Embed Size (px)
Citation preview
UNIVERSIDADE ESTADUAL DE CAMPINAS
INSTITUTO DE BIOLOGIA
BRUNO HENRIQUE PIMENTEL ROSADO
ECOLOGIA FUNCIONAL DE ÁRVORES NA MATA ATLÂNTICA:
O PAPEL DE ATRIBUTOS MORFOLÓGICOS, GRAU DE
EXPOSIÇÃO DA COPA E ALTITUDE SOBRE O USO DE ÁGUA
DAS ESPÉCIES
Tese apresentada ao Instituto de Biologia, da Universidade Estadual de Campinas para obtenção do Título de Doutor em Biologia Vegetal na área de Ecologia Funcional de Plantas.
Orientador: Prof. Dr. Marcos Pereira Marinho Aidar Co-orientador: Prof. Dr. Rafael Silva Oliveira
Campinas/2011

1
Campinas, 28 de fevereiro de 2011
Banca Examinadora Prof. Dr. Marcos Pereira Marinho Aidar (Orientador) (Instituto de Botânica de São Paulo) Prof. Dr. Eduardo Arcoverde de Mattos (Universidade Federal do Rio de Janeiro) Prof. Dr. Sergio Tadeu Meirelles (Universidade de São Paulo) Prof. Dr. Flavio Antonio Maës dos Santos (UNICAMP) Prof. Dr. Carlos Alfredo Joly (UNICAMP) Suplentes
Prof. Dr. Ivany Ferraz Marques Valio (UNICAMP)
Prof. Dr. Ladaslav Sodek (UNICAMP)

2
Esta tese recebeu suporte do CNPq através de bolsa institucional e de bolsa de doutorado sanduíche durante seis meses na:
Faculty of Agriculture, Food and Natural Resources, The University of Sydney, Australia
sob a supervisão do
Prof Dr. Stephen Stewart Oakley Burgess.
Outras Instituições que também colaboraram para a execução deste trabalho: - Instituto de Botânica/Seção de Fisiologia e Bioquímica de Plantas - Parque Estadual da Serra do Mar. Núcleos Pincinguaba e Santa Virgínia - Programa BIOTA/FAPESP. - University of Western Australia (Ecosystem Research Group)

3
para meus pais (Paulo e Alba);
minha irmã (Carol);
minha avó (Alzira)
e Paloma;
que são a minha água

4
“Não, não sei o que é a inspiração. Mas também a verdade é que às vezes nós usamos conceitos que nunca paramos a examinar. Vamos lá a ver: imaginemos que eu estou a pensar determinado tema e vou andando, no desenvolvimento do raciocínio sobre esse tema, até chegar a uma certa conclusão. Isto pode ser descrito, posso descrever os diversos passos desse trajecto, mas também pode acontecer que a razão, em certos momentos, avance por saltos; ela pode, sem deixar de ser razão, avançar tão rapidamente que eu não me aperceba disso, ou só me aperceba quando ela tiver chegado ao ponto a que, em circunstâncias diferentes, só chegaria depois de ter passado por todas essas fases. Talvez, no fundo, isso seja inspiração, porque há algo que aparece subitamente; talvez isso possa chamar-se também intuição, qualquer coisa que não passa pelos pontos de apoio, que saltou de uma margem do rio para a outra, sem passar pelas pedrinhas que estão no meio e que ligam uma à outra. Que uma coisa a que nós chamamos razão funcione desta maneira ou daquela, que funcione com mais velocidade ou que funcione de forma mais lenta e que eu posso acompanhar o próprio processo, não deixa de ser um processo mental a que chamamos razão”.
José Saramago Diálogos com José Saramago
“Entre os fatores que governam a vida dos vegetais, um dos mais importantes é o fator água”
Felix Kurt Rawitscher1.1942. Algumas noções sobre a transpiração e o balanço dágua de plantas brasileiras. Anais da Academia Brasileira de Ciências, ANO XIV
1 Professor do Departamento de Botânica da Faculdade de Filosofia, Ciências e Letras da Universidade de São Paulo, criado em 1934. Na década de 40, publicou os livros Elementos básicos de botânica geral e Problemas de fitoecologia com considerações especiais sobre o Brasil Meridional. Estudou especialmente as plantas do cerrado e foi orientador de Mário Guimarães Ferri, Mercedes Rachid, Berta Lange de Morretes e Aylthon Brandão Joly (Morretes, 1994. Felix Rawitscher. Perfis De Mestres. Estudos Avancados. vol.8).

5
Agradecimentos
Fazer esta tese não foi tarefa fácil. Tentar entender algum aspecto da miríade de processos que ocorrem em Florestas Tropicais Chuvosas em apenas quatro anos foi tarefa árdua. Quando lembro das dificuldades que enfrentei, do quanto amadureci e das coisas que aprendi, não apenas em relação à tese, mas ao longo dos últimos 10 anos, é impossível não lembrar das queridas pessoas que me ajudaram e me fizeram chegar até aqui. Esta tese, portanto, encerra uma etapa que começou 10 anos atrás, quando comecei a graduação, e dá início à carreira científica que sempre busquei e sonhei.
Ao meu orientador, Professor Marcos Aidar, por ter aceitado me orientar quando
fizemos contato em agosto de 2006. Agradeço pela amizade, pela paciência, pelos ensinamentos, pelo enorme apoio, pelas inúmeras oportunidades que me deu, pelos trabalhos de campo (nos quais aprendi muito sobre nitrogênio) e por ter acreditado em mim desde o início.
Ao meu co-orientador, Professor Rafael Oliveira, pela amizade, paciência e por
ter aceitado entrar de cabeça nesta empreitada quando ainda era pós-doutorando. Agradeço pela gigantesca ajuda e por ter o prazer em ensinar e compartilhar comigo o seu profundo conhecimento sobre os mistérios do fluxo de água em plantas, pois, sem o qual, teria sido extremamente difícil realizar este trabalho.
To my supervisor in Australia, Prof. Stephen Burgess, for his patience, friendship,
lessons of humility and for have taught me so many important things about sap flow, science and life. And also for have introduced me to the wonderful world of Bubble Tea.
Ao Professor Carlos Alfredo Joly que, na qualidade de coordenador do Projeto
Temático Biota/Gradiente Funcional, não poupou esforços para que este trabalho fosse conduzido com todas as facilidades e qualidade possíveis. Agradeço pela confiança depositada em mim para a execução de um trabalho que consumiu tanto em termos de recursos públicos. Obrigado pela constante cobrança, pois isto sempre me impulsionou a buscar o meu melhor para realizar este trabalho.
Ao Renato Belinello (Pezão) pela enorme amizade e ajuda nos mais variados
momentos e pela diversão que era ir para o campo na “kombosa”. Renatão, o que aprendi com você (sobre o mundo e sobre a mata) não tem doutorado que ensine.
To my dear friends from ICT, Alec Downey and Alvaro Arias that came to Brazil
two times to help me with sensors, cables, solar panels and dataloggers and for taught me how to keep the whole sap flow system running despite the humidity, ants, dirty, storms, water, fungus and etc. at the Atlantic rain forest. At least, I learned how to be a good electrician.
À Amanda Martins e Talita Colomeu pela paciência e grande dedicação na
triagem e digitalização das raízes finas.

6
Aos integrantes do Projeto Biota Gradiente Funcional pela ajuda e parceria nos mais variados momentos, especialmente: Simone Vieira e Luciana Alves pela amizade e ajudas das mais variadas; Hélber Freitas por todas as importantes conversas sobre eddy covariance, fluxo de calor latente, sensível e etc; Susian Martins por fornecer os dados de solo e Juliano Groppo (Joba) pela ajuda salvadora com os dados de precipitação.
Ao Professor Eduardo Arcoverde de Mattos pelos conselhos, grande amizade e
importantes ensinamentos dos últimos dez anos. É uma honra e um prazer que meu ex-orientador, que me viu dar os primeiros passos na vida acadêmica como seu aluno de iniciação cientifica, em abril de 2000, possa fazer parte da minha banca de doutorado. Ter sido seu aluno durante seis anos, foi de fundamental importância na minha formação.
Ao Professor Sergio Tadeu Meireles por ter aceitado participar da banca e pelas
importantes contribuições ao longo das diferentes fases do meu doutorado. Aos Professores Flavio Antonio Maës dos Santos, Ivany Valio e Ladaslav Sodek
por terem aceitado participar da banca e por toda a ajuda. Ao Programa de Pós-graduação, no nome dos coordenadores Marcelo Dornelas,
Eliana Forni Martins e Sandra Guerreiro, por todo o suporte e apoio. À secretária Maria Roseli por toda ajuda, gentileza e eficiência. Aos Professores dos Departamentos de Biologia Vegetal e Animal da Unicamp
por tudo o que aprendi nos últimos 4 anos. Aos funcionários do Departamento de Biologia Vegetal por toda a ajuda. Aos amigos da Pousada Betania e dos Núcleos Picinguaba e Santa Virgínia do
PESM pela companhia, apoio e ajuda no campo. Ao CNPq pelas bolsas de doutorado, doutorado sanduíche, mestrado e iniciação
científica. À FAPESP pelo suporte financeiro. Aos queridos amigos que fiz em Campinas, com os quais aprendi muito, dividi
risadas, tristezas, alegrias, batuques, brigas, rodas de capoeira e outros momentos inesquecíveis como ocorre em qualquer família. Lucas Kaminski, Pedro Cavalin, Luana Damasceno, Rafael Costa, Ninha (Marise) Filizola, Arildo Dias, Nivea Dias, Julia Sfair, Cris Baldauf, Chris Correa, Jacira Rabelo, Pedro Eisenlohr, Aline Lima, Carol Scultori, Rubem Ávila (Rubão), Marisa Gesteira, José Ataliba, Carolina Virillo, Felipe Amorim, Larissa Veiga (Larissinha), Lorena Fonseca, Larissa Pereira (Larissona), Viviane Oliveira, Maira Padgurschi, Juliano “Pequeno” van Melis, Mariana Cruz Campos, André Rochelle, Leo Meirelles, Bruno Aranha, João Aranha, Debora Drucker, Marina Merlo, Sabrina Latansio-Aidar, Giseli Areias, Ewerton Manarin, Giampiero Bini Cano

7
(especialmente pelas madrugadas escaneando folhas), Livia Cordi, Gabriela Bieber e Paulinho, Daniel Paiva, Janaína Cortinoz, Adaíses Maciel, Erico Pereira-Silva, Sandra Obando, Cora, Rubem e Erich, Juca, Lucíola, Bruno Lenharo, Vornei, Guto, Lara, Lílian Casanova, Marcos Gallardo, Eduin Muñoz, Dú Mattez e Lucía. Agradeço especialmente: Luana Damasceno, Pedro Cavalin e Lucas Kaminski pelos maravilhosos e inesquecíveis momentos da nossa saudosa convivência sob o mesmo teto.
Aos queridos amigos Alberto Latorre, Adriana Carranza, Bruno Buzatto, Jeremy
Hisinger e Mariana Cruz Campos por toda a amizade, apoio e companhia (especialmente nas aventuras que passamos para assistir os jogos da Copa Mundo de 2010 às duas da manhã) durante os quentes e frios seis meses que passei na Austrália.
To my friends from the University of Sydney and the University of Western
Australia (Ecosystem Research Group) for the help, useful discussions and friendship. Special thanks goes to: Prof. Pauline Grierson, Prof. Erik Veneklaas, Prof. Hans Lambers, Prof. Mark Adams, Tim Bleby, Elizabeth McLean, Alison O’Donnell, Gerald Page, Kate Bowler, Ana Byrne, Douglas Ford, Chloe Flaherty, Jessica O’Brien, Ali Barlow, Nicolas Faivre, Kosta Voltchanskii and Bonnie Knott.
Aos meus pais, minha irmã e minha avó pelo apoio incondicional, compreensão,
carinho e alegria reconfortantes com os quais me recebiam quando eu reaparecia no meu Rio de Janeiro depois de meses em Campinas/Ubatuba/São Luis do Paraitinga/Austrália.
À Paloma, por cada gesto, olhar e sorriso que, além de me fazerem um bem
“danado de bom”, sempre me fizeram seguir em frente. Ao Fred, Elza, Aline, Mauricio e Fabrício pelo gigantesco carinho e apoio. Aos queridos amigos que sempre estão comigo mesmo quando estamos longe.
Bruna Fonseca, Patrícia Pinho, Elisa Fichman, Maurício Salgado, Paula Celestino, Daniel Rocha, Rafael Leitão, Dani Kasper, Gina Cardinot, Amartya Saha, Gabi Joppert, Pedro Rossi, Ellen Fonte, Paula Lira, Bel Braz, André Dias, Karen von Dorp, Bráulio Santos, Sidclay Dias, Lilian Figueiredo e Viviane Grenha.
Aos meus queridos mestres do Instituto de Biologia da UFRJ, especialmente os
do Departamento de Ecologia, por tudo o que me ensinaram. À Mata Atlântica e à Restinga, que muito me ensinaram e de onde guardo
maravilhosas lembranças.
8
Resumo
O entendimento de como diferentes espécies e/ou tipos funcionais de plantas utilizam
água, requer a caracterização dos fatores que afetam o fluxo de água no contínuo solo-
planta-atmosfera (SPA). Desta forma, esta tese reúne uma série de trabalhos nos quais
investiguei como variações no uso de água de espécies arbóreas na Floresta Atlântica a
partir de atributos morfológicos, seu reflexo sobre o fluxo de água do xilema e como
ambos são afetados pelo grau de exposição da copa (EC) e à variação de fatores abióticos
em função da altitude na Mata Atlântica. As altitudes estudadas, 100 e 1000 metros de
altitude acima do nível do mar, correspondem às Florestas Ombrófila Densa de Terras
Baixas (FODTB) e Montana (FODM). Com base na literatura foi assumido como
premissa que na FODM, a maior radiação solar (RS) e demanda evaporativa do ar (DPV)
favoreceriam a maior perda de água criando situações de maior vulnerabilidade à
variação na disponibilidade hídrica do que na FODTB. Foram estudados componentes
que fazem parte do contínuo SPA tais como a densidade de comprimento de raízes finas
(DCR), que indica eficiência de absorção de água, repelência hídrica foliar (RHF) e
densidade da madeira, além de medidas diretas de fluxo de água do xilema. As variações
em atributos funcionais e seu reflexo no uso de água das espécies se deram tanto em
função da EC e da variação dos fatores abióticos conforme aumento da altitude. Maiores
DCR e RHF na FODM; regulação da transpiração noturna na FODM além de tendência
de menores áreas de histerese de fluxo em relação a FODTB indicam ajustes associados
ao uso da água. Estes resultados trazem importantes contribuições para o entendimento
do funcionamento de floresta tropicais chuvosas ao evidenciar que luz e nutrientes não
podem ser considerados como os únicos fatores limitantes destes ambientes.

9
Abstract
Understanding how different plant species and / or functional types use water requires
characterization of the factors that affect the continuous soil-plant-atmosphere (SPA).
This thesis presents a number of studies in which I investigated how changes in water use
of tree species in the Atlantic Forest taking into account morphological attributes, its
reflection on the sap flow and how both are affected by the degree of crown exposure
(CE) and the variation of abiotic factors as a function of altitude in the Atlantic. The
altitudes studied, 100 and 1000 meters above sea level, correspond to the lowland
ombrophilous dense forest (LODF) and Montane (MODF). Based on the literature it was
assumed that at the MODF, the higher solar radiation (SR) and air evaporative demand
(VPD) would be lead to greater water loss by creating situations of greater vulnerability
to changes in water availability than in LODF. Were studied components that are part of
the continuum SPA such as fine root length density (RLD), which indicates efficiency
water absorption, leaf water repellency (LWR) and wood density, besides measurements
of sap flow. Variations in functional attributes and its reflection on water use species that
have were associated to CE and the variation of abiotic factors according to altitude.
Higher RLD and LWR at the MODF; regulation of nighttime transpiration at the MODF
and trend of lower hysteresis areas of sap flow in relation to the LODF indicate
adjustments associated with the water use. These results provide important contributions
to understanding tropical rain forest functioning and indicate that light and nutrients can
not be considered as the only limiting factors at these environments.

10
Sumário Pág.
Resumo................................................................................................................................8
Abstract ..............................................................................................................................9
Introdução Geral..............................................................................................................11
Capítulo 1. Fine Root Biomass and Root Length Density in a Lowland and a Montane
Tropical Rain Forest, Sp, Brazil...............................................................................……27
Capítulo 2. Is Leaf water repellency related to vapor pressure deficit and crown exposure
in tropical forests?..............................................................................................................45
Capítulo 3. Diversity in Nighttime Transpiration Behavior of Woody Species at the
Atlantic Rain Forest, Brazil………………………………………..……….…….……...50
Capítulo 4. Relação entre fluxo de água do xilema e características morfológicas de
espécies arbóreas em florestas tropicais.............................................................................74
Conclusão e Considerações finais…….........................................................................118
11
Introdução Geral
Apesar de parecer recente, em função do atual cenário de mudanças climáticas
globais, a busca pelo entendimento do papel das florestas sobre o ciclo da água, vem
desde a antiguidade (McCulloch & Robinson 1993; Andréassian 2004). Entre os anos 77
e 79 D.C., Plínio, O Velho publicou a enciclopédia Naturalis Historia, na qual consta a
seguinte passagem: “Muitas vezes, depois das árvores terem sido cortadas, mananciais
que elas utilizavam para alimentar-se emergem: por exemplo, sobre o monte Himus,
quando Cassandro sitiou os Gauleses e derrubou uma floresta para construir um
entrincheiramento. Muitas vezes, desastrosas enxurradas são formadas após a
derrubada de florestas de montanha, que prendiam as nuvens para trás e também as
alimentavam”.
Figura 1. Capa da Naturalis Historia
Quase dois mil anos depois, em 1820, no
livro, Sistema Analítico dos conhecimentos
positivos do Homem, o naturalista Jean-
Baptiste de Lamarck menciona que “em
todos os lugares nos quais destruiu as
plantas de grande porte que protegiam o
solo, por razões de satisfazer o desejo do
momento, o homem rapidamente torna
estéril o solo que ele habita e faz com
que os rios sequem”.
Ao longo da História, avanços metodológicos e científicos nos trazem a um cenário
no qual entender o funcionamento de florestas, não apenas a partir de uma perspectiva

12
das relações hídricas, deve passar pela integração de diferentes níveis hierárquicos que
vão desde o fisiológico ate o ecossistêmico (McCulloch & Robinson 1993; Buchmann
2002; Andréassian 2004; Beyschlag & Ryel, 2007). Neste sentido, estudos eco-
hidrológicos têm buscado entender e quantificar como a relação entre suprimento e
demanda de água influenciam a evapotranspiração de comunidades vegetais. Do ponto de
vista biofísico, um ecossistema não pode utilizar mais água (através da transpiração e
evaporação direta no solo) do que está disponível (precipitação menos escoamento
superficial e infiltração). Na escala do indivíduo e da comunidade, cada espécie vegetal
pode explorar o suprimento de água através de uma variedade de mecanismos que
permitem diferentes usos deste recurso.
A detecção da ampla escala de convergência funcional entre as plantas em diversos
estudos, realizados em diferentes ambientes, tem sido feita a partir de um diverso
conjunto de características que são capazes de descrever como cada espécie responde à
multiplicidade de fatores ambientais e afetam a aquisição de recursos (Westoby et al.
2002; de Mattos et al. 2004). O entendimento de como diferentes espécies e/ou tipos
funcionais de plantas utilizam água, e como comunidades vegetais afetam o balanço
hídrico de um ecossistema, requer a caracterização dos fatores que afetam o fluxo de água
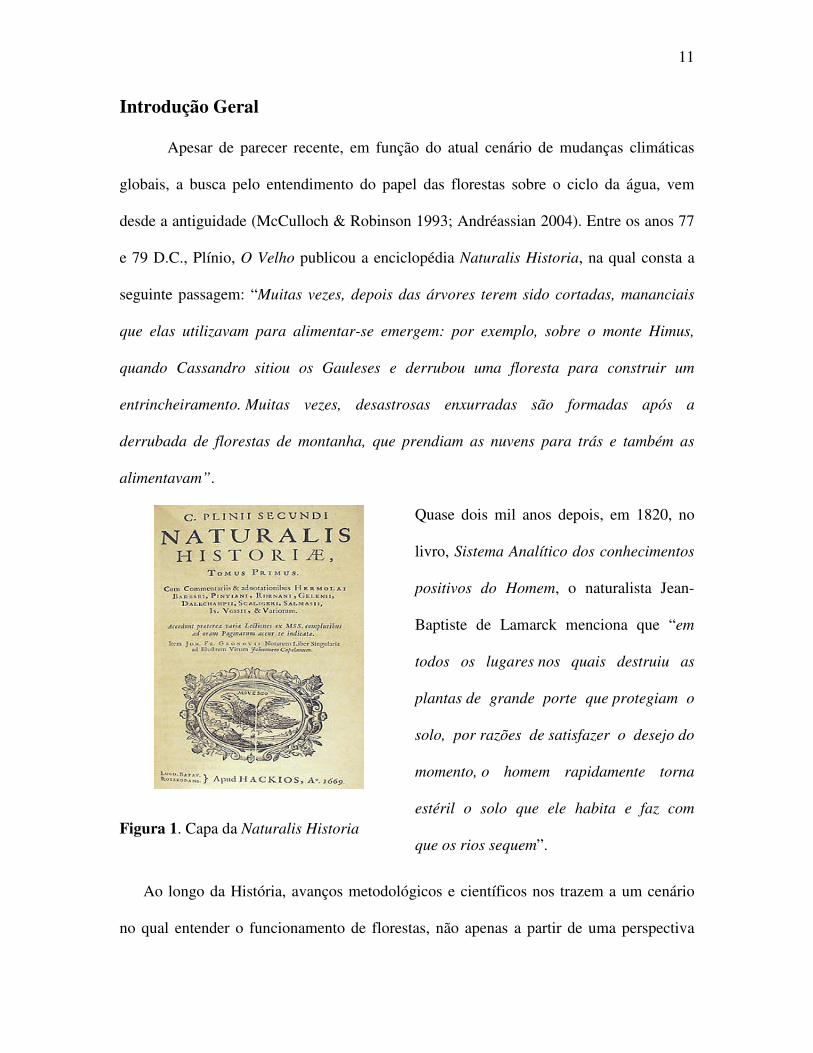
no contínuo solo-planta-atmosfera (SPA; Figura 2) (Burgess 2006). O estudo do fluxo da
água do xilema, que é resultante de uma série de características presentes ao longo do
contínuo SPA, tem sido capaz de clarificar os modos de aquisição de recursos e
mecanismos de respostas das plantas à variação ambiental (Burgess et al. 1998; Burgess
& Dawson 2004; Burgess 2006; Dawson et al. 2007; Marks & Lechowicz 2007; Scholz et
al. 2008).
13
Dentro do cenário de respostas das plantas às variações ambientais, a Mata Atlântica
destaca-se por se um bioma que, ao longo dos anos, sofreu 92% de redução da sua área
original pela intensa exploração dos seus recursos e uma acelerada ocupação humana.
Recentemente, a Mata Atlântica foi inserida na classificação de hot spots da
biodiversidade cuja definição são biomas que possuem alta diversidade de espécies e de
endemismos e que perderam mais de 70% de sua área original (Myers et al. 2000). A
Mata Atlântica possui uma ampla distribuição geográfica, do sudeste do Rio Grande do
Norte até o sudeste de Santa Catarina (Ab’Saber 2003).
Figura 2. Representação esquemática do contínuo solo-planta-atmosfera (SPA). Em cada
um dos três compartimentos do contínuo, características associadas aos processos de
absorção, transporte e estocagem e transpiração afetam diretamente o uso de água e a
manutenção de um balanço hídrico positivo nas plantas. Cada um dos capítulos desta tese
está relacionado a cada um dos compartimentos que fazem parte do continuo SPA.

14
No Parque Estadual da Serra do Mar (PESM) a área de domínio da Mata Atlântica,
denominada Floresta Ombrófila Densa, é subdividida de acordo com a hierarquia
topográfica por refletir fisionomias e composições diferentes, em função de variações das
faixas altimétricas e latitudinais (Veloso et al. 1991). Com uma área de quase 315 mil ha,
o PESM, que vai desde o norte do estado de São Paulo, na divisa com o Rio de Janeiro,
até o sul do estado, representa a maior porção contínua preservada de Mata Atlântica do
Brasil e é divido em Núcleos administrativos tal como mostrado na figura 3.
Figura 3. Localização de cada um dos núcleos administrativos que compõem o Parque
Estadual da Serra do Mar.
Dada a escassez de estudos sobre diversos aspectos do funcionamento das diferentes
fisionomias da Floresta Ombrófila Densa Atlântica e a urgente necessidade de
compreender os processos biológicos que estruturam este ecossistema, foi desenvolvido o
Projeto Temático Biota Gradiente Funcional/FAPESP, no qual esta tese está inserida. O
principal objetivo deste Projeto Temático foi investigar de forma multidisciplinar, com a

15
participação de pesquisadores de diferentes instituições nacionais e internacionais
(http://www.biota.org.br/projeto/index?show+251), a seguinte hipótese de trabalho no
PESM: são as características intrínsecas das espécies que determinam a composição
florística, a estrutura e o funcionamento das diferentes fisionomias da Floresta
Ombrófila Densa. Para isso, o Projeto Temático Biota Gradiente Funcional envolveu
diferentes níveis de investigação: Florística e fitossociologia; Estudos auto-ecológicos e
populacionais; Grupos funcionais; Funcionamento do ecossistema e Modelagem.
1.1 Descrição das áreas de estudo do Projeto Biota Gradiente Funcional
Neste Projeto Temático, os Núcleos selecionados no PESM foram os de Picinguaba e
Santa Virgínia (Figura 3). O Núcleo Picinguaba (23° 31' a 23° 34' S e 45° 02' a 45° 05'
W) situa-se no município de Ubatuba, SP. As altitudes no Núcleo Picinguaba variam do
nível do mar a 1.340 metros. O clima regional é tropical úmido, (Setzer 1966), com uma
precipitação média anual superior a 2.200 mm. Mesmo nos meses mais secos, junho a
agosto, a precipitação média mensal nunca é inferior a 80 mm (Tabela 1; Figura 4). O
Núcleo Santa Virgínia (23° 17' 23° 24' S e 45° 03' 45° 11' W) situa-se nos municípios de
São Luís do Paraitinga, Cunha e Ubatuba, e é recoberto, predominantemente, pela
Floresta Ombrófila Densa Montana (Veloso et al. 1991), uma vez que esta localizado a
uma altitude que varia de 850 a 1.100 m. O clima regional é tropical temperado, (Setzer
1966), com uma precipitação média anual superior a 2.000 mm. Mesmo nos meses mais
secos, junho a agosto, a precipitação média mensal nunca é inferior a 60 mm (Tabela 1;
Figura 4).

16
Tabela 1. Relação dos postos de precipitação nos municípios de Ubatuba e São Luis do Paraitinga (Martins, 2010).
jan fev mar abr mai jun jul ago set out nov dez0
100
200
300
400
Pre
cip
itaçã
o m
éd
ia m
ensal (m
m)
Meses
E009Ubatuba
jan fev mar abr mai jun jul ago set out nov dez0
100
200
300
400
Pre
cip
ita
ção
méd
ia m
en
sal (m
m)
Meses
E2-135
E2-132
2345067
São Luís do Paraitinga
Figura 4. Precipitação média mensal no período entre 1973-2008 em diferentes postos de
precipitação nos municípios de Ubatuba (Floresta Ombrófila Densa de Terras Baixas) e
São Luís do Paraitinga (Floresta Ombrófila Densa Montana) no estado de SP.
Postos Latitude Longitude Altitude (m) Bacia Município E2-009 23o23’ 45o07’ 220 Grande Ubatuba Ubatuba E2-132 23o14’ 45o18’ 740 Paraibuna São Luís do Paraitinga E2-135 23o22’ 45o12’ 815 Paraibuna São Luís do Paraitinga
2345067 23o19’ 45o08’ 888 Paraibuna São Luís do Paraitinga

17
O Projeto Temático foi desenvolvido em diferentes fisionomias de floresta nestes dois
Núcleos: Mata de Restinga, Floresta Ombrófila Densa de Terras Baixas (FODTB),
Floresta Ombrófila Densa Submontana e Floresta Ombrófila Densa Montana (FODM).
Nestas fisionomias, foram implantadas parcelas de 100 x 100 m, totalizando quatro
hectares, subdivididas em 100 sub-parcelas contíguas de 10 x 10 m. A única exceção foi a
Mata de Restinga onde apenas uma parcela foi implantada. Tanto as parcelas como as
sub-parcelas foram delimitadas com estacas permanentes. A caracterização das áreas e a
ampla maioria dos estudos realizados no âmbito do Projeto Temático foram realizados
nestas parcelas nas quais indivíduos arbóreos com perímetro à altura do peito maior que
15 cm foram marcados, numerados e mapeados através de coordenadas X e Y.
Nesta tese, as FODTB e FODM foram escolhidas como as áreas de estudo por se
tratarem dos extremos fisionômicos de Floresta Ombrófila Densa contemplados pelo
Projeto Temático. No caso das FODTB e FODM, as parcelas foram implantadas nas
altitudes em torno de 100 e 1000 metros acima do nível do mar, respectivamente. De
posse das informações geradas pelos diferentes grupos de pesquisa atuando em cada um
dos níveis de abordagem mencionados acima, apresentarei brevemente as distinções em
termos de condições e recursos das FODTB e FODM. Esta diferenciação será de
fundamental importância para o entendimento geral dos resultados e conclusões
apresentados nesta tese.
Em função do aumento da altitude, observam-se mudanças nas condições ambientais
tais como menor pressão parcial do CO2 atmosférico, menor velocidade do vento e maior
radiação (Leuschner 2000; Körner 2007; Rosado et al., 2010a). No caso das duas
fisionomias estudadas, além das variações mencionadas acima, também se observam

18
distinções em relação aos solos. Embora sejam rasos em ambas as altitudes, o solo da
FODM é mais antigo e possui maior riqueza nutricional que os solos da FODTB, no
entanto, em ambas as fisionomias, a concentração de nutrientes é maior nas camadas
superficiais do solo (Martins, 2010). Em relação à textura do solo, a FODTB apresenta
textura argilo-arenosa (areia: 60.4%; argila: 31.5%) enquanto a FODM a textura é argilo-
arenosa (areia: 57.4%; argila: 20.3%) (consulte Martins, 2010, para maiores detalhes). Na
FODM as menores temperaturas do ar e do solo e a menor umidade do solo (Sousa Neto
2008) afetam negativamente tanto a produção de serapilheira quanto as taxas de
decomposição que são menores na FODM quando comparadas a FODTB (Martins,
2010). Além destas variações, a maior presença de neblina na FODM (Rosado et al.,
2010a), conhecida como “precipitação oculta” (Rizzini 1997), pode desempenhar um
importante papel no balanço hídrico das plantas uma vez que atua como fonte de água
para as plantas (Burgess & Dawson 2004). No entanto, a presença de neblina também
pode reduzir significativamente a quantidade de radiação solar recebida durante o dia, o
que conseqüentemente, reduz a taxa fotossintética e os fluxos transpiracionais (Graham et
al. 2005). Outra importante diferenciação entre as FOTB e FODM está relacionada à
topografia. Na FOTB, a topografia do terreno apresenta grau de inclinação entre 10-30o
enquanto a FODM apresenta valores >30o (Alves et al. 2010; Martins, 2010).
Considerando-se o atual cenário de mudanças climáticas, estudos ao longo de
gradientes altitudinais são uma excelente oportunidade para a compreensão não apenas
das alterações em processos ecossistêmicos, tais como a decomposição de serapilheira e
produtividade primária, mas também de como as plantas responderão a estas mudanças.
Tais estudos devem passar obrigatoriamente por uma abordagem que foque nas relações

19
entre as características morfofisiológicas, o significado funcional de cada uma delas e
seus efeitos sobre o contínuo SPA. Uma vez que alterações nos níveis de precipitação
podem alterar os padrões de distribuição das espécies tropicais (Engelbrecht et al. 2005),
o entendimento integrado destas características morfofisiológicas auxilia a descrição do
comportamento ecofisiológico das espécies ao longo de variações espaço-temporais nas
condições e recursos. Especialmente no caso da Mata Atlântica, ainda são poucos os
estudos sobre como conjuntos de características afetam a capacidade de resposta das
plantas frente à natureza interativa dos fatores ambientais e o uso de recursos e suas
implicações sobre a composição de espécies e a estrutura da comunidade (de Mattos et al.
2004; Rosado & de Mattos, 2010b).
Com base em tudo o que foi exposto, esta tese é o resultado do meu crescente
interesse na área de ecologia funcional e relações hídricas em plantas nos últimos anos e
que se insere na parte de Estudos auto-ecológicos e populacionais do Projeto Temático
Biota Gradiente Funcional. Neste nível de abordagem as gerais questões investigadas
pelo Projeto Temático foram: (i) quais são as características intrínsecas das espécies que
determinam seu sucesso reprodutivo; sua capacidade de germinação, recrutamento e
crescimento; sua estrutura populacional; sua variabilidade genética; sua inserção em
grupos funcionais; e sua participação nos ciclos de carbono e nitrogênio? (ii) estas
características se modificam ao longo da variação altitudinal, representada pelas
diferentes fisionomias da Floresta Ombrófila Densa? Além desta abordagem, Os
resultados apresentados nesta tese também contribuem diretamente para os níveis de
abordagem de Grupos Funcionais, Funcionamento do Ecossistema e Modelagem que, de
maneira sucinta, objetivaram maior entendimento: das respostas das plantas e
20
funcionamento do ecossistema através do agrupamento de espécies em grupos ou tipos
funcionais; do funcionamento das florestas em termos de ciclo da água e balanço de
carbono; de modelos sobre o funcionamento da Floresta Ombrófila Densa em diferentes
cenários de aquecimento global, respectivamente.
Em relação ao histórico de trabalhos realizados na Mata Atlântica, cabe ressaltar o
trabalho pioneiro sobre as relações hídricas de plantas realizado por Coutinho (1962).
Apesar de ter avaliado exclusivamente epífitas, Coutinho (1962) aponta para o fato de
que há forte restrição estomática e redução na transpiração em períodos de baixa
disponibilidade de água durante veranicos2 neste bioma (Figura 5). Além disso, estas
plantas apresentam distintas características associadas ao armazenamento de água na
Mata Atlântica: reservas internas (tecidos) e/ou externas tais como o acúmulo de água em
rosetas de bromélias tanque (Coutinho 1962). Apesar da sua importância em termos
históricos, o estudo de Coutinho (1962) é de pouca relevância para o entendimento do
contínuo SPA de espécies arbóreas. Isto se deve às diferenças de forma de vida e hábito
que impossibilitam a comparação e a elaboração de pressupostos concretos sobre as
relações hídricas de plantas arbóreas da Mata Atlântica.
2 Embora não haja uma forte sazonalidade na Mata Atlântica, há a ocorrência de
veranicos (Coutinho 1962) e de mudanças no regime de precipitação (Webb et al. 2005).
Na literatura, não há uma padronização sobre o uso do termo “estação seca” e existem
várias definições baseadas em aspectos climáticos, ecológicos, agrícolas, hidrológicos e
socioeconômicos (Rizzini 1997; Heinn 2002). Nesta tese, portanto, será utilizada a
definição climatológica de Heinn (2002) onde “estação seca” é aquela na qual ocorre uma
redução e/ou ausência de precipitação. Cabe ressaltar que em um recente estudo
hidrológico realizado na Floresta Ombrófila Densa Montana no Núcleo Santa Virgínia do
PESM (Groppo, 2010) foi verificada a existência de uma estação seca.

21
26/6
/200
8
10/8
/200
8
25/9
/200
8
9/11
/200
8
25/1
2/20
08
8/2/
2009
26/3
/200
9
10/5
/200
9
25/6
/200
9
9/8/
2009
24/9
/200
9
0
20
40
60
80
100
120
140
160
Ch
uvo
sa
Se
ca
Pre
cip
ita
çã
o D
iári
a (
mm
)
Tempo (dias)
FODTB
FODM
Se
ca
Figura 5. Precipitação diária (mm) na Floresta Ombrófila Densa de Terras Baixas e
Ombrófila Densa Montana. Estão destacados os períodos que foram selecionados para
análise dos dados do fluxo de água do xilema (terceiro e quarto capítulos, como descrito
abaixo).
Neste contexto, esta tese representa um importante avanço no conhecimento sobre
diferentes aspectos funcionais associados ao SPA de espécies arbóreas que co-ocorrem
nas FODTB e FODM no PESM e que apresentam diferenças quanto ao estrato ocupado e
grau de exposição da copa. Partindo-se da premissa que as espécies que ocupam os
estratos superiores da floresta responderão mais diretamente às variações atmosféricas

22
que espécies do sub-bosque, espécies com menor grau de exposição da copa
apresentarão fluxos de água similares independentemente da altitude.
A tese compreende tanto trabalhos já publicados ou em fase de submissão e cada um
deles focou em aspectos relacionados a cada um dos compartimentos e processos
responsáveis por modular o contínuo SPA (Figura 2). Como mencionado acima, através
do Projeto Temático Biota Gradiente Funcional/FAPESP, a estrutura de parcelas e o fato
de que indivíduos arbóreos com perímetro à altura do peito maior que 15 cm já se
apresentavam devidamente marcados, numerados e mapeados através de coordenadas X e
Y, possibilitaram a identificação e escolha das espécies e indivíduos arbóreos para os
estudos apresentados nos diferentes capítulos desta tese.
O capítulo intitulado “Fine root biomass and root length density in a Lowland and a
Montane Tropical Rain Forest, SP, Brazil” (Rosado et al.), retrata as variações no
investimento de raízes finas entre altitudes e as implicações deste investimento
diferencial nas respostas das espécies aos diferentes fatores ambientais entre altitudes. O
segundo capítulo, intitulado “Is leaf water repellency related to vapor pressure deficit
and crown exposure in tropical forests?” (Rosado et al. 2010a), foi publicado no Acta
Oecologica e traz o primeiro teste do efeito do grau de exposição da copa e déficit de
pressão de vapor da atmosfera sobre o grau de repelência hídrica foliar em cinco espécies
que co-ocorrem nas Florestas Ombrófilas Densas de Terras Baixas e Montana. O terceiro
capítulo, intitulado “Diversity in nighttime transpiration behavior of woody species at the
Atlantic Rain Forest, Brazil” (Rosado et al.), traz novos e importantes resultados acerca
dos fatores que modulam a transpiração noturna em plantas e as implicações deste
fenômeno sobre o uso de água das espécies. O quarto capítulo “Relação entre Fluxo de

23
Água do Xilema e Características Morfológicas de Espécies Arbóreas em Florestas
Tropicais” (Rosado et al.) integra resultados apresentados nos capítulos anteriores e
apresenta a contribuição de atributos morfológicos, grau de exposição da copa, altitude, o
efeito do tamanho dos indivíduos sobre o uso de água total e comparações da
suscetibilidade destas espécies à variação da disponibilidade hídrica.
Referências
Ab'Saber, A. (2003) Os Domínios Morfoclimáticos de Natureza no Brasil -
Potencialidades Paisagísticas, 4a edn. Ateliê Editorial, São Paulo.
Andréassian, V. (2004) Waters and forests: from historical controversy to scientific
debate. Journal of Hydrology, 291, 1-27.
Beyschlag, W. & Ryel, R.J. (2007) Plant physiological ecology: An essential link for
integrating across disciplines and scales in plant ecology. Flora, 202, 608-623.
Buchmann, N. (2002) Plant ecophysiology and forest response to global change. Tree
Physiology, 22, 1117-1184.
Burgess, S.S.O. & Dawson, T.E. (2004) The contribution of fog to the water relations of
Sequoia sempervirens (D. Don): foliar uptake and prevention of dehydration. Plant,
Cell and Environment, 27, 1023–1034.
Burgess, S.S.O. (2006) Measuring transpiration responses to summer precipitation in a
Mediterranean climate: a simple screening tool for identifying plant water-use
strategies. Physiologia Plantarum, 127, 404-412.
Coutinho, L.M. (1962). Contribuição ao conhecimento da ecologia da Mata Pluvial
Tropical. Boletim da Faculdade de Filosofia Ciências e Letras da USP 18:11-219.

24
de Mattos, E.A., Braz, M.I.G., Cavalin, P.O., Rosado, B.H.P., Gomes, J.M., Martins,
L.S.T., & Arruda, R.C.O. (2004). Variação espacial e temporal em parâmetros
fisioecológicos de plantas. In Pesquisas de longa duração na restinga de Jurubatiba.
Ecologia, história natural e conservação (eds C.F.D. Rocha, F.A. Esteves & F.R.
Scarano), pp. 99-116. RiMa editora, São Carlos.
Engelbrecht, B., Kursar, T., & Tyree, M. (2005) Drought effects on seedling survival in a
tropical moist forest. Trees, 19, 312-321.
Graham, E.A., Mulkey, S.S., Kitajima, K., Phillips, N.G., & Wright, S.J. (2005) Cloud
cover limits net CO2 uptake and growth of a rainforest tree during tropical rainy
seasons. Proocedings National Academy of Sciences, 100, 572-576.
Groppo, J.D. (2010) Caracterização hidrológica e dinâmica do nitrogênio em uma
microbacia com cobertura florestal (Mata Atlântica), no Parque Estadual da Serra do
Mar, núcleo Santa Virgínia. Doutorado, USP, Piracicaba.
Heim, R.R. (2002) A Review of Twentieth-Century Drought Indices Used in the United
States. American Meteorological Society, 1149-1165.
Körner, C. (2007) The use of ‘altitude’ in ecological research. Trends in Ecology and
Evolution, 22, 569-574.
Leuschner, C. (2000) Are high elevations in tropical mountains arid environments for
plants? Ecology, 81, 1425-1436.
Martins, S.C. (2010) Caracterização dos solos e serapilheira ao longo do gradiente
altitudinal da Mata Atlântica, estado de São Paulo. Tese Doutorado, USP, Piracicaba,
SP.

25
McCulloch, J.S.G. & Robinson, M. (1993) Hystory and Forest Hydrology. Journal of
Hydrology, 150, 189-216.
Myers, N., Mittermeier, R.A., Mittermeier, C.G., Fonseca, G.A.B., & Kent, J. (2000)
Biodiversity hotspots for conservation priorities. Nature, 403, 853-858.
Rizzini, C.T. (1997) Tratado de Fitogeografia do Brasil, 2 edn. Âmbito Cultural Edições,
Rio de Janeiro.
Rosado, B.H.P., Oliveira, R.S., & Aidar, M.P.M. (2010a) Is leaf water repellency related
to vapor pressure and crown exposure in tropical forests? Acta Oecologica, 36, 645-
649.
Rosado, B.H.P. & de Mattos, E.A. (2010b) Interspecific variation of functional traits in a
CAM-tree dominated sandy coastal plain. Journal of Vegetation Science, 21, 43-54.
Setzer, J. 1966. Atlas climatológico do estado de São Paulo. Comissão Interestadual da
Bacia do Paraná-Paraguai. CESP, São Paulo
Sousa Neto, E.R. (2008) Perdas de nitrogênio pela emissão de óxido nitroso (N2O) e sua
relação com a decomposição da serapilheira e biomassa de raízes na floresta de Mata
Atlântica. Dissertação Mestrado, USP, Piracicaba, SP.
Veloso, H.P., Rangel-Filho, A.L.R., & Lima, J.C.A. (1991) Classificação da vegetação
brasileira, adaptada a um sistema universal, Rio de Janeiro. Fundação Instituto
Brasileiro de Geografia e Estatística-IBGE. 123 p.
Webb T.J., W., F., Hannah, L. & Gaston, K (2005) Forest cover-rainfall relationships in a
biodiversity hotspot: the Atlantic forest of Brazil. Journal of Ecological Applications,
15, 1968-1983.

26
Westoby, M., Falser, D.S., Moles, A.T., Wesk, P.A., & Wright, I.J. (2002) Plant
ecological strategies: some leading dimensions of variaton between species. Ann.
Rev. Ecol. Syst., 33, 125-159.

27
Capítulo 1
Fine root biomass and root length density in a Lowland and a Montane Tropical Rain Forest, SP, Brazil.
Bruno Henrique P. Rosado1,2,*, Amanda C. Martins2,4, Talita C. Colomeu2,4,
Rafael S. Oliveira2, Carlos A. Joly2 and Marcos P. Marinho Aidar3
(1)Bolsista Doutorado/CNPq. Programa de Pós-graduação em Biologia Vegetal, IB,
Universidade Estadual de Campinas, Campinas, SP, Brazil.
(2)Departamento de Botânica, IB, Universidade Estadual de Campinas, São Paulo, SP,
Brazil
(3)Seção de Fisiologia e Bioquímica de Plantas, Instituto de Botânica, SP, Brazil
(4)Pontifícia Universidade Católica De Campinas, Centro De Ciências Da Vida,
Faculdade de Ciências Biológicas, SP, Brazil.
(*)Corresponding author: Departamento de Biologia Vegetal, IB Universidade Estadual de
Campinas, Campinas/SP, CEP: 13083-970, Brazil; e-mail: [email protected]; fax:
++ 55 (0)19 35216374; tel: ++ 55 (0)19 35216175.

28
Abstract
Fine roots, <2 mm in diameter, are responsible for water and nutrient uptake and
therefore have a central role in carbon, nutrient and water cycling at the plant and
ecosystem level. The root length density (RLD), fine root biomass (FRB) and vertical
fine root distribution (VRD) in the soil profile have been used as a good descriptors of
resource-use efficiency and carbon storage in the soil. Along altitudinal gradients,
decreases in temperature and radiation inputs (depending on the frequency of fog events)
may reduce decomposition rates and nutrient availability what might stimulate increases
in fine root investment to increase absorption of resources. We evaluated the seasonal
variation of fine root parameters in the Lowland and Montane forest at the Atlantic Rain
Forest. We hypothesized that the investment in FRB and RLD at soil surface will be
higher in the Montane forest, which can maximize the efficiency of resource absorption.
Fine root biomass and root length density were higher in the the Montane forest in both
seasons, especially at the 0-5 layer. Total FRB in the top 30cm of the soil at the Lowland
site was 334.53 g m-2 in the dry season and 219.11 g m-2 in the wet season and 875.22
and 451.04 g m-2 at the Montane forest in the dry and wet season, respectively. We
discuss the different mechanisms associated to the differential investment in fine roots
between forests and their implications to ecophysiological responses of plant species to
changes in conditions and resources along the altitudinal variation at the Atlantic Rain
Forest.
Key words: Nutrient uptake, vertical distribution of fine roots, seasonal variation,
altitudinal gradient, Atlantic Rain Forest
29
Introduction
Fine roots, defined as those <2 mm in diameter, are responsible for water and nutrient
uptake and therefore have a central role in carbon, nutrient and water cycling at the plant
and ecosystem level (Nepstad et al. 1994; Jackson et al. 1997; Gordon & Jackson 2000).
High fine root densities increase the hydraulic contact between plants and the soil , water
uptake rates and therefore contribute to higher transpiration rates (Nepstad et al. 1994;
Williams et al. 1998) and embolism repair (Zeppel et al. 2004). In addition, 60% of the
carbon fixed in annual basis is allocated belowground (Jackson et al. 1996, 1997) and the
amount of carbon and nutrients returned to the soil via decomposition of fine roots may
be equal or higher in comparison to leaves (Jackson et al. 1997).
Root length density (RLD), i.e. the total root length per unit soil volume, has been
used as a good descriptor of resource use efficiency and may indicate the potential of
water and nutrient uptake of a vegetation stand (Soethe et al. 2006). Fine root biomass
(FRB) is an important parameter related to carbon allocation and carbon turnover at the
ecosystem level (Nepstad et al. 1994; Jackson et al. 1997). The evaluation of vertical fine
root distribution (VRD) in the soil profile indicates (i) the plant’s resource use capacity in
soil; (ii) the efficiency to avoid nutrient losses by leaching (Nepstad et al. 1994; Soethe et
al. 2006); (iii) and fine root’s contribution to biogeochemical cycles (Jackson et al. 1996).
Along altitudinal variations in tropical forests, the investment in fine roots tend to
increase in response to changes of different environmental factors such as radiation,
temperature and nutrient availability in soil (Soethe et al. 2006; Leuschner et al. 2007;
Graefe et al. 2008). In tropical montane forests, the lower temperatures and lower
radiation inputs (depending on frequency of fog events) may reduce the decomposition
30
rates and nutrient availability (Brujinzeel & Veneklaas 1998). At higher altitudes, lower
temperatures may promote the reduction (i) in microbial nutrient mineralisation rates; (ii)
mycorrizhal fungi activities and their nutrient supply functions and (iii) carrier activity in
the root plasma membranes, which are temperature sensitive, leading to reductions in
nutrient uptake (Leuschner et al. 2007). Thus, a higher RLD might counterbalance the
lower nutrient-cycling rates allowing nutrient uptake (Soethe et al. 2006).
Curiously, although abiotic factors such as temperature, nutrient and water
availability may stimulate fine root production (Gill & Jackson 2000; Yavitt & Wright
2001; Zobel et al. 2007), controversial results have been found among studies. At higher
altitudes in different ecosystems, factors such as waterlogged soils, lower temperatures,
reductions in trees size and species richness, might contribute to lower fine root
investment (Soethe et al. 2006; Leuschner et al. 2007; Graefe et al. 2008). For instance,
seasonal variations and increases in RLD were not observed along an altitudinal gradient
from 1900 to 3000 m at tropical forests in Ecuador (Soethe et al. 2006). However,
increases in fine root dynamics (root length production and root turnover) have been
observed along an altitudinal gradient, from 1050 to 3060 m, at the South Ecuadorian
mountain rainforests (Graefe et al. 2008). At the Brazilian Atlantic Rain Forest, Sousa
Neto (2008) have found higher fine root biomass at the Montane forest and significant
increases in fine root biomass from wet to dry season. However, his study was focused on
the first 10 cm of soil profile and information on deeper soil profile is still lacking.
In the present study we evaluated the variation of fine root parameters at the
Atlantic Rain Forest in different altitudes in the wet and dry seasons. Despite the
importance of fine roots in different scales, the difficulties associated to sampling and

31
evaluation of different factors affecting fine roots parameters (e.g species composition,
soil moisture, nutrient and water availability, temperature and soil texture) lead to a lack
of information for different environments (Jackson et al. 1996, 1997; Gill & Jackson
2000; Soethe et al. 2006, Leuschner et al. 2007, Graefe et al. 2008). There is scarce
information about the belowground compartment in tropical forests and these data are
essential to parameterize models about ecosystem functioning and plant responses to
climate changes. We hypothesized that (i) the investment in FRB and RLD along the soil
profile will be higher in the Montane forest; (ii) the proportion of roots near the soil
surface will be higher at the Montane forest.
Material and Methods
Study sites
Our study was conducted in lowland and montane forest in the Serra do Mar State
Park, which is the largest protected area of Atlantic Rain Forest and covers 315,000
hectares in the north of São Paulo state, Brazil. The Lowland forest is 100 m above sea
level- (23° 31' to 23° 34' S and 45° 02' to 45° 05' W) and has a tropical climate and a
mean annual precipitation of 2200 mm. Usually, the driest months are July and August.
The Montane forest is 1000 m above sea level - (23° 17' to 23° 24' S and 45° 03' to 45°
11' W), has a tropical temperate climate, with mean annual precipitation around 2000 mm
and a high fog frequency around 100 days per year (Rosado et al. 2010). All
physiognomies are characterized as Ombrophylous Dense Atlantic Forest (broadleaf
evergreen forest; Joly et al. 1999). The soils in both sites are considered as poor in basic
cations and rich in aluminum concentration when compared to Amazon (Martins 2010).
However, the soil at the Montane Forest is richer in aluminum and iron concentration and

32
shows higher cation exchange capacity (CEC), and nitrogen and carbon content (Martins
2010). On the other hand, the soil at the Lowland Forest shows more sand and clay and
less silt than MF (Martins 2010).
Root Sampling and analysis
In each altitude, we collected samples in four one-hectare plots (divided in 100 sub-plots)
belonging to the Gradiente Funcional/BIOTA Project whose main proposal is evaluate
changes in forest composition, structure and functioning along the altitudinal variation
(http://www2.ib.unicamp.br/projbiota/gradiente_funcional/index.html). In each plot we
randomly chose 4 sub-plots for sampling and in each one, soil samples were taken from
the following depths: 0-5, 5-10, 10-20 e 20-30 cm. The same procedure was repeated in
the dry (August 2007) and wet season (December/January 2008), totalizing 128 soil
samples per season. We used a soil corer with a diameter of 20 cm to collect samples at
0-5 cm, and a smaller diameter corer (10 cm) for the other depths. Samples were labeled,
taken to laboratory and kept frozen until processing to extract fine roots. The total volume
of each sample was measured with a plastic container. Fine roots were separated from
soil using a semi-automatic root washer system built with buckets and hoses as described
by Martins (2002). After that, samples were kept in alcohol 70% until separation in living
and dead roots under magnifying glass, based on colour, root elasticity and the degree of
cohesion of cortex, periderm and stele (Persson 1978).
We followed the protocol suggested by Bouma et al. (2000) to acquire better
digital images used to estimate fine root length and root surface area. Fine roots were
stained with methylen blue and placed on a transparent tray with a thin layer of water on
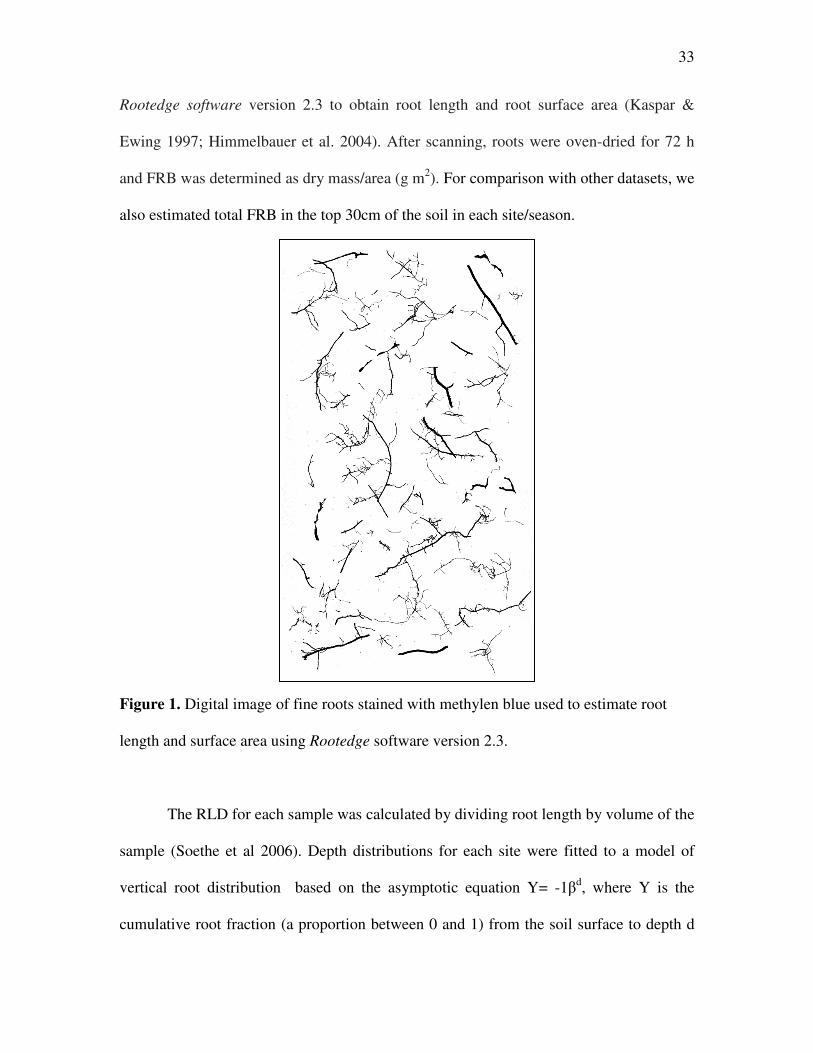
a flatbed scanner to acquire 400dpi images (Bouma et al. 2000) (Figure 1). We used the
33
Rootedge software version 2.3 to obtain root length and root surface area (Kaspar &
Ewing 1997; Himmelbauer et al. 2004). After scanning, roots were oven-dried for 72 h
and FRB was determined as dry mass/area (g m2). For comparison with other datasets, we
also estimated total FRB in the top 30cm of the soil in each site/season.
Figure 1. Digital image of fine roots stained with methylen blue used to estimate root
length and surface area using Rootedge software version 2.3.
The RLD for each sample was calculated by dividing root length by volume of the
sample (Soethe et al 2006). Depth distributions for each site were fitted to a model of
vertical root distribution based on the asymptotic equation Y= -1βd, where Y is the
cumulative root fraction (a proportion between 0 and 1) from the soil surface to depth d
34
(in centimeters) and β is the fitted extinction coefficient (Gale & Grigal 1987). Since β is
the fitted parameter, it provides a simple numerical index of rooting distribution (Gale &
Grigal 1987) where high values correspond to a greater proportion of roots at depth and
low values have a greater proportion of roots near the soil surface (Jackson et al. 1996).
Statistical Analyses
For each depth, significant differences of RLD, FRB and β between altitudes and seasons
were assessed by Two-way ANOVA with post hoc Tukey’s test.
Results
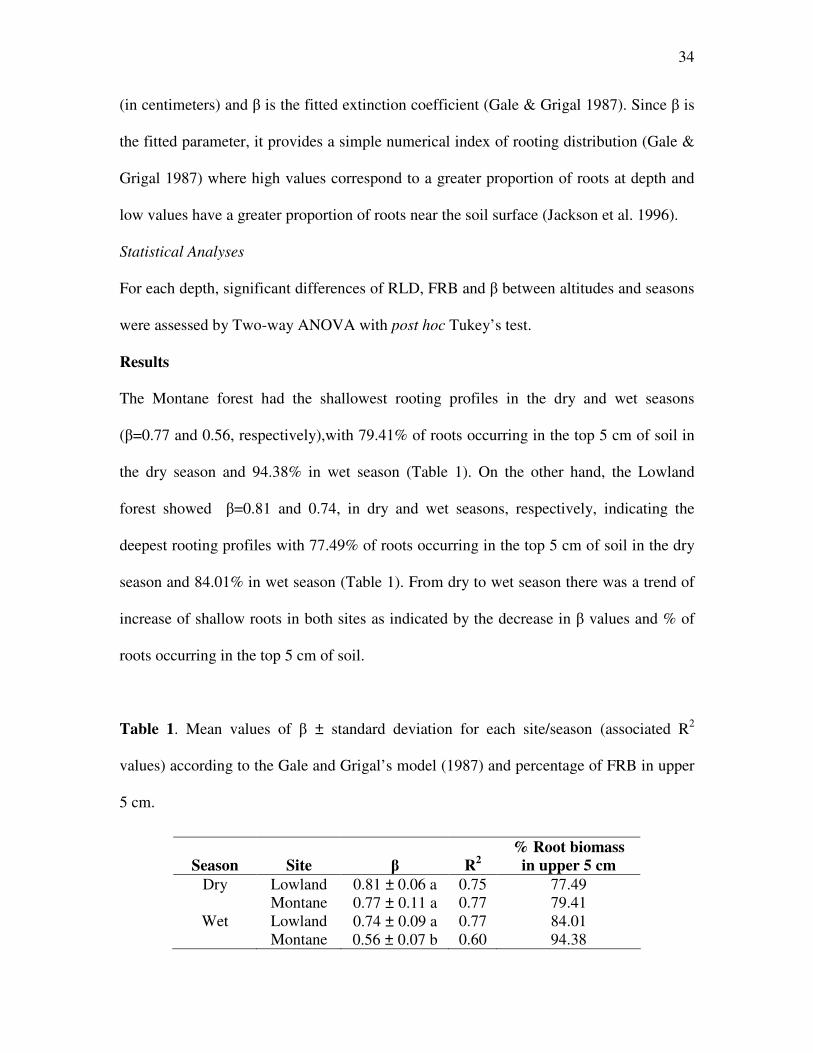
The Montane forest had the shallowest rooting profiles in the dry and wet seasons
(β=0.77 and 0.56, respectively),with 79.41% of roots occurring in the top 5 cm of soil in
the dry season and 94.38% in wet season (Table 1). On the other hand, the Lowland
forest showed β=0.81 and 0.74, in dry and wet seasons, respectively, indicating the
deepest rooting profiles with 77.49% of roots occurring in the top 5 cm of soil in the dry
season and 84.01% in wet season (Table 1). From dry to wet season there was a trend of
increase of shallow roots in both sites as indicated by the decrease in β values and % of
roots occurring in the top 5 cm of soil.
Table 1. Mean values of β ± standard deviation for each site/season (associated R2
values) according to the Gale and Grigal’s model (1987) and percentage of FRB in upper
5 cm.
Season Site β R2 % Root biomass
in upper 5 cm Dry Lowland 0.81 ± 0.06 a 0.75 77.49
Montane 0.77 ± 0.11 a 0.77 79.41 Wet Lowland 0.74 ± 0.09 a 0.77 84.01
Montane 0.56 ± 0.07 b 0.60 94.38

35
The montane forest showed higher FRB in the 0-5 soil layer in both seasons and
in the 5-10 layer in the dry season (Figure 2), while for others depths there were no
differences between altitudes. Seasonal differences in FRB were observed only in the
montane site in the 5-10 and 10-20 layers, with lower values in the wet season (Figure 2).
The total FRB in the top 30cm of the soil in the dry and wet season, respectively: for the
Lowland Forest 334.53 and 219.11 g m-2 and 875.22 and 451.04 g m-2 for the Montane
Forest. At both altitudes and seasons, FRB was highest in the 0-5 layer (Figure 2)
although higher values were observed at the Montane forest. The variation of FRB
between altitudes in the 0-5 cm was 3.2 fold in the dry and 2.2 fold in the wet season. In
the 5-10 cm in the dry season, the FRB variation between altitudes was 2.5 fold.
Wet Season
Fine root biomass (g m-2)
0 200 400 600
Dry Season
Fine root biomass (g m-2)
0 200 400 600
Soi
l Dep
th (
cm)
0-5
5-10
10-20
20-30LowlandMontane
ab
ab
ab*
aa
aa*
aa
aa
aa
Figure 2. Variation of fine root biomass in soil profile, between altitudes and seasons.
Lower case letters indicate significant differences between altitudes in each depth
(student’s t-test; P < 0.05); asterisks indicate significant differences between seasons in
each depth (student’s t-test; P < 0.05).
36
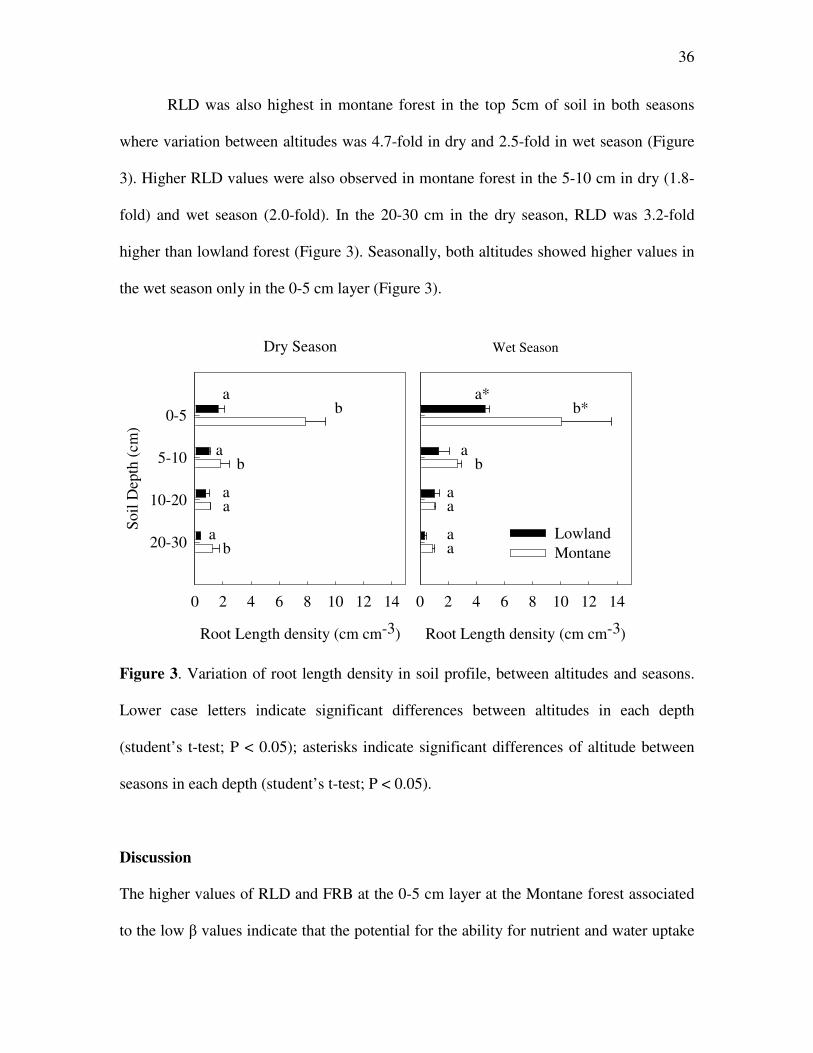
RLD was also highest in montane forest in the top 5cm of soil in both seasons
where variation between altitudes was 4.7-fold in dry and 2.5-fold in wet season (Figure
3). Higher RLD values were also observed in montane forest in the 5-10 cm in dry (1.8-
fold) and wet season (2.0-fold). In the 20-30 cm in the dry season, RLD was 3.2-fold
higher than lowland forest (Figure 3). Seasonally, both altitudes showed higher values in
the wet season only in the 0-5 cm layer (Figure 3).
Wet Season
Root Length density (cm cm-3)
0 2 4 6 8 10 12 14
Dry Season
Root Length density (cm cm-3)
0 2 4 6 8 10 12 14
Soil
Dep
th (
cm)
0-5
5-10
10-20
20-30LowlandMontane
ab
a*b*
ab
ab
aa
aa
ab
aa
Figure 3. Variation of root length density in soil profile, between altitudes and seasons.
Lower case letters indicate significant differences between altitudes in each depth
(student’s t-test; P < 0.05); asterisks indicate significant differences of altitude between
seasons in each depth (student’s t-test; P < 0.05).
Discussion
The higher values of RLD and FRB at the 0-5 cm layer at the Montane forest associated
to the low β values indicate that the potential for the ability for nutrient and water uptake

37
is in the top soil. The higher investment in fine roots at Montane forests, especially in
shallow soil layers, is probably a response to maximize nutrient uptake under the lower
decomposition rates (Bruijnzeel & Veneklaas 1998). The higher investment and more
superficial distribution of fine roots, especially at Montane forests, may improve nutrients
uptake that are leached from the canopy (Stewart 2000), litterfall, stemflow and
throughfall (Cavalier 1992). Our results are in accordance to those by Sousa Neto (2008)
who found increases of FRB with altitude in shallow soil layers at the Atlantic Rain
Forest. In fact, studies performed in our sites show that litter accumulation is higher and
litterfall is lower at the Montane site, what is also related to the lower decomposition
rates (Sousa Neto 2008; Martins 2010). The lower decomposition rates, the higher
content of organic matter and the higher CEC at the Montane site (Martins 2010),
indicates that plants are absorbing more organic forms of nitrogen what might be related
to the higher investment in fine roots at 0-5cm (Näsholm et al. 1998; Näsholm et al.
2009).
Our FRB data in the top 30 cm (219.11- 875.22 g m-2) are within the range
reported for other tropical forests from 150 to ~1100 g m-2 (Cavelier et al. 1996; Herbert
& Fownes 1999; Yavitt & Wright 2001; Hertel et al. 2003; Leuschner et al. 2007). In
fact, Jackson et al. (1997) reported an average value of 330 g m-2 for tropical forests.
Unfortunately, we did not evaluate deeper soil layers below 30 cm due to shallow rock
bed. However, the differential investment and vertical distribution in the top 30cm of soil
between the Lowland and the Montane forest may be enough to promote a significant
impact on plant water use, phenology and evapotranspiration. These questions, however,
remain to be answered in future studies being conducted at the Atlantic rain forest.
38
It was not possible evaluate if the higher RLD and FRB values observed at the
Montane forest were due to high fine root production or high fine root longevity. Lower
air and soil temperatures, as observed at the Montane forest (Sousa Neto 2008), are
associated to lower respiration rates, what reduces root turnover (Gill & Jackson 2000)
and increases root longevity (Graefe et al. 2008) maximizing water and nutrient
acquisition (Eissenstat & Yanai 1997). However, it is important to take into account
changes in fine root parameters along altitudinal gradients, associated to the altitudinal
range evaluated. While our comparison was made between forests in ~100 and ~1000 m
above sea level, the studies that did not detect any trends of fine root parameters
investment along altitudinal gradients were performed in ranges from ~1000 to ~3000m
(Graefe et al. 2008; Soethe et al. 2006). Thus, depending on the altitudinal range, factors
such as oxygen deficiency, lower temperatures and reductions in trees size and species
abundance might contribute to lower fine roots investment in higher altitudes (Leuschner
et al. 2007; Graefe et al. 2008).
In our study, the differential investment in FRB and RLD between forests may
also be associated to changes in forest structure, phytosociology and species composition
as also observed by Leuschner et al. (2007). The higher FRB and RLD at the Montane
forest may be related to the total stem density (ha-1) which is higher at the Montane forest
in comparison to the lowland forest (Alves et al. 2010). In addition, the high abundance
of bamboos, that are present only at the Montane site (Padgurschi 2010) and are not
considered in the total density, may also contribute to the higher FRB and RLD. In this
case, we can not disregard the effect of anthropogenic disturbances on our results since
39
the Lowland forest experienced logging and different land uses what can reduce the stem
density (Alves et al. 2010) and, consequently, promote reductions in FRB and RLD.
Although we did not find differences in the seasonal variation of FRB for each
depth, except at the Montane forest in the depths of 5-10 and 10-20 cm, there was a trend
of lower FRB in the wet season especially when considering the whole soil profile.
According to Cavalier (1992), low FRB values are associated to more carbon allocation
aboveground during the growing season what could decrease the fine root production. In
addition, higher water availability during wet season might promote oxygen deficiency
(Soethe et al. 2006; Graefe et al. 2008) what may contribute to accelerate root death and
decomposition rates (Yavitt & Wright 2001). Our RLD data in both sites are similar to
those observed by Soethe et al. (2006) along an altitudinal gradient in Ecuador. In our
study, the increase of RLD from the dry to the wet season, especially at the top soil as
also indicated by lower β values, may improve the nutrient and water uptake
compensating the lower FRB values. In fact, it has been observed that the density of fine
roots increased with soil water content and nutrient availability without changes in FRB
(Yavitt & Wright 2001), what is also associated to changes in root anatomy to invest in
length maintaining similar biomass (Hill et al. 2006).
In conclusion, despite limitations to our understanding about the possible causes
to the increase in fine root parameters with altitude, it was possible to drew some
important implications regarding the differences in FRB and RLD between altitudes. In
addition, the differential fine roots investment between altitudes, within the context of
resource use, should be considered in studies about plant establishment, seedling growth
and population dynamics at the Atlantic Rain Forest. At the ecosystem level, taking into

40
account the fine root parameters and their vertical and seasonal variations may improve
our understanding of the Atlantic rain forest functioning in terms of the biogeochemical
fluxes and the carbon balance in a possible scenario of climate change and environmental
changes.
Acknowledgements
We are grateful to Renato Belinello, Roseli Costa, Ewerton Manarin, Mauro Brum and
Cleiton for help in field work and laboratory. Sincere thanks goes to Willis Gwenzi
(University of Western Australia) for useful discussions and Luis Fernando Martins for
help us with the root washing system. The authors were supported by grants from CNPq
and the Biota-FAPESP Program - Projeto Temático Gradiente Funcional (03/12595-7).
COTEC/IF 41.065/2005 and IBAMA/CGEN 093/2005.
References
ALVES, L.F., VIEIRA, S.A., SCARANELLO, M.A., CAMARGO, P.B., SANTOS,
F.A.M., JOLY, C.A., & MARTINELLI, L.A. 2010. Forest structure and live
aboveground biomass variation along an elevational gradient of tropical Atlantic moist
forest (Brazil). Forest Ecology and Management 260: 679-691.
BOUMA, T.J., NIELSEN, K.L., & KOUTSTAAL, B. 2000. Sample preparation and
scanning protocol for computerised analysis of root length and diameter. Plant and Soil
218: 185-196.
BRUIJNZEEL, L.A. & VENEKLAAS, E.J. 1998. Climatic conditions and tropical
montane forest productivity: the fog has not lifted yet. Ecology 79: 3-9.
CAVELIER , J. 1992. Fine-root biomass and soil properties in a semideciduous and a
lower montane rain forest in Panama. Plant Soil 142: 187–201.

41
EISSENSTAT, D.M .& YANAI, R. D. 1997. The ecology of root life span. Adv.
Ecol. Res. 27: 1–62.
GALE, M.R. & GRIGAL, D.K. 1987. Vertical root distributions of northern tree species
in relation to successional status. Canadian Journal of Forest Research 17: 829-834.
GILL, R.A. & JACKSON, R.B. 2000. Global patterns of root turnover for terrestrial
ecosystems. New Phytologist 147: 13–31.
GORDON, W.S. & JACKSON, R.B. 2000. Nutrient concentrations in fine roots. Ecology
81: 275-280.
GRAEFE, S., HERTEL, D. & LEUSCHNER, C. 2008. Estimating Fine Root Turnover in
Tropical Forests along an Elevational Transect using Minirhizotrons. Biotropica 40: 536–
542.
HERBERT, D. A., & FOWNES, J. H. 1999. Forest productivity and efficiency of
resource use across a chronosequence of tropical montane soils. Ecosystems 2:242–254.
HERTEL, D., LEUSCHNER , C. & HÖLSCHER, D. 2003. Size and structure of fine
root systems in old-growth and secondary tropical montane forests (Costa Rica).
Biotropica 35: 143–153.
HILL, J., SIMPSON, R., MOORE, A. & CHAPMAN, D. 2006. Morphology and
response of roots of pasture species to phosphorus and nitrogen nutrition. Plant and Soil
286: 7-19.
HIMMELBAUER , M.L., LOISKANDL, W. & KASTANEK, F. 2004. Estimating
length, average diameter and surface area of roots using two different Image analyses
systems. Plant and Soil 260: 111-120.

42
JACKSON, R., CANADELL, J., EHLERINGER, J.R., MOONEY, H.A., SALA, O.E. &
SCHULZE, E.D. 1996. A global analysis of root distributions for terrestrial biomes.
Oecologia 108: 389-411.
JACKSON, R.B., MOONEY, H.A. & SCHULZE, E.D. 1997. A global budget for fine
root biomass, surface area, and nutrient contents. Proocedings National Academy of
Sciences 94: 7362–7366.
JOLY, C.A., AIDAR, M.P.M., KLINK, C.A., MCGRAPH, D.G., MOREIRA, A.G.,
MOUTINHO, P., NEPSTAD, D.C., OLIVEIRA, A.A., POTT, A., & SAMPAIO,
E.V.S.B. 1999. Evolution of the Brazilian phytogeography classification systems:
implications for biodiversity conservation. Ciência e Cultura (SBPC) 51: 331-348.
KASPAR, T. C. & EWING, R. P. 1997. ROOTEDGE: Software for measuring root
length from desktop scanner images. Agron. J. 89: 932–940.
LEUSCHNER, C., MOSER, G., BERTSCH, C., RÖDERSTEIN, M. & HERTEL, D.
(2007) Large altitudinal increase in tree root/shoot ratio in tropical mountain forests of
Ecuador. Basic and Applied Ecology 8: 219-230.
MARTINS, L.F.D.S. 2002. Configuração do sistema radicular das árvores de Eucalyptus
grandis em resposta à aplicação de doses crescentes de biossólido. Dissertação de
Mestrado, USP, Piracicaba, SP.
NEPSTAD, D.C., CARVALHO, C., DAVIDSON, E., JIPP, P.H., LEFEBVRE, P.,
NEGREIROS, G.H., DA SILVA, E.D., STONE, T.A., TRUMBORE, S.E. & VIEIRA,
S.A. 1994. The role of deep roots in the hydrological and carbon cycles of Amazonian
forests and pastures. Nature 372: 666-669.
43
PADGURSCHI, M.C.G. 2010. Composição e estrutura arbórea de um trecho de Floresta
Ombrófila Densa Montana com taquaras na Mata Atlântica. Dissertação de Mestrado,
Unicamp, Campinas, SP.
PERSSON, H. 1978. Root dynamics in a young Scots pine stand in central Sweden.
Oikos 30: 508–519.
ROSADO, B.H.P., OLIVEIRA, R.S. & AIDAR, M.P.M. 2010. Is leaf water repellency
related to vapor pressure and crown exposure in tropical forests? Acta Oecologica 36:
645-649.
SOETHE, N., LEHMANN, J. & ENGELS, C. 2006. The vertical pattern of rooting and
nutrient uptake at different altitudes of a south Ecuadorian montane forest. Plant and Soil
286: 287-299.
SOUSA NETO, E.R. 2008. Perdas de nitrogênio pela emissão de óxido nitroso (N2O) e
sua relação com a decomposição da serapilheira e biomassa de raízes na floresta de Mata
Atlântica. Dissertação de Mestrado, USP, Piracicaba, SP.
STEWART, C. G. 2000. A test of nutrient limitation in two tropical montane forests
using root in growth cores. Biotropica 32: 369–373.
WILLIAMS, M., MALHI, Y., NOBRE, A.D., RASTETTER, E.B., GRACE, J. &
PEREIRA, M.G.P. 1998. Seasonal variation in net carbon exchange and
evapotranspiration in a Brazilian rain forest: a modelling analysis. Plant Cell and
Environment 21: 953-968.
YAVITT, J.B. & WRIGHT, S.J. 2001. Drought and Irrigation Effects on Fine Root
Dynamics in a Tropical Moist Forest, Panama. Biotropica 33: 421-434.
44
ZEPPEL, M.J.B., MURRAY, B.R., BARTON, C. & EAMUS, D. 2004. Seasonal
responses of xylem sap velocity to VPD and solar radiation during drought in a stand of
native trees in temperate Australia. Functional Plant Biology 31: 461-470.
ZOBEL, R.W., KINRAIDE, T.B. & BALIGAR, V.C. 2007. Fine root diameters can
change in response to changes in nutrient concentrations. Plant and Soil 297: 243–254.
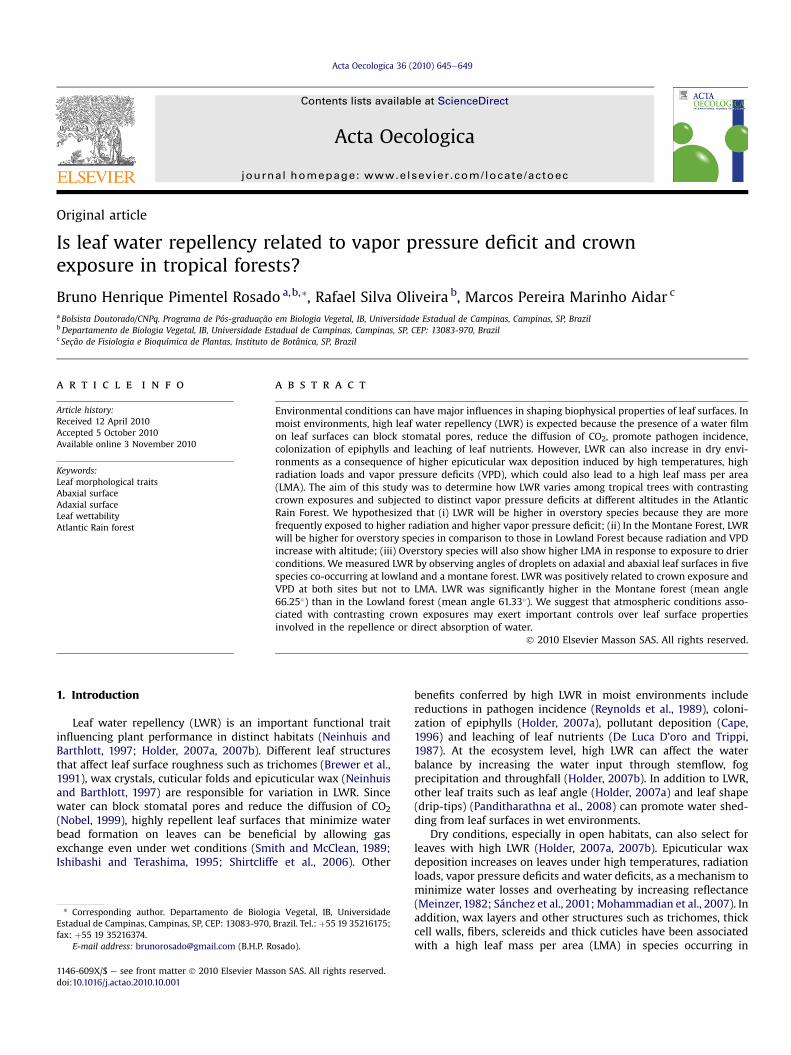
Original article
Is leaf water repellency related to vapor pressure deficit and crownexposure in tropical forests?
Bruno Henrique Pimentel Rosado a,b,*, Rafael Silva Oliveira b, Marcos Pereira Marinho Aidar c
aBolsista Doutorado/CNPq. Programa de Pós-graduação em Biologia Vegetal, IB, Universidade Estadual de Campinas, Campinas, SP, BrazilbDepartamento de Biologia Vegetal, IB, Universidade Estadual de Campinas, Campinas, SP, CEP: 13083-970, Brazilc Seção de Fisiologia e Bioquímica de Plantas, Instituto de Botânica, SP, Brazil
a r t i c l e i n f o
Article history:Received 12 April 2010Accepted 5 October 2010Available online 3 November 2010
Keywords:Leaf morphological traitsAbaxial surfaceAdaxial surfaceLeaf wettabilityAtlantic Rain forest
a b s t r a c t
Environmental conditions can have major influences in shaping biophysical properties of leaf surfaces. Inmoist environments, high leaf water repellency (LWR) is expected because the presence of a water filmon leaf surfaces can block stomatal pores, reduce the diffusion of CO2, promote pathogen incidence,colonization of epiphylls and leaching of leaf nutrients. However, LWR can also increase in dry envi-ronments as a consequence of higher epicuticular wax deposition induced by high temperatures, highradiation loads and vapor pressure deficits (VPD), which could also lead to a high leaf mass per area(LMA). The aim of this study was to determine how LWR varies among tropical trees with contrastingcrown exposures and subjected to distinct vapor pressure deficits at different altitudes in the AtlanticRain Forest. We hypothesized that (i) LWR will be higher in overstory species because they are morefrequently exposed to higher radiation and higher vapor pressure deficit; (ii) In the Montane Forest, LWRwill be higher for overstory species in comparison to those in Lowland Forest because radiation and VPDincrease with altitude; (iii) Overstory species will also show higher LMA in response to exposure to drierconditions. We measured LWR by observing angles of droplets on adaxial and abaxial leaf surfaces in fivespecies co-occurring at lowland and a montane forest. LWR was positively related to crown exposure andVPD at both sites but not to LMA. LWR was significantly higher in the Montane forest (mean angle66.25�) than in the Lowland forest (mean angle 61.33�). We suggest that atmospheric conditions asso-ciated with contrasting crown exposures may exert important controls over leaf surface propertiesinvolved in the repellence or direct absorption of water.
� 2010 Elsevier Masson SAS. All rights reserved.
1. Introduction
Leaf water repellency (LWR) is an important functional traitinfluencing plant performance in distinct habitats (Neinhuis andBarthlott, 1997; Holder, 2007a, 2007b). Different leaf structuresthat affect leaf surface roughness such as trichomes (Brewer et al.,1991), wax crystals, cuticular folds and epicuticular wax (Neinhuisand Barthlott, 1997) are responsible for variation in LWR. Sincewater can block stomatal pores and reduce the diffusion of CO2(Nobel, 1999), highly repellent leaf surfaces that minimize waterbead formation on leaves can be beneficial by allowing gasexchange even under wet conditions (Smith and McClean, 1989;Ishibashi and Terashima, 1995; Shirtcliffe et al., 2006). Other
benefits conferred by high LWR in moist environments includereductions in pathogen incidence (Reynolds et al., 1989), coloni-zation of epiphylls (Holder, 2007a), pollutant deposition (Cape,1996) and leaching of leaf nutrients (De Luca D’oro and Trippi,1987). At the ecosystem level, high LWR can affect the waterbalance by increasing the water input through stemflow, fogprecipitation and throughfall (Holder, 2007b). In addition to LWR,other leaf traits such as leaf angle (Holder, 2007a) and leaf shape(drip-tips) (Panditharathna et al., 2008) can promote water shed-ding from leaf surfaces in wet environments.
Dry conditions, especially in open habitats, can also select forleaves with high LWR (Holder, 2007a, 2007b). Epicuticular waxdeposition increases on leaves under high temperatures, radiationloads, vapor pressure deficits and water deficits, as a mechanism tominimize water losses and overheating by increasing reflectance(Meinzer, 1982; Sánchez et al., 2001; Mohammadian et al., 2007). Inaddition, wax layers and other structures such as trichomes, thickcell walls, fibers, sclereids and thick cuticles have been associatedwith a high leaf mass per area (LMA) in species occurring in
* Corresponding author. Departamento de Biologia Vegetal, IB, UniversidadeEstadual de Campinas, Campinas, SP, CEP: 13083-970, Brazil. Tel.: þ55 19 35216175;fax: þ55 19 35216374.
E-mail address: [email protected] (B.H.P. Rosado).
Contents lists available at ScienceDirect
Acta Oecologica
journal homepage: www.elsevier .com/locate/actoec
1146-609X/$ e see front matter � 2010 Elsevier Masson SAS. All rights reserved.doi:10.1016/j.actao.2010.10.001
Acta Oecologica 36 (2010) 645e649

nutrient and/or water-limited environments (Witkowski andLamont, 1991; Baldini et al., 1997; Niinemets, 2001). For plantsoccurring under stressful conditions, high LMA has been reportedas a common trait that improves nutrient and water use efficiency(Loveless, 1961; Chabot and Hicks, 1982; Niinemets, 2001),protection from solar radiation (Jordan et al., 2005) and protectionagainst herbivory (Turner, 1994).
Increases in radiation, temperature and vapor pressure deficitalong altitudinal gradients (Körner, 2007) can induce modificationsin leaf morphological traits (Grubb, 1977; Velázquez-Rosas et al.,2002). In a broad comparison among tropical forests under con-trasting climates, Holder (2007a, 2007b) showed that leaves in drytropical forest tend to have higher LWR values than at Montanesites. In addition, variation in leaf traits in dry and moist forestsseems to be related to crown exposure (CE) reflecting the wayspecies copewith distinct abiotic factors (Poorter, 2009). Thus, LWRaffects plant responses by (i) increasing water use efficiency (Smithand McClean, 1989; Pandey and Nagar, 2002), (ii) minimizing risksof ice formation on leaves (Aryal and Neuner, 2010) and (iii)promoting water input in soils of dry sites (Holder, 2007a). There-fore, many authors consider LWR as a functional trait that mightpromote an increase in plant performance in dry and open habitats(Pandey and Nagar, 2002; Holder, 2007a), and along altitudinalgradients from tropical to alpine zones (Aryal and Neuner, 2010).
Along the Brazilian coast, the Atlantic Rain Forest is an idealecosystem to test hypotheses about environmental influences onLWR because it provides gradients of abiotic factors associated withforest structure and altitudinal variations. Here, we addressed thefollowing questions: will species that co-occur at different altitudesandwith different crown exposures (CE) showdifferent LWR? Takinginto account the vertical gradient of abiotic factors, does LWR varyaccording to the CE of the species within the forest? What is therelationship between LMA and LWR? We hypothesized that (i)Despite the lower evaporative demand in shaded environments, LWRwill be greater in overstory species because they are more frequentlyexposed to direct radiation and higher vapor pressure deficit; (ii) Atthe Montane Forest, LWR will be greater for overstory species incomparison to those in Lowland Forest because total radiation andVPD increases with altitude; (iii) As well as high LWR, overstoryspecies will show higher LMA in response to drier conditions.
2. Material and methods
2.1. Study site and species
Our study was conducted in lowland and montane forests in theSerra do Mar State Park, which is the largest protected area of
Atlantic Rain Forest and covers 315,000 ha in the north of São Paulostate, Brazil. The Lowland forest is 100 m above sea level(23�310e23�340S and 45�020e45�050W) and has a tropical climatewithout a marked dry season and a mean annual precipitation of2200 mm. Usually, the driest months are July and August. TheMontane forest is 1000 m above sea level (23�170e23�240S and45�030e45�110W) and has a tropical temperate climate. Meanannual precipitation is approximately 2000 mm and frequent fogevents occur in comparison to the Lowland forest. All physiogno-mies are characterized as broadleaf evergreen forests.
We classified the crown exposure (CE) of trees according toClark and Clark (1992), where the crowns are classified according toan illumination index from 1 (when the tree does not receive anydirect light) to 5 (emergent crown, fully exposed) (Table 1). Thespecies were selected according to the following criteria: co-occurrence at both sites, species with different canopy position(overstory, intermediary and understory) and species belonging todifferent families to avoid phylogenetic effects. We studied fivespecies co-occurring at the Lowland and at the Montane Forest atthe Atlantic Rain Forest to assess whether species with contrastingcrown exposures would show distinct LWR. The following specieswere chosen: Hyeronima alchorneoides Allemão (Phyllantaceae),Alchornea triplinervea (Spreng.) Müll. Arg. (Euphorbiaceae), Molli-nedia schottiana (Spreng.) Perkins (Monimiaceae); Euterpe edulisMart. (Arecaceae) and Rustia formosa Klotzch (Rubiaceae). Forsimplicity, we will refer to each species by their generic names.
2.2. Leaf water repellency and leaf mass per area
In February 2009, seventy leaves for each species, from tenindividuals per species, were collected for leaf water repellencymeasurements, which were made on the abaxial and adaxial leafsurfaces for each species and estimated as the contact angle (q)between a water droplet and the leaf surface (Holder, 2007a). Afterthe leaf surface was dried with an absorbent filter paper, the leafwas pinned onto a styrofoam platform to flatten the leaf surfaceand expose the leaf’s horizontal profile. A 10-ml droplet of distilledwater was placed onto the leaf surface using a Micropipette (P100,Pipetman, Gilson SAS, Villiers-le-Bel, France) to represent a rain-drop as described by Holder (2007a). A photograph of a profile ofthewater droplet resting on the leaf surfacewas takenwith a digitalcamera Nikon Cool Pix P80 (135MM F/2.8e4.5 AF e 10 Megapixel;Nikon Corporation, Tokyo, Japan). From the digital image, the q ofthe leaf surface and the line tangent to the droplet through thepoint of contact was measured using the free software ImageJ,version 1.37, (National Institutes of Health, USA, http://www.rsd.info.nih.gov/ij/). The q was measured relative to the horizontal
Table 1The mean and standard error (SE) of leaf water repellency (in degrees) of adaxial and abaxial surfaces, leaf mass per area (LMA) for each species within each site and crownexposure (CE). Adaxial and abaxial leaf surfaces were significantly different at P < 0.05(*); P < 0.01 (**); P < 0.001 (***) based on t test. Bold numbers indicate on which leafsurface the leaf water repellency was higher. Different letters indicate significant differences among species within each site (ANOVA, P < 0.05).
Site Species LWR Adaxial LWR Abaxial LMA (g m�2) Crown Exposure
Mean SE Mean SE Mean SE Mean SE
Lowland Forest Alchornea*** 62.17 1.54 68.61 1.35 75.27 ab 12.04 4.5 0.19Euterpe* 51.21 1.76 44.68 1.21 80.11 ab 7.7 3.01 0.30Hyeronima** 69.83 2.38 77.92 2.66 82.38 b 6.24 5.0 0Mollinedia 47.22 2.34 50.03 1.71 48.09 a 4.47 3.04 0.07Rustia *** 64.73 2.35 50.1 0.36 58.35 ab 7.06 4.0 0.25
Montane Forest Alchornea* 63.88 2.27 69.88 2.36 86.62 a 4.91 4.96 0.04Euterpe** 61.27 1.9 51.47 1.71 88.16 a 16.07 3.0 0.20Hyeronima 74.95 2.55 70.47 2.04 78.17 a 3.44 4.94 0.04Mollinedia 59.19 2.05 60.74 2.26 61.33 a 6.11 3.0 0.15Rustia 65.89 2.79 63.57 1.8 73.83 a 3.96 4.0 0.28
B.H.P. Rosado et al. / Acta Oecologica 36 (2010) 645e649646

leaf surface. Based on previous studies, leaves surfaces are classifiedas super-hydrophilic (q < 40�), highly wettable (40� < q < 90�),wettable (90� < q < 110�), non-wettable (110� < q < 130�), highlynon-wettable (130� < q < 150�) and super-hydrophobic (q > 150�)(Smith and McClean, 1989; Aryal and Neuner, 2010).
All leaves were digitized (100 dpi) to estimate leaf area and leafcircularity using ImageJ, version 1.37, (National Institutes of Health,USA, http://www.rsd.info.nih.gov/ij/). Leaves were then oven-driedfor at least 48 h at 70 �C and weighed. From these data the LMA(g m�2) was calculated as leaf mass per unit leaf blade area.
2.3. Micrometeorological variables
At each altitude three temperature and relative humiditysensors (HOBO, Onset Computer Corporation), set to gather dataevery 30 min, were placed at different heights at approximately20 m (canopy), 10 m (intermediary) and 2 m (understory) from theground at both sites. These datawere used to calculate atmosphericvapor pressure deficit (VPD). Mean values for each height and sitewere calculated from a temporal series of three hundred days. Weconsidered zero VPD data, in non-rainfall periods, as a proxy toestimate the number of days with fog events in each site. Globalsolar radiation (MJ m�2) data in both sites were obtained fromglobal solar radiation sensors (MODEL 200SA Pyranometer,Microcom Design Inc, Hunt Valley, MD, USA). At the Lowland forest,the sensor was placed at 2 m height in a site clearly unobstructedfor daylight conditions. At the Montane forest, it was necessary toplace the sensor above the canopy, at 35m height, for unobstructeddaylight conditions. The global solar radiation data were alsoavailable as a dataset provided by the Centro de Previsão de Tempoe Estudos Climáticos (CPTEC/INPE) website (http://www.cptec.inpe.br/). The mean values correspond to a one year period ofdaily integral of radiation energy that we used to calculate monthlyaverages.
2.4. Statistical analysis
Linear regressions were performed between LWR on both leaffaces and mean VPD, CE and LMA. Tests of significance of differ-ences between means were performed for each species withinstudy sites to determine differences between the LWR of adaxialand abaxial surfaces. Nested ANOVAwas used to test whether therewere significant differences in LWR in the five species and betweenthe two sites. Species were nested within study sites, leaves werenested within species and leaf surfaces were nested within leaves(Holder, 2007a, 2007b). When analysis of variance showed signif-icant differences among species, we used Tukey HSD multiplecomparison tests to determine which pairs of species and leaf facesexhibited significant differences (Holder, 2007a, 2007b). We usedpaired t-tests to compare VPD and solar radiation between sites. Alldata analysis were done using the R software, version 2.11.1, 2010,http://www.R-project.org.
3. Results
Global solar radiation was significantly higher in the Montane(12.0 MJ m�2) in comparison to the Lowland forest (8.6 MJ m�2)throughout the year (paired t test ¼ �4.60; df ¼ 13; P < 0.0001).Mean VPD was also higher in the Montane forest (0.21 kPa) than inthe Lowland forest (0.15 kPa; paired t test ¼ �5.72; df ¼ 13;P < 0.0001) and increased from the understory to the overstory inboth sites (Fig. 1). Irrespective of day or night, the stratification ofVPD in the canopy profile did not change along the seasons (datanot shown). Using zero VPD data, we found that fog occurredduring 100 days in the Montane Forest and 34 days per year at the
Lowland Forest. Fog duration was also higher at the MontaneForest, as zero VPD data represented 26.4% of the whole VPDdataset (registered every 30 min) at this site and 4.4% at theLowland Forest during a year.
We found differences in LWR between sites, species, leaves andleaf faces (Table 2). LWR showed significant differences betweenspecies and between adaxial and abaxial leaf surfaces (Table 2,Fig.1). Leafwater repellencywas significantly higher at theMontaneforest (mean angle 66.25�) than Lowland forest (mean angle 61.33�;Table 2). In the Lowland Forest, Euterpe and Rustia showed higherLWR of the adaxial surfaces while Alchornea and Hyeronima hadhigher abaxial LWR (Table 1, Fig. 1). In the Montane Forest onlyEuterpe and Alchornea showed differences between leaf surfaces asalso observed in the Lowland site. At both altitudes, LWR did notshow a clear trend of differences between leaf faces (Table 1).
Within species, LWR of each leaf surface did not vary for canopyspecies between altitudes in most cases (Fig. 1). However, Euterpe,Mollinedia and Rustia had significant lower LWR in the LowlandForest especially on the abaxial surfaces (Fig. 1). In general, theoverstory species had higher LWR on both leaf faces and at bothaltitudes (Fig. 1). LWR of the adaxial surface was positively relatedto CE (R2 ¼ 0.89, P < 0.05) and VPD (R2 ¼ 0.87, P < 0.05) only in theLowland Forest (Fig. 2). For the abaxial surface, LWR was positivelyassociated with CE in Lowland (R2¼ 0.84, P< 0.05) andwith CE andVPD in Montane Forest (R2 ¼ 0.82, P < 0.05; R2 ¼ 0.77, P < 0.05,respectively; Fig. 2). For our study sites, the vertical stratification ofdaytime and nighttime VPD were similar, therefore the relation-ships between daylight and nighttime VPD with LWR were notdifferent. The LMA variation among species was 1.41-fold for theLowland site and 1.44-fold for the Montane site. In the Lowland siteLMA was highest in Hyeronima while Mollinedia had the lowestvalues (Table 1). Despite the lack of significant differences amongspecies in the Montane site, Rustia and Mollinedia, showed a trendof increase of LMA from the Lowland to the Montane forest. Forboth leaf faces in both sites, the relationship between LWR and LMAwas not significant.
Fig. 1. Comparison of leaf water repellencies between Lowland and Montane Forest foreach leaf surface. Different letters indicate significant differences among species foreach leaf surface (Tukey HSD multiple pairwise comparison, P < 0.05).
Table 2Summary of results of the Nested ANOVA for each level.
df SS MS F
Site 1 5077 5076.9 1880.88***Site : Species 8 52417 6552.1 2427.4***Site : Species : Leaf 690 90491 235.7 87.304*Site : Species : Leaf : Leaf Face 700 24113 61.5 22.789*
*P < 0.05; ***P < 0.0001.
B.H.P. Rosado et al. / Acta Oecologica 36 (2010) 645e649 647

4. Discussion
Leaf trait variation from understory to canopy and along alti-tudinal gradients have been consistently described in the literature(Williams et al., 1989; Witkowski and Lamont, 1991; Niinemets,2001; Panditharathna et al., 2008; Beaumont and Burn, 2009;Aryal and Neuner, 2010). Our findings are similar to thoseobserved by Aryal and Neuner (2010) where LWR increases alongan altitudinal gradient and decreases from the canopy to theunderstory. However, while our study was performed at tropicalforests located at 100 and 1000 m above the sea level, their studycomprised a different range of elevation (from 186 to 5268 m abovesea level) and ecosystems (from tropical to alpine climatic zones) inthe Central Himalayas, Nepal. In their study, the functional meaningof higher LWR, considered as highly non-wettable(130� < q < 150�), was preferentially related to avoidance of iceformation that could cause damage to leaf tissues in plantsfrequently exposed to freezing temperatures. In contrast, our LWRdata (from 44.68� to 77.92�) are within the range of highly wettableleaves as observed for other tropical environments (Holder, 2007a;Aryal and Neuner, 2010). Despite the small range of variation ofLWR in our study sites, we showed that CE and VPD were positivelyrelated to LWR, suggesting that exposition to drier conditionsmightstimulate epicuticular wax exudation from epidermic and guardcells (Meinzer, 1982; Sánchez et al., 2001; Mohammadian et al.,2007). Thus, even subtle increases in LWR through wax deposi-tion could minimize sharp declines in leaf water potential, strongstomatal closure and decreases in photosynthesis (Myers et al.,1987; Santiago et al., 2000; Jordan et al., 2005; Motzer et al., 2005).
We found that LWR was also higher for overstory species.Similarly, wetness on leaf surfaces decreases from understory to
canopy in montane tropical forests in Colombia as a consequence oflow relative humidity and high radiation in the canopy (Letts andMulligan, 2005). In that study, Letts and Mulligan (2005) foundthat at 10 m height, mean wetness on leaf surfaces is around 14%,suggesting that water beads do not form very frequently onexposed leaves. This finding reinforces the view that high LWRmight be related to factors different from those exclusively relatedto avoidance of leaf wetting on exposed leaves. Additionally, higherLWR has been reported for drier sites (Holder, 2007a, 2007b) and inplants occurring in more open habitats (Pandey and Nagar, 2002;Aryal and Neuner, 2010) where leaf wetting is less common. Incontrast to studies where changes in leaf structures in response toenvironmental conditions (Meinzer, 1982; Baldini et al., 1997;Sánchez et al., 2001; Jordan et al., 2005; Mohammadian et al.,2007) lead to alterations in LWR (Neinhuis and Barthlott, 1997),we did not find any relationship between LMA and LWR. LMA is theproduct of different structures such as thick cell walls, fibers andsclereids (Witkowski and Lamont, 1991; Baldini et al., 1997;Niinemets, 2001), which may not affect the biophysical character-istics of leaf surfaces, and therefore LWR.
There is increasing evidence to show that when a leaf gets wet,water might be either repelled or directly absorbed (Burgess andDawson, 2004; Oliveira et al., 2005; Zimmermann et al., 2007;Simonin et al., 2009). Leaf water uptake (LWU) seems to bea common mechanism among terrestrial plants that mightcontribute positively to the maintenance of key physiologicalprocesses. Plants that are able to absorb water via leaves duringperiods of soil water deficit may increase their leaf water content,leaf water potential, stomatal conductance and rates of gasexchange (Burgess and Dawson, 2004; Simonin et al., 2009;Burkhardt, 2010). In addition, Simonin et al. (2009) suggested
Ada
xial
Sur
face
Lea
f W
ater
Rep
elle
ncy
(o ) L
eaf
Wat
er R
epel
lenc
y (o )
45
50
55
60
65
70
75
Crown Exposure
3.0 3.5 4.0 4.5 5.0
Aba
xial
Sur
face
40
50
60
70
80
Lowland Forest Montane Forest
VPD (kPa)
0.10 0.12 0.14 0.16 0.18 0.20 0.22
Lowland - R 2 =0.87; p<0.05 Montane - non significant
Lowland - non significant Montane - R 2 =0.77; p<0.05
Lowland - R 2 =0.84; p<0.05 Montane - R 2 =0.82; p<0.05
Lowland - R 2 =0.89; p<0.05 Montane - non significant
Fig. 2. Relationships between adaxial surface LWR, crown exposure and VPD in the Lowland (y ¼ 19.50 þ 10.11x and y ¼ 30.98 þ 187.89x, respectively) and Montane forest (non-significant relationships) and between abaxial surface LWR, crown exposure and VPD in the Lowland (y ¼ 0.23 þ 14.84x, non-significant, respectively) and Montane forest(y ¼ 34.51 þ 7.21x, y ¼ 8.89 þ 264.51x, respectively).
B.H.P. Rosado et al. / Acta Oecologica 36 (2010) 645e649648

that the negative effect of low LWR would be short lived, since thepositive physiological effects (e.g. increased rates of gas exchange)take place after leaf surfaces have dried. However, the benefitsassociated with high LWU capacity will depend on the frequency ofevents promoting leaf wettability and soil water availability.
In conclusion, we showed that LWR varied according to crownexposure andVPD at both sites, supporting thewell-observed trendsof leaf trait variation along environmental gradients. However, it isimportant to highlight the role of CE to changes in LWR. Our resultssuggest that the functional significance of LWR is related to differentCE and to different atmospheric conditions which plants are sub-jected to. Thus, further studies considering leaf trait variation alongaltitudinal gradients should consider differences associated withstrata position and crown exposure. Additionally, much largerdatasets are necessary to elucidate the tradeoffs between therepellent versus absorptive abilities of leaf surfaces and their inter-play with other leaf traits and atmospheric conditions.
Acknowledgements
We are grateful to Pedro Cavalin, Giseli Areias and AmandaMartins for their help in fieldwork. We thank Dr. Curtis Holder forhelping us with the method to estimate leaf water repellency andDr. Erik Veneklaas for useful discussions. Sincere thanks goes toElizabeth McLean (University of Western Australia), Dr. EduardoArcoverde de Mattos and two anonymous reviewers for criticalreading and suggestions. The authors were supported by grantsfrom CNPq and the Biota-FAPESP Program e Projeto TemáticoGradiente Funcional (03/12595-7). COTEC/IF 41.065/2005 andIBAMA/CGEN 093/2005.
References
Aryal, B., Neuner, G., 2010. Leaf wettability decreases along an extreme altitudinalgradient. Oecologia 162, 1e9.
Baldini, E., Facini, O., Nerozzi, F., Rossi, F., Rotondi, A., 1997. Leaf characteristics andoptical properties of different woody species. Trees 12, 73e81.
Beaumont, S., Burn, K.C., 2009. Vertical gradients in leaf trait diversity in a NewZealand forest. Trees 23, 339e346.
Brewer, C.A., Smith, W.K., Vogelmann, T.C., 1991. Functional interaction between leaftrichomes, leaf wettability and the optical properties of water droplets. Plant,Cell and Environment 14, 955e962.
Burgess, S.S.O., Dawson, T.E., 2004. The contribution of fog to the water relations ofSequoia sempervirens (d. Don): foliar uptake and prevention of dehydration.Plant, Cell and Environment 27, 1023e1034.
Burkhardt, J., 2010. Hygroscopic particle on leaves: nutrients or desiccants?Ecological Monographs 80, 369e399.
Cape, D.J.,1996. Surfacewetness andpollutant deposition. In: Kerstiens, G. (Ed.), PlantCuticles: An Integrated Approach. Bios Scientific Publ., Oxford, pp. 283e300.
Chabot, B.F., Hicks, D.J., 1982. The ecology of leaf life spans. Annual Review ofEcology and Systematics 13, 229e259.
Clark, D., Clark, D., 1992. Life history diversity of canopy and emergent trees ina neotropical rain forest. Ecological Monographs 62, 315e344.
De Luca D’oro, G.M., Trippi, V.S., 1987. Effect of stress conditions induced bytemperature, water and rain on senescence development. Plant Cell Physiology28, 1389e1396.
Grubb, P.J., 1977. Control of forest growth and distribution on wet tropical moun-tains: with special reference to mineral nutrition. Annual Review of Ecology andSystematics 8, 83e107.
Holder, C., 2007a. Leaf water repellency as an adaptation to tropical montane cloudforest environments. Biotropica 39, 767e770.
Holder, C., 2007b. Leaf water repellency of species in Guatemala and Colorado (USA)and its significance to forest hydrology studies. Journal ofHydrology336,147e154.
Ishibashi, M., Terashima, I., 1995. Effects of continuous leaf wetness on photosyn-thesis: adverse aspects of rainfall. Plant, Cell and Environment 18, 431e438.
Jordan, G.J., Dillon, R.A., Weston, P.H., 2005. Solar radiation as a factor in theevolution of scleromorphic leaf anatomy in Proteaceae. American Journal ofBotany 92, 789e796.
Körner, C., 2007. The use of ‘altitude’ in ecological research. Trends in Ecology andEvolution 22, 569e574.
Letts, M.G., Mulligan, M., 2005. The impact of light quality and leaf wetness onphotosynthesis in north-west Andean tropical montane cloud forest. Journal ofTropical Ecology 21, 549e557.
Loveless, A.R., 1961. A nutritional interpretation of sclerophylly based on differencesin the chemical composition of sclerophyllous and mesophytic leaves. Annals ofBotany 25, 169e184.
Meinzer, F.C., 1982. The effect of vapor pressure on stomatal control of gasexchange in douglas fir (Pseudotsuga menziesii) saplings. Oecologia 54,236e242.
Mohammadian, M.A., Watling, J.R., Hill, R.S., 2007. The impact of epicuticular waxon gas-exchange and photoinhibition in Leucadendron lanigerum (Proteaceae).Acta Oecologica 31, 93e101.
Motzer, T., Munz, N., Küppers, M., Schmitt, D., Anhuf, D., 2005. Stomatal conduc-tance, transpiration and sap flow of tropical montane rain forest trees in thesouthern Ecuadorian Andes. Tree Physiology 25, 1283e1293.
Myers, B.J., Robichaux, R.H., Unwin, G.L., Craig, I.E., 1987. Leaf water relations andanatomy of a tropical rainforest tree species vary with crown position. Oeco-logia 74, 81e85.
Neinhuis, C., Barthlott, W., 1997. Characterization and distribution of water-repel-lent, self-cleaning plant surfaces. Annals of Botany 79, 667e677.
Niinemets, Ü, 2001. Global-scale climatic controls of leaf dry mass per area, density,and thickness in trees and shrubs. Ecology 82, 453e469.
Nobel, P., 1999. Physiochemical and Environmental Plant Physiology, second ed.Academic Press, San Diego, California.
Oliveira, R.S., Dawson, T., Burgess, S.S.O., 2005. Evidence for direct water absorptionby the shoot of the desiccation-tolerant plant Vellozia flavicans in the savannasof central Brazil. Journal of Tropical Ecology 21, 585e588.
Pandey, S., Nagar, P.K., 2002. Leaf surface wetness and morphological characteristicsof Valeriana jatamansi grown under open and shade habitats. Biologia Planta-rum 45, 291e294.
Panditharathna, P.A.K.A.K., Singhakumara, B.M.P., Griscom, H.P., Ashton, M.S., 2008.Change in leaf structure in relation to crown position and size class for treespecies within a Sri Lankan forest. Botany 86, 633e640.
Poorter, L., 2009. Leaf traits show different relationships with shade tolerance inmoist versus dry tropical forests. New Phytologist 181, 890e900.
Reynolds, K.M., Madden, L.V., Richard, D.L., Ellis, M.A., 1989. Splash dispersal ofPhytophthora cactorum from infected strawberry fruit by simulated canopy drip.Phytopathology 79, 447e454.
Santiago, L.S., Goldstein, G., Meinzer, F.C., Fownes, J.H., Mueller-Dombois, D., 2000.Transpiration and forest structure in relation to soil waterlogging in a Hawaiianmontane cloud forest. Tree Physiology 20, 673e681.
Sánchez, F.J., Manzanares, M., De Andrés, E.F., Tenorio, J.L., Ayerbe, L., 2001. Residualtranspiration rate, epicuticular wax load and leaf colour of Pea plants in droughtconditions. Influence on harvest index and canopy temperature. EuropeanJournal of Agronomy 15, 57e70.
Simonin, K.A., Santiago, L.S., Dawson, T.E., 2009. Fog interception by Sequoia sem-pervirens (D. Don) crowns decouples physiology from soil water deficit. Plant,Cell and Environment 32, 882e892.
Shirtcliffe, N.J., Pyatt, F.B., Newton, M.I., Mchale, G., 2006. A lichen protected bya super-hydrophobic and breathable structure. Journal of Plant Physiology 163,1193e1197.
Smith, W.K., McClean, T.M., 1989. Adaptive relationship between leaf water repel-lency, stomatal distribution, and gas exchange. American Journal of Botany 76,465e469.
Turner, I.M., 1994. Sclerophylly: primarily protective? Functional Ecology 8,669e675.
Velázquez-Rosas, Meave, J., Vazquez-Santana, S., 2002. Elevational variation of leaftraits in montane rain forest tree species at la chinantla, Southern Mexico.Biotropica 34, 534e546.
Williams, K., Field, C.B., Mooney, H.A., 1989. Relationships among leaf constructioncost, leaf longevity, and light environment in rain-forest plants of the genusPiper. American Naturalist 133, 198e211.
Witkowski, E.T.F., Lamont, B.B., 1991. Leaf specific mass confounds leaf density andthickness. Oecologia 88, 486e493.
Zimmermann, D., Westhoff, M., Zimmermann, G., Geßner, P., Gessner, A.,Wegner, L.H., Rokitta, M., Ache, P., Schneider, H., Vásquez, J.A., Kruck, W.,Shirley, S., Jakob, P., Hedrich, R., Bentrup, F.-W., Bamberg, E., Zimmermann, U.,2007. Foliar water supply of tall trees: evidence for mucilage-facilitated mois-ture uptake from the atmosphere and the impact on pressure bombmeasurements. Protoplasma 232, 11e34.
B.H.P. Rosado et al. / Acta Oecologica 36 (2010) 645e649 649

50
Capítulo 3
Diversity in nighttime transpiration behavior of woody species at the Atlantic Rain Forest, Brazil Bruno H. P. Rosado1,4; Stephen S. O. Burgess2,3; Rafael S. Oliveira4 & Marcos P. M. Aidar5
(1)Bolsista Doutorado/CNPq. Programa de Pós-graduação em Biologia Vegetal, IB,
Universidade Estadual de Campinas, Campinas, SP, Brazil.
(2)Faculty of Agriculture, Food and Natural Resources, The University of Sydney,
Sydney, Australia.
(3)School of Plant Biology, The University of Western Australia, Perth, Australia
(4)Departamento de Biologia Vegetal, IB, Universidade Estadual de Campinas, São Paulo,
SP, Brazil.
(5) Seção de Fisiologia e Bioquímica de Plantas, Instituto de Botânica, SP, Brazil.
(*)Corresponding author: Departamento de Biologia Vegetal, IB Universidade Estadual de
Campinas, Campinas/SP, CEP: 13083-970, Brazil; e-mail: [email protected]; fax:
++ 55 (0)19 35216374; tel: ++ 55 (0)19 35216175.
Word count Main body of text: 3490 words Introduction: 804 words Material and Methods: 795 words Results: 383 words Discussion: 1508 words Acknowledgments: 75 The manuscript contains 04 figures and 01 Supporting Information Table S1.

51
Summary
• Nighttime transpiration (NT) has been documented in many plant species but we
do not yet have a thorough understanding of abiotic controls of this phenomenon.
In this study we examined interspecific variation in NT behaviors in plants with
distinct crown exposures and occurring at different altitudes in the Brazilian
Atlantic Rainforest. We hypothesized that understory species in Lowland and
Montane forests will have quite uniform, low NT owing to the buffered within
canopy microclimate; NT will be higher for overstory species which are more
coupled to drier, windier atmospheric conditions and NT will be higher for
Montane species, where VPD and incident solar radiation are higher.
• To this end, we used the heat ratio method to make measurements of sap flow in
species occurring in both altitudes.
• NT did indeed show differences between altitude and species. Of most
significance was prominent non-linear relationship between the NT and VPD,
observed at the Montane site.
• This non-linearity is in contrast to most previously published NT kinetics and
suggests strong physiological or abiotic controls on NT rates. We discuss
thermodynamic aspects relevant to non-linear NT kinetics and also the wider
implications of diversity of NT in complex forest stands.
Keywords: nighttime transpiration, cooling effect, xylem refilling, sensible heat flux,
latent heat flux, sap flow, micrometeorology, Atlantic rain forest
52
Introduction Transpiration by plants follows a force-flux relationship that is shaped by the ability of a
plant’s transport system to conduct water. Plants can modify their hydraulic conductivity
throughout the entire transport system and perhaps the strongest and most dynamic
control is that of stomatal aperture which affects conductance to water vapor:
understanding stomatal behavior in response to environmental conditions is key to
understand variation on plant water fluxes (Cowan & Farquhar, 1977; Jones &
Sutherland, 1991; Cruiziat et al., 2002). A commonly known relationship between
transpiration and vapor pressure deficit (VPD) is a non-linear saturating response of
daytime transpiration to VPD because of decreases in stomatal conductance as a response
to a drying atmosphere (Jones & Sutherland, 1991; Cruiziat et al., 2002). Whilst daytime
transpiration dynamics are quite well studied, only recently did attention turn to nighttime
transpiration (NT).
NT has been described for quite a few plant species from contrasting
environments (Donovan et al., 2001; Dawson et al., 2007; Snyder, 2008; Christman,
2008) and whilst generally lower in magnitude relative to daytime transpiration it is none-
the-less significant enough for potential impacts on whole-plant water relations and
ecosystem hydrology (Dawson et al., 2007; Wood et al., 2008). Functional consequences
of NT include pre-dawn disequilibrium, increases in oxygen supply (Daley & Phillips,
2006) and facilitation of bulk flow of water to the roots overnight, promoting nutrient
uptake (Donovan et al., 2001, Snyder et al., 2003). Although little is known about the
controls of NT, a strongly linear positive relationship between sapflow and VPD has been
documented in several ecosystems, suggesting that VPD is the most important

53
environmental driving force for nocturnal water loss (Fisher et al., 2007; Dawson et al.,
2007).
In tropical forests, small-scale changes in abiotic factors such as VPD, air
temperature and solar radiation are common due to the high heterogeneity of the canopy
structure, topography, and wind patterns (Motzer, 2005). Thus, even in short horizontal
and altitudinal distances, plant species may be subjected to high spatio-temporal
heterogeneity (Leigh et al., 2004). In view of the high heterogeneity in tropical forests,
many studies have been performed to evaluate species responses at different scales
(Brujinzeel & Veneklaas, 1998; Velázquez-Rosas et al., 2002; Graham, 2005; Holder,
2007; Beaumont & Burn, 2009; Poorter, 2009). Species responses along altitudinal
gradients have been studied especially at a morphological level (Brujinzeel & Veneklaas,
1998; Velázquez-Rosa et al., 2002; Holder, 2007; Rosado et al., 2010) where species
from contrasting environments exhibit different leaf morphologies in response to the
degree of crown exposure (CE) and the environmental regime this implies (Poorter,
2009). To date however, whole plant water relations of tropical rain forest trees have not
been examined along altitudinal gradients (Santiago et al., 2000; Santiago et al., 2004;
Oliveira et al., 2005). It is equally true that the science surrounding NT has been poorly
advanced in tropical rain forests (Dawson et al., 2007). Since tropical rain forests present
high environmental heterogeneity and high species diversity (Myers et al., 2000; Leigh et
al., 2004), this is both a major hindrance and major research need for understanding how
nighttime conditions plant ecophysiology and overall forest function.
The Atlantic Forest occurs along the whole Brazilian coast and is considered a
hot-spot (Myers et al., 2000). This biome is a mosaic of ecosystems that belongs to the
54
Atlantic Dominion including lowland and montane forests (Joly et al., 1999). In addition,
altitudinal gradients present in the Atlantic rain forest produce directional changes in
abiotic factors such as increases in radiation and decreases in temperature and
atmospheric pressure. These changes promote strong directional changes in plant traits
such as increases in leaf longevity and water use (Grubb, 1977; Brujinzeel & Veneklaas,
1998; Leuschner, 2000; Körner, 2007).
Considering the high environmental heterogeneity that tropical forest plants are
subjected to via vertically complex canopies and altitudinal variation, we address the
following question: are there different nocturnal transpirational behaviors in plants with
distinct strata positions, crown exposures (CE) and occurring in different altitudes? We
chose four woody species from Atlantic Rainforest co-occurring in Lowland (100 m) and
Montane forests (1000 m) and occupying different canopy strata. We hypothesized that
understory species in both altitudes will have quite uniform low rates of NT owing to the
buffered within-canopy microclimate; generally low VPD should produce low NT fluxes.
On the other hand, overstory species will be more exposed to bulk atmosphere conditions
with a consequence of greater evaporative demand and higher NT. We also hypothesize
higher NT at the Montane site compared to the Lowland forest, since VPD is higher in
the sunnier montane environment (Rosado et al., 2010). Testing these hypotheses
concerning the diversity of NT ecophysiology within Atlantic Rainforest will deepen our
understanding of the structural and functional complexity of these valuable forests which
face threats from fragmentation and shifting environmental conditions.

55
Material and Methods
Study sites and species
Our study was conducted in lowland and montane forests in the Serra do Mar
State Park, covering 315,000 hectares in the Atlantic Rain Forest in the north of São
Paulo state, Brazil. The Lowland forest is around 100 m above sea level- (23° 31' to 23°
34' S and 45° 02' to 45° 05' W) and has a tropical climate and a mean annual precipitation
of 2200 mm. Usually, the driest months are July and August. The Montane forest is 1000
m above sea level - (23° 17' to 23° 24' S and 45° 03' to 45° 11' W), has a tropical
temperate climate, with mean annual precipitation around 2000 mm and fog frequency is
around 100 days per year (Rosado et al., 2010). All physiognomies are characterized as
broadleaf evergreen tropical forests.
We selected plant species according to co-occurrence at both sites, contrasting
canopy position (overstory, intermediary and understory) and species belonging to
different families to avoid phylogenetic effects. The species chosen were: Hyeronima
alchorneoides Allemão (Phyllantaceae), Alchornea triplinervea (Spreng.) Müll. Arg.
(Euphorbiaceae), Mollinedia schottiana (Spreng.) Perkins (Monimiaceae); and Rustia
formosa Klotzch (Rubiaceae). Hyeronima and Alchornea are overstory species while
Rustia is an intermediary and Mollinedia an understory species. For simplicity, we will
refer to each species by their generic names.
Sap-flow probe installation and measurements
We used the heat ratio method (Burgess et al., 1998, 2001) to make continuous
measurements of sap flow in trunks in three individuals per species in each site. The
HRM measure the increase in temperature following a heat pulse at two symmetrical

56
points, 5 mm above and below a heater inserted 30 mm into the active sapwood. This
technique allows bi-directional measurements of sap flow and also measures very slow
flow rates which we might expect during the night. Sap flow sensors (ICT International
Pty Ltd, Armidale, NSW, Australia) were inserted into the xylem tissue of the trunks at
breast height of three individuals per species. Each temperature sensor had two
measurement points to measure sap velocity at two depths in the xylem tissue. Standard
needles are 35mm long and have two thermocouples located 7.5 mm and 22.5 mm from
the tip of the needle. This provides a spacing of 15 mm between each thermocouple and a
12.5mm distance between the outer thermocouple and the epoxy base of the needle. The
15 mm spacing between thermocouples is to prevent thermal differentiation of the two
the readings. A metal guide (with three holes carefully drilled on a parallel line, spaced
out 5 mm apart) was used to help drill the holes parallel and correctly spaced along their
full depth of insertion (~30mm). The heater was set up to send a pulse every 30 min and
temperature ratios were recorded continuously with a data logger (ICT International Pty
Ltd, Armidale, NSW, Australia). We calculated the heat pulse velocity (cm hr-1)
following Burgess et al. (1998) as:
V= (kX-1) x ln (v1 (v2)-1) x 3600
where k is the thermal diffusivity of the fresh wood, X is the distance between the heater
and the thermocouples, and v1and v2 are the differences between the initial temperature
at the two thermocouples (downstream and upstream the flow in relation to the heater,
respectively) and the temperature measured after a heat pulse. Since it was not possible to
cut the xylem to establish zero flow, we selected a series of cloudy dawn after rainfall
events to establish the baseline. The measurements were performed from June 2008 to

57
September 2009. We selected data from thirty representative nights of two dry seasons
(July 2008 and June 2009) and one wet season (January 2009). The dry season of 2008
had two rainless months and was drier than 2009. NT was calculated as % of maximum
transpiration rate during each period per individual. Data collected between 19:00 and
05:00 h were considered for analysis. Noisy data caused by equipment failure were
excluded from the analysis.
Environmental variables
Three air temperature and relative humidity sensors (HOBO) were placed at
different heights at the approximate distance from the ground of 20, 10 and 2 meters
(canopy, intermediary and understory, respectively at both sites), set up to collect data
every 30 min. These data were used to calculate the vapor pressure deficits (VPD, kPa).
Global solar radiation (MJ m-2) data in both sites were obtained from global solar
radiation sensors (MODEL 200SA Pyranometer, Microcom Design Inc, Hunt Valley,
MD, USA). The global solar radiation data were also available as a dataset provided by
the Centro de Previsão de Tempo e Estudos Climáticos (CPTEC/INPE) website
(http://www.cptec.inpe.br/). The mean values correspond to a daily integral of radiation
energy that we used to calculate monthly averages. We used regression analyses to
evaluate the relationship between En and VPD.
Results
Environmental Variables
Despite the higher VPD at the Montane forest site than the Lowland forest
(Rosado et al. 2010), mean air temperatures for all strata were lower at the Montane
forest (Fig. 1). Nocturnal VPD increased from understory to overstory in both forests in

58
the dry and wet season of 2008. In general, nocturnal VPDs were similar between dry
season of 2008 and the wet season. In the dry season of 2009, VPDs were similar among
strata (Fig. 3 and 4). Maximum values reached 0.20 kPa in the overstory during the dry
season of 2008 in the lowland forest and 0.70 kPa in the same period in the overstory of
the Montane Forest. In fact, the maximum VPD at the understory in the Montane forest
(around 0.3 kPa), was higher than the overstory at the Lowland site. Global solar
radiation was higher at the Montane site for most of the studied period, with exception for
one month in the wet season where the values were not different (Fig. 2).
Figure 1. Mean air temperature (oC) of three strata (overstory, intermediary and
understory) at the Lowland and Montane forests along the whole period of study. Data
collected every 30 min.
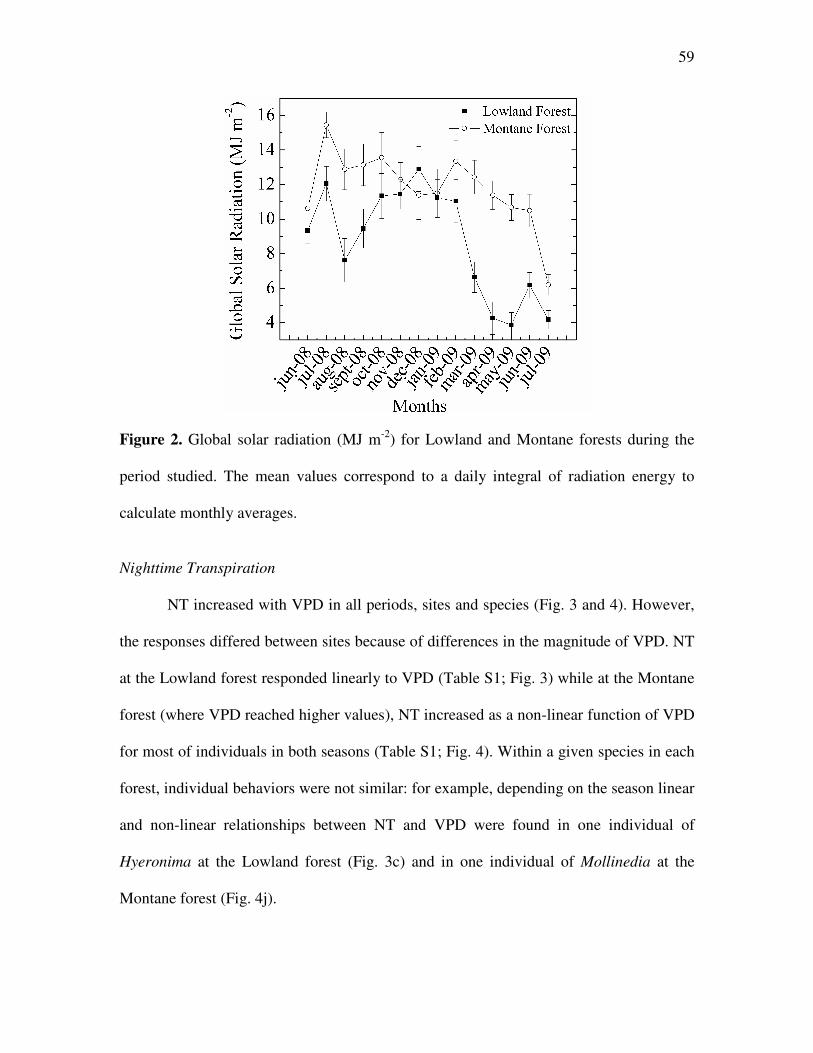
59
Figure 2. Global solar radiation (MJ m-2) for Lowland and Montane forests during the
period studied. The mean values correspond to a daily integral of radiation energy to
calculate monthly averages.
Nighttime Transpiration
NT increased with VPD in all periods, sites and species (Fig. 3 and 4). However,
the responses differed between sites because of differences in the magnitude of VPD. NT
at the Lowland forest responded linearly to VPD (Table S1; Fig. 3) while at the Montane
forest (where VPD reached higher values), NT increased as a non-linear function of VPD
for most of individuals in both seasons (Table S1; Fig. 4). Within a given species in each
forest, individual behaviors were not similar: for example, depending on the season linear
and non-linear relationships between NT and VPD were found in one individual of
Hyeronima at the Lowland forest (Fig. 3c) and in one individual of Mollinedia at the
Montane forest (Fig. 4j).

60
Figure 3. Relationship between vapor pressure deficit (VPD, kPa) and nighttime
transpiration (NT) in four species at the Lowland forest expressed as % of summertime
maximum transpiration rate. Each panel represented by different letters corresponds to
data from one individual. Measurements were made between 19:00 and 5:00 h over 30
nights in the dry season 2008 (●), the wet season (∆) and the dry season 2009 (○).

61
Figure 4. Relationship between vapor pressure deficit (VPD, kPa) and nighttime
transpiration (NT) in four species at the Montane forest expressed as % of summertime
maximum transpiration rate. Each panel represented by different letters corresponds to
data from one individual. Measurements were made between 19:00 and 5:00 h over 30
nights in the dry season 2008 (●), the wet season (∆) and the dry season 2009 (○).

62
Table S1. Equations from regressions between VPD and En for each individual of each
species in different seasons at the Lowland and Montane forest. Non-linear relationships
are represented in bold.
Maximum NT varied between and within species. NT for Hyeronima reached
extremely high values, which represented as much as 80% and 45% of total transpiration
at the Lowland and Montane forest, respectively. The other three species at the lowland
Site Species Ind Dry season 2008 Wet season Dry Season 2009 Lowland Hyeronima a y=-38.02+398.89x y= -25.72+237.20x y=10.17+61.34x
b y=-11.21+145.72x y= -6.73+115.88x y=3.17+69.24x
c y=68.82-490.48*4.82e-10x y= 64.24-640.91*7.959e-11x --
Alchornea d y=-5.15 + 50.99x y= -7.69+75.40x -- e y= -6.12 + 55.35x y= -6.77+65.64x y=1.28+33.49x
f y=-8.12+89.68x y= -7.47+87.05x y=-1.39+61.09x
Rustia g y=-8.78+137.81x y= -23.00+228.02x y=-1.30+107.48x
h y=-2.37+117.25x y= -3.88+102.20x --
i y=-11.21+125.91x y= -16.91+166.26x y=-1.27+73.88x
Mollinedia j y= -2.94+156.71x y= 0.45+119.92x y=-8.97+202.73x
k y= -0.74+135.88.71x y= 3.38+101.11x y=0.82+0.41x
l y= -5.35+124.40x y= 0.21+55.53x --
Montane Hyeronima a y= 39.63-55.39*0.013x y= 16.43-31.39*0.00137x y=22.12-20.29*0.001x
b y= 38.18-42.05*0.058x y= 27.00-64.29*0.0002x --
c y= 39.88-44.60*0.02x y= 34.83-45.90*0.017x y=26.82-22.80*1.2e-4x
Alchornea d y= 10.11-9.98*0.05x -- y=10.04-10.65-9.02*0.0001x
e y= 13.75-18.71*0.05x y=20.41-27.48*0.04979x y=14.64-9.02*0.005x
f y= 44.94-55.32*0.06x y=30.46-53.97*0.00179x --
Rustia g y= 19.46-27.77*0.007x y=9.37-12.43*0.00297x y=13.48-11.79*0.003x
h y= 24.29-32.77*0.015x y=11.16-34.71*6.96e-6x y=13.41-12.73*6.2e-4x
i y= 28.44-40.64*0.005x y=19.57-37.86*0.00045x y=18.75-16.33*6.2e-4x
Mollinedia j y=-17.83+180.87x y=15.30-24.92*0.00165x y=42.68-37.13*0.02x
k y=28.21-72.05*1.0e-4x y=20.99-41.09*0.0002x y=25.86-14.15*0.002x
l y=41.98-126.46*4.0e-5x y=19.70-45.05*0.00005x --

63
forest showed maximum NT values between 25% and 32%. Alchornea and Mollinedia
showed maximum NT values around 45% at the Montane forest that were higher in
comparison to the Lowland forest (Fig. 3 and 4). Only Rustia did not show great
differences in the maximum NT between Lowland and Montane forest with values
around 40% and 30%, respectively.
Discussion
Functions proposed to explain the significance of nighttime transpiration such as
promoting nutrient supply (Scholz et al., 2007) and carbohydrate export (Mark &
Lechowciz, 2007), do not have a robust physiological basis and remain controversial
(Dawson et al., 2007; Mark & Lechowciz, 2007; Scholz et al., 2007; Christman et al.,
2008; Christman et al., 2009). NT has been considered as a passive process linearly
driven by changes in VPD (Dawson et al., 2007) as a consequence of high soil-to-
atmosphere water potential gradients (Donovan et al., 1999; Dawson et al., 2007). To the
extent the process is passively driven by VPD one could argue it is merely a consequence
of poor stomatal regulation of water loss at night without having to invoke reasons for its
occurrence beyond this. In fact, nighttime stomatal opening may be a consequence of
recovery of normal turgor, or may assist respiratory gas exchange (Daley & Phillips,
2006; Mark & Lechowciz, 2007; Mott & Peak, 2010). In such cases the consequential
loss of water could be viewed as no different to the water forfeited each day to facilitate
carbon dioxide uptake during the day.
A novel finding of our present study is that NT-VPD can be highly non-linear
which introduces a more complex picture, raising possibilities of nighttime stomatal
regulation or other exogenous controls which limit NT. Indeed, as we discuss below all

64
of the usual thermodynamic aspects of transpiration involving energy input, sensible and
latent heat flux, which are commonly considered for daytime transpiration (Pražák et al.,
1994; Williams et al., 1998; Dekker et al., 2004; Wang et al., 2007) must also be
considered in interpreting NT.
For example, some of the curved trajectories we recorded indicating reduction of
transpiration as VPD increases at night might be related to a cooling effect by
evaporation (latent heat flux). During the night there is no solar heating of leaves, but
ambient heat in the air mass may be advected to the leaf with air flow, providing a low
but constant heat source analogous to incident solar radiation. However, transpiration
would rapidly cool leaves providing a self-limiting (energy-limited) process that becomes
unresponsive to increasing atmospheric VPD (because of very low leaf vapor pressures).
In addition to possible thermodynamic influences on the trajectories of NT-VPD
relationships, some of the nighttime behavior may be related to leaf water status and
stomatal behavior since mechanisms responsible for stomatal responses to humidity and
temperature are not different during day and night (Mott & Peak, 2010). Rapidly
asymptotic components to some of the curves we measured hint at ‘gating’ by
endogenous (leaf-level) physiological controls. At present, neither nocturnal leaf energy-
balance, nor nocturnal stomatal behaviors are well understood and it is likely that
characterization of both, including their combination, will be required before NT can be
fully interpreted. Despite the nonlinear relationships between NT and VPD do not have a
specific time to occur, the NT-VPD relationship can still be independent of this nightly
progression if it is based on leaf water status, for instance, even with decline in VPD and
wind toward dawn. If there is an energy balance element then maybe we will see some

65
shifts in the relationship over the course of the night. We suggest these are important
avenues for future research and some preliminary modeling and measurement activities
are already underway.
To our knowledge, we are aware of only two studies reporting non-linear
relationship between NT and VPD, where values reached 4.0kPa (Moore et al., 2008) and
2.5 kPa (Zeppel et al., 2010). In both cases we have some reservations concerning these
non-linear relationships. Moore et al. (2008) explained non-linear relationship based on a
minimum threshold required for NT under low VPD. However, their study was
performed with the heat dissipation method that shows difficulties related to estimate
zero and low flows especially at night (Lu et al., 2004; Dawson et al., 2007; Burgess &
Dawson, 2008). Certainly we cannot discard, in our own study, the possibility that our
definitions of zero flow contained inaccuracies, but any errors should appear as an offset
and not affect the linearity of transpirational flows detected by the HRM given it behaves
symmetrically and linearly throughout low positive or negative flow ranges. Even with
HRM, however, difficulties can arise for example when small reverse flow events occur
due to foliar uptake of water (Burgess & Dawson, 2004). These produce a range of small
velocities at zero VPD and if zero flow determination is also slightly inaccurate, some of
this range may present as spurious positive numbers. This can skew curve fitting at the
origin and where datasets are limited (e.g. spanning only a certain representation of soil,
plant and atmospheric conditions) other sections of the curve can retain some uncertainty.
We believe both of these cautions are worth raising in the case of the curves fitted
by Zeppel et al. (2010). We happily apply these types of cautions to our own data, but
also highlight that the greater amount of data collected gives much stronger evidence that

66
curved NT-VPD functions exist. Also in the case of Zeppel et al. (2010), their curved
functions are at odds with the strongly linear functions recorded for other eucalypt
woodlands (Dawson et al., 2007) underscoring the need for further characterization of the
exact shape of NT-VPD relationships in these types of systems. Although our own data
are also at odds with the strongly linear trends found across a range of biomes (Dawson et
al., 2007) most of these are for relatively dry sclerophyllous forest (e.g. Benyon, 1999;
Dawson et al., 2007) and there is little known about NT in Atlantic rainforest, or
Montane tropical forests to contradict our results. For this reason, we suggest our results
are quite unique among the NT literature.
We hope that with further measurement other indications of non-linear NT
behaviours (Moore et al., 2008; Zeppel et al., 2010) can be confirmed. Obviously,
increasing methodological sensitivity will be required to use sap flow to elucidate NT-
VPD relationships, including handling such issues as zero flow, foliar uptake and
separating refilling and transpiration processes by various means (e.g. Fisher et al., 2007;
Dawson et al., 2007). We note however that we should not assume these latter processes
are mutually exclusive. As pointed out by Burgess & Dawson (2008), when taking into
account the cohesion-tension theory, all capacitors to be refilled are in equilibrium with
the rest of water column such that refilling should begin concomitantly with decreasing
afternoon transpiration and by dusk quite a bit of ‘catch-up’ may have taken place. Our
time-based criteria (19:00h onwards) to identify NT were based on theory and careful
observation on low VPD nights, that refilling is short-lived in our study species. Perhaps
more important than refilling, if leaf energy balance is involved, is further measurement

67
of heat-related drivers of NT, e.g. changes to forest heat storage, leaf and air temperatures
overnight and their effect on the NT-VPD relationship.
The role of site conditions and canopy strata
Despite limitations to our present conceptual understanding and the need for
further study, we can draw some conclusions regarding the differences in NT behaviors
among our sites. Firstly, in the Montane site, the diurnal thermal regime was more
extreme than the Lowland forest: solar radiation was higher and air temperature at night
was lower. This is obviously related to the low atmospheric turbidity in Montane forests
which would promote higher incoming radiation and higher outgoing nighttime thermal
radiation (Körner, 2007). Given this thermal regime, we might expect higher heat storage
build-up in the forest and drier, windier bulk atmosphere above the canopy compared to
Lowland. The result should be higher leaf-to-air vapor pressure gradients at the Montane
site (see also Leuschner, 2000) and the resulting higher NT rates should reach putative
endogenous or exogenous limits more readily. This would explain why almost all
individuals of all species at the Montane forest showed strongly asymptotic curves
between NT and VPD in all seasons. If stomatal regulation is involved in the asymptotic
curves at the Montane site, the lower nighttime stomatal conductance would be related to
high water use efficiency and lower daytime stomatal conductance due to natural
selection in plants occurring in drier habitats with high VPD (Christman et al., 2008).
In contrast to the observed differences between altitudes, canopy strata position
does not seem to be an important factor affecting exogenous or endogenous controls of
maximum NT nor the degree of linearity/non-linearity. Interestingly, our results are in
contrast to the observed by Mark & Lechowicz (2007) where high NT is a characteristic

68
of shade-intolerant tree species associated to carbohydrate export and dark respiration.
This is perhaps due to comparatively homogenous conditions within the canopies in our
study sites when compared to larger site differences.
In conclusion, the asymptotic relationship between NT and VPD indicates that
transpiration models still require improvement for better understanding of possible
functional meanings related to NT. Several studies have elucidated the presence and
possible causes to explain why plants lose water at night but we believe that the NT
puzzle still has some pieces missing.
Acknowledgements
We are grateful to Renato Belinello and Erico Pereira-Silva for their help in fieldwork.
Sincere thanks goes to Alec Downey and Alvaro Arias from ICT International Pty Ltd for
excellent technical assistance during the whole study. We thank Pauline Grierson, Erik
Veneklaas, Elizabeth McLean and the ERGO team for useful discussions. The authors
were supported by grants from CNPq and the Biota-FAPESP Program - Projeto Temático
Gradiente Funcional (03/12595-7). COTEC/IF 41.065/2005 and IBAMA/CGEN
093/2005.
References
Beaumont S, Burn KC. 2009. Vertical gradients in leaf trait diversity in a New Zealand
forest. Trees 23: 339-346.
Benyon RG. 1999. Nighttime water use in an irrigated Eucalyptus grandis plantation.
Tree Physiology 19:853–859.
Bruijnzeel LA, Veneklaas EJ. 1998. Climatic conditions and tropical montane forest
productivity: the fog has not lifted yet. Ecology 79: 3-9.
69
Burgess SSO, Adams MA, Turner NC, Ong CK. 1998. The redistribution of soil water
by tree root systems. Oecologia 115: 306-311.
Burgess SSO, Adams MA, Turner NC, Beverly CR, Ong CK, Khan AAH, Bleby
TM. 2001. An improved heat pulse method to measure low and reverse rates of sap flow
in woody plants. Tree Physiology 21: 589–598.
Burgess SSO, Dawson TE. 2004. The contribution of fog to the water relations of
Sequoia sempervirens (D. Don): foliar uptake and prevention of dehydration. Plant, Cell
and Environment 27: 1023–1034.
Burgess SSO, Dawson TE. 2008. Using branch and basal trunk sap flow measurements
to estimate whole-plant water capacitance: a caution. Plant and Soil 305: 5-13.
Christman MA, Richards JH, Mckay JK, Stahl EA, Juenger TE, Donovan LA.
2008. Genetic variation in Arabidopsis thaliana for night-time leaf conductance. Plant,
Cell and Environment 31: 1170-1178.
Christman MA, Donovan LA, Richards JH. 2009. Magnitude of nighttime
transpiration does not affect plant growth or nutrition in well-watered Arabidopsis.
Physiologia Plantarum 136: 264-273.
Cowan IR, Farquhar GD. 1977. Stomatal function in relation to leaf metabolism and
environment. Symp. Soc. Exp. Biol. 31: 471-505.
Cruiziat P, Cochard H, Améglio T. 2002. Hydraulic architecture of trees: main
concepts and results. Ann. For. Sci. 59: 723-752.
Daley MJ, Phillips NG. 2006. Interspecific variation in night-time transpiration and
stomatal conductance in a mixed New England deciduous forest. Tree Physiology 26:
411–419.

70
Dawson TE, Burgess SSO, Tu KP, Oliveira RS, Santiago LS, Fisher JB, Simonin
KA, Ambrose AR. 2007. Nighttime transpiration in woody plants from contrasting
ecosystems. Tree Physiology 27: 561–575.
Dekker SC, Bouten W, Verstraten JM. 2000. Modelling forest transpiration from
different perspectives. Hydrological Processes 14: 251-260.
Donovan LA, Grise DJ, West JB, Pappert RA, Alder NN, Richards JH. 1999.
Predawn disequilibrium between plant and soil water potentials in two cold-desert shrubs.
Oecologia 120: 209–217.
Donovan LA, Linton MJ, Richards JH. 2001. Predawn plant water potential does not
necessarily equilibrate with soil water potential under well-watered conditions. Oecologia
129: 328-335.
Fisher JB, Baldocchi DD, Misson L, Dawson TE, Goldstein AH. 2007. What the
towers don’t see at night: nocturnal sap flow in trees and shrubs at two AmeriFlux sites in
California. Tree Physiology 27: 597-610.
Graham EA, Mulkey SS, Kitajima K, Phillips NG, Wright SJ. 2005. Cloud cover
limits net CO2 uptake and growth of a rainforest tree during tropical rainy seasons.
Proceedings National Academy of Sciences 100: 572-576.
Grubb PJ. 1977. Control of forest growth and distribution on wet tropical mountains:
with Special Reference to Mineral Nutrition. Ann. Rev. Ecol. Syst. 8: 83-107.
Holder C. 2007. Leaf water repellency as an adaptation to tropical montane cloud forest
environments. Biotropica 39: 767–770.
Joly CA, Aidar MPM, Klink CA, Mcgraph DG, Moreira AG, Moutinho P, Nepstad
DC, Oliveira AA, Pott A, Sampaio EVSB. 1999. Evolution of the Brazilian
71
phytogeography classification systems: implications for biodiversity conservation.
Ciência e Cultura (SBPC) 51: 331-348.
Jones HG, Sutherland RA. 1991. Stomatal control of xylem embolism. Plant Cell and
Environment 14: 607-612.
Körner C. 2007. The use of ‘altitude’ in ecological research. Trends in Ecology and
Evolution 22: 569-574.
Leigh EG, Davidar P, Dick CW, Puyravaud J-P, Terborgh J, Steege Ht, Wright SJ.
2004. Why do some tropical forests have so many species of trees? Biotropica 36: 447-
473.
Leuschner C. 2000. Are high elevations in tropical mountains arid environments for
plants? Ecology 81: 1425-1436.
Lu P, Urban L, Zhao P. 2004. Granier’s thermal dissipation probe (TDP) method for
measuring sap flow in trees: theory and practice. Acta Bot Sin 46: 631–646.
Marks CO, Lechowicz MJ. 2007. The ecological and functional correlates of nocturnal
transpiration. Tree Physiology 27: 577-584.
Moore GW, Cleverly JR, Owens MK. 2008. Nocturnal transpiration in riparian
Tamarix thickets authenticated by sap flux, eddy covariance and leaf gas exchange
measurements. Tree Physiology 28: 521–528.
Mott Ka, Peak D. 2010. Stomatal responses to humidity and temperature in darkness.
Plant, Cell and Environment 33: 1084-1090.
Motzer T, Munz N, Küppers M, Schmitt D, Anhuf D. 2005. Stomatal conductance,
transpiration and sap flow of tropical montane rain forest trees in the southern Ecuadorian
Andes. Tree Physiology 25: 1283–1293.

72
Myers N, Mittermeier RA, Mittermeier CG, Fonseca GAB, Kent J. 2000.
Biodiversity hotspots for conservation priorities. Nature 403: 853-858.
Oliveira RS, Bezerra L, Davidson EA, Pinto F, Klink CA, Nepstad DC, Moreira A.
2005. Deep root function in soil water dynamics in cerrado savannas of central Brazil.
Functional Ecology 19: 574-581.
Poorter L. 2009. Leaf traits show different relationships with shade tolerance in moist
versus dry tropical forests. New Phytologist 181: 890-900.
Pražák J, Sír M, Tesár M. 1994. Estimation of plant transpiration from meteorological
data under conditions of sufficient soil moisture. Journal of Hydrology 162: 409-427.
Rosado BHP, Oliveira RS, Aidar MPM. 2010. Is leaf water repellency related to vapor
pressure and crown exposure in tropical forests? Acta Oecologica 36: 645-649.
Santiago LS, Goldstein G, Meinzer FC, Fownes JH, Mueller-Dombois D. 2000.
Transpiration and forest structure in relation to soil waterlogging in a Hawaiian montane
cloud forest. Tree Physiology 20: 673-681.
Santiago LS, Kitajima K, Wright SJ, Mulkey SS. 2004. Coordinated changes in
photosynthesis, water relations and leaf nutritional traits of canopy trees along a
precipitation gradient in lowland tropical forest. Oecologia 139: 495-502.
Scholz FG, Bucci SJ, Goldstein G, Meinzer FC, Franco AC, Miralles-Wilhelm F.
2007. Removal of nutrient limitations by long-term fertilization decreases nocturnal water
loss in savanna trees. Tree Physiology 27: 551-559.
Snyder KA, Richards JH, Donovan LA. 2003. Night-time conductance in C-3 and C-4
species: do plants lose water at night? Journal of Experimental Botany 54: 861–865.

73
Snyder KA, James JJ, Richards JH, Donovan LA. 2008. Does hydraulic lift or
nighttime transpiration facilitate nitrogen acquisition? Plant and Soil 306: 159-166.
Velázquez-Rosas N, Meave J, Vazquez-Santana S. 2002. Elevational variation of leaf
traits in montane rain forest tree species at La Chinantla, Southern Mexico. Biotropica
34: 534-546.
Wang J, Bras RL, Lerdau M, Salvucci GD. 2007. A maximum hypothesis of
transpiration. Journal of Geophysical Research 112: 1-11.
Williams M, Malhi Y, Nobre AD, Rastetter EB, Grace J, Pereira MGP. 1998.
Seasonal variation in net carbon exchange and evapotranspiration in a Brazilian rain
forest: a modelling analysis. Plant, Cell and Environment 21: 953-968.
Wood SA, Beringer J, Hutley LB, McGuire AD, Dijk AV, Kilinc M. 2008. Impacts of
fire on forest age and runoff in mountain ash forests. Functional Biology 35: 483-492.
Zeppel M, Tissue D, Taylor D, Macinnis-Ng C, Eamus D. 2010. Rates of nocturnal
transpiration in two evergreen temperate woodland species with differing water-use
strategies. Tree Physiology 30: 988-1000.

74
Capítulo 4
Relação entre Fluxo de Água do Xilema e
Características Morfológicas de Espécies Arbóreas
em Florestas Tropicais
Bruno H. P. Rosado1,4; Stephen S. O. Burgess2,3; Rafael S. Oliveira4 & Marcos P. M. Aidar5
(1)Bolsista Doutorado/CNPq. Programa de Pós-graduação em Biologia Vegetal, IB,
Universidade Estadual de Campinas, Campinas, SP, Brazil.
(2)Faculty of Agriculture, Food and Natural Resources, The University of Sydney,
Sydney, Australia
(3)School of Plant Biology, The University of Western Australia, Perth, Australia
(4)Departamento de Biologia Vegetal, IB, Universidade Estadual de Campinas, São Paulo,
SP, Brazil
(5) Seção de Fisiologia e Bioquímica de Plantas, Instituto de Botânica, SP, Brazil
(*)Corresponding author: Departamento de Biologia Vegetal, IB Universidade Estadual de
Campinas, Campinas/SP, CEP: 13083-970, Brazil; e-mail: [email protected]; fax:
++ 55 (0)19 35216374; tel: ++ 55 (0)19 35216175.
75
Resumo
A detecção da ampla escala de convergência funcional entre as plantas em diversos
estudos, realizados em diferentes ambientes, tem sido feita a partir de um diverso
conjunto de características. Além de atributos morfológicos, medidas diretas do fluxo de
água do xilema podem refletir o comportamento ecofisiológico de cada espécie em
termos de transpiração e uso de água já que reflete a integração de uma série de atributos
e condições ambientais. Ao longo de variações altitudinais em florestas tropicais,
observa-se que aumentos na quantidade de radiação solar e maiores demandas
evaporativas do ar são condições similares as de ambientes secos já que favorecem
maiores perdas de água pelas plantas. No entanto, variações nas respostas das plantas em
função do estrato ocupado e do grau de exposição da copa dos indivíduos podem afetar a
resposta das plantas as condições atmosféricas independente da altitude. Neste estudo, foi
avaliado como variações no fluxo de água do xilema em espécies que co-ocorrem na
Floresta Ombrófila Densa de Terras Baixas (FODTB) e na Floresta Ombrófila Densa
Montana (FODM) estão associadas à variação de atributos morfológicos, dos diferentes
estratos ocupados pelas espécies e condições ambientais em cada altitude. Apesar dos
menores valores de volume de água transportado pelas espécies no FODM, esta diferença
esteve associada ao menor tamanho dos indivíduos amostrados. A normalização do fluxo
de água pela área da copa dos indivíduos indicou ausência de diferenças associadas ao
estrato ocupado. A discussão aborda como diferenças morfológicas entre espécies e das
condições ambientais entre altitudes parecem ter maior preponderância na determinação
dos fluxos de água.
Palavras-chave: Histerese, área específica foliar, variação altitudinal, Floresta Atlântica,

76
Introdução
O contínuo solo-planta-atmosfera (SPA) depende de uma série de características
de cada um dos três compartimentos do contínuo que podem alterar o uso da água de
diversas maneiras. Algumas destas características tais como: folhas menores para dissipar
o calor por convecção (Jarvis & McNaughton 1986; Sellers et al. 1992); produção de
folhas mais reflectivas que minimizam o aquecimento (Sellers et al. 1992); redução da
superfície transpirante através fenologia foliar (Casper et al. 2001); arquitetura radicular
promovendo acesso à água em diferentes profundidades (Oliveira et al. 2005) e variações
quanto à eficiência no uso da água devido ao tipo de via fotossintética (Ehleringer &
Monson 1993). Ajustes fisiológicos tais como grau de abertura estomática, acúmulo de
solutos e condutância hidráulica (Sperry et al. 2002) também podem alterar a utilização
da água. Além dos fluxos de água, todas as características supracitadas também podem
afetar a capacidade de assimilação do CO2, já que estão diretamente relacionadas à
fotossíntese. Neste sentido, características capazes de descrever não apenas as respostas
das plantas ao longo de uma variação altitudinal, mas que também estão relacionadas
com fluxo de água do xilema devem ser consideradas.
Além de características como área foliar, via fotossintética e arquitetura radicular,
a área específica foliar (AEF) é uma característica que tem sido utilizada como um bom
descritor de processos desde o nível de indivíduos até ecossistemas, pois se relaciona com
processos como fotossíntese, fenologia foliar e decomposição (Reich et al. 1992; Wright
et al. 2004). A AEF é um atributo que reflete o custo de construção da folha baseado
principalmente em carbono e é dependente tanto da densidade foliar (DEN) quanto da
espessura foliar (ESP) (Witkowski & Lamont 1991). Em ambientes pobres em recursos
77
as espécies tendem a apresentar folhas com menores AEF (Westoby et al. 2002), e nestes
ambientes observa-se uma relação negativa entre AEF e longevidade foliar, uma vez que
a maior durabilidade da folha estaria associada a maior quantidade de tecidos estruturais
(fibras, esclereídeos, etc.) que promovem maior resistência tanto a intempéries quanto a
herbivoria (Chabot & Hicks 1982; Reich et al. 1992). A maior durabilidade permite que a
fotossíntese em cada folha ocorra por um tempo maior, amortizando, em termos de
carbono e nutrientes, o custo investido na construção das folhas (Chabot & Hicks 1982;
Westoby et al. 2002).
Contudo, diferenças em características foliares também podem se dar em um
mesmo ambiente em função de variações nas condições tais como a disponibilidade de
luz (Williams et al. 1989; Niinemets 2001). Ao contrário do esperado, onde espécies
tolerantes a sombra tenderiam a apresentar maiores AEF para maximizar a interceptação
de energia luminosa, vários estudos tem demonstrado o inverso, onde espécies tolerantes
a sombra possuem menores AEF o que aumenta a longevidade foliar e a defesa contra
herbívoros (Reich et al. 2003). Mais recentemente, este significado funcional tem sido
explicado a partir do grau de exposição da copa dos indivíduos especialmente para
espécies que ocorrem em florestas úmidas (Poorter 2009).
Além de características foliares, a densidade da madeira (DM) é uma importante
característica associada às propriedades de transporte de água no xilema, além de estar
associada a crescimento e resistência a danos físicos (Meinzer 2003). Hacke et al. 2001,
registraram correlações significativas entre a DM e a pressão xilemática na qual há perda
de 50% da condutividade hidráulica por cavitação entre várias espécies com madeiras de
diferentes densidades. Altas DM aumentam a resistência ao fluxo de água, diminuindo a
78
eficiência no transporte de água por área de xilema, promovendo valores mais negativos
de potencial hídrico foliar (Meinzer 2003). Assim, o ganho em resistência à cavitação
com aumento da DM parece estar diretamente associado com a redução da condutividade
hidráulica estabelecendo um claro trade-off entre eficiência no transporte de água e
resistência à cavitação. Esta associação entre DM e transporte de água tem reflexo
também em relação a características como a área foliar já que há uma relação inversa
entre área foliar e DM (Wright et al. 2007). Uma possível explicação para esta relação é
que folhas menores possuem menor demanda por água o que se ajustaria às maiores
restrições ao transporte de água oferecidas por madeiras mais densas (Chave et al. 2009).
Neste sentido, um importante parâmetro morfológico que agrega tanto
características foliares quanto dos ramos é o Valor de Huber (VH). O Valor de Huber
reflete a demanda potencial de transpiração relativa à capacidade de transporte de água e
pode ser expresso como um índice da potencial restrição arquitetural do suprimento de
água em relação à demanda transpiracional (Meinzer et al. 1997). Assim, análises das
respostas das plantas em relação às condições atmosféricas e variações sazonais do VH
indicam ajustes relacionados ao aumento na condutância hidráulica (Bucci et al. 2005).
De maneira geral, há um consenso de que a abertura estomática exerce papel
preponderante na regulação transpiracional e essa visão tem-se mantido inquestionável
em vários de estudos (Dolman et al. 1991; Meinzer 1993). Entretanto, diversos modelos
micrometeorológicos tem sido capazes de predizer os fluxos transpiracionais sem
considerar variações na abertura estomática, levando a crer que fatores como radiação,
vento e umidade relativa são mais importantes na determinação da transpiração (Collatz
et al. 1991; Meinzer 1993). A origem da controvérsia relaciona-se aos tipos de

79
experimentos que foram conduzidos e as ferramentas de análise de trocas gasosas. De
modo geral, a influência do grau de abertura dos estômatos nos fluxos transpiracionais
tem sido notada em estudos que utilizam Porômetros e Analisadores de Gases por
Infravermelho (IRGA – infra red gas analyser) onde as folhas são acondicionadas em
câmaras ventiladas que removem completamente a camada envolvente de ar (boundary
layer) (Jarvis & McNaughton 1986). Assim, a condutância da camada envolvente, que
pode variar de acordo com tamanho foliar e vento, por exemplo, pode ter um papel mais
importante nos fluxos transpiracionais (Grace et al. 1980), uma vez que baixas
condutâncias desacoplam o ar da superfície foliar e o circundante, limitando as trocas de
gases (Jarvis & McNaughton 1986, Meinzer 1993).
Neste sentido, estimativas do fluxo de água do xilema são importantes, pois não
desconsideram a condutância da camada envolvente que pode possuir papel central nos
fluxos transpiracionais. Assim, medidas diretas do fluxo de água do xilema podem refletir
o comportamento ecofisiológico de cada espécie em termos de transpiração e uso de
água, uma vez que é a resultante final de uma série de características morfofisiológicas
das plantas, do solo e da atmosfera (Burgess 2006). Calibre dos vasos, grau de abertura
dos estômatos, índice de área foliar, condutância da camada envolvente e fatores
abióticos como déficit de pressão de vapor, vento e água no solo também contribuem para
variações no fluxo de água do xilema e vários estudos realizados em diferentes
ecossistemas têm utilizado o fluxo de água do xilema na detecção das estratégias de
utilização de água em várias espécies (Burgess & Dawson 2004, O`Brien et al. 2004,
Oliveira et al. 2005; Burgess 2006; Marks & Lechowicz 2007; Scholz et al. 2008; Snyder
et al. 2008). Além disso, o fluxo de água do xilema apresenta significado funcional não
80
apenas em relação ao uso de água, mas também em relação às taxas de absorção e
transporte de nutrientes (Baker & Becker 1995).
Em casos onde a condutância da camada envolvente é maior do que a estomática, a
taxa de transpiração é proporcional a condutância estomática e o grau de desacoplamento
da planta com a atmosfera é baixo (Jarvis & McNaughton 1986; Meinzer 1993). Em
linhas gerais, espera-se que o desacoplamento será alto em espécies com copas densas
e/ou com folhas grandes o que pode aumentar a espessura da camada envolvente (menor
condutância) (Jarvis & McNaughton 1986; Meinzer 1993). Por outro lado, copas mais
expostas ao vento e folhas menores permitem que a condutância da camada envolvente
seja alta fazendo com que desacoplamento seja próximo de zero, aumentando assim as
trocas gasosas (Jarvis & McNaughton 1986).
Ao longo de variações altitudinais em florestas tropicais, como observado no
Parque Estadual na Serra do Mar-SP, observa-se que em altitudes elevadas, a presença de
neblina pode reduzir significativamente a quantidade de radiação solar recebida durante o
dia, o que conseqüentemente, reduz a taxa fotossintética e os fluxos transpiracionais
(Graham et al. 2005). Portanto, como um meio de compensar o baixo ganho de carbono
por unidade de tempo em função da atenuação luminosa provocada pela neblina, espécies
que ocorrem em florestas montanas tendem a apresentar uma menor AEF e longevidade
foliar para compensar o baixo ganho de carbono por unidade de tempo (Bruijnzeel &
Veneklaas 1998). Além disso, menores valores de AEF em maiores altitudes estariam
associados a maiores espessuras foliares como mecanismo relacionado a aumentar a
fixação de CO2 uma vez que um maior número de camadas de parênquima paliçádico
aumentaria a eficiência do aparato fotossintético (Grubb 1977; Velázquez-Rosa et al.

81
2002; Roche et al. 2004). Além de AEF e espessura foliar, a área foliar tende a diminuir
ao longo de elevações altitudinais uma vez que menores temperaturas podem reduzir o
crescimento celular (Velázquez-Rosa et al. 2002).
Contudo, não apenas a fotossíntese como também o fluxo de água nas plantas
diminui com a presença da neblina (Graham et al. 2005) o que contribuiria para menores
taxas de crescimento e reduzido transporte de nutrientes para as folhas (Santiago et al.
2000). Os fluxos transpiracionais e as taxas de crescimento podem ser ainda menores em
florestas montanas se as espécies apresentarem altas DM uma vez que maiores restrições
hidráulicas levariam a reduções na fotossíntese (Santiago et al. 2004). Entretanto,
menores fluxos transpiracionais podem ser vantajosos mesmo para plantas que ocorrem
em florestas ombrófilas densas montanas (FODM). Isto porque fatores como menor
pressão parcial do CO2 atmosférico, menor velocidade do vento e maior radiação (em
períodos sem neblina) favorecem aumentos na demanda evaporativa do ar o que aumenta
a perda de água em maiores altitudes (Leuschner 2000; Korner 2007; Rosado et al. 2010).
Além disso, a maior proporção de raízes finas encontradas na FODM da Serra do Mar
(Rosado et al.) pode contribuir para maiores taxas transpiracionais, de absorção de água e
minimização de embolismos (Nepstad et al. 1994; Williams et al. 1998; Zeppel et al
2004). Outro fator que pode contribuir para maiores fluxos de água na FODM é a maior
repelência hídrica foliar (Rosado et al. 2010) que pode impedir o acumulo de água sobre
a folha especialmente durante períodos de neblina.
Levando-se em consideração as espécies que ocorrem em estratos mais baixos da
floresta, o efeito da neblina na atenuação luminosa pode ser reduzido em comparações
feitas com espécies que ocupam o mesmo estrato em FODTB. Partindo-se da premissa
82
que as espécies que ocupam os estratos superiores da floresta responderão mais
diretamente às variações atmosféricas que espécies do sub-bosque (O’Brien et al., 2004),
sugerimos que espécies presentes no sub-bosque apresentarão fluxos de água similares
em diferentes altitudes. Em complemento a isto, mesmo em altitudes com fatores
abióticos contrastantes, as espécies podem possuir desacoplamentos semelhantes, fazendo
com que o grau de exposição da copa tenha um efeito superior na determinação dos
fluxos.
Na literatura, nota-se que espécies de sub-bosque em florestas tropicais não
apresentam variações nos fluxos transpiracionais mesmo com variações no grau de
abertura dos estômatos (Jarvis & McNaughton 1986; Meinzer et al. 1995), o que faz com
que estas espécies respondam mais lentamente as variações atmosféricas do que as
espécies de dossel (Roberts et al. 1990; O`Brien et al. 2004). Assim, variações no grau de
abertura dos estômatos podem realmente ter pouca relevância para as trocas gasosas de
um indivíduo de sub-bosque, uma vez que, o somatório das condutâncias das camadas
envolventes de todos os indivíduos do entorno terão maior contribuição na magnitude dos
fluxos (Jarvis & McNaughton 1986; Collatz et al. 1991). No entanto, o assunto ainda
merece investigação uma vez que em estudo realizado em Floresta Montana no Equador
não foram observadas diferenças no desacoplamento entre espécies de dossel e sub-
bosque (Motzer et al. 2005).
Considerando todo o exposto acima, características integradoras capazes de refletir
o comportamento ecofisiológico de cada espécie em termos de trocas gasosas e uso de
água são essenciais em diferentes níveis de investigação. Especialmente em relação ao
fluxo de água do xilema que é a resultante final de características morfo-fisiológicas

83
como grau de abertura dos estômatos, índice de área foliar, condutância da camada
envolvente e fatores abióticos como déficit de pressão de vapor e água no solo (Burgess
2006).
Assim, as hipóteses são: (i) espécies presentes no sub-bosque e sub-dossel de
florestas montanas e de terras baixas apresentarão fluxos de água similares uma vez que o
somatório das condutâncias das camadas envolventes seria capaz de tamponar variações
nas condições atmosféricas. Portanto, nestas espécies, diferenças em atributos
morfológicos como área foliar, densidade da madeira e valor de huber não afetariam o
fluxo de água; (ii) espécies de dossel estariam mais acopladas às condições atmosféricas e
responderiam mais rapidamente do que espécies de sub-bosque a variações nas condições
atmosféricas; (iii) atributos morfológicos modulariam as diferenças de fluxo entre
espécies de dossel dentro de cada altitude; (iv) a maior radiação solar, DPV e proporção
de raízes finas na FODM favoreceriam maior fluxo de água nas espécies de dossel
quando comparadas as espécies de dossel de terras baixas.
Material e Métodos
Áreas de estudo
Situado no município de Ubatuba, a floresta de Terras Baixas - Núcleo
Picinguaba (23° 31' a 23° 34' S e 45° 02' a 45° 05' W), é uma fisionomia definida como
Floresta Ombrófila Densa de Terras Baixas (FODTB). O clima regional é tropical úmido,
com uma precipitação média anual superior a 2.200 mm (Assis 1999). A Floresta
Montana - Núcleo Santa Virgínia (23° 17' a 23° 24' S e 45° 03' a 45° 11' W) situa-se nos
municípios de São Luís do Paraitinga (70%), Cunha (20%) e Ubatuba (10%). A
fisionomia predominantemente é a Floresta Ombrófila Densa Montana (FODM)

84
situando-se a uma altitude que varia de 850 a 1.100 m. O clima regional é tropical
temperado, com uma precipitação média anual superior a 2.000 mm. Em cada uma das
altitudes, as coletas foram realizadas dentro de uma parcela de um hectare que
apresentam topografias distintas onde a FODM apresenta maior declividade do que a
FODTB (Martins, 2010).
Espécies estudadas
Foram escolhidas quatro espécies lenhosas que atendessem quatro requisitos. Co-
ocorrência em ambas as altitudes; ocupassem diferentes estratos em ambas as florestas;
que as posições nos estratos não fossem diferentes entre as florestas e que pertencessem a
gêneros e/ou famílias diferentes para evitar efeitos filogenéticos (Felsenstein 1985). As
espécies escolhidas foram: Hyeronima alchorneoides Allemão (Phyllantaceae),
Alchornea triplinervea (Spreng.) Müll. Arg. (Euphorbiaceae), Mollinedia schottiana
(Spreng.) Perkins (Monimiaceae) e Rustia formosa Klotzch (Rubiaceae). Em cada
altitude foram amostrados de três a quatro indivíduos de cada espécie.
Características morfológicas
Para a caracterização morfológica das folhas, foi coletado um ramo de três a
quatro indivíduos adultos de cada espécie durante as estações seca e chuvosa em ambas
as altitudes. As coletas foram feitas em junho de 2007 e janeiro de 2008 na floresta de
terras baixas e em junho de 2008 e janeiro de 2009 na floresta Montana. Após a coleta os
ramos foram levados até a estação de campo, onde foram reidratados em água por duas
horas. O corante azul de metileno (0,5% m/v) foi adicionado à água para determinação da
capacidade de transporte de água dos ramos através do valor de Huber (cm2 m-2),
calculado como a razão entre a área de xilema ativo e área foliar total do ramo. Após a
85
hidratação, a espessura (mm) de três folhas por ramo foi medida em seus terços médios
com um paquímetro digital. Todas as folhas de um ramo terminal foram digitalizadas em
um scanner de mesa e secas em estufa a 60 oC por três dias para a obtenção da massa
seca. A área foliar (cm2) foi medida através do programa ImageJ (versão 1.38x, National
Institutes of Health, EUA). A partir destes dados foi calculada a área específica foliar
(AEF, cm2 g-1) (Witkowski & Lamont 1991). O ramo terminal, sem folhas, foi dividido
em madeira e casca. O volume da madeira foi obtido segundo o princípio de
deslocamento de água de Arquimedes, e as amostras secas em estufa a 60 oC por sete dias
para a obtenção da massa seca. A partir destes dados, foi calculada a densidade da
madeira (g cm-3) (Hacke et al. 2001) e a razão de área foliar (RAF, m2 g-1), calculada
como a área foliar total dividida pela massa total do ramo. (Lambers & Poorter 1992). A
área da copa de cada indivíduo foi estimada a partir da distância entre a projeção do
término da copa, em relação ao solo, até o tronco em quatro direções e a área foi
calculada a partir da fórmula da elipse (O’Brien et al. 2004). O grau de exposição da copa
de cada indivíduo foi estimado a partir do método visual proposto por Clark & Clark
(1992) como descrito em Rosado et al. (2010).
Fluxo de água do xilema
Foi medido através do método da razão de calor (MRC) (Burgess et al. 2001). Os
sensores foram instalados, em junho de 2008, a altura do peito, nos troncos dos
indivíduos, com diâmetro a altura do peito (DAP) maior que 15 cm, de cada espécie em
cada localidade e a velocidade do fluxo de água (Vh) expressa em cm.h-1. O MRC mede
o aumento de temperatura seguindo um pulso de calor em dois pontos simétricos acima e
abaixo de uma resistência inserida 6 mm na área de xilema ativa. Esta técnica é vantajosa,
86
pois permite medidas bi-direcionais de seiva e também detecta taxas mais lentas de fluxo
e pode ser usada como medida dos fluxos transpiracionais (Burgess 2006). Uma
resistência e um par de termopares foram inseridos radialmente no xilema de dois
indivíduos por espécie em cada localidade. Cada termopar tem duas junções para medir
velocidade da seiva. Os sensores foram programados para medições a cada 30 minutos
(ICT, International Sydney, Austrália). Para estimar a área de xilema ativo de cada
indivíduo, primeiramente são estimados os DAP e espessura da casca. Posteriormente,
pipetas de vidro foram inseridas no tronco e o corante azul de metileno foi injetado. Com
auxílio de uma broca de 1,3 cm de diâmetro uma amostra do tronco foi retirada para
posterior medida do trecho de xilema ativo com um paquímetro (Granier et al. 1996) para
o cálculo do volume de água transportada.
Variáveis Abióticas
Foram instalados três sensores de temperatura e umidade relativa (HOBO) em
diferentes estratos na floresta para o cálculo e avaliação da variação vertical do déficit de
pressão de vapor da atmosfera (DPV) (Rosado et al., 2010). Dependendo do estrato
ocupado por cada indivíduo, os valores de fluxo de água no xilema foram relacionados ao
DPV da altura correspondente. Cada um dos sistemas de sensores de fluxo de seiva, em
cada uma das áreas, possui um painel solar responsável por recarregar a bateria que
alimenta o datalogger. Os dados de amperagem do painel solar, referentes à recarga da
bateria, registrados a cada trinta minutos, foram utilizados como ‘radiação solar” uma vez
que a variação temporal da amperagem ocorre de acordo com variações na radiação solar.

87
Análises Estatísticas
A partir de uma análise de variância de dois fatores (ANOVA two-way, P<0,05)
com teste post hoc de Tukey (P<0,05), foram avaliadas diferenças entre as espécies em
relação às características morfológicas entre estações e altitudes. Foram feitas regressões
lineares entre os valores máximos de fluxo de água (litro.dia-1) e a área projetada copa de
cada indivíduo (m2). A partir desta análise, a comparação entre espécies e entre altitudes
foi feita com os dados de velocidade do fluxo de água normalizados pela área da copa.
Gráficos de três eixos (fluxo de água, DPV e radiação) foram gerados para determinar se
a direção do fluxo de água se dá no sentido horário ou anti-horário (Figura 1). A área da
histerese destes gráficos (kPa) foi derivada através do calculo das áreas polinomiais das
curvas superiores e a subtração da área da polinomial da curva inferior (Zeppel et al.
2004). A condutância total de cada indivíduo (CT, lit.dia-1.m-2.kPa-1) foi estimada a partir
da relação fluxo de água/DPV (Cavender-Bares et al. 2007) nas estações seca e chuvosa
Foi feita uma Análise de Componentes Principais (ACP) para testar possíveis associações
entre os valores máximos do fluxo de água e a média dos atributos funcionais em cada
uma das altitudes ao longo do tempo (O’Brien et al. 2004). Nas ACPs foram incluídos os
dados de repelência hídrica foliar estimado para as mesmas espécies nas duas florestas
(Rosado et al. 2010). Todas as análises foram feitas utilizando o software R versão
2.11.1, 2010, http://www.R-project.org.
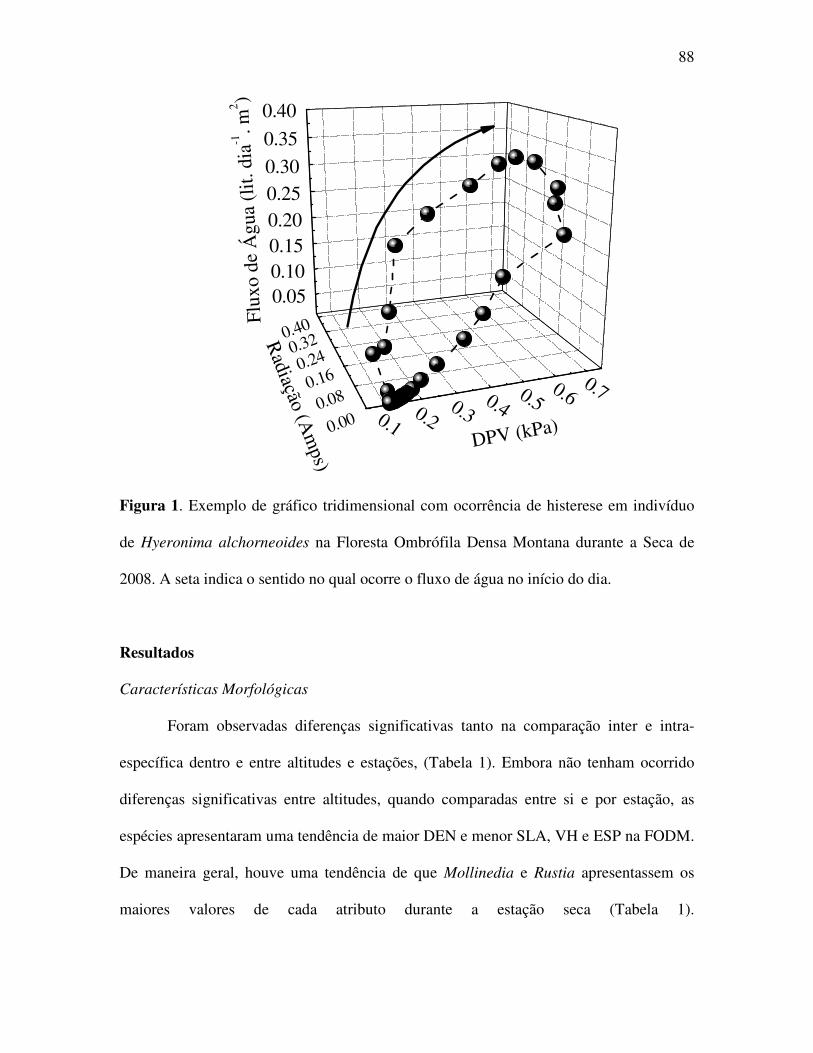
88
0.400.32
0.24
0.16
0.08
0.00
0.050.100.150.200.250.30
0.35
0.40
0.10.2
0.30.4
0.50.6
0.7
Flux
o de
Águ
a (l
it. d
ia-1
. m2 )
DPV (kPa)
Radiação (A
mps)
Figura 1. Exemplo de gráfico tridimensional com ocorrência de histerese em indivíduo
de Hyeronima alchorneoides na Floresta Ombrófila Densa Montana durante a Seca de
2008. A seta indica o sentido no qual ocorre o fluxo de água no início do dia.
Resultados
Características Morfológicas
Foram observadas diferenças significativas tanto na comparação inter e intra-
específica dentro e entre altitudes e estações, (Tabela 1). Embora não tenham ocorrido
diferenças significativas entre altitudes, quando comparadas entre si e por estação, as
espécies apresentaram uma tendência de maior DEN e menor SLA, VH e ESP na FODM.
De maneira geral, houve uma tendência de que Mollinedia e Rustia apresentassem os
maiores valores de cada atributo durante a estação seca (Tabela 1).

89
Tabela 1. Variação de atributos morfológicos entre espécies e estações na duas florestas. Os valores são médias ± erro padrão. Letras
diferentes apontam diferenças significativas entre espécies para cada atributo (Tukey, ANOVA, p<0.05).
Local Estação Espécies VH CAF AEF DEN ESP DM cm2 m-2 g g-1 cm2 g-1 mg mm-3 mm g cm-3 Terras Baixas Chuvosa Alchornea 0.73±0.30ab 0.62±0.02ab 138.31±33.64ab 0.50±0.16cd 0.19±0.05a 0.30±0.05a Hyeronima 0.90±0.15ab 0.73±0.02d 129.63±17.84a 0.32±0.05abcd 0.25±0.01ab 0.42±0.01abcd Mollinedia 0.89±0.13ab 0.72±0.02d 194.40±31.05ab 0.26±0.04abc 0.21±0.01ab 0.50±0.01d Rustia 1.14±0.28b 0.78±0.01d 148.14±3.46ab 0.25±0.01abc 0.27±0.01ab 0.35±0.01abc Seca Alchornea 0.53±0.12ab 0.61±0.01a 153.57±15.96ab 0.22±0.04ab 0.32±0.04b 0.30±0.05a Hyeronima 0.66±0.12ab 0.72±0.02d 121.03±14.45a 0.27±0.03abc 0.32±0.04b 0.42±0.04abcd Mollinedia 1.20±0.32b 0.76±0.01d 237.41±7.44b 0.19±0.01ab 0.23±0.01ab 0.50±0.01d Rustia 2.73±0.47c 0.92±0.01e 242.89±77.54b 0.15±0.02a 0.32±0.05b 0.35±0.05abc Montana Chuvosa Alchornea 0.56±0.07ab 0.59±0.02a 118.41±8.74a 0.55±0.05d 0.16±0.02a 0.38±0.02abcd Hieronyma 0.88±0.10ab 0.76±0.01d 131.25±9.33a 0.35±0.03abcd 0.23±0.02ab 0.34±0.02ab Mollinedia 0.54±0.07a 0.77±0.03d 186.74±21.51ab 0.31±0.07abc 0.21±0.03a 0.46±0.03d Rustia 0.80±0.13ab 0.70±0.01bcd 131.16±5.19a 0.40±0.04abcd 0.20±0.02a 0.47±0.02d Seca Alchornea 0.18±0.02a 0.61±0.04abc 114.69±2.89a 0.45±0.05bcd 0.20±0.03ab 0.38±0.02abcd Hieronyma 0.74±0.22ab 0.76±0.01d 127.06±3.14a 0.32±0.01abc 0.25±0.01ab 0.34±0.02ab Mollinedia 0.35±0.12a 0.72±0.03d 148.27±12.07ab 0.29±0.03abc 0.25±0.04ab 0.46±0.03bcd Rustia 0.69±0.13ab 0.71±0.03cd 146.74±18.41ab 0.39±0.01abcd 0.18±0.02a 0.47±0.02cd

90
O Valor de Huber (VH) variou de 0.18 a 2.24 cm2.m-2. As espécies Mollinedia e
Rustia apresentaram os maiores valores de VH na FODTB durante a estação seca (1.20 e
2.34 cm2 m-2, respectivamente) e durante a chuvosa (Rustia, 1.14 cm2 m-2). De maneira
geral, houve tendência de menores VH na FODM na qual Alchornea apresentou o menor
valor durante a estação seca (0.18 cm2 m-2). O conteúdo de água (CAF) foliar variou de
0.61 a 0.92 g g-1 onde Rustia na FODTB, durante o período seco, apresentou valores
significativamente maiores de CAF enquanto Alchornea apresentou os menores valores
em ambas as altitudes. O mesmo foi observado para a área específica foliar (AEF) onde
Rustia e Alchornea apresentaram o maior e menor valor respectivamente (242 e 114 cm2
g-1). Os dois componentes da AEF que são espessura (ESP) e densidade foliar (DEN)
apresentaram padrões inversos de diferenciação entre as espécies. Para a DEN, que
variou de 0.15 a 0.55 mg mm-3, Alchornea na FODM durante a estação seca apresentou
maiores valores (0.55 mg mm-3) enquanto Rustia na FODTB durante a seca apresentou o
menor valor (0.15 mg mm-3). Em relação a ESP, que variou de 0.16 a 0.32 mm, foi
observado o inverso onde Alchornea na FODM durante a estação seca apresentou
menores valores (0.16 mm). A densidade da madeira (DM) variou de 0.30 a 0.50 g cm-3.
Rustia e Mollinedia apresentaram os maiores valores em ambas as altitudes (Tabela 1).
Na variação entre estações em cada altitude para cada espécie foram poucas as
diferenças significativas e ocorreram apenas na FODTB. Rustia apresentou os maiores
valores durante a estação seca em relação à VH e CAF. Alchornea apresentou os maiores
valores de DEN e ESP também na estação seca. A área foliar não apresentou diferenças
em nenhuma das comparações (entre altitudes ou estações; dados não mostrados). Rustia
foi a única espécie a apresentar diferenças quanto a área de xilema ativo (dados não
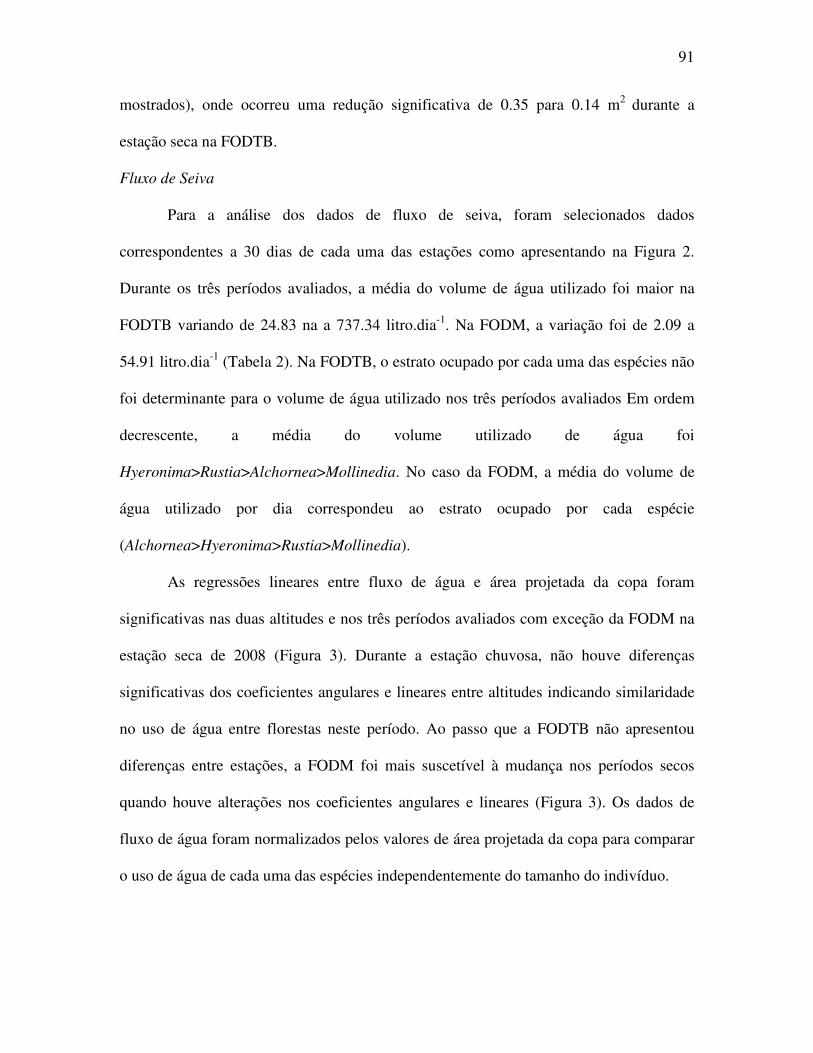
91
mostrados), onde ocorreu uma redução significativa de 0.35 para 0.14 m2 durante a
estação seca na FODTB.
Fluxo de Seiva
Para a análise dos dados de fluxo de seiva, foram selecionados dados
correspondentes a 30 dias de cada uma das estações como apresentando na Figura 2.
Durante os três períodos avaliados, a média do volume de água utilizado foi maior na
FODTB variando de 24.83 na a 737.34 litro.dia-1. Na FODM, a variação foi de 2.09 a
54.91 litro.dia-1 (Tabela 2). Na FODTB, o estrato ocupado por cada uma das espécies não
foi determinante para o volume de água utilizado nos três períodos avaliados Em ordem
decrescente, a média do volume utilizado de água foi
Hyeronima>Rustia>Alchornea>Mollinedia. No caso da FODM, a média do volume de
água utilizado por dia correspondeu ao estrato ocupado por cada espécie
(Alchornea>Hyeronima>Rustia>Mollinedia).
As regressões lineares entre fluxo de água e área projetada da copa foram
significativas nas duas altitudes e nos três períodos avaliados com exceção da FODM na
estação seca de 2008 (Figura 3). Durante a estação chuvosa, não houve diferenças
significativas dos coeficientes angulares e lineares entre altitudes indicando similaridade
no uso de água entre florestas neste período. Ao passo que a FODTB não apresentou
diferenças entre estações, a FODM foi mais suscetível à mudança nos períodos secos
quando houve alterações nos coeficientes angulares e lineares (Figura 3). Os dados de
fluxo de água foram normalizados pelos valores de área projetada da copa para comparar
o uso de água de cada uma das espécies independentemente do tamanho do indivíduo.

92
26/6
/200
8
10/8
/200
8
25/9
/200
8
9/11
/200
8
25/1
2/20
08
8/2/
2009
26/3
/200
9
10/5
/200
9
25/6
/200
9
9/8/
2009
24/9
/200
9
0
20
40
60
80
100
120
140
160
Chu
vosa
Se
ca
Pre
cip
ita
ção
Diá
ria (
mm
)
Tempo (dias)
FODTB
FODM
Se
ca
Figura 2. Precipitação (mm) diária durante todo o período de estudo. Estão selecionados
os períodos utilzados para análise dos dados de fluxo de água do xilema.
Tabela 2. Volume (litros) de água transportada por dia para cada espécie entre altitudes e
estações. Os valores são médias ± erro padrão.
Seca 2008 Chuvosa Seca 2009 Terras Baixas Montana Terras Baixas Montana Terras Baixas Montana Alchornea 47.02±16.35 50.83±24.69 60.75±25.73 29.06±12.29 24.83±21.75 54.91±18.37 Hyeronima 737.34±114.69 26.89±4.77 525.87±72.53 9.35±0.41 323.30±99.48 22.04±1.77 Mollinedia 36.21±21.87 6.76±2.37 34.20±24.16 2.09±0.72 14.00±7.21 5.23±1.92 Rustia 77.45±34.94 12.36±2.96 79.67±39.61 2.42±0.55 66.87±31.95 8.47±1.76

93
0.0 0.5 1.0 1.5 2.0 2.50.0 0.5 1.0 1.5 2.0 2.5-1.0
-0.5
0.0
0.5
1.0
1.5
2.0
2.5
3.0
3.5
0.0 0.5 1.0 1.5 2.0 2.5
Área Copa (m2)[log]
Chuvosa
Terras Baixas - y = 0.71 + 0.84x; R2=0.53; P<0.004
Montana - y= 0.87 + 0.66x; R2=0.35; P<0.01
Flux
o de
Águ
a (l
itro
.dia
-1)[
log] Seca 2008
Terras Baixas - y = 0.66 + 0.92x; R2=0.64; P<0.0011Montana - nao significativa
Terras Baixas Montana
Seca 2009
Terras Baixas - Y=0.37 + 0.87x; R2= 0.40; P<0.02
Montana - Y = 0.69 + 0.55x; R2=0.28; P<0.04
Figura 3. Comparação da relação entre fluxo de água (litros.dia-1) e área da copa entre altitudes
nas estações seca de 2008 e 2009 e chuvosa. Cada ponto representa o total de uso de água de
cada indivíduo por altitude.
Para visualizar o comportamento de uso de água de cada uma das espécies em
cada altitude foram selecionados quatro dias de cada estação avaliada. Em todos os casos
o DPV decresceu do dossel até o sub-bosque (Figura 4 e 5). Os dados de amperagem
referentes ao carregamento da bateria pelo painel solar apresentaram correspondência
positiva com os dados de DPV atestando que podem ser utilizados como aproximação
para radiação solar. Devido a problemas eletrônicos durante a estação seca de 2009 não
houve registro de amperagem na FODTB. Apesar de Hyeronima ter apresentado os
maiores volumes de água na FODTB, os dados normalizados mostraram que Rustia
apresentou os maiores valores nos três períodos estudados (Figura 4). Na estação seca de
2008 e na chuvosa, Hyeronima é ultrapassada por Mollinedia que havia apresentado os
menores volumes de água (Tabela 2). Houve uma tendência de maiores fluxos de água na
estação chuvosa onde os valores foram maiores em relação a estação seca de 2008. Na

94
seca de 2009, as espécies apresentaram menores valores. Na FODM, Hyeronima
apresentou os maiores valores normalizados, seguida por Rustia>Alchornea>Mollinedia.
Ao contrário do observado na FODTB, os maiores fluxos foram observados nas estações
secas de 2008 e 2009 enquanto a estação chuvosa apresentou os menores valores (Figura
5).
0.5
1.0
1.5
2.0
2.5
3.0
0.2
0.4
0.6
0.8
1.0
0.10.20.30.40.50.60.70.80.91.0
0.5
1.0
1.5
2.0
2.5
3.0
0.0
0.2
0.4
0.6
0.8
0.1
0.20.3
0.40.5
0.6
0.70.8
0.9
0.5
1.0
1.5
2.0
2.5
3.0
0.1
0.20.3
0.4
0.5
0.6
0.70.8
0.9
Dossel Intermediário Sub-bosque
------ Radiação
Seca 2008
Alchornea Hyeronima Rustia Mollinedia
Seca 2008
DP
V (
kPa)
Chuvosa
Flu
xo d
e Á
gua
(lit
. dia
-1. m
-2)
Rad
iaçã
o (A
mps
)
Chuvosa
0 20 40 60 80 100 120 140 160 180 200
Seca 2009
0 20 40 60 80 100 120 140 160 180 200
TempoTempo
Seca 2009
Floresta de Terras Baixas
Figure 4. DPV e radiação nos três estratos (dossel, intermediário e sub-bosque) e fluxo
de água, nas quatro espécies estudadas na Floresta Ombrófila Densa de Terras Baixas em
um intervalo de cinco dias.
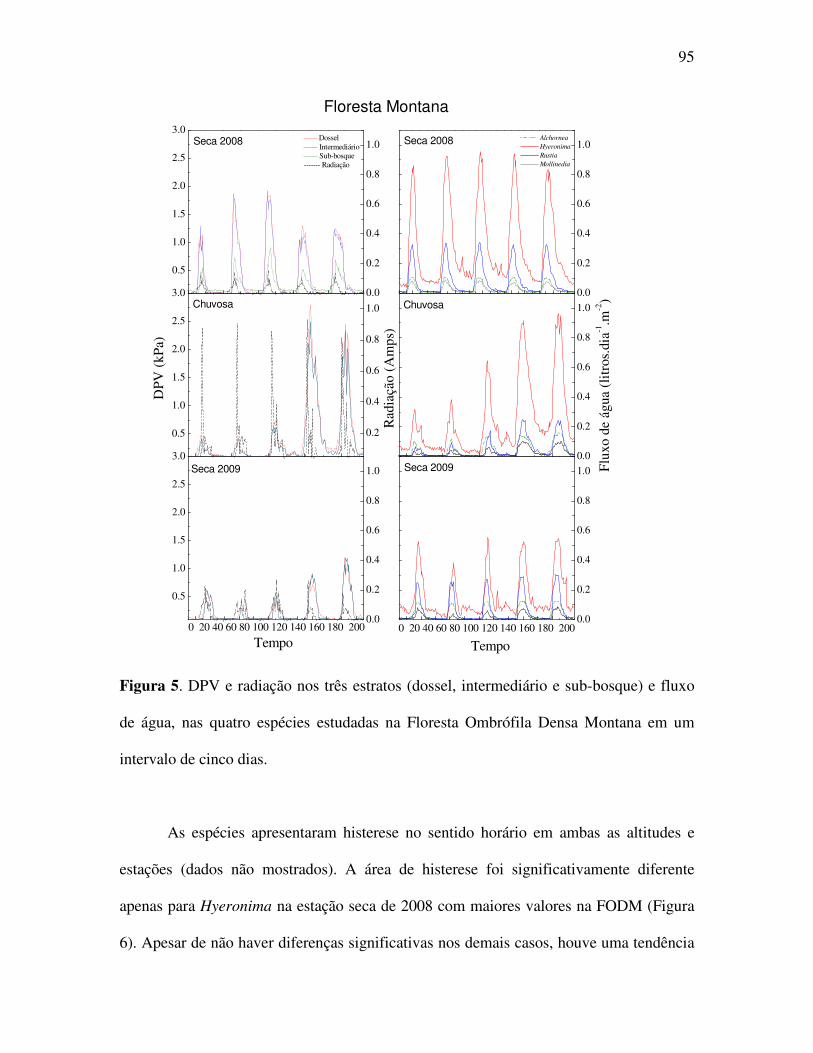
95
0.0
0.2
0.4
0.6
0.8
1.0
0.5
1.0
1.5
2.0
2.5
3.0
0.0
0.2
0.4
0.6
0.8
1.0
0.0
0.2
0.4
0.6
0.8
1.0
0.5
1.0
1.5
2.0
2.5
3.0
0.0
0.2
0.4
0.6
0.8
1.0
0.0
0.2
0.4
0.6
0.8
1.0
0.5
1.0
1.5
2.0
2.5
3.0
0.2
0.4
0.6
0.8
1.0
Alchornea Hyeronima Rustia Mollinedia
Seca 2008
Dossel Intermediário Sub-bosque
------- Radiação
Seca 2008
Flux
o de
águ
a (l
itro
s.di
a-1.m
-2)
Chuvosa
Tempo
Seca 2009
0 20 40 60 80 100 120 140 160 180 200
0 20 40 60 80 100 120 140 160 180 200
Tempo
Seca 2009
Floresta Montana
DPV
(kP
a)
Chuvosa
Rad
iaçã
o (A
mps
)
Figura 5. DPV e radiação nos três estratos (dossel, intermediário e sub-bosque) e fluxo
de água, nas quatro espécies estudadas na Floresta Ombrófila Densa Montana em um
intervalo de cinco dias.
As espécies apresentaram histerese no sentido horário em ambas as altitudes e
estações (dados não mostrados). A área de histerese foi significativamente diferente
apenas para Hyeronima na estação seca de 2008 com maiores valores na FODM (Figura
6). Apesar de não haver diferenças significativas nos demais casos, houve uma tendência

96
geral de maiores valores na estação seca de 2008, intermediários na chuvosa e menores
valores na seca de 2009. Além disso, Alchornea, Mollinedia e Rustia apresentaram
tendência de maiores áreas de histerese na FODTB (Figura 6).
0.0
0.2
0.4
0.6
0.8
0.0
0.2
0.4
0.6
Áre
a de
His
tere
se (
kPa)
Terras Baixas Montana
Alchornea
aa
aa a
Hyeronima
a a
a
b
Seca 2008 Chuvosa Seca 2009
Áre
a de
His
tere
se (
kPa)
Estação
Rustia
a
aa
a
aa
Seca 2008 Chuvosa Seca 2009
Estação
Mollinedia
a
a
aa a
Figura 6. Comparação da área de histerese estimada a partir dos gráficos de fluxo de
água, DPV e radiação. Letras diferentes apontam diferenças significativas dentro de cada
espécie (Tukey, ANOVA, p<0.05).
Os valores de CT foram maiores na FODTB chegando em torno de 13 lit.dia-1.m-
2.kPa-1 enquanto a FODM não apresentou valores superiores a 5.0 lit.dia-1.m-2.kPa-1
(Figura 7). Na FODTB, Mollinedia e Rustia apresentaram valores maiores de CT em
comparação a Alchornea e Hyeronima tanto na estação seca (~5.0 e ~7.5; ~1.5 e ~3.0
lit.dia-1.m-2.kPa-1, respectivamente), quanto na chuvosa (~11 e ~13.5; ~7.5 e ~3.0 lit.dia-
1.m-2.kPa-1, respectivamente). Na FODM, Alchornea, Mollinedia e Rustia apresentaram
97
valores que não ultrapassaram 1.5 lit.dia-1.m-2.kPa-1, enquanto Hyeronima apresentou
valores em torno de 3.0 lit.dia-1.m-2.kPa-1.
Na comparação entre estações, todos os indivíduos de Alchornea apresentaram
aumentos significativos de CT em ambas as altitudes (Tabela 3). Na FODTB este
aumento de CT da seca para a chuvosa chegou a 76% (Tabela 3). Nas demais espécies da
FODTB não houve padrão claro de variação de CT já que Hyeronima e Mollinedia, por
exemplo, apresentaram indivíduos com respostas opostas entre estações (Tabela 3). Na
FODM, três indivíduos de Rustia e dois de Mollinedia apresentaram redução significativa
de CT durante a estação chuvosa. Hyeronima, tal como observado na FODTB, não
apresentou padrão claro de resposta (Tabela 3).
Análise de Componente Principal
Na FODTB, o primeiro, segundo e terceiro eixos da ACP explicaram 46.66, 28.04
e 16.20%, respectivamente, da variação entre espécies e estações (Tabela 3; Figura 7). As
variáveis que apresentaram maior contribuição no primeiro eixo foram área especifica
foliar (AEF), valor de huber (VH), repelência hídrica foliar (RHF), conteúdo de água
foliar (CAF) e fluxo máximo de água (Fmáx; Tabela 3). Espessura foliar (ESP) e
exposição da copa (EC) apresentaram maior contribuição no segundo eixo enquanto a
contribuição da densidade da madeira (DM) surgiu apenas no terceiro eixo (Tabela 3). O
deslocamento das espécies da estação chuvosa para a seca, no espaço multivariado,
ocorreu ao longo do primeiro eixo para Rustia e Mollinedia enquanto as espécies de
dossel Alchornea e Hyeronima apresentaram deslocamento ao longo do segundo eixo
(Figura 7). Relações positivas entre os atributos foram observadas entre Fmáx, CAF e VH

98
(positivamente associadas com o deslocamento multivariado de Rustia entre estações) e
entre EC e RHF (Figura 7). Apenas Mollinedia, em ambas as estações, esteve
positivamente associada a DM (Figura 7).
Tabela 3. Variações nos valores máximos de condutância total, em porcentagem, em
cada indivíduo de cada espécie. A direção e cor das setas indicam se houve aumento (�)
ou diminuição (�) da condutância total da estação seca para a chuvosa. Asteriscos
indicam diferença significativa entre estações (Teste-t pareado, P<0.05).
%
Espécie Indivíduo Floresta
Terras Baixas Floresta Montana
Alchornea 1 �64.2* �51.2* 2 �76.1* �63.7* 3 �45.6* �40.4*
Hyeronima 1 �28.4* �52.6* 2 �27.2* �2.1 3 �19.4 �33.2*
Mollinedia 1 �22.9 �44.1* 2 �14.7* �35.2* 3 �37.3* �5.0
Rustia 1 �21.7 �69.9* 2 �17.2 �42.1* 3 �16.1* �57.5*
Na FODM, o primeiro e segundo eixos da ACP explicaram 42.87, 39.17 e
12.39%, respectivamente, da variação entre espécies e estações. Fmáx, CAF, EC, ESP e
VH apresentaram maior contribuição no primeiro eixo. No segundo eixo, AEF, EC, DM e
RHF apresentaram maior contribuição. No terceiro eixo, Fmáx e CAF foram os atributos
com maior contribuição de variação das espécies. O deslocamento das espécies da
estação chuvosa para a seca, no espaço multivariado, ocorreu ao longo do primeiro eixo

99
0
3
6
9
12
15
0 500 1000 1500 20000
3
6
9
12
15
0 500 1000 1500 2000
Esta
ção s
eca
Alchornea
Esta
ção c
huvosa
Hyeronima
Esta
ção s
eca
Esta
ção c
huvosa
Mollinedia
Con
dutâ
ncia
Tot
al (
lit.d
ia-1
.m-2
.kP
a-1)
Dias
Esta
ção s
eca
Esta
ção c
huvosa
Rustia
Dias
Esta
ção s
eca
Esta
ção c
huvosa
Floresta de Terras Baixas
0
3
6
9
12
15
0
3
6
9
12
15
Floresta Montana
Alchornea
Con
dutâ
ncia
Tot
al (
lit.d
ia-1
.m-2
.kP
a-1)
Esta
ção s
eca
Esta
ção c
huvosa
Hyeronima
Esta
ção s
eca
Esta
çã
o c
huvosa
Mollinedia
Dias
Esta
ção s
eca
Esta
ção c
huvo
sa
0 500 1000 1500 2000
Rustia
Dias
Esta
ção s
eca
Esta
ção c
huvosa
0 500 1000 1500 2000
Figura 7. A condutância total (a cada 30 minutos) de cada indivíduo de cada espécie em
cada um das florestas estudadas. A linha tracejada em cada painel separa as estações seca
(2008) e chuvosa. Em cada painel, os indivíduos estão representados por linhas diferentes
(1 ─ ; 2 ----; 3─) que correspondem aos mesmos números encontrados na tabela 3.

100
-1.4-1.2-1.0-0.8-0.6-0.4-0.2 0.0 0.2 0.4 0.6 0.8 1.0 1.2 1.4
-1.4
-1.2
-1.0
-0.8
-0.6
-0.4
-0.2
0.0
0.2
0.4
0.6
0.8
1.0
1.2
1.4
AlcWet
HyeWet
MolWet
RusWet
AlcDry
HyeDry
MolDry
RusDryEC
RHF
DM
ESP
VH
AEF
Eix
o 2
(2
8.0
4%
)
Eixo 1 (46.66%)
CAF
FMax
Terras Baixas
-1.4-1.2-1.0 -0.8 -0.6-0.4-0.2 0.0 0.2 0.4 0.6 0.8 1.0 1.2 1.4
-1.4
-1.2
-1.0
-0.8
-0.6
-0.4
-0.2
0.0
0.2
0.4
0.6
0.8
1.0
1.2
1.4
AlcWet
HyeWet
MolWet
AlcDry
MolDry
RusDry
HyeDry
ECRHF
DM
ESP
VH
AEF
Eix
o 2
(3
9.1
7%
)
Eixo 1 (42.86%)
CAF
FMax
Montana
RusWet
Figura 7. Ordenação de análise de componente principal, para floresta de terras baixas e
montana, baseada em 8 características de 4 espécies em duas estações. As siglas das
variáveis são as mesmas apresentadas na Tabela 3.

101
Tabela 3. Auto-valores de cada um dos atributos utilizados nas análises de componentes
principais em cada uma das altitudes. Estão apresentados os três primeiros eixos e em
negrito os atributos com maior poder explicativo em cada eixo. Os atributos são área
especifica foliar (AEF), valor de huber (VH), repelência hídrica foliar (RHF), conteudo
de água foliar (CAF), fluxo máximo de água (Fmáx), exposição da copa (EC), densidade
da madeira (DM) e espessura foliar (ESP).
apenas em Hyeronima enquanto Alchornea, Rustia e Mollinedia variaram ao longo do
segundo eixo. Relações positivas entre os atributos foram observadas entre Fmáx, HV e
RHF (positivamente associadas com o deslocamento multivariado de Hyeronima entre
estações) e entre ESP e CAF (Figura 7). Fmáx, HV e RHF apresentaram tendência de
associação negativa com DM (Figura 7). As espécies de sub-dossel e sub-bosque, Rustia
e Mollinedia, em ambas as estações, estiveram positivamente associadas a AEF e DM
(Figura 7).
T. Baixas Eixo 1 Eixo 2 Eixo 3 Montana Eixo 1 Eixo 2 Eixo 3 atributos 46.65% 28.03% 16.19% atributos 42.87% 39.17% 12.39% AEF -0.9202 0.17106 0.12673 FMax -0.873 -0.414 0.035 VH -0.8331 -0.4603 0.10405 CAF -0.803 0.581 0.064 RHF 0.80335 -0.5531 0.06093 EC 0.716 -0.683 0.087 CAF -0.7754 -0.4502 0.39259 ESP -0.712 0.278 -0.606
FMax -0.7649 -0.4051 -0.4123 VH -0.658 -0.063 0.723
EC 0.56993 -0.6114 0.52125 RHF -0.593 -0.795 0.076 DM -0.1879 0.51285 0.81725 DM 0.458 0.776 0.262 ESP -0.0049 -0.8319 0.03702 AEF -0.084 0.918 0.118

102
Discussão
Em linhas gerais, o volume total de água utilizado pelas plantas está
positivamente associado ao tamanho dos indivíduos (Meinzer et al. 2001). O aumento no
fluxo de água em função de características ligadas ao tamanho da planta (i.e. área da copa
e DAP) são considerados como robustos indicadores da área de xilema ativo (Meinzer
2001). Portanto, maiores indivíduos apresentarão maiores volumes de água transportados
(Meinzer 2001, Motzer 2005). Apesar da diminuição do volume de água transportado na
FODM nas quatro espécies estudadas, isso se deve apenas ao fato dos indivíduos
estudados na FODM serem menores. De qualquer modo, é importante ressaltar que em
termos de volume de água transportada por dia, os valores observados no nosso estudo
(de 2.09 a 737 lit.dia-1) abarcam a ampla variação encontrada em outras florestas. Em
floresta de terras baixas no Panamá, foram registrados entre 380 lit.dia-1 (Andrade et
al.1998) e 750 lit.dia-1 (James et al. 2002) e entre 250 e 300 lit.dia-1 na Guiana Francesa
(Granier et al., 1996). Os estudos realizados em florestas montanas tropicais também
mostram grande variabilidade com valores entre 5 e 35 lit.dia-1 (Santiago et al. 2000),
entre 10 e 110 lit.dia-1 (Zotz et al. 1998) e em torno de 372 lit.dia-1 (Kline et al. 1970).
A comparação das espécies, a partir da normalização do fluxo de água pela área
projetada da copa, indica que o grau de exposição da copa e o estrato ocupado por cada
espécie não estiveram diretamente associados ao volume de água transportado nas duas
altitudes. A similaridade das relações entre área de copa de fluxo de água nas duas
altitudes durante a estação chuvosa indica que em períodos mais favoráveis, o
comportamento dos indivíduos entre altitudes é similar. No entanto, durante os períodos
secos, as diferenças de funcionamento em termos de uso de água podem ter se dado em

103
função de restrições à perda de água e ajustes hidráulicos para otimizar o uso da água (Xu
e Cohen 2005). Tais ajustes podem estar associados a variações em atributos
morfológicos como será descrito na próxima seção.
Apesar do DPV ter sido mais importante na determinação do fluxo transpiracional
do que a radiação (estimada a partir dos dados de amperagem dos painéis solares), a
estratificação vertical do DPV nas duas altitudes não acarretou em diferenças no fluxo de
água de acordo com o estrato ocupado. Mesmo que aumentos na radiação solar ocorram
primeiro que o DPV em ambas as altitudes, nos três períodos analisados, as espécies se
mostraram mais sensíveis à variação do DPV fazendo com que o início do fluxo
transpiracional ocorresse no sentido horário tal como ilustrado na figura 1. Fluxos de
água no sentido horário ocorrem porque, durante a manhã, para um dado valor de DPV, a
radiação será maior do que no período da tarde e, portanto, o fluxo de água será maior no
início do dia (Zeppel et al. 2004). Embora fossem esperadas maiores histereses na
FODM, em função de maiores DPV e radiação, sugerimos que a maior proporção de
raízes finas na FODM (capítulo 1) possa ter aumentado a absorção de água, minimizando
riscos de embolia e diminuindo, portanto, a área de histerese (Nepstad et al. 1994;
Williams et al. 1998; Zeppel et al 2004). Na FODM, o fato de Hyeronima ter sido a única
espécie a apresentar área de histerese significativamente maior na estação seca de 2008
pode ser atribuído ao maior VH e Fmáx, que apresentaram associação positiva na ACP.
Maior VH, associado ao maior grau de exposição da copa em Hyeronima, poderia levar a
maiores perdas de água durante a manhã acarretando maiores declínios de potencial
hídrico foliar o que levaria à maior histerese devido a forte fechamento estomático
durante a tarde (Gotsch et al. 2010).

104
Além do maior investimento em raízes finas, os baixos valores de CT na FODM,
em relação a FODTB, indicam que os maiores DPVs e radiação na FODM impõem um
maior controle nas perdas de água em função da existência de ajustes estomáticos ao
longo de todo o dia. Portanto, ao contrário do observado na literatura, sugerimos que
menores histereses também podem refletir restrições à perda de água (Williams et al.
1998; Zeppel et al 2004). Menor diferença entre grau de abertura estomática entre manhã
e tarde também pode ser indicativo de fortes restrições estomáticas ao longo de todo o dia
mesmo em florestas montanas (Rada et al., 2009), favorecendo a existência de menores
histereses. As reduções na transpiração noturna na FODM, seja em função de um controle
fisiológico ou abiótico (capítulo 3), também reforçam esta ideia de maiores restrições à
noite permitem restrições a perda d’água no inicio do dia (Dawson et al., 2007). Na
comparação entre estações, Alchornea foi a única espécie a apresentar padrões de
resposta similares em ambas as altitudes, indicando ajustes para minimizar a perda de
água durante a estação seca independentemente das diferenças de DPV e radiação entre
florestas. Na FODM, a redução de CT em Rustia e Mollinedia, espécies com menor grau
de exposição da copa, pode ter ocorrido em função do aumento de eventos de neblina que
diminuiria a diferença de demanda evaporativa para a transpiração. Cabe ressaltar que
apesar da neblina ser capaz de diminuir a intensidade dos fluxos, ela não parece ser uma
fonte de água significativa para a FODM (Groppo, 2010).
Em termos comparativos, as áreas de histerese observadas neste estudo (entre 0.02
e 0.58 kPa) foram menores do que as observadas em estudo realizado por Zeppel et al.
(2004) com Callitris glaucophylla e Eucalyptus cebra na Austrália, onde os valores
ficaram entre 0.30 e 1.2 kPa. No estudo realizado por Zeppel et al. (2004), a baixa média
105
de precipitação anual (680 mm) e os elevados valores de DPV (~2.5 kPa) podem resultar
nas maiores histereses ao contrário das observadas no nosso estudo onde as precipitações
anuais são maiores (~2000 mm) e os DPVs menores. No entanto, é importante ressaltar
que mesmo em condições em principio mais favoráveis na Mata Atlântica, há a
ocorrência de histereses nas espécies e que os valores de histerese observados apresentam
um grau de sobreposição com das espécies do open woodland. Isto indica que mesmo
com menores DPVs e maior precipitação em relação ao open woodland, as espécies da
Mata Atlântica apresentam um elevado grau de suscetibilidade a pequenas variações na
disponibilidade hídrica.
Características Morfológicas
Mudanças em características morfológicas foliares são comumente observadas ao
longo de variações altitudinais, em função das variações nas condições ambientais
(Grubb 1977; Velázques-Rosa et al 2002; Macek et al. 2009; Navarro et al 2010). Como
observado na literatura, as condições ambientais de florestas montanas (i.e. maiores
radiação e DPV, menor pressão atmosférica e presença de neblina) fazem com que as
plantas estejam submetidas a condições semelhantes aquelas de plantas que ocorrem em
ambientes secos (Leuschner 2000). A tendência de menores AEF, que reflete maior
investimento na folha em termos de carbono, associado a maiores DEN na FODM,
indicam o investimento em folhas com maior durabilidade o que pode levar a maiores
longevidades foliares e maior eficiência no uso da água e nutriente (Brujinzeel e
Veneklaas 2000). Além disso, levando-se em conta as maiores radiações e DPV
observados na FODM (Rosado et al. 2010) os menores VH e AEF indicam ajustes

106
hidráulicos associados à minimização do risco de embolia (Sellin e Kupper 2006; Wright
et al. 2006).
Em ambientes mais sombreados, com menor radiação e DPV (Motzer 2005;
Barigah et al. 2006), a alocação de recursos em área foliar tende a ser maior para
maximizar a absorção da energia luminosa do que em tecidos vasculares para suprir uma
baixa demanda de transporte de água, o que levaria a maiores VH (Callaway et al. 2000;
Barigah et al. 2006; Schoonmaker et al. 2010). Desta forma, tem se observado que
plantas de ambientes sombreados tendem a ser mais suscetíveis à cavitação do que
plantas de dossel (Barigah et al. 2006; Schoonmaker et al. 2010). Considerando a maior
declividade do terreno na FODM (Martins, 2010), que permitiria maior entrada de
radiação no sub-bosque e os maiores DPV, os menores VH de Rustia e Mollinedia,
espécies de sub-dossel e sub-bosque, respectivamente, significativamente mais baixos do
que na FODTB indicam ajustes hidráulicos associados à minimização da cavitação.
Ajustes hidráulicos associados a maior radiação e DPV levariam aos menores
fluxos de água observado nestas duas espécies na FODM. Em suporte a estes resultados,
foi observado que Rustia e Mollinedia apresentaram aumentos significativos na
repelência hídrica foliar na FODM, o que parece estar associado a um mecanismo de
minimização da perda de água (Rosado et al., 2010). Apesar de Mollinedia ter
apresentado tendência de maior DM nas duas florestas, isto não estão diretamente ligado
à resistência a cavitação (Hacke et al. 2001) já que características como o calibre das
pontoações pode ter maior importância (Schoonmaker et al. 2010). No entanto, tal como
observado para outras plantas de sombra em florestas tropicais, maiores DM podem levar

107
a maiores taxas de sobrevivência devido ao aumento de resistência a queda de detritos e
invasão por patógenos (Chave et al 2009).
Relação multivariada entre atributos morfológicos e fluxo de água entre estações
Embora diferentes conjuntos de atributos tenham explicado a variação entre
espécies e estações em ambas as altitudes, CAF e VH foram os atributos que estiveram
positivamente associados ao Fmáx independentemente da altitude. Este resultado indica
que independentemente das diferenças entre condições ambientais e espécies, há uma
convergência funcional na relação entre atributos que afetam Fmáx (Meinzer 2001, 2003).
Na FODTB e FODM, Rustia e Hyeronima, respectivamente, foram as espécies que
apresentaram associação positiva com Fmáx, VH e CAF especialmente durante a seca. Em
ambas as altitudes, estas duas espécies apresentaram maiores VH e, no caso de Rustia, o
VH aumentou da estação chuvosa para a seca. Maiores VH atuam como uma das
principais forças motrizes para Fmáx o que associado aos maiores VPD durante a seca
explicariam a associação entre VH e Fmáx (Gotsch et al. 2010).
Embora a magnitude do fluxo de água na FODTB não esteja associado ao estrato
ocupado por cada espécie, as espécies apresentaram diferenças morfológicas que
estiveram associadas ao estrato ocupado, o que explicaria o fato de AEF ter sido o
atributo com maior contribuição no primeiro eixo. No caso da FODM, os maiores DPVs
e radiação solar que atuam como importantes fatores na magnitude do fluxo de água
podem explicar o fato de Fmáx ter sido o atributo com maior contribuição no primeiro
eixo.

108
Conclusão
Embora o funcionamento da FODTB e FODM, em termos de uso de água, seja
similar em períodos favoráveis, períodos de menor disponibilidade hídrica acarretaram
ajustes associados ao uso de água especialmente na FODM. Tal como observado em
outros estudos, o estrato ocupado pelas espécies afetou a variação vertical de atributos
morfológicos (Williams et al. 1989; Beaumont et al. 2009; Rosado et al, 2010). No
entanto, o fluxo de água não apresentou correspondência com o estrato ocupado, mas
com o efeito integrado dos atributos morfológicos, condições atmosféricas e raízes finas.
Apesar de das diferenças no volume de água transportada em função do tamanho das
plantas, estes resultados se opõem a uma série de estudos que tem apontado tamanho da
planta e exposição da copa, independentemente da identidade da espécie, como os
principais fatores determinantes que afetam o fluxo de água. Embora se assuma que os
principais fatores limitantes em Florestas tropicais chuvosas sejam luz e nutrientes, este
estudo demonstra importantes ajustes associados ao uso água, especialmente no caso das
espécies de sub-bosque e sub-dossel, que apresentaram indicativos de maior
vulnerabilidade à diminuição da disponibilidade hídrica.
Referências
Andrade, J.L., Meinzer, F., Goldstein, G., Holbrook, N.M., Cavelier, J., Jackson, P., &
Silvera, K. (1998) Regulation of water flux through trunks, branches, and leaves in
trees of a lowland tropical forest. Oecologia, 115, 463– 471.
Barigah, T.S., Ibrahim, T., Bogard, A., Faivre-Vuillin, B., Lagneau, L.A., Montpied, P.,
& Dreyer, E. (2006) Irradiance-induced plasticity in the hydraulic properties of

109
saplings of different temperate broad-leaved forest tree species. Tree Physiol, 26,
1505-1516.
Barker, M. & Becker, P. (1995) Sap flow rate and sap nutrient content of a tropical rain
forest canopy species, Dryobalanops aromatica, in Brunei. Selbyana, 16, 201-211.
Beaumont, S. & Burn, K.C. (2009) Vertical gradients in leaf trait diversity in a New
Zealand forest. Trees, 23, 339-346.
Bruijnzeel, L.A. & Veneklaas, E.J. (1998) Climatic conditions and tropical montane
forest productivity: the fog has not lifted yet. Ecology, 79, 3-9.
Bucci, S.J., Goldstein, G., C.Meinzer, F., Franco, A.C., Campanello, P., & G.Scholz, F.
(2005) Mechanisms contributing to seasonal homeostasis of minimum leaf water
potential and predawn disequilibrium between soil and plant water potential in
Neotropical savanna trees. Trees, 19, 296-304
Burgess, S.S.O., Adams, M.A., Turner, N.C., & Ong, C.K. (1998) The redistribution of
soil water by tree root systems. Oecologia, 115, 306-311.
Burgess, S.S.O., Adams, M.A., Turner, N.C., Beverly, C.R., Ong, C.K., Khan, A.A.H., &
Bleby, T.M. (2001) An improved heat pulse method to measure low and reverse
rates of sap flow in woody plants. Tree Physiology, 21, 589–598.
Burgess, S.S.O. & Dawson, T.E. (2004) The contribution of fog to the water relations of
Sequoia sempervirens (D. Don): foliar uptake and prevention of dehydration. Plant,
Cell and Environment, 27, 1023–1034.
Burgess, S.S.O. (2006) Measuring transpiration responses to summer precipitation in a
Mediterranean climate: a simple screening tool for identifying plant water-use
strategies. Physiologia Plantarum, 127, 404-412.
110
Callaway, R.M., Sala, A., & Keane, R.E. (2000) Succession May Maintain High Leaf
Area: Sapwood Ratios and Productivity in Old Subalpine Forests. Ecosystems, 3,
254-268.
Casper, B.B., Forseth, I.N., Kempenich, H., Seltzer, S., & Xavier, K. (2001) Drought
prolongs leaf life span in the herbaceous desert perennial Cryptantha flava.
Functional Ecology, 15, 740-747.
Cavender-Bares, J., Sack, L., & Savage, J. (2007) Atmospheric and soil drought reduce
nocturnal conductance in live oaks. Tree Physiol, 27, 611-620.
Chabot, B.F. & Hicks, D.J. (1982) The ecology of leaf life spans. Ann. Rev. Ecol. Syst.,
13, 229-259.
Chave, J., Coomes, D., Jansen, S., Lewis, S.L., Swenson, N.G., & Zanne, A.E. (2009)
Towards a worldwide wood economics spectrum. Ecology Letters, 12, 351-366.
Clark, D. & Clark, D. (1992) Life history diversity of canopy and emergent trees in a
neotropical rain forest. Ecological Monographs, 62, 315-344.
Collatz, G.J., Ball, J.T., Grivet, C., & Berry, J.A. (1991) Physiological and
Environmental-Regulation of Stomatal Conductance, Photosynthesis and
Transpiration - A Model That Includes a Laminar Boundary-Layer. Agricultural
and Forest Meteorology, 54, 107-136.
Dawson, T.E., Burgess, S.S.O., Tu, K.P., Oliveira, R.S., Santiago, L.S., Fisher, J.B.,
Simonin, K.A., & Ambrose, A.R. (2007) Nighttime transpiration in woody plants
from contrasting ecosystems. Tree Physiology, 27, 561–575

111
Dolman, A.J., Gash, J.H.C., Roberts, J., & Shuttleworth, W.J. (1991) Stomatal and
surface conductance of tropical rainforest. Agricultural and Forest Meteorology, 54,
303-318.
Ehleringer, J.R. & Monson, R.K. (1993) Evolutionary and ecological aspects of
photosynthetic pathway variation. Ann. Rev. Ecol. Syst., 24, 411-439.
Felsenstein, J. (1985) Phylogenies and The Comparative Method. American Naturalist,
125, 1-15.
Gotsch, S., Geiger, E., Franco, A., Goldstein, G., Meinzer, F., & Hoffmann, W. (2010)
Allocation to leaf area and sapwood area affects water relations of co-occurring
savanna and forest trees. Oecologia, 163, 291-301.
Grace, J., Fasehun, F.E., & Dixon, M. (1980) Boundary layer conductance of the leaves
of some tropical timber trees. Plant Cell and Environment, 3, 443-450.
Graham, E.A., Mulkey, S.S., Kitajima, K., Phillips, N.G., & Wright, S.J. (2005) Cloud
cover limits net CO2 uptake and growth of a rainforest tree during tropical rainy
seasons. Proceedings National Academy of Sciences, 100, 572-576.
Granier, A., Biron, P., Bréda, N., Pontaillerj, J.-Y., & Saugierj, B. (1996) Transpiration of
trees and forest stands: short and long-term monitoring using sapflow methods.
Global Change Biology, 2, 265-274.
Groppo, J.D. (2010) Caracterização hidrológica dinâmica do nitrogênio em uma
microbacia com cobertura florestal (Mata Atlântica), no Parque Estadual da Serra
do Mar, núcleo Santa Virgínia. Doutorado, USP, Piracicaba.
Grubb, P.J. (1977) Control of forest growth and distribution on wet tropical mountains:
with Special Reference to Mineral Nutrition. Ann. Rev. Ecol. Syst., 8, 83-107.

112
Hacke, U.G., Sperry, J.S., Pockman, W.T., Davis, S.D., & Mcculloh, K.A. (2001) Trends
in wood density and structure are linked to prevention of xylem implosion by
negative pressure. Oecologia, 126, 457-461.
James, S.A., M.J. Clearwater, F.C. Meinzer and G. Goldstein. 2002. Heat dissipation
sensors of variable length for the measurement of sap flow in trees with deep
sapwood. Tree Physiol. 22:277–283.
Jarvis, P.G. & McNaughton, K.G. (1986). Stomatal control of transpiration: scaling up
from leaf to region. In Advances in Ecological Research (eds A. Macfadyen & E.D.
Ford), Vol. 15, pp. 1-49.
Kline, J.R., J.R.Martin, C.F. Jordan and J.J. Koranda. 1970. Measurement of transpiration
in tropical trees with tritiated water. Ecology 51:1068–1073.
Körner, C. (2007) The use of ‘altitude’ in ecological research. Trends in Ecology and
Evolution, 22, 569-574.
Lambers, H. & Poorter, H. (1992) Inherent variation on growth rate between higher
plants: a search for physiological causes and ecological consequences. Advances in
Ecological Research, 23, 187-260.
Leuschner, C. (2000) Are high elevations in tropical mountains arid environments for
plants? Ecology, 81, 1425-1436.
Macek, P., Mackova, J., & Bello, F.d. (2009) Morphological and ecophysiological traits
shaping altitudinal distribution of three Polylepis treeline species in the dry tropical
Andes. Acta Oecologica, 35, 778-785.
Marks, C.O. & Lechowicz, M.J. (2007) The ecological and functional correlates of
nocturnal transpiration. Tree Physiology, 27, 577-584

113
Martins, S.C. (2010) Caracterização dos solos e serapilheira ao longo do gradiente
altitudinal da Mata Atlântica, estado de São Paulo. Tese Doutorado, USP, Piracicaba,
SP.
Meinzer, F. (1993) Stomatal control of transpiration. Trends in Ecology and Evolution, 8,
289-294.
Meinzer, F.C., Goldstein, G., Jackson, P., Holbrook, N.M., Gutiérrez, M.V., & Cavelier,
J. (1995) Environmental and Physiological Regulation of Transpiration in Tropical
Forest Gap Species: The Influence of Boundary Layer and Hydraulic Properties.
Oecologia, 101, 514-522.
Meinzer, F.C., Andrade, J.L., Goldstein, G., N.M.Holbrook, Cavelier, J., & Jackson, P.
(1997) Control of transpiration from the upper canopy of a tropical forest: the role
of stomatal, boundary layer and hydraulic architecture components. Plant, Cell and
Environment, 20, 1241-1252
Meinzer, F.C., Goldstein, G., & Andrade, J.L. (2001) Regulation of water flux through
tropical forest canopy trees: Do universal rules apply? Tree Physiology, 21, 19–26.
Meinzer, F. (2003) Functional Convergence in plant responses to the environment.
Oecologia, 134, 1-11.
Motzer, T., Munz, N., Küppers, M., Schmitt, D., & Anhuf, D. (2005) Stomatal
conductance, transpiration and sap flow of tropical montane rain forest trees in the
southern Ecuadorian Andes. Tree Physiology, 25, 1283–1293.
Navarro, T., El Oualidi, J., Taleb, M., Pascual, V., Cabezudo, B., & Milla, R.n. (2010)
Leaf patterns, leaf size and ecologically related traits in high Mediterranean
mountain on the Moroccan High Atlas. Plant Ecology, 210: 275-290.

114
Nepstad, D.C., Carvalho, C., Davidson, E., Jipp, P.H., Lefebvre, P., Negreiros, G.H., da
Silva, E.D., Stone, T.A., Trumbore, S.E., & Vieira, S.A. (1994) The role of deep
roots in the hydrological and carbon cycles of Amazonian forests and pastures.
Nature, 372, 666-669.
Niinemets, Ü. (2001) Global-scale climatic controls of leaf dry mass per area density, and
thickness in trees and shrubs. Ecology, 82, 453-469.
O’Brien, J.J., Oberbauer, S.F., & Clark, D.B. (2004) Whole tree xylem sap flow
responses to multiple environmental variables in a wet tropical forest. Plant, Cell
and Environment, 27, 551–567.
Oliveira, R.S., Dawson, T.E., Burgess, S.S.O. & Nepstad, D.C. (2005) Hydraulic
distribution in three Amazonian trees. Oecologia, 145, 354-363.
Poorter, L. (2009) Leaf traits show different relationships with shade tolerance in moist
versus dry tropical forests. New Phytologist, 181, 890-900.
Rada, F., García-Núñez, C., & Ataroff, M. (2009) Leaf Gas Exchange in Canopy Species
of a Venezuelan Cloud Forest. Biotropica, 41, 659-664.
Reich, P.B., Walters, M.B., & Ellsworth, D.S. (1992) Leaf life-span in relation to leaf,
plant, and stand characteristics among diverse ecosystems. Ecological Monographs,
62(3), 365-392.
Reich, P.B., Wright, I.J., Cavender-Bares, J., Craine, J.M., Oleksyn, J., Westoby, M., &
Walters, M.B. (2003) The evolution of plant functional variation: traits, spectra and
strategies. International Journal of Plant Science, 164, 143-164.

115
Roberts, J., Cabral, O.M.R., & Aguiar, L.F.D. (1990) Stomatal and Boundary-Layer
Conductances in an Amazonian terra Firme Rain Forest. The Journal of Applied
Ecology, 27, 336-353.
Roche, P., Díaz-Burlinson, N., & Gachet, S. (2004) Congruency analysis of species
ranking on leaf traits: which traits are the more reliable? Plant Ecology, 174, 37-48.
Rosado, B.H.P., Oliveira, R.S., & Aidar, M.P.M. (2010) Is leaf water repellency related
to vapor pressure and crown exposure in tropical forests? Acta Oecologica, 36, 645-
649.
Santiago, L.S., Goldstein, G., Meinzer, F.C., Fownes, J.H., & Mueller-Dombois, D.
(2000) Transpiration and forest structure in relation to soil waterlogging in a
Hawaiian montane cloud forest. Tree Physiology, 20, 673-681
Santiago, L.S., Kitajima, K., Wright, S.J., & Mulkey, S.S. (2004) Coordinated changes in
photosynthesis, water relations and leaf nutritional traits of canopy trees along a
precipitation gradient in lowland tropical forest. Oecologia, 139, 495-502.
Scholz, F.G., Bucci, S.J., Goldstein, G., Frederick, Meinzer, C., Franco, A.C., &
Miralles-Wilhelm, F. (2008) Temporal dynamics of stem expansion and contraction
in savanna trees: withdrawal and recharge of stored water. Tree Physiology, 28,
469-480.
Schoonmaker, A.L., Hacke, U.G., Landhäusser, S.M., Lieffers, V.J., & Tyree, M.T.
(2010). Hydraulic acclimation to shading in boreal conifers of varying shade
tolerance. Plant, Cell & Environment, 33, 382-393.

116
Sellers, P.J., Berry, J.A., Collatz, G.J., Field, C.B., & Hall, F.G. (1992) Canopy
reflectance, photosynthesis and transpiration. III. A reanalysis using improved leaf
models and a new canopy integration scheme. Remote Sens Environ, 42, 187-296.
Sellin, A. & Kupper, P. (2006) Spatial variation in sapwood area to leaf area ratio and
specific leaf area within a crown of silver birch. Trees, 20, 311–319.
Snyder, K.A., James, J.J., Richards, J.H., & Donovan, L.A. (2008) Does hydraulic lift or
nighttime transpiration facilitate nitrogen acquisition? Plant and Soil, 306, 159-166.
Sperry, J.S., Hacke, U.G., Oren, R., & Comstock, J.P. (2002) Water deficits and
hydraulic limits to leaf water supply. Plant Cell and Environment, 25, 251-263.
Velázquez-Rosas, N. Meave, J., & Vazquez-Santana, S. (2002) Elevational Variation of
Leaf Traits in Montane Rain Forest Tree Species at La Chinantla, Southern
Mexico. Biotropica, 34, 534-546.
Westoby, M., Falser, D.S., Moles, A.T., Wesk, P.A., & Wright, I.J. (2002) Plant
ecological strategies: some leading dimensions of variaton between species. Ann.
Rev. Ecol. Syst., 33, 125-159.
Williams, K., Field, C.B., & Mooney, H.A. (1989) Relationships among leaf construction
cost, leaf longevity, and light environment in rain-forest plants of the genus Piper.
American Naturalist, 133, 198-211.
Witkowski, E.T.F. & Lamont, B.B. (1991) Leaf specific mass confounds leaf density and
thickness. Oecologia, 88, 486-493.
Wright, I.J., Reich, P., Westoby, M., Ackerly, D., Baruch, Z., Bongers, F., Cavender-
Bares, J., Chapin, T., Cornelissen, J.H.C., Diemer, M., Flexas, J., Garnier, E.,
Groom, P.H., Gulias, J., Hikosaka, K., Lamont, B., Lee, T., Lusk, C., Midgley, J.J.,

117
Laure-Navas, M., Niinemets, Ü., Oleksyn, J., Osada, N., Poorter, H., Poot, P., Prior,
L., Pyankov, V., Roumet, C., Thomas, S.C., Tjoelker, M.G., Veneklaas, E.J., &
Villar, R. (2004) The world wide leaf economics spectrum. Nature, 428, 821-827.
Wright, I.J., Falster, D.S., Pickup, M., & Westoby, M. (2006) Cross-species patterns in
the coordination between leaf and stem traits and their implications for plant
hydraulics. Physiologia Plantarum, 127, 445-456.
Wright, I.J., Ackerly, D.D., Bongers, F., Harms, K.E., Ibarra-Manriquez, G., Martinez-
Ramos, M., Mazer, S.J., Muller-Landau, H.C., Paz, H., Nigel C. A. Pitman ,
Poorter, L., Silman, M.R., Vriesendorp, C., Webb, C.O., Westoby, M., & Wright,
S.J. (2007) Relationships Among Ecologically Important Dimensions of Plant Trait
Variation in Seven Neotropical Forests. Annals of Botany, 99, 1003-1015.
Xu, Y.L. & Cohen, S. (2005) Long-term hydraulic acclimation to soil texture and
radiation load in cotton. Plant Cell and Environment, 28, 492-499.
Zeppel, M.J.B., Murray, B.R., Barton, C., & Eamus, D. (2004) Seasonal responses of
xylem sap velocity to VPD and solar radiation during drought in a stand of native
trees in temperate Australia. Functional Plant Biology, 31, 461-470.
Zotz, G., Tyree, M.T., Patiño, S. & Carlton, M.R. 1998. Hydraulic architecture and water
use of selected species from a lower montane forest in Panama. Trees 12:302–309.
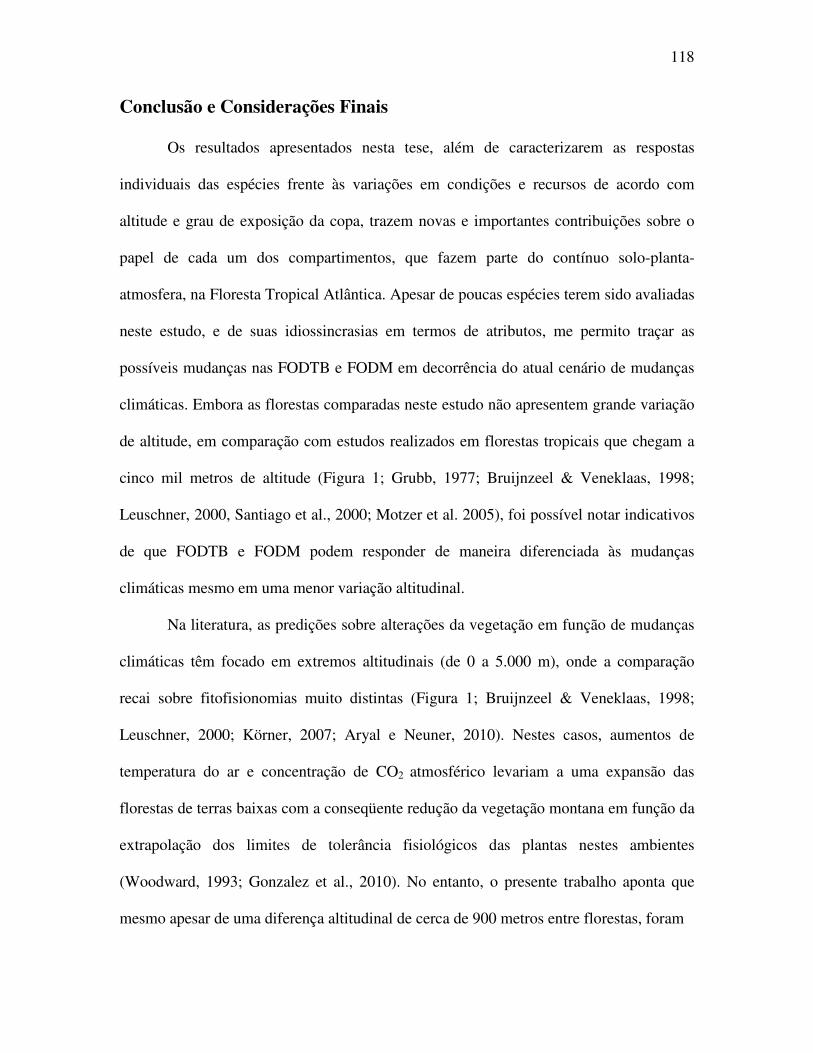
118
Conclusão e Considerações Finais
Os resultados apresentados nesta tese, além de caracterizarem as respostas
individuais das espécies frente às variações em condições e recursos de acordo com
altitude e grau de exposição da copa, trazem novas e importantes contribuições sobre o
papel de cada um dos compartimentos, que fazem parte do contínuo solo-planta-
atmosfera, na Floresta Tropical Atlântica. Apesar de poucas espécies terem sido avaliadas
neste estudo, e de suas idiossincrasias em termos de atributos, me permito traçar as
possíveis mudanças nas FODTB e FODM em decorrência do atual cenário de mudanças
climáticas. Embora as florestas comparadas neste estudo não apresentem grande variação
de altitude, em comparação com estudos realizados em florestas tropicais que chegam a
cinco mil metros de altitude (Figura 1; Grubb, 1977; Bruijnzeel & Veneklaas, 1998;
Leuschner, 2000, Santiago et al., 2000; Motzer et al. 2005), foi possível notar indicativos
de que FODTB e FODM podem responder de maneira diferenciada às mudanças
climáticas mesmo em uma menor variação altitudinal.
Na literatura, as predições sobre alterações da vegetação em função de mudanças
climáticas têm focado em extremos altitudinais (de 0 a 5.000 m), onde a comparação
recai sobre fitofisionomias muito distintas (Figura 1; Bruijnzeel & Veneklaas, 1998;
Leuschner, 2000; Körner, 2007; Aryal e Neuner, 2010). Nestes casos, aumentos de
temperatura do ar e concentração de CO2 atmosférico levariam a uma expansão das
florestas de terras baixas com a conseqüente redução da vegetação montana em função da
extrapolação dos limites de tolerância fisiológicos das plantas nestes ambientes
(Woodward, 1993; Gonzalez et al., 2010). No entanto, o presente trabalho aponta que
mesmo apesar de uma diferença altitudinal de cerca de 900 metros entre florestas, foram
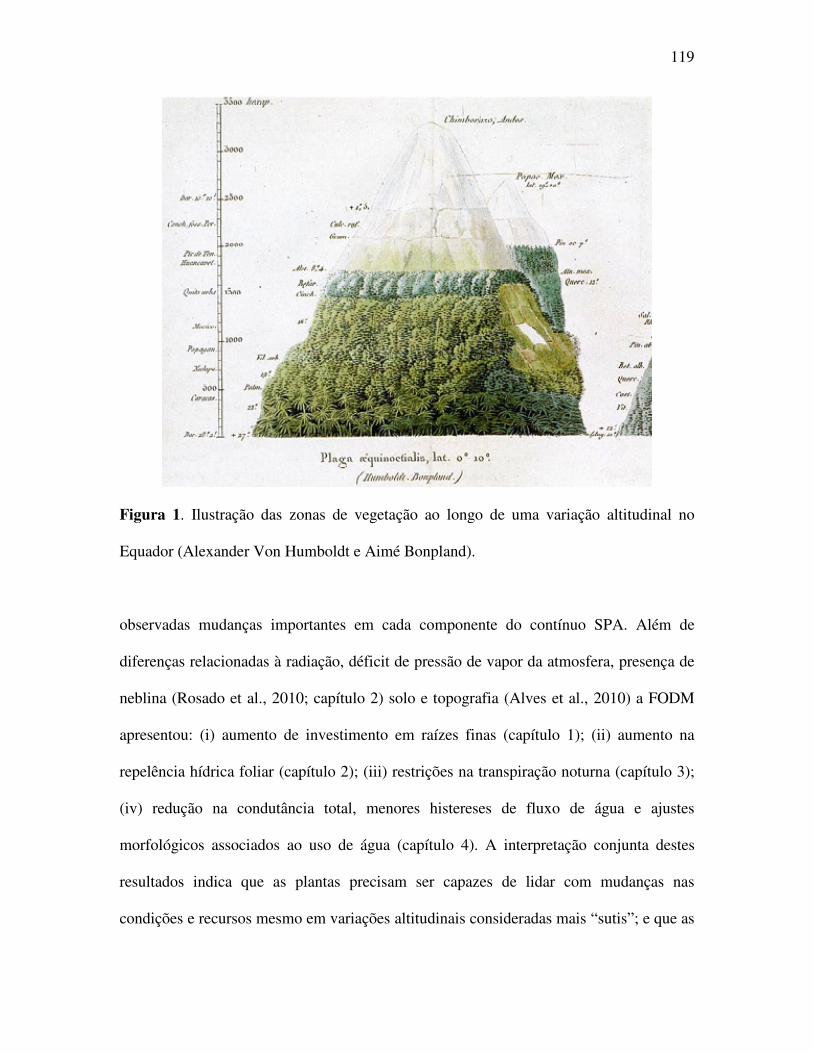
119
Figura 1. Ilustração das zonas de vegetação ao longo de uma variação altitudinal no
Equador (Alexander Von Humboldt e Aimé Bonpland).
observadas mudanças importantes em cada componente do contínuo SPA. Além de
diferenças relacionadas à radiação, déficit de pressão de vapor da atmosfera, presença de
neblina (Rosado et al., 2010; capítulo 2) solo e topografia (Alves et al., 2010) a FODM
apresentou: (i) aumento de investimento em raízes finas (capítulo 1); (ii) aumento na
repelência hídrica foliar (capítulo 2); (iii) restrições na transpiração noturna (capítulo 3);
(iv) redução na condutância total, menores histereses de fluxo de água e ajustes
morfológicos associados ao uso de água (capítulo 4). A interpretação conjunta destes
resultados indica que as plantas precisam ser capazes de lidar com mudanças nas
condições e recursos mesmo em variações altitudinais consideradas mais “sutis”; e que as

120
duas florestas diferem não apenas em termos de estrutura (Alves et al. 2010), mas
também em termos funcionais no que tange as relações hídricas.
Ainda no contexto de mudanças climáticas, o fato da água também ser
considerada como fator limitante mesmo em uma floresta tropical chuvosa, especialmente
na FODM, traz à tona algumas reflexões acerca das predições sobre respostas das plantas
frente ao aumento na concentração de CO2 atmosférico. Tais predições indicam que uma
maior concentração de CO2 levaria a expansão das florestas em função de aumentos na
biomassa vegetal causados por maiores taxas fotossintéticas (Woodward, 1993; Phillips
et al., 1998; Körner, 2006; Storck et al. 2007). Embora maiores concentrações de CO2
possam levar a maiores taxas fotossintéticas, há o efeito contrário de promoverem
reduções na condutância estomática (Field & Jackson, 1995; Ainsworth & Rogers, 2007;
Stork et al. 2007; Peñuelas et al., no prelo). Este antagonismo em função da maior
disponibilidade de CO2 pode ser explicado a partir do modelo de Cowan & Farquhar
(1977) no qual a condutância estomática é produto de uma maximização da eficiência no
uso da água em termos da assimilação de CO2. Embora diminuições na condutância
estomática tragam o beneficio de aumentar a eficiência no uso da água em curto prazo
(Peñuelas et al., no prelo), podem ocorrer aumentos no índice de área foliar das espécies
como mecanismo compensatório (Field & Jackson, 1995), o que nos leva a um cenário
alarmante quando avaliamos esta questão em níveis hierárquicos superiores.
Menores condutâncias estomáticas têm, como conseqüência direta, reduções na
evapotranspiração dos ecossistemas (Dolman et al., 1991; Field & Jackson, 1995; Stork et
al., 2007), fazendo com que, a longo prazo, a disponibilidade de água diminua devido a
reduções na precipitação (Field & Jackson, 1995; Stork et al., 2007). Adicionalmente,

121
maiores índices de área foliar, implicando em maior superfície de demanda evaporativa
(Meinzer, 2003; Field & Jackson, 1995; Gotsch et al. 2010), e aumento da temperatura,
aumentando a foto-respiração e diminuindo a eficiência no uso da água (Nobel, 1999;
Saxe et al., 2001), levam a um cenário de perda de espécies mais suscetíveis ao aumento
de deficiência hídrica decorrente do aumento na concentração de CO2 atmosférico (Field
& Jackson, 1995; Saxe et al., 2001).
Baseado nos resultados de que a FODM já apresenta maiores sinais de deficiência
hídrica e no cenário exposto acima, sugiro que os aumentos na concentração de CO2
atmosférico levará a uma maior freqüência, intensidade e duração dos eventos de seca
será maior na FODM, levando a uma maior perda de espécies e conseqüente redução na
magnitude de processos ecossistêmicos (Chapin et al., 2000). Considerando ainda, a
maior radiação solar na FODM associada a menores condutâncias estomáticas, podem
ocorrer danos severos ao aparato fotossintético das plantas devido ao excesso de energia
radiante levando ao estresse luminoso (Walker, 1992; Demmig-Adams & Adams, 2006).
Em termos de estrutura populacional, existem indicativos de que eventos de seca
levariam à morte as árvores maiores primeiro devido a limitações hidráulicas (Ryan et al.,
2006; Phillips et al., 2010). Porém, também devido a diferenças espécie-específicas, não
há consenso se a mortalidade devido à seca seria tamanho-dependente, além do fato de
que seus efeitos sobre a demografia podem durar cerca de dois anos (Phillips et al.,
2010).
Independentemente do efeito da seca sobre a estrutura populacional das espécies,
a resultante final da susceptibilidade de uma dada espécie à seca seria uma redução no
padrão de distribuição espacial (Engelbrecht et al., 2005). Em estudo publicado

122
recentemente, Colombo e & Joly (2010) avaliaram, através de modelagem, alterações nas
distribuições de 38 espécies da Mata Atlântica em função de diferentes cenários de
aumento de temperatura esperados para o ano de 2050. Dentre as espécies estudadas por
Colombo & Joly (2010), estão Hyeronima alchorneioides, Alchornea triplinervia e
Mollinedia schottiana. Nesta modelagem, Mollinedia schottiana apresenta uma das
maiores reduções em sua atual distribuição (59,88%) no cenário pessimista de aumento
de 1% de CO2 e ≥4 oC de temperatura projetado pelo Painel Intergovernamental sobre
Mudanças Climáticas (IPCC, 2007) (Colombo & Joly, 2010). Esta predição reforça os
resultados desta tese que apontam Mollinedia schottiana como espécie mais suscetível à
seca quando comparada a Hyeronima alchorneioides e Alchornea triplinervia. Isto
reforça o fato de que a maior robustez destes modelos será alcançada a partir da inclusão
de dados sobre ecologia funcional e interações com outras espécies.
Finalmente, os resultados desta tese trazem novas e importantes contribuições
sobre o contínuo solo-planta-atmosfera, na Floresta Tropical Atlântica. As conclusões
aqui apresentadas indicam a importância de ajustes associados ao uso da água e indicam
que luz e nutrientes não podem ser considerados como os únicos importantes fatores
abióticos que estruturam estes ambientes. Contudo, mesmo que as conclusões desta tese
tragam importantes contribuições para o entendimento do funcionamento da Floresta
Ombrófila Densa Atlântica, ainda não é fácil saber qual é a figura final do complexo
quebra-cabeça que estamos montando. Se um dia saberemos, é difícil prever, mas o certo
é que continuaremos a busca por este entendimento da mesma forma que, assim como
Plínio O Velho, temos feito desde a antiguidade.
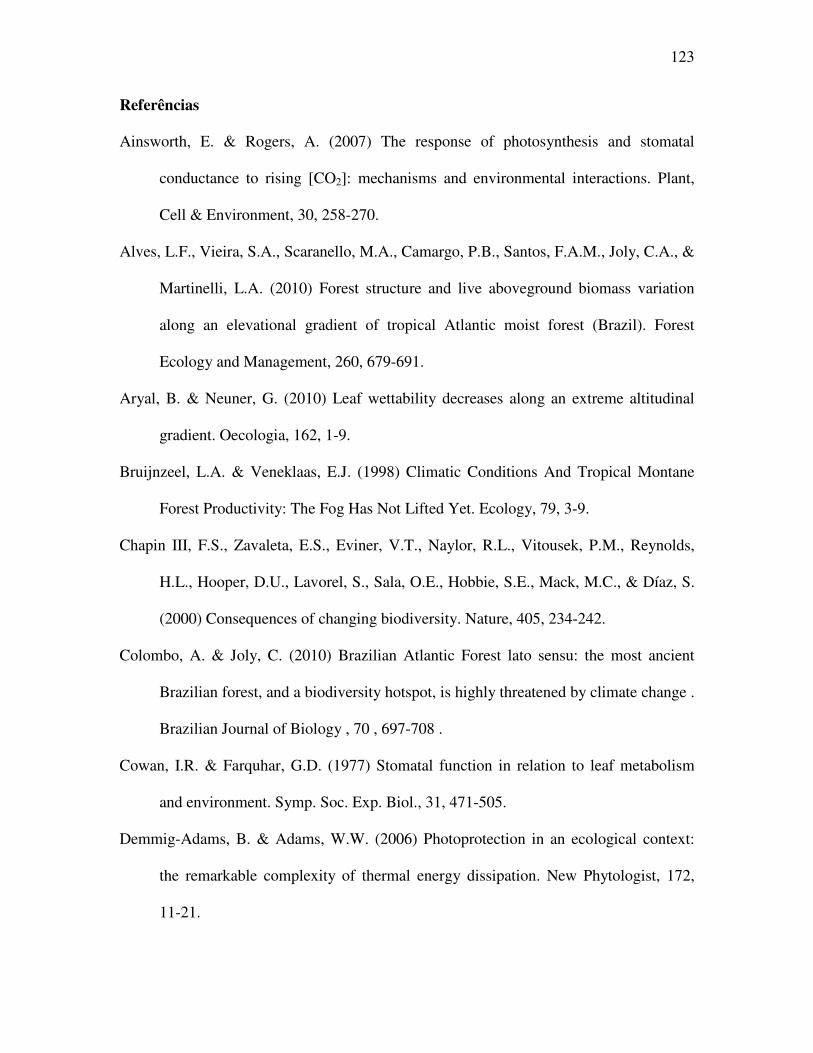
123
Referências
Ainsworth, E. & Rogers, A. (2007) The response of photosynthesis and stomatal
conductance to rising [CO2]: mechanisms and environmental interactions. Plant,
Cell & Environment, 30, 258-270.
Alves, L.F., Vieira, S.A., Scaranello, M.A., Camargo, P.B., Santos, F.A.M., Joly, C.A., &
Martinelli, L.A. (2010) Forest structure and live aboveground biomass variation
along an elevational gradient of tropical Atlantic moist forest (Brazil). Forest
Ecology and Management, 260, 679-691.
Aryal, B. & Neuner, G. (2010) Leaf wettability decreases along an extreme altitudinal
gradient. Oecologia, 162, 1-9.
Bruijnzeel, L.A. & Veneklaas, E.J. (1998) Climatic Conditions And Tropical Montane
Forest Productivity: The Fog Has Not Lifted Yet. Ecology, 79, 3-9.
Chapin III, F.S., Zavaleta, E.S., Eviner, V.T., Naylor, R.L., Vitousek, P.M., Reynolds,
H.L., Hooper, D.U., Lavorel, S., Sala, O.E., Hobbie, S.E., Mack, M.C., & Díaz, S.
(2000) Consequences of changing biodiversity. Nature, 405, 234-242.
Colombo, A. & Joly, C. (2010) Brazilian Atlantic Forest lato sensu: the most ancient
Brazilian forest, and a biodiversity hotspot, is highly threatened by climate change .
Brazilian Journal of Biology , 70 , 697-708 .
Cowan, I.R. & Farquhar, G.D. (1977) Stomatal function in relation to leaf metabolism
and environment. Symp. Soc. Exp. Biol., 31, 471-505.
Demmig-Adams, B. & Adams, W.W. (2006) Photoprotection in an ecological context:
the remarkable complexity of thermal energy dissipation. New Phytologist, 172,
11-21.

124
Dolman, A.J., Gash, J.H.C., Roberts, J., & Shuttleworth, W.J. (1991) Stomatal and
surface conductance of tropical rainforest. Agricultural and Forest Meteorology,
54, 303-318.
Engelbrecht, B., Kursar, T., & Tyree, M. (2005) Drought effects on seedling survival in a
tropical moist forest. Trees, 19, 312-321.
Field, D.C., Jackson, R.B., & Mooney, H.A. (1995) Stomatal responses to increased CO2:
implications from the plant to the global scale. Plant, Cell & Environment, 18,
1214-1225.
Gonzalez, P., Neilson, R.P., Lenihan, J.M., & Drapek, R.J. (2010) Global patterns in the
vulnerability of ecosystems to vegetation shifts due to climate change. Global
Ecology and Biogeography, 19, 755-768.
Gotsch, S., Geiger, E., Franco, A., Goldstein, G., Meinzer, F., & Hoffmann, W. (2010)
Allocation to leaf area and sapwood area affects water relations of co-occurring
savanna and forest trees. Oecologia, 163, 291-301.
Grubb, P.J. (1977) Control of forest growth and distribution on wet tropical mountains:
with Special Reference to Mineral Nutrition. Ann. Rev. Ecol. Syst., 8, 83-107.
IPCC (2007). International Panel on Climate Change. Climate change 2007: Mitigation -
Contribution of Working group III to the Fourth Assessment Report of the
Intergovernmental Panel on Climate Change. Cambridge University Press.,
Cambridge.
Körner, C. (2006) Plant CO2 responses: an issue of definition, time and resource supply.
New Phytologist, 172, 393-411.

125
Körner, C. (2007) The use of ‘altitude’ in ecological research. Trends in Ecology and
Evolution, 22, 569-574.
Leuschner, C. (2000) Are High Elevations In Tropical Mountains Arid Environments For
Plants? Ecology, 81, 1425-1436.
Meinzer, F. (2003) Functional Convergence in plant responses to the environment.
Oecologia, 134, 1-11.
Motzer, T., Munz, N., Küppers, M., Schmitt, D., & Anhuf, D. (2005) Stomatal
conductance, transpiration and sap flow of tropical montane rain forest trees in the
southern Ecuadorian Andes. Tree Physiology, 25, 1283–1293.
Nobel, P. (1999) Physiochemical & Environmental Plant Physiology, 2 edn. Academic
Press, San Diego, California.
Peñuelas, J., Canadell, J.G., & Ogaya, R. Increased water-use efficiency during the 20th
century did not translate into enhanced tree growth. Global Ecology and
Biogeography. no prelo.
Phillips O. L.,Malhi Y., Higuchi N. et al. (1998) Changes in the carbon balance of
tropical forest: evidence from long-term plots. Science 282, 439–42.
Phillips, O.L., van der Heijden, G., Lewis, S.L., López-González, G., Aragão, L.E.O.C.,
Lloyd, J., Malhi, Y., Monteagudo, A., Almeida, S., Dávila, E.A., Amaral, I.,
Andelman, S., Andrade, A., Arroyo, L., Aymard, G., Baker, T.R., Blanc, L., Bonal,
D., de Oliveira, Á.C.A., Chao, K.-J., Cardozo, N.D., da Costa, L., Feldpausch,
T.R., Fisher, J.B., Fyllas, N.M., Freitas, M.A., Galbraith, D., Gloor, E., Higuchi,
N., Honorio, E., Jiménez, E., Keeling, H., Killeen, T.J., Lovett, J.C., Meir, P.,
Mendoza, C., Morel, A., Vargas, P.N., Patiño, S., Peh, K.S.-H., Cruz, A.P., Prieto,

126
A., Quesada, C.A., Ramírez, F., Ramírez, H., Rudas, A., Salamão, R., Schwarz, M.,
Silva, J., Silveira, M., Ferry Slik, J.W., Sonké, B., Thomas, A.S., Stropp, J., Taplin,
J.R.D., Vásquez, R., & Vilanova, E. (2010) Drought mortality relationships for
tropical forests. New Phytologist, 187, 631-646.
Ryan, M.G., Phillips, N., & Bond, B.J. (2006) The hydraulic limitation hypothesis
revisited. Plant, Cell & Environment, 29, 367–381.
Rosado, B.H.P., Oliveira, R.S., & Aidar, M.P.M. (2010) Is leaf water repellency related
to vapor pressure and crown exposure in tropical forests? Acta Oecologica, 36,
645-649.
Santiago, L.S., Goldstein, G., Meinzer, F.C., Fownes, J.H., & Mueller-Dombois, D.
(2000) Transpiration and forest structure in relation to soil waterlogging in a
Hawaiian montane cloud forest. Tree Physiology, 20, 673-681.
Saxe, H., Cannell, M.G.R., Johnsen, Ø., Ryan, M.G., & Vourlitis, G. (2001) Tree and
forest functioning in response to global warming. New Phytologist, 149, 369-400.
Stork, N.E., Balston, J., Farquhar, G.D., Franks, P.J., Holtum, J.A.M., & Liddell, M.J.
(2007) Tropical rainforest canopies and climate change. Austral Ecology, 32, 105-
112.
Walker, D. (1992) Excited leaves. New Phytologist, 121, 325-345.
Woodward, F.I. (1993) The lowland-to-upland transition - modelling plant responses to
evironmental change. Ecological Applications, 3, 404-408.


![Liver Transplantation outcome prediction - A …...Despite significant improvements over the years in the results of liver transplantation (LT) [1], primary graft dysfunction (PGD)](https://img.document.onl/doc/110x75/5f9bbaccdc4bd5770f3bedfd/liver-transplantation-outcome-prediction-a-despite-significant-improvements.jpg)