Embed Size (px)
Citation preview
UNIVERSIDADE FEDERAL DO PARANÁ
VIVIANE DESLANDES DO NASCIMENTO
A EVOLUÇÃO DO CANTO EM AVES: INTEGRANDO MORFOLOGIA, FILOGENIA
E AMBIENTE.
CURITIBA
2014

VIVIANE DESLANDES DO NASCIMENTO
A EVOLUÇÃO DO CANTO EM AVES: INTEGRANDO MORFOLOGIA, FILOGENIA
E AMBIENTE
Tese apresentada como requisito
parcial à obtenção do grau de Doutor em
Ecologia, no Curso de Pós-Graduação em
Ecologia e Conservação, Setor de Ciências Biológicas, da
Universidade Federal do Paraná.
Orientador: Prof. Dr. Marcio R. Pie
CURITIBA
2014
i
AGRADECIMENTOS
A toda a minha família pelo apoio incondicional às minhas escolhas desde sempre e
a lista de nomes é tão grande que infelizmente não posso incluir aqui.
Ao meu orientador, Dr. Marcio R. Pie pelo incentivo, exigência, paciência, amizade
e conversas interessantes sobre ciência, educação infantil, literatura e assuntos aleatórios.
Obrigada por ter acreditado no meu potencial e ter possibilitado essa grande oportunidade
de aprendizado e amadurecimento durante esses anos juntos.
Aos colegas e amigos do Pielab pela companhia, cafés na cantina, risadas e troca de
experiências, especialmente à Gabriela Decker, Carina. R. Firkowski, Diego Bilski e
Pollyana P. Costa por estarem sempre presentes e prontos a ajudar em todos os momentos.
A todos os meus amigos, os recentes e de longa data, pelo companheirismo nas
horas alegres e nas mais difíceis especialmente à Thais R. Costa por ter me ensinado muita
coisa sobre bebês, truques no Excel e Arcgis; à Karlla Barbosa pelas medições de peles no
United States National Museum (USNM); à Carolina Bernardes e Vitor de Q. Piacentini
pela amizade e hospedagem durante minhas visitas ao MZUSP; à Wagner Chrissante pela
amizade e ajuda com ilustrações sempre que preciso.
Ao pessoal do Cornell Lab of Ornithology: Dr. Michael Webster e seus alunos pela
excelente recepção durante os quatro meses de estágio sanduíche em seu laboratório; à
Gregory F. Budney pelas conversas agradáveis sobre ornitologia, livros e dicas sobre
equipamentos; à Matthew D. Medler pela eficiência e prontidão em selecionar milhares de
gravações; à Ann Warde , Russ Chariff e Nick Mason pelas discussões frutíferas sobre
análises bioacústicas; aos meus housemates em Ithaca: Justin Proctor, Sophia Orzechowski,
Tim Salzman e Maya Wilson pela companhia e ajuda em tudo que precisei e aos demais
colegas que me proporcionaram essa experiência de aprendizado tão enriquecedora durante
a estadia em Ithaca.
Às coleções biológicas e bioacústicas e seus curadores sem os quais este estudo não
seria possível: Instituto de Investigación de Recursos Biológicos Alexander Von Humboldt
(Colômbia), Acervo Neotropical Elias Coelho (Universidade Federal do Rio de Janeiro,
Brazil), Macaulay Library (Cornell University, EUA), XENO-CANTO database, Museu de
Zoologia da USP (MZUSP), American Museum of Natural History (AMNH), Cornell
University Museum of Vertebrates (CUMV) e United States National Museum (USNM). À

ii
Jeremy Minns e Christian Borges Andretti por disponibilizarem gravações de suas coleções
pessoais para este estudo.
Ao Dr. Jeffrey Podos pela ajuda com as análises do capítulo 3.
À CAPES pela bolsa durante esses quatro anos e pelos cinco meses de doutorado
sanduíche sem os quais esse doutorado não seria possível.
Aos professores que aceitaram o convite para a banca de defesa desta tese: Dr.
Mauricio O. Moura, Dra Lilian Manica, Dr. Sidney F. Gouveia, Dr. Gonçalo Ferraz e Dr.
Ricardo Belmonte Lopes.
À Fernando Maia Silva Dias pelo grande incentivo para que eu começasse essa
jornada e pelo apoio incondicional e companheirismo em todos os momentos dela.
Finalmente, à Alice Deslandes Dias, minha amada filha, por resignificar minha vida
no final deste período e a todos aqueles que brincaram e cuidaram dela com tanto carinho
enquanto eu redigia a tese, especialmente meu companheiro Fernando Maia Silva Dias,
meus pais Christina M. S. Souza e João Ribeiro do Nascimento, meus irmãos Adriana
Deslandes Nascimento e Rafael Deslandes Nascimento, meus cunhados Elaine Melo e
Wagner Chrissante, minha sogra Silvania Maia Silva Dias e minha amiga Gabriela Decker.
Sem vocês certamente essa tese não seria concluída!

iii
SUMÁRIO
LISTA DE FIGURAS ............................................................................................................... iv
LISTA DE TABELAS ............................................................................................................... vii
RESUMO .................................................................................................................................... ix
ABSTRACT ............................................................................................................................... xii
1. INTRODUÇÃO GERAL ........................................................................................................ 1
2. OBJETIVO GERAL ............................................................................................................... 5
2.1 OBJETIVOS ESPECÍFICOS .......................................................................................... 5
3. REFERÊNCIAS ...................................................................................................................... 6
4. ARTIGO I. “A macroecological test of the acoustic adaptation hypothesis” .................. 12
4.1 ABSTRACT ......................................................................................................................... 14
4.2 INTRODUCTION ................................................................................................................. 15
4.3 METHODS ........................................................................................................................... 17
4.4 RESULTS ............................................................................................................................. 20
4.5 DISCUSSION ....................................................................................................................... 21
4.6 REFERENCES ...................................................................................................................... 25
5. ARTIGO II. “Testing alternative models of bird song evolution” ................................... 45
5.1 ABSTRACT .......................................................................................................................... 47
5.2 BACKGROUND ................................................................................................................... 48
5.3 METHODS ........................................................................................................................... 49
5.4 RESULTS ............................................................................................................................. 52
5.5 DISCUSSION ....................................................................................................................... 53
5.6 REFERENCES ...................................................................................................................... 56
6. ARTIGO III. “Morphological constraints in song structure: a comparison between oscine
and suboscine birds” ................................................................................................................. 68
6.1 ABSTRACT .......................................................................................................................... 70
6.2. INTRODUCTION ................................................................................................................ 72
6.3 METHODS ........................................................................................................................... 74
6.4 RESULTS ............................................................................................................................. 78
6.5 DISCUSSION ....................................................................................................................... 80
6.6 REFERENCES ...................................................................................................................... 84
7. CONCLUSÃO GERAL ........................................................................................................ 97
iv
LISTA DE FIGURAS
Artigo I. A macroecological test of the acoustic adaptation hypothesis.
Figura 1. Thamnophilidae song variables affected by NDVI. (a): Residuals of peak
frequency vs. richness; (b): Residuals of maximum frequency vs. richness; (c): Residuals of
minimum frequency vs. richness; (d): NDVI based on average of values calculated per
species present in each cell using the interpolation method (see Methods). All these
frequency variables showed an inverse relation with NDVI, according with specific
predictions of AAH of lower frequency values associated to closed vegetation (or high
NDVI values). ................................................................................................................. .36
Figura 2. Tyrannidae song variable affected by Normalized Difference Vegetation Index
(NDVI). (a): Residuals of Maximum frequency vs. richness; (b): NDVI based on average of
values calculated per species present in each cell using the interpolation method (see
Methods). The lowest residual values to maximum frequency (a) were associated to highest
NDVI values (b), confirming the AAH predictions related to frequency song parameters.
......................................................................................................................................... 37
Figura 3. Pipridae song variables affected by Normalized Difference Vegetation Index
(NDVI). (a): Residuals of peak frequency vs. richness; (b): Residuals of maximum
frequency vs. richness; (c): Residuals of frequency bandwidth vs. richness; (d): NDVI
based on average of values calculated per species present in each cell using the
interpolation method (see Methods). Contrasting with AAH predictions there is a positive
relation between frequency variables and NDVI, with lower frequency values associated to
more open vegetation (lower NDVI values). .................................................................. 38
Figura 4. Turdidae song variables affected by Normalized Difference Vegetation Index
(NDVI). (a): Residuals of peak frequency vs richness; (b): Residuals of minimum
frequency vs richness; (c): NDVI based on average of values calculated per species present
in each cell using the interpolation method (see Methods). As in Pipridae songs, lower
frequency values were positively associated to lower NDVI values, indicating the opposite
pattern that expected by AAH. ........................................................................................ 39
v
Artigo II. Testing alternative models of birdsong evolution.
Figura 1. Spectrogram illustrating seven quantitative song measurements used in the
present study. SD: song duration (s), the duration from the beginning of the first element
(note) to the end of the last element in the song; (NN): number of elements (notes) detected
within the song; ER: element rate (s), the average duration of elements (notes) within a
song; Fmax: Maximum frequency (kHz), the highest frequency across the entire song;
Fmin: Minimum frequency (kHz), the lowest frequency across the entire song; FB:
Frequency Bandwidth (KHz), the range in frequency values within a song. NDN: Number
of different notes types found within a phrase. This spectrogram shows three different notes
types signed by “a”, “b” and “c”. PF: Peak frequency also was measured but was omitted
here because it is impossible visually to determine in which pixel within a spectrogram
represent the higher sound energy, which characterizes peak frequency. ....................... 62
Artigo III. Morphological constraints in song structure: a comparison between oscine and
suboscine birds.
Figura 1. Beak morphology and representative song spectrograms of five selected species
of the studied families (a): Thamnophilidae; (b): Tyrannidae; (c): Pipridae; (d): Parulidae
and (e): Turdidae. (f): Beak measurements; (f1): length of exposed culmen (LEC); (f2):
length of beak from gape (LBG); (f3): height beak at nostrils (HB); (f4): width of beak
(WB) ................................................................................................................................ 88
Figura 2. Upper bound scatterplots of frequency bandwidth and song rate of the five studied
families. Song rate is the number of notes divided by song duration. Scatterplots at right
show upper bound regressions using bins of 1Hz in song rate while scatterplots at left show
upper bound regressions using bins of 2 Hz. (a) Thamnophilidae (1 Hz): -34.15x +
3850.58, R2=0.085, P=0.140; (b) Thamnophilidae (2 Hz): -64.27x + 4743.62, R
2=0.327,
P=0.025; (c) Tyrannidae (1 Hz): -25.59x + 5933.70, R2= 0.034, P=0.250; (d) Tyrannidae (2
Hz): -38.12x + 6760.47, R2=0.086, P=0.184; (e) Pipridae (1 Hz): -91.33x + 5905.62,
R2=0.473, P=0.000; (f) Pipridae (2 Hz): -115.83 + 6750.06, R
2=0.678, P=0.000; (g)
Parulidae (1 Hz): -16.82x + 6309.48, R2=0.023, P=0.381; (h) Parulidae(2 Hz): -21.36x +
vi
6870.90, R2=0.060, P=0.326; (i) Turdidae (1 Hz): -209.9x + 7697.3, R
2=0.182, P=0.165; (j)
Turdidae (2 Hz):-338.5x + 9390, R2=0.654, P=0.051 ..................................................... 89
Figura 3. Quantile regression using τ =0.90 on the original data of the five studied families.
(a): Thamnophilidae; (b): Tyrannidae, (c): Pipridae; (d): Parulidae and (e): Turdidae. All
families showed a strong positive relation between frequency bandwidth (Hz) and song rate
(Hz), only in Pipridae this relation was insignificant ...................................................... 90
vii
LISTA DE TABELAS
Artigo I. A macroecological test of the acoustic adaptation hypothesis.
Table 1. Summary of sampling effort for each sampled bird family .............................. 40
Table 2. Proportional contributions of spatial (φ), phylogenetic (λ), and independent (λ’)
effects on variation in song characteristics of different bird families ............................. 41
Table 3. Results from generalized least squares analyses on the relationship between song
acoustic properties and the average normalized difference vegetation index (NDVI) of the
corresponding species for different bird families ............................................................ 43
Artigo II. Testing alternative models of birdsong evolution.
Table 1. Number of species and recordings per family with mean and standard deviation of
each song trait analysed in this study .............................................................................. 64
Table 2. Principal component analysis with correlation matrix on song traits of the five
studied families ................................................................................................................ 65
Table 3. Fit of the models of evolution on principal components of the songs traits, of five
studied families. WN: White Noise, BM: Brownian motion, OU: Ornstein-Uhlenbeck, and
EB: Early burst. Numbers in bold indicate the preferred model (with the lowest AICc). See
text for details .................................................................................................................. 66
Artigo III. Morphological constraints in song structure: a comparison between oscine and
suboscine birds
Table 1. Number of species and recordings per family to which there is phylogenetic and
morphological data associated in this study. NS: number of species; NR: number of
recordings; MNRS: mean and range of the number of recordings per species ............... 91
Table 2. Principal component analysis on the logarithmized average of the beak measures
of the five studied families. Length of exposed culmen (LEC); Length from beak to gape
(LBG); Height beak at nostrils (HB) and width of the beak (WB) ................................ 92
viii
Table 3. Quantile regression between frequency bandwidth (FB) and song rate (SR) using τ
= 0.90. All families show significant and positive relation between these variables, with
exception of Pipridae ....................................................................................................... 93
Table 4. Phylogenetic generalized least squares of the frequency bandwidth and song rate
and PC beak and log of body mass to the five studied families. Only the models with lowest
AIC values are shown (all models are available in Table S2 in supplementar material). The
models with interaction between beak and body mass were the best fit between all models
in all families ................................................................................................................... 94
Table S1. Logarithmized average of the beak measures and body mass to all species
included in this study ....................................................................................................... 98
Table S2. Phylogenetic Generalized Least Square (PGLS) models. Model 1: FB ~ PCbeak
+ logMASS; Model 2: FB ~ PCbeak; Model 3: FB ~ PCbeak * logMASS; Model 4: SR ~
PCbeak + logMASS; Model 5: SR ~ PCbeak; Model 6: SR ~ PCbeak * logMASS.
FB: Frequency bandwidth; PCbeak: Principal Component from beak measurements;
logMASS: log of the mean of body mass; SR: song rate (number of notes divided by song
duration) ........................................................................................................................ 106
ix
RESUMO GERAL
A comunicação acústica tem sido um marco na evolução das aves. Estudos sobre evolução
do canto geralmente levantam o papel das características morfológicas influenciando o
aparato de produção do canto, estrutura do habitat causando barreiras à transmissão do
canto, partilha de nicho acústico para evitar sobreposição de sinais entre espécies e deriva
cultural durante o processo de aprendizagem. O aumento na disponibilidade de informações
sobre a relação filogenética entre espécies, informações ecológicas e a disponibilidade de
gravações de alta qualidade permite investigar como estes fatores contribuem para moldar o
canto dentro de uma perspectiva macroecológica. Neste estudo foram utilizados métodos
filogenéticos comparativos e estatística espacial a fim de testar hipóteses clássicas de
limitação (ambiental e morfológica) sobre a estrutura do canto de aves suboscines (famílias
Thamnophilidae, Tyrannidae e Pipridae) e oscines (famílias Parulidae e Turdidae). No
primeiro capítulo nós testamos a Hipótese de Adaptação Acústica (HAA) (limitação
ambiental) em uma ampla escala utilizando uma medida quantitativa de vegetação, a
Normalized Difference Vegetation Index (NDVI). Após controlar os efeitos filogenéticos e
espaciais sobre os parâmetros do canto, somente Thamnophilidae e Tyrannidae exibiram o
padrão esperado segundo a HAA, relacionado à frequência do canto, com uma relação
negativa entre frequência e NDVI: cantos em ambiente florestal apresentaram menores
valores de freqüência do que cantos em ambientes abertos. A maioria dos modelos com
resultados significativos incluiu massa corporal, indicando a influência da morfologia como
uma forte limitação sobre a freqüência do canto. Por outro lado, características temporais
do canto não foram afetadas pela vegetação. No segundo capítulo nós resumimos a variação
interespecífica nas características do canto dessas famílias utilizando análise de
componentes principais (PCA) e ajustamos modelos de evolução alternativos (White noise,
Brownian motion, Ornstein-Uhlenbeck and Early burst) sobre os scores dos componentes
principais do canto. O primeiro PC apontou por aproximadamente 40% da variância em
todas as famílias, indicando que o principal eixo de variação da evolução do canto envolve
mudanças na freqüência do canto. Mais ainda, os modelos mais simples (White noise e
Brownian motion) mostraram melhor ajuste para a maioria dos componentes principais do
canto. Finalmente, no terceiro capítulo nós testamos se estas famílias experimentam um
x
balanço entre a variação na freqüência do canto (frequency bandwidth- FB) e a taxa de
repetição de elementos (notas) do canto (song rate – SR), já demonstrada em outros taxa.
Nós utilizamos dois métodos de regressão para estimar essas relações: upper bound e
quantile regression. Os resultados da upper bound regression foram afetados pelos
intervalos estabelecidos em SR. Utilizando intervalo de 1 Hz somente Pipridae exibiu a
relação negativa esperada entre FB e SR, mas utilizando intervalo de 2 Hz,
Thamnophilidae, Pipridae e Turdidae mostraram resultados significativos. Uma vez que as
regressões pelos métodos upper bound e quantile tiveram resultados conflitantes nós
utilizamos análise de regressão filogenética (PGLS) para testar o efeito do tamanho do bico
e massa corporal (limitação morfológica) diretamente sobre FB e SR. As medidas do bico
foram resumidas utilizando análise de componentes principais e os scores dos componentes
foram posteriormente utilizados nas análises PGLS. Em quatro famílias todas as medidas
do bico foram reduzidas no primeiro componente principal, somente em Pipridae foram
necessários dois eixos para representar o tamanho do bico. Os modelos de melhor ajuste
apontados pela PGLS foram os que incluíram a interação entre o PC do bico e o log da
massa corporal. A morfologia do bico e massa corporal afetaram FB e SR em
Thamnophilidae e Parulidae. Em Thamnophilidae bicos pequenos e aves mais leves
produzem taxas de repetição mais rápidas e maior variação na faixa de freqüências
produzidas, consistente com a hipótese de limitação morfológica sobre a produção do
canto. Concluindo, os resultados desta tese provêm evidências para os seguintes princípios
gerais a respeito da evolução do canto: (1) as características do canto relacionadas à
freqüência são limitadas pelo ambiente e morfologia. Entretanto, para a maioria das
famílias, características temporais do canto não mostraram qualquer tipo de limitação, com
exceção de SR em Thamnophilidae que foi afetada pela morfologia do bico e massa
corporal; (2) em geral os modelos mais simples, sem estrutura de correlação (White Noise)
ou com uma taxa de evolução constante ao longo dos ramos da filogenia (Brownian
motion) apresentaram melhor ajuste às características do canto, indicando que elas podem
evoluir de modo mais simples do o usualmente imaginado; (3) massa corporal é uma
importante característica que limita propriedades dos cantos e deveria ser incluída em
qualquer estudo bioacústico comparativo; (4) a história evolutiva das famílias irá
determinar o potencial para a evolução do canto e as características morfológicas e

xi
fisiológicas impostas pela filogenia são importantes em limitar as propriedades acústicas
dos cantos.
xii
ABSTRACT
Acoustic communication has been a hallmark of avian evolution. Studies on birdsong
evolution generally invoke the role of morphological characteristics influencing the sound-
producing apparatus, habitat structure causing barriers on sound transmition, niche acoustic
partitioning among species to avoid overlapping their signals and cultural drift during song
learning process. The increasing data availability on the phylogenetic relationships between
species, ecological information and the availability of high quality recordings allows for
investigating how these factors contribute in shaping song evolution into a macroecological
perspective. In this study we used phylogenetic comparative methods and spatial statistic to
test classical constraints hypotheses (environmental and morphological) on song structure
of suboscine (families Thamnophilidae, Tyrannidae and Pipridae) and oscine (families
Parulidae and Turdidae) birds. In the first chapter we tested the Acoustic Adaptation
Hypotheses (AAH) (environmental constraint) in a broad scale using a quantitative measure
of vegetation, the Normalized Difference Vegetation Index (NDVI). After controlling the
phylogenetic and spatial effects on song parameters, only Thamnophilidae and Tyrannidae
exhibited the expected pattern under AAH related to song frequency, with a negative
relation between song frequency and NDVI: songs in forest environment presented lower
frequency values than songs in open environment. Most models with significant results
included body mass, indicating the strong influence of morphology as a constraint on song
frequency. On the other hand, temporal song traits analyzed not were affected by
vegetation. In the second chapter we summarized the interspecific variation in song traits in
these families using principal component analysis fitting alternative models of evolution
(White noise, Brownian motion, Ornstein-Uhlenbeck and Early burst) on the PC scores.
The first PC, which accounted for approximately 40% of the variance in all families,
indicated that the main axis of birdsong evolution involves changes in song frequency. In
addition, the simplest models (White noise and Brownian motion) showed the best fit to
most of song principal component scores. Finally, in the third chapter we tested whether
these families experience the tradeoff between frequency bandwidth (FB) and song rate
(SR) already demonstrated in other taxa. We used upper bound and quantile regressions to
estimate these relations. Upper bound results were affected by intervals established in song

xiii
rate. Using 1 Hz only Pipridae exhibited the expected negative relation between FB and SR,
but using 2 Hz, Thamnophilidae, Pipridae and Turdidae showed significant results. Given
that upper bound and quantile regression showed conflicting results, we used phylogenetic
generalized least squares (PGLS) analysis to test the effect of the beak size and body mass
(morphological constraint) directly on FB and SR. Four beak measures were summarized
using principal component analysis and the beak PC scores were posteriorly used in the
PGLS analysis. In four families all beak measures were summarized into the first PC, only
in Pipridae were needed two PCs to represent beak size. The best fit of PGLS models were
that included the interaction between beak PC’s and log of the body mass. Beak
morphology and body mass affected FB and SR in Thamnophilidae and Parulidae. In
Thamnophilidae, small beaks and body mass produces the faster rates and broad frequency
bandwidth, consistent with the hypothesis of constraints on sound production. In
conclusion, the results of this thesis provide evidence for the following general principles
regarding birdsong evolution: (1) frequency characteristics are constrained by environment
and morphology. However, to most families temporal song characteristics not showed any
kind of constraint, with exception of song rate in antbirds that was affected by beak
morphology and body mass; (2) in general simplest models representing no correlation
structure (White noise) or a constant rate of evolution along the phylogeny branch
(Brownian motion) presented the best fit to song characteristics, indicating that they could
has evolved by more simple than usually is suspected; (3) body mass is a morphological
characteristic extremely important in constraining song properties and should be included
in any comparative study in bioacoustic, and finally (4) the evolutionary history of the
families will determine the potential to song evolution and the morphological and
physiological characteristics imposed by phylogeny are important in constraint acoustic
song properties.
1
1. INTRODUÇÃO GERAL
O canto em aves é um caráter com considerável variação temporal e espacial e,
devido ao seu papel na atração de fêmeas e defesa do território, está fortemente sujeito
seleção natural e sexual (Searcy & Anderson 1986, Catchpole & Slater 1995, Badyaev &
Leaf 1997, Slater 1989, Podos et al. 2004). A maioria dos estudos de vocalizações de aves
envolve espécies da Ordem Passeriformes, um grupo monofilético subdividido nas
subordens suboscines e oscines (Raikow 1982, Sick 1997). Na primeira, o canto é
considerado inato, enquanto na segunda é o resultado de uma complexa interação entre
genética e aprendizado (Baker & Cunningham 1985). Essa diferença entre as subordens
tem implicações importantes: estudos com suboscines predominam na região tropical -
onde há maior riqueza de espécies dessas aves e enfatizam o papel de barreiras geográficas
(Cohn-Haft 2000), os limites de distribuição de espécies simpátricas (Payne 1986, Isler et
al. 1998, Seddon 2007) e a influência do ambiente acústico na variação do canto (Lindel
1996, Seddon 2005, Tobias et al. 2010). Por outro lado, o número de espécies de oscines é
bem maior em regiões temperadas, sendo que nesses locais predominam estudos sobre
programas de aprendizagem (Kroodsma 1977, Nelson 1995, Payne 1996, Beecher &
Brenowitz 2005) e variação geográfica no canto, conhecida como dialeto (Lemon 1967,
Baptista 1977, Bitterbaum & Baptista 1979, Petrinovich & Patterson 1981, Podos &
Warren 2007).
Do mesmo modo que qualquer outro fenótipo o canto está sujeito a diversas
limitações que impossibilitam sua variação em qualquer direção. Dentre as limitações que
afetam a evolução do canto estão a morfologia, o ambiente e a própria historia
compartilhada entre as espécies. A estrutura da siringe, os núcleos cerebrais de controle
produção do canto, a massa corporal e a forma e tamanho do bico são exemplos de
características morfológicas que afetam o canto (Margoliash et al. 1994, Podos et al. 2004).
Nas aves Oscines, a estrutura da siringe é composta por seis pares de músculos sob controle
do ajuste da tensão motora muscular, sendo responsável pela modulação da freqüência
fundamental do canto (Amador et al. 2008). No cérebro há um sistema especializado
responsável pelo controle do canto, conhecido como “aparelho sonoro”, formado por um
circuito que inclui o alto centro de controle vocal e o núcleo robusto do arqueoestriado,

2
ambos essenciais para a produção de cantos ao longo da vida, e também pelo circuito
cerebral anterior, que é importante para o desenvolvimento do canto e plasticidade no
aprendizado (Bottjer et al. 1984, Scharff & Nottebohm 1991, Marler & Doupe 2000,
Farries 2004).
Nos Suboscines, existem de três a quatro pares de músculos siringeais e não há
evidências de controle muscular para modulação do som, pelo menos nas poucas espécies
estudadas (Nottebohm 1980, Kroodsma 1984, Kroodsma & Konishi 1991, Amador et al.
2008). Porém é desconhecido se esta aparente falta de circuito de controle motor do canto
está relacionada à capacidade de controle vocal menos sofisticada desta subordem. Além
disso, estudos sobre a estrutura cerebral deste grupo indicam que eles não apresentam
centros responsáveis por mecanismos de aprendizado como os existentes em oscines
(Brenowitz & Kroodsma 1996). Como resultado, o canto em suboscines é relativamente
mais simples e estereotipado (Seddon 2007). Por exemplo, em Thamnophilidae foi
demonstrado que a variação vocal exibe padrão geográfico e que o canto deve ser um
caráter herdado e não aprendido (Brumfield 2005, Isler et al. 2005, Remsen 2005).
O tamanho corporal, estimado geralmente pela massa corporal das aves, está
diretamente ligado ao tamanho da siringe e negativamente relacionado à freqüência, ou
seja, aves maiores tendem a cantar em freqüências mais baixas. Esse padrão já foi
demonstrado tanto em não Passeriformes (Bertelli & Tubaro 2002) como em Passeriformes
(Wallchlager 1980). Ryan & Brenowitz (1985) demonstraram que há diferença na massa
corporal entre aves de ambientes abertos e fechados e concluíram que estudos relacionando
a freqüência do canto somente ao ambiente desconsiderando a massa corporal poderiam
cometer equívocos.
A forma e o tamanho do bico também afetam a produção do canto, pois influenciam
na capacidade de abertura e fechamento do bico no momento em que a ave canta,
direcionando o desempenho e habilidade vocal, podendo inclusive modificar a estrutura do
canto (Podos & Nowicki 2004). Nos tentilhões de Darwin, indivíduos maiores e com bicos
mais robustos produzem cantos com menor taxa de repetição silábica e bandas de
freqüência mais estreitas (Podos 2001). Essa relação entre morfologia do bico e estrutura do
canto tem sido testada em uma variedade de espécies, com foco predominante em aves
oscines (Ballentine 2006, Huber & Podos 2006, Derryberry 2009, Podos et al. 2009,

3
Cardoso & Hu 2011, Wilson et al. 2014). Recentemente a hipótese de limitação
morfológica sobre a estruturação do canto também foi testada em suboscines (Seddon 2005,
Palacios & Tubaro 2000, Derryberry et al. 2012). Entretanto, os estudos mais antigos foram
realizados com uma ou poucas espécies, e até hoje nenhum estudo comparativo foi
realizado investigando os padrões entre aves Oscines e Suboscines. Essa comparação tem
um potencial elucidativo, uma vez que as duas subordens representam linhagens
divergentes com ampla variação morfológica e portanto, poderiam apresentar diferenças em
como essas limitações morfológicas afetam os cantos.
Além da morfologia, o ambiente é capaz de exercer pressão seletiva sobre os cantos,
direcionando sua evolução (Barker 2008, Brumm & Naguib 2009). Segundo a Hipótese de
Adaptação acústica (HAA), (Morton 1975) os cantos são estruturados para maximizar seu
desempenho sob as barreiras do ambiente acústico. Dessa forma, cantos de baixa
freqüência, com pouca repetição de notas e presença de assovios são favorecidos em
ambientes florestais, enquanto cantos de alta freqüência, com presença de elementos
repetitivos e trinados são mais eficientes em ambientes abertos (Morton 1975, Hansen
1979, Wiley & Richards 1982, Rothstein & Fleischer 1987, Tubaro & Segura 1994, Brown
& Handford 1996, Badyaev & Leaf 1997; Doutrelant et al. 1999).
Apesar de uma grande quantidade de estudos testando a HAA desde a década de 70,
os resultados são frequentemente contraditórios, dependendo da espécie estudada e da
escala geográfica do estudo. Enquanto alguns estudos suportam algumas das predições da
hipótese (Badyaev & Leaf 1997; Bertelli & Tubaro 2002; Slabbekoorn et al. 2002;
Slabbekoorn & Smith 2002; Patten et al. 2004; Nicholls & Goldizen 2006, Derryberry
2009, Kirschel et al. 2009), outros encontraram evidências opostas (Lemon et al. 1981;
Daniel & Blumstein 1998, Tubaro & Mahler 1998, Blumstein & Turner 2005, Boncoraglio
& Saino 2007). A maneira usual de testar a HHA é classificar a vegetação qualitativamente
em “aberta” e “fechada”, ou algumas vezes estabelecendo mais categorias para descrever as
diferenças na fisionomia da vegetação. Possivelmente as diferenças entre os resultados
desses estudos podem estar relacionadas a essa classificação subjetiva da vegetação.
Recentemente estudos sobre a evolução do canto vêm utilizando grandes conjuntos
de dados e métodos filogenéticos comparativos para controlar o efeito das relações
filogenéticas entre os fatores investigados, e as questões que antes se restringiam a uma
4
espécie ou população agora são direcionadas para padrões em larga escala. Por exemplo,
Weir & Wheatcroft (2011) observaram que existe um gradiente latitudinal na diversidade
de sílabas e comprimento do canto entre aves oscines e suboscines. Em latitudes mais altas
a taxa de evolução do canto em aves oscines é vinte vezes mais rápida do que em regiões
tropicais, sugerindo que taxas evolutivas em características tão importantes como o canto
são influenciadas pela latitude e, ao contrário do esperado, essas taxas são maiores em
regiões temperadas onde a diversidade de espécies é menor.
O padrão de variação na freqüência do canto também foi analisado em escala
macrogeográfica, mostrando que espécies em regiões tropicais em ambiente florestal
cantam em freqüências mais baixas e utilizam uma variação menor nas faixas de freqüência
do que as espécies de ambientes temperados. Esse resultado sugere a existência de uma
janela acústica menor nos trópicos devido à presença de insetos que sinalizam em algumas
faixas de freqüência específica e que competiriam com os cantos das aves (Weir et al.
2012). Além disso, modelos de evolução foram ajustados à freqüência dos cantos,
indicando limitação diferenciada em ambiente tropical e temperado, sendo que a frequência
dos cantos evolui mais rápido em ambiente temperado independentemente do tipo de
habitat (floresta ou vegetação aberta). Outro estudo comparativo recente testando a HAA
mostrou que em Thraupidae a taxa de mudança na frequência, a distribuição de frequência
das notas e a taxa de repetição de elementos foram consistentes com as predições da
hipótese, enquanto outros parâmetros de freqüência do canto como freqüência de pico,
freqüência maior e menor variaram em direção oposta a daquela predita pela HAA (Mason
2012).
Todos os estudos mencionados acima trazem contribuições importantes para o
entendimento da evolução do canto, entretanto, nenhum deles investigou a contribuição das
diferentes limitações (ambiental, filogenética e morfológica) sobre a evolução do canto ao
mesmo tempo e em diferentes linhagens utilizando uma ampla escala geográfica. Portanto,
este estudo tem por objetivo investigar a contribuição do ambiente, filogenia e morfologia
sobre a evolução do canto de aves suboscines (Thamnophilidae, Tyrannidae e Pipridae) e
oscines (Parulidae e Turdidae) em escala macroecológica. A escolha das famílias do
presente estudo foi baseada na disponibilidade de filogenias moleculares publicadas, cantos
de boa qualidade depositados em coleções, disponibilidade de mapas de distribuição das
5
espécies georeferenciados e peles em museus. Além disso, as famílias foram selecionadas
buscando uma ampla variação em relação à morfologia, comportamento e distribuição
geográfica a fim de testar a generalidade dessas hipóteses de limitações sobre a estruturação
do canto em larga escala. O presente estudo foi estruturado em três capítulos. No primeiro
capítulo foram utilizados métodos filogenéticos comparativos e estatística espacial a fim de
testar a hipótese de adaptação acústica em escala macrogeográfica (Américas), utilizando
uma medida quantitativa de vegetação, o Normalized Difference Vegetation Index (NDVI),
com o objetivo de entender o papel do ambiente na evolução do canto. No segundo capítulo
foram ajustados diferentes modelos de evolução aos parâmetros do canto das famílias
estudadas, procurando compreender como a filogenia contribui para a evolução dessas
características. E finalmente, no terceiro capítulo foi testada a generalidade da hipótese de
limitação morfológica sobre a estrutura dos cantos, comparando os padrões encontrados
entre aves Oscines e Suboscines.
2. OBJETIVO GERAL
Realizar um estudo comparativo e abrangente de como a filogenia, morfologia e o
ambiente moldaram a evolução do canto em aves oscines e suboscines em ambientes
temperados e tropicais.
2.1. OBJETIVOS ESPECÍFICOS
i. Testar a Hipótese de Adaptação Acústica em escala macrogeográfica e mapear os
padrões geográficos dos parâmetros dos cantos.
ii. Testar o ajuste de diferentes modelos de evolução para os diferentes parâmetros dos
cantos.
iii. Testar se a massa corporal e o tamanho do bico afetam a estrutura dos cantos
(Hipótese de restrição morfológica).
6
REFERÊNCIAS
Amador, A.; Goller, F.; Mindlin, G. B. 2008. Frequency Modulation During Song in a
Suboscine Does Not Require Vocal Muscles. Journal of Neurophysiology 99: 2383-
2389.
Badyaev, A.V.; Leaf, E. S. 1997. Habitat associations of song characteristics in
Phylloscopus and Hippolais Warblers. Auk, 114: 40-46.
Baker, M. C. 1981. Early experience determines song dialect responsiveness of female
sparrows. Science 214: 819-820.
Baptista, L. F. 1977. Geographic variation in song and dialects of the Puget sound white –
crowned sparrow. Condor 79: 356-370.
Barker, N. 2008. Bird song structure and transmission in the Neotropics: trends, methods,
and future directions. Ornitologia Neotropical 19: 175-199.
Beecher, M. D.; Brenowitz, E. A. 2005. Functional aspects of song learning in songbirds.
Trends in Ecology and Evolution 20: 143-149.
Bertelli, S.; Tubaro, P. L. 2002. Body mass and habitat correlates of song structure in a
primitive group of birds. Biological Journal of the Linnean Society 77: 423-430.
Bitterbaum, E.; Baptista, L. F. 1979. Geographical variation in songs of California House
Finches (Carpodarcus mexicanus). Auk 96: 462-474.
Boncoraglio, G.; Saino, N. 2007. Habitat structure and the evolution of bird song: a meta-
analysis of the evidence for the acoustic adaptation hypothesis. Functional Ecology 21:
134-142.
Bottjer, S.W.; Miesner, E.A.; Arnold AP. 1984. Forebrain lesions disrupt development but
not maintenance of song in passerine birds. Science 224: 901-903.
Brown, T. J.; Handford, P. 1996 Acoustical signal amplitude patterns: a computer
simulation investigation of the acoustic adaptation hypothesis. Condor 98: 608-623.
Brumm, H.; Naguib, M. 2009. Environmental Acoustics and the Evolution of Bird Song.
Advances in the Study of Behavior 40: 1-33.
Brenowitz, E.A.; Kroodsma, D.E., 1996. The neuroethology of birdsong. In: Kroodsma,
D.E., Miller, E.H. (Eds.), Ecology and Evolution of Acoustic Communication in Birds.
Cornell University Press, Ithaca, NY, pp. 285-304.
7
Brumfield, R.T. 2005. Mitochondrial variation in Bolivian populations of the variable
antshrike (Thamnophilus caerulescens). Auk 122: 414-432.
Cardoso, G. C.; Hu, Y. 2011. Birdsong Performance and the Evolution of Simple (Rather
than Elaborate) Sexual Signals. American Naturalist 178: 679-686.
Catchpole, C. K.; Slater, P. J. B. 1995. Bird Song: biological themes and variation.
Cambridge University Press. 185-218.
Cohn-Haft, M. 2000. A case study in amazonian biogeography: vocal and DNA-sequence
variation in Hemitriccus flycatchers. Ph.D. diss. Louisiana State University, Baton
Rouge, EUA.
Daniel, J. C.; Blumstein, D. T. 1998. A test of the acoustic adaptation hypothesis in four
species of marmots. Animal Behaviour 56: 1517-1528.
Derryberry, E. 2009. Ecology Shapes Birdsong Evolution: Variation in Morphology and
Habitat Explains Variation in White-Crowned Sparrow Song. American Naturalist
174: 24-33.
Derryberry, E.P.; Seddon, N.; Claramunt, S.; Tobias, J. A.; Baker, A.; Aleixo, A.;
Brumfield, R. T. 2012.Correlated evolution of beak morphology and song in the
Neotropical woodcreper radiation. Evolution 66: 2784-2797.
Doutrelant, C.; Leitão, A. Georg, M.; Lambrechts, M. M. 1999. Geographic variation in
blue tit songs: the result of an adjustment to vegetation type? Behavioral Science 136:
481-493.
Farries, M. A. 2004.The Avian Song System in Comparative Perspective. Annals of the
New York Academy of Sciences 1016: 61-76.
Hansen, P. 1979: Vocal learning: its role in adapting sound structures to long-distance
propagation and a hypothesis on its evolution. Animal Behaviour 27: 1270-1271.
Huber, S. K.; Podos, J. 2006. Beak morphology and song features covary in a population of
Darwin’s finches (Geospiza fortis ). Biological Journal of the Linnean Society 88: 489-
498.
Isler, M.; Isler, P. R.; Whitney, B. M. 1998. Use of vocalizations to establish species limits
in antbirds (Passeriformes: Thamnophilidae). Auk 115: 577-590.
Isler, M.L.; Isler P.R.; Whitney, B.M. 2005. Clinal variation in vocalizations of an antbird
(Thamnophilidae) and implications for defining species limits. Auk 122: 433-444.
8
Kroodsma, D. E.1984. Song of the alder flycatcher (Empidonax alnorum) and willow
flycatcher (Empidonax trailli) are innate. Auk 96: 506-515.
Kirschel, A. N. G; Blumstein, D. T.; Cohen, R. C.; Buermann, W.; Smith,T. B.;
Slabbekoorn, H. 2009. Birdsong tuned to the environment: green hylia song varies with
elevation, tree cover, and noise. Behavioral Ecology 20:1089-1095.
Kroodsma, D. E.; Konishi, M. 1991. A suboscine bird (eastern phoebe, Sayornis phoebe)
develops normal song without auditory feedback. Animal Behaviour 42: 477-487.
Kroodsma, D. E. 1977. Correlates of song organization among North American wrens.
American Naturalist 111: 995-1008.
Lemon, R. E. 1967. The response of cardinals to songs of different dialects. Animal
Behaviour 15: 538-545.
Lindell, C. 1998. Limited geographic variation in the vocalizations of a neotropical
Furnariid, Synallaxis albescens. Wilson Bulletin 110: 368-374.
Margoliash, D.; Fortune, E. S.; Sutter, M. L.; Yu, A. C.;Wren-Hardi, D. B; Dave, A.
1994.Distributed Representation in the Song System of Oscines: Evolutionary
lmplications and Functional Consequences. Brain Behavior and Evolution 44: 247-264.
Marler, P.; Doupe, J. A. 2000. Singing in the brain. PNAS 97: 2965-2967.
Mason, Nicholas. 2012. Song complexity and its evolutionary correlates across a continent-
wide radiation of songbirds. MSc thesis, San Diego State University.
Morton, E. S. 1975. Ecological sources of selection on avian sounds. American Naturalist
109: 17-34.
Nelson, D. A. 1995. A comparative approach to vocal learning: intraspecific variation in
the learning process. Animal Behaviour 50: 83-97.
Nicholls, J. A.; Goldizen, A. W. 2006. Habitat type and density influence vocal signal
design in satin bowerbirds. Journal of Animal Ecology 75: 549-558.
Nottebohm F. 1980. Brain pathways for vocal learning in birds: a review of the first 10
years. Progress Psychobiology and Physiological Psychology 9: 85-124.
Palacios, M. G.; Tubaro, P. L. 2000. Does beak size affect acoustic frequencies in
Woodcreepers? Condor 102: 553-560.
Payne, R. B. 1996. Song Traditions in Indigo Buntings: origin, improvisation, dispersal and
extinction in cultural evolution. In: Ecology and Evolution of Acoustic Communication

9
in Birds Eds: Kroodsma, D. E. and Miller, E. H. Cornell University Press. Ithaca and
London.
Payne, R. B. 1986. Bird Song and avian systematics. Current Ornithology (3). Ed.Richard
F. Johnston.Plenum Press, New York and London. 87-126.
Petrinovich, L.; Patterson, T. L. 1981. The responses of white-crowned sparrows to songs
of different dialects and subspecies. Zeitschrift Fur Tierpsychologie 57: 1-14.
Podos, J.; Lahti, D. C.; Moseley, D. L. 2009. Vocal performance and Sensorimotor learning
in songbirds. Advances in the Study of Behavior 40: 159-195.
Podos, J.; Warren, P.S. 2007. The evolution of geographic variation in birdsong Advances
in the Study of Behavior 37: 403-458.
Podos, J.; Nowicki, S. 2004. Beaks, Adaptation, and Vocal Evolution in Darwin’s Finches
Bioscience 54 (6): 501-510.
Podos, J.; Huber, S. K.; Taft, B. 2004. Bird Song: The Interface of Evolution and
mechanism. Annual Review of Ecology, Evolution and Systematics 35: 55-87.
Podos, J. 2001. Correlated evolution of morphology and vocal signal structure in Darwin’s
finches. Nature 409: 185-188.
Raikow, R. J. 1982. Monophily of the Passeriformes: test of a phylogenetic hypothesis. Auk
99: 431-445.
Remsen, J. V. 2005. Pattern, process and rigor meet classification. Auk 122: 403–413.
Richards, D. G.; Wiley, R. H. 1980. Reverberations and amplitude fluctuations in the
propagation of sound in a forest: implications for Animal communication. American
Naturalist 115: 381-399.
Rothstein, S. I.; Fleischer, R. C. 1987. Vocal dialects and their possible relation to honest
status signaling in the brown-headed cowbird. Condor 89: 1-23.
Ryan, M. J.; Brenowitz, E. A. 1985. The role of Body Size, Phylogeny and Ambient Noise
in the evolution of Bird Song. American Naturalist 126: 87-100.
Scharff, C.; Nottebohm, F .1991. A comparative study of the behavioral deficits following
lesions of various parts of the zebra finch song system: implications for vocal learning.
Journal of Neuroscience 11: 2896-2913.
10
Searcy, W. A.; K. Yasukawa. 1996. Song and female choice. Pp. 454-473 in D. E.
Kroodsma and E. H. Miller, eds. Ecology and evolution of acoustic communication in
birds. Cornell Univ.Press, Ithaca, NY.
Searcy, W. A.; Anderson, M. 1986. Sexual selection and the evolution of song Annual
Review of Ecology, Evolution and Systematics 17: 507-533.
Seddon, N.; Tobias, J. A. 2007. Song divergence at the edge of Amazonia: an empirical test
of the peripatric speciation model. Biological Journal of the Linnean Society 90: 173-
188.
Seddon, N. 2005. Ecological adaptation and species recognition drives vocal evolution in
neotropical suboscine birds. Evolution 59: 200-215.
Sick, H. 1997. Ornitologia Brasileira. Ed. Nova Fronteira: 692-718.
Slabbekoorn, H.; Smith, T. B. 2002. Bird song, ecology and speciation. Philosophical
Transactions of the Royal Society B 357: 493-503.
Slabbekoorn, H.; Ellers, J.; Smith, T. B. 2002. Birdsong and sound reverberation: the
benefits of reverberations. Condor 104: 564.
Slater, P. J. B. 1989. Bird song learning: causes and consequences. Ethology Ecology &
Evolution 1: 19-46.
Tobias, J. A.; Aben, J.; Brumfield, R. T.; Derryberry, E. P.; Halfwerk, W.; Slabbekoorn, H.;
Seddon, N. 2010. Song Divergence by Sensory Drive in Amazonian Birds. Evolution
64: 1-20.
Tubaro, P. L.; Mahler, B. 1998. Acoustic frequencies and body mass in New World doves.
Condor 100: 54-61.
Tubaro, P. L.; Segura, E. T. 1994. Dialect differences in the song of Zonotrichia capensis in
the southern Pampas: a test of the acoustic adaptation hypothesis. Condor 96: 1084-
1088.
Wallschlager. D. 1980. Correlation of song frequency and body weight in passerine birds
Experientia 36: 412.
Weir, J. T.; Wheatcroft, D.; Price. T. 2012. The role of ecological constraint in driving the
evolution of avian song frequency across a latitudinal gradient. Evolution 66: 2773-
2783.

11
Weir, J.; Wheatcroft, D . 2011. A latitudinal gradient in rates of evolution of avian syllable
diversity and song length. Proceedings of Royal Society B 278: 1713-1720.
Wiley, R. H.; Richards, D. G. 1982. Adaptations for acoustic communication in birds:
sound transmission and signal detection. In: Acoustic Communication in Birds
(Kroodsma, D. E. & Miller, E. H., eds). Academic Press, New York & London: 131-
181.
Wilson, D. R.; Bitton, P. B.; Podos, J.; Mennill, D. J. 2014. Uneven Sampling and the
Analysis of Vocal Performance Constraints. American Naturalist 183: 214-228.
12
3. ARTIGO I
A macroecological test of the acoustic adaptation hypothesis
Viviane Deslandes & Marcio R. Pie
Capítulo formatado de acordo com a instrução aos autores da revista “Journal of Animal
Ecology”
13
A macroecological test of the acoustic adaptation hypothesis
Viviane Deslandes1, 2
& Marcio R. Pie1, 3
1-Laboratório de Dinâmica Evolutiva e Sistemas Complexos
Departamento de Zoologia
Universidade Federal do Paraná
C.P. 19020
81531-990 Curitiba, PR
Brazil
Phone: +55(41)3361-1558
2- e-mail: [email protected]
3-e-mail: [email protected]
Keywords: Phylogenetic comparative method, macroecology, song evolution, Suboscines,
birds.
Running head: Testing the acoustic adaptation hypothesis.
14
3.1. Abstract
One of the most important hypotheses on song evolution is the acoustic adaptation
hypothesis (AAH), which posits that environmental pressures act on species by shaping
their songs. In dense forests, selection would favour longer songs, with lower frequencies,
and fewer note repetitions or longer note duration, with the opposite pattern being favoured
in open environments. A large number of studies have tested these predictions, yet most
were conducted with only one or few species, and with the exception of two large-scale
studies, their macroecological patterns remain unknown. In this study, we tested the AAH
predictions in a broad geographical scale using a quantitative measure of the vegetation
(NDVI), and controlling the phylogenetic and spatial effects on songs parameters of three
Suboscines families (Thamnophilidae, Tyrannidae and Pipridae) and two Oscines families
(Parulidae and Turdidae). After controlling for the phylogenetic and morphological
constraints on song parameters, only Thamnophilidae and Tyrannidae exhibited the
expected pattern under AAH related to song frequency, showing a negative relation
between song frequency and NDVI. Most models with significant results included body
size, indicating the strong influence of morphology as a constraint on song frequency. Our
results highlight two main implications: frequency seems to be more constrained by
physical characteristics of the environment than temporal song parameters and the
influence of the environment in constraining birdsong might not be a widespread
phenomenon in bird song evolution, at least at large geographical scales. Possibly,
morphological and ecological differences among these families respond differently to
environmental constraints.
15
3.2. Introduction
Acoustic communication has been one of the major hallmarks of bird evolution
(Kroodsma & Miller 1996). The remarkable variety of sounds generated during bird
vocalization as a consequence of the advent of the syrinx allowed birds to produce a
bewildering diversity of songs of varying levels of complexity (Fagerlund 2004; Suthers &
Zollinger 2004). Although their function is most commonly associated with sexual
selection (Slater 1989; Price 1998; Nowicki & Searcy 2004), bird vocalizations might also
play important roles in a variety of contexts, including defence (e.g. mobbing and alarm
calls: Catchpole & Slater 2008), communication with nestlings (Leonard & Horn 2001;
Marques et al. 2009) and even echolocation (Suthers & Hector 1982; 1985).
Passerines (order Passeriformes) include the highest diversity of both species and
songs among all birds (Marler & Slabbekoorn 2004). Interestingly, the earliest split during
the evolution of passerines was marked by the evolution of two fundamentally different
modes of song evolution. Oscines are mostly temperate birds with developed syringeal
muscles (Amador et al. 2008) and are able to learn songs, thus displaying higher song
plasticity (Baker & Cunningham 1985). On the other hand, Suboscines, which are most
common in the tropics, usually possess a simpler syrinx structure and display more
stereotyped song patterns (Kroodsma & Konishi 1991; Isler et al. 2005, Amador et al.
2008; Seddon & Tobias 2007). Most studies to date have focused on Oscines, including
topics such as learning programs (Kroodsma 1977; Nelson 1992; Podos et al. 1999,
Beecher & Brenowitz 2005; Nulty et al. 2010) and song geographic variations, known as
dialects (Lemon 1967; Bitterbaum & Baptista 1979; Cunningham et al.1987; Podos &
Warren 2007; Liu et al. 2008), whereas suboscine songs have been comparatively less
studied.
16
One of the most general hypotheses about the forces driving the song evolution is
the acoustic adaptation hypothesis (AAH), which provides specific predictions as to how
the acoustic environment would shape bird song characteristics (Morton 1975). For
instance, sound transmission can suffer interference from elements of the soil or the
vegetation, and some sound frequencies can experience attenuation by wind, humidity, and
temperature (Richards & Wiley 1980; Wiley & Richards 1982). As a consequence, natural
selection on forest bird species would favour longer songs, with lower frequencies and
fewer note repetitions. In contrast, open environments would favour shorter songs, with
higher frequencies and more frequent repetitions (Wiley 1991; Doutrelant et al. 1999;
Barker 2008; Tobias et al. 2010). Despite these clear predictions and the large number of
studies testing the AAH, results to date have been often contradictory, depending on the
studied species and study scale. Although many studies confirmed some of the hypothesis
predictions (Badyaev & Leaf 1997; Bertelli & Tubaro 2002; Slabbekoorn et al. 2002;
Slabbekoorn & Smith 2002; Nicholls & Goldizen 2006; Derryberry 2009; Kirschel et al.
2009), other found conflicting evidence (Lemon et al. 1981; Daniel & Blumstein 1998;
Tubaro & Mahler 1998; Blumstein & Turner 2005; Boncoraglio & Saino 2007). Possibly,
some of these discrepancies might be due to the subjective classification of vegetation
physiognomies and the local scale used in these studies, such as the classification of
vegetation as either "open" or "closed". Here, instead this classification, we used the
Normalized Difference Vegetation Index (NDVI), which is a measure of photosynthetically
active green biomass: higher values represent more living green biomass (Vinciková et
al.2010). This index is a more precise measure of plant biomass and therefore should allow
for more precise inferences regarding AAH.

17
The field of macroecology has revolutionized the study of a variety of long-standing
ecological issues, as the latitudinal gradient in species richness (Hawkins et al. 2007),
Bergmann’s rule (Diniz-Filho et al. 2007; Ollala-Tárraga et al. 2009; Cooper & Purvis
2010) and, more recently, phylogenetic niche conservatism (Hawkins et al. 2006; Wiens et
al.2006; Rangel et al.2007; Ramirez et al.2008; Kerkhoff et al. 2014). However, little is
known about the macroecological pattern of phenotypic traits. Investigating how
bioacoustic features of bird songs are distributed over large spatial scales can provide a
valuable tool for understanding the evolutionary dynamics of these traits (Weir &
Wheatcroft 2011; Cardoso & Hu 2011; Weir et al. 2012). In this study, we test the AAH in
a broad geographical scale (Americas), among Suboscine (Thamnophilidae, Tyrannidae
and Pipridae) and Oscine bird families (Turdidae and Parulidae). In particular, we use
phylogenetic comparative methods and spatial statistics to integrate information on song
acoustic properties of a representative sample of these families and GIS-based information
to test the AAH in a macroecological perspective and mapping song parameters.
3.3. Methods
Song measurements
Recordings were obtained from the following collections: Instituto de Investigación
de Recursos Biológicos Alexander Von Humboldt (Colombia), Acervo Neotropical Elias
Coelho (Universidade Federal do Rio de Janeiro, Brazil), Macaulay Library (Cornell
University, EUA), XENO-CANTO database (http://www.xeno-canto.org), and private song
collections of Jeremy Minns and Christian Borges Andretti. We measured a total of 3173
recordings from suboscine (Thamnophilidae, Tyrannidae, and Pipridae) and oscine families
(Parulidae and Turdidae) (Table 1). For suboscines we measured one phrase per individual,

18
given this suborder shows stereotyped songs with little variation in repertoire. However, in
oscines, due to learning, one individual can sing a large number of different phrases within
a song. In this case, to capture the song variation throughout a species, we analysed all the
different phrases sung by each individual within an interval of three minutes. Songs with
sample rate and resolution less that 22.050 Hz and 16 bits were discarded. All the
spectrograms were generated using the software AVISOFT SAS Lab Pro 5.1 (Specht 2011),
with the following specifications: Window: Hamming, FFT: 256, Frame Size: 100%, and
Overlap: 88%. We used the “two thresholds” automatic parameters with the threshold fitted
to each song independently, visualizing the best cut-off value in the power spectrum
graphic, which allows for selecting all notes while excluding the noise in the background.
For each phrase we measured the following acoustic parameters: 1) mean phrase duration
(SD): (s), the duration from the beginning of the first element (note) to the end of the last
element in the phrase; 2) mean number of notes (NN): number of elements (notes) detected
within the phrase; 3) element rate (ER): (s), the average duration of the elements (notes)
within a phrase; 4) peak frequency (PF): (KHz), at maximum spectrum (peak hold) of the
entire phrase. To measure the maximum and minimum frequencies (Fmax and Fmin,
respectively), we used the manual cursor because songs show considerable variation in
relation to the presence of harmonics, which hamper the accurate automatic estimation of
these parameters. Frequency bandwidth (FB) was obtained by subtracting Fmin from Fmax.
We used species means for each measurement in further analyses.
Phylogenetic and Spatial Analysis
Predictions of the AAH were tested by assessing the correspondence between the
level of vegetation cover found throughout the distribution of each species (as measured by
19
NDVI) and its song acoustic properties. This assessment involved four main steps. First, we
obtained the distribution shapefiles of the species from the NATURESERVE database
(http://www.natureserve.com). In ARCGIS 9.3 (ESRI 2008) we generated a set of random
coordinates within the distribution of each species using the "GENERATE RANDOM
POINTS TOOL" (Beyer, H. L. 2004. Hawth's Analysis Tools for ArcGIS. Available at
http://www.spatialecology.com/htools). We used the point density equal to 10, such that the
number of simulated coordinates was proportional to the size of the distribution of the
species. From the NDVI raster (obtained from the Center for Satellite Applications and
Research, available at http://www.star.nesdis.noaa.gov) we extracted values from each
simulated coordinate and posteriorly calculated an average within-species NDVI.
Finally, the influence of phylogenetic relationships, NDVI and acoustic
characteristics were tested using the method of Freckleton & Jetz (2009) in R, 3.0.1 (R
Development Core Team, 2014). This method is based on the estimation of the parameters
λ’ and φ, which vary from 0 to 1 and reflect the extent of phylogenetic or spatial
autocorrelation, respectively. We fitted different models to each family and estimated λ’
and φ, based on the following phylogenies: Thamnophilidae (Gomez et al. 2010),
Tyrannidae (Ohlson et al. 2008), Pipridae (Ohlson et al. 2008), Parulidae (Lovette et al.
2010) and Turdidae (Klicka et al. 2005). Given that body size might also influence the
acoustic properties of songs (Wallschläger 1980; Ryan & Brenowitz 1985; Wiley 1991;
Bertelli &Tubaro 2002), we used the logarithm of body mass (in g) as a covariate in all
tested models. We obtained information about body mass from Handbook of the Birds of
the World (del Hoyo et al. 2003; 2004; 2005 and 2010) and from Dunning (2008), using
median values when only ranges were reported or when masses were reported separately
for males and females. We used ARCGIS 9.3, establishing a grid on the species distribution
20
with cells of 0.5 degrees and then we mapped the residuals of the regressions between the
average of the song parameters and species richness in each cell. This procedure was made
because cells with more species showed disproportionally higher values to song parameters
when these were directly mapped. If song parameters support the AAH, then we expect that
the maps these residuals and NDVI will exhibit similar patterns.
3.4. Results
There was no consistent pattern of phylogenetic or spatial autocorrelation among the
tested song traits among families (Table 2). Of all 40 performed analyses (eight song
parameters from five families), half of the tested traits showed independence with respect to
both space and phylogeny, followed by 14 cases of predominantly phylogenetic
autocorrelation, and 6 cases of substantial spatial autocorrelation. On the other hand,
families differed substantially regarding the estimated values of 'and φ. The families
Thamnophilidae and Parulidae showed a predominance of phylogenetic autocorrelation (6
and 4 out of 8 tested traits, respectively). In particular, song acoustic characteristics in
Tyrannidae, Pipridae, and Turdidae were generally independent of space and phylogenetic
history, with higher γ values for 5, 6, and 5 out of 8 tested traits, respectively (Table 2).
Once potential spatial and phylogenetic autocorrelation were accounted for, the
prediction of a relationship between song characteristics and NDVI was tested separately
for each family and measured trait. In general, AAH predictions were not supported at the
studied scale (Table 3). For instance, no significant association was found between NDVI
and the variables SD, NN, and FB for any of the investigated families. In the case of
Parulidae, no significant association was found between NDVI and any of the tested song
variables. In Pipridae, the interaction between NDVI and body mass was significantly
21
associated with PF and Fmax, and yet for Turdidae, the interaction term was significant for
PF and Fmin. However, the direction of variation of the PF for Pipridae and Turdidae was
the opposite of that expected by the AAH, with higher values being observed for more
forested areas (Table 3, Fig 3 and 4, respectively). In contrast, in Thamnophilidae, PF, Fmax,
and Fmin were significant and negatively associated with NDVI, as predicted by the AAH
(Table 3, Fig. 1). Likewise, in Tyrannidae, results for Fmax also corroborated the hypothesis,
with lower frequency values being concentrated in regions of high NDVI values (Fig 2).
3.5. Discussion
This is the first study to investigate the AAH in a macroecological scale using tools
to control simultaneously potential effects of phylogenetic and spatial autocorrelation. In
particular, we tested whether birds living in forest regions presented longer songs, with
lower frequencies, and higher note duration when compared to birds living in more open
vegetation. We showed that, after controlling by phylogenetic and spatial effects (Table 2),
most of song parameters analyzed were inconsistent with AAH predictions (Table 3).
Interestingly, for all families included in the present study, only frequency parameters
supported AAH, particularly in Thamnophilidae and Tyrannidae. In Pipridae and Turdidae,
these relations also were significant, but in the opposite direction than that predicted by the
hypothesis. These results suggest two main implications: first, frequency song parameters
seem to be more constrained by physical characteristics of the environment than temporal
song parameters and, second, the influence of the environment in constraining birdsong
might not be a widespread phenomenon in shaping bird song evolution.
Song optimal structure to transmition depends on several factors acting together:
typical communication distance, acoustic characteristics of the habitat, ambient noise

22
profiles, and physical and phylogenetic constraints (Brumm & Naguib 2009). Therefore,
complex patterns for the evolution of bird song are expected and our results reinforce these
various observations in respect to the generality of AAH. For instance, in Thamnophilidae,
the strong phylogenetic signal in most song parameters (Table 2) and the influence of the
beak morphology and body mass on frequency and song rate (unpublished data, see Table 4
in Chapter 3 for more details) suggests that the contribution of the evolutionary history in
this family is as important as physical characteristic of the environment in shaping song
evolution. These results agree with those in a study by Seddon (2005) which analyzed 163
thamnophilid species testing predictions of morphological adaptation, acoustic adaptation,
and the species recognition hypotheses. In that study, AAH was tested using strata as a
proxy of vegetation structure. Species were assigned to different codes, according to the
strata in which they habitually sang. Likewise, the AAH predictions related to frequency
were supported: understory and canopy birds sing higher-pitched songs than birds living in
the midstory, suggesting that song structure is related to the sound transmission properties
of different habitat strata. Another study using local scale and small differences in
vegetation physiognomies found similar results (Tobias et al. 2010), i.e. pairs of closely
related Amazonian birds (some antbirds) occurring in bamboo and Terra firme forests were
compared with the purpose of investigating whether vocal divergence between these two
groups could be explained by ambient noise, correlated evolutionary response to beak and
body size or genetic drift. Their results showed that song divergence was correlated with
the sound transmission properties of the habitats, rather than with genetic divergence,
ambient noise, or effects of mass, and beak size.
When considering Tyrannidae, Pipridae and Turdidae, the phylogenetic history did
not represent an important constraint on song parameters, although songs in these taxa also
23
have been affected by NDVI. In Tyrannidae, Fmax followed the AAH predictions, with
forest birds presenting lower Fmax values than birds living in more open habitats. However,
in Pipridae and Turdidae, frequency song parameters exhibited variation in an opposite
direction than that predicted by AAH, and body mass was an important parameter in the
model, once all significant results showed interaction between body mass and NDVI. We
might speculate that, in Pipridae, sexual selection might be the main force driving song
evolution. In this family, males display reproductive behavior in groups or “leks” in arenas
that are located at the same place year after year. An adult male can spend more than 90%
of daylight hours centered on the lek, with brief absences for foraging (Snow 2004). Thus,
it seems reasonable that environmental constraint is not a strong pressure on song evolution
in this family, given that vocalizations are simpler and sound transmition is assured by a
reproductive strategy, in which males remain at a short distance from females, differently
from other birds, in which males need to defend larger territories and cover longer distances
to forage. In Turdidae, we believe that the lack of phylogenetic signal on frequency song
parameters and the existence of learning could add sufficient plasticity in songs, allowing
birds to change their frequency patterns, despite the environmental constraints, meaning
that the cultural evolution and ontogenetic adaptation have an important role in shaping
oscine song evolution (Brumm & Naguib 2009).
Despite an extensive literature about AAH, only recently the hypothesis’ predictions
have been investigated under a macroecological view (Mason 2012, Weir et al. 2012), and
yet there are inconsistencies between studies. For instance, in the case of Thraupidae,
frequency shift rates, average note bandwidths, and trill rates were consistent with AAH,
whereas peak, high and minimum frequency parameters did not support the hypothesis
(Mason 2012). On the other hand, another comparative study investigating the latitudinal

24
pattern in song frequency showed that tropical latitudes constrained song frequency to low
values and narrower bandwidths when compared to temperate latitudes (Weir et al. 2012).
When considered together, previous studies and present results reinforce that,
despite differences among which song parameters are affected by the environment, AAH
has a general support in relation to song frequency parameters, regardless of the study scale
(small vs. broad scale), methods used to estimate differences in vegetation (qualitative vs.
quantitative), or more detailed information about microhabitat (strata). However, it is also
clear that considering only vegetation to test this hypothesis is not sufficient, because
morphology is a factor of interference on song frequency (our results, Ryan & Brenowitz
1985). In this study we investigated whether the AAH predictions would be supported
when using a quantitative measure of vegetation and controlling by phylogeny spatial
effects and body size. We suggest that future research investigating AAH should also
include information about strata favorably used by birds, given this information could add
some important information about vegetation that could not have been captured by NDVI
alone.
Acknowledgements
We thank G. Decker for assistance during data acquisition, M. Webster and Cornell Lab of
Ornithology for hosting a visit by V. D.. We also thank A. A. Padial, M. O. Moura, M. S.
Barbeitos, C. R. Firkowski for valuable comments on previous versions of this manuscript.
VD was funded by Coordenação de Aperfeiçoamento de Pessoal de Nível Superior
(CAPES), scholarship and grant (0225-12-6) and MRP was funded by CNPq/MCT (grant
571334/2008-3).
25
4.6. References
Amador, A., Goller, F. & Mindlin, G. B. (2008) Frequency Modulation During Song in a
Suboscine Does Not Require Vocal Muscles. Journal of Neurophysiology, 99, 2383-
2389.
Badyaev, A.V. & Leaf, E. S. (1997) Habitat associations of song characteristics in
Phylloscopus and Hippolais Warblers. Auk, 114, 40-46.
Baker, M. C. & Cunningham, M. A. 1985 The biology of bird-song dialects. Behavioral
and Brain Sciences, 8, 85-133.
Barker, N. (2008) Bird song structure and transmission in the Neotropics: trends, methods,
and future directions. Ornitologia Neotropical, 19,175-199.
Beecher, M. D. & Brenowitz, E. A. (2005) Functional aspects of song learning in
songbirds. Trends in Ecology and Evolution, 20, 143-149.
Bertelli, S. &Tubaro, P. L. (2002) Body mass and habitat correlates of song structure in a
primitive group of birds. Biological Journal of the Linnean Society, 77, 423-430.
Bitterbaum, E. & Baptista, L. F. (1979) Geographical variation in songs of California
House Finches (Carpodarcus mexicanus). Auk, 96, 462-474.
Blumstein, D. T. & Turner, A. C. (2005) Can the acoustic adaptation hypothesis predict the
structure of Australian birdsong? Acta Ethologica, 15, 35-44.
Boncoraglio, G. & Saino, N. (2007) Habitat structure and the evolution of bird song: a
meta-analysis of the evidence for the acoustic adaptation hypothesis. Functional
Ecology, 21, 134-142.
Brumm, H. & Naguib, M. (2009) Environmental Acoustics and the Evolution of Bird Song.
Advances in the Study of Behavior, 40, 1-33.
26
Cardoso, G. C. & Hu, Y. (2011). Birdsong Performance and the Evolution of Simple
(Rather than Elaborate) Sexual Signals. American Naturalist, 178, 679-686.
Catchpole, C. K. & Slater, P. J. B. (2008) Variation in time and space. Bird Song:
biological themes and variation, pp. 185-218. Cambridge University Press.
Collar, N. (2005) Family Turdidae (Thrushes). pp -514-807 in J. del Hoyo, A. Elliott and
J. Sargatal, eds. Handbook of the Birds of the World, Vol. 10. Lynx Edicions,
Barcelona.
Cooper, N. & Purvis, A. (2010) Body Size Evolution in Mammals: Complexity in Tempo
and Mode. American Naturalist, 175, 1-14.
Cunningham, M. A., Baker, M.C. & Boardman, T. J. (1987) Microgeographic song
variation in the Nutall's White-Crowned sparrow. Condor, 89, 261-275.
Curson, J. (2010) Family Parulidae (New World Warblers). pp. 666-800 in J. del Hoyo, A.
Elliott and J. Sargatal, eds. Handbook of the Birds of the World, Vol.15. Lynx Edicions,
Barcelona.
Daniel, J. C. & Blumstein, D. T. (1998) A test of the acoustic adaptation hypothesis in four
species of marmots. Animal Behaviour, 56, 1517-1528.
Derryberry, E. (2009) Ecology Shapes Birdsong Evolution: Variation in Morphology and
Habitat Explains Variation in White-Crowned Sparrow Song. American Naturalist,
174, 24-33.
Diniz-Filho, J. A. F., Bini, L. M., Rodriguez, M. A. Rangel, T. F. L. V. B. & Hawkins, B.
A. (2007) Seeing the forest for the trees: partitioning ecological and phylogenetic
components of Bergmann’s rule in European Carnivora. Ecography, 30, 598-608.
27
Doutrelant, C., Leitão, A. G. M. & Lambrechts, M. M. (1999) Geographic variation in blue
tit songs: the result of an adjustment to vegetation type? Behavioral Science, 136, 481-
493.
Dunning, J. B. (2008). CRC Handbook of avian body masses. CRC Press, Taylor & Francis
Group, Boca Raton, USA.
Fagerlund, S. (2004) Automatic Recognition of Bird Species by Their Sounds. Master’s
Thesis. Chapter 2. Helsinki University of Technology.
Fitzpatrick, J., Bates, J., Bostwick, K., Caballero, I., Clock, B., Farnsworth, A. et al. (2004)
Family Tyrannidae (Tyrant-flycatchers). pp. 170-462 in J. del Hoyo, A. Elliott and J.
Sargatal, eds. Handbook of the Birds of the World, Vol. 9. Lynx Edicions, Barcelona.
Freckleton, R. P. & Jetz, W. (2009) Space versus phylogeny: disentangling phylogenetic
and spatial signals in comparative data. Proceedings of the Royal Society B, 276, 21-
30.
Gómez, J. P., Bravo, G. A., Brumfield, R. T., Tello, J. G., & Cadena, C. D. (2010) A
phylogenetic approach to disentangling the role of competition and habitat filtering in
community assembly of Neotropical forest birds. Journal of Animal Ecology, 79, 1181-
1192.
Hawkins, B. A., Diniz-Filho, J. A. F., Bini, L. M., Araújo, M. B., Field, R., Hortal, J., Kerr,
J. T., Rahbek, C., Rodríguez, M. A. &Sanders, N. J. (2007) Metabolic theory and
diversity gradients: where do you go from here? Ecology, 88, 1898-1902.
Hawkins, B. A., Diniz-Filho, J. A. F., Jaramillo, C. A. & Soeller, S. A. (2006) Post-eocene
climate change, niche conservatism, and latitudinal gradient of New World birds.
Journal of Biogeography,33,770-780.
28
Hunter, M. L. & Krebs, J. R. (1979) Geographical variation in the song of great tit (Parus
major), in relation to ecological factors. Journal of Animal Ecology, 48, 759-785.
Isler, M.L., Isler, P. R. & Whitney, B. M. (2005) Clinal variation in vocalizations of an
antbird (Thamnophilidae) and implications for defining species limits. Auk 122: 433-
444.
Kembel, S.W., Cowan, P.D., Helmus, M.R., Cornwell, W.K., Morlon, H., Ackerly, D. D.
Blomberg, S. P. & Webb. C.O. (2010) Picante: R tools for integrating phylogenies and
ecology. Bioinformatics, 26, 1463-1464.
Kerkhoff, A. J., Moriarty, P. E. & Weiser, M. D. (2014) The latitudinal species richness
gradient in New World woody angiosperms is consistent with the tropical conservatism
hypothesis. Proceedings of National Academic Science, 111, 8125-8130.
Kirschel, A. N. G, Blumstein, D. T., Cohen, R. C., Buermann, W., Smith,T. B. &
Slabbekoorn, H. (2009) Birdsong tuned to the environment: green hylia song varies
with elevation, tree cover, and noise. Behavioral Ecology, 20, 1089-1095.
Klicka, J., Voelker, G. & Spellman, G. M. (2005) A molecular phylogenetic analysis of the
“true thrushes” (Aves: Turdinae). Molecular Phylogenetics and Evolution, 34, 486-500.
Kroodsma, D. E. (1977) Correlates of song organization among North American wrens.
American Naturalist, 111, 995-1008.
Leonard, M. L. & Horn, A. G. (2001) Begging calls and parental feeding decisions in tree
swallows (Tachycineta bicolor). Behavioral Ecology and Sociobiology, 49, 170-175.
Kroodsma, D. E. & Konishi, M. (1991) A suboscine bird (eastern phoebe, Sayornis phoebe)
develops normal song without auditory feedback. Animal Behaviour, 42, 477-487.
29
Kroodsma, D.E. & Miller, E. H. (1996) Ecology and Evolution of Acoustic Communication
in Birds. Cornell University Press, Ithaca, NY, 1996.
Lemon, R. E. (1967) The response of cardinals to songs of different dialects. Animal
Behaviour, 15, 538-545.
Lemon, R. E., Struger, J., Lechowicz, M. J. & Norman, R. F. (1981) Song features and
singing heights of American warblers: maximization or optimization of distance?
Journal of the Acoustical Society of America, 69, 1169-1176.
Liu, I. A., Lohr, B., Olsen, B. & Greenberd, R. (2008) Macrogeographic vocal variation in
subspecies of swamp sparrow. Condor, 110, 102-109.
Lovette, I. J., Pérez-Emán, J. L., Sullivan, J. L., Banks, R. C., Fiorentino, I., Córdoba-
Córdoba, S. et.al. (2010) A comprehensive multilocus phylogeny for the Wood-
Warblers and a revised classification of the Parulidae (Aves). Molecular Phylogeneics
and Evolution, 57, 753-770.
Marler, P & Slabbekoorn, H. (2004) Nature´s Music. The Science of Birdsong. Hardcover,
504 pages, including 2 CD´s. Academic Press Elsevier, San Diego.
Marques, P. A., Vicente, M. L. & Márquez, R. (2009) Nestling Begging Call Structure and
Bout Variation Honestly Signal Need but Not Condition in Spanish Sparrows.
Zoological Studies, 48, 587-595.
Mason, N (2012) Song complexity and its evolutionary correlates across a continent-wide
radiation of songbirds. MSc thesis, San Diego State University..
Morton, E. S. (1975) Ecological sources of selection on avian sounds. American Naturalist,
109, 17-34.

30
Nelson, D. A. (1992) Song overproduction and selective attrition lead to song sharing in the
field sparrow. Behavioral Ecology and Sociobiology, 30, 415-424.
Nicholls, J. A. & Goldizen, A. W. (2006) Habitat type and density influence vocal signal
design in satin bowerbirds. Journal of Animal Ecology, 75, 549-558.
Nowicki, S. & Searcy, W. (2004) Song function and the evolution of female preferences:
Why birds sing and why brains matter. Behavioral Neurobiology of Birdsong (eds. H.P.
Zeigler & P. Marler), pp. 1-37. New York Academy of Sciences Press.
Nulty, B., Burt, J. M., Akçay, Ç., Templeton, C., Campbell, S. E. & Beecher, M. D. (2010)
Song learning in song sparrows: relative importance of autumn vs. spring tutoring.
Ethology, 116, 653-661.
Ohlson, J. I., Fjeldså, J., Per, G. & Ericson, P. (2013) Molecular phylogeny of the manakins
(Aves: Passeriformes: Pipridae), with a new classification and the description of a new
genus. Molecular Phylogenetics and Evolution, 69, 796-804.
Ohlson, J., Fjeldså, J. & Ericson, P. G. P. (2008) Tyrant flycatchers coming out in the open:
phylogeny and ecological radiation of Tyrannidae (Aves, Passeriformes). Zoologica
Scripta, 37, 315-335.
Olalla-Tárraga, M. A., Diniz-Filho, J. A. F., Bastos, R. P. & Rodríguez, M. A. (2009)
Geographic body size gradients in tropical regions: water deficit and anuran body size in
the Brazilian Cerrado. Ecography, 32, 581-590.
Podos, J. &Warren, P. S. (2007) The evolution of geographic variation in birdsong.
Advances in the Study of Behavior, 37, 403-458.
Pinheiro, J., D. Bates, DebRoy, S., Sarkar, D & R Development Core Team. (2013) nlme:
Linear and Nonlinear Mixed Effects Models. R package version 3.1-109.
31
Price, T. (1998) Sexual selection and natural selection in bird speciation. Philosophical
Transactions of the Royal Society B, 353, 251-260.
R Development Core Team (2014) R: A language and environment for statistical
computing. R Foundation for Statistical Computing, Vienna, Austria. ISBN 3-900051-
07-0, URL http://www.R-project.org.
Ramirez, L., Diniz-Filho, J. A. F. & Hawkins, B. A. (2008) Partitioning phylogenetic and
adaptive components of the geographical body-size pattern of New World birds.
Global Ecology and Biogeography, 17, 100-110.
Rangel, T. F. L. B., Diniz-Filho, J. A. F. & Cowell, R. K. (2007) Species richness and
evolutionary niche dynamics: a spatial pattern-oriented simulation experiment.
American Naturalist, 170, 1-15.
Richards, D. G. & Wiley, R. H. (1980) Reverberations and amplitude fluctuations in the
propagation of sound in a forest: implications for Animal communication. American
Naturalist, 115, 381-399.
Ryan, M. J. & Brenowitz, E. A. (1985) The role of Body Size, Phylogeny and Ambient
Noise in the evolution of Bird Song. American Naturalist, 126, 87-100.
Seddon, N. (2005) Ecological adaptation and species recognition drives vocal evolution in
Neotropical suboscine birds. Evolution, 59, 200-215.
Seddon, N. & Tobias, J. A. (2007) Song divergence at the edge of Amazonia: an empirical
test of the peripatric speciation model. Biological Journal of the Linnean Society, 90,
173-188.
Slabbekoorn, H. & Smith, T. B. (2002) Bird song, ecology and speciation.
Philosophical Transactions of the Royal Society B, 357, 493-503.

32
Slabbekoorn, H., Ellers, J. & Smith, T. B. (2002) Birdsong and sound reverberation: the
benefits of reverberations. Condor, 104, 564.
Slater, P. J. B. (1989) Bird song learning: causes and consequences. Ethology Ecology and
Evolution, 1, 19-46.
Snow, D. (2004) Family Pipridae (Manakins). pp. 110-169 in J. del Hoyo, A. Elliott and J.
Sargatal, eds. Handbook of the Birds of the World, Vol. 9. Lynx Edicions, Barcelona.
Specht, R. (2011) Avisoft SAS Lab Pro Sound Analysis and Synthesis Laboratory. Version
5.1. Avisoft, Berlin, Germany.
Suthers, R. A. & Hector, D. H. (1982) Mechanism for the Production of Echolocation
Clicks by the Grey Swiftlet, Collocmia spodiopygia. Journal of Comparative
Physiology, 148, 457-470.
Suthers, R. A., & Hector, D. H. (1985) The physiology of vocalization by the echolocating
oilbird, Steatornis caripensis. Journal of Comparative Physiology, 56, 243-266.
Suthers, R. A. & Zollinger, S. A. (2004) Producing song: the vocal apparatus. Annals of the
New York Academy of Sciences, 1016, 109-129.
Tobias, J. A., Aben, J., Brumfield, R. T., Derryberry, E. P., Halfwerk, W., Slabbekoorn, H.
& Seddon, N. (2010) Song Divergence by Sensory Drive in Amazonian Birds.
Evolution, 64, 1-20.
Tubaro, P. L. & Mahler, B. (1998) Acoustic frequencies and body mass in New World
doves. Condor, 100, 54-61.
Tubaro, P. L & Segura, E.T. (1994) Song of Zonotrichia capensis in the southern pampas: a
test of the acoustic adaptation hypothesis. Condor, 96, 1084-1088.
33
Vinciková, H., Hais, M., Brom, J., Procházka, J., Pecharová, E. (2010) Use of remote
sensing methods in studying agricultural landscapes – a review. Journal of Landscape
Studies, 3, 53-63.
Wallschlager. D. (1980) Correlation of song frequency and body weight in passerine birds.
Experientia 36: 412.
Weir, J. T., Wheatcroft, D. & Price. T. (2012) The role of ecological constraint in driving
the evolution of avian song frequency across a latitudinal gradient. Evolution, 66, 2773-
2783.
Weir, J. T. & Wheatcroft, D. (2011) A latitudinal gradient in rates of evolution of avian
syllable diversity and song length. Proceedings of Royal Society London B, 278, 1713-
1720.
Wiley, R. H. & Richards, D. G. (1982) Adaptations for acoustic communication in birds:
sound transmission and signal detection. Acoustic Communication in Birds (eds D. E.
Kroodsma & E. H. Miller), pp. 131-181.Academic Press, New York and London.
Wiley, R. H. (1991) Associations of song properties with habitats for territorial oscine birds
of eastern North America. American Naturalist, 138, 973-993.
Wiens, J. J., Graham, C. H., Moen, D., Smith,S. A. & Reeder, T. W. (2006) Evolutionary
and ecological causes of the latitudinal diversity gradient in Hylid frogs: treefrog trees
unearth the roots of high tropical diversity. American Naturalist, 168, 579-596.
Zimmer, K. J., &Isler, M. L. (2003) Family Thamnophilidae (typical antbirds). pp. 448–68
in J. del Hoyo, A. Elliott, and D. Christie, eds. Handbook of birds of the World. Vol. 8.
Lynx Edicions, Barcelona.
34
FI GURE CAPTIONS
Figure 1. Thamnophilidae song variables affected by Normalized Difference Vegetation
Index (NDVI). (a): Residuals of peak frequency vs. richness; (b): Residuals of maximum
frequency vs. richness; (c): Residuals of minimum frequency vs. richness; (d): NDVI based
on average of values calculated per species present in each cell using the interpolation
method (see Methods). All these frequency variables showed an inverse relation with
NDVI, according with specific predictions of AAH of lower frequency values associated to
closed vegetation (or high NDVI values).
Figure 2. Tyrannidae song variable affected by Normalized Difference Vegetation Index
(NDVI). (a) Residuals of Maximum frequency vs. richness; (b): NDVI based on average of
values calculated per species present in each cell using the interpolation method (see
Methods). The lowest residual values to maximum frequency (a) were associated to highest
NDVI values (b), confirming the AAH predictions related to frequency song parameters.
Figure 3. Pipridae song variables affected by Normalized Difference Vegetation Index
(NDVI). (a): Residuals of peak frequency vs. richness; (b): Residuals of maximum
frequency vs. richness; (c): Residuals of frequency bandwidth vs. richness; (d): NDVI
based on average of values calculated per species present in each cell using the
interpolation method (see Methods). Contrasting with AAH predictions there is a positive
relation between frequency variables and NDVI, with lower frequency values associated to
more open vegetation (lower NDVI values).
Figure 4. Turdidae song variables affected by Normalized Difference Vegetation Index
(NDVI). (a): Residuals of peak frequency vs richness; (b): Residuals of minimum
frequency vs richness; (c):NDVI based on average of values calculated per species present
in each cell using the interpolation method (see Methods). As in Pipridae songs, lower

35
frequency values were positively associated to lower NDVI values, indicating the opposite
pattern that expected by AAH.
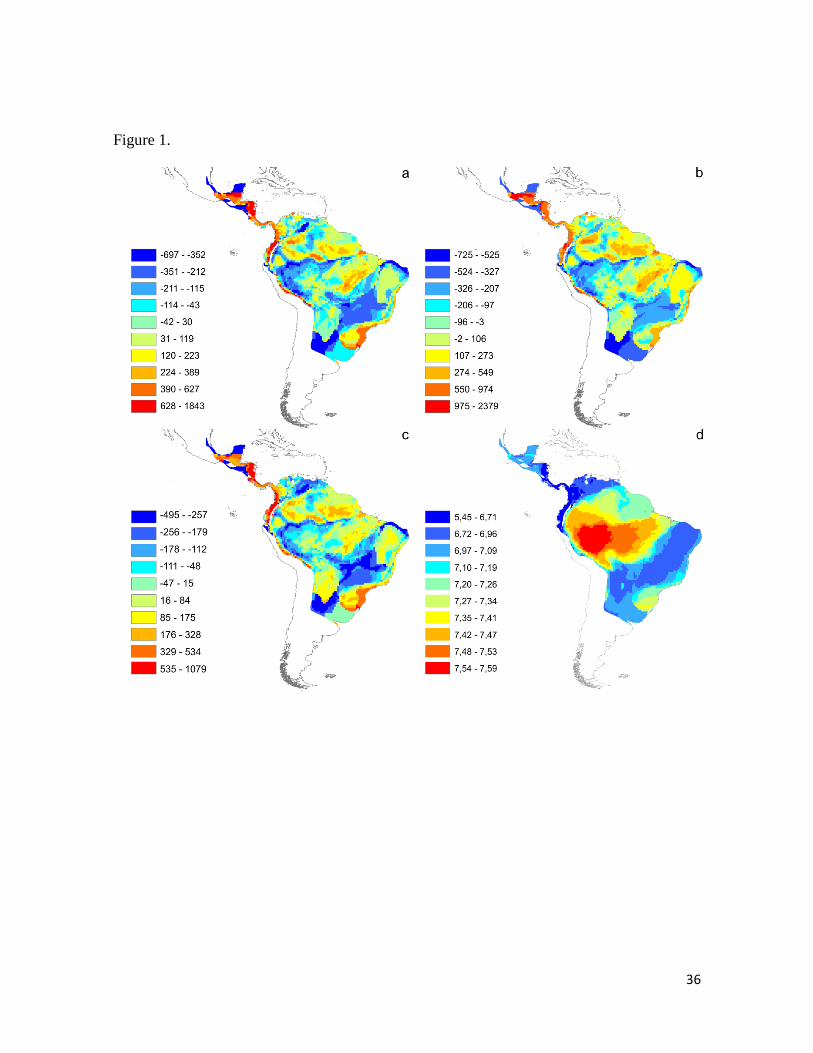
36
Figure 1.

37
Figure 2.
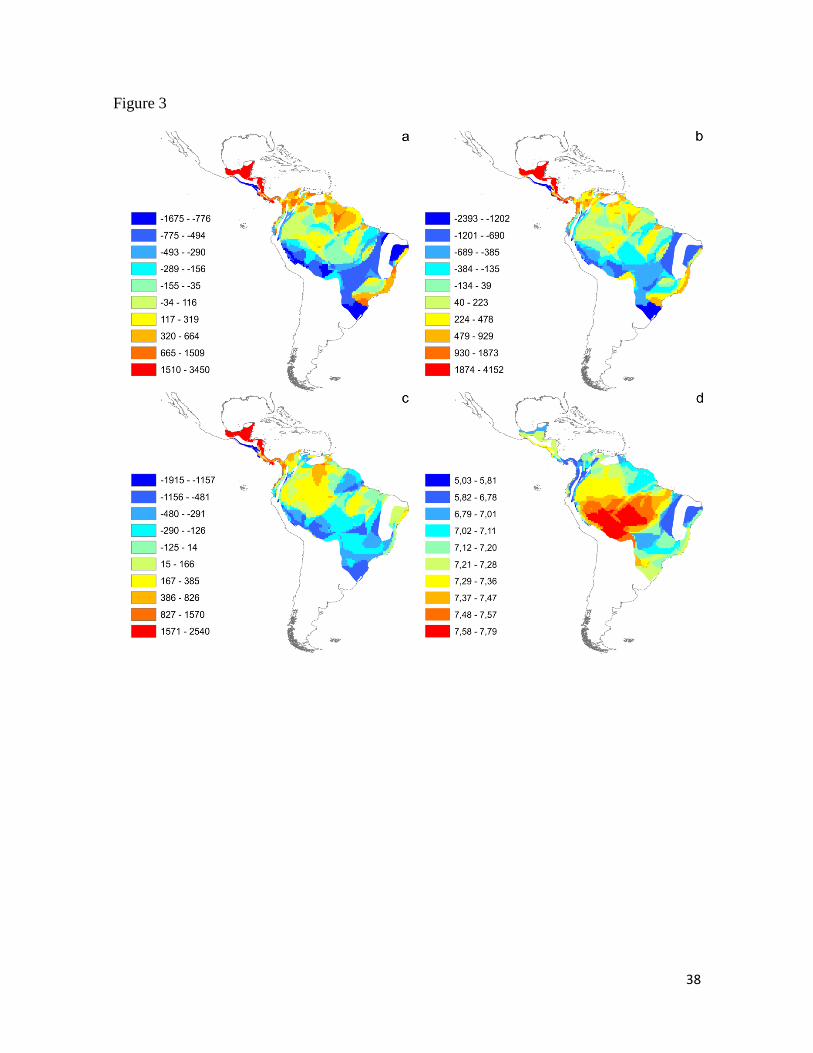
38
Figure 3
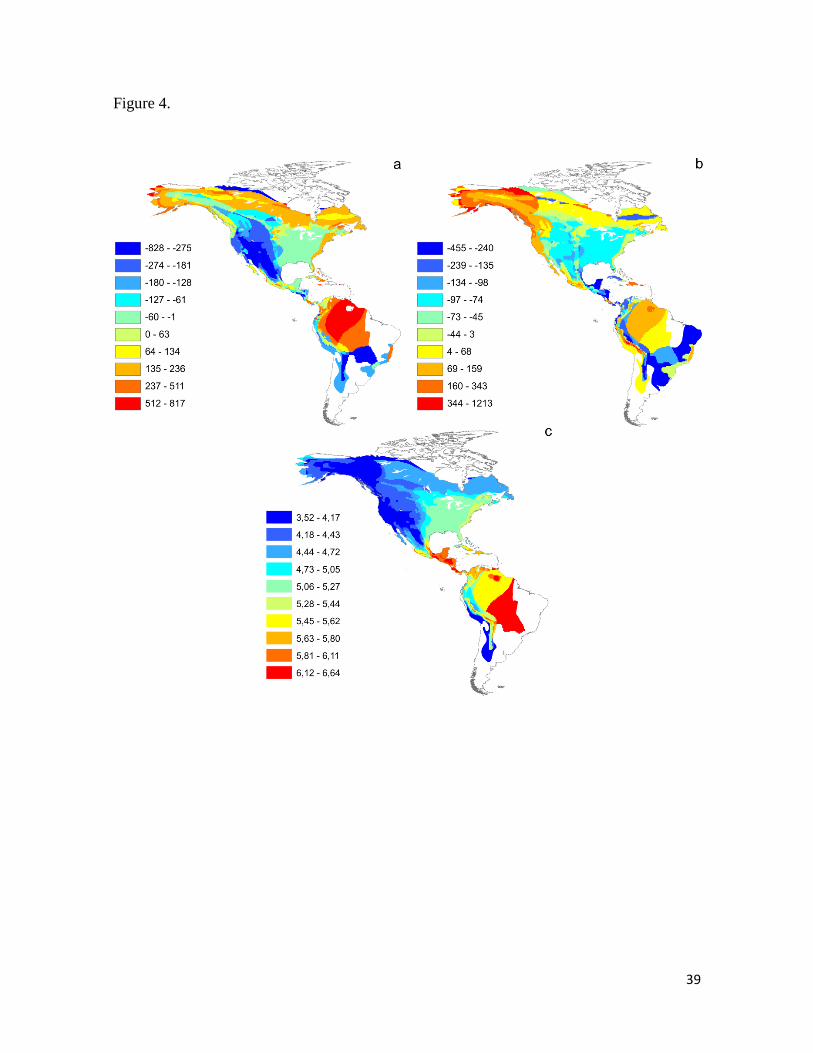
39
Figure 4.
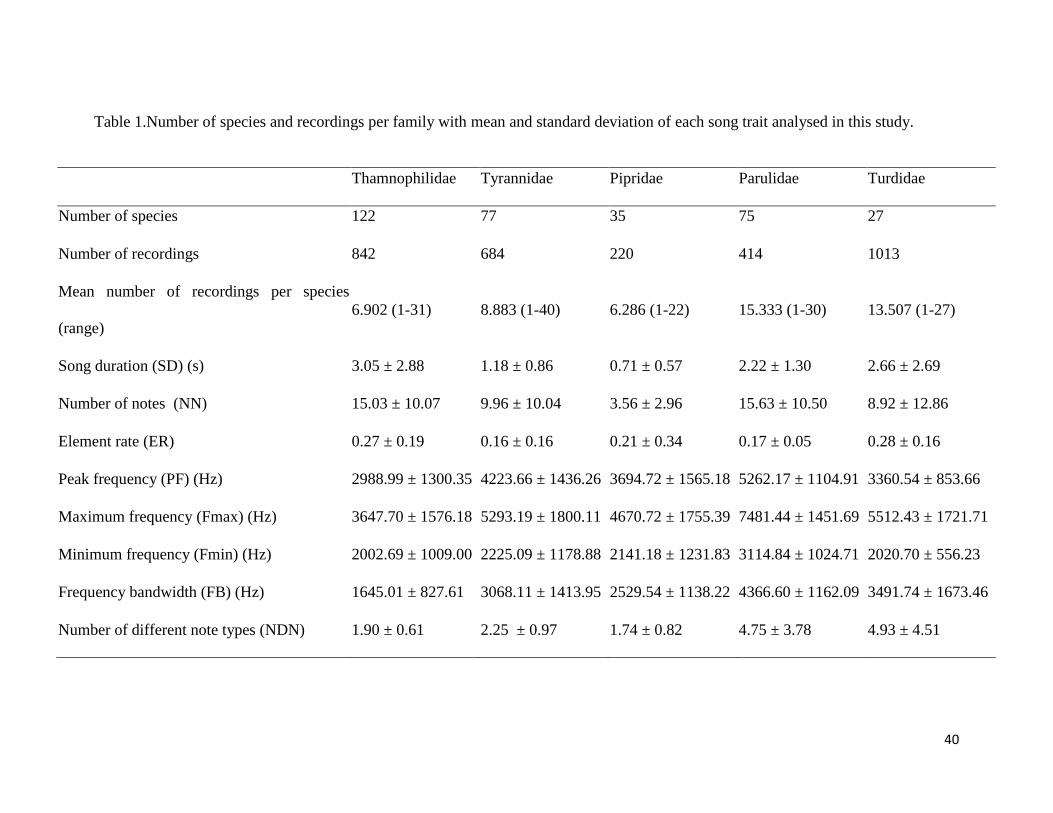
40
Table 1.Number of species and recordings per family with mean and standard deviation of each song trait analysed in this study.
Thamnophilidae Tyrannidae Pipridae Parulidae Turdidae
Number of species 122 77 35 75 27
Number of recordings 842 684 220 414 1013
Mean number of recordings per species
(range)
6.902 (1-31) 8.883 (1-40) 6.286 (1-22) 15.333 (1-30) 13.507 (1-27)
Song duration (SD) (s) 3.05 ± 2.88 1.18 ± 0.86 0.71 ± 0.57 2.22 ± 1.30 2.66 ± 2.69
Number of notes (NN) 15.03 ± 10.07 9.96 ± 10.04 3.56 ± 2.96 15.63 ± 10.50 8.92 ± 12.86
Element rate (ER) 0.27 ± 0.19 0.16 ± 0.16 0.21 ± 0.34 0.17 ± 0.05 0.28 ± 0.16
Peak frequency (PF) (Hz) 2988.99 ± 1300.35 4223.66 ± 1436.26 3694.72 ± 1565.18 5262.17 ± 1104.91 3360.54 ± 853.66
Maximum frequency (Fmax) (Hz) 3647.70 ± 1576.18 5293.19 ± 1800.11 4670.72 ± 1755.39 7481.44 ± 1451.69 5512.43 ± 1721.71
Minimum frequency (Fmin) (Hz) 2002.69 ± 1009.00 2225.09 ± 1178.88 2141.18 ± 1231.83 3114.84 ± 1024.71 2020.70 ± 556.23
Frequency bandwidth (FB) (Hz) 1645.01 ± 827.61 3068.11 ± 1413.95 2529.54 ± 1138.22 4366.60 ± 1162.09 3491.74 ± 1673.46
Number of different note types (NDN) 1.90 ± 0.61 2.25 ± 0.97 1.74 ± 0.82 4.75 ± 3.78 4.93 ± 4.51
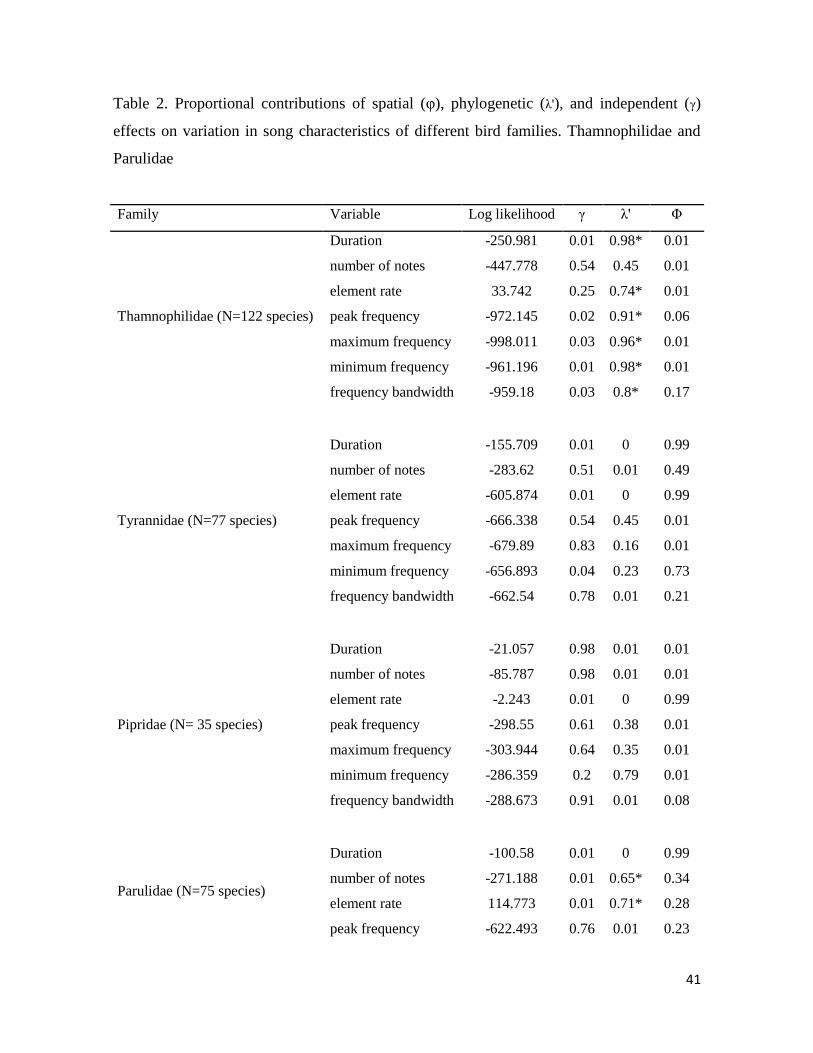
41
Table 2. Proportional contributions of spatial (φ), phylogenetic (λ'), and independent (γ)
effects on variation in song characteristics of different bird families. Thamnophilidae and
Parulidae
Family Variable Log likelihood γ λ' Φ
Thamnophilidae (N=122 species)
Duration -250.981 0.01 0.98* 0.01
number of notes -447.778 0.54 0.45 0.01
element rate 33.742 0.25 0.74* 0.01
peak frequency -972.145 0.02 0.91* 0.06
maximum frequency -998.011 0.03 0.96* 0.01
minimum frequency -961.196 0.01 0.98* 0.01
frequency bandwidth -959.18 0.03 0.8* 0.17
Tyrannidae (N=77 species)
Duration -155.709 0.01 0 0.99
number of notes -283.62 0.51 0.01 0.49
element rate -605.874 0.01 0 0.99
peak frequency -666.338 0.54 0.45 0.01
maximum frequency -679.89 0.83 0.16 0.01
minimum frequency -656.893 0.04 0.23 0.73
frequency bandwidth -662.54 0.78 0.01 0.21
Pipridae (N= 35 species)
Duration -21.057 0.98 0.01 0.01
number of notes -85.787 0.98 0.01 0.01
element rate -2.243 0.01 0 0.99
peak frequency -298.55 0.61 0.38 0.01
maximum frequency -303.944 0.64 0.35 0.01
minimum frequency -286.359 0.2 0.79 0.01
frequency bandwidth -288.673 0.91 0.01 0.08
Parulidae (N=75 species)
Duration -100.58 0.01 0 0.99
number of notes -271.188 0.01 0.65* 0.34
element rate 114.773 0.01 0.71* 0.28
peak frequency -622.493 0.76 0.01 0.23
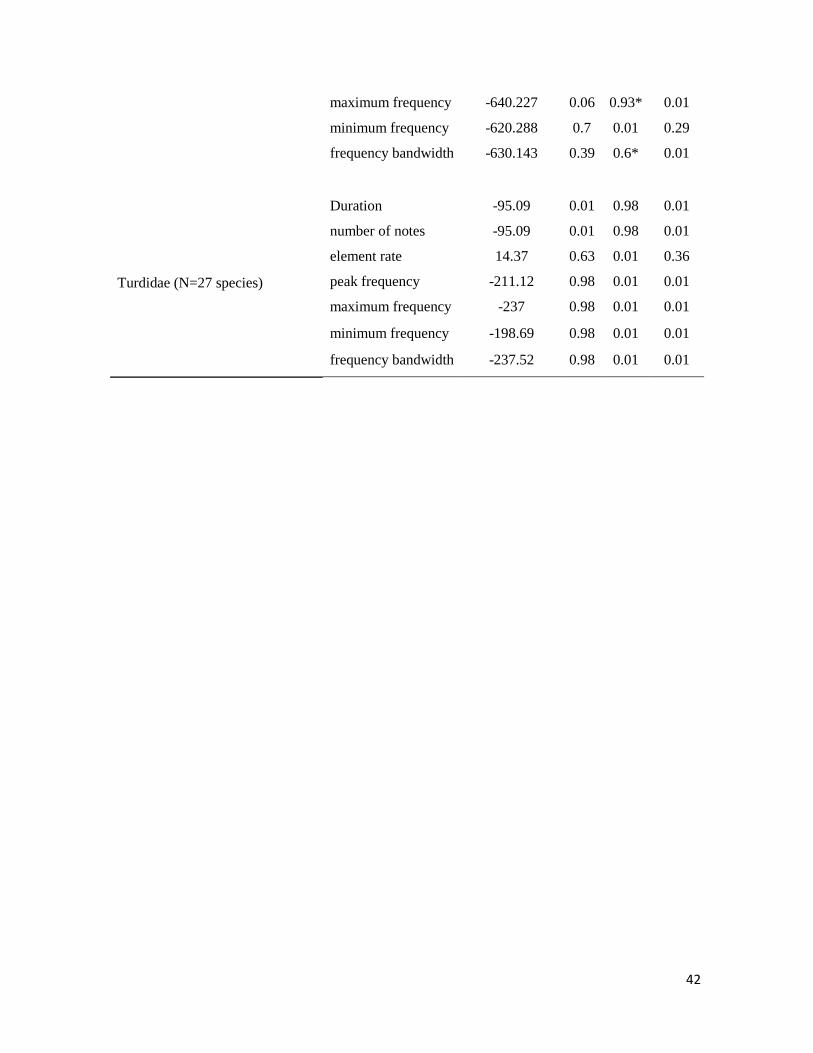
42
maximum frequency -640.227 0.06 0.93* 0.01
minimum frequency -620.288 0.7 0.01 0.29
frequency bandwidth -630.143 0.39 0.6* 0.01
Turdidae (N=27 species)
Duration -95.09 0.01 0.98 0.01
number of notes -95.09 0.01 0.98 0.01
element rate 14.37 0.63 0.01 0.36
peak frequency -211.12 0.98 0.01 0.01
maximum frequency -237 0.98 0.01 0.01
minimum frequency -198.69 0.98 0.01 0.01
frequency bandwidth -237.52 0.98 0.01 0.01

43
Table 3. Results from generalized least squares analyses on the relationship between song acoustic properties and the average
Normalized Difference Vegetation Index (NDVI) of the corresponding species for different bird families. NDVI* mass are the models
in which log of body mass by species was included as interaction with NDVI. PF: Peak frequency (KHz); Fmax: maximum frequency
(KHz); Fmin: minimum frequency (KHz); FB: frequency bandwidth (KHz); SD: song duration (s); NN: number of notes (or elements);
ER: element rate (mean duration of the element). Significant results are evidenced in bold.
Family PF (KHz) Fmax (KHz) Fmin (KHz) FB (KHz) SD (s) NN ER
ND
VI
ND
VI
*m
ass
ND
VI
ND
VI
*m
ass
ND
VI
ND
VI
*m
ass
ND
VI
ND
VI
*m
ass
ND
VI
ND
VI
*m
ass
ND
VI
ND
VI
*m
ass
ND
VI
ND
VI
*m
ass
Th
amn
op
hil
idae
Slope -201.2 169.31 -195.78 46.13 -115.85 83.74 -76.58 -100.4 0.2443 0.2827 0.205 -0.864 0.01309 0.13272
SE 73.66 124.04 84.62 127.15 52.98 61.56 73.24 152.42 0.1569 0.1824 1.307 5.862 0.02399 0.08376
t -2.731 1.365 -2.314 0.363 -2.187 1.36 -1.046 -0.659 1.556 1.55 0.157 -0.147 0.546 1.585
p 0.007 0.17487 0.0224 0.7174 0.0308 0.1763 0.298 0.511 0.122 0.124 0.875 0.883 0.5863 0.1158
Ty
ran
nid
ae
Slope -251.31 194.07 -396.9 117.6 -47.75 40.49 -268.195 0.8223 0.0802 0.1274 -0.763 0.384 -17.75 36.2
SE 145.85 130.7 175 127.8 126.9 70.85 140.466 121.879 0.1931 0.0955 1.047 1.036 66.81 33.04
t -1.723 1.485 -2.268 0.92 -0.376 0.571 -1.909 0.007 0.415 1.335 -0.729 0.372 -0.266 1.096
p 0.089 0.14194 0.0263 0.3607 0.7078 0.56946 0.0602 0.9946 0.679 0.186 0.468 0.711 0.791 0.277
Pip
rid
ae Slope 195.1 3466.9 314.6 3467.6 277.5 1144 173.8 1677.5 -0.145 0.507 -0.145 0.507 0.0713 0.24344
SE 319.7 1083 374.4 1264.1 207.3 647.8 252.1 787.5 0.7662 2.4281 0.766 2.428 0.06063 0.14066
T 0.61 3.201 0.84 2.743 1.339 1.766 0.689 2.13 -0.189 0.209 -0.189 0.209 1.176 1.731

44
p 0.546 0.00323 0.4074 0.0102 0.1907 0.0876 0.49584 0.04149 0.851 0.836 0.851 0.836 0.24882 0.09378
Par
uli
dae
Estimate 2.147 -607.376 116.51 -6.298 -45.63 -226.43 -18.54 -556.57 -0.1074 -0.1808 -0.325 -1.476 0.000261 0.007336
SE 115.399 313.879 133.426 188.509 112.87 307.91 127.74 324.69 0.1103 0.2117 0.995 1.628 0.005716 0.008964
t 0.019 -1.935 0.873 -0.033 -0.404 -0.735 -0.145 -1.714 -0.974 -0.854 -0.327 -0.906 0.046 0.818
p 0.985 0.057 0.386 0.973 0.687 0.465 0.885 0.0909 0.3334 0.396 0.744 0.368 0.964 0.416
Tu
rdid
ae
Slope 133.6 794.8 218.7 660.4 23.18 628.22 195.49 32.22 -1.46 -3.379 -1.46 -3.379 -0.007988 -0.101368
SE 106.4 227.6 277.5 593.7 67.15 143.67 282.94 605.38 1.424 2.865 1.424 2.865 0.02671 0.06879
t 1.256 3.491 0.788 1.112 0.345 4.373 0.691 0.053 -1.025 -1.18 -1.025 -1.18 -0.299 -1.474
p 0.222 0.00207 0.439 0.278 0.73324 0.00024 0.497 0.958 0.316 0.251 0.316 0.251 0.768 0.155
45
4. ARTIGO II
Testing alternative models of songbird evolution
Viviane Deslandes & Marcio R. Pie
Capítulo formatado de acordo com a instrução aos autores da revista “Journal of
Evolutionary Biology”
46
Testing alternative models of songbird evolution
Viviane Deslandes*& Marcio R. Pie
Laboratório de Dinâmica Evolutiva e Sistemas Complexos, Departamento de Zoologia,
UFPR. Universidade Federal do Paraná (UFPR), Curitiba, PR, Brazil.
and
Programa de Pós-Graduação em Ecologia e Conservação, Universidade Federal do
Paraná (UFPR), Curitiba, PR, Brazil.
* Corresponding author.
Address for correspondence: Departamento de Zoologia, UFPR, C.P. 19020, CEP
81531-990, Curitiba, Paraná, Brazil. Phone number: +55 41 3361-1558.
47
5.1 Abstract
Acoustic communication has been a hallmark of avian evolution, yet little is known
about the mode and tempo of evolution of the birdsongs. In this study we fit four
alternative models of evolution (White Noise, Brownian motion, Ornstein-Uhlenbeck
and Early-Burst) on song characteristics of suboscine (Thamnophilidae, Tyrannidae and
Pipridae) and oscine families (Parulidae and Turdidae). Interspecific variation in
acoustic traits was summarized using principal component analyses and the resulting
scores were used for model fitting. The first PC, which accounted for approximately
40% of the variance in all datasets, indicated that the main axis of birdsong evolution
involves changes in frequency parameters. In addition, the simplest models (WN and
BM) showed the best fit to most of song principal component scores. Despite extensive
evidence from the literature on the role of environment and morphology in constraining
song frequency, these constraints do not seem to translate into macroevolutionary
timescales. One possibility for this discrepancy is that birdsong plasticity might ensue
due to its multivariate nature: song is the result of temporal and frequency components
and birds can change some of these components depending on their singing context.
Keywords: Oscines, Suboscines, Brownian motion, Ornstein-Uhlenbeck, phylogenetic
comparative methods, Early Burst, acoustic communication.
48
5.2. Background
Birds are among the animals with the highest diversity in acoustic
communication. There is considerable variation in the types of signals produced by
birds, including songs, mechanical sounds, alarm calls, and echolocation (Suthers &
Hector 1982, 1985, Prum 1998, Catchpole & Slater 2008). Among all these vocalization
types, songs have been the main focus of bioacoustic research, given that they play
important roles in the contexts of sexual attraction and territorial defence and therefore
are likely to be under strong natural and sexual selection (Slater 1989, Price 1998,
Nowicki & Searcy 2004). Historically, phylogenetic comparative methods have been
used in birdsong studies to reconstruct vocal evolution in some clades (Price & Lanyon
2002, 2004, Price et al. 2007), to test the correlated evolution between song and
morphology or environmental conditions (Seddon 2005, Tobias & Seddon 2009,
Cardoso 2010, Tobias et al. 2010), or to assess the level of evolutionary conservatism in
certain song characteristics (Marler & Pickert 1984, Payne 1986, Price & Lanyon 2002).
However, despite an extensive literature on song evolution, little attention has been
given to understand the tempo and mode of evolution of song characteristics.
Interspecific patterns of song diversity suggest that their distribution it is not
equal: some clades show considerable differences while others exhibit little variation,
suggesting that mechanisms that shape song evolution could act in a different way
depending on clade and region. For example, at low-latitude tropical forests, songs seem
to have experienced more environmental pressure when compared to open habitats or at
higher latitudes, yet song length seems unaffected by latitude in either oscines or
suboscines (Weir et al. 2012). Furthermore, variation in syllable diversity shows a
gradient in oscine songs, which exhibit rates 20 times higher at temperate latitudes
(Weir & Wheatcroft 2011). These examples show that song diversification is not

49
constant, but instead can be accelerated or decelerated according to context where bird
lineages evolve.
Recent advances in phylogenetic comparative methods allow for fitting more
realistic models of song trait evolution than the classical Brownian motion (BM) or
Ornstein-Uhlenbeck (OU) models, the two more commonly used models in
phylogenetic comparative analysis (Felsenstein 1985, Butler & King 2004). Brownian
motion is a neutral model, in which the variance in a given trait accumulates at a
constant rate along each branch of the phylogeny. In this model the differences between
species traits grow linearly with the evolutionary time, and there is not an adaptive
component (Dias-Uriarte and Garland Jr. 1996, Pagel 1997, Blomberg et al. 2003,
Freckleton and Jetz 2009). On the contrary, in the OU model the phenotypic traits are
subject to genetic or environmental constraints, being constraint defined as the property
of a trait that, although possibly adaptative in the environment in which it originally
evolved, acts to place limits on the production of new phenotypics variants (Butler and
King 2004). More recently Blomberg et al. 2003 and Harmon et al. (2010), developed
the Early Burst model (or ACDC model), in which the earliest divergences in the
phylogenetic tree account for a substantial fraction of the total trait disparity in a clade
(Harmon. We argue that the application of alternative models on song traits can provide
valuable insights into the mechanisms underlying birdsong evolution.
In this study we explored the fit of four models of evolution: White Noise (non
phylogenetic model), Brownian motion, Ornstein-Uhlenbeck and Early-Burst on song
parameters of suboscine (Thamnophilidae, Tyrannidae and Pipridae) and oscine families
(Turdidae and Parulidae). We used the models as exploratory tools for comparing
patterns of song evolution between families in which the song is either innate (suborder
Suboscines) or learned (suborder Oscines). We believe that testing the relative fit of
evolutionary models using families with a broad variation in ecology, behaviour,
morphology and distribution can give us insights about differences in the evolutionary
processes shaping birds songs.
5.3. Methods
We measured a total of 3173 songs from three suboscine (Thamnophilidae,
Tyrannidae and Pipridae) and two oscine families (Turdidae and Parulidae) (Table 1).
50
Recordings were obtained from the following collections: Instituto de Investigación de
Recursos Biológicos Alexander Von Humboldt (Colombia), Acervo Neotropical Elias
Coelho (Universidade Federal do Rio de Janeiro, Brazil), Macaulay Library (Cornell
University, EUA), XENO-CANTO database (http://www.xeno-canto.org), and private song
collections of Jeremy Minns and Christian Borges Andretti. Songs with sample rate and
resolution less than 22.050 Hz and 16 bits were discarded. For suboscines we measured
one phrase in each song per individual, given this suborder shows stereotyped songs
with little variation in repertoire. However, in oscines, due to learning, one individual
can sing a large number of different phrases within a song. In this case, to capture the
song variation throughout a species, we analysed all the different phrases sung by each
individual within an interval of three minutes.
Spectrograms were generated using the software AVISOFT SAS Lab Pro 5.1,
with the following specifications: Window: Hamming, FFT: 256, Frame Size: 100%,
and Overlap: 88%. We used the “two thresholds” automatic parameters with the
threshold fitted to each song independently, visualizing the best cutoff value in the
power spectrum graphic, allowing the selection of all notes and excluding the noise in
the background. For all songs, we estimated the following acoustic measurements: 1)
mean song duration (SD): (s), the duration from the beginning of the first element (note)
to the end of the last element in the song; 2) mean number of notes (NN): number of
elements (notes) detected within the song; 3) element rate (ER): (s), the average
duration of the elements (notes) within a song;4) peak frequency (PF): (KHz), at
maximum spectrum (peak hold) of the entire song; 5) Maximum frequency (Fmax):
(kHz), the highest frequency across the entire song; 6) Minimum frequency (Fmin):
(kHz), the lowest frequency across the entire song; 7) Frequency Bandwidth (FB):
(KHz), the range in frequency values within a song. FB was obtained by subtracting

51
Fmin from Fmax; 8) Number of different notes (NDN): the number of different note types
found within a phrase. NDN was used as a proxy for song complexity.
To measure the Fmin and Fmax we used the manual cursor, given songs showed
considerable variation in relation to the presence of harmonics and, as a consequence,
the accurate automatic estimation of these parameters could be compromised. Figure 1
illustrates these quantitative measures in a spectrogram. To each family, we reduced the
dimensionality in the song dataset through a Principal Component Analysis (PCA),
using correlation matrix on the standardized mean values within species and the broken
stick criterion to select PC axes for further analyses.
We obtained estimates of relative divergence times of the studied lineages using
the following phylogenies: Thamnophilidae (Gomez et al. 2010), Tyrannidae (Ohlson et
al. 2008), Pipridae (Ohlson et al. 2013), Turdidae (Klicka et al. 2005) and Parulidae
(Lovette et al. 2010). We used the “fitContinuous” function in GEIGER 2.0.1 (Harmon et
al. 2008) to fit four evolutionary models for each song principal component separately,
namely White Noise (WN), Brownian motion (BM), Ornstein-Uhlenbeck (OU) (with
one peak) and Early Burst (EB). WN is a non phylogenetic model, which predicts a
single normal distribution of the data without a covariance structure among taxa. BM
model assumes that the variance in a given trait accumulates at a constant rate along
each branch of the phylogeny; OU add the “α” parameter to the BM model, which
represent the strength (or constraint) that return the trait to their original state (Butler &
King 2004). Finally, the EB model has the “a” parameter, which allows the rate of
evolution increase or decrease exponentially through time (Harmon et al. 2008). The
best-fit model for the scores of each principal component was chosen based on the
lowest AICc values (Harmon et al. 2010).
52
5.4. Results
Despite substantial differences in ecology, distribution, and behaviour between
the studied families, according to their PCAs, much of the structure of the observed
variation in song characteristics was largely consistent between them (Table 2). The
first PC, which accounted for approximately 40% of the variance in all datasets,
indicated that the main axis of birdsong evolution involves changes in frequency
parameters (PF, Fmax, Fmin, and FB) with fairly similar loadings to Thamnophilidae,
Tyrannidae, Parulidae and Pipridae. In Turdidae, however, there was a more
homogeneous contribution to PC1 of all variables except frequency bandwidth (Table
2), pointing to a more unique correlation structure for this family. In particular, turdid
minimum and maximum frequency loaded most strongly on PCs 2 and 3, respectively.
The remaining PCs (PC2-PC4) showed more idiosyncratic patterns for each family, but
mostly reflected different aspects of temporal parameters (SD, NN and NR) (Table 2).
A comparison between all four candidate models of evolution (WN, BM, OU,
and EB) on each of the song PCs showed that, in general, the simplest models presented
the best fit (Table 3). In particular BM and WN models showed the lowest AICc values
for the majority of song principal components. In Thamnophilidae, BM was the model
with the best fit to both frequency and temporal parameters (PC1 and PC3 respectively).
BM was also the preferred model for PC1 and PC4 in Parulidae, and for PC1 in
Turdidae. The WN model was the best-fit model to all principal components in
Tyrannidae songs, to temporal parameters (SD, NN e SR) and song complexity (NDN)
in Pipridae and Turdidae songs (PC2 and PC3 respectively), and to frequency (PC3) in
Parulidae songs. The OU and EB models, which represent more complex scenarios,
showed similar support according to AICc values as the best fit models to PC2,
53
representing temporal song parameters in Thamnophilidae and temporal and complexity
song parameters in Parulidae songs (Table 3).
5.5. Discussion
Contrary to classical ideas suggesting constraints on birdsong imposed by
environment, morphology or physiology (Podos et al. 2004, Boncoraglio & Saino 2007,
Brumm & Naguib 2009, Wilkins et al. 2013), our results suggests that, at least in the
five families investigated in the present study, acoustic properties of birdsong evolved
according to relatively simple rules, with changes in frequency accounting for nearly
40% of the evolution of song acoustic properties. In addition, although there is
considerable variation in ecology, morphology and behaviour among the studied birds
(del Hoyo et al. 2003, 2004, 2005 and 2010), WN and BM showed the best fit to both
frequency and temporal parameters in songs (Table 3). These results suggest that
changes in these traits could have taken place at a relatively constant rate along the
phylogeny in some families, such as Thamnophilidae, Parulidae and Turdidae, with
differences accumulating in relative proportion to divergence among species. On the
other hand, the best fit of the WN model in Tyrannidae and EB in Pipridae might
suggest that changes in frequency might have been more labile in these families.
Frequency was identified as the most important axis of variation in song
evolution, given that frequency traits correlated strongly with the first principal
component in four out of five studied families (Table 2). There are many studies
suggesting that frequency song parameters are strongly subject to environmental
constraint and that species adapt their songs according to the habitat in which they have
evolved- Acoustic Adaptation Hypothesis - (Morton 1975, Wiley & Richards 1982,
Wiley 1991, Badyaev & Leaf 1997, Slabbekoorn & Smith 2002, Boncoraglio & Saino
54
2007, Derryberry 2009, Kirschel et al. 2009, Tobias et al. 2010, Wilkins et al. 2013).
Furthermore, evidences suggest that morphological or physiological constraints could
limit the frequency spectrum in which birds are capable to produce sounds (Podos et al.
2004). For instance, the production of some frequency spectra depends on the length of
vocal tract, which is related to body size (Podos 1997, Podos 2001, Bradbury &
Vehremcamp 1998). Therefore, one could expect that the OU model should fit better to
song frequency parameters, given that this model could potentially incorporate these
environmental or morphological/physiological constraints, yet it was not the best-fit
model in PC1 scores of any of the investigated families. We argue that, despite these
real constraints imposed on song evolution, birdsong plasticity might ensue due to its
multivariate nature: song is the result of temporal and frequency components and birds
can change some of these compounds depending on their singing context. For instance,
some species can change their perch height to avoid song degradation while singing
(Nemeth et al. 2001, Barker & Mennill 2009, Barker et al. 2009), change the frequency
spectrum or amplitude level of their songs at noisy environments (Brumm & Naguib
2009, Hu & Cardoso 2010, Bermúdez-Cuamatzin et al. 2010, Halfwerk et al. 2011,
Schuster et al. 2012), or even modify their singing pattern through the alternation in
note repetition in response to other signallers (Bermúdez-Cuamatzin et al. 2010, Francis
et al. 2011). This phenomenon can be observed in the case of wood warblers, where the
relationship between syllable repetition and song complexity can lead to the evolution
of simple, rather than elaborated songs (Cardoso & Hu 2011). Despite the fact that those
authors did not specifically fit models of evolution on song traits, their study used other
comparative methods and showed that evolution does not always follows the most
complex way, same in traits recognized to be subject to direct sexual selection as
birdsong.
55
Our study results disagree with those found by Weir et al. (2012), which
supported OU model as the best model to explain song evolution in oscine and
suboscine birds from tropical and temperate environments. Those authors claimed that
frequency was more constrained in tropical than temperate zones, because of the
elevated background noise caused by insects and frequency attenuation present in
tropical environments. On the other hand, another study that fitted BM and OU models
testing AAH found more support for constraint in temporal and structural song features
than frequency parameters (Mason 2012). However, it is important to mention that both
authors only fitted OU and BM models to song traits, which could limit their
explanatory power. The present study is the first to investigate the fit of alternative
evolutionary models on song traits for a large dataset of oscine and suboscine lineages.
However, a common caveat among these two studies and our results is that behavioural
information associated with the recording context was ignored, given that the analysed
recordings are from sound collections, in which this information is frequently not
available. Future research fitting evolutionary models on song traits could focus in bird
assemblages and field experiments, aiming at collecting behavioural data associated to
the recording context (e.g. perch height, presence of co-specific, presence of female,
etc.).
Acknowledgments
We thank G. Decker for assistance during data acquisition, M. Webster and Cornell Lab
of Ornithology for hosting a visit by V. D.. We also thank D. Bilski, C. R. Firkowski,
for valuable comments on previous versions of this manuscript. VD was funded by
REUNI/CAPES scholarship (grant 0225-12-6) and MRP was funded by CNPq/MCT
(grant 571334/2008-3).

56
5.6. References
Badyaev, A.V. & Leaf, E. S. 1997. Habitat associations of song characteristics in
Phylloscopus and Hippolais Warblers. Auk 114: 40-46.
Barker, N. K. S & Menill, D. J. 2009. Song perch height in Rufous-and-White Wrens:
does behaviour enhance effective communication in a tropical forest? Ethology 115:
897-904.
Barker, N. K. S, Dabelsteen, T. & Mennill, D. J. 2009. Degradation of male and female
rufous-and-white wren songs in a tropical forest: effects of sex, perch height, and
habitat. Behaviour 146: 1093-1122.
Bermúdez-Cuamatzin, E., Ríos-Chelén, A., Gil, D. & Garcia, C. M. 2010. Experimental
evidence for real-time song frequency shift in response to urban noise in a passerine
bird. Biol. Lett.7: 36-38.
Blomberg, S. P., Garland Jr., T., Ives, A. R. 2003. Testing for phylogenetic signal in
comparative data: Behavioral traits are more labile. Evolution 57: 717-745.
Boncoraglio, G. & Saino, N. 2007. Habitat structure and the evolution of bird song: a
meta-analysis of the evidence for the acoustic adaptation hypothesis. Funct. Ecol. 21:
134-142.
Bradbury, J. W. & Vehrencamp, S. L. 1998. Principles of animal communication.
Sinauer, Sunderland, MA.
Butler, M. A. & King, A. A. 2004. Phylogenetic comparative analysis: a modeling
approach for adaptive evolution. Am. Nat. 164: 683-695.
Brumm, H. & Naguib, M. 2009. Environmental Acoustics and the Evolution of Bird
Song. Adv. Stud. Behav. 40: 1-33.
Cardoso, G. C. & Hu, Y. 2011. Birdsong Performance and the Evolution of Simple
(Rather than Elaborate) Sexual Signals. Am. Nat. 178: 679-686.

57
Catchpole, C. K. & Slater, P. J. B. 2008. Bird song: Biological Themes and Variations,
2nd ed. Cambridge, UK: Cambridge University Press.
Collar, N. 2005. Family Turdidae (Thrushes). In: Handbook of the Birds of the World,
Vol. 10. Cuckoo-shrikes to Thrushes (J.del Hoyo, A. Elliott & J. Sargatal), pp. 514-
807. Lynx Edicions, Barcelona.
Curson, J. 2010. Family Parulidae (New World Warblers). In: Handbook of the Birds of
the World, Vol.15. Weaves to New World Warblers (J. del Hoyo, A. Elliott & J.
Sargatal), pp. 666-800. Lynx Edicions, Barcelona.
Derryberry, E. 2009. Ecology Shapes Birdsong Evolution: Variation in Morphology and
Habitat Explains Variation in White-Crowned Sparrow Song. Am. Nat. 174: 24-33.
Felsenstein, J. 1985. Phylogenies and the comparative method. Am. Nat. 125: 1-15.
Fitzpatrick, J., Bates, J., Bostwick, K., Caballero, I., Clock, B., Farnsworth, A. et al
2004. Family Tyrannidae (Tyrant-flycatchers). Handbook of the Birds of the World,
Vol. 9. Cotingas to Pipits and Wagtails (J.del Hoyo, A. Elliott & J. Sargatal), pp.
170-462. Lynx Edicions, Barcelona.
Francis, C. D., Ortega, C. P. & Cruz. A. 2011. Different behavioural responses to
anthropogenic noise by two closely related passerine birds. Biol. Lett. 7: 850-852.
Gómez, J. P., Bravo, G. A., Brumfield, R. T., Tello, J. G., & Cadena, C. D. 2010. A
phylogenetic approach to disentangling the role of competition and habitat filtering in
community assembly of Neotropical forest birds. J. Anim. Ecol. 79: 1181-1192.
Halfwerk, W., Bot, S., Buikx, J., van der Velde, M., ten Cate, C. & Slabbekoorn, H.
2011. Low-frequency songs lose their potency in noisy urban conditions. PNAS 108:
14549-14554.

58
Harmon, L. J., Losos, J. B., Davies, T. J., Gillespie, R. G., Gittleman, J. L., Jennings, B.
et al. 2010. Early bursts of body size and shape evolution are rare in comparative
data. Evolution 64: 2385-2396.
Harmon, L. J., Weir, J. T., Brock, C. D., Glor, R. E. & Challenger, W. 2008. GEIGER:
investigating evolutionary radiations. Bioinformatics 24: 129-131.
Harmon, L. J., Schulte, J. A., Losos, J. B. & Larson, A. 2003. Tempo and mode of
evolutionary radiation in iguanian lizards. Science 301: 961-964.
Hu, Y. & Cardoso, G. C. 2010.Which birds adjust the frequency of vocalizations in
urban noise? Anim. Behav. 79: 863-867.
Kirschel, A. N. G., Blumstein, D. T., Cohen, R. C., Buermann, W., Smith, T. B. &
Slabbekoorn, H. 2009. Birdsong tuned to the environment: green hylia song varies
with elevation, tree cover, and noise. Behav. Ecol. 20: 1089-1095.
Klicka, J., Voelker, G. & Spellman, G. M. 2005. A molecular phylogentic analysis of
the “true thrushes” (Aves: Turdinae). Mol. Phylogenet. Evol. 34: 486-500.
Lovette, I. J., Pérez-Emán, J. L., Sullivan, J. L., Banks, R. C., Fiorentino, I., Córdoba-
Córdoba, S. et.al. 2010. A comprehensive multilocus phylogeny for the Wood-
Warblers and a revised classification of the Parulidae (Aves). Mol. Phylogenet. Evol.
57: 753-770.
Lovette, I, J. & Bermingham, E. 1999. Explosive speciation in the New World
Dendroica warblers. Proc. R. Soc. Lond. B 266: 1629-1636.
Marler, P. & Pickert, R. 1984. Species-universal micro-structure in the learned song of
the swamp sparrow, Melospiza georgiana. Anim. Behav. 32: 673-689.
Mason, N. 2012. Song complexity and its evolutionary correlates across a continent-
wide radiation of songbirds. MSc thesis, San Diego State University.

59
Nemeth, E., Winkler, H. & Dabelsteen, T. 2001. Differential degradation of antbird
songs in a neotropical rainforest: adaptation to perch height? J. Acoust. Soc. Am. 110:
3263-3274.
Nowicki, S. & Searcy, W. 2004. Song function and the evolution of female preferences:
Why birds sing and why brains matter. In: Behavioral Neurobiology of Birdsong (H.
P. Zeigler & P. Marler), pp 1-37. New York Academy of Sciences Press, New York.
Ohlson, J. I., Fjeldså, J. & Ericson, P. G. P. 2013. Molecular phylogeny of the manakins
(Aves: Passeriformes: Pipridae), with a new classification and the description of a
new genus. Mol. Phylogen. Evol. 69: 796-804.
Ohlson, J., Fjeldså, J. & Ericson, P. G. P. 2008. Tyrant flycatchers coming out in the
open: phylogeny and ecological radiation of Tyrannidae (Aves, Passeriformes). Zool.
Scripta 37: 315-335.
Phillimore, A. B. & Price, T. D. 2008. Density-dependent cladogenesis in birds. PLOS
Biol.6: 483-489.
Podos, J., Huber, S. K. & Taft, B. 2004. Bird Song: the interface between evolution and
mechanism. Annu. Rev. Ecol. Evol. Syst. 35: 55-87.
Podos, J. 2001. Correlated evolution of morphology and vocal signal structure in
Darwin’s Finches. Nature 409: 185-187.
Podos, J. 1997. A performance constraint on the evolution of trilled vocalizations in a
songbird family (Passeriformes: Emberizidae). Evolution 51: 537-551.
Price, T. 1998. Sexual selection and natural selection in bird speciation. Phil. Trans. R.
Soc. Lond. B 353: 251-260.
Price, J. J. & Lanyon, S. M. 2002. Reconstructing the evolution of complex bird song in
the oropendolas. Evolution 56: 1514-1529.
60
Price, J. J. & Lanyon, S. M. 2004. Patterns of song evolution and sexual selection in the
oropendolas and caciques. Behav. Ecol. 15: 485-497.
Price, J. J., Friedman, N. R, & Omland, K. E. 2007. Song and plumage evolution in the
New World orioles (Icterus) show similar lability and convergence in patterns.
Evolution 61: 850-863.
Prum, R. O. 1998. Sexual selection and the evolution of mechanical sound production in
manakins (Aves: Pipridae). Anim. Behav. 55: 977-994.
Rabosky, D & Lovette, I. J. 2008. Density-dependent diversification in North American
wood warblers. Proc. R. Soc. B. 275: 2363-2371.
Schuster, S., Zollinger, S. A., Lesku, J. A. & Brumm, H. 2012. On the evolution of
noise-dependent vocal plasticity in birds. Biol. Lett. 8, doi: 10.1098/rsbl.2012.0676.
Slabbekoorn, H. & Smith, T. B. 2002. Bird song, ecology and speciation. Philos. Trans.
R. Soc. Lond. B 357: 493-503.
Slater, P. J. B. 1989. Bird song learning: causes and consequences. Ethol. Ecol. Evol.
1:19-46.
Snow, D. 2004. Family Pipridae (Manakins). In: Handbook of the Birds of the World,
Vol. 9. Cotingas to Pipits and Wagtails (J. del Hoyo, A. Elliott & J. Sargatal), pp.
110-169. Lynx Edicions, Barcelona.
Suthers, R. A. & Hector, D. H. 1982. Mechanism for the Production of Echolocation
Clicks by the Grey Swiftlet, Collocmias podiopygia. J. Comp. Physiol. 148: 457-470.
Suthers, R. A. & Hector, D. H. 1985. The physiology of vocalization by the
echolocating oilbird, Steatornis caripensis. J. Comp. Physiol. 56: 243-266.
Seddon, N. 2005. Ecological adaptation and species recognition drives vocal evolution
in Neotropical suboscine birds. Evolution 59: 200-215.

61
Tobias, J. A. & Seddon, N. 2009. Sexual selection and ecological generalism are
correlated in antbirds. J. Evol. Biol. 22: 623-636.
Tobias, J. A., Aben, J., Brumfield, R.T., Derryberry, E., Halfwerk, W., Slabbekoorn, H.
et al. 2010. Song divergence by sensory drive in Amazonian birds. Evolution 64:
2820-2839.
Zimmer, K. & Isler, M. 2003. Family Thamnophilidae (Typical Antbirds). In:
Handbook of the Birds of the World, Vol. 8. Broadbills to Tapaculos (J. del Hoyo, A.
Elliott & J. Sargatal), pp. 448-681. Lynx Edicions, Barcelona.
Weir, J. T., Wheatcroft, D. & Price. T. 2012. The role of ecological constraint in driving
the evolution of avian song frequency across a latitudinal gradient. Evolution 66:
2773-2783.
Weir, J. T. & Wheatcroft, D. 2011. A latitudinal gradient in rates of evolution of avian
syllable diversity and song length. Proc. R. Soc. Lond. B. 278: 1713-1720.
Weir, J. T. 2006. Divergent timing and patterns of species accumulation in lowland and
highland Neotropical birds. Evolution 60: 842-855.
Wiley, R. H. 1991. Associations of song properties with habitats for territorial oscine
birds of eastern North America. Am. Nat. 138: 973-993.
Wiley, R. H. & Richards, D. G. 1982. Adaptations for acoustic communication in birds:
sound transmission and signal detection. In: Acoustic Communication in Birds (D.
E. Kroodsma & E. H. Miller), pp. 131-181. Academic Press, New York and
London.
Wilkins, M. R., Seddon, N. & Safran, R. J. 2013. Evolutionary divergence in acoustic
signals: causes and consequences. Trends Ecol. Evol. 28: 156-166.

62
FIGURE CAPTIONS
Figure 1. Spectrogram illustrating seven quantitative song measurements used in the
present study (Myrmecyza laemosticta XC3303). SD: song duration (s), the duration
from the beginning of the first element (note) to the end of the last element in the song;
(NN): number of elements (notes) detected within the song; ER: element rate (s), the
average duration of elements (notes) within a song; Fmax: Maximum frequency (kHz),
the highest frequency across the entire song; Fmin: Minimum frequency (kHz), the
lowest frequency across the entire song; FB: Frequency Bandwidth (KHz), the range in
frequency values within a song. NDN: Number of different notes types found within a
phrase. This spectrogram shows three different notes types signed by “a”, “b” and “c”.
PF: Peak frequency also was measured but was omitted here because it is impossible
visually to determine in which pixel within a spectrogram represent the higher sound
energy, which characterizes peak frequency.
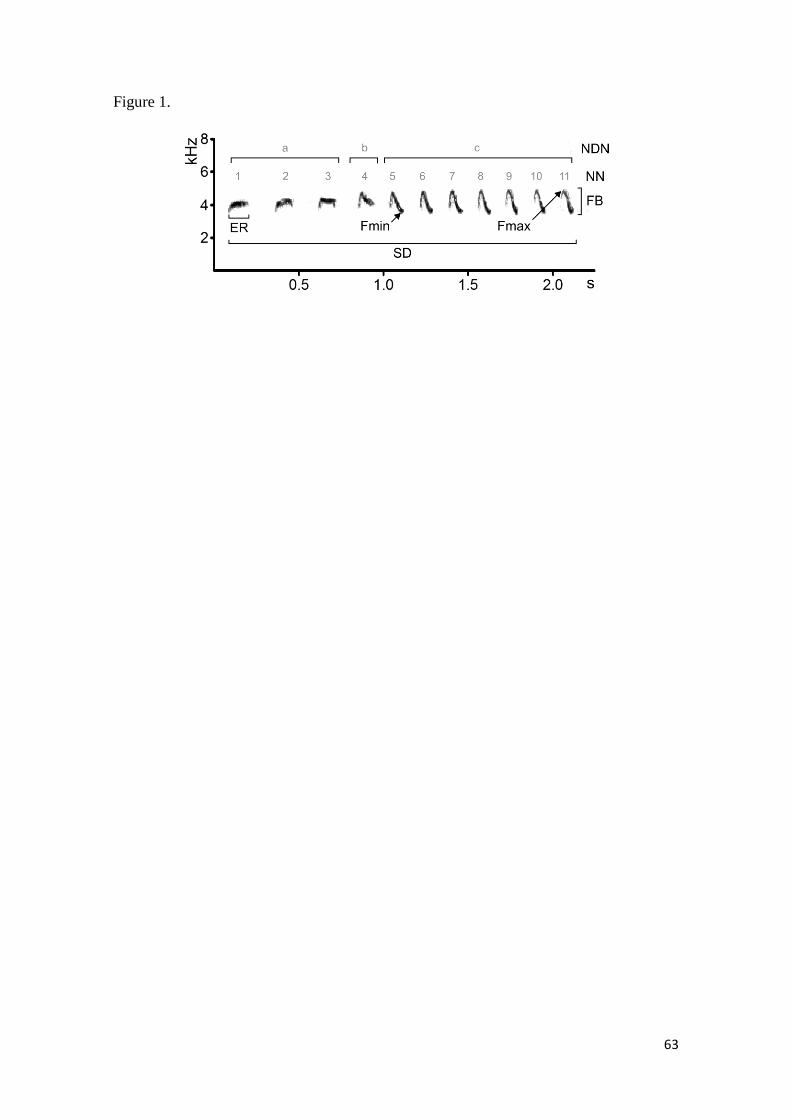
63
Figure 1.

64
Table 1.Number of species and recordings per family with mean and standard deviation of each song trait analysed in this study.
Thamnophilidae Tyrannidae Pipridae Parulidae Turdidae
Number of species 122 77 35 75 27
Number of recordings 842 684 220 414 1013
Mean number of recordings per species
(range) 6.902 (1-31) 8.883 (1-40) 6.286 (1-22) 15.333 (1-30) 13.507 (1-27)
Song duration (SD) (s) 3.05 ± 2.88 1.18 ± 0.86 0.71 ± 0.57 2.22 ± 1.30 2.66 ± 2.69
Number of notes (NN) 15.03 ± 10.07 9.96 ± 10.04 3.56 ± 2.96 15.63 ± 10.50 8.92 ± 12.86
Element rate (ER) 0.27 ± 0.19 0.16 ± 0.16 0.21 ± 0.34 0.17 ± 0.05 0.28 ± 0.16
Peak frequency (PF) (Hz) 2988.99 ± 1300.35 4223.66 ± 1436.26 3694.72 ± 1565.18 5262.17 ± 1104.91 3360.54 ± 853.66
Maximum frequency (Fmax) (Hz) 3647.70 ± 1576.18 5293.19 ± 1800.11 4670.72 ± 1755.39 7481.44 ± 1451.69 5512.43 ± 1721.71
Minimum frequency (Fmin) (Hz) 2002.69 ± 1009.00 2225.09 ± 1178.88 2141.18 ± 1231.83 3114.84 ± 1024.71 2020.70 ± 556.23
Frequency bandwidth (FB) (Hz) 1645.01 ± 827.61 3068.11 ± 1413.95 2529.54 ± 1138.22 4366.60 ± 1162.09 3491.74 ± 1673.46
Number of different note types (NDN) 1.90 ± 0.61 2.25 ± 0.97 1.74 ± 0.82 4.75 ± 3.78 4.93 ± 4.51
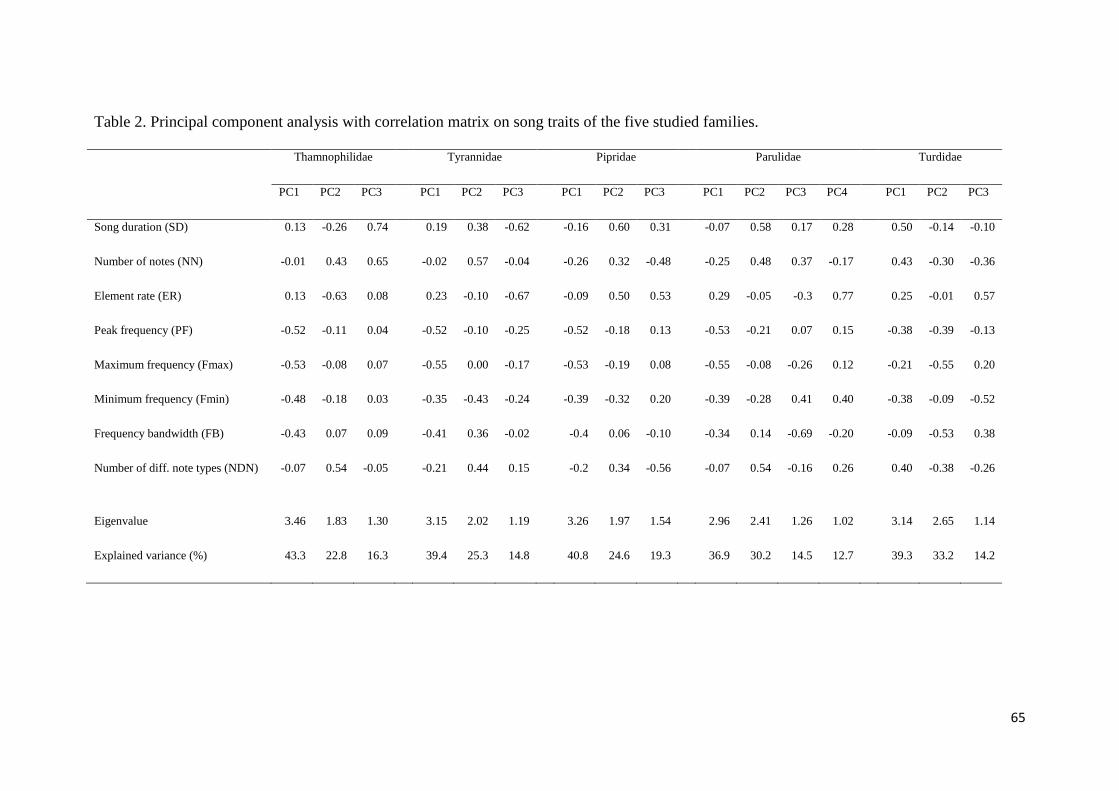
65
Table 2. Principal component analysis with correlation matrix on song traits of the five studied families.
Thamnophilidae
Tyrannidae
Pipridae
Parulidae
Turdidae
PC1 PC2 PC3
PC1 PC2 PC3
PC1 PC2 PC3
PC1 PC2 PC3 PC4
PC1 PC2 PC3
Song duration (SD) 0.13 -0.26 0.74
0.19 0.38 -0.62
-0.16 0.60 0.31
-0.07 0.58 0.17 0.28
0.50 -0.14 -0.10
Number of notes (NN) -0.01 0.43 0.65
-0.02 0.57 -0.04
-0.26 0.32 -0.48
-0.25 0.48 0.37 -0.17
0.43 -0.30 -0.36
Element rate (ER) 0.13 -0.63 0.08
0.23 -0.10 -0.67
-0.09 0.50 0.53
0.29 -0.05 -0.3 0.77
0.25 -0.01 0.57
Peak frequency (PF) -0.52 -0.11 0.04
-0.52 -0.10 -0.25
-0.52 -0.18 0.13
-0.53 -0.21 0.07 0.15
-0.38 -0.39 -0.13
Maximum frequency (Fmax) -0.53 -0.08 0.07
-0.55 0.00 -0.17
-0.53 -0.19 0.08
-0.55 -0.08 -0.26 0.12
-0.21 -0.55 0.20
Minimum frequency (Fmin) -0.48 -0.18 0.03
-0.35 -0.43 -0.24
-0.39 -0.32 0.20
-0.39 -0.28 0.41 0.40
-0.38 -0.09 -0.52
Frequency bandwidth (FB) -0.43 0.07 0.09
-0.41 0.36 -0.02
-0.4 0.06 -0.10
-0.34 0.14 -0.69 -0.20
-0.09 -0.53 0.38
Number of diff. note types (NDN) -0.07 0.54 -0.05
-0.21 0.44 0.15
-0.2 0.34 -0.56
-0.07 0.54 -0.16 0.26
0.40 -0.38 -0.26
Eigenvalue 3.46 1.83 1.30
3.15 2.02 1.19
3.26 1.97 1.54
2.96 2.41 1.26 1.02
3.14 2.65 1.14
Explained variance (%) 43.3 22.8 16.3 39.4 25.3 14.8 40.8 24.6 19.3 36.9 30.2 14.5 12.7 39.3 33.2 14.2

66
Table 3. Fit of the models of evolution on principal components of the songs traits, of five studied families. WN: White Noise, BM: Brownian
motion, OU: Ornstein-Uhlenbeck, and EB: Early burst. Numbers in bold indicate the model with the lowest AICc. See text for details.
WN BM OU EB
Family PC lnL AICc lnL AICc
lnL AICc α lnL AICc A
Thamnophilidae
PC1 -248.37 500.85 -181.25 368.71 0.96 -221.18 448.56 3.27 -221.18 448.56 6.55
PC2 -209.37 422.85 -203.07 412.35 0.55 -200.49 407.19 49.96 -200.49 407.19 99.92
PC3 -188.98 382.06 -169.57 345.35 0.91 -179.51 365.22 18.64 -179.51 365.22 37.28
Tyrannidae
PC1 -152.95 310.07 -153.59 313.51 0.18 -159.13 324.58 25.00 -159.13 324.58 50.00
PC2 -135.93 276.03 -136.86 280.05 0.00 -146.94 300.21 15.70 -146.94 300.21 31.40
PC3 -115.39 234.95 -115.02 236.38 0.00 -130.81 267.96 40.64 -130.81 267.96 81.27
Pipridae
PC1 -69.86 144.11 -67.59 141.98 0.77 -66.88 140.55 0.00 -66.56 139.92 32.85
PC2 -61.03 126.44 -61.38 129.57 0.00 -63.23 133.27 19.80 -63.23 133.27 39.59
PC3 -56.73 117.84 -57.11 121.01 0.00 -59.01 124.82 15.31 -59.01 124.82 30.62
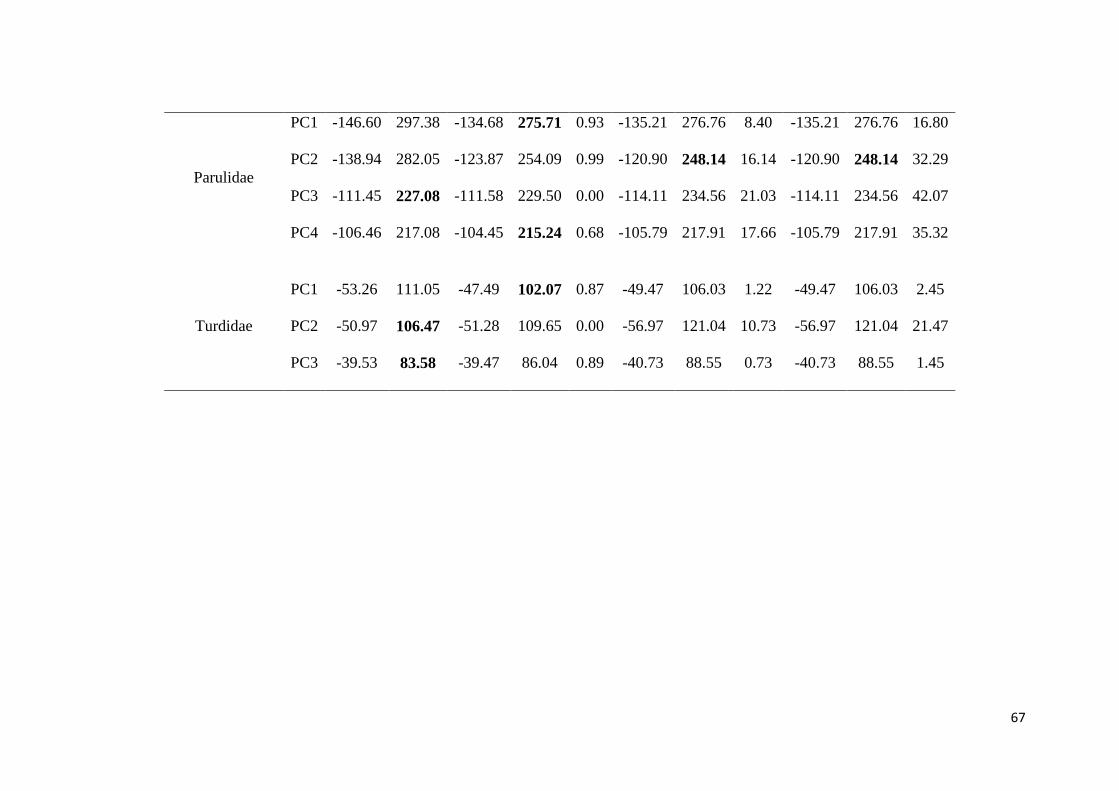
67
Parulidae
PC1 -146.60 297.38 -134.68 275.71 0.93 -135.21 276.76 8.40 -135.21 276.76 16.80
PC2 -138.94 282.05 -123.87 254.09 0.99 -120.90 248.14 16.14 -120.90 248.14 32.29
PC3 -111.45 227.08 -111.58 229.50 0.00 -114.11 234.56 21.03 -114.11 234.56 42.07
PC4 -106.46 217.08 -104.45 215.24 0.68 -105.79 217.91 17.66 -105.79 217.91 35.32
Turdidae
PC1 -53.26 111.05 -47.49 102.07 0.87 -49.47 106.03 1.22 -49.47 106.03 2.45
PC2 -50.97 106.47 -51.28 109.65 0.00 -56.97 121.04 10.73 -56.97 121.04 21.47
PC3 -39.53 83.58 -39.47 86.04 0.89 -40.73 88.55 0.73 -40.73 88.55 1.45
68
5. ARTIGO III
Morphological constraints in song structure: a comparison between
oscine and suboscine birds
Viviane Deslandes & Marcio R. Pie
Capítulo formatado de acordo com a instrução aos autores da revista “Journal of Avian
Biology”.
69
Title: Morphological constraints in song structure:
a comparison between oscine and suboscine birds
Viviane Deslandes*& Marcio R. Pie
Laboratório de Dinâmica Evolutiva e Sistemas Complexos, Departamento de Zoologia,
UFPR. Universidade Federal do Paraná (UFPR), Curitiba, PR, Brazil.
and
Programa de Pós-Graduação em Ecologia e Conservação, Universidade Federal do
Paraná (UFPR), Curitiba, PR, Brazil.
* Corresponding author.
Address for correspondence: Departamento de Zoologia, UFPR, C.P. 19020, CEP
81531-990, Curitiba, Paraná, Brazil. Phone number: +55 41 3361-1558.
70
5.1. Abstract
Body size and beak morphology are characteristics known to affect acoustic
structure in birdsongs. Birds cannot efficiently produce sound frequencies higher than
those allowed by their body size or their sound producing apparatus. Therefore, there
should be a negative relationship between song frequency and body size (frequently
represented by body mass). Song production also is affected by beak morphology due to
tradeoff in how rapidly and widely a bird can open and close the beak while singing,
leading to a negative relationship between frequency bandwidth (FB) and song rate
(SR), known as vocal deviation. In this study we investigated the generality of
morphological constraints on birdsong evolution in suboscine (Thamnophilidae,
Tyrannidae and Pipridae) and oscine (Parulidae and Turdidae) birds. We tested whether
there is a triangular negative relation between FB and SR in these families, using both
upper bound and quantile regression methods. We also tested the beak morphology and
body mass affect directly FB and SR. We used principal component analysis to
summarize four measures of beak morphology and Phylogenetic Generalized leas
square (PGLS) regression to test these relations. Upper bound results were affected by
intervals established in song rate. Using interval of 1 Hz in song rate, only Pipridae
exhibited the expected negative relation between FB and SR, but using 2 Hz,
Thamnophilidae, Pipridae and Turdidae showed significant results. The best fit of PGLS
models were that included the interaction between beak morphology and log of body
mass. Beak morphology and body mass affected FB and SR in Thamnophilidae and
Parulidae. In Thamnophilidae, small beak and small body mass produces faster rates
and broad frequency bandwidth, consistent with the hypothesis of constraints on sound
production. In Parulidae, the positive interaction between beak size and body size

71
exhibited the opposite pattern expected by constraint hypotheses, indicating that heavier
birds with larger beaks produce higher FB values.
72
5.2. Introduction
Phenotypic traits, such those involved in animal communication, may be subject
to an array of competing and/or complementary evolutionary pressures (Endler 1993).
Particularly in the case of birdsongs, evidence supports the influence of historical
factors and intra as well as interspecific variation in morphological, ecological and
behavioral traits in shaping song evolution (Podos and Warren 2007). Two
morphological characteristics that are known to affect acoustic structure in birdsongs
are body size and beak morphology. For instance, birds cannot efficiently produce
sound frequencies higher than those allowed by their body size or their sound producing
apparatus (i.e. syrinx) (Bradbury andVehremcamp 1998). As a consequence these
physical constraints, a negative relationship between song frequency and body size has
been recovered in a variety of taxa, including both passerines (Wallshlager 1980, Ryan
and Brenowitz 1985, Badyaev and Leaf 1997, Mason 2012), and non-passerines (Ryan
and Brenowitz 1985, Tubaro and Mahler 1998, Bertelli and Tubaro 2002).
In songbirds, the beak movements have an important function to sound
production. Motor constraints on beak movements during song production result in a
trade-off between how rapidly and how widely a singing bird can open and close the
beak, leading to a trade-off between song rate (number of syllable repetition divided by
song duration) and frequency bandwidth. The relationship between song rate and
frequency bandwidth is defined as vocal deviation, whereas vocal performance
corresponds to the bird’s ability to meet the trade-off between song rate and frequency
bandwidth (Podos 1997, 2001). Hence, beak morphology and function may cause
divergence in vocal performance abilities and consequently on song structure (Podos
and Nowicki 2004). A series of studies have pointed out the existence of a relationship
between vocal performance and beak size (Podos 2001, Huber and Podos 2006,
Derryberry 2009, Derryberry et al. 2012). In addition, mechanical simulations of jaw
73
movements suggest that larger beaks are more constrained in their ability to produce
rapid movements required for fast and broad-band trills than in the case of birds with
smaller beaks (Nowicki et al.1992, Podos and Nowicki 2004). For instance, in Darwin’s
finches, birds with larger beaks and body sizes exhibit songs with lower rates of syllable
repetition and narrower frequency bandwidths when compared to smaller birds (Podos
2001, Huber and Podos 2006). The same relationship was found in swamp sparrows
(Melospiza georgiana), in which the increase in beak size corresponded to a decrease on
vocal performance (Ballentine 2006).
These patterns found in songbirds are also reported in studies with suboscines.
Derryberry et al. (2012) used phylogenetic comparative methods to investigate the
relationship between beak size and song performance in Neotropical woodcreepers.
These authors analyzed a large dataset, including 52 species and 46 subspecies, and
found a positive relationship between beak size and vocal deviation across species,
indicating that birds with large beaks produce songs with low performance. On the other
hand, in thamnophilids, after controlling for the effects of phylogenetic relatedness and
body size, beak size did not predict variation in acoustic frequencies of loudsongs, but is
instead strongly related to a temporal song pattern (Seddon 2005).
Most studies relating beak morphology to bird song evolution were carried out
with songbirds (Podos et al. 2009, Cardoso and Hu 2011, Wilson et al. 2014). A few
other bird taxa have been investigated (Palacios and Tubaro 2000, Derryberry et al.
2012), and in these taxa only few studies used comparative methods to control the effect
of shared history between species (Derryberry et al. 2012). Therefore, one should have
caution when generalizing the established patterns in songbirds to other bird taxa, given
that sound production in these birds is different from suboscines. In this study we use
phylogenetic comparative methods to test the relation between song traits (frequency
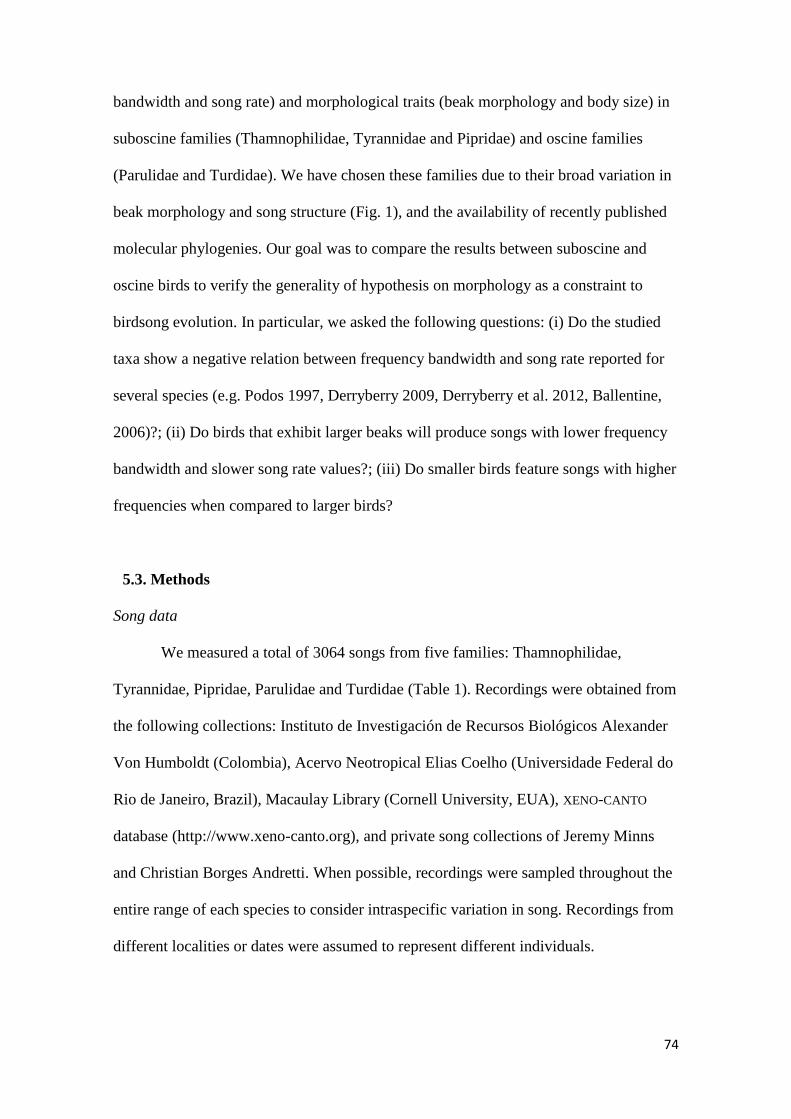
74
bandwidth and song rate) and morphological traits (beak morphology and body size) in
suboscine families (Thamnophilidae, Tyrannidae and Pipridae) and oscine families
(Parulidae and Turdidae). We have chosen these families due to their broad variation in
beak morphology and song structure (Fig. 1), and the availability of recently published
molecular phylogenies. Our goal was to compare the results between suboscine and
oscine birds to verify the generality of hypothesis on morphology as a constraint to
birdsong evolution. In particular, we asked the following questions: (i) Do the studied
taxa show a negative relation between frequency bandwidth and song rate reported for
several species (e.g. Podos 1997, Derryberry 2009, Derryberry et al. 2012, Ballentine,
2006)?; (ii) Do birds that exhibit larger beaks will produce songs with lower frequency
bandwidth and slower song rate values?; (iii) Do smaller birds feature songs with higher
frequencies when compared to larger birds?
5.3. Methods
Song data
We measured a total of 3064 songs from five families: Thamnophilidae,
Tyrannidae, Pipridae, Parulidae and Turdidae (Table 1). Recordings were obtained from
the following collections: Instituto de Investigación de Recursos Biológicos Alexander
Von Humboldt (Colombia), Acervo Neotropical Elias Coelho (Universidade Federal do
Rio de Janeiro, Brazil), Macaulay Library (Cornell University, EUA), XENO-CANTO
database (http://www.xeno-canto.org), and private song collections of Jeremy Minns
and Christian Borges Andretti. When possible, recordings were sampled throughout the
entire range of each species to consider intraspecific variation in song. Recordings from
different localities or dates were assumed to represent different individuals.
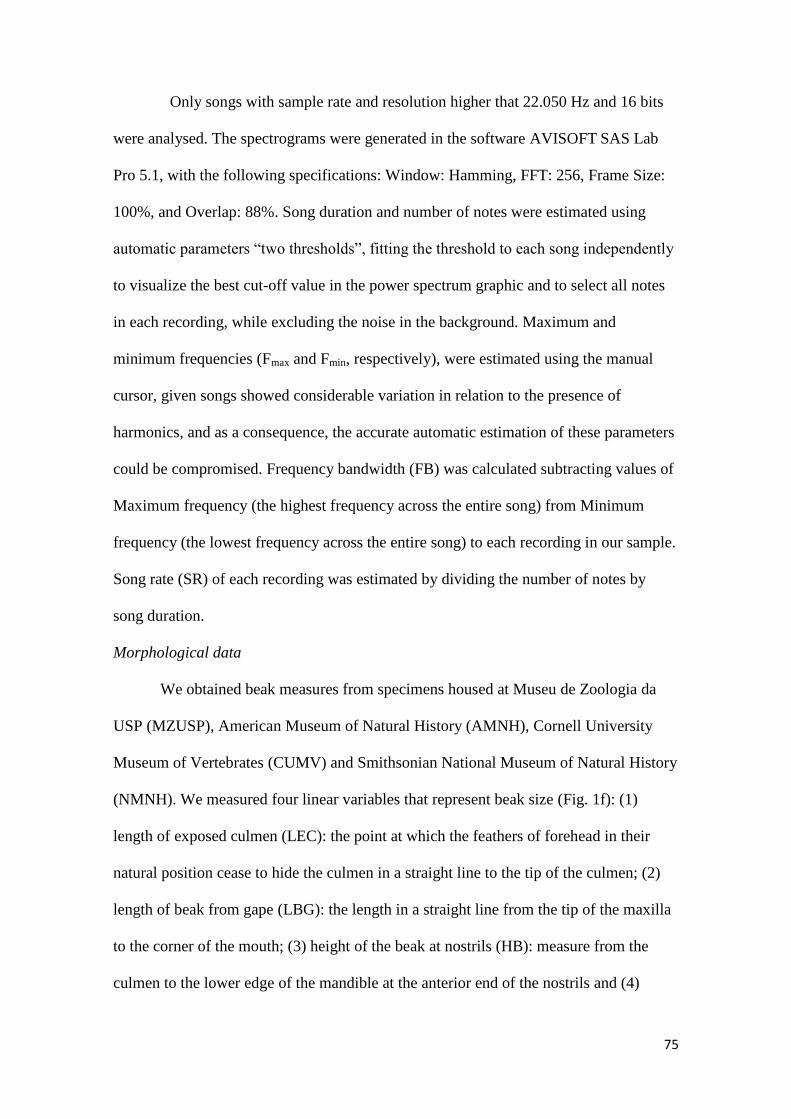
75
Only songs with sample rate and resolution higher that 22.050 Hz and 16 bits
were analysed. The spectrograms were generated in the software AVISOFT SAS Lab
Pro 5.1, with the following specifications: Window: Hamming, FFT: 256, Frame Size:
100%, and Overlap: 88%. Song duration and number of notes were estimated using
automatic parameters “two thresholds”, fitting the threshold to each song independently
to visualize the best cut-off value in the power spectrum graphic and to select all notes
in each recording, while excluding the noise in the background. Maximum and
minimum frequencies (Fmax and Fmin, respectively), were estimated using the manual
cursor, given songs showed considerable variation in relation to the presence of
harmonics, and as a consequence, the accurate automatic estimation of these parameters
could be compromised. Frequency bandwidth (FB) was calculated subtracting values of
Maximum frequency (the highest frequency across the entire song) from Minimum
frequency (the lowest frequency across the entire song) to each recording in our sample.
Song rate (SR) of each recording was estimated by dividing the number of notes by
song duration.
Morphological data
We obtained beak measures from specimens housed at Museu de Zoologia da
USP (MZUSP), American Museum of Natural History (AMNH), Cornell University
Museum of Vertebrates (CUMV) and Smithsonian National Museum of Natural History
(NMNH). We measured four linear variables that represent beak size (Fig. 1f): (1)
length of exposed culmen (LEC): the point at which the feathers of forehead in their
natural position cease to hide the culmen in a straight line to the tip of the culmen; (2)
length of beak from gape (LBG): the length in a straight line from the tip of the maxilla
to the corner of the mouth; (3) height of the beak at nostrils (HB): measure from the
culmen to the lower edge of the mandible at the anterior end of the nostrils and (4)

76
width of beak (WB): measured vertically at the level of the anterior border of nostrils
(Baldwin et al.1931, Derryberry et al. 2012). All measures were made using digital
calipers and when possible, ten individuals (five males and five females) were measured
for each species. We used the mean between sexes to characterize the variation in beak
morphology per species. Principal component analysis using correlation matrix was
performed on the logarithmized mean of beak measures (Table S1) within species to
reduce the data dimensionality. The broken stick criterion was used to retain the
principal component axes for later analysis.
Information about body mass by species was compiled from Dunning (2008) and
in del Hoyo et al. (2003 - 2005 and 2010). We used average values when only ranges
were reported or when data to male and female were reported separately. Body mass
data also was log-transformed for later analyses. There are no clear predictions about
how variation in body mass might shape the expression of vocal deviations (Podos
2001), but because body mass might constrain song frequency, we included it as a
covariate in our analyses (Table S1).
Analysis
For many species of oscine birds there is a triangular inverse relationship
between song rate and frequency bandwidth with a clear trade-off: while songs with low
rate may have narrow or broad frequency bandwidths, however, fast rate songs are
restricted to narrower bandwidths (Podos 1997). Upper bound regression -the standard
method to estimate vocal performance - consists in dividing the range of song rate
values into equal intervals, regressing only the maximum frequency bandwidth values
in each interval (Podos 1997, Wilson et al. 2014). The orthogonal deviation from this
upper limit is called vocal deviation, which is a measure of vocal performance (the
greater the deviation from the upper limit, the lower is the vocal performance), while the
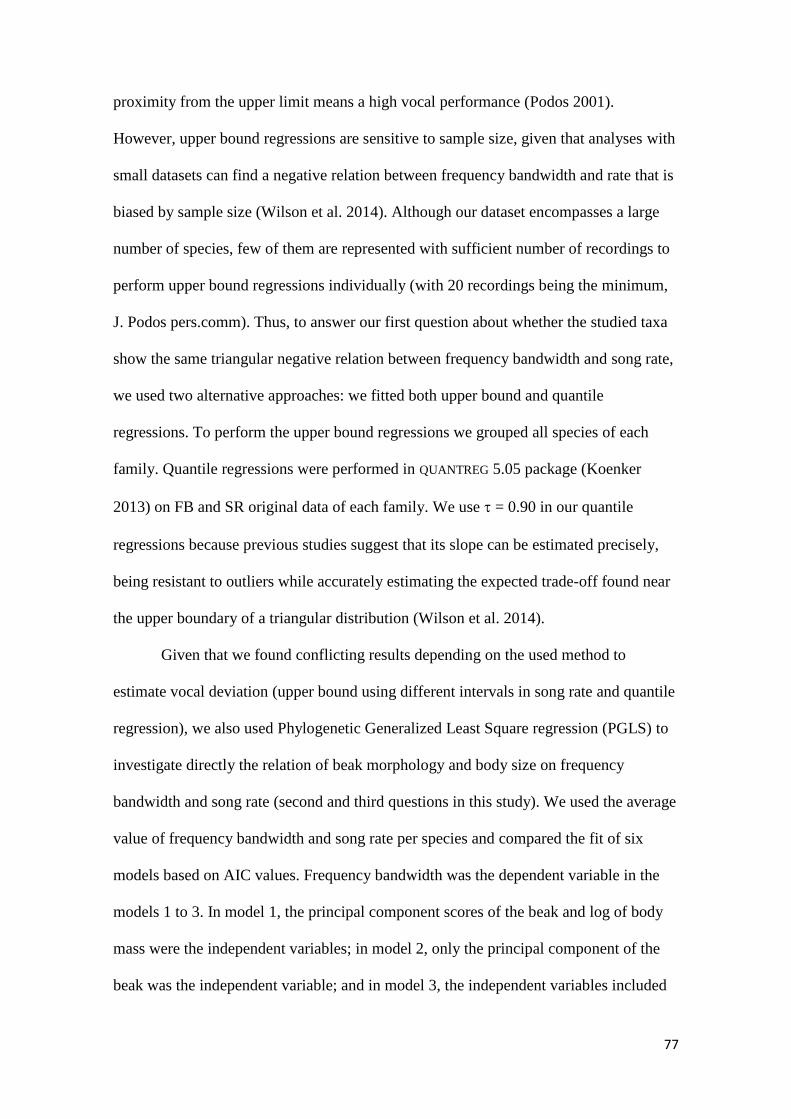
77
proximity from the upper limit means a high vocal performance (Podos 2001).
However, upper bound regressions are sensitive to sample size, given that analyses with
small datasets can find a negative relation between frequency bandwidth and rate that is
biased by sample size (Wilson et al. 2014). Although our dataset encompasses a large
number of species, few of them are represented with sufficient number of recordings to
perform upper bound regressions individually (with 20 recordings being the minimum,
J. Podos pers.comm). Thus, to answer our first question about whether the studied taxa
show the same triangular negative relation between frequency bandwidth and song rate,
we used two alternative approaches: we fitted both upper bound and quantile
regressions. To perform the upper bound regressions we grouped all species of each
family. Quantile regressions were performed in QUANTREG 5.05 package (Koenker
2013) on FB and SR original data of each family. We use = 0.90 in our quantile
regressions because previous studies suggest that its slope can be estimated precisely,
being resistant to outliers while accurately estimating the expected trade-off found near
the upper boundary of a triangular distribution (Wilson et al. 2014).
Given that we found conflicting results depending on the used method to
estimate vocal deviation (upper bound using different intervals in song rate and quantile
regression), we also used Phylogenetic Generalized Least Square regression (PGLS) to
investigate directly the relation of beak morphology and body size on frequency
bandwidth and song rate (second and third questions in this study). We used the average
value of frequency bandwidth and song rate per species and compared the fit of six
models based on AIC values. Frequency bandwidth was the dependent variable in the
models 1 to 3. In model 1, the principal component scores of the beak and log of body
mass were the independent variables; in model 2, only the principal component of the
beak was the independent variable; and in model 3, the independent variables included

78
the interaction between the principal components of the beak and log of body mass.
Models 4 to 6 followed the same scheme of models 1 to 3, only replacing frequency
bandwidth for song rate as dependent variable. In all models the phylogenetic
relationships were considered using the phylogenetic variance/covariance matrix among
species, as fitted by BM model.
5.4. Results
Results of principal component analyses of beak measurements are shown in
Table 2. PC1 explained 75-92% of the variance and was the only component retained
for further analyses based on the broken-stick criterion in four out of five studied
families. Given that the loadings on PC1 had the same sign and similar magnitudes,
scores on this PC were interpreted as reflecting a general measure of beak size. The only
exception was Pipridae, where the first two PCs had similar explained variances (49.9%
and 39.9%, respectively). In particular, loadings on the first PC in piprids can be
interpreted as a measure of relative beak depth, given the negative relationship between
HB and LBG + WB, whereas PC2 reflected mostly the relative magnitude of LEC and
HB.
We found conflicting results on tests of a triangular and negative relationship
between frequency bandwidth and song rate depending on the method used and the
interval established in song rate for the upper bound regression calculation. Using upper
bound regression with an interval of 1 Hz in song rate, we found the predicted negative
relation between FB and SR only in piprid songs (Fig. 2). However, when the used
interval in song rate was 2 Hz, Thamnophilidae, Pipridae and Turdidae exhibited
significant results (Fig. 2b, f and j). Conversely, the quantile regression between

79
frequency bandwidth and song rate showed a positive and significant relation in all
families, exception for Pipridae (Fig. 3, Table 3).
The PGLS with the best fit were those that included the interaction between
principal component of the beak and log of body mass. In particular, models 3 and 6
resulted in the lowest AIC values in all families (Table 4). The fit of all PGLS models
are presented in Table S2. A significant effect of beak morphology and body size on
frequency bandwidth and song rate was only detected in Thamnophilidae and Parulidae.
In Thamnophilidae, frequency bandwidth was inversely related to beak morphology and
body size, i.e smaller birds produce higher frequency bandwidth values and smaller
beaks produce a broader frequency bandwidth, according with the constraint hypothesis
to sound production. Conversely, song rate showed a positive relation with beak
morphology and body size: larger beaks and body size were associated to faster song
rates. However, the interaction between beak morphology and body size was inversely
related to song rate, indicating that, when these variables are considered together,
smaller beaks and body size produces the faster rates, again consistent with the
hypothesis of constraints on sound production.
Parulidae also exhibited a negative relation between frequency bandwidth and
beak morphology. However, when the interaction between beak morphology and body
size was taken into account, we found a positive and significant relation between these
variables, indicating that heavier birds with larger beaks produce higher frequency
bandwidth values, in contrast with the hypothesis of constraints on sound production
(Table 4).
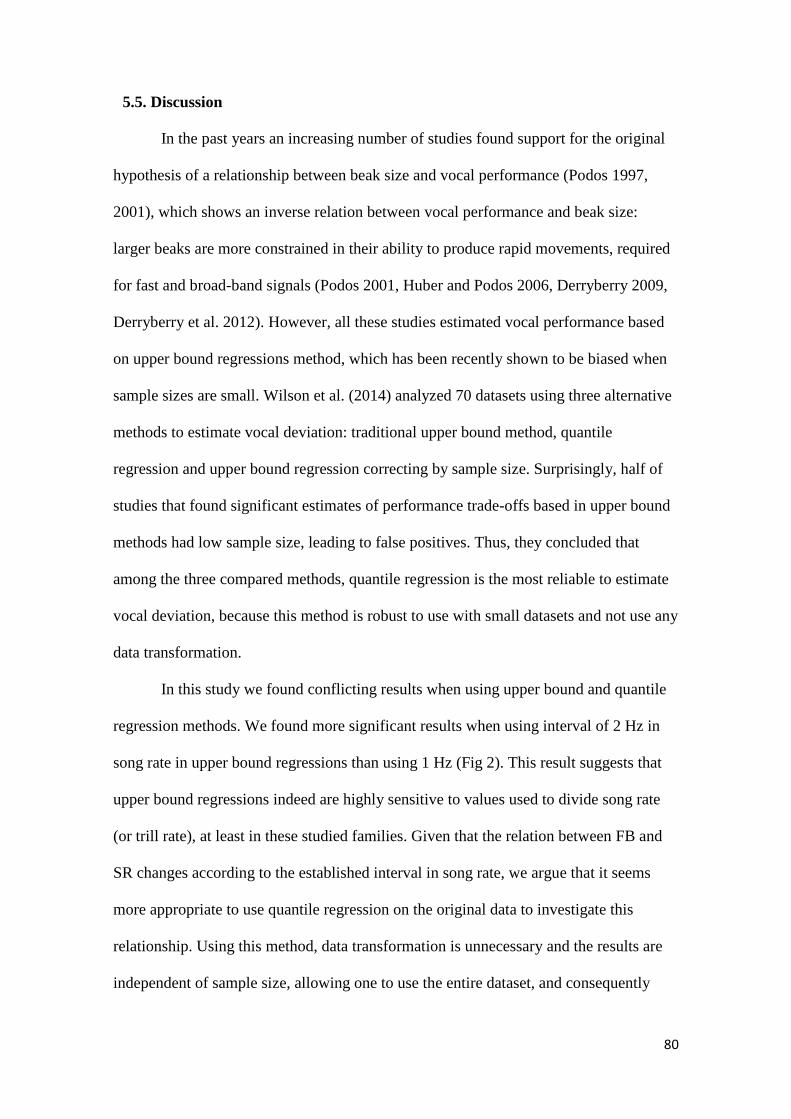
80
5.5. Discussion
In the past years an increasing number of studies found support for the original
hypothesis of a relationship between beak size and vocal performance (Podos 1997,
2001), which shows an inverse relation between vocal performance and beak size:
larger beaks are more constrained in their ability to produce rapid movements, required
for fast and broad-band signals (Podos 2001, Huber and Podos 2006, Derryberry 2009,
Derryberry et al. 2012). However, all these studies estimated vocal performance based
on upper bound regressions method, which has been recently shown to be biased when
sample sizes are small. Wilson et al. (2014) analyzed 70 datasets using three alternative
methods to estimate vocal deviation: traditional upper bound method, quantile
regression and upper bound regression correcting by sample size. Surprisingly, half of
studies that found significant estimates of performance trade-offs based in upper bound
methods had low sample size, leading to false positives. Thus, they concluded that
among the three compared methods, quantile regression is the most reliable to estimate
vocal deviation, because this method is robust to use with small datasets and not use any
data transformation.
In this study we found conflicting results when using upper bound and quantile
regression methods. We found more significant results when using interval of 2 Hz in
song rate in upper bound regressions than using 1 Hz (Fig 2). This result suggests that
upper bound regressions indeed are highly sensitive to values used to divide song rate
(or trill rate), at least in these studied families. Given that the relation between FB and
SR changes according to the established interval in song rate, we argue that it seems
more appropriate to use quantile regression on the original data to investigate this
relationship. Using this method, data transformation is unnecessary and the results are
independent of sample size, allowing one to use the entire dataset, and consequently
81
incorporating a higher number of species in the analysis, which is more interesting in
comparative studies that seek general patterns when comparing several taxa.
Furthermore, our quantile regression results exhibited the opposite pattern predicted by
vocal performance hypothesis suggesting that at least in four analyzed taxa, most
species seem not to have experienced constraints in the production of fast and broad
bandwidth signals. One possible explanaiton is that song structure in these families does
not present a sufficient fast rate to cause a trade-off, and conversely, allowed the
coexistence of high values of both FB and SR or yet, that selection on vocal
performance in these families happened in other song variables not analyzed in this
study (Wilson et al 2014).
Given that we found conflicting results using different methods to estimate vocal
deviation (upper bound vs quantile regression) and that the major question in this study
is about the influence of beak morphology and body size on song features (specifically
frequency bandwidth and song rate), we considered PGLS the most appropriate method
to answer our question. Using this approach, we showed two main points: first, beak
morphology and body size should not be dissociated in studies on morphology acting as
a constraint in birdsong. All the best models based on lowest AIC values were those that
presented the interaction between these variables (Table 4). Second, the relationship
between song features and beak morphology, and body size is not consistent among
studied taxa. We found significant results of beak morphology and body size affecting
FB and SR in two of the five studied families (Thamnophilidae and Parulidae).
In Thamnophilidae we found support for the inverse relation between frequency
bandwidth and body size, and beak size. Seddon (2005) found similar results in relation
to song structure and body size in this family, but in contrast to our results, in her study
beak morphology did not show a significant effect on song frequency. Her argument to
82
explain this result is that the variation in beak length in this family is small when
compared to other suboscines taxa, in which a significant and negative correlation
between beak morphology and song frequency was detected. Consequently, in
Thamnophilidae, body mass is more important in determining song frequency when
compared to beak morphology (Seddon 2005). However, our results evidenced that
even the small variation in beak size in antbirds is sufficient to generate the inverse
relation between beak size and song frequency found in other suboscine family
(Dendrocolaptidae) (Palacios and Tubaro 2000, Derryberry et al. 2012). We agree with
Seddon’s argument that body mass is important to determine song frequency in
antbirds, yet, the constraint imposed by beak morphology should not be ignored as an
important contribution to shape aspects of thamnophilid songs. Moreover, at the time of
her Seddon's study, no molecular phylogeny was yet available for antbirds and the
phylogenetic information in that study was based on a variety of sources, resulting in a
phylogeny without branch lengths. It might be so that the differences between Seddon’s
and our results could result from differences in how the phylogenetic information was
considered in each study.
In Parulidae, the relation between FB and SR in upper bound regressions was
negative, but not significant, contrasting with Cardoso and Hu (2011) results, in which
the upper bound regression using intervals of 3 Hz in trill rate showed significant
results. As in Thamnophilidae, PGLS results for warblers also showed the inverse
relation between FB and beak size. However, body mass does not seem equally
important in constraining song frequency in this family as well as beak morphology.
In conclusion, our study added weight to the caution in using upper bound
regression as a method to estimate vocal deviation (Wilson et al 2014) and shows that
PGLS is an appropriated method to study the role of morphology as a constraint on song
83
structure. In addition, we also showed that the universality of the constraint hypothesis
should be considered with caution, because only two taxa here studied (Thamnophilidae
and Parulidae) supported their predictions. These findings also reinforce the hypothesis
suggested by Servedio et al. (2011) and Derryberry et al. (2012), that beak morphology
can be considered a magic trait in birds. The more plausible explanation in several
studies relating song features and beak morphology is the correlated evolution. In other
words, beak morphology changes in response to habitat (foraging niches) and this
modification affects song structure. For this reason, future studies asking these
questions could also focus in ecological information regarding the species, such as diet
and habitat structure, once these factors can directly affect beak morphology and song
structure (Seddon 2005).
Acknowledgements
We thank G. Decker for assistance during data acquisition, M. Webster and Cornell Lab
of Ornithology for hosting a visit by V. D.. We also thank W. Chrissante for the
illustrations in Figure 1, as well as J. Podos and C. R. Firkowski for valuable comments
on previous versions of this manuscript. VD was funded by CAPES Foundation
(scholarship and grant 0225-12-6) and MRP was funded by CNPq/MCT (grant
571334/2008-3).
84
5.6. References
Ballentine, B. 2006. Morphological adaptation influences the evolution of a mating
signal. -Evolution 60: 1936–1944.
Badyaev, A. V. and Leaf, E. S. 1997. Habitat associations of song characteristics in
Phylloscopus and Hippolais Warblers. - Auk 114: 40-46.
Bertelli, S. and Tubaro, P. L. 2002. Body mass and habitat correlates of song structure
in a primitive group of birds. - Biol. J. Linnean Soc. 77: 423-430.
Bradbury, J. W. and Vehrencamp, S. L. 1998. Principles of Animal Communication. -
Sinauer Associates, Sunderland, MA.
Cardoso, G. C. and Hu, Y. 2011. Birdsong performance and the evolution of simple
(rather than elaborated) sexual signals. - Am. Nat. 178: 679-686.
Collar, N. 2005. Family Turdidae (Thrushes). - .In: del Hoyo, J., Elliott, A. and
Sargatal, J. (eds). Handbook of the Birds of the World, Vol. 10. Cuckoo-shrikes to
Thrushes. Lynx Edicions, Barcelona, pp 514-807.
Curson, J. 2010. Family Parulidae (New World Warblers). - In: del Hoyo, J., Elliott, A.
and Sargatal, J. (eds). Handbook of the Birds of the World, Vol.15. Weaves to New
World Warblers. Lynx Edicions, Barcelona, pp. 666-800.
Derryberry, E.P., Seddon, N., Claramunt, S., Tobias, J. A., Baker, A., Aleixo, A. and
Brumfield, R. T. 2012. Correlated evolution of beak morphology and song in the
Neotropical woodcreper radiation. - Evolution 66: 2784-2797.
Derryberry, E. P. 2009. Ecology Shapes Birdsong Evolution: Variation in Morphology
and Habitat Explains Variation in White-Crowned Sparrow Song. - Am. Nat. 174:
24-33.
85
Dunning, J. B. 2008. CRC Handbook of avian body masses. CRC Press, Taylor &
Francis Group, Boca Raton, USA.
Endler, J. A. 1993. Some general comments on the evolution and design of animal
communication systems. - Phil. Trans. R. Soc. Lond. B, Biol. Sci. 340: 215-225.
Fitzpatrick, J., Bates, J., Bostwick, K., Caballero, I., Clock, B., Farnsworth, A. et al.
2004. Family Tyrannidae (Tyrant-flycatchers). - In: del Hoyo, J., Elliott, A. and
Sargatal, J. (eds). Handbook of the Birds of the World, Vol. 9. Cotingas to Pipits and
Wagtails. Lynx Edicions, Barcelona, pp. 170-462.
Huber, S. K. and Podos, J. 2006. Beak morphology and song features covary in a
population of Darwin’s finches (Geospiza fortis ). - Biological Journal of the Linnean
Society 88: 489-498.
Koenker, R. 2013. Package “quantreg”. R package vesion 5.05.
http://cran.rproject.org/web/packages/quantreg/quantreg.pdf
Mason, Nicholas. 2012. Song complexity and its evolutionary correlates across a
continent-wide radiation of songbirds. MSc thesis, San Diego State University.
Nowicki, S., Westneat, M. W. and Hoese, W. J. 1992. Birdsong: Motor function and the
evolution of communication. - Seminars in the Neurosciences 4: 385- 390.
Palacios, M. G. and Tubaro, P. L. 2000. Does beak size affect acoustic frequencies in
Woodcreepers? - Condor 102: 553-560.
Podos, J. and Warren, P. S. 2007. The Evolution of Geographic Variation in Birdsong. -
Advances in the Study of Behavior, 37: 403-458.
Podos, J., Huber, S. K. and Taft, B. 2004. Bird Song: The Interface of Evolution and
mechanism. - Annual Review of Ecology, Evolution, and Systematics 35: 55-87.

86
Podos, J. 2001. Correlated evolution of morphology and vocal signal structure in
Darwin’s Finches. - Nature 409: 185-187.
Podos, J. 1997. A performance constraint on the evolution of trilled vocalizations in a
songbird family (Passeriformes: Emberizidae). - Evolution 51: 537- 551.
Ryan, M. J. and Brenowitz, E. A. 1985. The role of Body Size, Phylogeny and Ambient
Noise in the evolution of Bird Song. - Am. Nat. 126: 87-100.
Seddon, N. 2005. Ecological adaptation and species recognition drives vocal evolution
in Neotropical suboscine birds. - Evolution 59: 200-215.
Snow, D. 2004. Family Pipridae (Manakins). - In: del Hoyo, J., Elliott, A. and Sargatal,
J. (eds). Handbook of the Birds of the World, Vol. 9. Cotingas to Pipits and Wagtails.
Lynx Edicions, Barcelona, pp. 110-169.
Tubaro, P. L. and Mahler, B. 1998. Acoustic frequencies and body mass in New World
doves. - Condor 100: 54-61.
Zimmer, K. and Isler, M. 2003. Family Thamnophilidae (Typical Antbirds). - In: del
Hoyo, J., Elliott, A. and Sargatal, J. (eds). Handbook of the Birds of the World, Vol.
8. Broadbills to Tapaculos. Lynx Edicions, Barcelona, pp. 448–681.
Wallschlager. D. 1980. Correlation of song frequency and body weight in passerine
birds. - Experiential 36: 412.
Wilson, D. R., Bitton, P. B., Podos, J. and Mennill, D. J. 2014. Uneven Sampling and
the Analysis of Vocal Performance Constraints. - Am. Nat.183: 214-228.
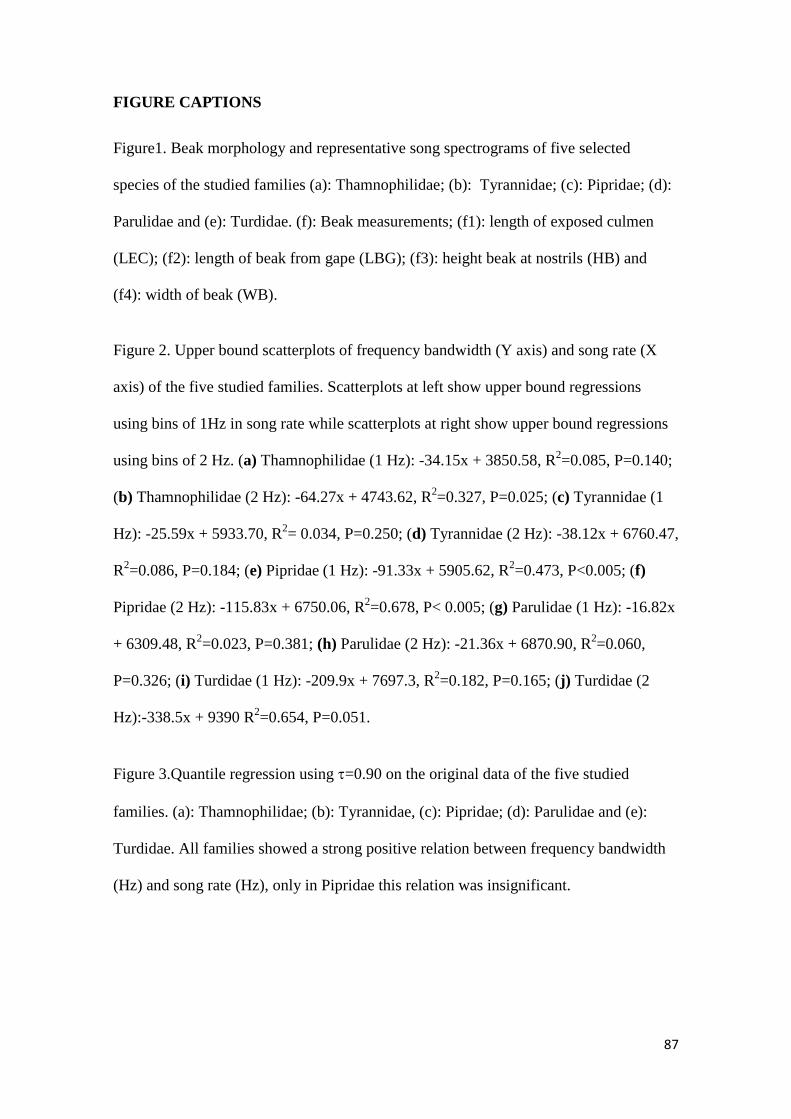
87
FIGURE CAPTIONS
Figure1. Beak morphology and representative song spectrograms of five selected
species of the studied families (a): Thamnophilidae; (b): Tyrannidae; (c): Pipridae; (d):
Parulidae and (e): Turdidae. (f): Beak measurements; (f1): length of exposed culmen
(LEC); (f2): length of beak from gape (LBG); (f3): height beak at nostrils (HB) and
(f4): width of beak (WB).
Figure 2. Upper bound scatterplots of frequency bandwidth (Y axis) and song rate (X
axis) of the five studied families. Scatterplots at left show upper bound regressions
using bins of 1Hz in song rate while scatterplots at right show upper bound regressions
using bins of 2 Hz. (a) Thamnophilidae (1 Hz): -34.15x + 3850.58, R2=0.085, P=0.140;
(b) Thamnophilidae (2 Hz): -64.27x + 4743.62, R2=0.327, P=0.025; (c) Tyrannidae (1
Hz): -25.59x + 5933.70, R2= 0.034, P=0.250; (d) Tyrannidae (2 Hz): -38.12x + 6760.47,
R2=0.086, P=0.184; (e) Pipridae (1 Hz): -91.33x + 5905.62, R
2=0.473, P<0.005; (f)
Pipridae (2 Hz): -115.83x + 6750.06, R2=0.678, P< 0.005; (g) Parulidae (1 Hz): -16.82x
+ 6309.48, R2=0.023, P=0.381; (h) Parulidae (2 Hz): -21.36x + 6870.90, R
2=0.060,
P=0.326; (i) Turdidae (1 Hz): -209.9x + 7697.3, R2=0.182, P=0.165; (j) Turdidae (2
Hz):-338.5x + 9390 R2=0.654, P=0.051.
Figure 3.Quantile regression using =0.90 on the original data of the five studied
families. (a): Thamnophilidae; (b): Tyrannidae, (c): Pipridae; (d): Parulidae and (e):
Turdidae. All families showed a strong positive relation between frequency bandwidth
(Hz) and song rate (Hz), only in Pipridae this relation was insignificant.
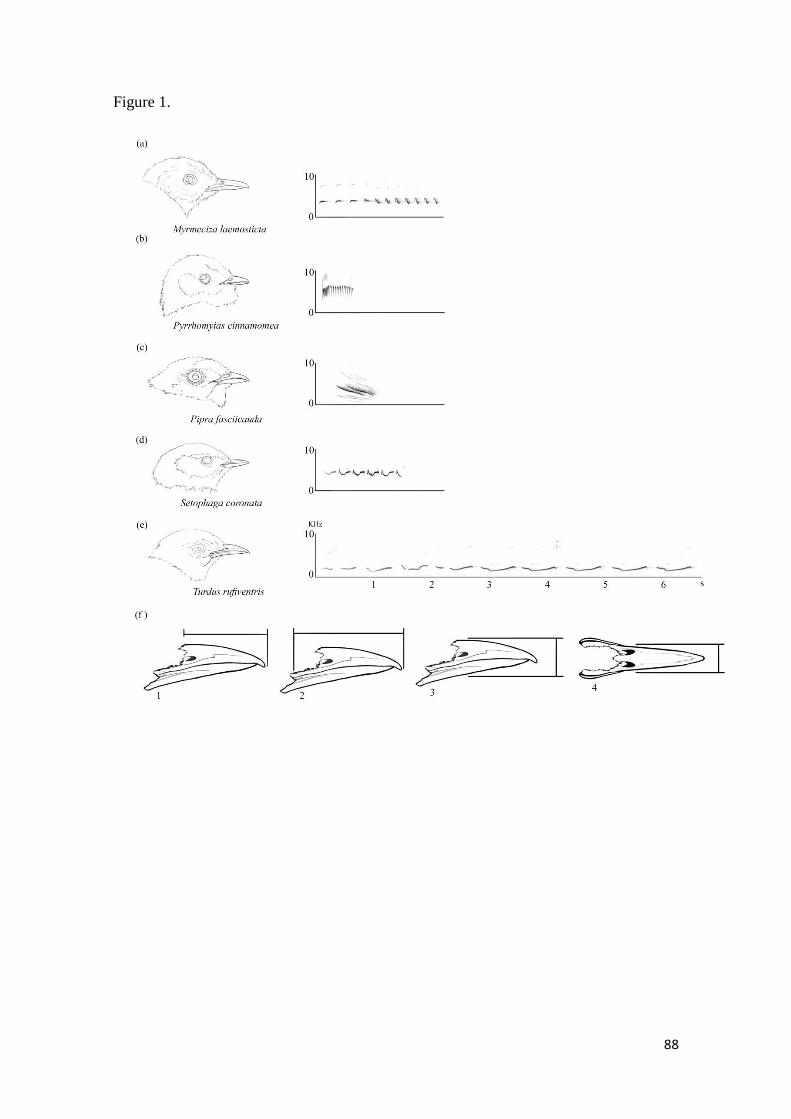
88
Figure 1.
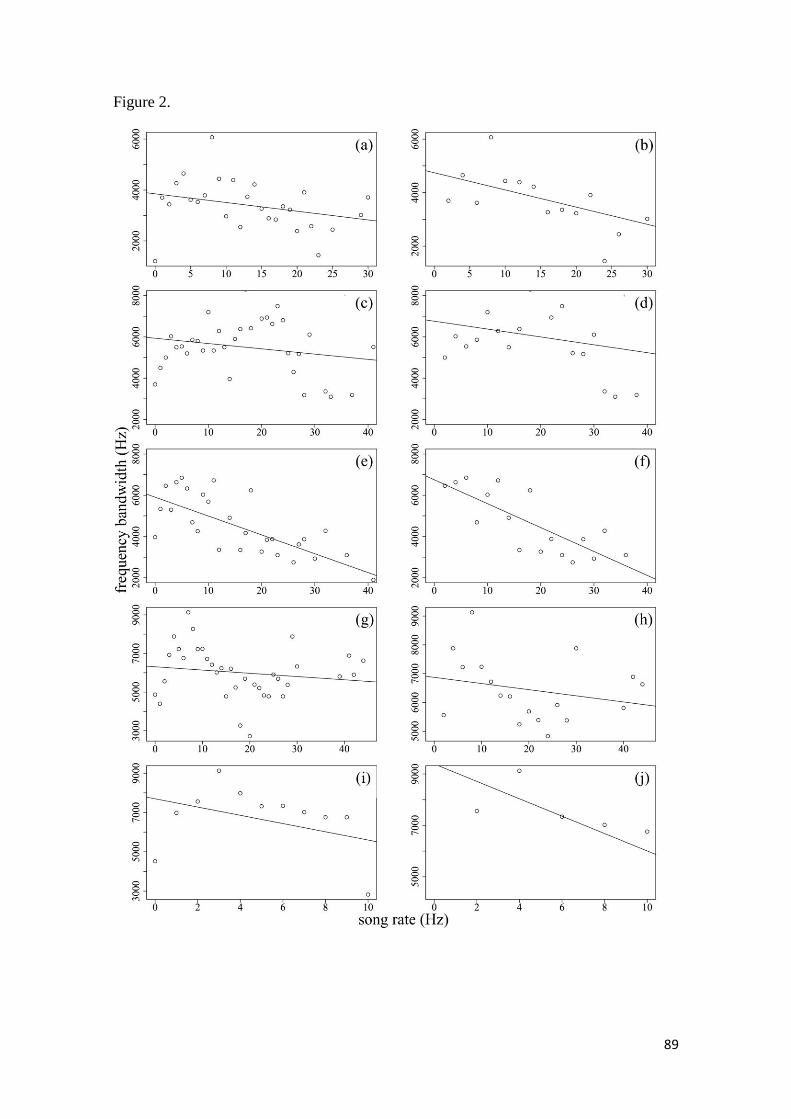
89
Figure 2.
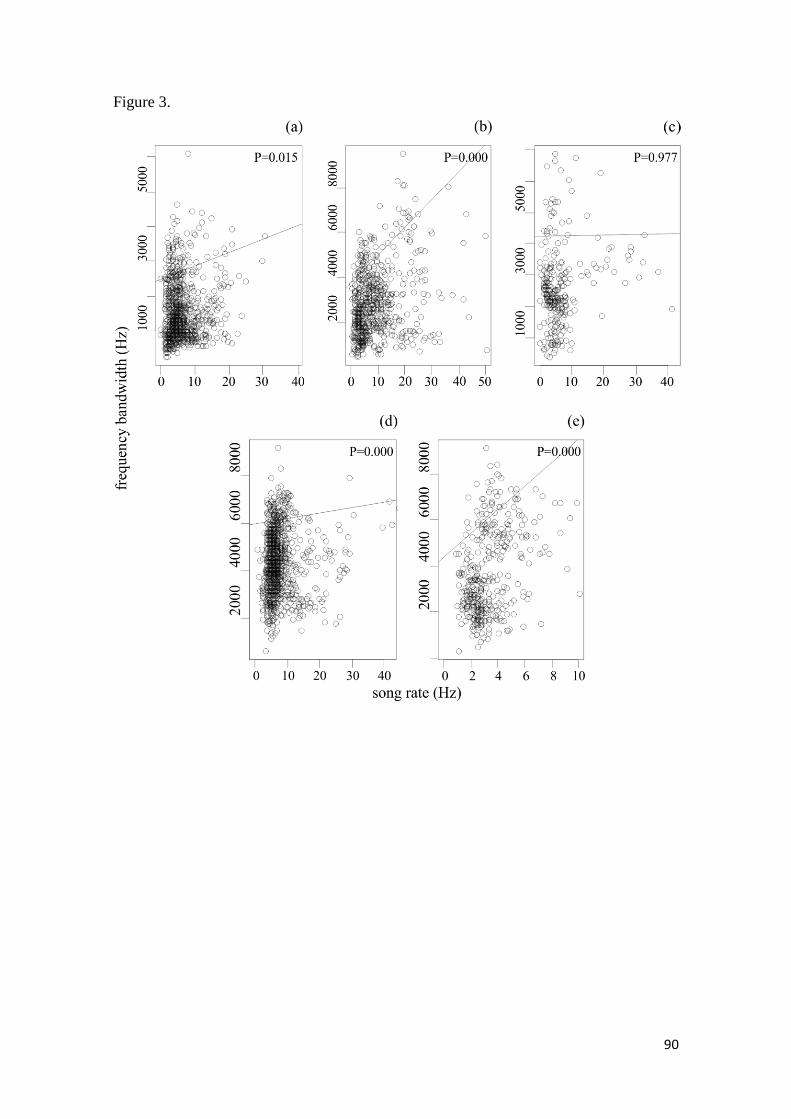
90
Figure 3.

91
Table 1. Number of species and recordings per family to which there is phylogenetic
and morphological data associated in this study, totalizing 318 species and 3064
recordings. NS: number of species; NR: number of recordings; MNRS: mean and range
of the number of recordings per species.
Family NS NR MNRS
Thamnophilidae 112 802 7.16 (1-31)
Tyrannidae 74 668 9.02 (1-40)
Pipridae 32 211 6.59 (1-22)
Parulidae 74 998 13.48 (1-27)
Turdidae 26 385 14.80 (1-30)

92
Table 2. Principal component analysis with correlation matrix on the logarithmized average of the beak measures of the five studied families.
Length of exposed culmen (LEC); Length from beak to gape (LBG); Height height beak at nostrils (HB) and width of the beak (WB).
Variable
Thamnophilidae Tyrannidae Pipridae Parulidae Turdidae
PC1 PC1 PC1 PC2 PC1 PC1
log LEC 0.406
0.486
0.120
-0.718
-0.502
0.535
log LBG 0.397
0.480
-0.891
-0.127
-0.464
0.574
log HB 0.659
0.540
0.270
-0.575
-0.486
0.558
log WB 0.493
0.492
-0.345
-0.371
-0.545
0.272
Eigenvalue 0.028
0.059
0.013
0.010
0.009
0.024
Explained variance (%) 86.9 91.8 49.9 39.9 75.8 83.8
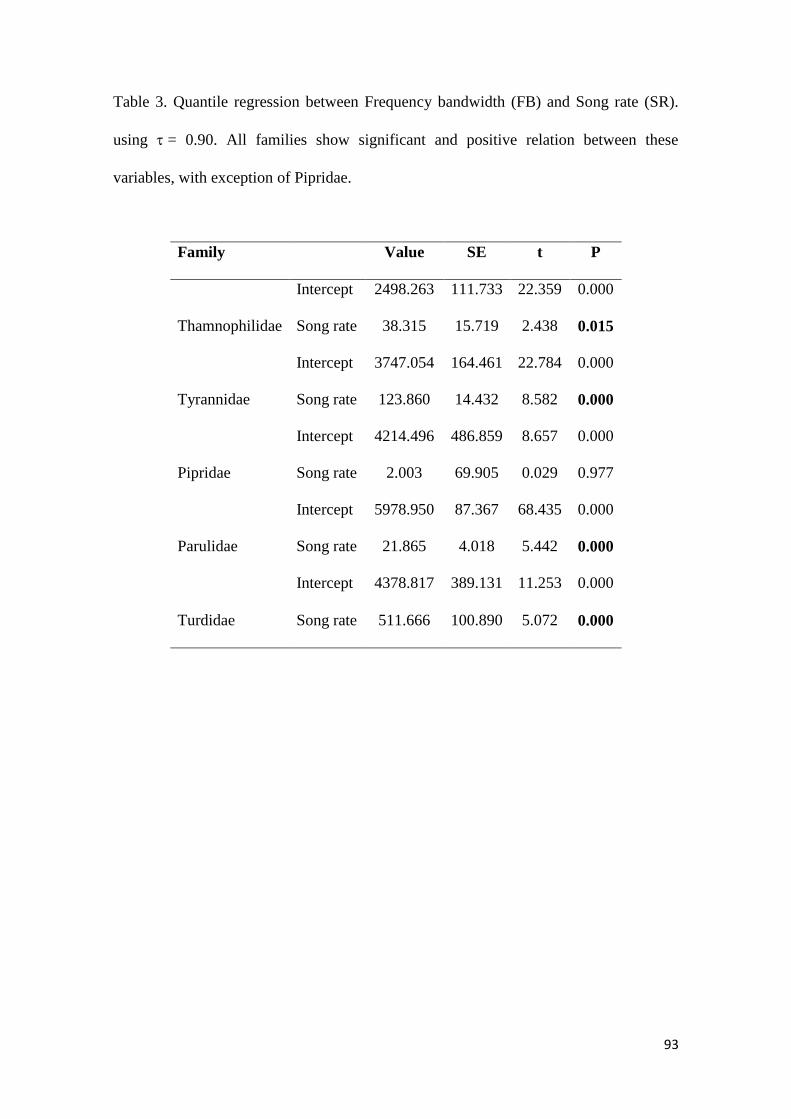
93
Table 3. Quantile regression between Frequency bandwidth (FB) and Song rate (SR).
using = 0.90. All families show significant and positive relation between these
variables, with exception of Pipridae.
Family Value SE t P
Thamnophilidae
Intercept 2498.263 111.733 22.359 0.000
Song rate 38.315 15.719 2.438 0.015
Tyrannidae
Intercept 3747.054 164.461 22.784 0.000
Song rate 123.860 14.432 8.582 0.000
Pipridae
Intercept 4214.496 486.859 8.657 0.000
Song rate 2.003 69.905 0.029 0.977
Parulidae
Intercept 5978.950 87.367 68.435 0.000
Song rate 21.865 4.018 5.442 0.000
Turdidae
Intercept 4378.817 389.131 11.253 0.000
Song rate 511.666 100.890 5.072 0.000
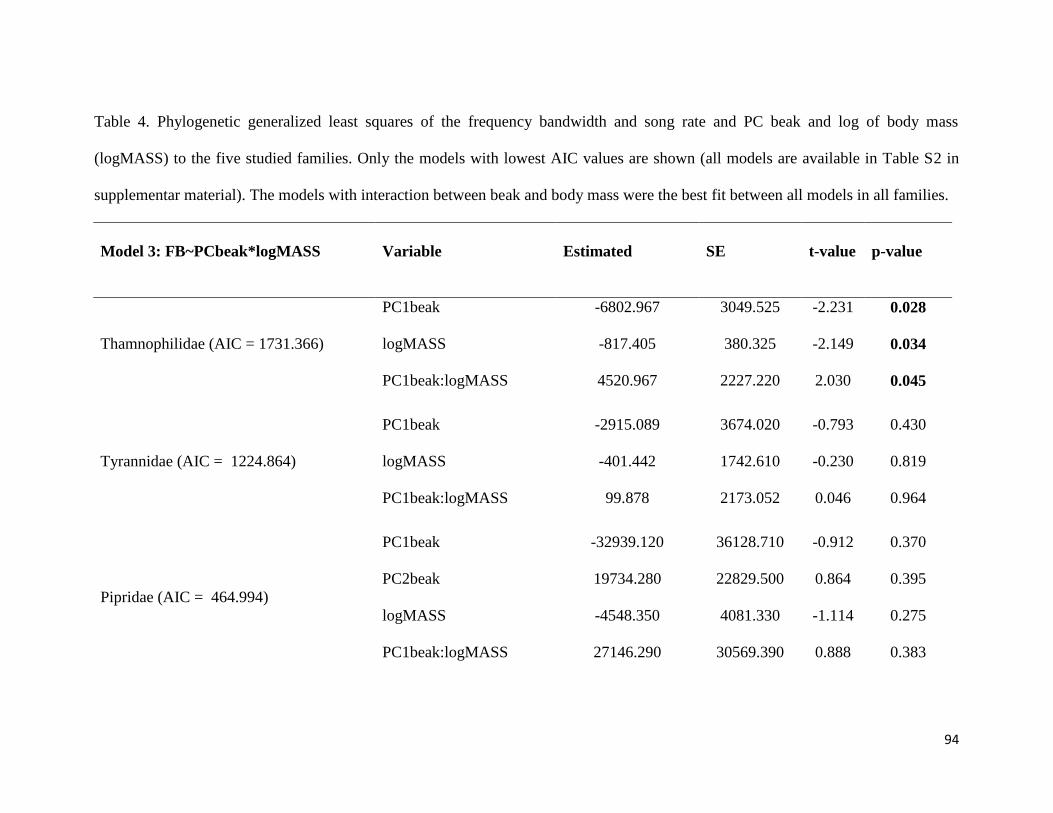
94
Table 4. Phylogenetic generalized least squares of the frequency bandwidth and song rate and PC beak and log of body mass
(logMASS) to the five studied families. Only the models with lowest AIC values are shown (all models are available in Table S2 in
supplementar material). The models with interaction between beak and body mass were the best fit between all models in all families.
Model 3: FB~PCbeak*logMASS Variable Estimated SE t-value p-value
Thamnophilidae (AIC = 1731.366)
PC1beak -6802.967 3049.525 -2.231 0.028
logMASS -817.405 380.325 -2.149 0.034
PC1beak:logMASS 4520.967 2227.220 2.030 0.045
Tyrannidae (AIC = 1224.864)
PC1beak -2915.089 3674.020 -0.793 0.430
logMASS -401.442 1742.610 -0.230 0.819
PC1beak:logMASS 99.878 2173.052 0.046 0.964
Pipridae (AIC = 464.994)
PC1beak -32939.120 36128.710 -0.912 0.370
PC2beak 19734.280 22829.500 0.864 0.395
logMASS -4548.350 4081.330 -1.114 0.275
PC1beak:logMASS 27146.290 30569.390 0.888 0.383
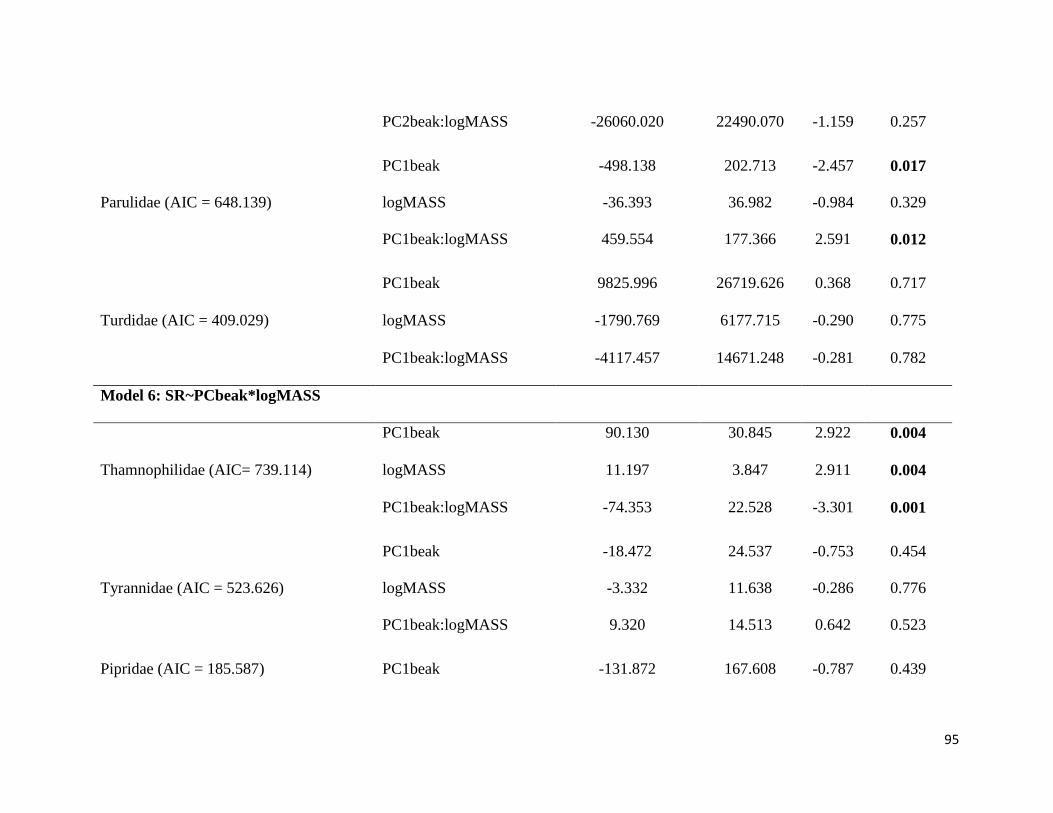
95
PC2beak:logMASS -26060.020 22490.070 -1.159 0.257
Parulidae (AIC = 648.139)
PC1beak -498.138 202.713 -2.457 0.017
logMASS -36.393 36.982 -0.984 0.329
PC1beak:logMASS 459.554 177.366 2.591 0.012
Turdidae (AIC = 409.029)
PC1beak 9825.996 26719.626 0.368 0.717
logMASS -1790.769 6177.715 -0.290 0.775
PC1beak:logMASS -4117.457 14671.248 -0.281 0.782
Model 6: SR~PCbeak*logMASS
Thamnophilidae (AIC= 739.114)
PC1beak 90.130 30.845 2.922 0.004
logMASS 11.197 3.847 2.911 0.004
PC1beak:logMASS -74.353 22.528 -3.301 0.001
Tyrannidae (AIC = 523.626)
PC1beak -18.472 24.537 -0.753 0.454
logMASS -3.332 11.638 -0.286 0.776
PC1beak:logMASS 9.320 14.513 0.642 0.523
Pipridae (AIC = 185.587) PC1beak -131.872 167.608 -0.787 0.439

96
PC2beak 64.703 105.910 0.611 0.547
logMASS 18.238 18.934 0.963 0.344
PC1beak:logMASS 117.481 141.817 0.828 0.415
PC2beak:logMASS -53.938 104.336 -0.517 0.610
Parulidae (AIC = 661.585)
PC1beak 263.657 223.147 1.182 0.241
logMASS 31.342 40.710 0.770 0.444
PC1beak:logMASS -149.617 195.245 -0.766 0.446
Turdidae (AIC = 84.332)
PC1beak -11.607 16.671 -0.696 0.494
logMASS -0.986 3.854 -0.256 0.801
PC1beak:logMASS 6.961 9.154 0.760 0.455

97
6. CONCLUSÃO
A abordagem comparativa numa escala macrogeográfica permitiu identificar alguns
padrões robustos a respeito da evolução do canto. Apesar de cada táxon apresentar um
padrão particular é clara importância da história evolutiva em fornecer o potencial de
variação dos cantos, uma vez que a filogenia determina a morfologia e fisiologia das
espécies. Além disso, alguns padrões gerais foram evidentes independentemente do táxon
analisado: (1) as características do canto relacionadas à freqüência são limitadas pelo
ambiente e morfologia. Entretanto, para a maioria das famílias características temporais do
canto não mostraram qualquer tipo de limitação, com exceção de SR em Thamnophilidae
que foi afetada pela morfologia do bico e massa corporal; (2) em geral os modelos mais
simples, sem estrutura de correlação (White noise) ou com uma taxa de evolução constante
ao longo dos ramos da filogenia (Brownian motion) apresentaram melhor ajuste às
características do canto, indicando que elas podem evoluir de modo mais simples do que o
usualmente imaginado; (3) a massa corporal é uma importante característica que limita
propriedades dos cantos e deveria ser incluída em qualquer estudo bioacústico comparativo.
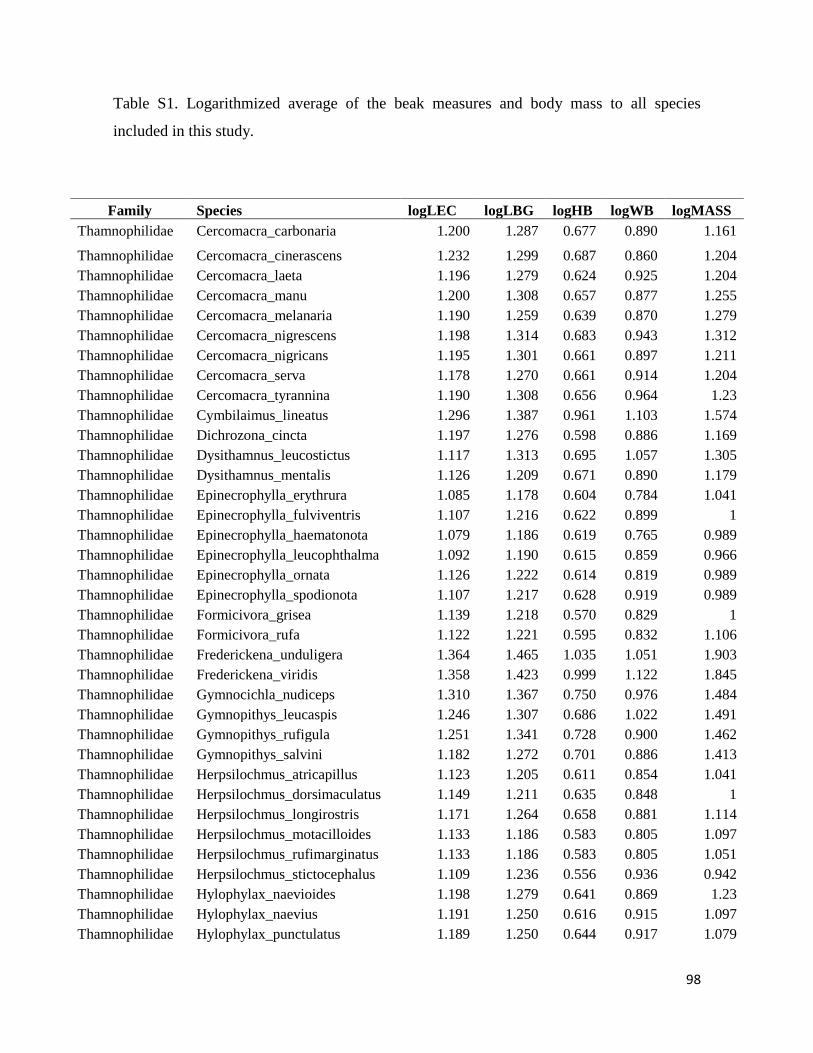
98
Table S1. Logarithmized average of the beak measures and body mass to all species
included in this study.
Family Species logLEC logLBG logHB logWB logMASS
Thamnophilidae Cercomacra_carbonaria 1.200 1.287 0.677 0.890 1.161
Thamnophilidae Cercomacra_cinerascens 1.232 1.299 0.687 0.860 1.204
Thamnophilidae Cercomacra_laeta 1.196 1.279 0.624 0.925 1.204
Thamnophilidae Cercomacra_manu 1.200 1.308 0.657 0.877 1.255
Thamnophilidae Cercomacra_melanaria 1.190 1.259 0.639 0.870 1.279
Thamnophilidae Cercomacra_nigrescens 1.198 1.314 0.683 0.943 1.312
Thamnophilidae Cercomacra_nigricans 1.195 1.301 0.661 0.897 1.211
Thamnophilidae Cercomacra_serva 1.178 1.270 0.661 0.914 1.204
Thamnophilidae Cercomacra_tyrannina 1.190 1.308 0.656 0.964 1.23
Thamnophilidae Cymbilaimus_lineatus 1.296 1.387 0.961 1.103 1.574
Thamnophilidae Dichrozona_cincta 1.197 1.276 0.598 0.886 1.169
Thamnophilidae Dysithamnus_leucostictus 1.117 1.313 0.695 1.057 1.305
Thamnophilidae Dysithamnus_mentalis 1.126 1.209 0.671 0.890 1.179
Thamnophilidae Epinecrophylla_erythrura 1.085 1.178 0.604 0.784 1.041
Thamnophilidae Epinecrophylla_fulviventris 1.107 1.216 0.622 0.899 1
Thamnophilidae Epinecrophylla_haematonota 1.079 1.186 0.619 0.765 0.989
Thamnophilidae Epinecrophylla_leucophthalma 1.092 1.190 0.615 0.859 0.966
Thamnophilidae Epinecrophylla_ornata 1.126 1.222 0.614 0.819 0.989
Thamnophilidae Epinecrophylla_spodionota 1.107 1.217 0.628 0.919 0.989
Thamnophilidae Formicivora_grisea 1.139 1.218 0.570 0.829 1
Thamnophilidae Formicivora_rufa 1.122 1.221 0.595 0.832 1.106
Thamnophilidae Frederickena_unduligera 1.364 1.465 1.035 1.051 1.903
Thamnophilidae Frederickena_viridis 1.358 1.423 0.999 1.122 1.845
Thamnophilidae Gymnocichla_nudiceps 1.310 1.367 0.750 0.976 1.484
Thamnophilidae Gymnopithys_leucaspis 1.246 1.307 0.686 1.022 1.491
Thamnophilidae Gymnopithys_rufigula 1.251 1.341 0.728 0.900 1.462
Thamnophilidae Gymnopithys_salvini 1.182 1.272 0.701 0.886 1.413
Thamnophilidae Herpsilochmus_atricapillus 1.123 1.205 0.611 0.854 1.041
Thamnophilidae Herpsilochmus_dorsimaculatus 1.149 1.211 0.635 0.848 1
Thamnophilidae Herpsilochmus_longirostris 1.171 1.264 0.658 0.881 1.114
Thamnophilidae Herpsilochmus_motacilloides 1.133 1.186 0.583 0.805 1.097
Thamnophilidae Herpsilochmus_rufimarginatus 1.133 1.186 0.583 0.805 1.051
Thamnophilidae Herpsilochmus_stictocephalus 1.109 1.236 0.556 0.936 0.942
Thamnophilidae Hylophylax_naevioides 1.198 1.279 0.641 0.869 1.23
Thamnophilidae Hylophylax_naevius 1.191 1.250 0.616 0.915 1.097
Thamnophilidae Hylophylax_punctulatus 1.189 1.250 0.644 0.917 1.079
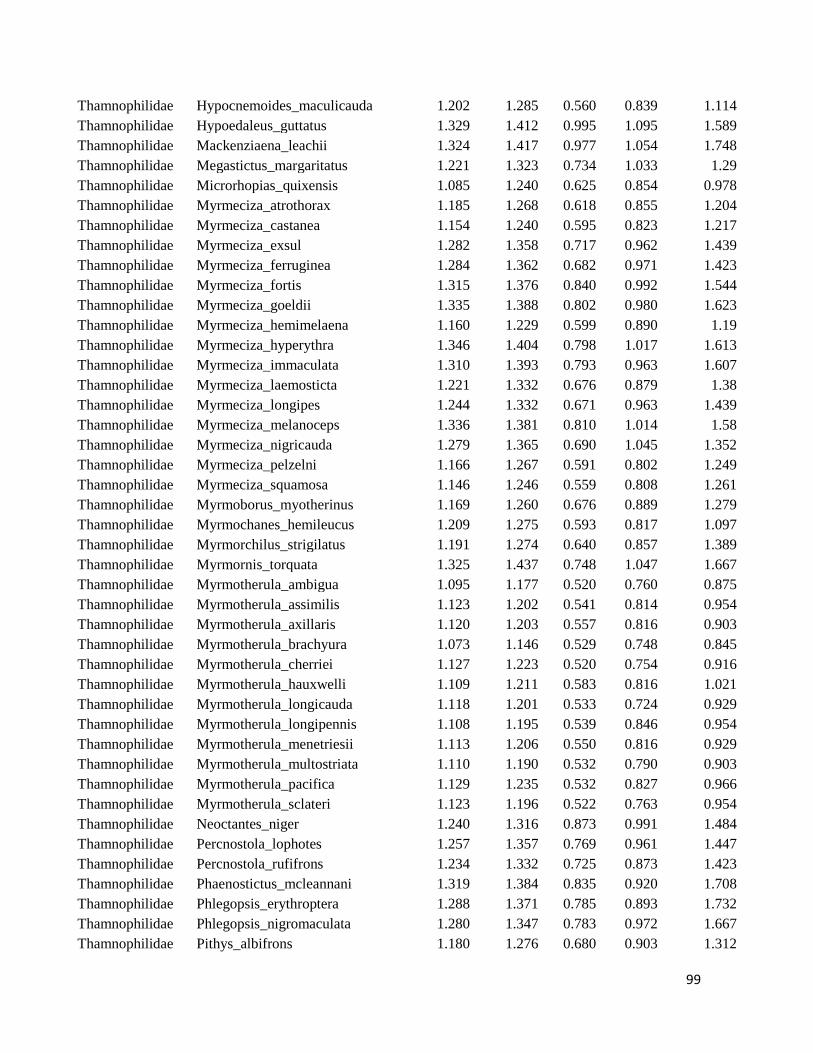
99
Thamnophilidae Hypocnemoides_maculicauda 1.202 1.285 0.560 0.839 1.114
Thamnophilidae Hypoedaleus_guttatus 1.329 1.412 0.995 1.095 1.589
Thamnophilidae Mackenziaena_leachii 1.324 1.417 0.977 1.054 1.748
Thamnophilidae Megastictus_margaritatus 1.221 1.323 0.734 1.033 1.29
Thamnophilidae Microrhopias_quixensis 1.085 1.240 0.625 0.854 0.978
Thamnophilidae Myrmeciza_atrothorax 1.185 1.268 0.618 0.855 1.204
Thamnophilidae Myrmeciza_castanea 1.154 1.240 0.595 0.823 1.217
Thamnophilidae Myrmeciza_exsul 1.282 1.358 0.717 0.962 1.439
Thamnophilidae Myrmeciza_ferruginea 1.284 1.362 0.682 0.971 1.423
Thamnophilidae Myrmeciza_fortis 1.315 1.376 0.840 0.992 1.544
Thamnophilidae Myrmeciza_goeldii 1.335 1.388 0.802 0.980 1.623
Thamnophilidae Myrmeciza_hemimelaena 1.160 1.229 0.599 0.890 1.19
Thamnophilidae Myrmeciza_hyperythra 1.346 1.404 0.798 1.017 1.613
Thamnophilidae Myrmeciza_immaculata 1.310 1.393 0.793 0.963 1.607
Thamnophilidae Myrmeciza_laemosticta 1.221 1.332 0.676 0.879 1.38
Thamnophilidae Myrmeciza_longipes 1.244 1.332 0.671 0.963 1.439
Thamnophilidae Myrmeciza_melanoceps 1.336 1.381 0.810 1.014 1.58
Thamnophilidae Myrmeciza_nigricauda 1.279 1.365 0.690 1.045 1.352
Thamnophilidae Myrmeciza_pelzelni 1.166 1.267 0.591 0.802 1.249
Thamnophilidae Myrmeciza_squamosa 1.146 1.246 0.559 0.808 1.261
Thamnophilidae Myrmoborus_myotherinus 1.169 1.260 0.676 0.889 1.279
Thamnophilidae Myrmochanes_hemileucus 1.209 1.275 0.593 0.817 1.097
Thamnophilidae Myrmorchilus_strigilatus 1.191 1.274 0.640 0.857 1.389
Thamnophilidae Myrmornis_torquata 1.325 1.437 0.748 1.047 1.667
Thamnophilidae Myrmotherula_ambigua 1.095 1.177 0.520 0.760 0.875
Thamnophilidae Myrmotherula_assimilis 1.123 1.202 0.541 0.814 0.954
Thamnophilidae Myrmotherula_axillaris 1.120 1.203 0.557 0.816 0.903
Thamnophilidae Myrmotherula_brachyura 1.073 1.146 0.529 0.748 0.845
Thamnophilidae Myrmotherula_cherriei 1.127 1.223 0.520 0.754 0.916
Thamnophilidae Myrmotherula_hauxwelli 1.109 1.211 0.583 0.816 1.021
Thamnophilidae Myrmotherula_longicauda 1.118 1.201 0.533 0.724 0.929
Thamnophilidae Myrmotherula_longipennis 1.108 1.195 0.539 0.846 0.954
Thamnophilidae Myrmotherula_menetriesii 1.113 1.206 0.550 0.816 0.929
Thamnophilidae Myrmotherula_multostriata 1.110 1.190 0.532 0.790 0.903
Thamnophilidae Myrmotherula_pacifica 1.129 1.235 0.532 0.827 0.966
Thamnophilidae Myrmotherula_sclateri 1.123 1.196 0.522 0.763 0.954
Thamnophilidae Neoctantes_niger 1.240 1.316 0.873 0.991 1.484
Thamnophilidae Percnostola_lophotes 1.257 1.357 0.769 0.961 1.447
Thamnophilidae Percnostola_rufifrons 1.234 1.332 0.725 0.873 1.423
Thamnophilidae Phaenostictus_mcleannani 1.319 1.384 0.835 0.920 1.708
Thamnophilidae Phlegopsis_erythroptera 1.288 1.371 0.785 0.893 1.732
Thamnophilidae Phlegopsis_nigromaculata 1.280 1.347 0.783 0.972 1.667
Thamnophilidae Pithys_albifrons 1.180 1.276 0.680 0.903 1.312
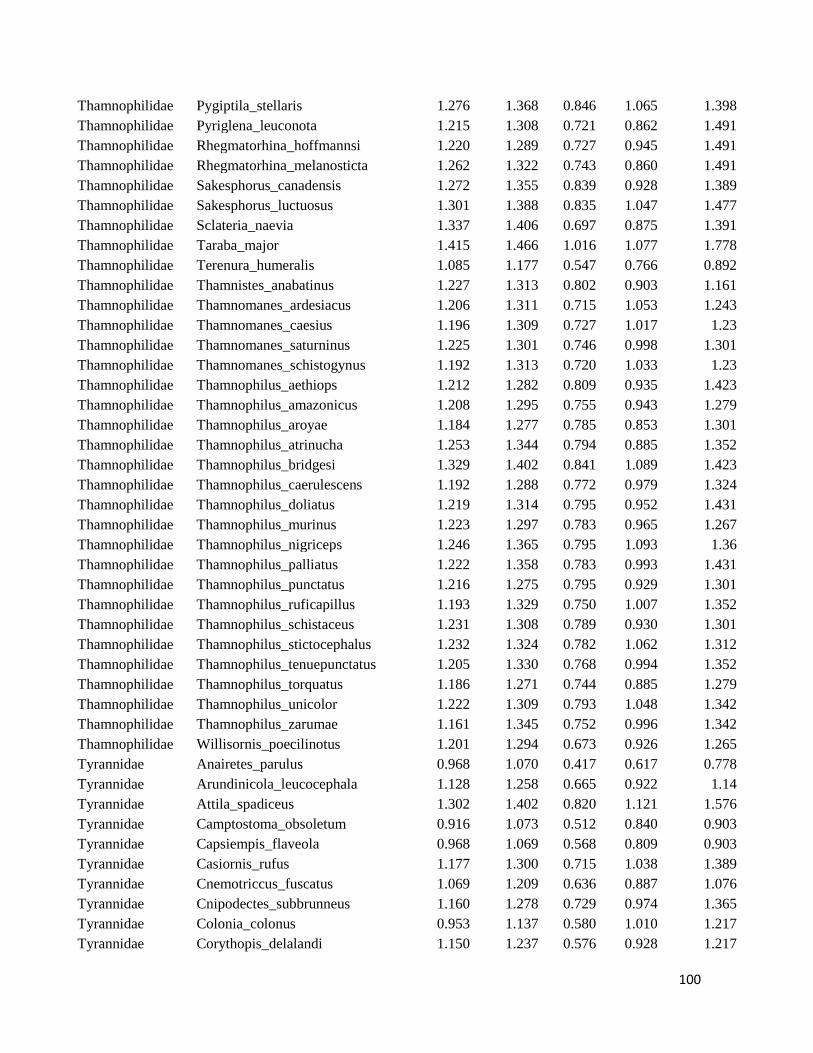
100
Thamnophilidae Pygiptila_stellaris 1.276 1.368 0.846 1.065 1.398
Thamnophilidae Pyriglena_leuconota 1.215 1.308 0.721 0.862 1.491
Thamnophilidae Rhegmatorhina_hoffmannsi 1.220 1.289 0.727 0.945 1.491
Thamnophilidae Rhegmatorhina_melanosticta 1.262 1.322 0.743 0.860 1.491
Thamnophilidae Sakesphorus_canadensis 1.272 1.355 0.839 0.928 1.389
Thamnophilidae Sakesphorus_luctuosus 1.301 1.388 0.835 1.047 1.477
Thamnophilidae Sclateria_naevia 1.337 1.406 0.697 0.875 1.391
Thamnophilidae Taraba_major 1.415 1.466 1.016 1.077 1.778
Thamnophilidae Terenura_humeralis 1.085 1.177 0.547 0.766 0.892
Thamnophilidae Thamnistes_anabatinus 1.227 1.313 0.802 0.903 1.161
Thamnophilidae Thamnomanes_ardesiacus 1.206 1.311 0.715 1.053 1.243
Thamnophilidae Thamnomanes_caesius 1.196 1.309 0.727 1.017 1.23
Thamnophilidae Thamnomanes_saturninus 1.225 1.301 0.746 0.998 1.301
Thamnophilidae Thamnomanes_schistogynus 1.192 1.313 0.720 1.033 1.23
Thamnophilidae Thamnophilus_aethiops 1.212 1.282 0.809 0.935 1.423
Thamnophilidae Thamnophilus_amazonicus 1.208 1.295 0.755 0.943 1.279
Thamnophilidae Thamnophilus_aroyae 1.184 1.277 0.785 0.853 1.301
Thamnophilidae Thamnophilus_atrinucha 1.253 1.344 0.794 0.885 1.352
Thamnophilidae Thamnophilus_bridgesi 1.329 1.402 0.841 1.089 1.423
Thamnophilidae Thamnophilus_caerulescens 1.192 1.288 0.772 0.979 1.324
Thamnophilidae Thamnophilus_doliatus 1.219 1.314 0.795 0.952 1.431
Thamnophilidae Thamnophilus_murinus 1.223 1.297 0.783 0.965 1.267
Thamnophilidae Thamnophilus_nigriceps 1.246 1.365 0.795 1.093 1.36
Thamnophilidae Thamnophilus_palliatus 1.222 1.358 0.783 0.993 1.431
Thamnophilidae Thamnophilus_punctatus 1.216 1.275 0.795 0.929 1.301
Thamnophilidae Thamnophilus_ruficapillus 1.193 1.329 0.750 1.007 1.352
Thamnophilidae Thamnophilus_schistaceus 1.231 1.308 0.789 0.930 1.301
Thamnophilidae Thamnophilus_stictocephalus 1.232 1.324 0.782 1.062 1.312
Thamnophilidae Thamnophilus_tenuepunctatus 1.205 1.330 0.768 0.994 1.352
Thamnophilidae Thamnophilus_torquatus 1.186 1.271 0.744 0.885 1.279
Thamnophilidae Thamnophilus_unicolor 1.222 1.309 0.793 1.048 1.342
Thamnophilidae Thamnophilus_zarumae 1.161 1.345 0.752 0.996 1.342
Thamnophilidae Willisornis_poecilinotus 1.201 1.294 0.673 0.926 1.265
Tyrannidae Anairetes_parulus 0.968 1.070 0.417 0.617 0.778
Tyrannidae Arundinicola_leucocephala 1.128 1.258 0.665 0.922 1.14
Tyrannidae Attila_spadiceus 1.302 1.402 0.820 1.121 1.576
Tyrannidae Camptostoma_obsoletum 0.916 1.073 0.512 0.840 0.903
Tyrannidae Capsiempis_flaveola 0.968 1.069 0.568 0.809 0.903
Tyrannidae Casiornis_rufus 1.177 1.300 0.715 1.038 1.389
Tyrannidae Cnemotriccus_fuscatus 1.069 1.209 0.636 0.887 1.076
Tyrannidae Cnipodectes_subbrunneus 1.160 1.278 0.729 0.974 1.365
Tyrannidae Colonia_colonus 0.953 1.137 0.580 1.010 1.217
Tyrannidae Corythopis_delalandi 1.150 1.237 0.576 0.928 1.217

101
Tyrannidae Deltarhynchus_flammulatus 1.155 1.262 0.659 0.975 1.236
Tyrannidae Empidonomus_varius 1.139 1.294 0.756 1.061 1.398
Tyrannidae Euscarthmus_meloryphus 1.003 1.119 0.509 0.822 0.845
Tyrannidae Fluvicola_albiventer 1.102 1.240 0.572 0.881 1.064
Tyrannidae Gubernetes_yetapa 1.304 1.419 0.947 1.098 1.562
Tyrannidae Hemitriccus_diops 1.021 1.152 0.552 0.878 1.061
Tyrannidae Hemitriccus_margaritaceiventer 1.113 1.171 0.550 0.815 0.929
Tyrannidae Hirundinea_ferruginea 1.206 1.335 0.701 1.037 1.322
Tyrannidae Hymenops_perspicillatus 1.158 1.272 0.660 0.887 1.36
Tyrannidae Inezia_inornata 0.929 1.066 0.439 0.703 0.76
Tyrannidae Lathrotriccus_euleri 1.049 1.194 0.602 0.897 1.041
Tyrannidae Legatus_leucophaius 1.041 1.171 0.722 0.960 1.389
Tyrannidae Leptopogon_amaurocephalus 1.075 1.192 0.606 0.875 1.079
Tyrannidae Lophotriccus_pileatus 1.026 1.095 0.500 0.764 0.875
Tyrannidae Machetornis_rixosus 1.248 1.351 0.720 0.953 1.471
Tyrannidae Mecocerculus_leucophrys 0.981 1.085 0.481 0.720 1.017
Tyrannidae Mecocerculus_poecilocercus 0.929 1.047 0.457 0.701 1.021
Tyrannidae Megarynchus_pitangua 1.462 1.542 1.054 1.237 1.82
Tyrannidae Mionectes_rufiventris 1.056 1.191 0.587 0.904 1.146
Tyrannidae Mitrephanes_phaeocercus 0.986 1.099 0.506 0.771 0.929
Tyrannidae Muscigralla_brevicauda 1.090 1.203 0.582 0.814 1.1
Tyrannidae Muscisaxicola_maculirostris 1.094 1.199 0.535 0.749 1.152
Tyrannidae Myiarchus_tyrannulus 1.238 1.339 0.816 1.026 1.641
Tyrannidae Myiodynastes_maculatus 1.298 1.444 0.933 1.149 1.643
Tyrannidae Myiopagis_caniceps 0.982 1.100 0.566 0.870 1.021
Tyrannidae Myiopagis_viridicata 0.989 1.118 0.572 0.883 1.114
Tyrannidae Myiophobus_cryptoxanthus 1.033 1.113 0.551 0.846 0.991
Tyrannidae Myiophobus_fasciatus 1.031 1.178 0.575 0.857 1.092
Tyrannidae Myiophobus_phoenicomitra 1.019 1.127 0.559 0.849 1.041
Tyrannidae Myiophobus_pulcher 0.976 1.054 0.445 0.804 0.978
Tyrannidae Myiornis_auricularis 0.967 1.085 0.475 0.758 0.699
Tyrannidae Myiotheretes_fumigatus 1.278 1.403 0.761 1.004 1.524
Tyrannidae Myiotriccus_ornatus 1.011 1.120 0.675 0.858 1.097
Tyrannidae Myiozetetes_similis 1.091 1.226 0.723 0.972 1.237
Tyrannidae Neopipo_cinnamomea 0.916 1.035 0.453 0.733 0.845
Tyrannidae Ochthoeca_cinnamomeiventris 0.947 1.198 0.559 0.862 1.076
Tyrannidae Ochthoeca_diadema 0.978 1.128 0.525 0.805 1.061
Tyrannidae Ornithion_brunneicapillus 0.919 1.035 0.533 0.709 0.875
Tyrannidae Phaeomyias_murina 0.982 1.084 0.531 0.801 0.903
Tyrannidae Phylloscartes_ventralis 1.010 1.107 0.473 0.711 0.954
Tyrannidae Phyllomyias_fasciatus 0.868 1.013 0.528 0.754 1.013
Tyrannidae Phyllomyias_griseiceps 0.885 1.027 0.501 0.769 0.857
Tyrannidae Phyllomyias_uropygialis 0.910 1.014 0.451 0.720 0.954
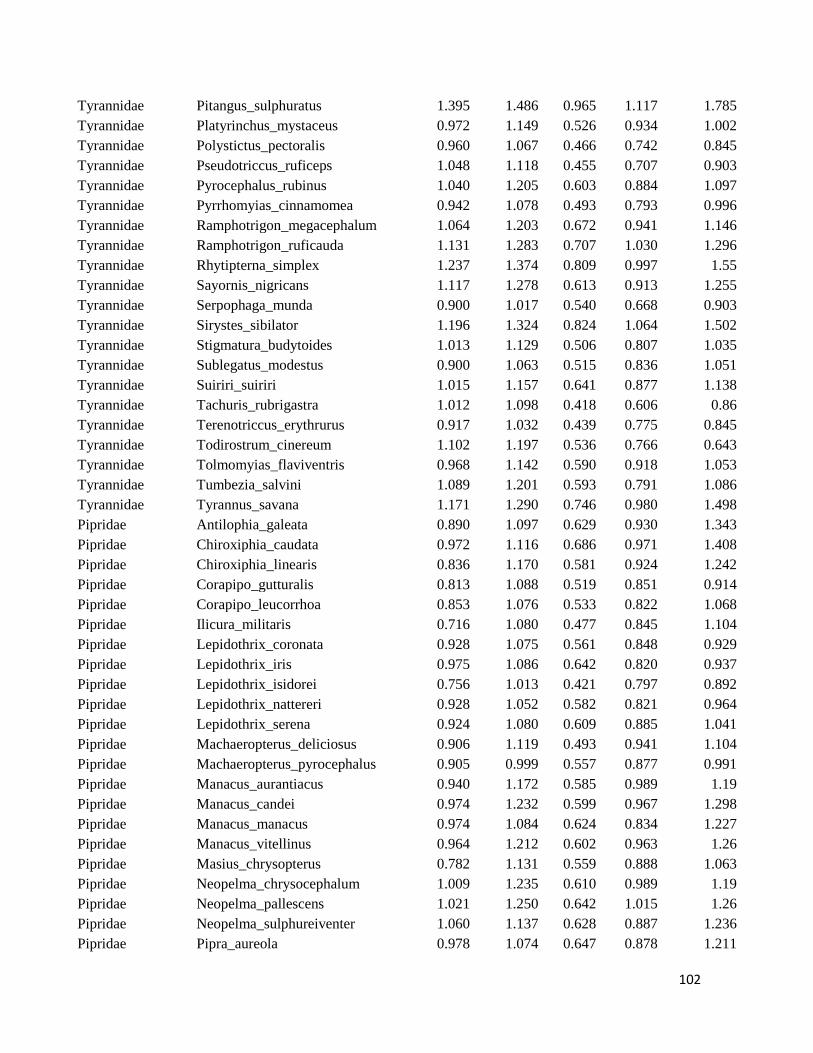
102
Tyrannidae Pitangus_sulphuratus 1.395 1.486 0.965 1.117 1.785
Tyrannidae Platyrinchus_mystaceus 0.972 1.149 0.526 0.934 1.002
Tyrannidae Polystictus_pectoralis 0.960 1.067 0.466 0.742 0.845
Tyrannidae Pseudotriccus_ruficeps 1.048 1.118 0.455 0.707 0.903
Tyrannidae Pyrocephalus_rubinus 1.040 1.205 0.603 0.884 1.097
Tyrannidae Pyrrhomyias_cinnamomea 0.942 1.078 0.493 0.793 0.996
Tyrannidae Ramphotrigon_megacephalum 1.064 1.203 0.672 0.941 1.146
Tyrannidae Ramphotrigon_ruficauda 1.131 1.283 0.707 1.030 1.296
Tyrannidae Rhytipterna_simplex 1.237 1.374 0.809 0.997 1.55
Tyrannidae Sayornis_nigricans 1.117 1.278 0.613 0.913 1.255
Tyrannidae Serpophaga_munda 0.900 1.017 0.540 0.668 0.903
Tyrannidae Sirystes_sibilator 1.196 1.324 0.824 1.064 1.502
Tyrannidae Stigmatura_budytoides 1.013 1.129 0.506 0.807 1.035
Tyrannidae Sublegatus_modestus 0.900 1.063 0.515 0.836 1.051
Tyrannidae Suiriri_suiriri 1.015 1.157 0.641 0.877 1.138
Tyrannidae Tachuris_rubrigastra 1.012 1.098 0.418 0.606 0.86
Tyrannidae Terenotriccus_erythrurus 0.917 1.032 0.439 0.775 0.845
Tyrannidae Todirostrum_cinereum 1.102 1.197 0.536 0.766 0.643
Tyrannidae Tolmomyias_flaviventris 0.968 1.142 0.590 0.918 1.053
Tyrannidae Tumbezia_salvini 1.089 1.201 0.593 0.791 1.086
Tyrannidae Tyrannus_savana 1.171 1.290 0.746 0.980 1.498
Pipridae Antilophia_galeata 0.890 1.097 0.629 0.930 1.343
Pipridae Chiroxiphia_caudata 0.972 1.116 0.686 0.971 1.408
Pipridae Chiroxiphia_linearis 0.836 1.170 0.581 0.924 1.242
Pipridae Corapipo_gutturalis 0.813 1.088 0.519 0.851 0.914
Pipridae Corapipo_leucorrhoa 0.853 1.076 0.533 0.822 1.068
Pipridae Ilicura_militaris 0.716 1.080 0.477 0.845 1.104
Pipridae Lepidothrix_coronata 0.928 1.075 0.561 0.848 0.929
Pipridae Lepidothrix_iris 0.975 1.086 0.642 0.820 0.937
Pipridae Lepidothrix_isidorei 0.756 1.013 0.421 0.797 0.892
Pipridae Lepidothrix_nattereri 0.928 1.052 0.582 0.821 0.964
Pipridae Lepidothrix_serena 0.924 1.080 0.609 0.885 1.041
Pipridae Machaeropterus_deliciosus 0.906 1.119 0.493 0.941 1.104
Pipridae Machaeropterus_pyrocephalus 0.905 0.999 0.557 0.877 0.991
Pipridae Manacus_aurantiacus 0.940 1.172 0.585 0.989 1.19
Pipridae Manacus_candei 0.974 1.232 0.599 0.967 1.298
Pipridae Manacus_manacus 0.974 1.084 0.624 0.834 1.227
Pipridae Manacus_vitellinus 0.964 1.212 0.602 0.963 1.26
Pipridae Masius_chrysopterus 0.782 1.131 0.559 0.888 1.063
Pipridae Neopelma_chrysocephalum 1.009 1.235 0.610 0.989 1.19
Pipridae Neopelma_pallescens 1.021 1.250 0.642 1.015 1.26
Pipridae Neopelma_sulphureiventer 1.060 1.137 0.628 0.887 1.236
Pipridae Pipra_aureola 0.978 1.074 0.647 0.878 1.211
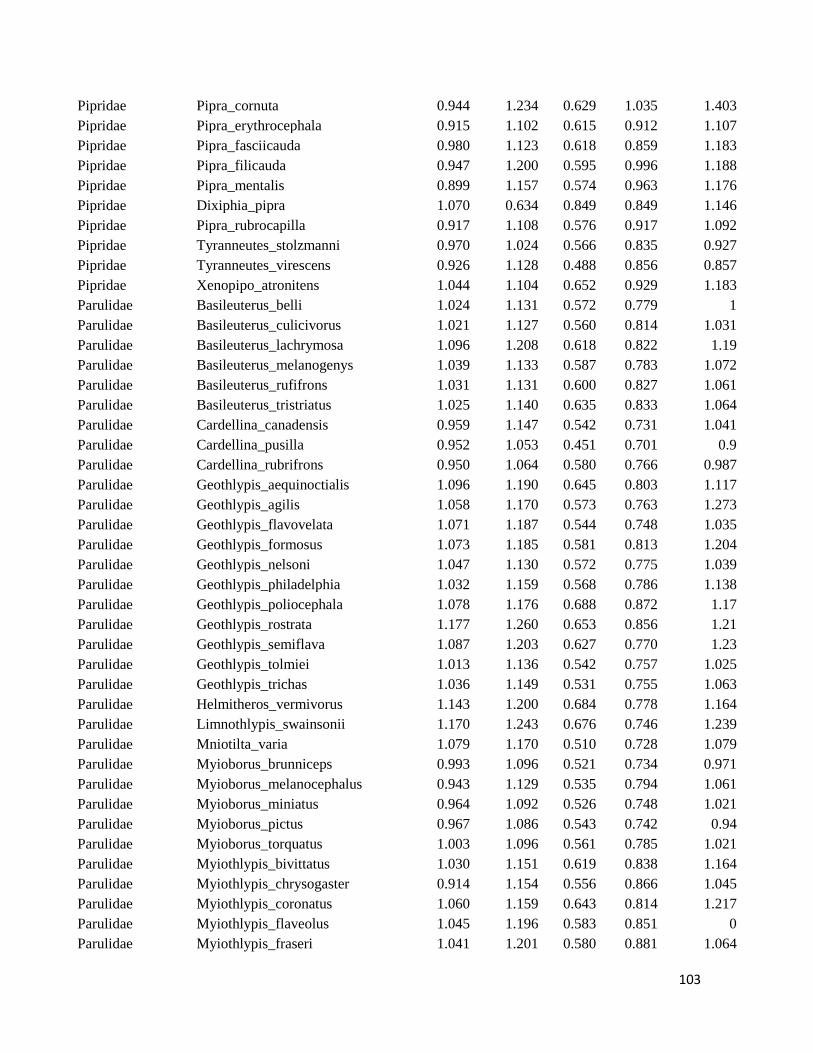
103
Pipridae Pipra_cornuta 0.944 1.234 0.629 1.035 1.403
Pipridae Pipra_erythrocephala 0.915 1.102 0.615 0.912 1.107
Pipridae Pipra_fasciicauda 0.980 1.123 0.618 0.859 1.183
Pipridae Pipra_filicauda 0.947 1.200 0.595 0.996 1.188
Pipridae Pipra_mentalis 0.899 1.157 0.574 0.963 1.176
Pipridae Dixiphia_pipra 1.070 0.634 0.849 0.849 1.146
Pipridae Pipra_rubrocapilla 0.917 1.108 0.576 0.917 1.092
Pipridae Tyranneutes_stolzmanni 0.970 1.024 0.566 0.835 0.927
Pipridae Tyranneutes_virescens 0.926 1.128 0.488 0.856 0.857
Pipridae Xenopipo_atronitens 1.044 1.104 0.652 0.929 1.183
Parulidae Basileuterus_belli 1.024 1.131 0.572 0.779 1
Parulidae Basileuterus_culicivorus 1.021 1.127 0.560 0.814 1.031
Parulidae Basileuterus_lachrymosa 1.096 1.208 0.618 0.822 1.19
Parulidae Basileuterus_melanogenys 1.039 1.133 0.587 0.783 1.072
Parulidae Basileuterus_rufifrons 1.031 1.131 0.600 0.827 1.061
Parulidae Basileuterus_tristriatus 1.025 1.140 0.635 0.833 1.064
Parulidae Cardellina_canadensis 0.959 1.147 0.542 0.731 1.041
Parulidae Cardellina_pusilla 0.952 1.053 0.451 0.701 0.9
Parulidae Cardellina_rubrifrons 0.950 1.064 0.580 0.766 0.987
Parulidae Geothlypis_aequinoctialis 1.096 1.190 0.645 0.803 1.117
Parulidae Geothlypis_agilis 1.058 1.170 0.573 0.763 1.273
Parulidae Geothlypis_flavovelata 1.071 1.187 0.544 0.748 1.035
Parulidae Geothlypis_formosus 1.073 1.185 0.581 0.813 1.204
Parulidae Geothlypis_nelsoni 1.047 1.130 0.572 0.775 1.039
Parulidae Geothlypis_philadelphia 1.032 1.159 0.568 0.786 1.138
Parulidae Geothlypis_poliocephala 1.078 1.176 0.688 0.872 1.17
Parulidae Geothlypis_rostrata 1.177 1.260 0.653 0.856 1.21
Parulidae Geothlypis_semiflava 1.087 1.203 0.627 0.770 1.23
Parulidae Geothlypis_tolmiei 1.013 1.136 0.542 0.757 1.025
Parulidae Geothlypis_trichas 1.036 1.149 0.531 0.755 1.063
Parulidae Helmitheros_vermivorus 1.143 1.200 0.684 0.778 1.164
Parulidae Limnothlypis_swainsonii 1.170 1.243 0.676 0.746 1.239
Parulidae Mniotilta_varia 1.079 1.170 0.510 0.728 1.079
Parulidae Myioborus_brunniceps 0.993 1.096 0.521 0.734 0.971
Parulidae Myioborus_melanocephalus 0.943 1.129 0.535 0.794 1.061
Parulidae Myioborus_miniatus 0.964 1.092 0.526 0.748 1.021
Parulidae Myioborus_pictus 0.967 1.086 0.543 0.742 0.94
Parulidae Myioborus_torquatus 1.003 1.096 0.561 0.785 1.021
Parulidae Myiothlypis_bivittatus 1.030 1.151 0.619 0.838 1.164
Parulidae Myiothlypis_chrysogaster 0.914 1.154 0.556 0.866 1.045
Parulidae Myiothlypis_coronatus 1.060 1.159 0.643 0.814 1.217
Parulidae Myiothlypis_flaveolus 1.045 1.196 0.583 0.851 0
Parulidae Myiothlypis_fraseri 1.041 1.201 0.580 0.881 1.064
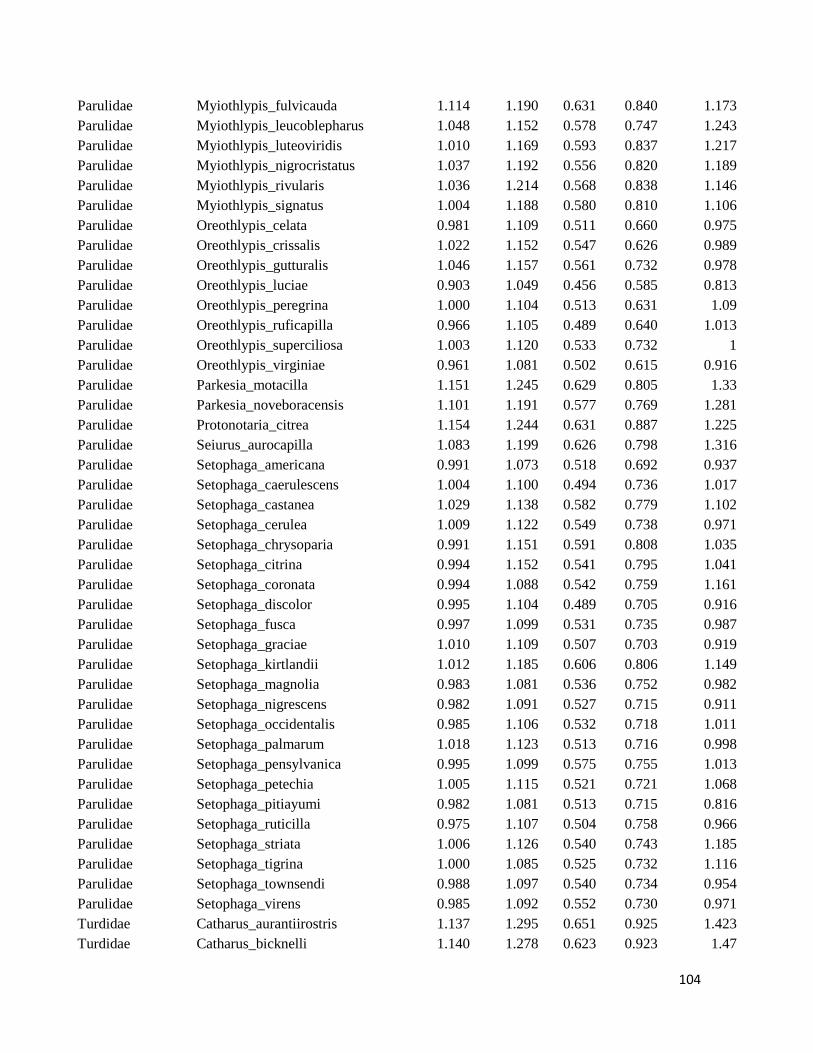
104
Parulidae Myiothlypis_fulvicauda 1.114 1.190 0.631 0.840 1.173
Parulidae Myiothlypis_leucoblepharus 1.048 1.152 0.578 0.747 1.243
Parulidae Myiothlypis_luteoviridis 1.010 1.169 0.593 0.837 1.217
Parulidae Myiothlypis_nigrocristatus 1.037 1.192 0.556 0.820 1.189
Parulidae Myiothlypis_rivularis 1.036 1.214 0.568 0.838 1.146
Parulidae Myiothlypis_signatus 1.004 1.188 0.580 0.810 1.106
Parulidae Oreothlypis_celata 0.981 1.109 0.511 0.660 0.975
Parulidae Oreothlypis_crissalis 1.022 1.152 0.547 0.626 0.989
Parulidae Oreothlypis_gutturalis 1.046 1.157 0.561 0.732 0.978
Parulidae Oreothlypis_luciae 0.903 1.049 0.456 0.585 0.813
Parulidae Oreothlypis_peregrina 1.000 1.104 0.513 0.631 1.09
Parulidae Oreothlypis_ruficapilla 0.966 1.105 0.489 0.640 1.013
Parulidae Oreothlypis_superciliosa 1.003 1.120 0.533 0.732 1
Parulidae Oreothlypis_virginiae 0.961 1.081 0.502 0.615 0.916
Parulidae Parkesia_motacilla 1.151 1.245 0.629 0.805 1.33
Parulidae Parkesia_noveboracensis 1.101 1.191 0.577 0.769 1.281
Parulidae Protonotaria_citrea 1.154 1.244 0.631 0.887 1.225
Parulidae Seiurus_aurocapilla 1.083 1.199 0.626 0.798 1.316
Parulidae Setophaga_americana 0.991 1.073 0.518 0.692 0.937
Parulidae Setophaga_caerulescens 1.004 1.100 0.494 0.736 1.017
Parulidae Setophaga_castanea 1.029 1.138 0.582 0.779 1.102
Parulidae Setophaga_cerulea 1.009 1.122 0.549 0.738 0.971
Parulidae Setophaga_chrysoparia 0.991 1.151 0.591 0.808 1.035
Parulidae Setophaga_citrina 0.994 1.152 0.541 0.795 1.041
Parulidae Setophaga_coronata 0.994 1.088 0.542 0.759 1.161
Parulidae Setophaga_discolor 0.995 1.104 0.489 0.705 0.916
Parulidae Setophaga_fusca 0.997 1.099 0.531 0.735 0.987
Parulidae Setophaga_graciae 1.010 1.109 0.507 0.703 0.919
Parulidae Setophaga_kirtlandii 1.012 1.185 0.606 0.806 1.149
Parulidae Setophaga_magnolia 0.983 1.081 0.536 0.752 0.982
Parulidae Setophaga_nigrescens 0.982 1.091 0.527 0.715 0.911
Parulidae Setophaga_occidentalis 0.985 1.106 0.532 0.718 1.011
Parulidae Setophaga_palmarum 1.018 1.123 0.513 0.716 0.998
Parulidae Setophaga_pensylvanica 0.995 1.099 0.575 0.755 1.013
Parulidae Setophaga_petechia 1.005 1.115 0.521 0.721 1.068
Parulidae Setophaga_pitiayumi 0.982 1.081 0.513 0.715 0.816
Parulidae Setophaga_ruticilla 0.975 1.107 0.504 0.758 0.966
Parulidae Setophaga_striata 1.006 1.126 0.540 0.743 1.185
Parulidae Setophaga_tigrina 1.000 1.085 0.525 0.732 1.116
Parulidae Setophaga_townsendi 0.988 1.097 0.540 0.734 0.954
Parulidae Setophaga_virens 0.985 1.092 0.552 0.730 0.971
Turdidae Catharus_aurantiirostris 1.137 1.295 0.651 0.925 1.423
Turdidae Catharus_bicknelli 1.140 1.278 0.623 0.923 1.47

105
Turdidae Catharus_dryas 1.186 1.322 0.680 0.884 1.602
Turdidae Catharus_frantzii 1.162 1.292 0.646 0.888 1.477
Turdidae Catharus_fuscater 1.164 0.964 0.669 0.888 1.562
Turdidae Catharus_fuscescens 1.100 1.308 0.657 0.984 1.531
Turdidae Catharus_gracilirostris 1.093 1.234 0.584 0.838 1.322
Turdidae Catharus_guttatus 1.150 1.290 0.620 0.930 1.439
Turdidae Catharus_mexicanus 1.149 1.312 0.661 0.931 1.477
Turdidae Catharus_minimus 1.136 1.297 0.639 0.909 1.58
Turdidae Catharus_occidentalis 1.138 1.266 0.613 0.900 1.415
Turdidae Catharus_ustulatus 1.113 1.272 0.633 0.964 1.544
Turdidae Cichlopsis 1.172 1.269 0.706 0.927 1.724
Turdidae Entomodestes_coracinus 1.185 1.314 0.694 0.967 1.748
Turdidae Entomodestes_leucotis 1.182 1.337 0.689 0.968 1.763
Turdidae Hylocichla 1.219 1.381 0.730 1.025 1.748
Turdidae Myadestes 1.065 1.234 0.646 0.928 1.464
Turdidae Sialia_currucoides 1.117 1.247 0.628 0.902 1.477
Turdidae Sialia_mexicanus 1.085 1.224 0.625 0.904 1.422
Turdidae Sialia_sialis 1.075 1.225 0.648 0.930 1.462
Turdidae Turdus_chiguanco 1.397 1.476 0.884 1.018 2.029
Turdidae Platycichla 1.248 1.375 0.784 0.992 1.803
Turdidae Turdus_fuscater 1.381 1.486 0.929 1.042 2.18
Turdidae Turdus_grayi 1.293 1.423 0.813 1.020 1.878
Turdidae Turdus_migratorius 1.285 1.403 0.825 1.010 1.884
Turdidae Turdus_rufiventris 1.287 1.391 0.835 0.937 1.875
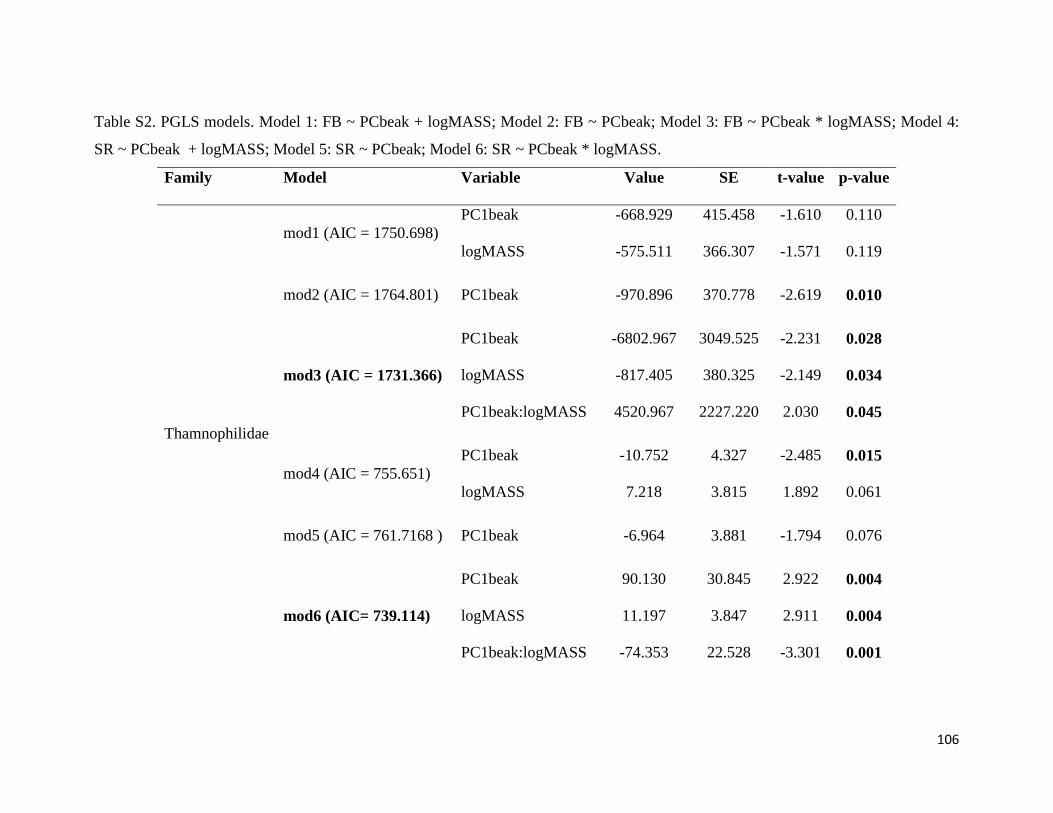
106
Table S2. PGLS models. Model 1: FB ~ PCbeak + logMASS; Model 2: FB ~ PCbeak; Model 3: FB ~ PCbeak * logMASS; Model 4:
SR ~ PCbeak + logMASS; Model 5: SR ~ PCbeak; Model 6: SR ~ PCbeak * logMASS.
Family Model Variable Value SE t-value p-value
Thamnophilidae
mod1 (AIC = 1750.698)
PC1beak -668.929 415.458 -1.610 0.110
logMASS -575.511 366.307 -1.571 0.119
mod2 (AIC = 1764.801) PC1beak -970.896 370.778 -2.619 0.010
mod3 (AIC = 1731.366)
PC1beak -6802.967 3049.525 -2.231 0.028
logMASS -817.405 380.325 -2.149 0.034
PC1beak:logMASS 4520.967 2227.220 2.030 0.045
mod4 (AIC = 755.651)
PC1beak -10.752 4.327 -2.485 0.015
logMASS 7.218 3.815 1.892 0.061
mod5 (AIC = 761.7168 ) PC1beak -6.964 3.881 -1.794 0.076
mod6 (AIC= 739.114)
PC1beak 90.130 30.845 2.922 0.004
logMASS 11.197 3.847 2.911 0.004
PC1beak:logMASS -74.353 22.528 -3.301 0.001
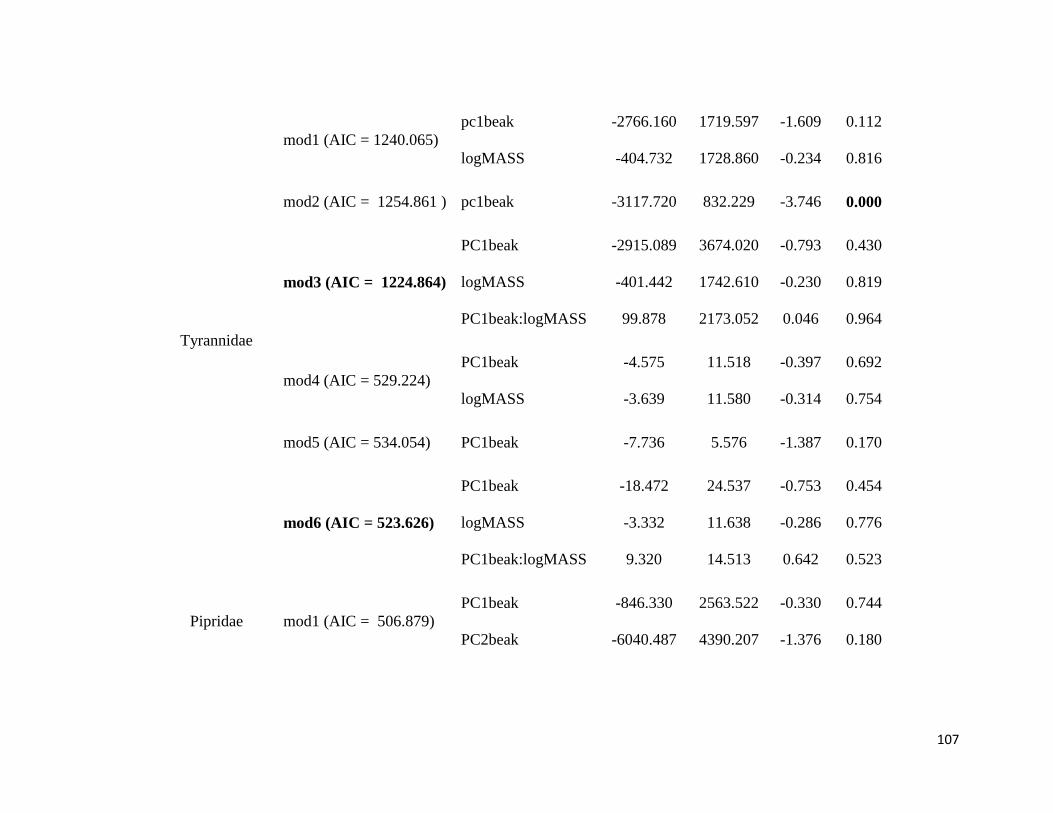
107
Tyrannidae
mod1 (AIC = 1240.065)
pc1beak -2766.160 1719.597 -1.609 0.112
logMASS -404.732 1728.860 -0.234 0.816
mod2 (AIC = 1254.861 ) pc1beak -3117.720 832.229 -3.746 0.000
mod3 (AIC = 1224.864)
PC1beak -2915.089 3674.020 -0.793 0.430
logMASS -401.442 1742.610 -0.230 0.819
PC1beak:logMASS 99.878 2173.052 0.046 0.964
mod4 (AIC = 529.224)
PC1beak -4.575 11.518 -0.397 0.692
logMASS -3.639 11.580 -0.314 0.754
mod5 (AIC = 534.054) PC1beak -7.736 5.576 -1.387 0.170
mod6 (AIC = 523.626)
PC1beak -18.472 24.537 -0.753 0.454
logMASS -3.332 11.638 -0.286 0.776
PC1beak:logMASS 9.320 14.513 0.642 0.523
Pipridae mod1 (AIC = 506.879)
PC1beak -846.330 2563.522 -0.330 0.744
PC2beak -6040.487 4390.207 -1.376 0.180
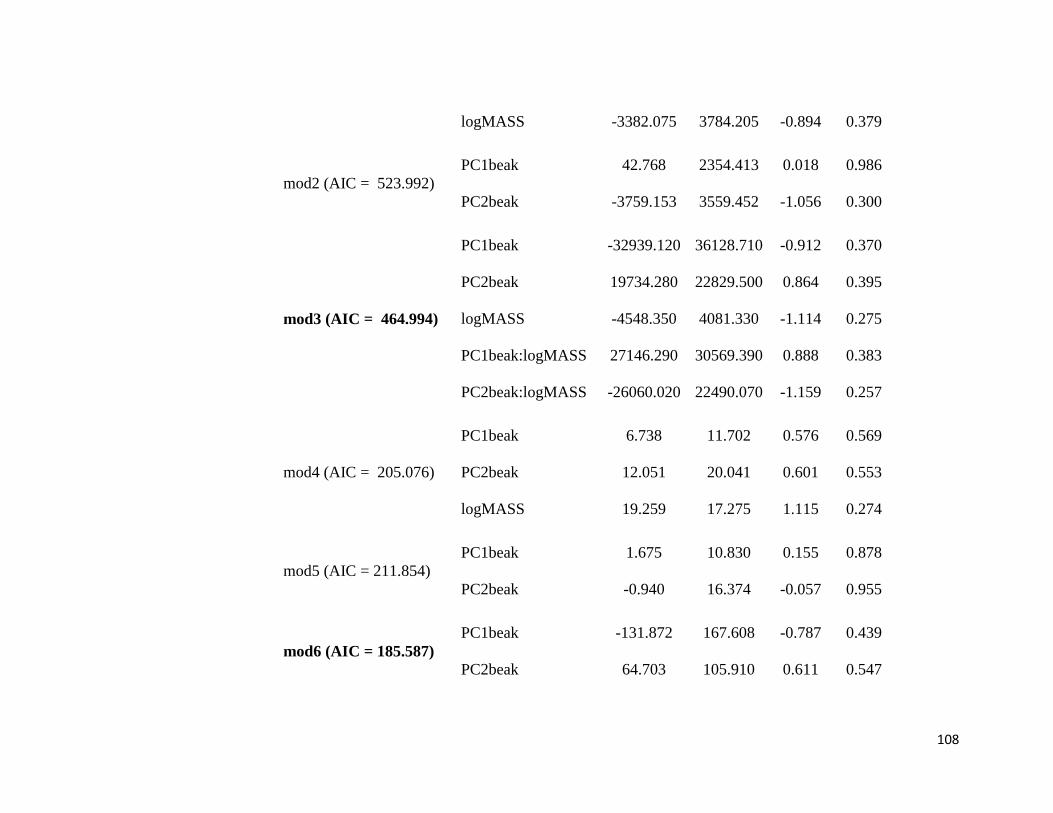
108
logMASS -3382.075 3784.205 -0.894 0.379
mod2 (AIC = 523.992)
PC1beak 42.768 2354.413 0.018 0.986
PC2beak -3759.153 3559.452 -1.056 0.300
mod3 (AIC = 464.994)
PC1beak -32939.120 36128.710 -0.912 0.370
PC2beak 19734.280 22829.500 0.864 0.395
logMASS -4548.350 4081.330 -1.114 0.275
PC1beak:logMASS 27146.290 30569.390 0.888 0.383
PC2beak:logMASS -26060.020 22490.070 -1.159 0.257
mod4 (AIC = 205.076)
PC1beak 6.738 11.702 0.576 0.569
PC2beak 12.051 20.041 0.601 0.553
logMASS 19.259 17.275 1.115 0.274
mod5 (AIC = 211.854)
PC1beak 1.675 10.830 0.155 0.878
PC2beak -0.940 16.374 -0.057 0.955
mod6 (AIC = 185.587)
PC1beak -131.872 167.608 -0.787 0.439
PC2beak 64.703 105.910 0.611 0.547

109
logMASS 18.238 18.934 0.963 0.344
PC1beak:logMASS 117.481 141.817 0.828 0.415
PC2beak:logMASS -53.938 104.336 -0.517 0.610
Parulidae
mod1 (AIC = 664.828)
PC1beak 15.729 43.589 0.361 0.719
logMASS -10.452 37.006 -0.282 0.778
mod2 (AIC = 671.962) PC1beak 23.447 33.740 0.695 0.489
mod3 (AIC = 648.139)
PC1beak -498.138 202.713 -2.457 0.017
logMASS -36.393 36.982 -0.984 0.329
PC1beak:logMASS 459.554 177.366 2.591 0.012
mod4 (AIC = 672.557
PC1beak 96.357 46.027 2.093 0.040
logMASS 22.896 39.076 0.586 0.560
mod5 (AIC = 680.066) PC1beak 79.448 35.693 2.226 0.029
mod6 (AIC = 661.585)
PC1beak 263.657 223.147 1.182 0.241
logMASS 31.342 40.710 0.770 0.444
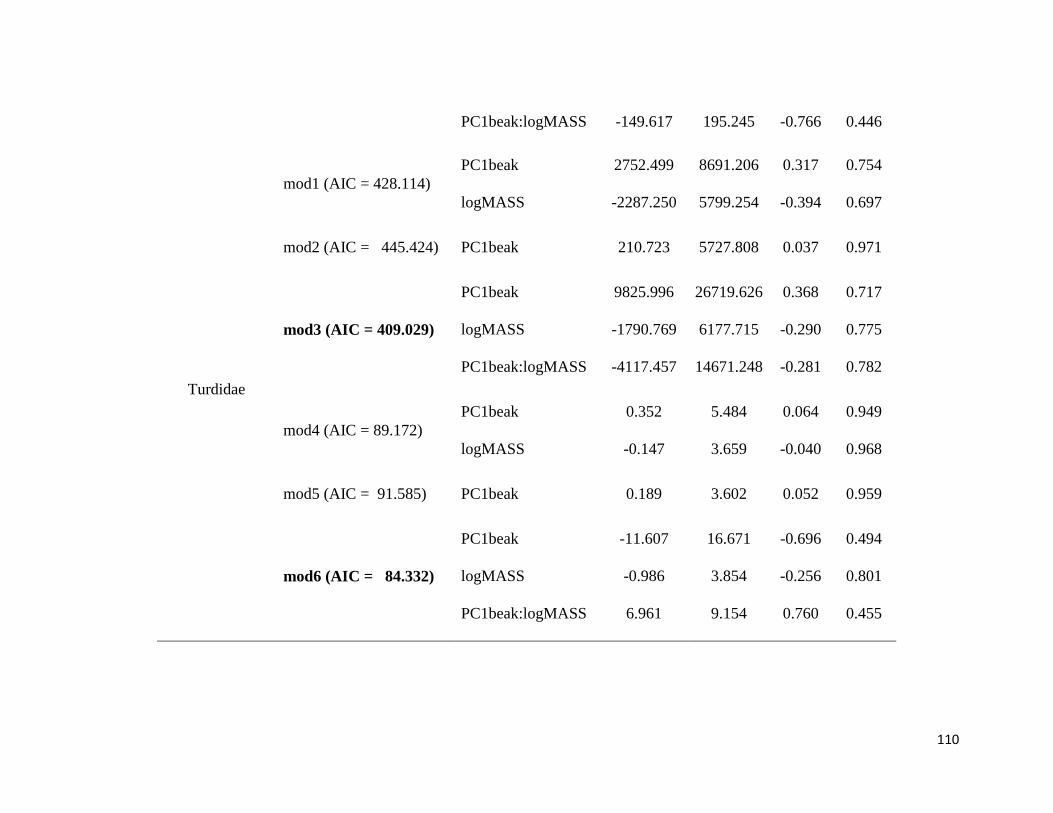
110
PC1beak:logMASS -149.617 195.245 -0.766 0.446
Turdidae
mod1 (AIC = 428.114)
PC1beak 2752.499 8691.206 0.317 0.754
logMASS -2287.250 5799.254 -0.394 0.697
mod2 (AIC = 445.424) PC1beak 210.723 5727.808 0.037 0.971
mod3 (AIC = 409.029)
PC1beak 9825.996 26719.626 0.368 0.717
logMASS -1790.769 6177.715 -0.290 0.775
PC1beak:logMASS -4117.457 14671.248 -0.281 0.782
mod4 (AIC = 89.172)
PC1beak 0.352 5.484 0.064 0.949
logMASS -0.147 3.659 -0.040 0.968
mod5 (AIC = 91.585) PC1beak 0.189 3.602 0.052 0.959
mod6 (AIC = 84.332)
PC1beak -11.607 16.671 -0.696 0.494
logMASS -0.986 3.854 -0.256 0.801
PC1beak:logMASS 6.961 9.154 0.760 0.455

111