Embed Size (px)
Citation preview


i
Agradecimentos
Quero agradecer ao Professor Doutor José Paulo Sousa por permitir a realização deste
projecto bem como por toda a sua disponibilidade e orientação.
Um enorme e sentido agradecimento à minha orientadora Doutora Joana Alves e ao
Mestre António Silva que juntos permitiram, apoiaram, trabalharam afincadamente e me
ajudaram em tudo o que precisei, sempre disponíveis e prontos a resolver os percalços
que iam surgindo. Muito obrigada do fundo do coração pelo vosso empenho e
dedicação, rigor científico ímpar e conhecimentos transmitidos. Não podia estar em
melhores mãos! Obrigada Joana por todos os sermões e puxões de orelhas que me
permitiram crescer, aprender cada vez mais e fazer as coisas da melhor forma possível.
Obrigada Toni pelo tempo perdido a compor as coisas que decidiam avariar nas minhas
mãos. Sem vocês esta dissertação não se teria tornado uma realidade. A vocês estarei
eternamente grata!
Quero agradecer à Mestre Fernanda Garcia por ter sido crucial e imprescindível neste
projecto, desde o trabalho de campo, ao trabalho do laboratório, à análise de dados, à
parte escrita da dissertação e mesmo a nível pessoal sempre esteve disponível e ajudou
em tudo e todas as etapas deste projecto. A ti Fernanda um enorme obrigada, por toda a
ajuda e entrega quer a nível profissional quer a nível pessoal.
Obrigada às minhas colegas, agora mestres, Catarina Coelho e Raquel Oliveira que me
ajudaram em todo o trabalho de campo. Obrigada também à Sandra Simões e Liliana
Almeida por terem também colaborado no trabalho de campo e ao Rúben Mina por ter
colaborado não só no trabalho de campo como na análise dos dados.
Quero agradecer também à entidade gestora da Zona de Caça Municipal de Vila Nova,
nomeadamente ao senhor Zé João por toda a sua ajuda e disponibilidade em campo,
bem como ao Centro de Estágio de Vila Nova.
Obrigada ao laboratório de solos por me ter aberto as portas. Obrigada a todas as
pessoas que lá trabalham que com a sua simpatia, boa disposição e prontidão a ajudar
tornaram os meus dias melhores.
Obrigada aos meus pais por todo o apoio financeiro e pessoal, a eles lhes devo um
enorme obrigada diariamente. Se estou onde estou é graças a eles! Obrigada também ao
resto da minha família por todo o apoio, preocupação, motivação e fé em mim.
Obrigada à minha irmã por ser um exemplo de profissionalismo, ao amigo de todas as
horas- Gonçalo, às minhas amigas de infância Marta e Natália, às minhas amigas não de
sempre mas para sempre Ália e Meme, à pitinha Lili por me transmitir a sua força, às
minhas colegas de casa por aturarem as minhas crises existenciais e nunca me falharem
com uma palavra amiga ou abraço reconfortante. A todos os restantes amigos que não
consigo enumerar aqui mas aos quais agradeço todo o apoio e preocupação nesta etapa
da minha vida.

ii
Porque o melhor se guarda para o fim, ao Leo, por acreditar mais em mim do que eu
própria, por todo o amor, carinho, compreensão e ajuda prestada. Obrigada por seres um
exemplo de Homem, por me transmitires valores e por nunca me teres largado a mão.
És o meu trevo de quatro folhas.
iii
Resumo
Os recursos ecológicos referem-se de uma forma simplificada ao refúgio e ao
alimento. Desta forma, para identificar os recursos ecológicos usados por uma espécie é
necessário estudar o uso do habitat bem como o seu comportamento alimentar. O estudo
do uso comparativo de recursos (em termos de habitat e alimento) permite identificar
interacções interespecíficas assim como o seu modo de operação. São cada vez mais as
situações por toda a Europa em que veado e corço ocorrem simpatricamente. Tal ocorre
na Serra da Lousã (Portugal) como resultado de programas de reintrodução. No entanto,
as interacções interespecíficas entre estes dois cervídeos nunca foram estudadas após a
sua reintrodução. No entanto, o seu conhecimento é crucial para a gestão e conservação
de ambas as espécies e dos seus habitats. Assim, este trabalho tem como objectivo
avaliar os recursos ecológicos usados sazonalmente pelo veado e pelo corço na Serra da
Lousã, de forma a perceber como uma espécie se comporta na presença da outra.
Contagens de grupos de excrementos através de transectos lineares com amostragem à
distância foram realizadas de modo a identificar os padrões do uso de habitat por ambas
as espécies. Durante a realização dos transectos também foram recolhidas amostras de
excrementos frescos de ambas as espécies que foram posteriormente analisadas por
meio da técnica microhistológica. Esta permitiu identificar as espécies de plantas
consumidas pelo veado e pelo corço.
Deste modo através de ambos os métodos pretendeu-se determinar as
interacções interespecíficas entre o veado e o corço e averiguar se a presença de ambas
as espécies não acarreta problemas para nenhuma delas, resultando em coexistência, ou
se pelo contrário a presença de uma compromete a presença da outra, resultando em
competição. Os resultados deste estudo mostraram que o veado e o corço coexistem na
Serra da Lousã, apresentando baixa competição quer em termos de ocupação de habitat
quer por recursos alimentares.
Palavras-chave: Cervus elaphus, Capreolus capreolus, uso do habitat, comportamento
alimentar, contagens de grupos de pellets, técnica microhistológica

iv
Abstract
The ecological resources, in simple terms, refers to cover and food. Hence, to
identify the ecological resources used by a species it is necessary to study their habitat
use as well as their feeding behavior. The study of the comparative use of resources (in
terms of habitat and food) allows the identification of interspecific interactions as well
as how they function. It is becoming more common for the red and roe deer to occur
sympatrically through all Europe, which also happens in Lousã Mountain (Portugal) as
the result of reintroduction programs. However, the interspecific interactions between
these two deer species was never been studied after their reintroduction. Such study is
crucial for the management and conservation of both species and their habitats.
Therefore, the aim of this study is to evaluate the ecological resources used seasonally
by the red and roe deer in Lousã Mountain, to understand the behavior of each species
in the presence of the other. Pellet group counts through line transects with distance
sampling was made to identify the patterns of the habitat used by both species. When
making the transects, fresh fecal samples of both species were collected for posterior
analysis using the microhistological technique. The latter allowed the identification of
the plant species consumed by the red and roe deer.
Thus, through the use of both methods the aim was to determine the interspecific
interactions between the red and roe deer, and to verify if the presence of both species is
not posing a problem for neither, resulting in coexistence, or on the contrary, if the
presence of one species affects the other, resulting in competition. The results of this
study demonstrate that the red and roe deer coexist in Lousã Mountain, presenting little
competition either for habitat or food.
Key words: Cervus elaphus, Capreolus capreolus, habitat use, feeding behavior, pellet
group counts, microhistological technique

v
Index List of images .................................................................................................................. vi
List of tables .................................................................................................................. viii
Chapter I – General introduction ...................................................................................... 1
1.1 Important ecological concepts and its definition ............................................... 2
1.2 Study species ...................................................................................................... 7
1.2.1 Red deer Cervus elaphus - Ecology and behavior ...................................... 7
1.2.2 Roe deer Capreolus capreolus - Ecology and behavior ........................... 10
1.3 Study area ........................................................................................................ 13
1.3.1 Location, climate and topography ............................................................ 13
1.3.2 Land cover and flora ................................................................................. 13
1.3.3 Red and roe deer presence ........................................................................ 14
1.4 Aims ................................................................................................................. 15
Chapter II – Red and roe deer in the Lousã Mountain: Are they using the same
ecological resources? ...................................................................................................... 17
2.1 Introduction ...................................................................................................... 18
2.2 Materials and methods ..................................................................................... 22
2.2.1 Study area and study species .................................................................... 22
2.2.2 Field methods ........................................................................................... 22
2.2.3 Feces collection and microhistological analysis ....................................... 24
2.2.4 Data analysis ............................................................................................. 25
2.3 Results .............................................................................................................. 27
2.3.1 Habitat use ................................................................................................ 27
2.3.2 Feeding behavior ...................................................................................... 31
2.4 Discussion ........................................................................................................ 39
2.4.1 Habitat use ................................................................................................ 39
2.4.2 Feeding behavior ...................................................................................... 44
2.4.3 Evaluating ecological resources used by red and roe deer ....................... 49
Chapter III-General conclusions ..................................................................................... 50
Chapter IV-References ................................................................................................... 52

vi
List of images
Fig 1: Distribution of red deer populations in Europe (adapted from ©Societas Europaea
Mammalogica 2018)..............................................................................................7
Fig 2: Distribution of red deer populations in Portugal (adapted from (Salazar 2009))..8
Fig 3: Distribution of roe deer populations in Europe (adapted from ©Societas Europaea
Mammalogica 2018)........................................................................................................10
Fig 4: Distribution of roe deer populations in Portugal (adapted from (Salazar
2009))……………………………………………………………………………...........11
Fig 5: Fig 5: Map of the study area with the line transects of fecal pellet
counts.…………………………………………………………………………………..23
Fig 6: Map of the pellet counts of red deer in each quadrant of the study area throughout
the year.………………………………………………………………………………...28
Fig 7: Map of the pellet counts of red deer in each quadrant of the study area in a)
winter, b) spring, c) summer and d) autumn....................................................................29
Fig 8: Map of the pellet counts of roe deer in each quadrant of the study area throughout
the year ………………………………………………………………………………...29
Fig 9: Map of the pellet counts of roe deer in each quadrant of the study area in a)
winter, b) spring, c) summer and d) autumn....................................................................30
Fig 10: PCA biplot for winter (Win), spring (Spr), summer (Sum) and autumn (Aut),
showing the differences between the deer species. Grey squares represent red deer
(N=61) and blue squares the roe deer (N=35)………………………………………….35
Fig 11: Absolute frequency of occurrence of the different structures of plants on the diet
of red deer (N=61) in the different seasons…………………………………………….36
Fig 12: Absolute frequency of occurrence of the different structures of plants on the diet
of roe deer (N=35) in the different seasons…………………………………………….37
Fig 13: Mean food amplitude index by season between red deer (open circles, N=61)
and roe deer (black squares, N=35)…………………………………………………….38

vii

viii
List of tables
Table 1: Pianka‟s index representing spatial overlap between red and roe deer……….31
Table 2: Diet composition of red deer (N=61) per season in terms of absolute frequency
of occurrence (AF) and relative frequency of occurrence (RF)………………………..32
Table 3: Table 3: Diet composition of roe deer (N=35) per season in terms of absolute
frequency of occurrence (AF) and relative frequency of occurrence (RF)…………….33
Table 4: Pianka‟s index representing food overlap between red and roe deer…………38

1
Chapter I – General introduction

2
When considering sympatric species, whom coexist and may or not compete, there
are several concepts that need to be defined to provide their correct utilization and
interpretation throughout the thesis.
1.1 Important ecological concepts and its definition
Ecological resources
Understand how animals answer to the environment allows identifying the essential
resources, how and when they are used (Manly et al. 2002; Alves et al. 2014).
Ecological resources correspond to resources requirements which are, in a simplified
way, the food and cover (Borkowski 2004; Manly et al. 2002). These two continuous
habitat variables, related with fitness of an individual (Clark 1994), are very important
because when different habitats confer opposing benefits, as food quality or quantity
versus protection against predation (Brown 1999; Godvik et al. 2009; Panzacchi et al.
2010), the animals have to make behavioral trade-offs (Dupke et al. 2017). In
accordance with the relative influence of the different limiting factors, the strength and
magnitude of trade-offs can vary in time and space (Dupke et al. 2017). Limiting factor
is an environmental factor of such importance that limits the size of the population (Jie
2017).
Habitat use and selection
Habitat can be defined as the set of resources and conditions present in an area that
will allow the occupation of a given area, and to determine the survival and
reproduction of organisms (Hall et al. 1997; Hirzel and Le Lay 2008). Two important
concepts should be considering when talking about habitat for a species, the habitat use
and habitat selection. Habitat use corresponds to how animals use the resources to
satisfy their requirements (Block and Brennan 1993). This is selective when resources
are used disproportionately to their availability (Johnson 1980). It‟s influenced by
biotic, abiotic, species and social factors. As biotic factors can be mentioned the quality,
quantity and dispersion of resources (MacDonald 1983; Anderson et al. 2005; Van
Beest et al. 2011); as abiotic factors the climate and topography (Kie et al. 2005; Rivrud
et al. 2010); of species the age, sex, physiology and reproductive state (Dahle and
Swenson 2003; Saïd et al. 2009) and finally the social factors as the intraspecific
competition by resources (Kjellander et al. 2004). The habitat selection is a hierarchical
process in space and time that occurs at multiple scales and is related with the process of
choosing a resource (Johnson 1980). It is influenced by several factors such as the
behavior, nutrition, competition, predation but also the scale at which selection occurs
(Johnson 1980; Senft et al. 1987; Wiens 1989; Manly et al. 2002; Hirzel and Le Lay
2008). In turn, it indirectly affects the population dynamics and distribution of species
and directly the survival and the reproductive success of individuals (Holt 2003;

3
Gaillard et al. 2010). So a lot of ecological factors can modulate habitat selection by
species, changing the benefits and costs supplied by the habitat (Lima and Dill 1990).
It is possible that animals develop trade-offs between the optimization of energy
balances and the need to use habitats with less food availability to increase the
opportunities for mating or safety (in relation to predators, for instance) (Hardenberg et
al. 2000; Ciuti et al. 2006; Panzacchi et al. 2009). In addition, the seasonality and
climate conditions may be a limiting factor for herbivorous (e.g. ungulates) which
strongly influences the space use (Shackleton and Bunnell 1987). As previously
mentioned, sex influences the use of space. In fact, males and females have different
constraints, for example the availability of high-quality food in case of females and
availability of high quantity in case of males. As seasonality and climate conditions,
these constraints will be influencing the space use too (Emlen and Oring 1977; Clutton-
Brock 1989).
Ecological niche
The ecological niche happens when a mutual relationship between organisms and
environment is present, meaning, when an organism needs and/or shape the
environment (Hutchinson 1957). Ecological niche includes a variety of small and large
processes, ranging from resource competition, predation, stress to community structure
as well as biodiversity and ecosystem function (Chase and Leibold 2003).
Niche overlap and niche breadth
The niche overlap is a measure of the extent of sharing of resources between species
(Giller 1984), and niche breadth is a measure of variety of items used within a resource
category (Latham 1999). Through the measure of niche breadth and niche overlap it's
possible to quantify the comparative resources used and to infer about the interspecific
interactions.
It is important to be careful and take into consideration the density of individuals
(Abrams 1980) and the abundance of resources (in space and time), when interpreting of
the quantification of niche overlap throughout the existing indices, since it will
determine when the overlap will lead to competition (Latham 1999). In fact, both niche
overlap and density will determine the magnitude of the competitive interactions
(Abrams 1980). This implies that high values of niche overlap may be found when
resources are superabundant, so the species can use the same resources without
competition. On the other hand, high values of niche overlap may also be found when
resources are scarce leading the species to use the same resources and compete, which
can lead to the exclusion of one of the species (Wiens 1993).

4
In addition, it's also important take into consideration the scale at which resources
are measured. This is because if the resources are divided into large groups (for example
in relation to diet, if plants are divided in forbs, shrubs and grasses) a greater value of
niche overlap are expected than if the resources are measure at small scales (for
example in also relation to diet, if plants are considered at the species level or
subdivided into different parts of the same plant) (Latham 1999). It's also important to
describe the overlap in resources in different times of the year, when resources are
numerous and when they are limited, and to infer about the existence of competition if
and when overlap decreases in the lean season (Smith et al. 1978; Gordon and Illius
1989). This is based on the presupposition that grazing ungulates begin to use lower-
quality forage when outcompeted from mutually preferred swards (Illius and Gordon
1987).
Home-range
The home-range is the area in which a species lives and moves, meaning, the area of
residence of a species. It‟s possible to define the home-range fidelity as the fixed
location of home-range over time (Greenwood 1980). Home-range fidelity depends,
besides its location in space, of the variation of its size. This causes to an individual
being able to stay in the same place and to present high home-range fidelity by changing
the size of home-range, which leads to changes in the degree of overlap (Richard et al.
2014). The overlap occurs when species' home-ranges coincide. The home-range size
it‟s determined by the resources that are used by each animal within this. On the other
hand, the variation of home-range size between individuals is determined by their
energy requirements (McNab 1963; Harestad and Bunnel 1979), age (Saïd et al. 2009),
body size (Harestad and Bunnel 1979) and by the amount of resources available
(Richard et al. 2011). These, in turn, are influenced by population density (Kjellander et
al. 2004) and by habitat quality (Wahlstrom and Kjellander 1995).
Sympatry
The first definition of sympatry is given by Poulton (1904) in which species are
called sympatric if found together in certain geographical areas. Later, Mayr (1942)
redefined sympatry whenever two forms or species occurs together, that is, whenever its
distribution areas overlap or match.
The occurrence of two species in same geographical area is the result of the different
adaptations of each species to local conditions, that is, since resources are found in
different conditions or at different moments, each species can adapt to these conditions
in different way, resulting in different behavior and preferences, allowing the
occurrence of both species in the same area (Darwin 1859).

5
Interspecific competition
Regarding interspecific interactions, in herbivorous these interactions depend on
factors such as: resources availability, animal density and the extent of overlap in the
resources used (De Boer and Prins 1990). Habitat heterogeneity it terms of resources
may allow species to coexist, especially if species differ in their feeding behavior, as
well as body size (Owen-Smith 2002). However, habitat heterogeneity may lead to
junction of animals into resources hotspots, which lead to increased local competition as
well to grouped distribution of the species that are upper competitors. This can lead to
the absence or origin of competition refuges (patches with reduced densities) for species
that are bottom competitors (Begon et al. 1996; Durant 1998; Hobbs and Gordon 2010).
In fact, for ungulates the most important interaction and that is more times
described is competition. Competition is understood by all interactions where one
species negatively affects the fitness of another species (Latham 1999). There are two
types of competition: resource competition and interference competition (Birch 1957).
The first type of competition occurs when species uses and compete for shared
resources, such as food or space. The interference competition happens when one
species causes slight effects on the environment, reducing its quality for the other
species. Therefore, it‟s expected if two species interact they can influence the way how
each of species uses the resources (Latham 1999).
So, the studies which compare the use of resources (habitat and food) of two
sympatric species at a range of densities allow identifying the interspecific interactions
and how they act (Latham 1999). According Putman (1996), it‟s common that two
sympatric species have resource partitioning, possibly has evolved of competition in
past. This implies that if species have currently the differential use of resources may not
mean that these species interacts, but if resources use of a species can be demonstrated
based on the character displacement, it‟s likely that these species interacts (Latham
1999).
To understand the interspecific competition is necessary to have information on
overlap in resources used (Schoener 1974; Abrams 1980). The exploitation competition
is a crucial mechanism of interaction between large herbivores (Sinclair and Norton-
Griffiths 1982; Sinclair 1985; Putman 1986; Putman 1996; Illius and Gordon 1987;
Gordon and Illius 1989). To interspecific exploitation competition takes place is crucial
occur overlap in habitat use and in diet, and also the shared resources are limited (De
Boer and Prins 1990; Tokeshi 1999).
Nevertheless, there is disagreement about the role of interspecific competition in
the establishment of food niches (Wiens 1977; Diamond 1978; Connell 1980; Schoener
1982). It is admitted that there is segregation of at least one dimension of spatial niche
when sympatric species coexist in long term. This is denominated “Competitive
exclusive principle” (Gause 1934; Hardin 1960). What this principle means is that
species with similar ecological niche cannot coexist at long term due to the pressure
exercised by the competition between the species. In this way one of species lead to the

6
displacement of the ecological niche of the other species, leading to behavioral changes
or even to the extinction to the other species. In conclusion, this principle implies that
long-standing competitors cannot coexist.
Feeding behavior
The natural selection shapes the species in terms of their morphology and
physiology, defining the limits of their fundamental food niches (Hutchinson 1957;
Hanley 1982; Chase and Leibold 2003). In this way, the diet of an animal depends on:
intrinsic limitations, essentially the body size; morphological/physiological
characteristics which dictate the range of food that is better tolerated; environmental
constraints, such as seasonality (variations in resources availability in short periods of
time (Schwartz and Ellis 1981)) and of interspecific interactions which determine the
resources availability (Storms et al. 2008).
Ungulates feed on plant species which differ in nutritional quality (Hanley
1982). The cells of plant tissues vary in the ratio between slowly digestible cell walls
and the facility of assimilation of cellular constituents. Therefore differ in the rate of
digestion by ungulates (Demment and Van Soest 1985). In relation to vegetal fiber
contents, grasses, sedges, heathers and ferns have high fiber contents whereas the leaves
of trees and shrubs have medium to high fiber contents and forbs have lower fiber
contents. The fibers (sclerenchyma) are slowly digested because they consist of
structural cells with thick-walled (Raven & al. 1992).
The capacity that individuals have to use these fibers in their diets is determined
by body size and consequently by their gut capacity. These capacities will determine the
retention time of the ingested in the gastrointestinal tract which determine the capacity
of individuals to use fibrous forage (Demment and Van Soest 1985; Gordon and Illius
1994; Robbins et al. 1995; Van Soest 1996). In this way, the interspecific
morphological/physiological differences are assigned to the tolerance to the fibrous
forage (Hofmann and Stewart 1972; Hofmann 1989; Clauss and Lechner-Doll 2001;
Clauss et al. 2003).

7
1.2 Study species
1.2.1 Red deer Cervus elaphus - Ecology and behavior
The red deer (Cervus elaphus, Linnaeus, 1758) belongs to the family Cervidae
and to the order Cetardiodactyla, according to the classification adopted by IUCN
(Lovari et al. 2016). Is the one of the largest cervids in world (Oliveira 2013), being one
of the mammals with the largest global distribution (Salazar 2009). Is widely distributed
throughout Europe (Fig.1) (Koubek and Zima 1999) and is currently the largest
ungulate in the Iberian Peninsula (Oliveira 2013). The red deer distribution also extends
to North Africa and the Middle East (Corbet 1978; Koubek and Zima 1999; Wilson and
Ruff 1999; Wilson and Mittermeier 2011).
Fig 1: Distribution of red deer populations in Europe (adapted from ©Societas Europaea
Mammalogica 2018).
In Portugal, existing populations of red deer resulted from reintroduction
programs or from natural expansion of the populations from Spain, where were
reintroduced after being close to extinction (Lovari et al. 2016). This has led to an
increase of populations in numbers and geographical area (Alves 2013) and this trend is
currently not only in Portugal (Lovari et al. 2016). This increase was due not only to
management actions but also to changes in habitats (Alves 2013).

8
Fig 2: Distribution of red deer populations in Portugal (adapted from (Salazar 2009)).
Red deer populations in Portugal (Fig.2) occur in several areas from the North to
the South of the country, such as: the Montesinho Natural Park; Peneda-Gerês National
Park; Lousã Mountain; International Tagus Natural Park; Tapada Nacional de Mafra;
Tapada Real de Vila Viçosa; Moura; Mourão; Barrancos and Monchique (Salazar
2009).
In Mediterranean environments, red deer uses a high variety of habitats,
including coniferous and mixed forests, shrublands, agricultural lands, grasslands as
well as areas close to the ecotone (transition between two different biomes) and water
sources (Koubek and Zima 1999; Alves et al. 2014) Thus, this species has a high
plasticity in terms of habitat use but shows preference for habitats that simultaneously
provide food and some refuge as shown by their preference for shrublands (Alves et al.
2014). Red deer also presents preference for forestall areas with dense coverings (60-
80%) as well as with a diverse tree layer (more than three species) (Prokešová et al.
2006). Red deer positively use areas with small covers and open spaces (e.g. grasslands
and shrublands) as proved by their positive use of ecotone zones (Alves et al. 2014).
Apart from these variables, human activity also influences the use of space.
Legal hunting (for instance) of red deer is allowed and lead to the avoidance of human
settlements, since hunting tends to promote various behavioral responses such as escape
behavior (Torres et al. 2014). Another anthropogenic factor is the roads.
This ruminant mammal shows a diphasic activity, once feed during the night to
avoid human disturbances (Richard et al. 2014) returning to their covers during the
morning (Georgii 1980; Licoppe 2006). So the night home-range is greater than the day
home-range (Richard et al. 2014) because red deer during the day are, for safety

9
reasons, in their covers and only leave during the night when they can go feeding in
safety in open areas (Walter et al. 2011).
In terms of feeding behavior, red deer is considered as an intermediate feeder
(Hofmann 1989) whereby they are able to be grazer with a mixed diet of grasses, whose
forage have a high fiber content, but also browser, feeding on herbaceous and shrub
foliage and trees (Bugalho et al. 2001; Gebert and Verheyden-Tixier 2001; Bugalho and
Milne 2003; Szemethy et al. 2003; Ruckstuhl and Neuhaus 2005; Dumont et al. 2005).
This depends on food availability (Hofmann 1989). The red deer has the capacity to
adapt their diet to seasonal changes in food quality and quantity, which leads to changes
in their diet composition (Dumont et al. 2005). In periods of reduced availability and
quality of food but with high energy requirements, red deer needs to resort to alternative
food such as agricultural species (Prokešová 2004; Putman and Staines 2004; Dumont
et al. 2005), fruits (Suter et al. 2004; Ferreira 2004; Putman and Staines 2004; Dumont
et al. 2005; Cortez 2010; Koda and Fujita 2011) but also browse on trees as a
complementary diet (Bugalho et al. 2001; Bugalho et al. 2005). This happens in
summer, when most of herbaceous species become senescent. This is a limiting period
in Mediterranean areas (dry and hot weather) which can leads to nutritional restrictions
(Alves 2013). Thus, red deer is an opportunistic species choosing the more digestible
and palatable foods according to environment availability (Hofmann 1989; Ferreira
2004; Dumont et al. 2005; Cortez 2010). In the study area (Lousã Mountain, Portugal)
shrubs are the main food resource of red deer throughout the year such as Erica sp.,
Pterospartum tridentatum, Ulex sp., Rubus sp. (Alves 2013). Nonetheless, red deer can
also look for Gramineae species and arboreous species, such as Quercus sp., Castanea
sativa and Pinus pinaster (Alves 2013; Garcia 2016). This herbivore prefer leaves and
sprouts of trees (Prokešová 2004; Dumont et al. 2005; Lovari et al. 2008; Bugalho et al.
2001; Koda and Fujita 2011), leafy young branches of shrub and arboreous species
(Suter et al. 2004; Szemethy et al. 2003) as well aerial parts of herbaceous plants and
grasses (Milne et al. 1978; Suter et al. 2004; Szemethy et al. 2003; Prokešová 2004;
Dumont et al. 2005; Cortez 2010). However, depending on phenology and availability
of plants, this ungulate eat different structures of plants (roots, stems, leaves, flowers,
fruits, sprouts and seeds), depending on the time of the year (Garcia 2016).
Also, the nutritional requirements change between seasons because the
reproductive cycle is synchronized, so this species, as well others ungulates, presents a
partial migration (Qviller et al. 2013) to choose the best locals to minimize energetic
losses and maximize gains. This partial migration includes altitudinal movements
throughout the year according to food quality and availability (Clutton-Brock et al.
1982). Aiming to found food of high quality, this species in summer migrates to high
altitudes (Bonenfant et al. 2004; Qviller et al. 2013) especially in locals with snow melt.

10
1.2.2 Roe deer Capreolus capreolus - Ecology and behavior
The roe deer (Capreolus capreolus, Linnaeus, 1758) also belongs to the family
Cervidae and to the order Cetardiodactyla, according to the classification adopted by
IUCN (Lovari et al. 2016). This species are considered the cervid with higher amplitude
in terms of geographical range (Aragon et al. 1998) and the most abundance of Europe
(Apollonio et al. 2010). It's a forest species that occupies a high variety of habitats,
occurring in the majority of the European landscapes (Apollonio et al. 2010; González
et al. 2013), with the exception of Ireland, Cyprus, Corsica, Sardinia and the majority of
small islands (Fig.3) (Lovari et al. 2016). Besides Europe, occurs in Turkey, northern
Syria, northern Iraq, northern Iran and in Caucasus (Wilson and Reeder 2005).
However, along the Black Sea coast and in region of Aegean Sea in northern of Turkey,
the Mediterranean sub-populations are close to the extinction (Lovari et al. 2016).
Fig 3: Distribution of roe deer populations in Europe (adapted from ©Societas Europaea
Mammalogica 2018).
In Portugal in last four decades their distribution as well as their density has
increased (Vingada et al. 2010) and this trend is not only present in our country (Lovari
et al. 2016). This trend resulted from the change in soil use practices and from partial
replacement of agricultural lands by forests, which led to a renaturation of habitats with
a consequent increase of landscape domain, in terms of surface area, from 66% in 1960
to 75% currently (Beilin et al. 2014). The increase of these ungulates was also due to
reintroduction programs and to the increase of accuracy in hunting legislation and
management policies (Torres et al. 2015).

11
Fig 4: Distribution of roe deer populations in Portugal (adapted from (Salazar 2009))
The populations of roe deer in Portugal (Fig.4) occur in the northern of the
country, like in Gerês, Marão, Montesinho and Nogueira Mountains (Salazar 2009). In
the center of Portugal, the roe deer is present in Lousã Mountain (Salazar 2009). Even
in center of the country but more close to the radius, their existence derive from the
movement of roe deer originating from the Spain (Salazar 2009). In addition, their
presence also occurs in south of the country as the result of introductions mainly in
privates enclosures (Salazar 2009).
The roe deer have a great adaptability and behavioral flexibility that is reflected
in high success of this species, since they can use a wide range of habitats (Linnell et al.
1998): deciduous, mixed or coniferous forests, Mediterranean forests, moorland,
pastures, arable land, suburban areas with large gardens as well as high latitudes and
altitudes (Jepsen and Topping 2004; Lovari et al. 2016). The forests that are used by roe
deer essentially have Rubus spp., Gramineae, Erica spp. and Ulex spp. (Mancinelli et al.
2015). However, preferred landscapes include a mosaic of woodland and farmland
(Stubbe 1999), and they are also well adapted to modern agricultural landscapes
(Andersen et al. 1998; Danilkin 1996; Sempéré et al. 1996). In fact, the human
modifications have been reported to be beneficial for this cervid in regions with low
snow cover, such as the cutting of trees, formation of croplands and meadows, as well
as intensive agriculture (Sempéré et al. 1996). Even so, roe deer can survive in semi-
desert environments and seasonally above the tree line (Lovari et al. 2016). Thus, roe
deer uses woodlands but also agricultural lands.
Although being a generalist species with a large fundamental niche, roe deer is
favored by heterogeneous or mixed habitats, which concurrently promote cover through

12
the tree canopy against predators and humans, as well as high quality of food resources
(Cederlund et al. 1998; Duncan et al. 1998; Mysterud and Ostbye 1999; Said and
Servanty 2005; Saïd et al. 2005). In contrast to red deer, roe deer is favored by habitats
with big covers and, contrarily, is favored by habitats with small herb layer, dominated
by brambles (Prokešová et al. 2006). Nonetheless, the roe deer also uses high-grass
meadows with some shrubs (Sempéré et al. 1996). Thus, the two main habitat requisites
for the roe deer are food (Duncan et al. 1998a) and cover (Cederlund et al. 1998). Using
big covers, this species gets simultaneously protection as well as the decrease of thermal
stress during the summer, which leads to energy saving (Mysterud 1996). Consequently,
roe deer opt for use more habitats with big covers and small herb layer.
Thus, this species has adapted to a high variety of habitats and environments and
it's known that these factors influence the social structure and spatial behavior of their
populations (Hewison et al. 1998). In fact, in mountainous habitats mainly in winter, the
roe deer spatial behavior changes in function of food availability and snow cover
(Cederlund 1983; Mysterud 1999; Lamberti et al. 2001; 2004). Alternatively, in
agricultural landscapes their social and spatial behavior changes in function of human
activity and woodland fragmentation (Lamberti et al. 2006). So, the strong link to
woodlands is the key factor that stays constant in all populations, therefore implying
that high fragmentation and low mean patch sizes of woodlands lead to a larger group
and home-range size (Lovari and San José 1997; Hewison et al. 2001; Cargnelutti et al.
2002).
This ungulate shows a polyphasic activity with alternative stages of feeding and
rest. Thus, the home-range fidelity between night and day is higher in the case of roe
deer than red deer, because the roe deer have in the same place food and cover. This
means that the size of night home-range is not different from size of day home-range for
roe deer (Richard et al. 2014).
Anciaux et al. (1991) suggested that the presence of red deer influences the
habitat use by roe deer since roe deer are territorial and many times solitary
(Dzięciołowski 1979), and they can be intimidated by red deer since red deer gather in
herds and in absence of natural predators their densities are artificially high (Latham
1999).
In terms of feeding behavior, this species is considered a browser (Clauss et al.
2003) and a selective feeder, so they feed selectively and preferably on the most
digestible plant material (low fiber content) (Hofmann 1989) that is rich in energy and
have high moisture content (Cornelis et al. 1999; Danilkin 1996; Sempéré et al. 1996;
Tixier and Duncan 1996), such as tree leaves, seedlings and forbs (Latham 1999). They
need a regular food intake (Dupke et al. 2017) because their stomach is small and have a
rapid digestion process (Hofmann 1989). As a consequence, this ungulate usually has
between five and eleven separate feeding periods in a day, feeding at hour intervals
during periods of optimal availability of food (Cornelis et al. 1999; Danilkin 1996;
Sempéré et al. 1996). The types of plants and individual species that are consumed by

13
roe deer vary according to seasons and habitats (Cornelis et al. 1999; Danilkin 1996;
Sempéré et al. 1996). 1,000 is the estimated number of plants species that are consume
by roe deer, of these species the percentage of breakdown of plant type is 25% for
woody plants, 54% for herbaceous dicotyledons and 16% for monocotyledons (Cornelis
et al. 1999; Danilkin 1996; Sempéré et al. 1996).
In addition, in winter, when there are less availability of other food sources, roe
deer can eat the needles of coniferous trees (Cornelis et al. 1999; Danilkin 1996;
Sempéré et al. 1996). Nonetheless, in various parts of Europe, the brambles are an
important resource for roe deer in winter (Siuda et al. 1969; Hearney and Jennings
1983; Homolka 1991; Tixier and Duncan 1996) because of their high nutritional value
(Prokešová et al. 2006). In this way, the diet of roe deer becomes less varied in winter,
as the forage reserves reduce which leads to a decline of metabolic rate and food intake.
On other hand, in spring this metabolic rate and food intake increases since the energy
requirements and digestion process also increases. In autumn, this cervid opt for
concentrate food resources, eating seeds and fruits (Cornelis et al. 1999; Danilkin 1996;
Sempéré et al. 1996).
1.3 Study area
1.3.1 Location, climate and topography
The Lousã Mountain (40°3′ N, 8°15′ W) is the study area and is located in the
centre of Portugal whose area is around 170 (Alves 2013). The climate is
Mediterranean, with hot and dry summers and rainy winters practically without snow
(Archibold 1995). The annual temperatures range from -4.1°C to 35.9°C and the annual
mean temperature is 12°C. The annual precipitation is approximately 827mm but can
reach 1600mm for the highest elevations. However, the patterns of temperature and
precipitation fluctuate because of the mountain topography as a consequence of slope,
altitude and landscape, which lead to climatic differences inside the mountain (Alves
2013). In relation to topography, the terrains are hilly with deep valleys and marked
hilltops. Although the majority of elevations have an altitude that range from 700m to
1000m, this can range from 100m to 1205m. Due to drainage basins of the Mondego
and Tejo rivers, the study area has a large hydrologic network (Alves 2013). The road
network have more than 500km but have a low traffic level, although in the beginning
and in the end of the day (with accentuated traffic) the area is much more disturbed
(Alves 2013).
1.3.2 Land cover and flora
Regarding to land cover, the Lousã Mountain is characterized by coniferous and
broadleaf tree plantations, constituting the mixed habitats, but also with large areas of

14
shrublands. The coniferous forests are composed by species of pine trees, as Pinus
pinaster, Pinus sylvestris and Pinus nigra but also by Douglas fir (Pseudotsuga
menziesii) and Mexican cypress (Cupressus lusitanica). These coniferous forests have a
sparse understory with shrub species, such as Rubus spp. (brambles), Erica spp. and
Calluna vulgaris (L.) Hull (heathers) but also with Ulex spp. (gorses). The broadleaf
trees are composed by Quercus sp. (oak), Castanea sativa Miller (Chestnut), Prunus
lusitanica (Portugal laurel) and Ilex aquifolium (common holly). However, these areas
are less common and are located close to the water courses, whose understory is also
sparse mainly with brambles. In shrublands, the most common and abundant species
are: Erica spp.; Calluna vulgaris; Ulex minor; Rubus ulmifolius; Pterospartum
tridentatum (L.) (“carqueja”); the brooms Genista triacanthos and Cytisus striatus and
various Gramineae species, such as Agrostis spp. and Festuca spp.. Mainly in these
areas during springtime occurs a boom of herbaceous species. However, no significant
changes occur between seasons in the land cover units constituted by evergreen species.
Forb species are also present in Lousã Mountain and they are diverse, although
less abundant. Anarrhinum bellidifolium, Carduus tenuiflorus, Crepis vesicaria,
Digitalis purpurea, Juncus effusus, Lepidophorum repandum, Lepidophorum officinale,
Tuberaria lignosa and Genista triacanthos are some examples of these (Alves 2013;
Alves et al. 2014; Garcia 2016).
In some lowest elevations, outside the mountainous region, the plantations of
eucalyptus trees are common, especially of Eucalyptus globulus Labill., alone or mixed
with maritime pine (Pinus pinaster). In addition, the abundance of exotic species
(Acacia melanoxylon and Acacia dealbata) increased during recent years (Alves 2013).
The land cover outside the mountain region has a greater human presence with
small villages and with an accentuated traffic level, where the mortality of deer caused
by the collision with a motor vehicle is more likely. In these areas, the agricultural
lands, close to urbanized areas, are an important stratum. In these small patches is
common to find several crops that are possible to divide into two principal groups:
Irrigated annual crops and non-irrigated crops. As example of the first group of crops
are the potatoes, several vegetables (e.g. Brassica sp.) and maize. The rye, wheat and
oats represent the non-irrigated crops, frequently associated with olives and fruit trees.
Here, the conflicts between humans and deer become more accentuated (Alves 2013).
Due to variety and great richness of fauna and flora, the Lousã Mountain was
inserted in the National List of Natura 2000 sites and it is classified as a Natura 2000
Site, due to the presence of reliquial ecosystems (Alves 2013).
1.3.3 Red and roe deer presence
The presence of red and roe deer in Lousã Mountain is the result of
reintroduction programs (Salazar 2009). In case of red deer, the reintroduction began in

15
March 1995 with the reintroduction of four males and three females from Tapada de
Vila Viçosa and Herdade da Contenda (Barrancos) (Vingada et al. 1997). The animals
were released in the central part of the mountain and no adaptation paddocks were used
(Salazar 2009). This reintroduction continued until 1999, originating a total of 96
individuals (32 males and 64 females) released (Alves 2013).
In case of roe deer, the reintroduction began in February 1994 when three
individuals were reintroduced: one male, female and calf from Nogueira Mountain
paddock (Bragança) (Jesus 2002). This reintroduction was possible because in
November of the previous year was finished the construction of a paddock, for
acclimatization of the roe deer, with about 20 hectares in northern slope of Lousã
Mountain (Salazar 2009). From here, several reintroductions followed until 1997,
resulting in a total of 54 roe deer reintroduced (including young and adult females and
young and adult males) that was released in zone of Social Hunting of Lousã Mountain
(Salazar 2009), currently known as National Hunting Area of the Lousã Mountain.
Consequently, these populations began to occupy new territories, increasing in
distribution area and number. Currently the red deer populations occupy an estimated
area of about 435 including not only the Lousã Mountain (170 ) but also the
surrounding areas. Nevertheless, the central area of Lousã Mountain (120 ) is the
most important local for activities of red deer. The density in the period between 2005
and 2009 was estimated at 5.6 red deer/ (Alves 2013). Regarding to roe deer, in an
area of 14.88 in the Lousã Mountain was reported an increase from about 32
animals in 2004 to about 44 animals in 2005 (Carvalho 2007). The mean density in
2004 was 2.2 individuals/ and in 2005 was 3.0 individuals/ (Carvalho 2007).
In the study area, the occurrence of domestic ungulates is restricted to known
areas, and the wild ungulates show noticeable differences, being thus possible to
distinguish their pellets. In addition, their natural predators are inexistent, but the stray
dogs assume this role by attacking mainly young, sub-adults and adult females. The
populations of red and roe deer live in sympatry with wild boar (Sus scrofa) (Alves
2013).
1.4 Aims
After the reintroduction plan of red and roe deer and their consequent demographic
and geographic expansion, it‟s important to assess if red and roe deer are in fact two
sympatric species, and are using the same ecological niche, or if they are using different
ecological resources. This allows to understand if the coexistence of both species poses
a threats to each other, or if one species is affected by the presence of the other and to
what extent, resulting in interspecific competition. If the species uses different
ecological resources is expected that they coexist, but if they use the same ecological
resources is expected that the species will compete. Thus, to evaluate the ecological

16
resources used by each species when they occur sympatrically, it‟s necessary to study
the habitat use as well as the feeding behavior of both species.
According to body dimorphism (Richard et al. 2011) and traits of life stories (Peters
and Wassenberg 1983), it is expected that red and roe deer use the habitat differentially
since they are markedly different in body size, behavior, morphology, having thus large
differences in energy requirements (McNab 1963). Furthermore, it is also expected that
red and roe deer have more differences in diet composition than in diet diversity since
both species have the capacity to feed on a large number of different plant species.
However, it is expected that the proportion of each of these plant species in red and roe
deer diet to be different, given the differences in red and roe deer feeding strategies. In
this way is expected that red and roe deer do not compete for space and food, allowing
their coexistence in Lousã Mountain, since is expected that they use different ecological
resources (in terms of habitat and food).

17
Chapter II – Red and roe deer in the Lousã Mountain: Are
they using the same ecological resources?

18
2.1 Introduction
One of the principles in ecology is to understand how animals react to the nature
(Manly et al. 2002). These responses, in turn, allow knowing the ecological resources
needed, how and when they are used (Alves et al. 2014). For this it‟s necessary to study
habitat use as well as the feeding behavior of red and roe deer since the ecological
resources may be described as food and cover (Borkowski 2004; Manly et al. 2002).
Thus, the study of comparative use of resources (habitat and diet) is important because
allow identifying the interspecific interactions as well as their mode of operation
(Latham 1999). The analysis of interactions between feeding strategies of red deer
(intermediate feeder) and roe deer (concentrate feeder) it‟s important because indicate
the probably direction of competition between these species. Nonetheless, it‟s crucial to
take into consideration the densities in which these interactions start to operate (Latham
1999).
The interactions between species shape their communities (Gause 1934; Hutchinson
1959). These interactions can be competitive, when species of same trophic level (e.g.
red and roe deer) uses the same resources which availability is limited (De Boer and
Prins 1990), and where one of the species reduce the shared resources below the level
that can be efficiently used by the other (Illius and Gordon 1987; Murray and Illius
1996; Prins and Olff 1998). Such competition may be avoided by coevolved species,
through resources partitioning, but the overlap in the resources used can still occur
(Hutchinson 1959; MacArthur 1972; Pianka 1973; Schoener 1974). Various factors can
enhance the competition such as the spatiotemporal variation in resources availability,
habitat modifications caused by man, patterns of resources availability or even the
composition of animal communities (Arsenault and Owen-Smith 2002; Gurnell et al.
2004; Robertson et al. 2013).
Nonetheless, when overlap in the use of resources by individual animals occurs does
not inevitably imply competition. It depends on the extent to which these resources limit
the abundance of the populations (Wiens 1989; Putman 1996). That is why it is
important take into consideration the evaluation of niche breath as well as the niche
overlap to quantify the comparative use of resources as well as to obtain findings about
interspecific interactions (Latham 1999).
The way how animals use their resources essentially depends on the way how they
handle with potential competitors (Namgail et al. 2009; Razgour et al. 2011; Vanak et
al. 2013). In fact, if species compete they influence the way how each one use the
resources (Latham 1999). For instance, an ungulate that have an intermediate feeding
strategy can feed on higher range of food resources than an ungulate that have
concentrate feeding strategy. In this case, the first ungulate have advantage over the
second because it is competitively superior (Latham 1999). Just as Latham et al. (in

19
press) suggested this for Scottish red and roe deer, this may occur in our study area for
the study species. Is important to study this because the competition can affect the
individuals of inferior competitor capacity (in this case the roe deer) in terms of their
behavior and/or their growth/survival (Durant 1998; Harris and Siefferman 2014),
leading to effects on population at local and global scales (Bertolino 2008; Hamel et al.
2013) and consequently on communities (Levi and Wilmers 2012; Robertson et al.
2013). In addition, there is a suspicion that interspecific competition between wild
herbivores can affect the resources used, population trends and/or species distribution,
in temperate and savannahs ecosystems (Sinclair and Norton-Griffiths 1982; Putman
1996; Latham 1999; Murray and Illius 2000; Arsenault and Owen-Smith 2002; Focardi
et al. 2006; Namgail et al. 2009). In this way the behavioral interactions between
ungulates are important because are these interspecific interactions that causes
alterations in behavior and consequently in populations, leading one species to use other
foraging ground because their preferred has been impoverished by a competitor
(Latham 1999).
Interspecific interactions may be particularly important between reintroduced
species (Lovari et al. 2014), which need to adapt to new environments, as is the case of
red and roe deer in the Lousã Mountain. However, the competition mechanisms
resultant of these reintroductions have never been studied. The need to study the
interspecific interactions between roe and red deer in Portugal was recently highlighted
by Torres et al. (2015). Furthermore, Anciaux et al. (1991) suggested that the presence
of red deer influences the use of habitat by roe deer because this last species is territorial
and many times solitary (Dzięciołowski 1979). Moreover, roe deer may be intimidated
by red deer because this species come together in herds and many times in artificially
high densities when natural predators are absent (Latham 1999). In addition, there are
studies that prove that reintroduction of Cervus elaphus in Italy can affect the quality
and quantity of food available to Apennine chamois (Rupicapra pyrenaica ornata)
having negative effects in dynamic of its populations (Ferretti et al. 2015). Contrarily,
Bartos et al. (2002) verified that the four sympatric species of cervids in Czech
Republic, including the Cervus elaphus and the Capreolus capreolus, do not compete
with each other.
In relation to wild ungulates, it has been suggested that the competition occurs
between pairs of species in which at least one of them is alien (Putman 1996; Forsyth
and Hickling 1998; Focardi et al. 2006; Ferretti et al. 2011; Ferretti and Lovari 2014).
This happen because the species not had time to develop strategies that allowed them to
coexist. The red and the roe deer lived in Lousã Mountain for over 200 years until their
extinction. So, when red and roe deer were reintroduced in 1995/1996, the dispersion of
resources as well as the availability of resources for both species was partially modified
by man in comparison to those present when species coevolved (Ferretti et al. 2015). In
turn, the majority of those changes in landscape promoted by anthropogenic pressures

20
can lead to the junction of the roe deer in the feeding areas of red deer, limiting the
availability of food for roe deer (Lovari et al. 2014; Ferretti et al. 2015).
As so, it‟s necessary to evaluate which are the consequences of interspecific interactions
in restored communities in ecosystems modified by man. This can have negative effects
to the conservation of both species (Lovari et al. 2014) since that coevolved species can
compete relatively to the level of modification of native biological diversity (Ferretti et
al. 2015). However, the competition is decreased through the morphophysiological
differences between species which will lead to differences in energetic requirements and
consequently to different preferences in relation to habitat use (Richard et al. 2014) as
well as feeding behavior (Bell 1970; Jarman 1974; Demment and Van Soest 1985;
Owen-Smith 1985; Illius and Gordon 1987; Owen-Smith 1989; Prins and Olff 1998).
Although the interspecific competition is more likely to occur during dormant season
(in this case in dry season - summer), because the availability of food of high quality is
lower, this can be minimized due to facilitation phenomena. For instance, the biggest
species can beneficiate the smaller species through their grazing during the season of
vegetation growth, improving the forage quality as well as facilitate the access to the
resources through the removal of occlusive structures of grass. This can improve the
reproductive success. Contrarily, it can led to a reduction of food quantity available for
the populations during the dormant season, which can lead to the increase of mortality
(Arsenault and Owen-Smith 2002).
Thus, the consequences at the population level cannot be seen only in a specific
season of the year. These consequences will be dependent on trade-offs between
competition and facilitation, highlighting the importance of the study being performed
seasonally, since what is verified in one season may not be what happen in next season.
Although competition and facilitation may have consequences in grazing efficiency in
short-time, their effects in population dynamic can be masked through seasonal trade-
offs and spatial location. The result will depend on what happen during annual cycle.
However, the facilitation, namely of feeding during growing season, can promote the
coexistence of herbivores species through the improvement of the exploitation
competition that occur during dormant season (Arsenault and Owen-Smith 2002).
Since that roe deer is increasing their range through the Europe as well the situations in
which they occur in sympatry with red deer (Gill 1990), it‟s crucial to study the
interspecific interactions between these species since there is evidences that roe deer is
susceptible to compete with other ungulate species, being displaced or out-competed,
evidencing the priority of this study (Latham 1999). There are other studies that
evaluate the habitat use (e.g. Prokešová et al. 2006; Borkowski and Ukalska 2008;
Borkowski 2004; San José et al. 1997; Heurich et al. 2015) and the feeding behavior
(e.g. Latham 1999) of both species but not in same context. Thus, this study of both
habitat use and feeding behavior is crucial to the management and the conservation of

21
both species. The results are expected to evidence to what extent both species are using
the same ecological resources and what consequences may occur as consequence. As so,
the main goal of this study is to evaluate the ecological resources seasonally used by red
and roe deer. Based on fecal pellet group counts through line transects with distance
sampling we expect to identify the patterns of habitat use by each species. Furthermore,
using the microhistological technique we expect to identify the species of plants that
were consumed by red and roe deer.
Based on red deer habitat preferences evidenced in previous studies (Koubek and
Zima 1999; Prokešová et al. 2006; Alves et al. 2014), it is expected that red deer
preferably use shrublands and areas with high plant heterogeneity with big and diverse
herb layer, representing areas with high food availability, like shrublands. However, due
to the hunting pressure to which red deer is exposed in the study area, is expected that
red deer tends to avoid settlements. In this way, is expected that the red deer diet is
mainly constituted by shrub species but also by herbaceous and arboreous species, given
that red deer is considered an intermediate feeder (Hofmann 1989; Ferreira 2004;
Dumont et al. 2005; Cortez 2010).
Regarding to roe deer habitat preferences, it is expected that it positively uses forests
whose herb layer is dominated by brambles, but also agricultural areas given their
adaptability to agricultural landscapes (Andersen et al. 1998; Danilkin 1996; Sempéré et
al. 1996). Based on their feeding strategy, it is expected that roe deer feed selectively
and preferably on leaves and sprouts of dicotyledon species, since these species have
low fiber content, but also on brambles given their nutritional value (Prokešová et al.
2006) and high abundance in the habitats used by roe deer. Since it is assumed that
browsers are obligatorily non-grazers (Wieren 1996; Clauss et al. 2003), avoiding
grasses with high fiber contents in comparison to grazers, preference by plants with less
fiber content (forbs and leaves of trees and shrubs) (Storms et al. 2008) is also expected.
Furthermore, it is also expected that in periods with low food resources available,
each species will become less selective. This is based on the optimal foraging theory, in
which in periods with low availability of food the animals become less selective
(Schoener 1971; Owen-Smith and Novellie 1982). Since it‟s know that in growing
season the plants have lower fiber contents that increases in lean season (summer, in
this case) (González-Hernández and Silva-Pando 1999) because plants become
senescent. Consequently, it‟s expected that the diets of both red and roe deer present
higher proportions of fibrous forage in summer because is this season that the quality
and availability of food is lower (Dzieciolowski 1969; Bobek 1977).

22
2.2 Materials and methods
2.2.1 Study area and study species
The study took place in Lousã Mountain (40° 3‟N, 8° 15‟W) which presents a
Mediterranean climate (Archibold 1995). Is mainly constituted by mixed forests but
also by large areas of shrublands (Alves 2013; Alves et al. 2014). Outside the mountain
region has a greater human presence with small villages and agricultural areas (Alves
2013). The presence of red deer (Cervus elaphus, Linnaeus, 1758) and roe deer
(Capreolus capreolus, Linnaeus, 1758) in the study area is the result of reintroduction
programs (Salazar 2009).
Besides the studied species, red and roe deer, wild boar is also present in the study
area. In terms of predation, no natural predators are present, so both species are mainly
preyed by feral dogs and foxes. Another important stressor is the anthropogenic
pressure, mainly related to game hunting to which both species are exposed (Alves
2013).
2.2.2 Field methods
To study the habitat use of red and roe deer, fecal pellet counts through line
transects with distance sampling were done. This method has been adapted from Mayle
et al. (1999) and Marques et al. (2001). The term “distance sampling” is based on the
fact that is necessary to register all perpendicular distances from the center of
excrements until to the center of transect line (Mayle et al. 1999). For this, the study
area (3500 ha) was divided into 35 quadrants which contained 70 transects each with
100 meters. The transects were randomly marked in the study area, to avoid a relation
between the line transect and the cervids distribution across the study areas (avoiding
the occurrence of attraction or avoidance to the line) (Mayle et al. 1999). The study area
was centered in the municipal hunting area of Vila Nova, Miranda do Corvo (Fig.5).

23
Fig 5: Map of the study area with the line transects of fecal pellet counts.
The study was performed seasonally starting in November 2016 until December
2017. A GPS (hTC with ArcPad) with the region map was used to reach to the tip of
each transect that indicated, apart from the location, their direction through the
indication of the angle that has been introduced in compass. 70 transects with 100
meters in length and a maximum width of 5 meters were done. Transects has been
delimited with a tape measure. In each transect one person walked close to the line, i.e.
in center of transect, and the other person walked in zigzag, distancing itself a maximum
of five meters from center of the transect for both sides of tape. Along the transects, all
feces found were registered together with the identification of transect, species,
perpendicular distance to the line transect, linear distance from the starting point, age-
class of excrements (i.e. fresh, old or very old) and size (number of pellets).
With line transects with distance sampling it was intended to understand the
influence of several habitat variables on the habitat used by red and roe deer in the
Lousã Mountain, considering the combination between topographic variables and land
cover. These variables were land cover, proximity to areas more urbanized (artificial
surfaces), proximity to agricultural areas, presence of water bodies and altitude. The
inclusion of the variables proximity to areas more urbanized, proximity to agricultural
areas and presence of water bodies it's based on the possibility that those variables
influence the red and roe deer distribution as well as the availability of resources and
their safety (Alves et al. 2014). In case of the variable altitude this was also considered
because have influence on land cover, so affecting the growth of plants consumed by
red and roe deer (Stage and Salas 2007).
Regarding land cover, despite the stratification performed using QGIS, the
habitat characterization along the transects was also made in the field, together with the
collection of the other environmental variables previously defined. Thus, the study area

24
was divided into six different land cover units, being them shrublands, coniferous
forests, broadleaf forests, mixed forests, eucalyptus forests and agricultural areas, which
may be subdivided into open areas (feeding) and closed areas (protection) (Alves et al.
2014).
2.2.3 Feces collection and microhistological analysis
To obtain the epidermis of plants that were consumed by red and roe deer, the feces
of both species were collected simultaneously to the realization of the line transects.
Each fecal sample was constituted just by the fresh pellets.. Then, each fecal pellet
group was stored in a plastic bag properly labeled. The fecal samples were frozen in
laboratory at -20°C. This fecal material collection and subsequent analysis will allow to
determine the diet of each deer species.
The microhistological technique applied to the analysis of diet composition of red
and roe deer was done following the technique described by Sparks and Malechek
(1968). In this way, after defrost fecal samples five pellets were selected and to these
400ml of water was added and putted into an electrical blender, for mixing by applying
three pulses of ten seconds each (Sanders et al. 1980; Vavra and Holechek 1980;
Holechek and Vavra 1981; de Jong et al. 1995; Maia et al. 2003; Szemethy et al. 2003).
This automatic maceration allow epidermis to easily separate itself from the other
tissues, and makes the fragments as homogeneous as possible in terms of size and their
distribution in the prepared mixture (Maia et al. 2003). After, the mixture was washed
through a sieve with a 0.075mm of mesh, to discard all the fragments smaller and
residuals, since the minimal dimension of epidermis that allow their identification is
1 (Maia et al. 2003).
Afterwards, the prepared was putted in a Petri dish with sodium hypochlorite to
facilitate the observation and identification of epidermis, since this chemical compound
help to lighten the epidermis (Butet 1985; Maia et al. 2003). In order to obtain random
microscope slides, the Petri dish was placed on a matrix duly identified with numbers
and letters and with a pipette the mixture sample was selected through a random
algorithm (de Jong et al. 1995; Maia et al. 2003; Garcia 2016). Hereinafter, 20
microscopic slides were prepared for each sample, identifying ten fragments in each,
originating a total of 200 plants fragments per sample (Garcia 2016). To avoid duplicate
fragments, the slides were observed from one side to the other along the microscopic
slide through alternate and systematic transects (de Jong et al. 1995; Maia et al. 2003;
Shrestha and Wegge 2006). The observations as well as the photographs of plants
fragments were made using an amplification of 100x and 400x using the Optika Vision
Pro program.
Finally, the identification of epidermic fragments of plants preserved in fecal
samples was made through comparison with the reference collection of epidermis and
using a dichotomous key, both elaborated by Garcia (2016). Currently this collection

25
has 50 species of plants, including arboreous, shrub and herbaceous species
(dicotyledons and monocotyledons) (Garcia 2016).
The plant‟s epidermis are constituted by common epidermic cells and by specialized
epidermic cells, such as stomata and trichomes (Ferri 1999; Erickson et al. 2003; Toral
et al. 2010; Oliveira 2013). These cells can varied in form, number, size, organization,
presence/absence and position in different structures of plants as well as in different
plant species (Sparks and Malechek 1968; Sanders et al. 1980; Holechek and Gross
1982; Fahn 1990; Butet 1985; Giuletti et al. 1992; Adulyanukosol and Poovachiranon
2003; Erickson et al. 2003; Barclay et al. 2007; Ahmed and Chandan 2015). Thus, and
by comparison with the reference collection, the different plant structures consumed by
red and roe deer were identified. Several characteristics were taken into account to
enable the identification like the form of common epidermic cells (e.g. rectangular,
polygonal and in puzzle); presence/absence, position and type of stomata (e.g.
anomocytic and paracytic) and the presence/absence, size and form of trichomes (e.g.
tector and starry trichomes). Both stomata and trichomes, when present, are
indispensable to identify the epidermic fragments (Garcia 2016).
Based on the use of these individual and morphologic characteristics of epidermis as
discriminating characteristics, it‟s possible to use the reference collection of epidermis
and the dichotomous key to identify the epidermic fragments preserved in fecal samples
(Garcia 2016).
Only fragments of plants with appropriate dimensions (equal or higher than four
cells) and with sufficient discriminating characteristics were considered (Bauer et al.
2005; Oliveira 2013). The epidermic fragments identified were classified according to
the structure of plant (leaf, stem, sprout, flower or fruit) and according to the plant
group, i.e. in arboreous species, shrubs, herbaceous (dicotyledons and monocotyledons)
and agricultural species. This allow to determinate the importance that each plant group
and structure have in the diet of these deer species.
2.2.4 Data analysis
Regarding the habitat used by both species, a spatial representation of the number of
pellets count in each quadrant of the study area was performed. Beside the pellets
counts, the maps present the different habitat types of the study area: forests,
shrublands, sparse vegetation areas, agricultural areas, water bodies and artificial
surfaces, that correspond to the human settlements. Maps with the total number of
pellets of each species and the number of species per season were made for red and roe
deer. All maps were performed in QGIS 3.2.1 software.
Furthermore, the spatial overlap was evaluated using the symmetric niche overlap
coefficient. The Pianka‟s index (Pianka 1973) is given by:

26
∑
√∑ ∑
where = ∑ is the mean proportion of feces in quadrant of roe deer and
∑ is the mean proportion of feces in quadrant of red deer. The
Pianka‟s index varies between 0 (no spatial resources used in common) to 1 (complete
overlap of spatial resource use).
Regarding feeding behavior, and aiming to quantify the diet of both species, the
absolute frequency of occurrence (AF) and the relative frequency of occurrence (RF) of
each plant species consumed for each type (arboreous, shrub, herbaceous and
agricultural species), structure of plant (leaf, stem, sprout, flower and fruit), season and
species was calculated.
Those frequencies were calculated according to following formulas:
where is the number of epidermic fragments of the species , is the total number
of fragments of the sample, is the number of feceswith the epidermic fragments of
the species and is the total number of feces (Oliveira 2013; Garcia 2016).
To evaluate the differences between the diet composition of red and roe deer as
well as of the other relevant factors, such as the season, a multivariate analysis was
used. This approach was used because have the capacity to detect and represent the
adjacent structure of the data relating this same structure with the explanatory variables,
having the capacity to discriminate the different groups. The analysis was composed by
the PCA - Principal Component Analyses (ordination method) (Lepš and Šmilauer
2003), and by a permutation multivariate analysis of variance (PERMANOVA). These
statistical analyses were realized using Canoco 5 and Primer 6+PERMANOVA
software.
The diversity of plants species present in red and roe deer diet was evaluated
through the calculation of species richness (number of different species that are
present in the sample), Shannon-Weaver diversity index (predict the sample
diversity being the measure of the number of common species (Brewer and Williamson
1994)) (Shannon 2001; Spellerberg and Fedor 2003) and the Pielou‟s evenness index
(represent the uniformity of data) (Pielou 1966).
The Shannon-Weaver diversity index is given by:
∑

27
where being the number of epidermic fragments of species and the
total number of fragments of the sample.
The Pielou‟s evenness index is given by:
where .
Through the transformation of the Shannon-Weaver diversity index was
possible to interpret the food amplitude in order to represent the effective number
of species of plants, according to Jost (2006).
The statistical differences between red and roe deer in terms of richness,
evenness, diversity and food amplitude (dependent variables) along the several seasons
were analyzed using generalized linear models (GLM). Pairwise comparisons were
performed using the Boferroni correction. The statistical analyses were performed using
the program IBM.SPSS version 23. The statistical analyses were considered significant
when p < 0.05. The results are presented as estimated mean ± SE (standard error).
In addition, was evaluated the food overlap using the symmetric niche overlap
coefficient- Pianka‟s index (Pianka 1973). Is given by:
∑
√∑ ∑
where = ∑ is the mean proportion of food item of roe deer and
∑ is the mean proportion of food item of red deer. The Pianka‟s
index varies between 0 (no food resources used in common) to 1 (complete overlap of
food resource use).
2.3 Results
2.3.1 Habitat use
At a general level, our results showed that the red deer was present throughout the study
area, since pellet counts for each habitat type were recorded in all habitat types
considering all seasons (mixed forests=827 pellets, shrublands=626 pellets, coniferous
forests=115 pellets, agricultural areas=92 pellets and eucalyptus forests=14 pellets).
However, the higher densities of red deer feces were found in ecotone zones between
forests and shrublands that correspond to areas in higher altitudes, far from urbanized
areas (artificial surfaces) and agricultural lands (Fig. 6).

28
Fig 6: Map of the pellet counts of red deer in each quadrant of the study area throughout
the year.
Regarding each season, in winter (Fig. 7a) the presence of red deer was higher in
mixed forests (258 pellets) and in shrublands (166 pellets). The presence of red deer in
coniferous forests was low (46 pellets) but not as low as in agricultural areas (13 pellets)
and eucalyptus forest (1 pellets). As in the winter, in spring (Fig. 7b) the higher values
of red deer pellet counts were found in mixed forests (147 pellets) and shrublands (116
pellets), being lower in coniferous forests (25 pellets), agricultural areas (6 pellets) and
eucalyptus forests (3 pellets).
The pattern verified in previous seasons was also verified in summer (Fig. 7c),
where the presence of red deer was higher in mixed forests (187 pellets) and shrublands
(126 pellets). In contrast to winter and spring, in summer the values of pellet counts of
red deer were higher in agricultural areas (34 pellets) than in coniferous forests (19
pellets). The lower value continued to be found in eucalyptus forests (3 pellets). In
comparison with spring, in this season there was a significantly reduction of the density
of pellet counts of red deer in the transects close to the sparse vegetation areas (Fig. 7c).
Autumn was also similar to summer, with higher values in mixed forests (235 pellets)
followed by shrublands (218 pellets). As verified in summer, in autumn the presence of
red deer continued higher in agricultural areas (39 pellets) than in coniferous forests (25
pellets), and very low in eucalyptus forests (7 pellets). In this season, the density of
pellet counts of red deer in the transects close to the sparse vegetation areas increased
(Fig. 7d).

29
Fig 7: Map of the pellet counts of red deer in each quadrant of the study area in a)
winter, b) spring, c) summer and d) autumn.
The presence of roe deer, in opposition to the one of red deer, was higher in the
areas with lower altitudes, with a preference for forest areas close to the agricultural
lands (ecotone zones) and urbanized areas throughout the year (Fig. 8). Contrarily to red
deer, no roe deer feces were found in shrublands (Fig. 8). So, the pellet counts of roe
deer by each habitat type was 128 pellets in mixed forests; 106 pellets in agricultural
areas; 5 pellets in eucalyptus forests and 0 pellets in coniferous forests and shrublands.
Fig 8: Map of the pellet counts of roe deer in each quadrant of the study area throughout
the year.

30
In winter (Fig. 9a) the presence of roe deer was just verified in agricultural areas
(39 pellets) and in mixed forests (26 pellets). The winter was the only case in which the
presence of roe deer in agricultural areas was higher than in mixed forests. In spring
(Fig. 9b) the pattern of pellet counts of roe deer by each habitat type was similar to
winter, in which were just found pellets of roe deer in mixed forests (29 pellets) and in
agricultural areas (11 pellets). As in red deer in spring, the value of pellet counts of roe
deer in agricultural areas in spring reduced more than half in comparison with winter. In
summer (Fig. 9c), the presence of roe deer increased in agricultural areas (16 pellets)
and was similar to the presence of roe deer in mixed forests (18 pellets). Only in this
season were found roe deer feces in eucalyptus forests (5 pellets). The autumn (Fig. 9d),
in comparison with previous seasons, was the season with the highest values of pellet
counts of roe deer by each habitat type (mixed forests=55 pellets, agricultural areas=40
pellets), being this last value very similar to the value of pellet counts of roe deer found
in agricultural areas in winter (39 pellets).
Fig 9: Map of the pellet counts of roe deer in each quadrant of the study area in a)
winter, b) spring, c) summer and d) autumn.
Analyzing the results from the Pianka‟s index (Table 1), the spatial overlap of
resources used by red and roe deer was very low. Our results demonstrated that in
winter the spatial overlap between red and roe deer is the lowest, having started to
increase in the following seasons.

31
Table 1: Pianka‟s index representing spatial overlap between red and roe deer.
Pianka‟s index
Confidence
interval
Winter 0.066 0.007-0.125
Spring 0.147 0.088-0.206
Summer 0.221 0.162-0.280
Autumn 0.256 0.197-0.315
Global 0.211 0.152-0.270
2.3.2 Feeding behavior
The absolute and relative frequencies of occurrence were calculated for the red
deer (Table 2) and for roe deer (Table 3) by each season.
In case of red deer, in all seasons shrub species were the most consumed group
of plants (winter: 59.22%; spring: 72.92%; summer: 67.85%; autumn: 62.61%)
followed by the monocotyledons (winter: 19.21%; spring: 14.77%; summer: 12.91%;
autumn: 18.27%), arboreous (winter: 11.17%; spring: 7.39%; summer: 11.11%;
autumn: 10.39%) and dicotyledons species (winter: 7.06%; spring: 1.73%; summer:
5.20%; autumn: 7.14%). In all seasons, the most representative shrub species was
Pterospartum tridentatum with the exception of spring in which was Ulex minor
(28.26%). In the case of monocotyledons species, Arrhenatherum elatius was the most
representative species in all seasons, except in winter that was Festuca sp. (12.52%).
Regarding to arboreous species the most consumed species changed over the seasons: in
winter was Fraxinus sp. (3.41%), in spring was Castanea sativa (2.00%), in summer
was again Fraxinus sp. (2.97%) but also Quercus robur (2.95%) and in autumn was
Betula pubescens (3.08%). Finally, in the group of dicotyledons species, Athyrium filix-
femina was the most representative species in winter (3.51%) and summer (3.69%). In
spring was Trifolium sp. (1.01%) and in autumn was Lepidophorum repandum (4.32%).

32
Table 2: Diet composition of red deer (N=61) per season in terms of absolute frequency
of occurrence (AF) and relative frequency of occurrence (RF).
Red deer Winter Spring Summer Autumn
AF(%) RF(%) AF(%) RF(%) AF(%) RF(%) AF(%) RF(%)
Arboreous species 11.17 62.86 7.39 41.76 11.11 50.79 10.39 53.33
Acacia melanoxylon 2.54 73.33 1.63 53.85 0.99 33.33 2.05 66.67
Betula pubescens 0.89 80.00 0.18 30.77 0.19 22.22 3.08 60.00
Castanea sativa 0.60 53.33 2.00 46.15 2.57 77.78 0.91 60.00
Chamaecyparis
lawsoniana
0.67 66.67 0.41 30.77 1.12 55.56 0.90 53.33
Fraxinus sp. 3.41 73.33 1.70 46.15 2.97 66.67 1.27 66.67
Laurus nobilis 2.62 53.33 0.11 15.38 0.32 22.22 1.80 40.00
Quercus robur 0.44 40.00 1.36 69.23 2.95 77.78 0.38 26.67
Herbaceous species-
Dicots
7.06 40.00 1.73 36.54 5.20 41.67 7.14 46.67
Athyrium filix-femina 3.51 66.67 0.55 61.54 3.69 88.89 2.33 73.33
Lepidophorum repandum 2.89 33.33 0.00 0.00 0.19 11.11 4.32 53.33
Pteridium aquilinum 0.18 26.67 0.17 23.08 1.22 50.00 0.27 40.00
Trifolium sp. 0.48 33.33 1.01 61.54 0.10 16.67 0.22 20.00
Herbaceous species-
Monocots
19.21 70.67 14.77 81.54 12.91 54.44 18.27 72.00
Agrostis castellana 1.10 60.00 1.61 76.92 4.13 61.11 6.45 93.33
Arrhenatherum elatius 2.10 66.67 5.66 100.00 4.15 72.22 6.49 73.33
Dactylis glomerata 2.13 80.00 5.13 92.31 3.71 94.44 3.81 86.67
Festuca sp. 12.52 86.67 1.65 84.62 0.92 44.44 0.27 46.67
Graminae NI 1.36 60.00 0.72 53.85 0.00 0.00 1.25 60.00
Shrub species 59.22 77.04 72.92 68.38 67.85 75.93 62.61 80.74
Calluna vulgaris 5.83 86.67 0.14 23.08 2.08 66.67 3.10 73.33
Cytisus striatus 7.18 73.33 15.89 84.62 3.59 83.33 8.39 93.33
Erica arborea 4.79 86.67 6.67 92.31 4.34 83.33 4.99 86.67
Erica australis 8.12 93.33 1.42 69.23 9.87 83.33 4.31 86.67
Erica umbellata 3.59 73.33 1.27 84.62 1.68 83.33 2.60 80.00
Ilex aquifolium 2.24 66.67 0.04 7.69 0.13 22.22 0.62 53.33
Pterospartum tridentatum 17.60 60.00 13.91 92.31 25.33 88.89 23.21 93.33
Rubus ulmifolius 4.00 80.00 5.32 61.54 12.46 88.89 3.08 73.33
Ulex minor 5.87 73.33 28.26 100.00 8.37 83.33 12.31 86.67
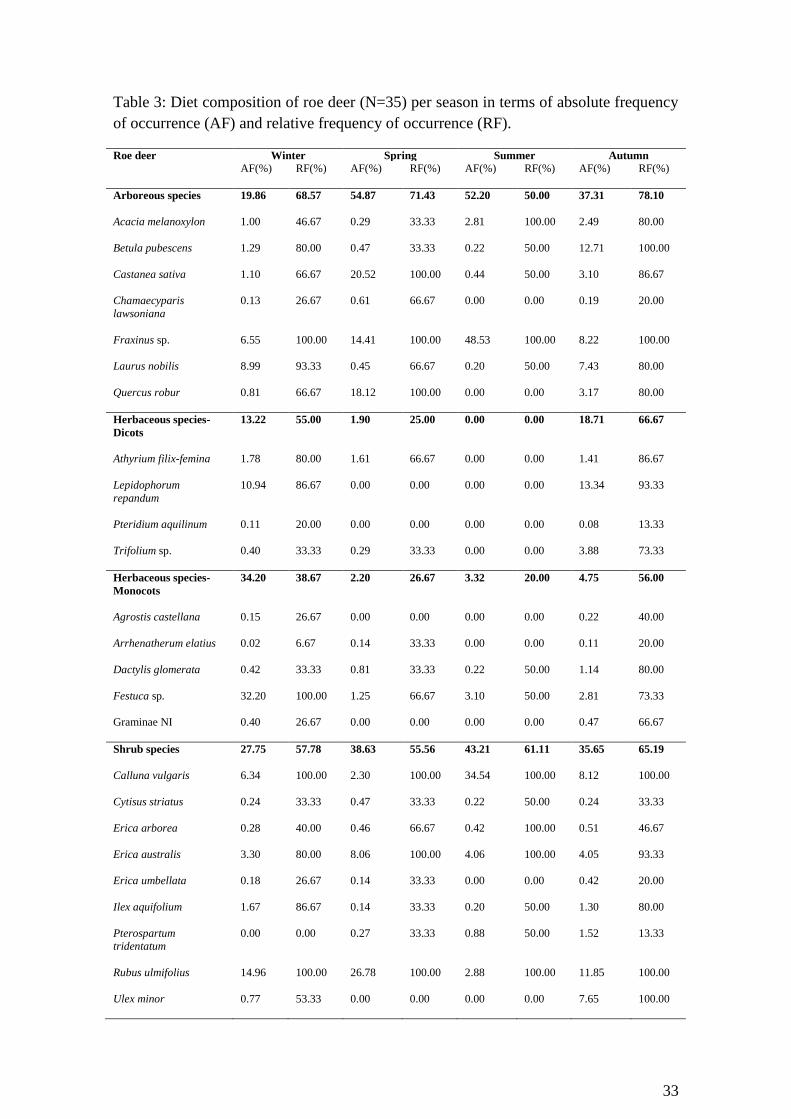
33
Table 3: Diet composition of roe deer (N=35) per season in terms of absolute frequency
of occurrence (AF) and relative frequency of occurrence (RF).
Roe deer Winter Spring Summer Autumn
AF(%) RF(%) AF(%) RF(%) AF(%) RF(%) AF(%) RF(%)
Arboreous species 19.86 68.57 54.87 71.43 52.20 50.00 37.31 78.10
Acacia melanoxylon 1.00 46.67 0.29 33.33 2.81 100.00 2.49 80.00
Betula pubescens 1.29 80.00 0.47 33.33 0.22 50.00 12.71 100.00
Castanea sativa 1.10 66.67 20.52 100.00 0.44 50.00 3.10 86.67
Chamaecyparis
lawsoniana
0.13 26.67 0.61 66.67 0.00 0.00 0.19 20.00
Fraxinus sp. 6.55 100.00 14.41 100.00 48.53 100.00 8.22 100.00
Laurus nobilis 8.99 93.33 0.45 66.67 0.20 50.00 7.43 80.00
Quercus robur 0.81 66.67 18.12 100.00 0.00 0.00 3.17 80.00
Herbaceous species-
Dicots
13.22 55.00 1.90 25.00 0.00 0.00 18.71 66.67
Athyrium filix-femina 1.78 80.00 1.61 66.67 0.00 0.00 1.41 86.67
Lepidophorum
repandum
10.94 86.67 0.00 0.00 0.00 0.00 13.34 93.33
Pteridium aquilinum 0.11 20.00 0.00 0.00 0.00 0.00 0.08 13.33
Trifolium sp. 0.40 33.33 0.29 33.33 0.00 0.00 3.88 73.33
Herbaceous species-
Monocots
34.20 38.67 2.20 26.67 3.32 20.00 4.75 56.00
Agrostis castellana 0.15 26.67 0.00 0.00 0.00 0.00 0.22 40.00
Arrhenatherum elatius 0.02 6.67 0.14 33.33 0.00 0.00 0.11 20.00
Dactylis glomerata 0.42 33.33 0.81 33.33 0.22 50.00 1.14 80.00
Festuca sp. 32.20 100.00 1.25 66.67 3.10 50.00 2.81 73.33
Graminae NI 0.40 26.67 0.00 0.00 0.00 0.00 0.47 66.67
Shrub species 27.75 57.78 38.63 55.56 43.21 61.11 35.65 65.19
Calluna vulgaris 6.34 100.00 2.30 100.00 34.54 100.00 8.12 100.00
Cytisus striatus 0.24 33.33 0.47 33.33 0.22 50.00 0.24 33.33
Erica arborea 0.28 40.00 0.46 66.67 0.42 100.00 0.51 46.67
Erica australis 3.30 80.00 8.06 100.00 4.06 100.00 4.05 93.33
Erica umbellata 0.18 26.67 0.14 33.33 0.00 0.00 0.42 20.00
Ilex aquifolium 1.67 86.67 0.14 33.33 0.20 50.00 1.30 80.00
Pterospartum
tridentatum
0.00 0.00 0.27 33.33 0.88 50.00 1.52 13.33
Rubus ulmifolius 14.96 100.00 26.78 100.00 2.88 100.00 11.85 100.00
Ulex minor 0.77 53.33 0.00 0.00 0.00 0.00 7.65 100.00

34
In the case of roe deer, the groups of plants that were more consumed varied
according to the season. The monocotyledons was the most consumed group of plants in
winter (34.20%) followed by shrub species (27.75%), arboreous species (19.86%) and
dicotyledons species (13.22%). Spring and summer were similar, in which the most
consumed group of plants was arboreous species (spring: 54.20%; summer: 52.20%)
followed by shrub species (spring: 38.63%; summer: 43.21%), monocotyledons species
(spring: 2.20%; summer: 3.32%) and by dicotyledons species (spring: 1.90%; summer:
0%). In autumn, the arboreous species was the most consumed group (37.31%)
followed by shrub species (35.65%), dicotyledons species (18.71%) and by
monocotyledons species (4.75%). In all seasons the most representative monocotyledon
species was Festuca sp.. Rubus ulmifolius was the most consumed shrub species in all
seasons, except in summer that was Calluna vulgaris (34.54%). In relation to arboreous
species, in winter the most representative species was Laurus nobilis (8.99%), in spring
was Castanea sativa (20.52%), Fraxinus sp. in summer (48.53%) and in autumn Betula
pubescens (12.71%). Lastly, Lepidophorum repandum was the most representative
dicotyledon species consumed in winter and autumn, while in spring was Athyrium filix-
femina (1.61%) and in summer were not found dicotyledons species in the roe deer
feces.
Our results showed significant differences between the species of deer (pseudo-
=13.796; p=0.001) in terms of diet composition. Considering the differences
between the species, diet composition of red deer was significantly different from diet
composition of roe deer for all seasons (winter: t=2.373; p=0.003, spring: t=2.442;
p=0.006, summer: t=2.752; p=0.004, autumn: t=2.866; p=0.001). In the winter season,
the species that contributed more to differentiate the diet composition of red and roe
deer was Pterospartum tridentatum and Festuca sp. (Fig. 10). Is possible to observe that
in spring, Ulex minor is of great importance for red deer diet and Rubus ulmifolius for
roe deer (Fig. 10). In summer, Pterospartum tridentatum was again the most important
plant species for red deer, followed by Ulex minor, whereas for roe deer was Fraxinus
sp. (Fig. 10). In autumn, red deer consumed more Pterospartum tridentatum,
Arrhenatherum elatius and Cytisus striatus whereas Rubus ulmifolius was the most
important plant species for roe deer in this season (Fig. 10).
Regarding seasons, our results demonstrate significantly differences between
the seasons (pseudo- =5.456; p=0.001). The diet of red deer in winter was
significantly different from the diet in spring (t=2.010; p=0.001) but not in summer
(t=1.469; p=0.055) and autumn (t=1.272; p=0.127). In spring, the diet of red deer was
significantly different from the diet in summer (t=2.469; p=0.001) and autumn (t=1.740;
p=0.016). However, were not verified significant differences in the diet composition of
red deer between summer and autumn (t=1.301; p=0.114). Regarding to diet
composition of roe der was verified significant differences between all seasons, except
between spring and summer (t=2.473; p=0.093).
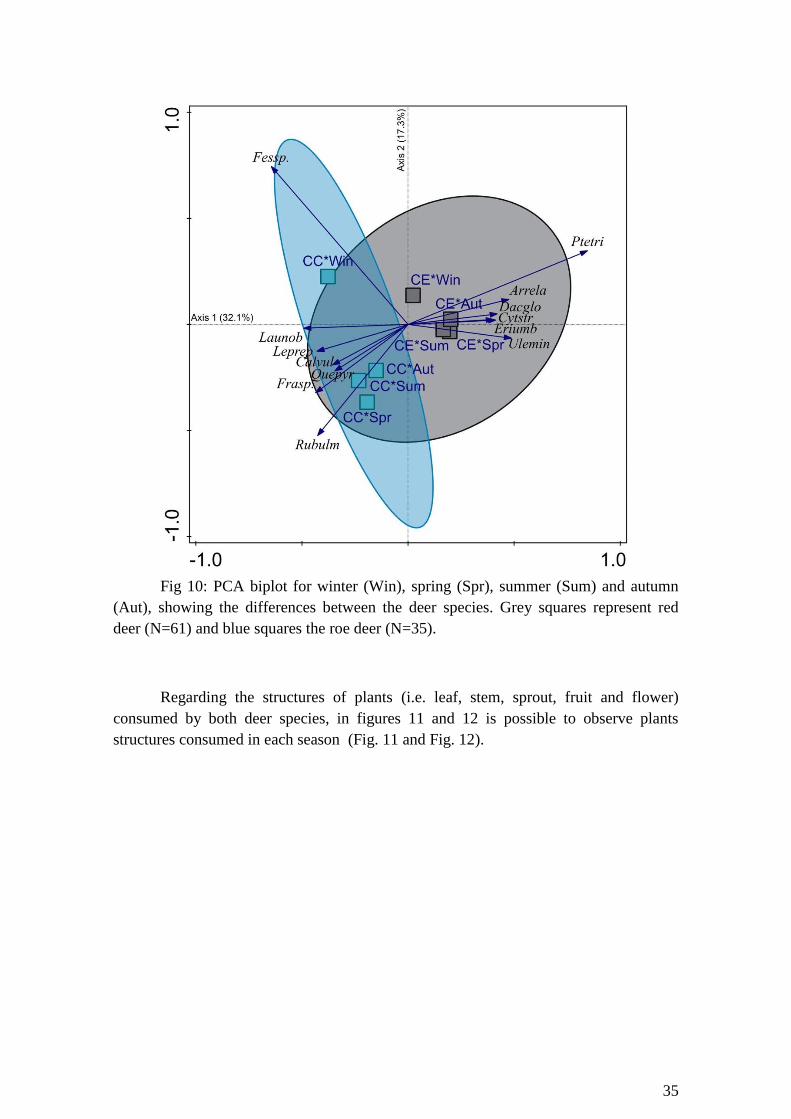
35
Fig 10: PCA biplot for winter (Win), spring (Spr), summer (Sum) and autumn
(Aut), showing the differences between the deer species. Grey squares represent red
deer (N=61) and blue squares the roe deer (N=35).
Regarding the structures of plants (i.e. leaf, stem, sprout, fruit and flower)
consumed by both deer species, in figures 11 and 12 is possible to observe plants
structures consumed in each season (Fig. 11 and Fig. 12).

36
Fig 11: Absolute frequency of occurrence of the different structures of plants on
the diet of red deer (N=61) in the different seasons.
Leaves of plants was the most consumed structure by red deer in all seasons
reaching the higher value in summer and autumn (52.41% and 52.44%, respectively)
(Fig.11). The second group of structures that was more consumed constituted the group
named “Leaf/Stem”, that correspond to the plants in which the epidermis of leaves and
stems are similar. The values were similar in all seasons. Stem was little consumed in
all seasons (winter: 8.78%; spring: 10.56%; summer: 8.89% and autumn: 9.41%)
(Fig.11). The intake of sprout was vestigial (maximum 1.19% in summer) and the fruits
did not arise in the red deer feces (Fig.11). Flowers were more consumed in spring and
summer (3.25% and 5.29%, respectively) (Fig.11). The indefinite structure of plants
corresponds to the monocotyledons species in which the structure of plant that was
consumed isn‟t clear (e.g. Festuca sp. and Graminae NI). In this case, was in winter that
this structure was more consumed (13.88%) (Fig.11).
0
10
20
30
40
50
60
AF(%)
Structures of plants
Red deer
Winter
Spring
Summer
Autumn

37
Fig 12: Absolute frequency of occurrence of the different structures of plants on
the diet of roe deer (N=35) in the different seasons.
Regarding to roe deer, leaves were the structure that was more consumed in all
seasons, having the higher value in the summer (Fig.12). In contrast to red deer,
leaf/stem and stem were not highly consumed by roe deer (Fig.12). The sprouts were
more consumed by roe deer than by red deer, except in summer (0.40% for roe deer)
(Fig.12). Although the small value, in autumn the fruits occurred in roe deer feces
(0.96%) (Fig.12). In the opposite to red deer, flowers epidermis did not appear in roe
deer feces (Fig.12). The indefinite structures of monocotyledons species were more
consumed in winter (33.60%) (Fig.12).
In relation to diet diversity analyzed by the species richness , Shannon-
Weaver diversity index , Pielou‟s evenness index and by the food amplitude
, our results demonstrate significantly differences between seasons for all of them
(S: p=0.003; : p=0.002; : p=0.004; : p=0.002). However, no significant
differences between red and roe deer were found for all indexes of diversity (p>0.05).
Since the results for these indexes of diversity were similar, we opted for only
present the food amplitude (Fig.13). In this case, the pairwise comparisons
between seasons showed significantly differences between the food amplitude in
autumn (9.17 ± 0.469) and spring (6.62 ±0.822) with p= 0.042, and between autumn
(9.17 ± 0.469) and summer (5.97 ±0.956) with p=0.016 (Fig.13). Regarding food
amplitude, no differences were found between species (p=0.085), nor in the interaction
between species and seasons (p=0.071).
0102030405060708090
100
AF(%)
Structures of plants
Roe deer
Winter
Spring
Summer
Autumn

38
Fig 13: Mean food amplitude index by season between red deer (open circles,
N=61) and roe deer (black squares, N=35).
Analyzing the food overlap using Pianka‟s index is possible to observe a low food
overlap between deer species. Our results demonstrated that in winter and autumn the
food overlap between red and roe deer was higher, decreasing in spring and summer.
Table 4: Pianka‟s index representing food overlap between red and roe deer.
Pianka‟s index Confidence
interval
Winter 0.573 0.417-0.729
Spring 0.171 0.015-0.327
Summer 0.164 0.008-0.320
Autumn 0.404 0.248-0.560
Global 0.399 0.244-0.555

39
2.4 Discussion
2.4.1 Habitat use
Independently of the sampling season, red deer used preferentially ecotone zones
between forests and shrublands at high altitudes, away from agricultural and urbanized
areas. This was also reported by Alves et al. (2014) for Lousã Mountain and by Torres
et al. (2014) in northeast Portugal, both for red deer. The same pattern was found in
Czech Republic in winter, in which the distribution of red deer in monitoring plots
situated away from fields distant to the villages, was higher than in plots close to the
fields (Prokešová et al. 2006). Also in China was verified that red deer, subspecies
Cervus elaphus xanthopygus, during winter occurred in habitats with mature mixed
coniferous at higher elevations far from human settlements and croplands (Jiang et al.
2008).
Our results demonstrate the need of red deer to use habitats that provide
simultaneously food, in quantity and quality, and some cover (Alves et al. 2014). As has
been reported by Borkowski (2004) and Borkowski and Ukalska (2008) in Poland, the
cover is the habitat requirement more important to large species, as is the case of red
deer, than to smaller species like roe deer. For large species is more difficult to find an
adequate cover than for small species. In this way, the differences between body sizes
lead to differences in habitat requirements, and consequently lead to a differential
habitat use by red and roe deer.
The use of ecotone zones reflects the necessity of red deer to use open areas (Alves
et al. 2014). Furthermore, the use of areas in forest habitats close to the edge allow to
maximize the gains and minimize the costs, allowing minimize the travel time between
food and cover (Thomas and Taylor 2006). In addition, Alves et al. (2014) reported that
near the edge in closed areas the understory became dense, providing adequate food
linked to cover. Similar results were found in Czech Republic, where red deer preferred
forest areas with dense cover and diversified shrub layer (Prokešová et al. 2006).
Contrarily to our results, in Alves et al. (2014) the results of pellet group counts and
direct observations disclose that red deer used less mixed forests than coniferous forests.
These two types of forests have a low (or even absence) understory (Alves et al. 2014)
because the tree canopy is closed, increasing the competition for light, nutrients and
water, affecting the ground layers and consequently the growth of shrubs (Nabuurs
1996), that are the main food resources for red deer (Garcia 2016). So, these forests
cannot by itself satisfy entirely the red deer requirements (Alves et al. 2014), and
consequently red deer used forests close to shrublands. The same explanation can be
used for the low number of pellet counts of red deer in eucalyptus forests, being the
understory absent in the majority of patches (Alves et al. 2014), and for that reason not
having the adequate quality for red deer, resulting in its avoidance.
As reported by Alves et al. (2014), the fact that no pellet counts were found in
broadleaf forests may be due to the small size of its patches and to the low abundance of

40
understory. These results demonstrate a selective use of available habitat by red deer
according to land cover, water bodies, distance to ecotone zones, distance to agricultural
areas and settlements and as well as topographic features like altitude. The topographic
characteristics, such as altitude, influence the composition of the vegetation in terms of
plant species and its size (Stage and Salas 2007). So, this can influence the distribution
of the red deer, that prefer to use the spaces with the best climatic conditions allowing
the intake of high quality of food (Alves et al. 2014).
In Mediterranean areas, the limiting period is the summer due its dry and hot
weather which can lead to nutritional restrictions (Bugalho and Milne 2003). This fact
can explain the increase of the number of red deer pellets in the summer in agricultural
areas (low altitudes), since these areas can operate as complementary food source. Thus,
in this season the availability of food in human-impacted areas may encourage the red
deer to use these open areas (Zhang et al. 2013). Also, in southern Spain throughout
most of the summer, red deer selected low altitudes (San José et al. 1997). The reverse
pattern was found in Helan Mountains, China for a subspecies of red deer (Cervus
elaphus alxaicus), in which red deer preferred open areas in winter and spring but not in
summer and autumn (Zhang et al. 2013). This is because in this region the limiting
period is not the summer but the winter (low precipitation) (Zhang et al. 2013).
In summer was also verified a reduction in densities of pellets counts in the transects
close to the sparse vegetation areas. These areas correspond to the firebreaks in the high
altitudes of the study area, so these areas do not have adequate food nor thermal cover
(Peek et al. 1982) for red deer in this season, so these areas became less used by red
deer in comparison with spring or autumn. Red deer in Tapada Nacional de Mafra
(Portugal) during summer uses more the shrublands and cork oak stands, proving their
necessity for areas with low sun exposure and low temperatures (Macedo 2015).
In autumn was verified a higher red deer presence in agricultural areas. These pellet
counts found in lower altitudes close to the agricultural areas may correspond to the
males of red deer (Alves et al. 2014). Consequently, after rut season, males segregate
from females and choose to move to higher quality patches to recover from the physical
condition lost in the previous month. In opposition, females prefer to continuing using
habitats located in high altitudes close to the ecotone zones and water bodies, due to
their new condition that requires more safety, the pregnancy (Alves et al. 2014).
Contrarily to the red deer, the presence of roe deer was higher in low altitudinal
areas, mainly in forest areas close to the agricultural lands (ecotone zones) and
urbanized areas. These results can be explain once again by the combination of food and
cover that determines the habitat attractiveness (Borkowski and Ukalska 2008). Since
roe deer is smaller than red deer, they can satisfy more easily their requirements of
cover (Borkowski 2004; Borkowski and Ukalska 2008), resulting in the higher use of
areas with human presence. Similar results was found by Torres et al. (2012b) for roe
deer in Norway and by Heurich et al. (2015) for roe deer in the Bohemian Forest
Ecosystem, situated along the border between Bavaria(Germany), the Czech Republic

41
and Austria. The greater tolerance of roe deer to the proximity to humans at low
altitudinal areas was also verified by Jiang et al. (2008) for Capreolus pygargus
bedfordi in China.
Contrarily to red deer, no roe deer feces were found in shrublands. Our results
evidenced that red deer is present in all habitats even in the ones with higher density of
roe deer, but the opposite does not happen, and roe deer avoid the areas where the red
deer density is higher. This evidence a level of spatial segregation between both species,
and previous verified by Wildash (1951). The occurrence of roe deer in areas with low
red deer presence was also highlighted in various studies (e.g. Aragón et al. 1995;
Tellería and Virgós 1997; Virgós and Tellería 1998; Torres et al. 2011, 2012a, 2012b).
Roe deer is a concentrate feeder (Tixier and Duncan 1996) with low body
reserves (income breeder) (Jönsson 1997) depending on immediate energy acquisition
for reproduction (Richard et al. 2014) through frequent and regular food intakes (Dupke
et al. 2017) in comparison with red deer (capital breeder) (Jönsson 1997) that has the
capacity of storing energy for reproduction through body reserves construction (Stearns
1992; Festa-Bianchet et al. 1998), having the ability of use the stored energy to raise
their young (Dupke et al. 2017). This implies that roe deer have the necessity to use
constantly habitats that simultaneously have food and cover in the same area in order to
increase the intake of food with high quality and simultaneously have cover in the
proximity to these feeding areas, to minimize the travels between feeding areas and
covers (thermal and hiding covers) (Peek et al. 1982). This is possible using ecotone
zones between forests and agricultural areas.
In fact, the use of areas close to the settlements and ecotone zones between
forests and agricultural areas maximize the food intake of roe deer. This positive
correlation can be related with soil fertility since human settlements are generally
situated close to naturally fertile soils or fertilized soils (Pautasso 2007). In this way the
agricultural lands provide extra sources with high-quality forage (Torres et al. 2012b).
Furthermore the forests edges close to the agricultural areas have a high diversity of
plant species, being an alternative food resource to the scarcity of preferred food
resources, providing simultaneously hiding cover in close proximity (Torres et al.
2012b). Thus edges provide good diversity of food resources and as well adequate cover
for roe deer (Torres et al. 2012b). This attractiveness of areas close to the forest edges
was also verified by Mysterud and Ostbye (1999).
Winter was the single season in which the presence of roe deer in agricultural
areas was higher than in mixed forests. In winter, the availability of vegetative parts
(leaves) of deciduous trees, shrubs and annual plants is low (Faria 1999), which are the
most important plant structure for roe deer diet. So, roe deer needs to find
complementary food resources mainly in agricultural areas (Torres et al. 2012b). In
addition, in the opposite to red deer, the winter fat reserves of roe deer are small and the
food availability is the mainly source of winter energy (Holand et al. 1998), so the

42
winter habitat used by roe deer is more influenced by food supply than in the case for
red deer (Borkowski and Ukalska 2008).
As for red deer, in spring the number of roe deer pellets in agricultural areas
reduced more than half in comparison with winter. The spring is the period of
vegetative growth, in which occurs the sprouting and flowering of different plant
species, increasing the food availability. In this period, the majority of plant species are
available and presenting green leaves (Faria 1999). Consequently, red and roe deer do
not need so much of find food resources in agricultural areas because in spring the
plant‟s availability is no longer limiting factor (Faria 1999).
In summer, the presence of roe deer increased in agricultural areas. In this
season, the herbaceous (Bugalho and Milne 2003) and grass species become senescent
due to hydric stress (Leite et al. 1997). The majority of leaves become dry (Faria 1999)
and of poor quality, so the roe der needs to find some alternative food resources, mainly
in agricultural areas (Torres et al. 2012b). Also, in Spain the roe deer selected the more
productive patches (e.g. pastures) in summer (Virgós and Tellería 1998), and large
agricultural patches were also important in the expansion process of roe deer across the
Iberian Mountains in Spain (Acevedo et al. 2005).
Roe deer feces in eucalyptus forests were only found in the summer. As mentioned
for red deer, the understory of eucalyptus forests is practically absence in the majority
of patches (Alves et al. 2014), not having the adequate food availability and quality,
resulting in its avoidance. However, it can operate as complementary thermal cover
(Peek et al. 1982) in this dry and hot season for roe deer, and it may be the reason why
roe deer feces were only found in eucalyptus forests in the summer.
In the autumn, the number of roe deer pellets in agricultural areas was very
similar to winter. In autumn, the majority of plants have dry leaves, although some
plants still have some green leaves such as Rubus sp. (Faria 1999). The availability in
this season in terms of quality of vegetative parts of plants is low, but in opposition
occurs the increase in the availability of dried fruit (e.g. chestnuts and acorns), that are
rich in amide and minerals, being an important energy source (Faria 1999). This makes
the agricultural areas even more attractive for roe deer during autumn and winter.
Regarding to spatial overlap between red and roe deer, the overlap between deer
species was very low. This result also visible in the maps of the number of pellets of
each deer species, in which is possible to observed a marked spatial segregation
between red and roe deer. Roe deer was mainly present at the lowest elevations with
high human presence mainly in ecotone zones between forests and agricultural areas,
whereas red deer selected the highest elevations in ecotone zones between forests and
shrublands away from settlements and agricultural areas. These results were also
verified by Jiang et al. (2008) in China for Cervus elaphus xanthopygus and for
Capreolus pygargus bedfordi. Since vegetation cover varies with altitude, the habitat
use of red and roe deer reflects these altitudinal differences, whereas red deer mainly
used shrublands that are abundant in high altitudes, and roe deer mainly used vegetation

43
types that are present in low altitudes. Thus, these differences in the altitudinal ranges
used by red and roe deer allow the habitat segregation of deer species and consequently
their coexistence (Jiang et al. 2008).
Our findings are in agreement to what was expected in terms of habitat used by
deer species, since both species are markedly different in terms of body size, behavior,
morphology, having thus large differences in energy and habitat requirements (McNab
1963), resulting in interspecific differences in habitat use (Richard et al. 2014).
However, the spatial overlap between red and roe deer in winter was the lowest, having
started to increase during the following seasons, attaining the highest value in autumn.
Analyzing the number of pellets in agricultural areas of both red and roe deer (areas
occupied by both species), mainly in autumn these values were the highest, very similar
for both species, resulting in the higher value of spatial overlap. The same trend was
found during winter in Poland, in which the winter habitat used by red and roe deer was
similar (Borkowski and Ukalska 2008). This is because in this region the limiting period
(with particular conditions and with low food available) is the winter, so the feeding
behavior and habitat use are more similar between red and roe deer than in other
seasons (Borkowski and Ukalska 2008).

44
2.4.2 Feeding behavior
Shrubs were the most consumed group of plants by red deer in all seasons, as also
described by Garcia (2016) for Lousã Mountain. Also Gebert and Verheyden-Tixier
(2001) confirmed the shrubs as a key plant species group for European red deer. These
results are in accordance with what was expected, since shrublands are one of the most
used habitats by red deer in all seasons, consequently red deer‟s diet is mainly
composed by shrubs. This fact was also described by other authors (Tixier and Duncan
1996; Cornelis et al. 1999; Gebert and Verheyden-Tixier 2001) that verified that diet
composition is mainly explained by the habitat in which species feed. This implies that
the availability of food in the habitats used by the species can be a key determinant of
their diet composition (Duncan et al. 1998b).
The most representative shrub species was Pterospartum tridentatum in all seasons,
except in spring that was Ulex minor. In spring (between May and June), the sprouting
and flowering of Ulex minor start to increase which can explain the higher consume of
this species specially in this season. Furthermore, the high consume of these two species
can be explained based on their high availability in whole study area (Garcia 2016) and
based on the high preference of Pterospartum tridentatum for high altitudes where
mainly red deer are present. In addition, they are two evergreen shrubs so can be
consumed throughout the year. These results are in accordance with fact that red deer
feed on plants proportionally to their availability, suggesting a non-selective grazing
behavior. This was also verified by Lathman et al. (1999) for red deer feeding behavior
in the Scottish forests.
Monocotyledon species were the second group of plants more consumed by red deer
in all seasons. Arrhenatherum elatius was the most representative species, except in
winter that was Festuca sp.. Since the flowering of Festuca sp. occurs in
spring/summer, in winter this species appears at high quantities, being more consumed
in this season.
However, red deer also feed on arboreous and dicotyledons species as verified by
Garcia (2016). These results are in accordance with what was expected because red deer
is considered as an intermediate feeder (Hofmann 1989), whereby they are able to be
grazers presenting a mixed of grasses in their diet, whose forage have a high fiber
content, but also browsers, feeding on herbaceous and shrub foliage and trees (Garcia
2016). This evidences the changes in diet composition according to food availability
(Hofmann 1989). This implies that large animals such as red deer have the capacity to
select diets of lower digestibility than smaller animals, such as roe deer (Clutton-Brock
and Harvey 1983; Demment and Van Soest 1985). Consequently, the red deer diet is
diverse and might be constituted by forages with high fiber content.
In the case of roe deer, the groups of plants more consumed varied according to the
season. The monocotyledon species was the most consumed group of plants in winter
being Festuca sp. the most consumed species. As previously mentioned, the flowering

45
of Festuca sp. occurs in spring/summer, so is in winter that this species presents the
higher quantity, so is more consumed. Besides, in winter the availability of vegetative
parts of deciduous trees and shrubs and annual plants is low (Faria 1999), so leaves that
are an important structure of plants in roe deer diet are less abundant. This result is in
agreement with optimal foraging theory, in which in periods of low food resources, the
species become less selective (Schoener 1971; Owen-Smith and Novellie 1982). Also,
in Italy, Minder (2012) found that grass was typical found in roe deer diet during winter.
The high consume of grass in winter can be explained through the increase of new
growth availability at the beginning of their vegetative cycle after the first autumn rains
(Minder 2012). So roe deer seems to optimize their feeding behavior in periods of low
availability of food, by including species of plants which are generally less consumed
and by selecting of species with relatively higher quality (Minder 2012).
Spring and summer diets were similar, in which the most consumed group of
plants was arboreous species followed by shrub species, monocotyledons species and by
dicotyledons species. Also, Faria (1999) verified that the roe deer diet in spring and
summer in the Lousã Mountain was similar, and mainly composed by brambles (Rubus
sp.) and arboreous species such as Castanea sativa. As previously mentioned, in spring
the most part of plants are available and presenting green leaves (Faria 1999).
Consequently, arboreous and shrub species were the most consumed group of plants in
this season. Furthermore, in summer the grasses (Leite et al. 1997) and herbaceous
species (Bugalho and Milne 2003) become senescent. Consequently, were less
consumed (or even not consumed such as the dicotyledons species) by roe deer because
in this season these plant species have higher fiber content (González-Hernández and
Silva-Pando 1999) resulting in its avoidance by roe deer.
Dicotyledons species were less consumed by roe deer than was expected since
have lower fiber contents. However, these results were also found in other studies
(Maizeret and Sung 1984; Fandos et al. 1987; Maillard and Picard 1987; Guilhem et al.
1995; Homolka 1995). According to Maizeret and Sung (1984), the herbaceous
dicotyledons constitute an ancillary food item in forest habitats. In addition, Homolka
(1995) verified in Czech Republic that herbaceous dicotyledons are not an important
food resources in forests habitats. Consequently, and as mentioned by Faria (1999), the
low importance of herbaceous dicotyledons in diet can be a consequence of its low
availability in forests habitats although its high diversity in the study area (Alves 2013;
Alves et al. 2014; Garcia 2016). Another possible explanation for this result arises from
the major problem of the application of microhistological technique. Different species
of plants have differences in digestibility (Fitzgerald and Waddington, 1979) which can
lead to errors in quantitative determination of the diet (Maizeret et al. 1986). The leaves
and stems of woody species and grasses have thicker epidermic cuticles so can be
overestimated in fecal analysis, whereas vegetal components with less cutinized
epidermis, such as leaves of herbaceous species might be underestimated (Dearden et al.
1975; Vavra et al. 1980; Holechek et al. 1982).

46
Rubus ulmifolius was the most representative shrub species in all seasons, except in
summer that was Calluna vulgaris. This result can be related with the flowering of
Calluna vulgaris that occurs in summer and the maturation of fruits occurs in sequence
of flowering. This results in high attractiveness of this species in summer. In addition, in
Mediterranean areas the limiting period is the summer which can lead to nutritional
restrictions (Bugalho and Milne 2003). Calluna vulgaris belong to the family Ericaceae
and the increase in consume of this plant species in summer was also verified by Faria
(1999) for roe deer diet in northeast Portugal. This species are usually consumed in
periods with low availability of food resources because their leaves have a low
nutritional value, high fiber content and consequently low digestibility of its organic
matter (Maizeret and Sung 1984). This in agreement with optimal foraging theory.
(Schoener 1971; Owen-Smith and Novellie 1982). Nonetheless, the importance of
Rubus ulmifolius for roe deer was also verified in other parts of Europe (Siuda et al.
1969; Hearney and Jennings 1983; Homolka 1991; Tixier and Duncan 1996; Storms et
al. 2008) because of their high nutritional value (Prokešová et al. 2006).
In relation to arboreous species, in winter the most representative species was
Laurus nobilis, in spring was Castanea sativa, Fraxinus sp. in summer and in autumn
Betula pubescens. These results can be related with the phenology of the species. The
flowering of Laurus nobilis start in January peaking in March, whereas the flowering of
chestnut tree (Castanea sativa) occur in spring, having the flowering peak in June. The
highest consume of Fraxinus sp. in summer can be related with the fact that this
arboreous species mainly occur in moist soils and have the capacity withstand droughts
due to their extent radicular system. Furthermore, the leaves of this species fall in
autumn resulting in low consume of this species in autumn and winter and high
consume in summer, when the leaves are green and the flowering already occurred.
Regarding to Betula pubescens, is in the autumn that gathers all conditions for being
more consumed.
These results are in accordance with our expectations for roe deer feeding behavior.
In fact, the eating habits of roe deer can quickly change (Tixier and Duncan 1996;
Cornelis et al. 1999) according to modifications in spatial and temporal availability of
food resources, which leads to a strong specialization of the seasonal diet (Duncan et al.
1998a). This species is a browser (Clauss et al. 2003) and a selective feeder, feeding
selectively and preferably on the most digestible plant material present in their habitats,
which are rich in energy and have high moisture content (Cornelis et al. 1999; Danilkin
1996; Sempéré et al. 1996), such as tree leaves, seedlings and forbs (Latham 1999).
This ungulate chooses to forage on plants with highly accessible cellular contents
(lower fiber content) (Hofmann 1989). In this way is verified the prediction that
browsers are obligatorily non-grazers (Wieren 1996; Clauss et al. 2003) because in
winter the most consumed group of plants by roe deer was monocotyledon species, and
was more consumed than red deer in this season. However, at a general level, roe deer
avoid grasses with high fiber contents in comparison to grazers, preferring plants with
less fiber content (leaves of trees and shrubs) (Storms et al. 2008). Consequently, the

47
roe deer diet had less fiber content than red deer diet. However, we cannot support the
prediction that the diets of red and roe deer have more fibrous forage in summer, since
nor red or roe deer diet had a high value of absolute frequency of occurrence of
monocotyledons species in comparison with other groups of plants in this season.
As our results showed, the diet composition of red and roe deer was significantly
different in all seasons, as verified by Storms et al. (2008). Thus, roe deer occupy a
niche which is clearly different from red deer, as previous verified by Tixier and
Duncan (1996). Regarding to the seasonality of diet composition, our results
demonstrated significantly differences in the food items present in the feces. These
differences were principally due to the phenology of the plants in the study area,
however can also reflects the availability of preferred species (Garcia, 2016).
In relation to the structures of plants consumed by red and roe deer, leaves were
the structure that was more consumed by both species in all seasons, whereas stem was
little consumed for the same period. The leaves provide a better quality diet for red and
roe deer than stems, since the green portions of plants are the most nutritive for animal
diet (Leite et al. 1997). In addition, the leaves are the principal component of the
photosynthesis of the forage, determining the capacity of dry matter production by the
plant (Leite et al. 1997). The sprouts were more consumed by roe deer than for red deer,
except in summer. This result can be related with the feeding strategy of roe deer
(Cornelis et al. 1999; Danilkin 1996; Sempéré et al. 1996). In spring, takes place the
vegetative growth and sprouting of plants (Faria 1999), explaining the higher consume
of this structure in this season than in other seasons.
The fruits did not appear in the red deer feces but appeared in roe deer feces in
autumn, even with small percentage. However, Garcia (2016) mentioned that fruits can
be eaten by red deer depending on phenology and availability of plants and
consequently in that the time of the year. In autumn, occurs an increase in the dried
fruits availability that are rich in amide and minerals being an important energy source
(Faria 1999), explaining the consume of fruits in this season. Also, Cornelis et al.
(1999), Danilkin (1996) and Sempéré et al. (1996) concluded that roe deer in autumn
opted for use concentrate food resources, such as fruits. The absence of fruits in red deer
feces and the low percentage in roe deer feces can be due to the absence of the cuticle in
this vegetal component, thus they can be totally digested not being detected in feces
with the microhistological technique (Voth and Black 1973; Maizeret et al. 1986). In
addition, it is possible that animals ingest the fruits without ectocarp not being detected
through microscopic fecal analysis (Faria 1999). Thus, is necessary to use
complementary methods to detect this structure in diet, such as the analysis of the seeds
present in feces and through the identification of germinated seeds in feces cultures as
made by Faria (1999) to roe deer diet in center and northeast Portugal.
Flowers were more consumed in spring and summer by red deer. In the opposite
to the red deer, flowers did not appear in roe deer feces. The majority of plants flourish
in spring and summer resulting in higher consume of the flowers in these seasons.

48
Furthermore, flowers are rich in nectar and pollen grains constituting important sources
of energy and nutrients (Faria 1999). So, its absence in roe deer diet was unexpected.
However, the importance of flowers in roe deer diet is not well documented (Faria
1999), although several studies referred the consume of flowers by roe deer (Holisová et
al. 1982; Holisová et al. 1984; Holisová et al. 1986; Fandos et al. 1987).
Regarding to diet diversity, no significant differences were found between red
and roe deer, although significantly differences were found between the seasons. These
results are in accordance with what was expected since more differences in diet
composition of red and roe deer than in diet diversity were predicted, since both species
eat high number of different plant species but those plants are consumed in different
quantities by each species. Differences on the diet diversity over the seasons reflect the
phenology of the plants in the study area, however can also reflects the availability of
preferred species (Garcia, 2016). In fact, in the periods with high food availability (e.g.
spring), the food amplitude is lower. This result indicates that in spring the animals are
feeding on their preferred food items (Garcia, 2016), resulting in lower food amplitude.
Conversely, the higher value of food amplitude indicates that species need to use a
larger variety of food items to suppress their energetic requirements (Garcia, 2016).
Regarding food overlap, the diet overlap between deer species was low,
indicating that these deer species use different food resources across seasons. The
highest value of food overlap was found in winter, as also reported by Storms et al.
(2008) for red and roe deer in France. The higher value of food overlap in winter was
due to Festuca sp. that was largely consumed by both species in this season. Also Tixier
and Duncan (1996) in mixed coniferous Scottish plantations found that dietary overlap
between red and roe deer increased in winter with the main overlap for Calluna vulgaris
and Vaccinium myrtillus. Conversely, in spring and summer food overlap decreases
because in these seasons each species is feeding on their preferred food items due its
availability (Garcia, 2016), which results in lower food overlap. In autumn, the food
overlap increases probably due to the decrease in food availability, that result in the use
of larger variety of food items by red and roe deer to supply their energy requirements
(Garcia, 2016). As so, our results confirm the segregation of both deer species in terms
of diet composition, as previously verified by Storms et al. (2008).

49
2.4.3 Evaluating ecological resources used by red and roe deer
Based on the results of spatial and food overlap, the results indicate a low
overlap between red and roe deer, both in terms of spatial niche and trophic niche. In
this way, red and roe deer can coexist in Lousã Mountain with low competition between
them, both in terms of space and food resources. Also in other studies, no competition
was found between red and roe deer, allowing the coexistence of both species (e.g.
Prokešová et al. 2006; Borkowski and Ukalska 2008; Melis et al. 2009; Storms et al.
2008).
The differences between body size and consequently energy requirements
explain the interspecific differences in the habitat use (Richard et al. 2014) in terms of
space and feeding behavior. These differences in body size as well as the segregation of
niche allow the coexistence of red and roe deer in Lousã Mountain. These differences
allow the resource partitioning (Putman 1996; Bell 1971; Jarman 1974) between these
sympatric species, that results in subtle interactions due to the species co-evolution
(Latham 1999).
Red deer can feed on the preferred food items of roe deer, and consequently
reduce their abundance, although they do not depend on them. Conversely, roe deer are
strongly selective and physiologically unable to supply their necessities based on a diet
that is mainly bulk forage. Consequently, roe deer is not able to decrease the abundance
of the principal food resources of red deer. Thus, red deer are able to exploit the
majority of the roe deer food niche, but the opposite does not occur, since roe deer can
only exploit a small part of the red deer food niche. These different digestive
physiologies between red and roe deer have implications for the potential competition
between these two species, being any competition for food resources between red and
roe deer probably be asymmetric (Latham 1999). In conclusion, red deer occurs in
habitats where roe deer occurs, but the opposite is less frequent.

50
Chapter III-General conclusions
51
The study of habitat use and feeding behavior in same context allowed to
conclude if red and roe deer after their reintroduction in Lousã Mountain are feeding on
same food resources in same area or if are feeding on same food resources but in
different areas. The findings obtained through both studies demonstrate that whereas red
deer mainly use ecotone zones between forests and shrublands, which occur at high
altitudes away from settlements, roe deer preferably uses ecotone zones between forests
and agricultural areas at low altitudes and close to human settlements. Besides the
differences in terms of habitat use, their diet composition is also different. Therefore,
red and roe deer are using different ecological resources (habitat and food) and
ecological niches. In this way, red and roe can coexist in the Lousã Mountain, occurring
a low competition between them, either by space or food resources.
The results of this study appear to be crucial for the correct management and
conservation of both species and their habitats, having future implications. The fact that
roe deer are using more the open areas, such as agricultural areas, than red deer, close to
the settlements, may have two future implications. Roe deer may increase the quality of
its diet by feeding in these areas, that have consequences at demographic level because
this allow to improve the reproductive capacity of young females and increase the
offspring survival, leading to the increase in number and geographical area of roe deer
as verify throughout Europe (Tixier and Duncan 1996). However, such habitat selection
leads to a higher conflict with human population, increasing the damages in agricultural
areas caused by roe deer.

52
Chapter IV-References

53
Abrams, P. 1980. “Some Comments on Measuring Niche Overlap.” Ecology 61:44–49.
Acevedo, P., Delibes-Mateos, M., Escudero, M.A., Vicente, J., Marco, J., and Gortazar,
C. 2005. “Environmental Constraints in the Colonization Sequence of Roe Deer
(Capreolus capreolus Linnaeus, 1758) across the Iberian Mountains, Spain.” Journal of
Biogeography 32 (9):1671–80.
Adulyanukosol, K., Poovachiranon, S. 2003. “A Pictorial Key to Genera/Species for
Identification of Seagrass Cells in Stomach Contents of Dugong from the Andaman Sea,
Thailand.” Technical Paper.
Ahmed, T., Khan, A. & Chandan, P. 2015. “Photographic Key for the Microhistological
Identification of Some Plants of Indian Trans-Himalaya.” Notulae Scientia Biologicae
7:171–76.
Alves, J. 2013. “Avaliação Eco-Cinegética Da População de Veado Da Serra Da
Lousã.” Universidade de Aveiro.
Alves, J., Silva, A.A., Soares, A.M.V.M., Fonseca, C. 2014. “Spatial and Temporal
Habitat Use and Selection by Red Deer: The Use of Direct and Indirect Methods.”
Mammalian Biology - Zeitschrift Für Säugetierkunde 79 (5). Elsevier GmbH:338–48.
Anciaux, M.R., Herrenschmidt, V., and Roland, M. L. 1991. “Choix de l‟habitat Par Le
Lynx Européen et Par Sa Proie Principale, Le Chevreuil, Dans Un Milieu de Moyenne
Montagne (Massif Vosgien). 1. Le Cas Du Chevreuil.” Cahiers d‟Ethologie 11 (1):51–
66.
Andersen, R., Duncan, P., and Linnell, J.D.C. 1998. “European Roe Deer: The Biology
of Success.” The Biology of Success. Scandinavian University Press, Oslo, Norway.
Anderson, D. P., Turner, M.G., Forester, J.D., Zhu, J., Boyce, M.S., Beyer, H., and
Stowell, L.. 2005. “Scale-Dependent Summer Resource Selection By Reintroduced Elk
in Wisconsin.” Journal of Wildlife Management 69:298–310.
Anthony, R.G. and Smith, N.S. 1974. “Comparison of Rumen and Fecal Analysis to
Describe Deer Diets.” The Journal of Wildlife Management 38 (3):535–40.
Apollonio, M., Andersen, R., and Putman, R.. 2010. “European Ungulates and Their
Management in the 21st Century. European Ungulates and Their Management in the
21st Century. ”
Aragon, S., Braza, F., and San Jose, C. 1998. “Variation in Skull Morphology of Roe
Deer (Capreolus capreolus) in Western and Central Europe.” Journal of Mammalogy
79 (1):131–40.
Aragón, S., Braza, F., and San José, C.. 1995. “Socioeconomic, Physiognomic, and
Climatic Factor Determining the Distribution Pattern of Roe Deer Capreolus capreolus
in Spain.” Acta Theriologica 40:37–43.

54
Archibold, O. 1995. Ecology of World Vegetation. London: Chapman & Hall.
Arsenault, R. and Owen-Smith, N.. 2002. “Facilitation versus Competition in Grazing
Herbivore Assemblages.” Oikos 97 (January):313–18.
Barclay, R., McElwain, J., Dilcher, D., and Sageman, B.. 2007. “The Cuticle Database:
Developing an Interactive Tool for Taxonomic and Paleoenvironmental Study of the
Fossil Cuticle Record.” CFS Courier Forschungsinstitut Senckenberg.
Bartos, L., Vanková, D. and Miller, K. V. 2002. “Interspecific Competition between
White-Tailed, Fallow, Red, and Roe Deer.” Journal of Wildlife Management 66:522–
27.
Bauer, M.O., Gomide, J.A., Silva, E.A.M., Regazzi, A.J., Chichorro, J.F. 2005.
“Análise Comparativa de Fragmentos Identificáveis de Forrageiras, Pela Técnica Micro-
Histológica.” Revista Brasileira de Zootecnia 34 (6):1841–1850.
Baumgartner, L., and Martin, A.C.. 1939. “Plant Histology as an Aid in Squirrel Food-
Habit Studies.” The Journal of Wildlife Management 3 (3):266–68.
Beest, F.M. Van, I. Rivrud, M., Leif, E.L., Milner, J.M., and Mysterud, A.. 2011. “What
Determines Variation in Home Range Size across Spatiotemporal Scales in a Large
Browsing Herbivore?” Journal of Animal Ecology 80 (4):771–85.
Begon, M., Harper, J.L., and Townsend, C.R.. 1996. Ecology: Individuals, Populations
and Communities. Third edit. Blackwell Science Ltd., Oxford, UK.
Beilin, R., Lindborg, R., Stenseke, M., Pereira, H.M., Llausàs, A., Slätmo, E.,
Cerqueira, Y. 2014. “Analyzing How Drivers of Agricultural Land Abandonment
Affect Biodiversity and Cultural Landscapes Using Case Studies from Scandinavia,
Iberia and Oceania.” Land Use Policy 36:60–72.
Bell, R.H.V. 1970. “The Use of the Herb Layer by Grazing Ungulates in the Serengeti.”
In Watson, A. (Ed.), Animal Populations in Relation to Their Food Resources.
Blackwell Scientific Publications, 111–24.
Bell, R.H.V. 1971. “A Grazing Ecosystem in the Serengeti.” Scientific American
224:86–93.
Bertolino, S. 2008. “Introduction of the American Grey Squirrel (Sciurus Carolinensis)
in Europe: A Case Study in Biological Invasion.” Curr Sci. 95:903–6.
Birch, L.C. 1957. “The Meanings of Competition.” Am. Nat. 91:5–18.
Block, W. M., and Brennan, L.. 1993. “The Habitat Concept in Ornithology. Theory
and Applications.” Current Ornithology Vol.11 11:35–91.
Bobek, B. 1977. “Summer Food as the Factor Limiting Roe Deer Population Size.”
Nature 268 (5615):47–49.

55
Boer, W.F. De, and Prins, H.H.T. 1990. “Large Herbivores That Strive Mightily but Eat
and Drink as Friends.” Oecologia 82:264–74.
Bonenfant, C., Loe, L. E., Mysterud, A., Langvatn, R., Stenseth, N. C., Gaillard, J.M.,
and Klein, F. 2004. “Multiple Causes of Sexual Segregation in European Red Deer:
Enlightenments from Varying Breeding Phenology at High and Low Latitude.”
Proceedings of the Royal Society B: Biological Sciences 271 (1542):883–92.
Borkowski, J. 2004. “Distribution and Habitat Use by Red and Roe Deer Following a
Large Forest Fire in South-Western Poland.” Forest Ecology and Management 201 (2–
3):287–93..
Borkowski, J., and Ukalska, J. 2008. “Winter Habitat Use by Red and Roe Deer in Pine-
Dominated Forest.” Forest Ecology and Management 255 (3–4):468–75.
Brewer, A., and Williamson, M. 1994. “A New Relationship for Rarefaction.”
Biodiversity and Conservation 3 (4):373–79.
Brown, J.S. 1999. “Vigilance, Patch Use and Habitat Selection: Foraging under
Predation Risk.” Evol. Ecol. Res. 1 (October):49–71.
Bugalho, M.N., Milne, J. and Racey, P. 2001. “The Foraging Ecology of Red Deer
(Cervus elaphus) in a Mediterranean Environment: Is a Larger Body Size
Advantageous?” Journal of Zoology 255:285–89.
Bugalho, M.N., and Milne, J.A. 2003. “The Composition of the Diet of Red Deer
(Cervus elaphus) in a Mediterranean Environment: A Case of Summer Nutritional
Constraint?” Forest Ecology and Management 181 (1–2):23–29.
Bugalho, M.N., and Milne, J.A., Mayes, R.W, and Rego, F.C. 2005. “Plant-Wax
Alkanes as Seasonal Markers of Red Deer Dietary Components.” Canadian Journal of
Zoology 83 (3):465–73.
Butet, A. 1985. “Methode d‟étude Du Régime Alimentaire d‟un Rongeur Polyphage
(Apodemus Sylvaticus LM 1758) Par l‟analyse Microscopique Des Fèces.” Mammalia
49 (4):455–84.
Cargnelutti, B., Reby, D., Desneux, L., Angibault, J-M, Jean, J., and Hewison, A. J. M.
2002. “Space Use by Roe Deer in a Fragmented Landscape Some Preliminary Results.”
Revue d‟ecologie 57 (1):29–37.
Carrière, S. 2002. “Photographic Key for the Microhistological Identification of Some
Arctic Vascular Plants.” Arctic 55 (3):247–68.
Carvalho, P.N.C. 2007. “Ecologia de Uma População Reintroduzida de Corço
(Capreolus capreolus L. 1758).” Faculdade de Ciências e Tecnologia, Universidade de
Coimbra.

56
Cederlund, G., Bergqvist, J., Kjellander, P., Gill, R., Gaillard, J-M., B. Boisaubert, P.B.,
and Duncan, P. 1998. “Managing Roe Deer and Their Impact on the Environment:
Maximising the Net Benefits to Society.” The European Roe Deer: The Biology of
Success, no. June 2016:337–72.
Cederlund, G. 1983. “Home Range Dynamics and Habitat Selection by Roe Deer in a
Boreal Area in Central Sweden During the Last Century the Roe Deer (Capreolus
capreolus Linnaeus, 1758) Population in Sweden Has Drastically Increased and
Extended Its Range North of the Arctic” 28:443–60.
Chase, J.M., and Leibold, M.A. 2003. “Ecological Niches.” Linking Classical and
Contemporary Approaches. The University of Chicago Press. Chicago.
Ciuti, S., Bongi, P., Vassale, S., and Apollonio, M. 2006. “Influence of Fawning on the
Spatial Behavior and Habitat Selection of Female Fallow Deer ( Dama Dama ) during
Late Pregnancy and Early Lactation.” Journal of Zoology 268:97–107.
Clark, C.W. 1994. “Antipredator Behavior and the Asset-Protection Principle.”
Behavioral Ecology 5 (2):159–70.
Clauss, M., and Lechner-Doll, M.. 2001. “Differences in Selective Reticulo-Ruminal
Particle Retention as a Key Factor in Ruminant Diversification.” Oecologia 129
(3):321–27.
Clauss, M., Lechner-Doll, M., and Jurgen, W.S. 2003. “Ruminant Diversification as an
Adaptation to the Physicomechanical Characteristics of Forage . A Reevaluation of an
Old Debate and a New Hypothesis.” Oikos 102 (2):253–62.
Clutton-Brock, T.H., Guinness F.E., and Albon, S.D. 1982. “Red Deer, Behavior and
Ecology of Two Sexes.” Behavioral Processes 10 (4):440–41.
Clutton-Brock, T.H. 1989. “Mammalian Mating Systems.” Proceedings of the Royal
Society of London (B) 236:339–72.
Clutton-Brock, T.H, and Harvey, P.H. 1983. “The Functional Significance of Variation
in Body Size among Mammals.” Special Publication of the American Society for
Mammalogy 7:632–63.
Connell, H.J. 1980. “Diversity and the Coevolution of Competitors, or the Ghost of
Competition Past.” Oikos 35 (2):131.
Corbet, G.B. 1978. The Mammals of the Palaearctic Region: A Taxonomic Review. Vii.
British Museum (Natural History) and Cornell University Press, London, UK and
Ithaca, NY, USA.
Cornelis, J., Casaer, J., and Hermy, M. 1999. “Impact of Season, Habitat and Research
Techniques on Diet Composition of Roe Deer (Capreolus capreolus): A Review.”
Journal of Zoology 248 (2):195–207.

57
Cortez, J. 2010. “Utilização e Impacto Dos Cervídeos Na Vegetação Lenhosa.”
Dahle, B., and Swenson, J.E. 2003. “Seasonal Range Size in Relation to Reproductive
Strategies in Brown Bears Ursus Arctos.” Journal of Animal Ecology 72 (4):660–67.
Danilkin, A. 1996. “Behavioral Ecology of Siberian and European Roe Deer.
Chapman.” Chapman and Hall, London, UK.
Darwin, C. 1859. “On The Origin of Species by Means of Natural Selection, or The
Preservation of Favoured Races in the Struggle for Life.” London, UK: John Murray.
Dearden, B.L., Pegau, R.E. and Hansen, R.M. 1975. “Precision of Microhistological
Estimates of Ruminant Food Habits.” The Journal of Wildlife Management 39 (2):402–
7.
Demment, M.W., and Van Soest, P.J.. 1985. “A Nutritional Explanation for Body-Size
Patterns of Ruminant and Nonruminant Herbivores.” The American Naturalist 125
(5):641–72.
Diamond, J.M. 1978. “Niche Shifts and the Rediscovery Interspecific Competition:
Why Did Field Biologists so Long Overlook the of Widespread Evidence for
Interspecific Competition That Had Already Impressed Darwin?” American Scientist 66
(3):322–31.
Dove, H., Mayes, R.W, and Freer, M.. 1995. “Using Cuticular Wax Alkanes to Estimate
Herbage Intake in Animals Fed Supplements.” Ann Zootech 44:237.
Dumont, B., Renaud, P-C, Morellet, N., Mallet, C., Anglard, F., and Verheyden-Tixier,
H. 2005. “Seasonal Variations of Red Deer Selectivity on a Mixed Forest Edge.”
Animal Research 54 (5):369–81.
Duncan, P., H. Tixier, Hofman R.R., and Lechner-Doll, M. 1998. “Feeding Strategies
and the Physiology of Digestion in Roe Deer.” The European Roe Deer: The Biology of
Success, no. January 1998:91–116.
Dupke, C., Bonenfant, C., Reineking, B., Hable, R., Zeppenfeld, T., Ewald, M., and
Heurich, M. 2017. “Habitat Selection by a Large Herbivore at Multiple Spatial and
Temporal Scales Is Primarily Governed by Food Resources.” Ecography 40 (8):1014–
27.
Durant, Sarah M. 1998. “Competition Refuges and Coexistence: An Example from
Serengeti Carnivores.” Journal of Animal Ecology 67 (3):370–86.
Dzieciolowski, R. 1969. The Quantity, Quality and Seasonal Variation of Food
Resources Available to Red Deer in Various Environmental Conditions of Forest
Management. Forest Research Institute, Warsaw, Poland.
Dzięciołowski, R. 1979. “Structure and Spatial Organization of Deer Populations.” Acta
Theriologica 24:3–21.

58
Emlen, S, and Oring, L. 1977. “Ecology, Sexual Selection, and the Evolution of Mating
Systems.” Science 197:215–23.
Erickson, A.A.; Saltis, M., Bell, S.S., Dawes, C.J. 2003. “Herbivore Feeding
Preferences as Measured by Leaf Damage and Stomatal Ingestion: A Mangrove Crab
Example.” Journal of Experimental Marine Biology and Ecology. 289:123– 138.
Fahn, A. 1990. Plant Anatomy. 4a edition. Pergamon Press. Oxford.
Fandos, P., Martínez, T. and Palacios F. 1987. “Estudio Sobre La Alimentacion Del
Corzo (Capreolus capreolus L. 1758) En España.” Ecologia 1:161–86.
Faria, A.M.S. 1999. “Dieta de Corço (Capreolus capreolus L.) No Centro e Nordeste de
Portugal.”
Ferreira, S.M.G. 2004. “Consumo e Digestibilidade de Dietas MediterrâNicas Pelo
Veado (Cervus elaphus). Um Caso de Estudo Da Beira Interior, Portugal.”
Universidade de Coimbra.
Ferretti, F., Lovari, S. 2014. “Introducing Aliens: Problems Associated with Invasive
Exotics. In: Putman RJ, Apollonio M, Editors. Behavior and Management of European
Ungulates. Dunbeath, UK: Whittles Publishing. p. 78–109.” In Putman RJ, Apollonio
M, Editors. Behavior and Management of European Ungulates. Dunbeath, UK: Whittles
Publishing. p. 78–109.
Ferretti, F., Corazza, M., Campana, I., and Pietrocini, V. 2015. “Competition between
Wild Herbivores : Reintroduced Red Deer and Apennine Chamois.” Behavioral Ecology
26 (2):550–59.
Ferretti, F., Sforzi, A., and Lovari, S.. 2011. “Behavioral Interference between Ungulate
Species: Roe Are Not on Velvet with Fallow Deer.” Behavioral Ecology and
Sociobiology 65 (5):875–87.
Ferri, M.G. 1999. “Botânica- Morfologia Interna Das Plantas (Anatomia).” Nobel. 9a.
São Paulo.
Festa-Bianchet, J.M., Gaillard M., and Jorgenson, J.T. 1998. “Mass‐ and Density‐
Dependent Reproductive Success and Reproductive Costs in a Capital Breeder.” The
American Naturalist 152 (3):367–79.
Fitzgerald, A.E., and Waddington, D.C. 1979. “Comparation of Two Methods of Fecal
Analyses of Herbivore Diet.” J.Wildl. Manage. 43 (2):468–73.
Focardi, S., Aragno, P., Montanaro, P. and Riga, F.. 2006. “Inter-Specific Competition
from Fallow Deer Dama Dama Reduces Habitat Quality for the Italian Roe Deer
Capreolus capreolus Italicus.” Ecography 29 (3):407–17.

59
Forsyth, D.M., Hickling, G.J. 1998. “Increasing Himalayan Tahr and Decreasing
Chamois Densities in the Eastern Southern Alps, New Zealand: Evidence for
Interspecific Competition.” Oecologia 113:377–382.
Gaillard, J-M, Hebblewhite, M., Loison, A., Fuller, M., Powell, R., Basille, M., and Van
Moorter, B. 2010. “Habitat – Performance Relationships : Finding the Right Metric at a
given Spatial Scale,” 2255–65.
Garcia, F. 2016. “Sexual Segregation in Red Deer : A Question of Food ?” Universidade
de Coimbra.
Gause, G.F. 1934. “The Struggle for Existence.” Soil Science 41 (2):159.
Gebert, C., and Verheyden-Tixier, H.. 2001. “Variations of Diet Composition of Red
Deer (Cervus elaphus L.) in Europe.” Mammal Rev 31 (3):89–201.
Georgii, B. 1980. “Home Range Patterns of Female Red Deer (Cervus elaphus L.) in
the Alps.” Oecologia 285:278–85.
Gill, R. M. A. 1990. Monitoring the Status of European and North American . GEMS
Information Series 8. Global Environment Monitoring System, United Nations
Environment Programme, Nairobi, Kenya.
Giller, P.S. 1984. Community Structure and the Niche. Outlines Studies in Ecology.
Vol. VII. Chapman and Hall, London, UK.
Godvik, I. Rivrud, M., Loe, L.E., Vik, J.O., Veiberg, V., Langvatn, R., and Mysterud,
A.. 2009. “Temporal Scales, Trade-Offs, and Functional Responses in Red Deer Habitat
Selection.” Ecology 90 (3):699–710.
González-Hernández, M.P; Silva-Pando, F.J. 1999. “Nutritional Attributes of
Understory Plants Known as Components of Deer Diets.” Society for Range
Management 52 (2):132–38.
González, J., Herrero, J., Prada, C., and Marco, J. 2013. “Changes in Wild Ungulate
Populations in Aragon , Spain between 2001 and 2010.” Galemys 25:51–57.
Gordon, I. J., and A. W. Illius. 1989. “Resource Partitioning by Ungulates on the Isle of
Rhum.” Oecologia 79 (3):383–89.
Gordon, I.J., and Illius, A.W. 1994. “The Functional-Significance of the Browser-
Grazer Dichotomy in African Ruminants.” Oecologia 98 (2):167–75.
Greenwood, B.Y.P.J. 1980. “Mating systems , philopatry and dispersal in birds and
mammals,” no. 1960:1140–62.
Guilhem, C., Bideau, E. Gérard, J.F., Khazraie, K. and Mechkour, F. 1995. “Écologie
Alimentaire D´une Population de Chevreuils (Capreolus capreolus (L.)) Introduite En
Milieu Méditerranéen.” Rev. Ecol. (Terre Vie) 50:69–84.

60
Gurnell, J., Wauters, L.A, Lurz, P.W.W., Tosi, G. 2004. “Alien Species and
Interspecific Competition: Effects of Introduced Eastern Grey Squirrels on Red Squirrel
Population Dynamics.” Journal of Animal Ecology 73:26–35.
Hall, L.S, Krausman, P.R., and Morrison, M.L. 1997. “The Habitat Concept and a Plea
for Standard Terminology.” Wildlife Society Bulletin 25 (1):173–82.
Hamel, S.S.T.K., Henden, J., Yoccoz, N.G, and Ims, R.A. 2013. “Disentangling the
Importance of Interspecific Competition , Food Availability , and Habitat in Species
Occupancy : Recolonization of the Endangered Fennoscandian Arctic Fox.” Biol
Conserv. 160:114–20.
Hanley, T.A. 1982. “The Nutritional Basis for Food Selection by Ungulates.” Journal of
Range Management 35 (2):146–51.
Hardenberg, A.V., Bassano, B., Peracino, A., Lovari, S.L. 2000. “Male Alpine Chamois
Occupy Territories at Hotspots Before the Mating Season.” Ethology 106:617–30.
Hardin, G. 1960. “The Competitive Exclusion Principle.” Science 131 (3409):1292–97.
Harestad, A.S. and Bunnel, F.L. 1979. “Home Range and Body Weight--A
Reevaluation.” Ecology 60 (2):389–402.
Harris, M.R, and Siefferman, L. 2014. “Interspecific Competition Influences Fitness
Benefits of Assortative Mating for Territorial Aggression in Eastern Bluebirds (Sialia
Sialis ).” PLoS ONE 9 (2):1–6.
Hearney, A.W., and Jennings, T.J. 1983. “Annual Foods of the Red Deer Cervus
elaphus and the Roe Deer Capreolus capreolus in the East of England.” Journal of
Zoology 201 (4):565–70.
Heurich, M., Brand, T.T.G., Kaandorp, M.Y., Šustr, P., Müller, J., and Reineking, B.
2015. “Country, Cover or Protection: What Shapes the Distribution of Red Deer and
Roe Deer in the Bohemian Forest Ecosystem?” PLoS ONE 10 (3):1–17.
Hewison, A.J.M., Vincent, J.P., and Reby, D. 1998. “Social Organization of European
Roe Deer. In: Andersen R, Duncan P, Linnell JDC (Eds) The European Roe Deer: The
Biology of Success.” Scandinavian Uni- Versity Press. Scandinavian University Press,
Oslo, Norway., 189–219.
Hewison, A.J.M., Vincent, J.P., Joachim, J., Angibault, J.M., Cargnelutti, B., and
Cibien, C. 2001. “The Effects of Woodland Fragmentation and Human Activity on Roe
Deer Distribution in Agricultural Landscapes.” Canadian Journal of Zoology 79
(4):679–89.
Hirzel, A.H., and Le Lay, G.. 2008. “Habitat Suitability Modelling and Niche Theory.”
Journal of Applied Ecology 45 (5):1372–81.

61
Hobbs, N.T, and Gordon I.J. 2010. “How Does Landscape Heterogeneity Shape
Dynamics of Large Herbivore Populations?” In Dynamics of Large Herbivore
Populations in Changing Environments: Towards Appropriate Models, edited by Owen-
Smith N, 141–64. Blackwell Publishing Ltd., Oxford, UK.
Hofmann, R.R. 1989. “Evolutionary Steps of Ecophysiological Adaptation and
Diversification of Ruminants: A Comparative View of Their Digestive System.”
Oecologia 78 (4):443–57.
Hofmann, R.R., and Stewart, D.R. 1972. “Grazer or Browser? A Classification Based
on Stomach Structure and Feeding Habits of East African Ruminants.” Mammalia 36
(2):226–40.
Holand, O., Mysterud, A., Wannag, A., and Linnell, J.D.C. 1998. “Roe Deer in
Northern Enviroments - Physiology and Behavior.” In Adersen, R., Ducan,P.,Linnell,
J.D.C. (Eds.), The European Roe Deer: The Biology of Success., 117–37. Scandinavian
Univ. Press, Oslo.
Holechek, J.L., Gross, B. 1982. “Training Needed for Quantifying Simulated Diets from
Fragmented Range Plants.” Journal of Range Management 35 (5):644–47.
Holechek, J.L. and Vavra, M. 1981. “The Effect of Slide and Frequency Observation
Numbers on the Precision of Microhistological Analysis.” Journal of Range
Management 34 (4):337–38.
Holechek, J.L., Gross, B. Dabo, S.M., and Stephenson, T. 1982. “Effects of Sample
Prepation, Growth Stage and Observer on Microhistological Analysis of Herbivore
Diets.” J.Wildl. Manage. 46 (2):502–7.
Holechek, J.L., Vavra, M., and Pieper, R.D. 1982. “Botanical Composition
Determination of Range Herbivore Diets: A Review.” Journal of Range Management 35
(3):309–15.
Holisová, V., Kozená, I., and Obrtel, R. 1984. “The Summer Food of Field Roe Bucks
(Capreolus capreolus) in the Southern Moravia.” Folia Zoologica 33 (3):193–208.
Holisová, V., Obrtel, R, and Kozená, I. 1982. “The Winter Diet of Roe Deer (Capreolus
capreolus) in the Southern Moravian Agricultural Landscape.” Folia Zoologica 31
(3):209–25.
Holisová, V., Obrtel, R, and Kozená, I. 1986. “Seasonal Variation in the Diet of Field
Roe Deer.” Folia Zoologica 35 (2):97–115.
Holt, R.D. 2003. “On the Evolutionary Ecology of Species‟ Ranges.” Evol. Ecol. Res. 5
(2):159–78.
Homolka, M. 1991. “The Diet of Capreolus capreolus in a Mixed Woodland
Environment in the Drahanska Vrchovina Highlands.” Folia Zoologica 40 (4):307–15.

62
Homolka, M. 1995. “The Diet of Cervus elaphus and Capreolus capreolus in
Deforested Areas of the Moravskoslezské Beskydy Mountains.” Folia Zoologica 44
(3):227–36.
Hutchinson, G.E. 1957. “Concluding Remarks.” In Proceedings of the Cold Spring
Harbor Symposia on Quantitative Biology- Population Studies: Animal Ecology and
Demography, XXII:415–27.
Hutchinson, G.E. 1959. “Homage to Santa Rosalia or Why Are There so Many Kinds of
Animals?” Am. Nat. 93 (870):145–59.
Illius, A.W. and Gordon, I.J. 1987. “The Allometry of Food Intake in Grazing
Ruminants.” Journal of Animal Ecology 56 (3):989–99.
Giuletti, J.D. Funes, M. O., Furlan, Z., and Ateca, N.S. 1992. “Atlas Epidérmico de
Gramíeas Del Pastizal Natural de La Provincia de San Luis, Argentina.” Agriscientia 9
(2):45–57.
Jarman, P.J. 1974. “The Social Organisation of Antelope in Relation To Their
Ecology.” Behavior 48 (1):215–67.
Jepsen, J.U, and Topping, C.J. 2004. “Modelling Roe Deer ( Capreolus capreolus ) in a
Gradient of Forest Fragmentation: Behavioral Plasticity and Choice of Cover.”
Canadian Journal of Zoology 82 (9):1528–41.
Jesus, L.C.R.C. 2002. “Contribuição Para a Gestão de Ungulados Na Serra Da Lousã.”
Coimbra.
Jiang, G., Zhang, M., and Jie, M.W. 2008. “Habitat Use and Separation between Red
Deer Cervus elaphus Xanthopygus and Roe Deer Capreolus Pygargus Bedfordi in
Relation to Human Disturbance in the Wandashan Mountains, Northeastern China.”
Wildlife Biology 14 (1):92–100.
Jie, M.W. 2017. “Limiting Factors in the Ecosystem.” Sciencing. 2017.
Johnson, D. H. 1980. “The Comparison of Usage and Availability Measurements for
Evaluating Resource Preference.” Ecology 61 (1):65–71.
Jong, C.B.de, Gill, R.M.A, van Wieren, S.E., and Burlton, F.W.E. 1995. “Diet Selection
by Roe Deer Capreolus capreolus in Kielder Forest in Relation to Plant Cover.” Forest
Ecology and Management 79 (1–2):91–97.
Jönsson, K.I. 1997. “Capital and Income Breeding as Alternative Tactics of Resource
Use in Reproduction.” Oikos 78 (1):57–66.
Jost, L. 2006. “Entropy and Diversity.” Oikos 113:363–75.

63
Kie, J.G., Ager, A.A., and Bowyer, R.T.. 2005. “Landscape-Level Movements of North
American Elk (Cervus elaphus): Effects of Habitat Patch Structure and Topography.”
Landscape Ecology 20 (3):289–300.
Kjellander, P., Hewison, A.J.M, Liberg, O., Angibault, J.M., Bideau, E. and
Cargnelutti, B. 2004. “Experimental Evidence for Density-Dependence of Home-Range
Size in Roe Deer (Capreolus capreolus L.): A Comparison of Two Long-Term
Studies.” Oecologia 139 (3):478–85.
Koda, R., and Fujita, N. 2011. “Is Deer Herbivory Directly Proportional to Deer
Population Density? Comparison of Deer Feeding Frequencies among Six Forests with
Different Deer Density.” Forest Ecology and Management 262 (3):432–39.
Koubek, P., and Zima, J. 1999. “Cervus elaphus.” In Mitchell-Jones, A. J., Amori, G.,
Bogdanowicz, W., Kryštufek, B., Reijnders, P. J. H., Spitzenberger, F., Stubbe, M.,
Thissen, J.B.M., Vohralík, V. and Zima, J. (Eds), The Atlas of European Mammals,
388–89. London, UK.: Academic Press, London, UK.
Lamberti, P., Mauri, L., and Apollonio, M. 2004. “Two Distinct Patterns of Spatial
Behavior of Female Roe Deer (Capreolus capreolus) in a Mountainous Habitat.”
Ethology Ecology & Evolution 16 (1):41–53.
Lamberti, P., Mauri, L., Merli, E., Dusi, S., and Apollonio, M. 2006. “Use of Space and
Habitat Selection by Roe Deer Capreolus capreolus in a Mediterranean Coastal Area:
How Does Woods Landscape Affect Home Range?” Journal of Ethology 24 (2):181–
88.
Lamberti, P., Rossi, I., Mauri, L., and Apollonio, M. 2001. “Alternative Use of Space
Strategies of Female Roe Deer (Capreolus capreolus) in a Mountainous Habitat.”
Italian Journal of Zoology 68 (1):69–73.
Latham, J., Staines, B.W., Gorman, M.L. 1999. “Comparative Feeding Ecology of Red
(Cervus elaphus) and Roe Deer (Capreolus capreolus) in Scottish Plantation Forests.”
Journal of Zoology (London) 247 (3):409–18.
Latham, J. 1999. “Interspecific Interactions of Ungulates in European Forests: An
Overview\r.” Forest Ecology and Management 120:13–21.
Leite, G.G., Gomes, A.C, and Neto, R.T., Neto, C.R.B. 1997. “Expansão e Senescência
de Folhas de Gramíneas Nativas Dos Cerrados Submetidas à Queima.” Pasturas
Tropicales 20 (3):16–21.
Lepš, J., and Šmilauer, P. 2003. Multivariate Analysis of Ecological Data Using
CANOCO. Cambridge University Press. Cambridge University Press.
Levi, T., Wilmers, C.C. 2012. “Wolves-Coyotes-Foxes: A Cascade among Carnivores.”
Ecology 93 (4):921–29.

64
Licoppe, A.M. 2006. “The Diurnal Habitat Used by Red Deer (Cervus elaphus L.) in
the Haute Ardenne.” European Journal of Wildlife Research 52 (3):164–70.
Lima, S.L., and Dill, L.M. 1990. “Behavioral Decisions Made under the Risk of
Predation: A Review and Prospectus.” Canadian Journal of Zoology 68 (4):619–40.
Linnell, J.D.C., Duncan, P., and Andersen, R. 1998. “The European Roe Deer: A
Portrait of a Successful Species. In: Andersen R., Duncan P., Linnell J.D.C. (Eds.). The
European Roe Deer: The Biology of Success. Scandinavian.” Scandinavian Univ. Press,
Oslo., 11–21.
Lovari, S., Herrero, J., Masseti, M., Ambarli, H., Lorenzini, R., and Giannatos, G. 2016.
“Capreolus capreolus, European Roe Deer.” The IUCN Red List of Threatened Species
8235.
Lovari, S., Ferretti, F., Corazza, M., Minder, I., Troiani, N., Ferrari, C., and Saddi, A.
2014. “Unexpected Consequences of Reintroductions: Competition between
Reintroduced Red Deer and Apennine Chamois.” Animal Conservation 17 (4):359–70.
Lovari, S., Lorenzini, R., Masseti, M., Pereladova, O., Carden, R.F., and Brook, S.M.
2016. “Cervus elaphus.” The IUCN Red List of Threatened Species 2016.
Lovari, S., Lorenzini, R., Masseti, M., Pereladova, O., Carden, R.F., and Brook, S.M.
2008. “Cervus elaphus, Red Deer Assessment.” The IUCN Red List of Threatened
Species 8235:15.
Lovari, S., and San José, C. 1997. “Wood Dispersion Affects Home Range Size of
Female Roe Deer.” Behavioral Processes 40 (3):239–41.
MacArthur, RH. 1972. Geographical Ecology: Patterns in the Distribution of Species.
New York: Harper and Row.
MacDonald, D.W. 1983. “The Ecology of Carnivoral Social Behavior.” Nature 301
(5899):379–84.
Macedo, A.L.C. 2015. “Monitorização Das Populações de Ungulados Da Tapada
Nacional de Mafra.”
Maia, M.J., Rego, F., Machado, F.S. 2003. “Determining Optimal Sampling Schemes to
Study Red Deer Diets by Fecal Analysis.” Silva Lusitana 11 (1):91–99.
Maillard, D., and Picard, J.F. 1987. “Le Régime Alimentaire Automnal et Hivernal Du
Chevreuil (Capreolus capreolus), Dans Une Hêtraie Calcicole, Déterminé Par L´analyse
Des Contenus Stomacaux.” Gibier Faune Sauvage 4:1–30.
Maizeret, C., Boutin, J.M., and Sempéré, A. 1986. “Intérêt de La Méthode
Micrographique D´analyse Des Fêces Pour L´étude Du Régime Alimentaire Du
Chevreuil (Capreolus capreolus).” Gibier Faune Sauvage 3:159–83.

65
Maizeret, C., and Sung, T.M. 1984. “Etude Du Régime Alimentaire et Recherche Du
Déterminisme Fonctionnel de La Sélectivié Chez Le Chevreuil Des Landes de
Gascogne.” Gibier Faune Sauvage 3:63–103.
Mancinelli, S., Peters, W., Boitani, L., Hebblewhite, M., and Cagnacci, F. 2015. “Roe
Deer Summer Habitat Selection at Multiple Spatio-Temporal Scales in an Alpine
Environment.” Hystrix 26 (2):132–40.
Manly, B.F.J., Lyman, L., McDonald, D.L., Thomas, T.L., McDonald, and Wallace,
P.E. 2002. “Resource Selection by Animals: Statistical Design and Analysis for Field
Studies,” 220.
Marques, F.F.C., Buckland, S.T., Goffin, D., Dixon, C.E., Borchers, D.L., Mayle, B.A.
and Peace, A.J. 2001. “Estimating Deer Abundance from Line Transect Surveys of
Dung: Sika Deer in Southern Scotland.” Journal of Applied Ecology 38 (2):349–63.
Mayle, B.A., Peace, A.J., and Gill, R.M.A. 1999. “How Many Deer? ” A Field Guide to
Estimating Deer Population Size. Forestry Commission, Edinburgh.
Mayr, E. 1942. “Systematics and Origin of Species.” Columbia University Press, New
York.
McNab, B.K. 1963. “McNab , B . K . Bioenergetics and The.” Am. Nat. 97
(January):133–40.
Melis, C., Jȩdrzejewska, B., Apollonio, M., Bartoń, K.A., Jȩdrzejewski, W., Linnell,
J.D.C., Kojola, I. 2009. “Predation Has a Greater Impact in Less Productive
Environments: Variation in Roe Deer, Capreolus capreolus, Population Density across
Europe.” Global Ecology and Biogeography 18 (6):724–34.
Milne, J.A., MacRae, J.C., Spence, A.M, and Wilson, S. 1978. “A Comparison of the
Voluntary Intake and Digestion of a Range of Forages at Different Times of the Year by
the Sheep and the Red Deer.” British Journal of Nutrition 40:347–57.
Minder, I. 2012. “Local and Seasonal Variations of Roe Deer Diet in Relation to Food
Resource Availability in a Mediterranean Environment.” European Journal of Wildlife
Research 58 (1):215–25.
Mitchell, B., Rowe, J.J., Ratcliffe, P., and Hinge, M. 1985. “Defecation Frequency in
Roe Deer (Capreolus capreolus) in Relation to the Accumulation Rates of FecalFecal
Deposits.” Journal of Zoology 207 (1):1–7.
Murray, M.G. and Illius, A.W. 1996. “Multispecies Grazing in the Serengeti.” In
Hodgson, J. and Illius, A. W. (Eds), The Ecology and Management of Grazing Systems.
CAB International, 247–272.
Murray, M.G., Illius, A.W. 2000. “Vegetation Modification and Resource Competition
in Grazing Ungulates.” Oikos 89:501–8.

66
Mysterud, A. 1996. “Bed-Site Selection by Adult Roe Deer Capreolus capreolus in
Southeast- Ern Norway during Summer.” Wildlife Biology 2:101–6.
Mysterud, A. 1999. “Seasonal Migration Pattern and Home Range of Roe Deer
(Capreolus capreolus) in an Altitudinal Gradient in Southern Norway.” Journal of
Zoology 247:479–86.
Mysterud, A., and Ostbye, E. 1999. “Cover as a Habitat Element for Temperate
Ungulates: Effects on Habitat Selection and Demography.” Wildlife Society Bulletin 27
(2):385–94.
Nabuurs, G.J. 1996. “Quantification of Herb Layer Dynamics under Tree Canopy.”
Forest Ecology and Management 88 (1–2):143–48.
Namgail, T., Mishra C., de Jong C.B., van Wieren, S.E., Prins, H.H.T. 2009. “Effects of
Herbivore Species Richness on the Niche Dynamics and Distribution of Blue Sheep in
the Trans-Himalaya.” Divers Distrib. 15:940–47.
Oliveira, J. 2013. “Dieta de veado na Serra da Lousã: uma questão de sexo? ”. MSc
thesis, University of Coimbra, Coimbra, Portugal.
Owen-Smith, N., Novellie, P. 1982. “What Should a Clever Ungulate Eat?” The
American Naturalist 119:151–78.
Owen-Smith, N. 1985. “Owen-Smith, N. 1985. Niche Separation among African
Ungulates.” In Vrba, E. S. (Ed.), Species and Speciation. Transvaal Mus. Monogr. No.
4. Pretoria, 167–71.
Owen-Smith, N. 1989. “Morphological Factors and Their Consequences for Resource
Partitioning among African Savanna Ungulates: A Simulation Modelling Approach.” In
Morris, D. W., Abramsky, Z., Fox, B. J. and Willig, M. R. (Eds), Patterns and Structure
of Mammalian Communities. Texas Tech Univ. Press, 155–65.
Owen-Smith, N. 2002. Adaptive Herbivore Ecology: From Resources to Populations in
Varaible Environments. Cambridge Studies in Ecology. Vol. 110. Cambridge
University Press, New York.
Panzacchi, M., Linnell, J.D.C., Odden, M., Odden, J., and Andersen, R. 2009. “Habitat
and Roe Deer Fawn Vulnerability to Red Fox Predation.” Journal of Animal Ecology
78:1124–33.
Panzacchi, M., Herfindal, I., Linnell, J.D.C., Odden, M., Odden, J., and Andersen, R.
2010. “Trade-Offs between Maternal Foraging and Fawn Predation Risk in an Income
Breeder.” Behavioral Ecology and Sociobiology 64 (8):1267–78.
Pautasso, M. 2007. “Scale Dependence of the Correlation between Human Population
Presence and Vertebrate and Plant Species Richness.” Ecology Letters 10 (1):16–24.

67
Peek, J.M., Scott, M.D., Nelson, L.J., and Pierce, J.D. 1982. “Role of Cover in Habitat
Management for Big Game in Northwestern United States.” Trans. North Am. Wildl.
Nat. Res. Conf. 47:363–73.
Peters, R.H., and Wassenberg, K. 1983. “The Effect of Body Size on Animal
Abundance.” Oecologia 60 (1):89–96.
Pianka, E.R. 1973. “The Structure of Lizard Communities.” Annual Review of Ecology
and Systematics 4:53–74.
Pielou, E.C. 1966. “The Measurement of Diversity in Different Types of Biological
Collections.” Journal of Theoretical Biology 13:131–44.
Poulton, E.B. 1904. “What Is a Species?” In Proc. Entomol. Soc. Lond., lxxvii–cxvi.
Prins, H.H.T. and Olff, H. 1998. “Species Richness of African Grazer Assemblages:
Towards a Functional Explanation.” In In: Newbury, D. M., Prins, H. H. T. and Brown,
N. D. (Eds), Dynamics of Tropical Communities. Blackwell Science., 449–490.
Prokešová, J. 2004. “Red Deer in the Floodplain Forest: The Browse Specialist?” Folia
Zoologica 53 (3):293–302.
Prokešová, J, Barančeková, M., and Homolka, M. 2006. “Density of Red and Roe Deer
and Their Distribution in Relation to Different Habitat Characteristics in a Floodplain
Forest.” Folia Zoologica 55 (1):1–14.
Putman, R.J., and Staines, B.W. 2004. “Supplementary Winter Feeding of Wild Red
Deer Cervus elaphus in Europe and North America: Justifications, Feeding Practice and
Effectiveness.” Mammal Review 34 (4):285–306.
Putman, R.J. 1996. “Competition and Resource Partitioning in Temperate Ungulate
Assemblies” 49 (0):131.
Putman, R.J. 1986. “Competition and Coexistence in a Multi-Species Grazing System.”
Competition and Coexistence in a Multi-Species Grazing System 13 (21):271–291.
Qviller, L., Risnes-Olsen, N., Bærum, K.M., Meisingset, E.L., Loe, L.E., Ytrehus, B.,
Viljugrein, H., and Mysterud, A. 2013. “Landscape Level Variation in Tick Abundance
Relative to Seasonal Migration in Red Deer.” PLoS ONE 8 (8).
Raven, P.H., Evert, R.F., and Eichhorn, S.E. 1992. Biology of Plants. 5th editio. New
York, N.Y. : Worth Publishers, c1992.
Raye, G., Miquel, C., Coissac, E., Redjadj, C., and Loison, A. 2011. “New Insights on
Diet Variability Revealed by DNA Barcoding and High-Throughput Pyrosequencing:
Chamois Diet in Autumn as a Case Study.” Ecological Research 26 (2):265–76.
Razgour, O., Korine, C., and Saltz, D. 2011. “Does Interspecific Competition Drive
Patterns of Habitat Use in Desert Bat Communities?” Oecologia 167:493–502.

68
Richard, E., Said, S., Hamann, J-L., and Gaillard, J-M. 2011. “Toward an Identification
of Resources Influencing Habitat Use in a Multi-Specific Context” 6 (12):1–9.
Richard, E., Said, S., Hamann, J-L., and Gaillard, J-M. 2014. “Daily, Seasonal, and
Annual Variations in Individual Home-Range Overlap of Two Sympatric Species of
Deer.” Canadian Journal of Zoology 92 (10):853–59.
Rivrud, I.M., Loe, L.E., and Mysterud, A. 2010. “How Does Local Weather Predict Red
Deer Home Range Size at Different Temporal Scales?” Journal of Animal Ecology 79
(6):1280–95.
Robbins, C.T., Spalinger, D.E., and van Hoven, W. 1995. “Adaptation of Ruminants to
Browse and Grass Diets: Are Anatomical-Based Browser-Grazer Interpretations
Valid?” Oecologia 103 (2):208–13..
Robertson, O.J, Mcalpine, C., House, A., and Maron, M. 2013. “Influence of
Interspecific Competition and Landscape Structure on Spatial Homogenization of Avian
Assemblages.” PLoS ONE 8 (5):1–8.
Ruckstuhl, K. and Neuhaus, P., 2005.“Sexual segregation in vertebrates”. Cambridge
University Press.
Said, S., and Servanty, S. 2005. “The Influence of Landscape Structure on Female Roe
Deer Home Range Size.” Landscape Ecology 20:1003–12.
Saïd, S., Bourgoin, G., Gaillard, J-M., and Widmer, O. 2009. “What Shapes Intra-
Specific Variation in Home Range Size ? A Case Study of Female Roe Deer,” no.
February:1299–1306.
Saïd, Sonia, Gaillard, J-M., Duncan, P., Guillon, N., Guillon, N., Servanty, S., Pellerin,
M., Lefeuvre, K., Martin, C., and Van Laere, G. 2005. “Ecological Correlates of Home-
Range Size in Spring–summer for Female Roe Deer ( Capreolus capreolus ) in a
Deciduous Woodland.” Journal of Zoology 267 (03):301.
Saïd, S., Gaillard J-M., Widmer, O., Débias, F., Bourgoin, G., Delorme, D., and Roux,
C. 2009. “What Shapes Intra-Specific Variation in Home Range Size? A Case Study of
Female Roe Deer.” Oikos 118 (9):1299–1306.
Salazar, D.C. 2009. “Distribuição e Estatuto Do Veado e Corço Em Portugal.” Biology
Department MSc in Eco:101.
San José, C, Braza, F., Aragon, S., and Delibes, J R. 1997. “Habitat Use by Roe and
Red Deer in Southern Spain.” Miscellania Zoologica 20 (8):27–38.
Sanders, K.D., Dahl, B.E. and Scott, G. 1980. “Bite-Count vs Fecal Analysis for Range
Animal Diets.” Journal of Range Management, 146–49.
Schoener, T.W. 1971. “Theory of Feeding Strategies.” Annual Review of Ecology and
Systematics . 2 (1971):369–404.
69
Schoener, T.W. 1982. “The Controversy over Interspecific Competition.” American
Scientist 70:586–95.
Schoener, T.W. 1974. “Resource Partitioning in Ecological Communities.” Science
(New York, N.Y.) 185 (4145):27–39.
Schoener, T.W. 1970. “Nonsynchronous spatial overlap of lizards.” Ecology 51:408–18.
Schwartz, C.C, and Ellis, J.E. 1981. “Feeding Ecology and Niche Separation in Some
Native and Domestic Ungulates on the Shortgrass Prairie.” The Journal of Applied
Ecology 18 (2):343–53.
Sempéré, A.J., Sokolov, V.E., and Danilkin, A.A. 1996. “Capreolus capreolus.”
Mammalian Species 538:1–9.
Senft, R.L., Coughenour, M. B., Bailey, D. W., Rittenhouse, L. R., Sala, O. E., and
Swift, D.M. 1987. “Large Herbivore Foraging and Ecological Hierarchies.” BioScience
37 (11):789–99.
Shackleton, D.M., and Bunnell, F.L. 1987. “Natural Factors Affecting Productivity of
Mountain Ungulates: A Risky Existence?” In Proceedings of the Conference on the
Reintroduction of Predators in Protected Areas, 46–56. Torino (Italy).
Shannon, C.E. 2001. “A Mathematical Theory of Communication.” Acm Sigmobile
Mobile Computing and Communications Review, 5 (1):3–55.
Shrestha, R., and Wegge, P. 2006. “Determining the Composition of Herbivore Diets in
the Trans-Himalayan Rangelands: A Comparison of Field Methods.” Rangeland
Ecology and Management 59 (5):512–18.
Sinclair, A.R.E., and Norton-Griffiths, M. 1982. “Does Competition or Facilitation
Regulate Migrant Ungulate Populations in the Serengeti? A Test of Hypotheses.”
Oecologia 53 (3):364–69.
Sinclair, A.R.E. 1985. “Does Interspecific Competition or Predation Shape the African
Ungulate Community?” Journal of Animal Ecology 54 (3):899–918.
Siuda, A., Ţurowski, W., and Siuda, H. 1969. “The Food of the Roe Deer.” Acta
Theriologica 14:247–262.
Smith, J.N.M., Grant, P.R., Grant, B.R., Abbott, I.J., and Abbott, L.K. 1978. “Seasonal
Variation in Feeding Habits of Darwin‟s Ground Finches.” Ecology 59 (6):1137–50.
Sparks, D.R, and Malechek, J.C. 1968. “Estimating Percentage Dry Weight in Diets
Using a Microscopic Technique.” Journal of Range Management 21 (4):264–65.
Spellerberg, I., and Fedor, P. 2003. “A Tribute to Claude Shannon (1916–2001) and a
Plea for More Rigorous Use of Species Richness, Species Diversity and the ‟Shannon–
Wiener‟Index.” Global Ecology and Biogeography 12 (3):177–79.

70
Stage, A.R, and Salas, C. 2007. “Composition and Productivity.” Society of American
Foresters 53 (208):486–92.
Stearns, S. 1992. The Evolution of Life Histories. Oxford University Press. Oxford.
Storms, D., Aubry, P., Hamann, J-L., Saïd, S., Hervé, F., Saint-Andrieux, C., and Klein,
F. 2008. “Seasonal Variation in Diet Composition and Similarity of Sympatric Red
Deer Cervus elaphus and roe der Capreolus capreolus.” Wildlife Biology 14 (2):237-
250.
Stubbe, C. 1999. “Capreolus capreolus.” In Mitchell-Jones, A.J., Amori, G.,
Bogdanowicz, W., Kryštufek, B., Reijnders, P. J. H., Spitzenberger, F. Stubbe, M.,
Thissen J.B.M., Vohralík, V., and Zima, J. (Eds), The Atlas of European Mammals,
Academic Press, London. London, UK.
Suter, W., Suter, U., Krüsi, B., and Schütz, M. 2004. “Spatial Variation of Summer Diet
of Red Deer Cervus elaphus in the Eastern Swiss Alps.” Wildlife Biology 10 (1):43–50.
Szemethy, L., Mátrai, K., Katona, K. and Orosz, S. 2003. “Seasonal Home Range Shift
of Red Deer Hinds, Cervus elaphus: Are There Feeding Reasons?” Folia Zoologica 52
(3):249–58.
Szemethy, L., Mátrai, K., Katona, K., and Orosz, S. 2003. “Seasonal Home Range Shift
of Red Deer Hinds, Cervus elaphus: Are There Feeding Reasons?” Folia Zoologica 52
(3):249–58.
Tafoya, J.J., Howard, V.W. Jr., and Boren, J.C. 2001. “Diets of Elk, Mule Deer and
Coues White-Tailed Deer on Fort Bayard in Southwestern New Mexico.”
Tellería, J.L., and Virgós, E. 1997. “Distribution of an Increasing Roe Deer Population
in a Fragmented Mediterranean Landscape.” Ecography 20 (3):247–52.
Thomas, D.L., Taylor, E.J. 2006. “Study Designs and Tests for Comparing Resource
Use and Availability II.” Journal of Wildlife Management 70 (2):324–36.
Tixier, H., and Duncan, P. 1996. “Are European Roe Deer Browsers? A Review of
Variations in the Composition of Their Diets.” Revue d‟Ecologie (La Terre et La Vie)
51 (1):3–17.
Tokeshi, M. 1999. Species Coexistence: Ecological and Evolutionary Perspectives.
Blackwell, Oxford.
Toral, M., Manríquez, A., Navarro-Cerrillo, R., Tersi, D., and Naulin, P. 2010.
“Características de Los Estomas, Densidad e Índice Estomático En Secuoya (Sequoia
Sempervirens) y Su Variación En Diferentes Plantaciones de Chile.” Bosque (Valdivia)
31 (2):157–64.
71
Torres, R.T., Virgós, E., Santos, J., Linnell, J.D.C, and Fonseca, C. 2012a. “Habitat Use
by Sympatric Red and Roe Deer in a Mediterranean Ecosystem.” Animal Biology 62
(3):351–66.
Torres, R.T., Miranda, J., Carvalho, J., and Fonseca, C. 2015. “Expansion and Current
Status of Roe Deer (Capreolus capreolus) at the Edge of Its Distribution in Portugal.”
Annales Zoologici Fennici 52 (5–6):339–52.
Torres, R.T., Miranda, J., Carvalho, J., and Fonseca, C. 2014. “Factors Influencing Red
Deer Occurrence at the Southern Edge of Their Range: A Mediterranean Ecosystem.”
Mammalian Biology 79 (1). Elsevier GmbH:52–57.
Torres, R.T., Santos, J., Linnell, J.D.C., Virgós, E., and Fonseca, C. 2011. “Factors
Affecting Roe Deer Occurrence in a Mediterranean Landscape, Northeastern Portugal.”
Mammalian Biology 76 (4):491–97.
Torres, R. T., Virgós, E., Panzacchi, M., Linnell, J.D.C., and Fonseca, C. 2012b. “Life
at the Edge: Roe Deer Occurrence at the Opposite Ends of Their Geographical
Distribution, Norway and Portugal.” Mammalian Biology 77 (2). Elsevier GmbH:140–
46.
Valentini, A., Miquel, C., Nawaz, M.A, Bellemain, E., Coissac, E., Pompanon, F.,
Gielly, L., Cruaud, C., Nascetti, G., Wincker, P., Swenson, J.E., and Taberlet, P. 2009.
“New Perspectives in Diet Analysis Based on DNA Barcoding and Parallel
Pyrosequencing: The TrnL Approach.” Mol Ecol Resour 9:51–60.
Vanak, A.T., Fortin, D., Thaker, M., Ogden, M., Owen, C., Greatwood, S., Slotow, R.
2013. “Moving to Stay in Place: Behavioral Mechanisms for Coexistence of African
Large Carnivores.” Ecology 94::2619–2631.
Van Soest, P.J.1996. “Allometry and Ecology of Feeding Behavior and Digestive
Capacity in Herbivores: A Review.” Zoo Biology 15 (5):455–79.
Vavra, M., and Holechek, J. L. 1980. “Factors Influencing Microhistologial Analysis of
Herbivore Diets.” Journal of Range Management 33 (5):317–73.
Vingada, J.V., Ferreira, A., Keating, A., Sousa, J. P., Eira, C., Fonseca, C., Faria, M.,
Soares, M., Loureiro, S., Sendim, R., Ferreira, S., and Soares, A.M.V.M. 1997.
“Conservação Do Lobo (Canis Lupus) Em Portugal - Fomento e Conservação Das
Principais Presas Naturais Do Lobo (Canis Lupus Signatus).” Coimbra.
Vingada, J., Fonseca, C., Cancela, J., Ferreira, J., and Eira, C. 2010. Ungulates and
Their Management in Portugal. European Ungulates and Their Management in the 21st
Century.
Virgós, E, and Tellería, J.L. 1998. “Roe Deer Habitat Selection in Spain: Constraints on
the Distribution of a Species.” Canadian Journal of Zoology 76 (7):1294–99.

72
Voth, E.H., and Black, H.C. 1973. “A Histologic Tecnhique for Determining Feeding
Habitats of Small Herbivores.” J.Wildl. Manage. 37 (2):223–31.
Wahlstrom, L.K., and Kjellander, F. 1995. “Ideal Free Distribution and Natal Dispersal
in Female Roe Deer.” Oecologia 103 (3):302–8.
Walter, W.D., Beringer, J., Hansen, L.P., Fischer, J.W., Millspaugh, J.J., and
Vercauteren, K.C. 2011. “Factors Affecting Space Use Overlap by White-Tailed Deer
in an Urban Landscape.” International Journal of Geographical Information Science 25
(3):379–92.
Wiens, J.A. 1989. “Spatial Scaling in Ecology Spatial Scaling in Ecology1.” Source:
Functional Ecology 3 (4):385–97.
Wiens, J.A. 1977. “On Competition and Variable Environments: Populations May
Experience „Ecological Crunches‟ in Variable Climates, Nullifying the Assumptions of
Competition Theory and Limiting the Usefulness of Short-Term Studies of Population
Patterns.” American Scientist 65 (5):590–97.
Wiens, J.A. 1993. “Fat Times, Lean Times and Competition among Predators.” Trends
in Ecology and Evolution 8 (10):348–49.
Wieren, S.E.V. 1996. Digestive Strategies in Ruminants and Nonruminants.
Dissertation.
Wildash, H. 1951. “Roe Deer in Austria.” Journal of Forestry Commission 22:122–25.
Wilson, D.E., and Reeder, D.M. 2005. Mammal Species of the Word: A Taxonomic and
Geographic Reference. 3rd editio. Johns Hopkins University Press, Baltimore.
Wilson, D.E., and Mittermeier, R.A. 2011. Handbook of the Mammals of the World-
Volume 2. Edited by Don E. Wilson and Russell A. Mittermeier. Lynx Edicions,
Barcelona, Spain.: Hoofed mammals.
Wilson, D.E., and Ruff, S. 1999. The Smithsonian Book of North American Mammals.
Smithsonian Institution Press, Washington, DC, USA.
Zhang, M., Liu, Z., and Teng, L. 2013. “Winter and Spring Habitat Selection of Red
Deer (Cervus elaphus Alxaicus) in the Helan Mountains, China.” Zoologia 30 (1):24–
34.