Embed Size (px)
Citation preview
Ministério da Agricultura, Pecuária e Abastecimento
Anuário Estatístico da
Agroenergia2012
Statistical Yearbook of Agrienergy

Ministério da Agricultura, Pecuária e Abastecimento
Secretaria de Produção e Agroenergia
Brasília/ DF
2013
Promover o desenvolvimento sustentável e a competitividade do agronegócio em
benefício da sociedade brasileira.
Missão do Mapa
Anuário Estatístico da
Agroenergia2012
Statistical Yearbook of Agrienergy

©2013 Ministério da Agricultura, Pecuária e Abastecimento Todos os direitos reservados. Permitida a reprodução desde que citada a fonte.A responsabilidade pelos direitos autorais de textos e imagens desta obra é do autor.
4ª edição. Ano 2013Tiragem: 10.000 exemplares
Elaboração, distribuição e informações:MINISTÉRIO DA AGRICULTURA, PECUÁRIA E ABASTECIMENTOSecretaria de Produção e AgroenergiaDepartamento de Cana-de-açúcar e Agroenergia
Esplanada dos Ministérios, Bloco D, 7º andar, sala 726CEP: 70043-900, Brasília/DFTel.: (61) 3218-2956Fax.: (61) 3322-0337www.agricultura.gov.bre-mail: [email protected]
Equipe Técnica: Antônio Carlos de Oliveira Lima, Cid Jorge Caldas, Fernanda Hastenrreiter Saraiva, Gabriela de França Menezes, João da Silva Abreu Neto, José Gerardo Fontelles, Leda Laboissiére, Leonardo Freire de Aguiar Cavalcante, Luís Carlos Mavignier de Araújo Job, Moacyr Faustino Júnior, Tiago Quintela Giuliani
Central de Relacionamento: 0800 704 1995Coordenação Editorial: Assessoria de Comunicação Social
Catalogação na FonteBiblioteca Nacional de Agricultura – BINAGRI
Brasil. Ministério da Agricultura, Pecuária e Abastecimento.Anuário estatístico de agroenergia 2012: statistical
yearbook of agrienergy / Ministério da Agricultura, Pecuária e Abastecimento. Secretaria de Produção e Agroenergia. Bilíngüe. – Brasília : MAPA/ACS, 2013.
284 p.
ISBN 978-85-7991-070-8
1. Cana de açúcar. 2. Produção agrícola. 3. Combustível. 4. Agroenergia. I. Secretaria de Produção e Agroenergia. II. Título.
AGRIS P05CDU 633.61

Prefácio | 5
1. Cana-de-açúcar / Sugarcane | 7
2. Etanol / Ethanol | 29
3. Açúcar / Sugar | 60
4. Oleaginosas / Oilseeds | 1684.1 Soja / Soybean | 1694.2 Palma de Óleo / Palm Oil | 1834.3 Girassol / Sunflower | 1924.4 Algodão / Cotton | 2034.5 Amendoim / Peanuts | 2214.6 Mamona / Castorbean | 2344.7 Canola / Rapeseed | 246
5. Biodiesel / Biodiesel | 254
6. Florestas Energéticas / Energy Forests | 2676.2 Carvão vegetal / Wood charcoal | 2696.3 Lenha / Firewood | 275
Siglas / Acronyms | 282
SUMÁRIO


Anuário Estatístico da Agroenergia – 2012 5
Prefácio
Esta é a quarta edição do Anuário Estatístico da Agroenergia, que, desta vez, refere-se a dois anos, apresentando as versões 2011 e 2012 em conjunto. Além disso, o Anuário Estatístico da Agroenergia 2011/2012 traz mais novidades. Nesta edição foi incluído um novo segmento agroenergético de grande importância econômica e ambiental – as Florestas Energéticas. Seus produtos são o carvão vegetal, a lenha e os resíduos decorrentes de outros aproveitamentos, por exemplo, serragem, cascas, sobras, que podem ser transformados em pellets e briquetes, ou queimados diretamente, possibilitando a geração de energia limpa e renovável.
O mais recente Balanço Energético Nacional (BEN) 2011, publicado pela Empresa de Pesquisa Energética, indica que a lenha e o carvão vegetal corresponderam a aproximadamente 10% da oferta interna de energia em 2010, o que ressalta a relevância do segmento.
Do ponto de vista da sustentabilidade, as florestas plantadas no Brasil têm sido uma grande aliada, proporcionando a recuperação de áreas degradadas, a redução da pressão sobre as florestas primárias, e dando grande contribuição para a redução de gases de efeito estufa (GEE), seja através do sequestro de carbono, seja pela substituição de carvão mineral na atividade siderúrgica.
Para o produtor, trata-se de mais uma oportunidade de investimento de longo prazo, permitindo a diversificação de atividades na propriedade, além das possibilidades relacionadas à prestação de serviços ambientais por meio da Redução de Emissões por Desmatamento e Degradação (REDD+), e o Mecanismo de Desenvolvimento Limpo (MDL) do Protocolo de Quioto, tudo em absoluta consonância com o Plano Nacional sobre Mudança do Clima e o cumprimento das metas estabelecidas em razão dos compromissos voluntários assumidos pelo Brasil na 15ª Conferência da ONU sobre Clima (COP-15).
Outra novidade foi a inclusão das informações sobre mais uma oleaginosa, a canola (colza), matéria-prima mais abundante na produção de biodiesel na Europa, e que no Brasil começa a ganhar destaque pelo aumento de área plantada e de produção, fruto de ações conjuntas entre os setores público e privado. Por solicitação da Secretaria de Produção e Agroenergia do Ministério da Agricultura, Pecuária e Abastecimento (Mapa), desde a safra 2009/2010 a canola consta do levantamento de safra de grãos da Companhia Nacional de Abastecimento (Conab), permitindo o acompanhamento da sua evolução, de grande utilidade à formulação das políticas públicas com foco na cultura.
Também pela primeira vez, o anuário traz os dados referentes aos estoques nacionais de etanol. Com a posição dos estoques no início de cada mês é possível acompanhar o movimento desse biocombustível ao longo do ano, principalmente no período de entressafra. Há, ainda, o detalhamento dos dados sobre a cana-de-açúcar, etanol e açúcar, tornando-os mensais. Assim, será possível entender o comportamento da indústria e a produção agrícola no país, que possui, em um determinado período do ano, duas safras paralelas de cana.
Assim, o Mapa renova seu compromisso de melhorar a qualidade e o acesso às informações, de forma a contribuir com o setor produtivo, universidades, institutos de pesquisa, entidades representativas, associações, sindicatos e demais interessados, além dos próprios agentes públicos na gestão e elaboração de políticas públicas voltadas para a ampliação e melhoria da agroenergia nacional.
Ministério da Agricultura, Pecuária e AbastecimentoSecretaria de Produção e Agroenergia
Departamento de Cana-de-açúcar e Agroenergia


Cana-de-açúcarSugarcane
01
Ministério da Agricultura, Pecuária e Abastecimento8
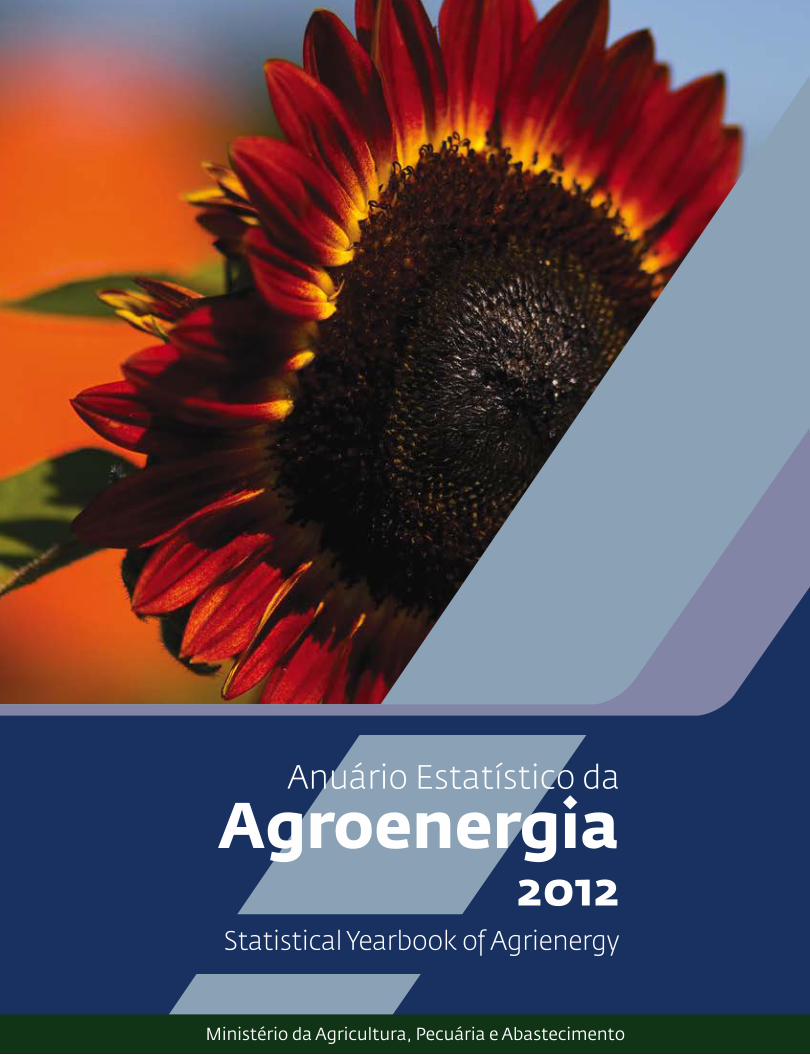
1.1 Informações técnicas 1.1 Technical information
Tabela 1 – Informações técnicas da culturaTable 1 – Technical information of sugarcane
ItemItem
Dado Data
Ciclo (Cycle) 5 anos (years)
Número médio de cortes (Average number of cuts) 5 cortes (cuts)
Produtividade de cana (Sugarcane productivity) 85 ton/ha (120 - 65)
Rendimento de açúcar (Sugar yield) 138 kg/ton
Rendimento de álcool (Ethanol yield) 82 l/ton
Cultivares registrados no Mapa (Cultivars registered in Mapa)
124 (Saccharum L.) 4 (Saccaharum Officinarum L.)
Defensivos registrados no Mapa (Registered pesticides in Mapa)
282
Poder calorífico etanol anidro (Ethanol anhydrous heating value)
6.750 kcal/kg
Poder calorífico etanol hidratado (Ethanol hydrous heating value)
6.300 kcal/kg
Balanço energético do biocombustível (Biofuel energy balance)
1 : 9,3
Fonte (Source): Mapa; Embrapa; Unicamp; EPE.

Anuário Estatístico da Agroenergia – 2012 9
1.2 Produção – Evolução da produção de cana-de-açúcar no Brasil
1.2 Production – Evolution of the Brazilian sugarcane production
Tabela 2 – Produção brasileira de cana-de-açúcar para produção de açúcar e álcool, por safraTable 2 – Brazilian sugarcane production destined for the sugar and ethanol production, by harvest
SafraCrop Year
Cana moída em toneladas Crushed cane ton
PrópriaOwn
Fornecedores Suppliers
Total
1948/49 8.535.270 7.132.275 15.667.545 1949/50 7.394.756 6.045.707 13.440.463 1950/51 8.467.081 7.015.495 15.482.576 1951/52 8.864.129 8.092.711 16.956.840 1952/53 10.456.212 9.663.392 20.119.604 1953/54 11.039.010 11.020.875 22.059.885 1954/55 11.927.865 11.740.239 23.668.104 1955/56 12.363.419 11.215.694 23.579.113 1956/57 12.904.617 11.473.705 24.378.322 1957/58 15.242.603 14.651.216 29.893.819 1958/59 18.265.420 17.977.932 36.243.352 1959/60 16.796.425 17.593.212 34.389.637 1960/61 18.562.728 17.985.706 36.548.434 1961/62 18.396.369 18.049.227 36.445.596 1962/63 16.770.034 16.546.518 33.316.552 1963/64 17.330.143 18.078.427 35.408.570 1964/65 19.099.902 20.827.056 39.926.958 1965/66 21.835.202 28.341.537 50.176.739 1966/67 22.306.610 25.040.441 47.347.051 1967/68 23.111.411 24.942.968 48.054.379 1968/69 22.737.438 20.864.127 43.601.565 1969/70 24.431.823 22.554.070 46.985.893 1970/71 29.697.915 27.379.496 57.077.411 1971/72 31.125.873 29.409.270 60.535.143 1972/73 33.801.108 34.068.950 67.870.058 1973/74 38.113.739 37.725.059 75.838.798 1974/75 39.312.756 35.195.887 74.508.643 1975/76 37.193.882 31.128.737 68.322.619 1976/77 44.921.579 42.905.085 87.826.664 1977/78 54.115.697 50.518.098 104.633.795 1978/79 52.675.183 54.951.194 107.626.377 1979/80 59.373.178 53.272.245 112.645.423 1980/81 65.295.196 58.385.401 123.680.597 1981/82 65.114.308 67.772.034 132.886.342 1982/83 79.765.724 86.412.868 166.178.592
(Continua / Continues)

Ministério da Agricultura, Pecuária e Abastecimento10
SafraCrop Year
Cana moída em toneladas Crushed cane ton
PrópriaOwn
Fornecedores Suppliers
Total
1983/84 96.404.041 100.338.900 196.742.941 1984/85 125.086.483 77.781.272 202.867.755 1985/86 139.979.016 83.227.251 223.206.267 1986/87 141.110.125 86.765.721 227.875.846 1987/88 143.171.908 81.325.642 224.497.550 1988/89 132.062.628 88.041.752 220.104.380 1989/90 133.741.406 89.160.937 222.902.343 1990/91 133.457.496 88.971.664 222.429.160 1991/92 137.533.346 91.688.897 229.222.243 1992/93 134.075.920 89.383.946 223.459.866 1993/94 123.921.310 82.614.206 206.535.516 1994/95 144.520.675 96.347.116 240.867.791 1995/96 144.697.685 105.178.890 249.876.575 1996/97 200.140.178 89.380.344 289.520.522 1997/98 206.717.827 95.480.689 302.198.516 1998/99 215.444.887 100.195.910 315.640.797 1999/00 211.352.494 98.770.290 310.122.784 2000/01 173.559.726 81.361.995 254.921.721 2001/02 191.936.935 100.392.206 292.329.141 2002/03 200.894.322 115.227.428 316.121.750 2003/04 228.428.646 128.682.237 357.110.883 2004/05 230.724.931 150.722.171 381.447.102 2005/06 232.462.389 150.019.613 382.482.002 2006/07 260.690.582 168.126.339 428.816.921 2007/08 284.567.712 211.275.480 495.843.192 2008/09 317.180.234 255.558.255 572.738.489 2009/10 342.577.133 258.853.957 601.431.090 2010/11 372.911.547 251.036.066 623.947.613 2011/12* 332.931.849 227.523.811 560.455.660
Fonte (Source): Mapa.Nota: *Dados apurados em 15/05/2012.
*Data value at May 15, 2012.Obs.: Estimativa com base na origem da cana-de-açúcar destinada à produção de açúcar: safras
1978/79, 1981/82, 1982/83, 1983/84.Estimated based in sugarcane destined to sugar production: harvest 1978/79, 1981/82, 1982/83 and 1983/84.Estimativa (60% fornecedores e 40% própria) com base nos dados das safras anteriores e posteriores ao período: safras 1988/89,1989/90,1990/91,1991/92,1992/93,1993/94 e 1994/95.Estimated data (60% suppliers and 40% production) based in the numbers from previous and posterior harvests 1988/89,1989/90,1990/91,1991/92,1992/93,1993/94 and 1994/95.
(Continuação / Continued)

Anuário Estatístico da Agroenergia – 2012 11
Gráfico 1 – Evolução da produção brasileira de cana-de-açúcarChart 1 – Evolution of the Brazilian sugarcane production
-
100
200
300
400
500
600
700
Milh
ões
de
ton
elad
as
Mill
ion
to
ns
Safras / Harvests
1948
/49
1950
/51
1952
/53
1954
/55
1956
/57
1958
/59
1960
/61
1962
/63
1964
/65
1966
/67
1968
/69
1970
/71
1972
/73
1974
/75
1976
/77
1978
/79
1980
/81
1982
/83
1984
/85
1986
/87
1988
/89
1990
/91
1992
/93
1994
/95
1996
/97
1998
/99
2000
/01
2002
/03
2004
/05
2006
/07
2008
/09
2010
/11
Gráfico 2 – Participação de fornecedores e produtores próprios na produção brasileira de cana-de-açúcarChart 2 – Suppliers and own producers share in the Brazilian sugarcane production
-
100
200
300
400
500
600
700
1948
/49
1951
/52
1954
/55
1957
/58
1960
/61
1963
/64
1966
/67
1969
/70
1972
/73
1975
/76
1978
/79
1981
/82
1984
/85
1987
/88
1990
/91
1993
/94
1996
/97
1999
/00
2002
/03
2005
/06
2008
/09
Milh
ões
de
ton
elad
as
Mill
ion
to
ns
Safras / Harvests
Fornecedores (Suppliers) Própria (Own)

Ministério da Agricultura, Pecuária e Abastecimento12
Tabela 3 – Quantidade de cana moída mensalmente no Brasil, em toneladasTable 3 – Quantity of brazilian sugarcane crushed by month, in tones
MêsMonth
Safras Harvests Total/mês
Total/month2008/09 2009/10 2010/11 2011/12
abr/08 16.163.797 16.163.797
mai/08 47.163.789 47.163.789
jun/08 55.702.837 55.702.837
jul/08 59.352.315 59.352.315
ago/08 60.115.354 60.115.354
set/08 80.279.321 80.279.321
out/08 97.979.480 97.979.480
nov/08 70.676.085 70.676.085
dez/08 35.978.171 35.978.171
jan/09 19.819.410 19.819.410
fev/09 14.579.342 14.579.342
mar/09 14.298.712 14.298.712
abr/09 527.099 42.153.273 42.680.372
mai/09 101.194 66.191.724 66.292.918
jun/09 1.583 68.721.696 68.723.279
jul/09 0 71.678.157 71.678.157
ago/09 0 73.807.267 73.807.267
set/09 63.048.669 63.048.669
out/09 74.085.321 74.085.321
nov/09 71.550.563 71.550.563
dez/09 42.012.805 42.012.805
jan/10 14.482.788 14.482.788
fev/10 6.747.893 6.747.893
mar/10 7.729.455 7.729.455
abr/10 483.047 57.117.752 57.600.799
mai/10 213.178 76.469.982 76.683.160
jun/10 150.531 82.702.801 82.853.332
jul/10 0 83.647.695 83.647.695
ago/10 0 83.695.221 83.695.221
set/10 72.921.104 72.921.104
out/10 66.052.950 66.052.950
nov/10 52.254.731 52.254.731
dez/10 22.633.127 22.633.127
jan/11 12.067.522 12.067.522
(Continua / Continues)

Anuário Estatístico da Agroenergia – 2012 13
MêsMonth
Safras Harvests Total/mês
Total/month2008/09 2009/10 2010/11 2011/12
fev/11 6.142.384 6.142.384
mar/11 7.442.660 7.442.660
abr/11 1.027.097 22.410.299 23.437.396
mai/11 38.149 74.089.752 74.127.901
jun/11 11.280 82.131.230 82.142.510
jul/11 0 81.234.870 81.234.870
ago/11 276.710 80.720.839 80.997.549
set/11 87.287.876 87.287.876
out/11 54.174.575 54.174.575
nov/11 42.297.084 42.297.084
dez/11 14.422.685 14.422.685
jan/12 9.414.226 9.414.226
fev/12 9.201.711 9.201.711
mar/12 2.912.738 2.912.738
abr/12 55.041 14.542.257
Total 572.738.489 603.056.367 624.501.165 560.352.926
Fonte (Source): Mapa/Sapcana.
(Continuação / Continued)

Ministério da Agricultura, Pecuária e Abastecimento14
Gráfico 3 – Quantidade de cana moída mensalmente no Brasil, em toneladasChart 3 – Quantity of brazilian sugarcane crushed by month, in tones
0
20.000.000
40.000.000
60.000.000
80.000.000
100.000.000
abr/0
8
out/0
8
abr/0
9
out/0
9
abr/1
0
out/1
0
abr/1
1
out/1
1
abr/1
2
Can
a-d
e-aç
úca
r em
to
nel
adas
Su
gar
can
e in
to
nn
es
Meses /Months
Gráfico 4 - Comparativo de safra no processamento mensal da cana no Brasil, em toneladasChart 4 - Monthly sugarcane crushed in Brazil, in tonnes
0
15.000.000
30.000.000
45.000.000
60.000.000
75.000.000
90.000.000
abril
m
aio
junh
o
julh
o ag
osto
se
tem
bro
outu
bro
nove
mbr
o de
zem
bro
jane
iro
feve
reiro
m
arço
abril
m
aio
junh
o
julh
o ag
osto
Can
a-d
e-aç
úca
r em
to
nel
adas
Sug
arca
ne
in t
on
nes
Meses / Months
safra 2008/09 (harvest 2008/09) safra 2009/10 (harvest 2009/10)
safra 2010/11 (harvest 2010/11) safra 2011/12 (harvest 2011/12)

Anuário Estatístico da Agroenergia – 2012 15
1.3 Área 1.3 Area
Tabela 4 – Área plantada e área colhida de cana-de-açúcar para todos os fins, por ano civilTable 4 – Planted area and harvested area of sugarcane for all purposes, annually
AnoYear
Área em hectares Land in hectares
Área Plantada Planted Area
Área Colhida Harvested Area
1975 1.899.005 1.899.005 1976 2.078.880 2.078.880 1977 2.267.493 2.267.493 1978 2.388.080 2.388.080 1979 2.542.037 2.542.037 1980 2.607.225 2.607.225 1981 2.803.124 2.803.124 1982 3.082.468 3.082.468 1983 3.482.224 3.482.224 1984 3.858.964 3.858.964 1985 3.899.558 3.899.558 1986 3.945.898 3.945.898 1987 4.352.650 4.310.401 1988 4.149.094 4.116.529 1989 4.012.632 4.067.696 1990 4.322.299 4.272.602 1991 4.241.352 4.210.954 1992 4.224.561 4.202.604 1993 3.953.047 3.863.702 1994 4.359.200 4.345.260 1995 4.638.281 4.559.062 1996 4.830.538 4.750.296 1997 4.881.648 4.814.084 1998 5.049.953 4.985.819 1999 4.975.189 4.898.844 2000 4.879.841 4.804.511 2001 5.022.490 4.957.897 2002 5.206.656 5.100.405 2003 5.377.216 5.371.020 2004 5.633.700 5.631.741 2005 5.815.151 5.805.518 2006 6.390.474 6.355.498 2007 7.086.851 7.080.920 2008 8.210.877 8.140.089 2009 8.845.833 8.617.555 2010 9.164.756 9.076.706
Fonte (Source): IBGE.

Ministério da Agricultura, Pecuária e Abastecimento16
Gráfico 5 – Área plantada e área colhida de cana-de-açúcar para todos os fins, por ano civilChart 5 – Planted area and harvested area of sugarcane for all purposes, annually
1.000.000
2.000.000
3.000.000
4.000.000
5.000.000
6.000.000
7.000.000
8.000.000
9.000.000
10.000.000
1975
19
76
1977
19
78
1979
19
80
1981
19
82
1983
19
84
1985
19
86
1987
19
88
1989
19
90
1991
19
92
1993
19
94
1995
19
96
1997
19
98
1999
20
00
2001
20
02
2003
20
04
2005
20
06
2007
20
08
2009
20
10
Áre
a em
hec
tare
s
Are
a in
hec
tare
s
Anos / Years
Área Plantada (Planted Area) Área Colhida (Harvested Area)
1.4 Destinação do ATR1.4 TRS destination
Tabela 5 – Destinação do ATR, por produto final: açúcar e etanolTable 5 – TRS destination by final product: sugar and ethanol
SafrasHarvests
Quantidade de ATR por produtoAmount of TRS by product
Percentual de ATR por produtoTRS percentual by product
ATR açúcarTRS sugar
ATR etanolTRS ethanol
ATR Anidro TRS
anhydrous
ATR Hidratado
TRS hydrated
% ATR açúcar
% TRS sugar
% ATR etanol % TRS ethanol
% ATR anidro% TRS
anhydrous
% ATR hidratado
% TRS hydrated
1948/49 1.484.732 680.601 - - 69% 31% - - 1949/50 1.331.128 300.572 - - 82% 18% - - 1950/51 1.562.726 223.734 - - 87% 13% - - 1951/52 1.674.694 300.033 86.971 213.062 85% 15% 29% 71%1952/53 1.939.576 406.700 179.667 227.033 83% 17% 44% 56%1953/54 2.101.620 478.328 252.785 225.543 81% 19% 53% 47%1954/55 2.239.671 545.163 305.304 239.859 80% 20% 56% 44%1955/56 2.233.109 504.830 300.497 204.333 82% 18% 60% 40%1956/57 2.366.370 446.849 189.195 257.654 84% 16% 42% 58%1957/58 2.794.404 711.773 444.118 267.656 80% 20% 62% 38%1958/59 3.391.411 779.651 510.489 269.162 81% 19% 65% 35%1959/60 3.202.845 843.316 547.512 295.804 79% 21% 65% 35%1960/61 3.422.336 806.924 317.624 489.300 81% 19% 39% 61%1961/62 3.553.551 758.997 373.627 385.369 82% 18% 49% 51%1962/63 3.216.403 605.641 183.269 422.372 84% 16% 30% 70%
(Continua / Continues)

Anuário Estatístico da Agroenergia – 2012 17
SafrasHarvests
Quantidade de ATR por produtoAmount of TRS by product
Percentual de ATR por produtoTRS percentual by product
ATR açúcarTRS sugar
ATR etanolTRS ethanol
ATR Anidro TRS
anhydrous
ATR Hidratado
TRS hydrated
% ATR açúcar
% TRS sugar
% ATR etanol % TRS ethanol
% ATR anidro% TRS
anhydrous
% ATR hidratado
% TRS hydrated
1963/64 3.252.033 712.818 174.113 538.705 82% 18% 24% 76%1964/65 3.741.719 681.583 199.739 481.844 85% 15% 29% 71%1965/66 4.784.498 1.073.242 609.328 463.913 82% 18% 57% 43%1966/67 4.319.571 1.293.739 692.414 601.325 77% 23% 54% 46%1967/68 4.424.259 1.202.889 649.595 553.294 79% 21% 54% 46%1968/69 4.315.276 834.857 259.676 575.181 84% 16% 31% 69%1969/70 4.547.329 810.865 182.005 628.860 85% 15% 22% 78%1970/71 5.373.299 1.127.270 457.198 670.072 83% 17% 41% 59%1971/72 5.653.273 1.095.083 706.586 388.496 84% 16% 65% 35%1972/73 6.226.366 1.213.242 704.671 508.571 84% 16% 58% 42%1973/74 7.013.997 1.181.282 554.862 626.420 86% 14% 47% 53%1974/75 7.053.528 1.051.317 392.348 658.969 87% 13% 37% 63%1975/76 6.179.279 983.927 421.510 562.418 86% 14% 43% 57%1976/77 7.565.323 1.177.981 544.215 633.766 87% 13% 46% 54%1977/78 8.719.185 2.643.595 2.132.630 510.966 77% 23% 81% 19%1978/79 7.706.183 4.485.007 3.797.222 687.784 63% 37% 85% 15%1979/80 6.975.214 6.106.151 4.920.270 1.185.881 53% 47% 81% 19%1980/81 8.501.232 6.602.595 3.814.784 2.787.811 56% 44% 58% 42%1981/82 8.328.119 7.485.782 2.633.014 4.852.768 53% 47% 35% 65%1982/83 9.295.555 10.390.373 6.431.522 3.958.852 47% 53% 62% 38%1983/84 9.535.845 13.868.062 4.474.631 9.393.431 41% 59% 32% 68%1984/85 9.254.654 16.154.546 3.809.884 12.344.662 36% 64% 24% 76%1985/86 8.206.308 21.007.043 5.931.040 15.076.003 28% 72% 28% 72%1986/87 8.560.986 18.447.461 3.920.206 14.527.255 32% 68% 21% 79%1987/88 8.380.490 20.091.714 3.592.134 16.499.580 29% 71% 18% 82%1988/89 8.469.658 20.397.596 3.110.280 17.287.316 29% 71% 15% 85%1989/90 7.571.144 20.858.777 2.632.157 18.226.620 27% 73% 13% 87%1990/91 7.729.925 20.141.270 2.331.261 17.810.009 28% 72% 12% 88%1991/92 8.952.720 22.292.617 3.600.071 18.692.546 29% 71% 16% 84%1992/93 9.722.724 20.580.310 4.016.090 16.564.220 32% 68% 20% 80%1993/94 9.615.661 19.840.552 4.570.931 15.269.621 33% 67% 23% 77%1994/95 12.279.638 22.431.444 5.206.728 17.224.717 35% 65% 23% 77%1995/96 13.277.313 22.358.896 5.540.293 16.818.603 37% 63% 25% 75%1996/97 14.306.666 25.454.055 8.388.364 17.065.691 36% 64% 33% 67%1997/98 15.581.973 27.256.767 10.327.891 16.928.876 36% 64% 38% 62%1998/99 18.849.636 24.651.525 10.292.156 14.359.368 43% 57% 42% 58%1999/00 20.339.517 23.205.771 11.127.073 12.078.697 47% 53% 48% 52%2000/01 16.813.347 18.036.191 9.768.810 8.267.381 48% 52% 54% 46%2001/02 19.934.584 19.694.301 11.333.394 8.360.907 50% 50% 58% 42%2002/03 23.489.212 21.438.637 12.260.253 9.178.384 52% 48% 57% 43%2003/04 26.178.974 25.178.321 15.336.807 9.841.514 51% 49% 61% 39%2004/05 27.950.362 26.086.682 14.295.316 11.791.366 52% 48% 55% 45%2005/06 27.512.003 27.055.466 13.404.548 13.650.918 50% 50% 50% 50%2006/07 32.256.463 30.657.813 14.130.573 16.527.240 51% 49% 46% 54%2007/08 32.846.851 38.239.064 14.806.138 23.432.925 46% 54% 39% 61%2008/09 33.066.449 47.098.708 16.845.637 30.253.070 41% 59% 36% 64%2009/10 34.668.636 43.645.864 12.135.547 31.510.317 44% 56% 28% 72%2010/11 39.953.951 46.852.102 14.041.323 32.810.779 46% 54% 30% 70%2011/12* 37.743.943 38.677.778 15.084.426 23.593.352 49% 51% 39% 61%
Fonte (Source): Mapa.Nota: * Dados apurados em 15/05/2012.
* Data value at May 15, 2012.Obs.: Parâmetros atuais (Current parameters):
1 quilograma (kg) de açúcar = 1,0495 kg ATR (1 kg sugar = 1,0495 kg TRS).1 litro (l) de anidro = 1,812 kg ATR (1 l anydrous = 1,812 kg TRS).1 litro (l) de hidratado = 1,7412 kg ATR (1 l hydrated = 1,7412 kg TRS).
(Continuação / Continued)

Ministério da Agricultura, Pecuária e Abastecimento18
Gráfico 6 – Distribuição do ATR por produto final: açúcar e álcoolChart 6 – TRS distribution by product: sugar and ethanol
0% 10% 20% 30% 40% 50% 60% 70% 80% 90%
100%
1948/49
1951/52
1954/55
1957/58
1960/61
1963/64
1966/67
1969/70
1972/73
1975/76
1978/79
1981/82
1984/85
1987/88
1990/91
1993/94
1996/97
1999/00
2002/03
2005/06
2008/09
2011/12*
Porc
enta
gem
de
ATR
Pe
rcen
tag
e o
f T
RS
% ATR etanol (% TRS ethanol) % ATR açúcar (% TRS sugar)
Safras / Harvests
1.5 Rendimento industrial1.5 Industrial Yield
Tabela 6 – Produtividade de açúcar, etanol e ATR, por tonelada de canaTable 6 – Sugar, ethanol and TRS productivity, per sugarcane ton
SafrasHarvests
Quilograma de ATR/
tonelada de cana
TRS kg/sugarcane ton
Quilograma de açúcar/
tonelada de cana
sugar kg/sugarcane ton
Litros de etanol/
tonelada de cana
ethanol liters/ sugarcane ton
Anidro/tonelada de
canaanhydrous/
sugarcane ton
Hidratado/tonelada de
cana hydrated/
sugarcane ton
1948/49 138,21 90,30 24,45 - -1949/50 121,40 94,37 12,59 - -1950/51 115,39 96,17 8,13 - -1951/52 116,46 94,10 10,05 2,83 7,221952/53 116,62 91,86 11,41 4,93 6,481953/54 116,95 90,78 12,20 6,32 5,871954/55 117,66 90,17 12,94 7,12 5,821955/56 116,12 90,24 12,01 7,03 4,981956/57 115,40 92,49 10,35 4,28 6,071957/58 117,29 89,07 13,34 8,20 5,141958/59 115,08 89,16 12,04 7,77 4,271959/60 117,66 88,74 13,73 8,79 4,941960/61 115,72 89,22 12,48 4,80 7,691961/62 118,33 92,90 11,73 5,66 6,071962/63 114,72 91,99 10,32 3,04 7,281963/64 111,97 87,51 11,45 2,71 8,741964/65 110,78 89,29 9,69 2,76 6,931965/66 116,74 90,86 12,01 6,70 5,311966/67 118,56 86,93 15,36 8,07 7,29
(Continua / Continues)

Anuário Estatístico da Agroenergia – 2012 19
(Continuação / Continued)
SafrasHarvests
Quilograma de ATR/
tonelada de cana
TRS kg/sugarcane ton
Quilograma de açúcar/
tonelada de cana
sugar kg/sugarcane ton
Litros de etanol/
tonelada de cana
ethanol liters/ sugarcane ton
Anidro/tonelada de
canaanhydrous/
sugarcane ton
Hidratado/tonelada de
cana hydrated/
sugarcane ton
1967/68 117,10 87,73 14,07 7,46 6,611968/69 118,12 94,30 10,86 3,29 7,581969/70 114,04 92,22 9,82 2,14 7,691970/71 113,89 89,70 11,16 4,42 6,741971/72 111,48 88,98 10,13 6,44 3,691972/73 109,62 87,41 10,03 5,73 4,301973/74 108,06 88,12 8,78 4,04 4,741974/75 108,78 90,20 7,99 2,91 5,081975/76 104,84 86,18 8,13 3,40 4,731976/77 99,55 82,08 7,56 3,42 4,141977/78 108,60 79,40 14,05 11,25 2,801978/79 113,27 68,22 23,14 19,47 3,671979/80 116,13 59,00 30,15 24,11 6,051980/81 122,12 65,49 29,97 17,02 12,951981/82 119,00 59,72 31,91 10,93 20,971982/83 118,46 53,30 35,04 21,36 13,681983/84 118,96 46,18 39,97 12,55 27,421984/85 125,25 43,47 45,31 10,36 34,951985/86 130,88 35,03 53,46 14,66 38,791986/87 118,52 35,80 46,11 9,49 36,611987/88 126,83 35,57 51,04 8,83 42,211988/89 131,15 36,67 52,91 7,80 45,111989/90 127,54 32,36 53,48 6,52 46,961990/91 125,30 33,11 51,77 5,78 45,991991/92 136,31 37,21 55,50 8,67 46,831992/93 135,61 41,46 52,49 9,92 42,571993/94 142,62 44,36 54,67 12,21 42,461994/95 144,11 48,58 53,00 11,93 41,071995/96 142,62 50,63 50,89 12,24 38,661996/97 137,33 47,08 49,84 15,99 33,851997/98 141,76 49,13 51,03 18,86 32,171998/99 137,82 56,90 44,12 18,00 26,131999/00 140,41 62,49 42,17 19,80 22,372000/01 136,71 62,84 41,26 21,91 19,352001/02 135,56 64,98 39,23 22,16 17,072002/03 142,12 70,80 39,50 22,17 17,322003/04 143,81 69,85 41,00 24,55 16,442004/05 141,66 69,82 39,87 21,42 18,442005/06 142,67 68,54 41,33 20,04 21,292006/07 146,72 71,67 41,83 18,84 23,002007/08 143,36 63,12 45,27 17,07 28,202008/09 139,97 55,01 48,33 16,81 31,522009/10 129,86 54,78 42,68 11,50 31,182010/11 139,00 60,96 44,20 12,85 31,352011/12* 136,38 64,18 40,51 15,39 25,12
Fonte (Source): Mapa.Nota: * Dados apurados em 15/05/2012.
* Data value at May 15, 2012.Obs.: Parâmetros atuais (Current parameters):
1 quilograma (kg) de açúcar = 1,0495 kg ATR (1 kg sugar = 1,0495 kg TRS).1 litro (l) de anidro = 1,812 kg ATR (1 l anydrous = 1,812 kg TRS).1 litro (l) de hidratado = 1,7412 kg ATR (1 l hydrated = 1,7412 kg TRS).

Ministério da Agricultura, Pecuária e Abastecimento20
Gráfico 7 - Destinação do ATR de cana para a produção de açúcar e etanolChart 7 – TRS sugarcane destination for the sugar and ethanol production
90
100
110
120
130
140
150
1948
/49
1951
/52
1954
/55
1957
/58
1960
/61
1963
/64
1966
/67
1969
/70
1972
/73
1975
/76
1978
/79
1981
/82
1984
/85
1987
/88
1990
/91
1993
/94
1996
/97
1999
/00
2002
/03
2005
/06
2008
/09
2011
/12*
kg A
TR/ t
can
a kg
TR
S/ t
on
can
e
Safras / Harvests
Quilograma de ATR/tonelada de cana (TRS kg/sugarcane ton)
Gráfico 8 – Produtividade etanol por tonelada de canaChart 8 – Ethanol productivity by sugarcane ton
0
10
20
30
40
50
60
1948
/49
1951
/52
1954
/55
1957
/58
1960
/61
1963
/64
1966
/67
1969
/70
1972
/73
1975
/76
1978
/79
1981
/82
1984
/85
1987
/88
1990
/91
1993
/94
1996
/97
1999
/00
2002
/03
2005
/06
2008
/09
2011
/12*
Litr
os/
t ca
na
Lite
rs/ t
on
can
e
Safras / Harvests
Litros de etanol/tonelada de cana (ethanol liters/ sugarcane ton)
Anidro/tonelada de cana (anhydrous/sugarcane ton)
Hidratado/tonelada de cana (hydrated/sugarcane ton)

Anuário Estatístico da Agroenergia – 2012 21
1.6
Pro
du
ção
mu
nd
ial d
e ca
na-
de-
açú
car
1.6
Wor
ld s
ugar
cane
pro
duct
ion
Tab
ela
7 –
Séri
e h
istó
rica
d
a p
rod
uçã
o
do
s p
rin
cip
ais
paí
ses
pro
du
tore
s d
e ca
na-
de-
açú
car,
em m
ilhõ
es d
e to
nel
adas
Tabl
e 7
- Pr
oduc
tion
of m
ain
suga
rcan
e pr
oduc
ing
coun
trie
s, i
n m
illio
n to
nnes
1980
1981
1982
1983
1984
1985
1986
1987
1988
1989
1990
1991
1992
1993
1994
1995
1996
1997
1998
1999
2000
2001
2002
2003
2004
2005
2006
2007
2008
2009
2010
Bras
il
(Bra
zil)*
123,
713
2,9
166,
219
6,7
202,
922
3,2
227,
922
4,5
220,
122
2,9
222,
422
9,2
223,
520
6,5
240,
924
9,9
289,
530
2,2
315,
631
0,1
254,
929
3,0
321,
734
9,6
374,
738
2,3
428,
349
5,5
552,
862
2,6
627,
3
Índi
a (In
dia)
128,
815
4,2
186,
418
9,5
174,
117
0,3
171,
718
6,1
196,
720
3,0
225,
624
1,0
254,
022
8,0
229,
727
5,5
281,
127
7,6
279,
531
0,3
299,
329
6,0
297,
228
7,4
233,
923
7,1
281,
235
5,5
348,
228
5,0
277,
8
Chin
a (C
hina
)32
,038
,445
,538
,646
,558
,756
,552
,856
,155
,663
,572
,778
,969
,066
,470
,371
,383
,087
,278
,169
,378
,092
,292
,091
,087
,693
,311
3,7
124,
911
6,3
111,
5
Tailâ
ndia
(T
haila
nd)
12,8
19,9
30,2
24,4
23,9
25,1
24,1
24,4
27,2
36,7
33,6
40,7
47,5
39,8
37,8
50,6
58,0
56,4
46,9
50,3
54,1
49,6
60,0
74,3
65,0
49,6
47,7
64,4
73,5
66,8
68,8
Méx
ico
(M
exico
)35
,333
,235
,534
,235
,034
,444
,345
,942
,743
,939
,938
,441
,742
,940
,644
,545
,145
,248
,946
,944
,147
,345
,647
,548
,751
,650
,752
,151
,149
,550
,4
Paqu
istã
o
(Pak
istan
)27
,532
,436
,632
,534
,332
,127
,943
,633
,037
,035
,536
,038
,938
,144
,447
,245
,242
,053
,155
,246
,343
,648
,052
,153
,847
,244
,754
,763
,950
,049
,4
Filip
inas
(P
hilip
pine
s)30
,931
,635
,828
,734
,322
,821
,017
,219
,325
,325
,524
,828
,929
,726
,724
,426
,627
,026
,323
,824
,527
,027
,531
,033
,531
,431
,632
,034
,032
,534
,0
Aus
trál
ia
(Aus
tralia
)24
,025
,124
,824
,225
,524
,424
,724
,827
,126
,924
,421
,420
,628
,031
,334
,937
,439
,941
,139
,738
,228
,131
,437
,037
,037
,837
,136
,432
,630
,331
,5
Arg
entin
a
(Arg
entin
a)17
,215
,515
,015
,115
,414
,114
,514
,513
,913
,715
,718
,216
,814
,315
,217
,717
,619
,519
,416
,718
,418
,719
,322
,121
,024
,426
,530
,030
,029
,029
,0
Indo
nési
a
(Indo
nésia
)17
,122
,321
,824
,523
,022
,624
,626
,128
,026
,828
,028
,132
,033
,032
,829
,029
,527
,828
,023
,523
,925
,225
,524
,526
,829
,329
,225
,326
,026
,526
,5
E.U
.A.
(USA
)24
,524
,927
,025
,524
,825
,627
,526
,527
,126
,725
,527
,427
,528
,228
,127
,926
,728
,831
,532
,036
,134
,635
,633
,929
,026
,629
,627
,825
,027
,624
,8
Colô
mbi
a
(Col
ombi
a)26
,123
,223
,524
,223
,525
,424
,925
,025
,826
,527
,827
,828
,930
,531
,232
,035
,036
,034
,033
,035
,035
,538
,039
,040
,039
,838
,538
,538
,538
,520
,3
Gua
tem
ala
(G
uate
mal
a)5,
76,
37,
46,
56,
66,
67,
06,
97,
67,
69,
610
,811
,311
,711
,915
,415
,617
,718
,217
,016
,616
,917
,517
,420
,023
,518
,716
,516
,218
,418
,4
Áfr
ica
do
Su
l (S
outh
Afr
ica)
14,1
19,5
19,3
13,4
22,4
18,8
18,3
21,0
19,8
18,6
18,1
20,1
13,0
11,2
15,7
16,7
21,0
22,2
22,9
21,2
23,9
21,2
23,0
20,4
19,1
21,3
20,3
19,7
19,3
18,7
16,0
Egit
o
(Egy
pt)
8,6
8,8
8,7
8,4
9,1
9,7
10,8
8,4
10,8
11,2
11,1
11,6
11,7
12,4
13,8
14,1
14,0
13,7
14,4
15,3
15,7
15,6
16,0
16,2
16,2
16,3
16,7
17,0
16,5
15,5
15,7
Mu
nd
o
(Wor
ld)
734,
579
9,6
907,
190
3,7
929,
893
3,2
934,
799
0,3
993,
01.0
18,0
1.053
,01.0
89,3
1.116
,31.0
30,4
1.089
,61.1
72,3
1.222
,91.2
51,5
1.275
,51.2
81,6
1.257
,51.2
66,8
1.334
,71.3
78,6
1.341
,01.3
21,5
1.422
,11.6
20,6
1.734
,11.6
68,0
1.68
5,4
Font
e (S
ourc
e): F
AO
; Map
a.N
ota:
* o
s va
lore
s de
200
1 a
2009
ano
civ
il, d
e 19
80 a
200
0 an
o-sa
fra.
Not
e: *
dat
a fr
om 2
001
to 2
009
by c
ivil
year
and
fro
m 1
980
to 2
000
by h
arve
st y
ear.

Ministério da Agricultura, Pecuária e Abastecimento22
Gráfico 9 – Série histórica da produção dos principais países produtores de cana-de-açúcar, em milhões de toneladasChart 9 – Production of main sugarcane producing countries, in million tonnes
-
120
240
360
480
600
720
1980
19
81
1982
19
83
1984
19
85
1986
19
87
1988
19
89
1990
19
91
1992
19
93
1994
19
95
1996
19
97
1998
19
99
2000
20
01
2002
20
03
2004
20
05
2006
20
07
2008
20
09
2010
Milh
ões
de
ton
elad
as
Mill
ion
to
nn
es
Anos / Years
Brasil (Brazil)*
Índia (India)
China (China)
Tailândia (Thailand)
México (Mexico)
Paquistão (Pakistan)

Anuário Estatístico da Agroenergia – 2012 23
Tab
ela
8 –
Séri
e h
istó
rica
de
área
pla
nta
da
do
s p
rin
cip
ais
paí
ses
pro
du
tore
s d
e ca
na-
de-
açú
car,
em m
ilhar
es d
e h
ecta
res
Tabl
e 8
– A
rea
harv
este
d of
mai
n su
garc
ane
prod
ucin
g co
untr
ies,
in
thou
sand
hec
tare
s
1980
1981
1982
1983
1984
1985
1986
1987
1988
1989
1990
1991
1992
1993
1994
Bras
il(B
razi
l)*2.
607,
62.
825,
93.
084,
33.
478,
83.
655,
83.
912,
03.
944,
74.
308,
74.
113,
24.
067,
74.
272,
64.
211,
04.
202,
63.
863,
74.
345,
3
Índi
a(In
dia)
2.61
0,2
2.66
6,6
3.19
3,3
3.35
7,6
3.10
9,7
2.95
3,2
2.86
2,0
3.07
8,7
3.27
8,6
3.32
8,9
3.43
9,0
3.68
6,0
3.84
0,0
3.57
0,0
3.42
0,0
Chin
a(C
hina
)59
1,3
658,
175
8,6
748,
881
4,9
1.05
2,5
1.01
7,8
925,
399
8,0
1.02
9,9
1.07
7,5
1.22
7,1
1.30
9,9
1.15
2,7
1.11
9,4
Tailâ
ndia
(T
haila
nd)
425,
645
6,5
613,
357
7,2
535,
953
1,0
546,
052
0,2
570,
665
9,5
686,
478
2,6
916,
699
1,7
799,
5
Paqu
istã
o(P
akist
an)
718,
582
4,7
946,
791
1,7
896,
590
3,6
779,
876
2,0
841,
687
6,9
854,
388
3,8
896,
188
4,6
962,
8
Méx
ico
(Mex
ico)
539,
952
9,6
523,
050
7,7
523,
448
8,7
586,
061
5,7
605,
361
2,7
571,
354
7,0
558,
256
1,7
587,
5
Indo
nési
a(In
done
sia)
189,
019
3,1
255,
025
5,3
231,
427
3,3
303,
031
0,0
340,
033
9,9
345,
036
5,0
394,
541
7,6
418,
2
Aus
trál
ia(A
ustr
alia
)28
8,3
315,
931
8,5
307,
231
2,6
303,
731
1,0
307,
231
7,0
313,
033
2,0
341,
032
9,0
328,
033
8,0
Filip
inas
(Phi
lippi
nes)
424,
639
9,9
416,
541
1,4
409,
536
8,5
300,
126
9,3
215,
626
1,7
318,
436
0,4
355,
838
4,0
401,
6
E.U
.A.
(USA
)29
6,5
305,
730
0,2
310,
730
2,4
311,
632
2,2
333,
334
2,1
344,
832
1,4
363,
037
4,4
383,
837
9,1
Arg
enti
na(A
rgen
tina)
314,
131
9,8
308,
531
3,4
317,
628
7,6
296,
329
0,2
296,
722
9,3
255,
629
2,2
254,
622
5,9
239,
0
Áfr
ica
do S
ul(S
outh
Afr
ica)
212,
625
7,6
266,
323
2,0
273,
026
6,4
275,
727
4,3
276,
425
8,5
264,
727
6,0
274,
726
5,9
269,
3
Gua
tem
ala
(Gua
tem
ala)
69,6
79,7
70,1
70,2
73,1
72,4
72,4
81,3
90,3
88,8
112,
012
2,5
125,
912
9,2
129,
5
Colô
mbi
a(C
olom
bia)
292,
227
9,1
261,
427
0,9
291,
034
6,0
340,
134
0,0
336,
632
1,7
318,
331
2,6
339,
038
1,1
373,
3
Egit
o(E
gypt
)10
6,1
105,
410
6,9
105,
010
2,5
105,
010
9,9
112,
511
5,6
115,
711
0,6
112,
211
3,8
116,
912
6,4
Mun
do(W
orld
)13
.284,8
13.68
6,615
.055,2
15.38
0,815
.635,5
15.94
7,915
.826,3
16.31
0,516
.390,0
16.53
5,917
.079,4
17.78
3,318
.151,9
17.29
2,817
.591,9
(Con
tinua
/ C
ontin
ues)

Ministério da Agricultura, Pecuária e Abastecimento24
1995
1996
1997
1998
1999
2000
2001
2002
2003
2004
2005
2006
2007
2008
2009
2010
Bras
il(B
razi
l)*4.
559,
14.
750,
34.
814,
14.
985,
84.
898,
84.
846,
04.
957,
65.
100,
55.
371,
05.
631,
75.
805,
56.
355,
57.
080,
98.
140,
18.
514,
49.
080,
8
Índi
a(In
dia)
3.87
0,0
4.15
0,0
4.17
4,1
3.92
9,8
4.05
4,9
4.21
9,7
4.31
5,7
4.41
1,6
4.52
0,3
3.93
8,4
3.66
1,5
4.20
1,1
5.15
0,0
5.05
5,2
4.42
0,0
4.20
0,0
Chin
a(C
hina
)1.
185,
61.
243,
71.
108,
21.
186,
91.
042,
41.
188,
61.
281,
01.
421,
01.
431,
81.
393,
11.
365,
81.
389,
01.
596,
61.
754,
01.
707,
61.
695,
2
Tailâ
ndia
(T
haila
nd)
922,
798
5,0
980,
391
7,6
917,
589
3,4
837,
698
6,0
1.10
5,1
1.11
1,2
1.03
5,2
942,
498
6,2
1.02
9,3
932,
597
8,0
Paqu
istã
o(P
akist
an)
1.00
9,0
963,
196
4,5
1.05
6,2
1.15
5,1
1.00
9,8
960,
899
9,7
1.09
9,6
1.07
4,5
966,
490
7,3
1.02
9,0
1.24
1,3
1.02
9,4
942,
8
Méx
ico
(Mex
ico)
573,
063
3,6
614,
863
0,6
643,
261
8,3
623,
763
2,2
644,
465
1,9
669,
867
9,9
690,
466
9,2
710,
670
3,9
Indo
nési
a(In
done
sia)
412,
043
0,4
378,
140
5,4
391,
136
6,0
386,
135
0,7
335,
734
4,8
382,
139
6,4
404,
741
5,6
420,
042
0,0
Aus
trál
ia(A
ustr
alia
)36
5,0
383,
040
1,0
420,
041
4,0
419,
040
3,0
426,
044
8,0
447,
643
4,0
415,
040
8,6
380,
539
1,3
405,
0
Filip
inas
(Phi
lippi
nes)
375,
139
5,6
352,
034
3,6
313,
939
4,9
387,
138
3,7
383,
938
8,6
368,
939
2,3
383,
039
8,0
404,
036
2,8
E.U
.A.
(USA
)37
7,3
359,
736
9,2
383,
340
2,0
417,
841
5,9
414,
140
1,6
379,
737
3,1
363,
335
6,0
351,
335
3,7
355,
1
Arg
enti
na(A
rgen
tina)
294,
929
6,7
298,
930
5,6
275,
028
0,0
292,
029
4,0
295,
028
1,9
284,
631
5,0
355,
035
5,0
355,
035
5,0
Áfr
ica
do S
ul(S
outh
Afr
ica)
273,
129
9,6
296,
631
6,4
315,
833
0,0
332,
033
0,0
327,
032
5,0
328,
032
0,0
323,
032
0,0
311,
026
7,0
Gua
tem
ala
(Gua
tem
ala)
138,
617
8,6
154,
018
0,0
182,
018
2,0
182,
018
6,3
192,
022
6,0
271,
623
3,3
190,
218
8,6
213,
421
3,4
Colô
mbi
a(C
olom
bia)
377,
938
8,2
387,
039
3,5
388,
540
6,0
404,
838
7,7
398,
639
9,5
406,
141
0,1
410,
238
3,4
379,
517
1,6
Egit
o(E
gypt
)12
8,8
126,
012
2,3
122,
512
9,1
134,
013
1,1
135,
913
7,5
135,
313
5,0
137,
314
0,8
135,
913
3,0
134,
5
Mun
do(W
orld
)18
.577,7
19.41
7,719
.294,8
19.31
8,319
.205,7
19.39
5,819
.595,8
20.36
3,820
.637,1
20.26
7,819
.862,4
20.73
1,822
.821,7
24.17
4,723
.735,9
23.81
5,2
Font
e (S
ourc
e): F
AO
; Map
a.N
ota:
* o
s va
lore
s de
200
1 a
2009
ano
civ
il, d
e 19
80 a
200
0 an
o-sa
fra.
Not
e: *
dat
a fr
om 2
001
to 2
009
by c
ivil
year
and
fro
m 1
980
to 2
000
by h
arve
st y
ear.
(Con
tinua
ção
/ Con
tinue
d)

Anuário Estatístico da Agroenergia – 2012 25
Gráfico 10 – Série histórica da área plantada dos principais países produtores de cana-de-açúcar, em milhares de hectaresChart 10 – Area harvested of main sugarcane producing countries, in thousand hectares
-
1.900
3.800
5.700
7.600
9.500
1980
19
81
1982
19
83
1984
19
85
1986
19
87
1988
19
89
1990
19
91
1992
19
93
1994
19
95
1996
19
97
1998
19
99
2000
20
01
2002
20
03
2004
20
05
2006
20
07
2008
20
09
2010
Milh
ares
de
hec
tare
s
Tho
san
ds
hec
tare
s
Anos / Years
Brasil (Brazil)*
Índia (India)
China (China)
Tailândia (Thailand)
México (Mexico)
Paquistão (Pakistan)

Ministério da Agricultura, Pecuária e Abastecimento26
Tab
ela
9 –
Séri
e h
istó
rica
da
pro
du
tivi
dad
e d
os
pri
nci
pai
s p
aíse
s p
rod
uto
res
de
can
a-d
e-aç
úca
r, em
to
nel
adas
po
r h
ecta
reTa
ble
9 –
Prod
uctiv
ity o
f mai
n su
garc
ane
prod
ucin
g co
untr
ies,
in to
nnes
per
hec
tare
1980
1981
1982
1983
1984
1985
1986
1987
1988
1989
1990
1991
1992
1993
1994
Co
lôm
bia
(C
olom
bia)
89,3
83,1
89,9
89,3
80,7
73,3
73,1
73,4
76,6
82,3
87,3
88,9
85,3
80,0
83,6
Egit
o
(Egy
pt)
81,2
83,5
81,8
80,0
89,2
92,2
98,5
74,9
93,4
97,0
100,
310
3,6
102,
910
6,2
109,
3
Filip
inas
(P
hilip
pine
s)72
,879
,086
,069
,883
,862
,069
,963
,989
,596
,580
,068
,981
,177
,566
,5
Gu
atem
ala
(Gua
tem
ala)
81,9
79,1
105,
992
,689
,890
,996
,784
,583
,879
,885
,788
,289
,890
,991
,6
Arg
enti
na
(Arg
entin
a)54
,848
,548
,848
,148
,649
,048
,849
,947
,059
,761
,462
,366
,063
,163
,6
Au
strá
lia
(Aus
tral
ia)
83,2
79,4
77,9
78,8
81,4
80,3
79,6
80,8
85,6
86,1
73,4
62,7
62,7
85,2
92,6
Méx
ico
(M
exic
o)65
,362
,767
,967
,466
,870
,575
,574
,570
,671
,769
,970
,374
,776
,469
,1
Tailâ
nd
ia
(Tha
iland
)30
,143
,549
,242
,344
,547
,244
,147
,047
,755
,648
,952
,051
,840
,247
,3
E.U
.A.
(USA
)82
,581
,390
,082
,282
,082
,185
,379
,579
,377
,479
,475
,673
,673
,574
,0
Bra
sil*
(Bra
zil* )
49,1
40,3
37,5
37,5
39,0
38,1
56,8
60,2
50,8
50,1
46,7
43,5
46,5
48,5
42,2
Índ
ia
(Indi
a)49
,457
,858
,456
,456
,057
,760
,060
,460
,061
,065
,665
,466
,163
,967
,2
Ch
ina
(Chi
na)
54,1
58,3
60,0
51,6
57,0
55,8
55,5
57,1
56,2
54,0
58,9
59,2
60,2
59,9
59,3
Ind
on
ésia
(In
done
sia)
90,7
115,
585
,595
,899
,282
,881
,284
,382
,378
,981
,177
,181
,179
,078
,5
Áfr
ica
do
Su
l (S
outh
Afr
ica)
66,1
75,8
72,6
57,9
81,9
70,6
66,2
76,6
71,7
71,9
68,3
72,7
47,2
42,3
58,2
Paq
uis
tão
(P
akis
tan)
38,3
39,2
38,6
35,7
38,2
35,6
35,7
57,2
39,2
42,2
41,5
40,7
43,4
43,0
46,1
Mu
nd
o
(Wor
ld)
55,3
58,4
60,2
58,8
59,5
58,5
59,1
60,7
60,6
61,6
61,7
61,3
61,5
59,6
61,9
(Con
tinua
/ C
ontin
ues)

Anuário Estatístico da Agroenergia – 2012 27
1995
1996
1997
1998
1999
2000
2001
2002
2003
2004
2005
2006
2007
2008
2009
2010
Co
lôm
bia
(C
olom
bia)
84,7
90,2
93,0
86,4
84,8
86,2
87,7
98,0
97,9
100,
198
,193
,893
,910
0,4
101,
411
8,1
Egit
o
(Egy
pt)
109,
511
0,7
112,
211
7,2
118,
211
7,2
118,
811
7,9
118,
212
0,0
120,
912
1,3
120,
912
1,2
116,
411
6,8
Filip
inas
(P
hilip
pine
s)65
,067
,276
,776
,575
,862
,069
,871
,780
,886
,285
,180
,483
,685
,480
,493
,7
Gu
atem
ala
(Gua
tem
ala)
111,
487
,311
4,9
101,
193
,590
,993
,093
,990
,688
,586
,480
,287
,086
,086
,286
,2
Arg
enti
na
(Arg
entin
a)60
,059
,365
,163
,560
,765
,764
,165
,574
,774
,385
,784
,084
,484
,581
,781
,7
Au
strá
lia
(Aus
tral
ia)
95,7
97,7
99,6
97,8
95,9
91,1
69,8
73,8
82,6
82,6
87,2
89,5
89,1
85,7
77,4
77,7
Méx
ico
(M
exic
o)77
,671
,173
,677
,572
,971
,375
,872
,273
,774
,677
,174
,575
,476
,469
,771
,6
Tailâ
nd
ia
(Tha
iland
)54
,858
,957
,551
,154
,960
,559
,260
,967
,258
,547
,950
,665
,371
,471
,770
,4
E.U
.A.
(USA
)74
,074
,377
,982
,279
,786
,483
,285
,984
,376
,471
,381
,478
,071
,378
,169
,9
Bra
sil*
(Bra
zil* )
44,1
46,8
46,9
46,3
40,6
43,7
49,2
45,6
43,2
45,3
53,4
55,9
50,6
41,2
48,1
53,5
Índ
ia
(Indi
a)71
,267
,766
,571
,176
,570
,968
,667
,463
,659
,464
,866
,969
,068
,964
,566
,1
Ch
ina
(Chi
na)
59,3
57,3
74,9
73,5
74,9
58,3
60,9
64,9
64,3
65,4
64,1
67,2
71,2
71,2
68,1
65,7
Ind
on
ésia
(In
done
sia)
70,4
68,5
73,4
69,0
60,1
65,3
65,2
72,8
73,0
77,6
76,7
73,7
62,5
62,6
63,1
63,1
Áfr
ica
do
Su
l (S
outh
Afr
ica)
61,2
69,9
74,7
83,1
67,2
72,4
63,7
69,7
62,4
58,8
64,8
63,4
61,1
60,2
60,0
60,0
Paq
uis
tão
(P
akis
tan)
46,7
47,0
43,5
50,3
47,8
45,9
45,4
48,1
47,3
50,1
48,9
49,2
53,2
51,5
48,6
52,4
Mu
nd
o
(Wor
ld)
63,1
63,0
64,9
66,0
66,7
64,8
64,6
65,5
66,8
66,2
66,5
68,6
71,0
71,7
70,3
70,8
Font
e (S
ourc
e): F
AO
; Map
a.N
ota:
* o
s va
lore
s de
200
1 a
2009
ano
civ
il, d
e 19
80 a
200
0 an
o-sa
fra.
Not
e: *
dat
a fr
om 2
001
to 2
009
by c
ivil
year
and
fro
m 1
980
to 2
000
by h
arve
st y
ear.
(Con
tinua
ção
/ Con
tinue
d)

Ministério da Agricultura, Pecuária e Abastecimento28
Gráfico 11 – Série histórica da produtividade dos principais países produtores de cana-de-açúcar, em toneladas por hectareChart 11 – Productivity of main sugarcane producing countries, in tonnes per hectare
Brasil (Brazil)*
Índia (India)
China (China)
Tailândia (Thailand)
México (Mexico)
30
45
60
75
90
1980
19
81
1982
19
83
1984
19
85
1986
19
87
1988
19
89
1990
19
91
1992
19
93
1994
19
95
1996
19
97
1998
19
99
2000
20
01
2002
20
03
2004
20
05
2006
20
07
2008
20
09
2010
Pro
du
tivi
dad
e em
t/h
a Pr
od
uct
ivit
y in
t/h
a
Anos / Years

EtanolEthanol
02
Ministério da Agricultura, Pecuária e Abastecimento30
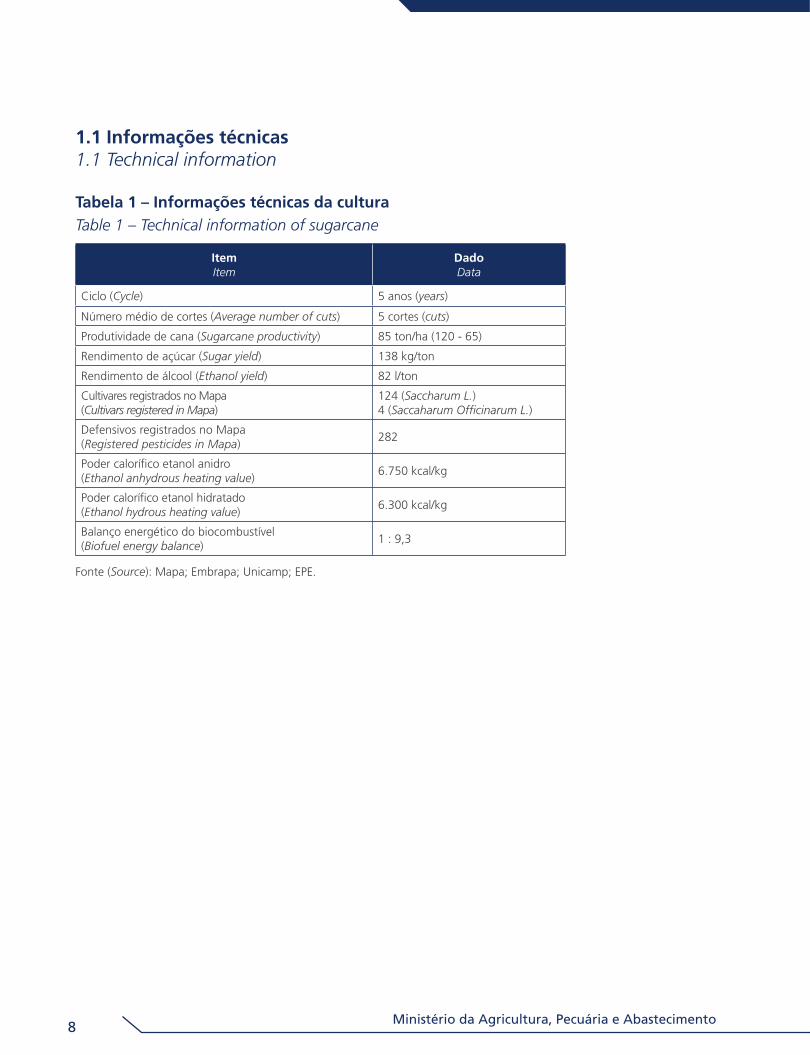
2.1 Produção – Evolução da produção de etanol no Brasil2.1 Production – Ethanol production in Brazil
Tabela 10 – Produção brasileira de etanol: anidro e hidratadoTable 10 – Ethanol production in Brazil: anhydrous and hydrous
SafrasHarvests
Etanol em m³ Ethanol in m³
AnidroAnhydrous
HidratadoHydrous
Total
1948/49 - - 383.092
1949/50 - - 169.184
1950/51 - - 125.934
1951/52 47.997 122.365 170.362
1952/53 99.154 130.389 229.543
1953/54 139.506 129.533 269.039
1954/55 168.490 137.755 306.245
1955/56 165.837 117.352 283.189
1956/57 104.412 147.975 252.387
1957/58 245.098 153.719 398.817
1958/59 281.727 154.584 436.311
1959/60 302.159 169.885 472.044
1960/61 175.289 281.013 456.302
1961/62 206.196 221.324 427.520
1962/63 101.142 242.575 343.717
1963/64 96.089 309.387 405.476
1964/65 110.231 276.731 386.962
1965/66 336.274 266.433 602.707
1966/67 382.127 345.351 727.478
1967/68 358.496 317.766 676.262
1968/69 143.309 330.336 473.645
1969/70 100.444 361.165 461.609
1970/71 252.317 384.833 637.150
1971/72 389.948 223.120 613.068
1972/73 388.891 292.081 680.972
1973/74 306.215 359.763 665.979
1974/75 216.528 378.457 594.985
1975/76 232.621 323.006 555.627
1976/77 300.340 363.982 664.322
1977/78 1.176.948 293.456 1.470.404
1978/79 2.095.597 395.006 2.490.603
1979/80 2.715.381 681.071 3.396.452
1980/81 2.105.289 1.601.086 3.706.375
(Continua / Continues)

Anuário Estatístico da Agroenergia – 2012 31
SafrasHarvests
Etanol em m³ Ethanol in m³
AnidroAnhydrous
HidratadoHydrous
Total
1981/82 1.453.098 2.787.025 4.240.123
1982/83 3.549.405 2.273.634 5.823.039
1983/84 2.469.443 5.394.803 7.864.246
1984/85 2.102.585 7.089.744 9.192.329
1985/86 3.273.201 8.658.398 11.931.599
1986/87 2.163.469 8.343.243 10.506.712
1987/88 1.982.414 9.475.982 11.458.396
1988/89 1.716.490 9.928.392 11.644.882
1989/90 1.452.625 10.467.850 11.920.475
1990/91 1.286.568 10.228.583 11.515.151
1991/92 1.986.794 10.735.439 12.722.233
1992/93 2.216.385 9.513.106 11.729.491
1993/94 2.522.589 8.769.596 11.292.185
1994/95 2.873.470 9.892.440 12.765.910
1995/96 3.057.557 9.659.202 12.716.759
1996/97 4.629.340 9.801.109 14.430.449
1997/98 5.699.719 9.722.534 15.422.253
1998/99 5.679.998 8.246.823 13.926.821
1999/00 6.140.769 6.936.996 13.077.765
2000/01 5.584.730 4.932.805 10.517.535
2001/02 6.479.187 4.988.608 11.467.795
2002/03 7.009.063 5.476.363 12.485.426
2003/04 8.767.898 5.872.025 14.639.923
2004/05 8.172.488 7.035.421 15.207.909
2005/06 7.663.245 8.144.939 15.808.184
2006/07 8.078.306 9.861.122 17.939.428
2007/08 8.464.520 13.981.459 22.445.979
2008/09 9.630.481 18.050.758 27.681.239
2009/10 6.937.770 18.800.905 25.738.675
2010/11 8.027.283 19.576.837 27.604.120
2011/12* 8.623.614 14.077.179 22.700.793
Fonte (Source): Mapa; Unica. Nota: * Dados apurados em 15/05/2012.
* Data value at May 15, 2012.Obs.: Estimativas com base na quantidade de cana destinada para álcool e produtividade da safra
1951/52, 1948/49, 1949/50 e 1950/51.Estimation based in amount of sugarcane destined for ethanol production and productivity of harvests 1951/52, 1948/49, 1949/50 and 1950/51.Dados da Unica (Data from Unica): 1951/52, 1952/53, 1953/54, 1954/55, 1955/56, 1956/57, 1957/58, 1958/59, 1959/60, 1960/61, 1961/62, 1962/63, 1963/64, 1964/65, 1965/66, 1966/67, 1967/68, 1968/69, 1969/70, 1984/85, 1985/86, 1986/87, 1987/88, 1988/89, 1989/90 e 1990/91
(Continuação / Continued)

Ministério da Agricultura, Pecuária e Abastecimento32
Gráfico 12 – Evolução da produção brasileira de etanolChart 12 – Ethanol production in Brazil
-
5
10
15
20
25
30
1948
/49
1951
/52
1954
/55
1957
/58
1960
/61
1963
/64
1966
/67
1969
/70
1972
/73
1975
/76
1978
/79
1981
/82
1984
/85
1987
/88
1990
/91
1993
/94
1996
/97
1999
/00
2002
/03
2005
/06
2008
/09
2011
/12*
Milh
ões
de
met
ros
cúb
ico
s
Mill
ion
s o
f cu
bic
met
ers
Safras / Harvests
Gráfico 13 – Evolução da produção brasileira de etanol, por tipoChart 13 – Ethanol production in Brazil, by type
1948
/49
1951
/52
1954
/55
1957
/58
1960
/61
1963
/64
1966
/67
1969
/70
1972
/73
1975
/76
1978
/79
1981
/82
1984
/85
1987
/88
1990
/91
1993
/94
1996
/97
1999
/00
2002
/03
2005
/06
2008
/09
2011
/12*
Milh
ões
de
met
ros
cúb
ico
s
Mill
ion
s o
f cu
bic
met
ers
Safras / Harvests
Hidratado (Hydrous) Anidro (Anhydrous)
5
10
15
20
25
30
-

Anuário Estatístico da Agroenergia – 2012 33
Tabela 11 – Produção mensal de etanol anidro no Brasil, em m³Table 11 – Brazilian monthly production of anhydrous ethanol, in m³
MêsMonth
Safras Harvests Total/mês
Total/month2008/09 2009/10 2010/11 2011/12
abr/08 179.516 179.516
mai/08 658.799 658.799
jun/08 909.339 909.339
jul/08 1.049.667 1.049.667
ago/08 1.079.279 1.079.279
set/08 1.452.712 1.452.712
out/08 1.862.858 1.862.858
nov/08 1.336.382 1.336.382
dez/08 690.390 690.390
jan/09 222.206 222.206
fev/09 109.525 109.525
mar/09 72.347 72.347
abr/09 7.451 174.420 181.871
mai/09 10 605.644 605.654
jun/09 0 719.839 719.839
jul/09 0 859.121 859.121
ago/09 0 912.326 912.326
set/09 818.961 818.961
out/09 997.563 997.563
nov/09 998.927 998.927
dez/09 515.486 515.486
jan/10 159.185 159.185
fev/10 111.093 111.093
mar/10 61.534 61.534
abr/10 3.671 428.749 432.420
mai/10 0 877.549 877.549
jun/10 0 985.421 985.421
jul/10 0 1.031.834 1.031.834
ago/10 0 1.191.773 1.191.773
set/10 1.135.425 1.135.425
out/10 1.016.136 1.016.136
nov/10 762.411 762.411
dez/10 271.758 271.758
jan/11 155.150 155.150
fev/11 71.023 71.023
(Continua / Continues)

Ministério da Agricultura, Pecuária e Abastecimento34
MêsMonth
Safras Harvests Total/mês
Total/month2008/09 2009/10 2010/11 2011/12
mar/11 76.005 76.005
abr/11 22.325 304.474 326.799
mai/11 1.724 1.087.930 1.089.654
jun/11 0 1.117.061 1.117.061
jul/11 0 1.273.923 1.273.923
ago/11 0 1.403.168 1.403.168
set/11 1.463.829 1.463.829
out/11 957.177 957.177
nov/11 558.746 558.746
dez/11 182.787 182.787
jan/12 137.169 137.169
fev/12 119.783 119.783
mar/12 15.445 15.445
abr/12 2.122 2.122
Total 9.630.481 6.937.770 8.027.283 8.623.614
Fonte (Source): Mapa/Sapcana.
Gráfico 14 – Produção mensal de etanol anidro no Brasil, em m³Chart 14 – Brazilian monthly production of anhydrous ethanol, in m³
0
200.000
400.000
600.000
800.000
1.000.000
1.200.000
1.400.000
1.600.000
1.800.000
2.000.000
abr/0
8
jul/0
8
out/0
8
jan/
09
abr/0
9
jul/0
9
out/0
9
jan/
10
abr/1
0
jul/1
0
out/1
0
jan/
11
abr/1
1
jul/1
1
out/1
1
jan/
12
abr/1
2
Met
ros
cúb
ico
s
Cu
bic
met
ers
Meses / Months
(Continuação / Continued)

Anuário Estatístico da Agroenergia – 2012 35
Gráfico 15 – Comparativo de safra na produção mensal etanol anidro, em m³Chart 15 – Monthly anhydrous ethanol production, in m3
0
200.000
400.000
600.000
800.000
1.000.000
1.200.000
1.400.000
1.600.000
1.800.000
2.000.000
abril
maio
junho
julh
o
agosto
sete
mbro
outubro
novem
bro
dezem
bro
janeir
o
feve
reiro
mar
ço
abril
maio
junho
julh
o
agosto
Met
ros
cúb
ico
s
Cu
bic
met
ers
Meses / Months
safra 2008/09 (harvest 2008/09) safra 2009/10 (harvest 2009/10)safra 2010/11 (harvest 2010/11) safra 2011/12 (harvest 2011/12)
Tabela 12 – Produção mensal de etanol hidratado no Brasil, em m³Table 12 – Brazilian monthly production of hydrous ethanol, in m³
MêsMonth
SafrasHarvests Total/mês
Total/month2008/09 2009/10 2010/11 2011/12
abr/08 593.263 593.263
mai/08 1.440.206 1.440.206
jun/08 1.554.614 1.554.614
jul/08 1.886.699 1.886.699
ago/08 3.081.199 3.081.199
set/08 2.562.798 2.562.798
out/08 2.284.831 2.284.831
nov/08 2.157.135 2.157.135
dez/08 1.325.471 1.325.471
jan/09 399.655 399.655
fev/09 447.945 447.945
mar/09 288.872 288.872
abr/09 20.920 1.362.598 1.383.518
mai/09 7.140 2.548.364 2.555.504
jun/09 10 2.627.572 2.627.582
(Continua / Continues)

Ministério da Agricultura, Pecuária e Abastecimento36
MêsMonth
SafrasHarvests Total/mês
Total/month2008/09 2009/10 2010/11 2011/12
jul/09 0 1.780.681 1.780.681
ago/09 0 2.417.167 2.417.167
set/09 2.081.375 2.081.375
out/09 1.988.622 1.988.622
nov/09 1.831.390 1.831.390
dez/09 1.286.956 1.286.956
jan/10 433.525 433.525
fev/10 220.696 220.696
mar/10 203.708 203.708
abr/10 14.419 1.856.628 1.871.047
mai/10 3.832 2.315.288 2.319.120
jun/10 0 2.678.888 2.678.888
jul/10 0 2.841.681 2.841.681
ago/10 0 2.976.183 2.976.183
set/10 2.469.939 2.469.939
out/10 1.871.741 1.871.741
nov/10 1.344.629 1.344.629
dez/10 694.862 694.862
jan/11 246.643 246.643
fev/11 130.648 130.648
mar/11 129.430 129.430
abr/11 17.700 540.322 558.022
mai/11 1.141 1.833.279 1.834.420
jun/11 1.136 2.244.214 2.245.350
jul/11 0 2.088.981 2.088.981
ago/11 300 2.076.675 2.076.975
set/11 2.172.320 2.172.320
out/11 1.385.269 1.385.269
nov/11 1.045.662 1.045.662
dez/11 303.462 303.462
jan/12 175.196 175.196
fev/12 178.811 178.811
mar/12 23.660 23.660
abr/12 9.328 9.328
Total 18.050.758 18.800.905 19.576.837 14.077.179
Fonte (Source): Mapa/Sapcana.
(Continuação / Continued)

Anuário Estatístico da Agroenergia – 2012 37
Gráfico 16 – Produção mensal de etanol hidratado no Brasil, em m³Chart 16 – Brazilian monthly production of hydrous ethanol, in m³
0
500.000
1.000.000
1.500.000
2.000.000
2.500.000
3.000.000
3.500.000
abr/0
8
jul/0
8
out/08
jan/09
abr/0
9
jul/0
9
out/09
jan/10
abr/1
0
jul/1
0
out/10
jan/11
abr/1
1
jul/1
1
out/11
jan/12
abr/1
2
Met
ros
cúb
ico
s
Cu
bic
met
ers
Meses / Months
Gráfico 17 – Comparativo de safra na produção mensal etanol hidratado, em m³Chart 17 – Monthly hydrous ethanol production, in m3
0
500.000
1.000.000
1.500.000
2.000.000
2.500.000
3.000.000
3.500.000
abril
maio
junho
julh
o
agosto
sete
mbro
outubro
novem
bro
dezem
bro
janeir
o
feve
reiro
mar
ço
abril
maio
junho
julh
o
agosto
Met
ros
cúb
ico
s
Cubi
c m
eter
s
Meses / Months
Safra 2008/09 (Harvest 2008/09) Safra 2009/10 (Harvest 2009/10) Safra 2010/11 (Harvest 2010/11) Safra 2011/12 (Harvest 2011/12)

Ministério da Agricultura, Pecuária e Abastecimento38
Tabela 13 – Produção mensal de etanol total no Brasil, em m³Table 13 – Brazilian monthly production of total ethanol, in m³
MêsMonth
Safras Harvests Total/mês
Total/month2008/09 2009/10 2010/11 2011/12
abr/08 772.779 772.779 mai/08 2.099.005 2.099.005 jun/08 2.463.953 2.463.953 jul/08 2.936.366 2.936.366 ago/08 4.160.478 4.160.478 set/08 4.015.510 4.015.510 out/08 4.147.689 4.147.689 nov/08 3.493.517 3.493.517 dez/08 2.015.861 2.015.861 jan/09 621.861 621.861 fev/09 557.470 557.470 mar/09 361.219 361.219 abr/09 28.371 1.537.018 1.565.389 mai/09 7.150 3.154.008 3.161.158 jun/09 10 3.347.411 3.347.421 jul/09 0 2.639.802 2.639.802 ago/09 0 3.329.493 3.329.493 set/09 2.900.336 2.900.336 out/09 2.986.185 2.986.185 nov/09 2.830.317 2.830.317 dez/09 1.802.442 1.802.442 jan/10 592.710 592.710 fev/10 331.789 331.789 mar/10 265.242 265.242 abr/10 18.090 2.285.377 2.303.467 mai/10 3.832 3.192.837 3.196.669 jun/10 0 3.664.309 3.664.309 jul/10 0 3.873.515 3.873.515 ago/10 0 4.167.956 4.167.956 set/10 3.605.364 3.605.364 out/10 2.887.877 2.887.877 nov/10 2.107.040 2.107.040 dez/10 966.620 966.620 jan/11 401.793 401.793 fev/11 201.671 201.671 mar/11 205.435 205.435 abr/11 40.025 844.796 884.821 mai/11 2.865 2.921.209 2.924.074 jun/11 1.136 3.361.275 3.362.411 jul/11 0 3.362.904 3.362.904 ago/11 300 3.479.843 3.480.143 set/11 3.636.149 3.636.149 out/11 2.342.446 2.342.446 nov/11 1.604.408 1.604.408 dez/11 486.249 486.249 jan/12 312.365 312.365 fev/12 298.594 298.594 mar/12 39.105 39.105 abr/12 11.450 11.450 Total 27.681.239 25.738.675 27.604.120 22.700.793
Fonte (Source): Mapa/Sapcana.

Anuário Estatístico da Agroenergia – 2012 39
Gráfico 18 – Produção mensal de etanol total no Brasil, em m³Chart 18 – Brazilian monthly production of total ethanol, in m³
0
500.000
1.000.000
1.500.000
2.000.000
2.500.000
3.000.000
3.500.000
4.000.000
4.500.000
abr/
08
jul/0
8
ou
t/08
jan
/09
abr/
09
jul/0
9
ou
t/09
jan
/10
abr/
10
jul/1
0
ou
t/10
jan
/11
abr/
11
jul/1
1
ou
t/11
jan
/12
abr/
12
Met
ros
cúb
ico
s
Cu
bic
met
ers
Meses / Months
Gráfico 19 – Comparativo de safra na produção mensal etanol total, em m³Chart 19 – Monthly total ethanol production, in m3
0
500.000
1.000.000
1.500.000
2.000.000
2.500.000
3.000.000
3.500.000
4.000.000
4.500.000
abril
mai
o
junh
o
julh
o ag
osto
se
tem
bro
outu
bro
nove
mbr
o de
zem
bro
jane
iro
feve
reiro
m
arço
abril
mai
o
junh
o
julh
o ag
osto
Met
ros
cúb
ico
s
Cu
bic
met
ers
Meses / Months
safra 2008/09 (harvest 2008/09) safra 2009/10 (harvest 2009/10)safra 2010/11 (harvest 2010/11) safra 2011/12 (harvest 2011/12)

Ministério da Agricultura, Pecuária e Abastecimento40
2.2 Exportação2.2 Exports
Tabela 14 – Exportações brasileiras de etanol em volume, valor e preço médio, por ano civil Table 14 – Volume, value and average price of ethanol exports, by year
AnoYear
Volume em mil m³ Volume in thousand
m³
Valor em milhões de US$
Value in million US$
Preço médio em US$/m³
Average price US$/ m³
1989 42 32 294,34
1990 40 39 248,77
1991 10 24 319,93
1992 189 68 335,36
1993 47 89 368,55
1994 90 101 376,38
1995 35 131 417,55
1996 68 126 456,46
1997 117 54 461,51
1998 94 36 376,51
1999 326 66 202,13
2000 218 35 159,65
2001 342 92 269,27
2002 782 169 216,40
2003 743 158 212,54
2004 2.371 498 209,90
2005 2.592 766 295,31
2006 3.429 1.605 468,01
2007 3.533 1.478 418,28
2008 5.124 2.390 466,45
2009 3.296 1.338 405,94
2010 1.900 1.014 533,78
2011 1.964 1.492 759,55
Fonte (Source): MDIC/ Secex.Obs.: Nomenclatura Comum do Mercosul 2207.10.00 - 2207.20.19
Mercosul Common Nomenclature 2207.10.00 - 2207.20.19.

Anuário Estatístico da Agroenergia – 2012 41
Gráfico 20 – Volume do etanol brasileiro exportado, por ano civilChart 20 – Volume of brazilian ethanol exports, by year
1989
19
90
1991
19
92
1993
19
94
1995
19
96
1997
19
98
1999
20
00
2001
20
02
2003
20
04
2005
20
06
2007
20
08
2009
20
10
2011
Etan
ol e
xpo
rtad
o e
m m
etro
s cú
bic
os
Ex
po
rted
eth
ano
l in
cu
bic
met
er
Anos / Years
1.000
2.000
3.000
4.000
5.000
6.000
-
Gráfico 21 – Valor das exportações brasileiras de etanol, por ano civilChart 21 – Value of Brazilian ethanol exports, by year
500
1.000
1.500
2.000
2.500
3.000
1989
19
90
1991
19
92
1993
19
94
1995
19
96
1997
19
98
1999
20
00
2001
20
02
2003
20
04
2005
20
06
2007
20
08
2009
20
10
2011
Etan
ol e
xpo
rtad
o e
m m
ilhõ
es U
SD
Exp
ort
ed e
than
ol i
n m
illio
ns
USD
Anos / Years
-

Ministério da Agricultura, Pecuária e Abastecimento42
Gráfico 22 – Preço médio do etanol brasileiro exportado, por ano civilChart 22 – Average price of brazilian ethanol exports, by year
1989
19
90
1991
19
92
1993
19
94
1995
19
96
1997
19
98
1999
20
00
2001
20
02
2003
20
04
2005
20
06
2007
20
08
2009
20
10
2011
Preç
o m
édio
US$
/m3
Ave
rag
e p
rice
US$
/m3
Anos / Years
100
200
300
400
500
600
700
800
-

Anuário Estatístico da Agroenergia – 2012 43
Tabela 15 – Exportações brasileiras de etanol em volume, valor e preço médio, por safra Table 15 – Volume, value and average price of brazilian ethanol exports, by harvest
SafraHarvest
Volume em mil m³ Volume in thousand m³
Valor em milhões de US$
Value in million US$
Preço médio em US$/m³
Average price US$/ m³
1989/90 72 56 216,92
1990/91 2 17 144,97
1991/92 5 19 286,10
1992/93 79 282 280,46
1993/94 73 251 290,08
1994/95 79 260 304,54
1995/96 134 390 342,77
1996/97 67 179 374,77
1997/98 55 152 358,74
1998/99 40 159 250,56
1999/00 70 486 143,22
2000/01 94 21 225,76
2001/02 539 138 253,93
2002/03 805 164 211,49
2003/04 1.048 226 210,74
2004/05 2.542 584 226,27
2005/06 2.511 798 323,33
2006/07 3.845 1.859 471,17
2007/08 3.631 1.498 413,42
2008/09 4.689 2.190 461,47
2009/10 2.940 1.239 476,82
2010/11 1.864 1.022 563,13
2011/12* 1.884 1.474 782,55
Fonte (Source):MDIC/Secex.Nota: * Dados apurados em 15/05/2012.
* Data value at May 15, 2012.Obs.: Nomenclatura Comum do Mercosul 2207.10.00 - 2207.20.19.
Mercosul Common Nomenclature 2207.10.00 - 2207.20.19.

Ministério da Agricultura, Pecuária e Abastecimento44
Gráfico 23 – Valor das exportações brasileiras de etanol, por safraChart 23 – Value of brazilian ethanol exports, by harvest
-
500
1.000
1.500
2.000
2.500
3.000
3.500
4.000
4.500
5.000
1989
/90
1990
/91
1991
/92
1992
/93
1993
/94
1994
/95
1995
/96
1996
/97
1997
/98
1998
/99
1999
/00
2000
/01
2001
/02
2002
/03
2003
/04
2004
/05
2005
/06
2006
/07
2007
/08
2008
/09
2009
/10
2010
/11
2011
/12*
Etan
ol e
xpo
rtad
o e
m m
etro
s cú
bic
os
Exp
ort
ed e
than
ol i
n c
ub
ic m
eter
Safras / Harvests
Gráfico 24 – Volume das exportações brasileiras de álcool, por safraChart 24 – Volume of brazilian ethanol exports, by harvest
-
500
1.000
1.500
2.000
2.500
1989
/90
1990
/91
1991
/92
1992
/93
1993
/94
1994
/95
1995
/96
1996
/97
1997
/98
1998
/99
1999
/00
2000
/01
2001
/02
2002
/03
2003
/04
2004
/05
2005
/06
2006
/07
2007
/08
2008
/09
2009
/10
2010
/11
2011
/12*
Etan
ol e
xpo
rtad
o e
m m
ilhõ
es U
SD
Exp
ort
ed e
than
ol i
n m
illio
ns
USD
Safras / Harvests

Anuário Estatístico da Agroenergia – 2012 45
Gráfico 25 – Evolução do preço médio do álcool brasileiro exportado, por safraChart 25 – Average price of brazilian ethanol exports, by harvest
0
150
300
450
600
750
900
1989
/90
1990
/91
1991
/92
1992
/93
1993
/94
1994
/95
1995
/96
1996
/97
1997
/98
1998
/99
1999
/00
2000
/01
2001
/02
2002
/03
2003
/04
2004
/05
2005
/06
2006
/07
2007
/08
2008
/09
2009
/10
2010
/11
2011
/12*
Preç
o m
édio
US$
/m3
Ave
rag
e p
rice
US$
/m3
Safras / Harvests

Ministério da Agricultura, Pecuária e Abastecimento46
2.3 Importação2.3 Imports
Tabela 16 – Importação brasileira de etanol em volume, valor e preço médio, por ano civil Table 16 – Volume, value and average price of brazilian ethanol imports, by year
AnoYear
Volume em mil m³ Volume in thousand m³
Valor em milhões de US$
Value in million US$
Preço médio em US$/m³
Average price US$/ m³
1989 98,0 15,7 160,69
1990 847,4 205,5 242,54
1991 791,2 225,9 285,55
1992 238,9 60,1 251,74
1993 536,4 133,2 248,39
1994 1.254,6 380,1 302,98
1995 1.417,4 471,7 332,78
1996 926,7 327,4 353,29
1997 529,9 179,6 338,98
1998 12,5 4,3 343,33
1999 17,9 4,2 233,94
2000 64,0 11,9 186,57
2001 117,9 42,7 362,22
2002 1,7 0,9 502,10
2003 6,2 1,5 236,26
2004 0,4 0,3 836,32
2005 0,2 0,3 1.283,73
2006 0,1 0,2 2.546,56
2007 3,3 2,0 625,42
2008 0,9 1,5 1.637,94
2009 4,4 2,3 505,45
2010 75,6 39,1 1.932,59
2011 1.137,0 841,0 1.351,96
Fonte (Source): MDIC/Secex.Obs.: Nomenclatura Comum do Mercosul 2207.10.00 - 2207.20.19.
Mercosul Common Nomenclature 2207.10.00 - 2207.20.19.

Anuário Estatístico da Agroenergia – 2012 47
Gráfico 26 – Volume de etanol brasileiro importado, por ano civilChart 26 – Volume of brazilian ethanol imports, by year
-
250
500
750
1.000
1.250
1.500 19
89
1990
19
91
1992
19
93
1994
19
95
1996
19
97
1998
19
99
2000
20
01
2002
20
03
2004
20
05
2006
20
07
2008
20
09
2010
20
11
Etan
ol i
mp
ort
ado
em
met
ros
cúb
ico
s
Imp
ort
ed e
than
ol i
n c
ub
ic m
eter
3
Anos / Years
Gráfico 27 – Valor das importações brasileiras de etanol, por ano civilChart 27 –Value of brazilian ethanol imports, by year
-
150
300
450
600
750
900
1989
19
90
1991
19
92
1993
19
94
1995
19
96
1997
19
98
1999
20
00
2001
20
02
2003
20
04
2005
20
06
2007
20
08
2009
20
10
2011
Etan
ol i
mp
ort
ado
em
milh
ões
US$
Imp
ort
ed E
than
ol i
n m
illio
ns
US$
Anos / Years

Ministério da Agricultura, Pecuária e Abastecimento48
Gráfico 28 – Preço médio das importações brasileiras de etanol, por ano civilChart 28 – Average price of brazilian ethanol imports, by year
-
600
1.200
1.800
2.400
3.000
1989
19
90
1991
19
92
1993
19
94
1995
19
96
1997
19
98
1999
20
00
2001
20
02
2003
20
04
2005
20
06
2007
20
08
2009
20
10
2011
Preç
o m
édio
US$
/m3
Ave
rag
e p
rice
US$
/m3
Anos / Years

Anuário Estatístico da Agroenergia – 2012 49
Tabela 17 – Importação brasileira de etanol em volume, valor e preço médio, por safra Table 17 – Volume, value and average price of brazilian ethanol imports, by harvest
SafraHarvest
Volume em mil m³
Volume in thousand m³
Valor em milhões de US$ Value in million US$
Preço médio em US$/m³
Average price US$/ m³
1989/90 366,5 102,2 248,77
1990/91 793,6 200,7 238,98
1991/92 868,6 222,1 291,19
1992/93 230,0 75,8 240,58
1993/94 911,4 230,6 262,74
1994/95 2.082,0 424,3 316,14
1995/96 1.344,9 516,4 333,73
1996/97 796,1 359,9 358,41
1997/98 204,2 82,8 332,74
1998/99 2,6 1,5 565,30
1999/00 37,5 7,2 197,37
2000/01 108,3 28,7 269,26
2001/02 57,7 22,9 403,96
2002/03 5,3 1,3 239,78
2003/04 2,0 0,8 393,47
2004/05 0,3 0,3 1.243,53
2005/06 0,2 0,3 1.439,79
2006/07 3,9 1,8 592,12
2007/08 0,5 0,7 1.321,63
2008/09 2,5 0,9 347,74
2009/10 41,0 21,2 517,18
2010/11 61,4 34,7 565,62
2011/12* 1.443,0 1.054,3 730,62
Fonte (Source): MDIC/Secex.Nota: * Dados apurados em 15/05/2012.
* Data value at May 15, 2012.Obs.: Nomenclatura Comum do Mercosul 2207.10.00 - 2207.20.19.
Mercosul Common Nomenclature 2207.10.00 - 2207.20.19.

Ministério da Agricultura, Pecuária e Abastecimento50
Gráfico 29 – Volume de etanol brasileiro importado, por safraChart 29 – Volume of brazilian ethanol imports, by harvest
-
500
1.000
1.500
2.000
2.500
1989
/90
1990
/91
1991
/92
1992
/93
1993
/94
1994
/95
1995
/96
1996
/97
1997
/98
1998
/99
1999
/00
2000
/01
2001
/02
2002
/03
2003
/04
2004
/05
2005
/06
2006
/07
2007
/08
2008
/09
2009
/10
2010
/11
2011
/12*
Etan
ol e
xpo
rtad
o e
m m
etro
s cú
bic
os
Exp
ort
ed E
than
ol i
n c
ub
ic m
eter
Safras / Harvests
Gráfico 30 – Valor das importações brasileiras de etanol, por safraChart 30 – Value of brazilian ethanol imports, by harvest
0
200
400
600
800
1000
1200
1989
/90
1990
/91
1991
/92
1992
/93
1993
/94
1994
/95
1995
/96
1996
/97
1997
/98
1998
/99
1999
/00
2000
/01
2001
/02
2002
/03
2003
/04
2004
/05
2005
/06
2006
/07
2007
/08
2008
/09
2009
/10
2010
/11
2011
/12*
Etan
ol e
xpo
rtad
o e
m m
ilhõ
es U
S$
Exp
ort
ed e
than
ol i
n m
illio
ns
US$
Safras / Harvests

Anuário Estatístico da Agroenergia – 2012 51
Gráfico 31 – Preço médio das importações brasileiras de etanol, por safraChart 31 – Average price of brazilian ethanol imports, by harvest
-
600
1.200
1.800
2.400
3.000
1989
19
90
1991
19
92
1993
19
94
1995
19
96
1997
19
98
1999
20
00
2001
20
02
2003
20
04
2005
20
06
2007
20
08
2009
20
10
2011
Preç
o m
édio
US$
/m3
Ave
rag
e p
rice
US$
/m3
Anos / Years

Ministério da Agricultura, Pecuária e Abastecimento52
2.4 Consumo2.4 Domestic consumption
Tabela 18 – Consumo de etanol combustível no BrasilTable 18 – Ethanol consumption in Brazil
Ano Year
Anidro em milhões de litros
Anhydrous in million liters
Hidratado em milhões de litros
Hydrous in million liters
Total em milhões de litros
Total in million liters1970 184 - 1841971 254 - 2541972 391 - 3911973 309 - 3091974 190 - 1901975 162 - 1621976 172 - 1721977 639 - 6391978 1.504 2 1.5061979 2.219 16 2.2351980 2.253 429 2.6821981 1.146 1.392 2.5381982 2.021 1.674 3.6951983 2.197 2.950 5.1471984 2.082 4.575 6.6571985 2.121 6.088 8.2091986 2.442 8.397 10.8391987 2.136 8.919 11.0551988 1.966 9.760 11.7261989 1.622 11.068 12.6901990 1.218 10.212 11.4301991 1.647 10.251 11.8981992 2.226 9.387 11.6131993 2.430 9.675 12.1051994 3.126 9.760 12.8861995 3.372 9.946 13.3181996 4.054 9.785 13.8391997 5.014 8.305 13.3191998 5.337 7.717 13.0541999 6.002 7.051 13.0532000 5.705 5.443 11.1482001 6.008 4.257 10.2652002 6.419 4.609 11.0282003 7.257 3.762 11.0192004 7.451 4.835 12.2862005 7.638 5.656 13.2942006 5.200 7.095 12.2952007 6.227 10.366 16.5932008 6.616 14.667 19.5842009 6.352 16.471 22.8232010 7.089 16.141 23.230
Fonte (Source): EPE/MME.

Anuário Estatístico da Agroenergia – 2012 53
Gráfico 32 – Consumo de etanol combustível no BrasilChart 32 – Consumption of fuel ethanol in Brazil
-
2.600
5.200
7.800
10.400
13.000
15.600
18.200
20.800
23.400
26.000 19
70
1971
19
72
1973
19
74
1975
19
76
1977
19
78
1979
19
80
1981
19
82
1983
19
84
1985
19
86
1987
19
88
1989
19
90
1991
19
92
1993
19
94
1995
19
96
1997
19
98
1999
20
00
2001
20
02
2003
20
04
2005
20
06
2007
20
08
2009
20
10 Co
nsu
mo
de
etan
ol e
m m
ilhõ
es d
e lit
ros
Et
han
ol c
on
sum
pti
on
in m
illio
n li
ters
Anos / Years
Anidro (Anhydrous) Hidratado (Hydrous) Total (Total)

Ministério da Agricultura, Pecuária e Abastecimento54
2.5 Estoque2.5 Stocks
Tabela 19 – Estoque de etanol anidro no Brasil, em m³Table 19 – Brazilian anhydrous ethanol stocks, in m³
MêsMonth
Safras Harvests Total/mês
Total/month2008/09 2009/10 2010/11 2011/12
01/09/08 975.266 975.266 01/10/08 1.496.430 1.496.430 01/11/08 2.273.224 2.273.224 01/12/08 2.938.553 2.938.553 01/01/09 2.979.794 2.979.794 01/02/09 2.587.555 2.587.555 01/03/09 1.897.382 1.897.382 01/04/09 1.178.582 1.178.582 01/05/09 145.667 466.074 611.741 01/06/09 76.128 625.125 701.253 01/07/09 37.777 776.414 814.191 01/08/09 14.855 965.481 980.336 01/09/09 4.559 1.259.462 1.264.021 01/10/09 1.446.664 1.446.664 01/11/09 1.848.416 1.848.416 01/12/09 2.191.047 2.191.047 01/01/10 1.980.746 1.980.746 01/02/10 1.396.137 1.396.137 01/03/10 931.875 931.875 01/04/10 537.914 537.914 01/05/10 80.702 261.254 341.956 01/06/10 28.523 530.932 559.455 01/07/10 11.192 918.216 929.408 01/08/10 2.168 1.271.126 1.273.294 01/09/10 6.690 1.822.379 1.829.069 01/10/10 2.295.732 2.295.732 01/11/10 2.671.611 2.671.611 01/12/10 2.822.962 2.822.962 01/01/11 2.365.826 2.365.826 01/02/11 1.851.002 1.851.002 01/03/11 1.246.405 1.246.405 01/04/11 504.546 504.546 01/05/11 64.689 202.065 266.754 01/06/11 57.368 722.158 779.526 01/07/11 34.240 1.160.868 1.195.108 01/08/11 29.959 1.729.014 1.758.973 01/09/11 16.469 2.461.976 2.478.445 01/10/11 3.141.882 3.141.882 01/11/11 3.499.886 3.499.886 01/12/11 3.355.943 3.355.943 01/01/12 3.024.294 3.024.294 01/02/12 2.581.374 2.581.374 01/03/12 2.139.635 2.139.635 01/04/12 1.232.021 1.232.021 01/05/12 178.039 178.039
Fonte (Source): Mapa/Sapcana.

Anuário Estatístico da Agroenergia – 2012 55
Gráfico 33 – Estoque de etanol anidro no Brasil, em m3
Chart 33 – Brazilian anhydrous ethanol stocks, in m³
0
500.000
1.000.000
1.500.000
2.000.000
2.500.000
3.000.000
3.500.000
4.000.000
1/9/08
1/12/0
8
1/3/09
1/6/09
1/9/09
1/12/0
9
1/3/10
1/6/10
1/9/10
1/12/1
0
1/3/11
1/6/11
1/9/11
1/12/1
1
1/3/12
m3
Meses / Months
Gráfico 34 – Comparativo safra de estoque de etanol anidro, em m3
Chart 34 – Monthly anhydrous ethanol stocks, in m3
0
500.000
1.000.000
1.500.000
2.000.000
2.500.000
3.000.000
3.500.000
1° m
aio
1° ju
nho
1° ju
lho
1° ag
osto
1° se
tem
bro
1° o
utubro
1° n
ovem
bro
1° d
ezem
bro
1° ja
neiro
1° fe
vere
iro
1° m
arço
1° ab
ril
1° m
aio
1° ju
nho
1° ju
lho
1° ag
osto
1° se
tem
bro
m3
Meses / Months
safra 2008/09 (harvest 2008/09) safra 2009/10 (harvest 2009/10)safra 2010/11 (harvest 2010/11) safra 2011/12 (harvest 2011/12)

Ministério da Agricultura, Pecuária e Abastecimento56
Tabela 20 – Estoque de etanol hidratado no Brasil, em m³Table 20 – Brazilian hydrous ethanol stocks, in m³
MêsMonth
Safras Harvest Total/mês
Total/month
2008/09 2009/10 2010/11 2011/1201/09/08 2.657.856 2.657.856 01/10/08 3.592.588 3.592.588 01/11/08 4.254.793 4.254.793 01/12/08 4.641.218 4.641.218 01/01/09 4.227.773 4.227.773 01/02/09 3.206.166 3.206.166 01/03/09 2.240.276 2.240.276 01/04/09 1.360.387 1.360.387 01/05/09 170.515 834.945 1.005.460 01/06/09 108.421 1.620.397 1.728.818 01/07/09 76.300 1.977.843 2.054.143 01/08/09 43.327 2.317.549 2.360.876 01/09/09 31.989 2.883.666 2.915.655 01/10/09 3.048.755 3.048.755 01/11/09 3.192.490 3.192.490 01/12/09 3.302.255 3.302.255 01/01/10 2.742.352 2.742.352 01/02/10 1.914.556 1.914.556 01/03/10 1.230.764 1.230.764 01/04/10 648.963 648.963 01/05/10 114.393 682.970 797.363 01/06/10 67.035 1.433.480 1.500.515 01/07/10 39.997 2.472.482 2.512.479 01/08/10 24.977 3.554.186 3.579.163 01/09/10 16.133 4.740.319 4.756.452 01/10/10 5.336.273 5.336.273 01/11/10 5.357.998 5.357.998 01/12/10 4.935.969 4.935.969 01/01/11 3.810.511 3.810.511 01/02/11 2.608.821 2.608.821 01/03/11 1.445.119 1.445.119 01/04/11 686.356 686.356 01/05/11 99.664 350.597 450.261 01/06/11 74.591 1.069.388 1.143.979 01/07/11 62.054 1.680.321 1.742.375 01/08/11 51.171 2.393.130 2.444.301 01/09/11 48.572 3.047.142 3.095.714 01/10/11 3.934.276 3.934.276 01/11/11 4.063.029 4.063.029 01/12/11 3.900.757 3.900.757 01/01/12 3.244.065 3.244.065 01/02/12 2.602.374 2.602.374 01/03/12 1.949.506 1.949.506 01/04/12 1.051.961 1.051.961 01/05/12 172.057 172.057
Fonte (Source): Mapa/Sapcana.

Anuário Estatístico da Agroenergia – 2012 57
Gráfico 35 – Estoque de etanol hidratado no Brasil, em m³Chart 35 – Brazilian hydrous ethanol stocks, in m³
0
1.000.000
2.000.000
3.000.000
4.000.000
5.000.000
6.000.000
1/9/08
1/12/0
8
1/3/09
1/6/09
1/9/09
1/12/0
9
1/3/10
1/6/10
1/9/10
1/12/1
0
1/3/11
1/6/11
1/9/11
1/12/1
1
1/3/12
m3
Meses / Months
Gráfico 36 – Comparativo safra de estoque de etanol hidratado, em m3
Chart 36 – Monthly hydrous ethanol stocks, in m3
0
1.000.000
2.000.000
3.000.000
4.000.000
5.000.000
1° m
aio
1° ju
nho
1° ju
lho
1° ag
osto
1° se
tem
bro
1° o
utubro
1° n
ovem
bro
1° d
ezem
bro
1° ja
neiro
1° fe
vere
iro
1° m
arço
1° ab
ril
1° m
aio
1° ju
nho
1° ju
lho
1° ag
osto
1° se
tem
bro
m3
Meses / Months
safra 2008/09 (harvest 2008/09) safra 2009/10 (harvest 2009/10)safra 2010/11 (harvest 2010/11) safra 2011/12 (harvest 2011/12)

Ministério da Agricultura, Pecuária e Abastecimento58
Tabela 21 – Estoque de etanol total no Brasil, em m³Table 21 – Brazilian total ethanol stocks, in m³
DataDate
Safras Harvests Total/mês
Total/month2008/09 2009/10 2010/11 2011/12
01/09/08 3.633.122 3.633.122 01/10/08 5.089.018 5.089.018 01/11/08 6.528.017 6.528.017 01/12/08 7.579.771 7.579.771 01/01/09 7.207.567 7.207.567 01/02/09 5.793.721 5.793.721 01/03/09 4.137.658 4.137.658 01/04/09 2.538.969 2.538.969 01/05/09 316.182 1.301.019 1.617.201 01/06/09 184.549 2.245.522 2.430.071 01/07/09 114.077 2.754.257 2.868.334 01/08/09 58.182 3.283.030 3.341.212 01/09/09 36.548 4.143.128 4.179.676 01/10/09 4.495.419 4.495.419 01/11/09 5.040.906 5.040.906 01/12/09 5.493.302 5.493.302 01/01/10 4.723.098 4.723.098 01/02/10 3.310.693 3.310.693 01/03/10 2.162.639 2.162.639 01/04/10 1.186.877 1.186.877 01/05/10 195.095 944.224 1.139.319 01/06/10 95.558 1.964.412 2.059.970 01/07/10 51.189 3.390.698 3.441.887 01/08/10 27.145 4.825.312 4.852.457 01/09/10 22.823 6.562.698 6.585.521 01/10/10 7.632.005 7.632.005 01/11/10 8.029.609 8.029.609 01/12/10 7.758.931 7.758.931 01/01/11 6.176.337 6.176.337 01/02/11 4.459.823 4.459.823 01/03/11 2.691.524 2.691.524 01/04/11 1.190.902 1.190.902 01/05/11 164.353 552.662 717.015 01/06/11 131.959 1.791.546 1.923.505 01/07/11 96.294 2.841.189 2.937.483 01/08/11 81.130 4.122.144 4.203.274 01/09/11 65.041 5.509.118 5.574.159 01/10/11 7.076.158 7.076.158 01/11/11 7.562.915 7.562.915 01/12/11 7.256.700 7.256.700 01/01/12 6.268.359 6.268.359 01/02/12 5.183.748 5.183.748 01/03/12 4.089.141 4.089.141 01/04/12 2.283.982 2.283.982 01/05/12 350.096 350.096
Fonte (Source): Mapa/Sapcana.

Anuário Estatístico da Agroenergia – 2012 59
Gráfico 37 – Estoque de etanol total no Brasil, em m³Chart 37 – Brazilian total ethanol stocks, in m³
0
2.000.000
4.000.000
6.000.000
8.000.000
10.000.000
1/9/08
1/12/0
8
1/3/09
1/6/09
1/9/09
1/12/0
9
1/3/10
1/6/10
1/9/10
1/12/1
0
1/3/11
1/6/11
1/9/11
1/12/1
1
1/3/12
m3
Meses / Months
Gráfico 38 – Comparativo safra de estoque de etanol total, em m³Chart 38 – Monthly total ethanol stocks, in m3
safra 2008/09 (harvest 2008/09) safra 2009/10 (harvest 2009/10)safra 2010/11 (harvest 2010/11) safra 2011/12 (harvest 2011/12)
0
1.500.000
3.000.000
4.500.000
6.000.000
7.500.000
1° m
aio
1° ju
nho
1° ju
lho
1° ag
osto
1° se
tem
bro
1° o
utubro
1° n
ovem
bro
1° d
ezem
bro
1° ja
neiro
1° fe
vere
iro
1° m
arço
1° ab
ril
1° m
aio
1° ju
nho
1° ju
lho
1° ag
osto
1° se
tem
bro
m3
Meses / Months

AçúcarSugar
03

Anuário Estatístico da Agroenergia – 2012 61
3.1 Produção 3.1 Production
Tabela 22 – Produção brasileira de açúcarTable 22 – Sugar production in Brazil
SafrasHarvests
Açúcar em t Sugar in ton
1948/49 1.414.704
1949/50 1.268.345
1950/51 1.489.020
1951/52 1.595.706
1952/53 1.848.096
1953/54 2.002.496
1954/55 2.134.037
1955/56 2.127.784
1956/57 2.254.759
1957/58 2.662.605
1958/59 3.231.454
1959/60 3.051.782
1960/61 3.260.920
1961/62 3.385.946
1962/63 3.064.701
1963/64 3.098.650
1964/65 3.565.239
1965/66 4.558.836
1966/67 4.115.837
1967/68 4.215.588
1968/69 4.111.744
1969/70 4.332.853
1970/71 5.119.866
1971/72 5.386.635
1972/73 5.932.698
1973/74 6.683.180
1974/75 6.720.846
1975/76 5.887.832
1976/77 7.208.502
1977/78 8.307.942
1978/79 7.342.718
1979/80 6.646.226
1980/81 8.100.269
(Continua / Continues)

Ministério da Agricultura, Pecuária e Abastecimento62
SafrasHarvests
Açúcar em t Sugar in ton
1981/82 7.935.321
1982/83 8.857.127
1983/84 9.086.084
1984/85 8.818.155
1985/86 7.819.255
1986/87 8.157.204
1987/88 7.985.222
1988/89 8.070.184
1989/90 7.214.049
1990/91 7.365.341
1991/92 8.530.462
1992/93 9.264.149
1993/94 9.162.135
1994/95 11.700.465
1995/96 12.651.084
1996/97 13.631.888
1997/98 14.847.044
1998/99 17.960.587
1999/00 19.380.197
2000/01 16.020.340
2001/02 18.994.363
2002/03 22.381.336
2003/04 24.944.434
2004/05 26.632.074
2005/06 26.214.391
2006/07 30.735.077
2007/08 31.297.619
2008/09 31.506.859
2009/10 33.033.479
2010/11 38.069.510
2011/12* 35.963.738
Fonte (Source): Mapa.Nota: * Dados apurados em 15/05/2012.
* Data value at May 15, 2012.
(Continuação / Continued)

Anuário Estatístico da Agroenergia – 2012 63
Gráfico 39 – Evolução da produção brasileira de açúcarChart 39 – Sugar production in Brazil
0
6
12
18
24
30
36
42
1948
/49
1951
/52
1954
/55
1957
/58
1960
/61
1963
/64
1966
/67
1969
/70
1972
/73
1975
/76
1978
/79
1981
/82
1984
/85
1987
/88
1990
/91
1993
/94
1996
/97
1999
/00
2002
/03
2005
/06
2008
/09
2011
/12*
Milh
ões
de
ton
elad
as
Mill
ion
to
n
Safras / Harvests
Tabela 23 – Produção mensal de açúcar no Brasil, em toneladasTable 23 – Brazilian monthly production of sugar, in tonnes
MêsMonth
Safras Harvest Total/mês
Total/month2008/09 2009/10 2010/11 2011/12
abr/08 570.313 570.313
mai/08 2.213.185 2.213.185
jun/08 2.818.717 2.818.717
jul/08 3.397.781 3.397.781
ago/08 4.147.583 4.147.583
set/08 5.151.764 5.151.764
out/08 5.059.316 5.059.316
nov/08 3.835.829 3.835.829
dez/08 2.162.853 2.162.853
jan/09 870.744 870.744
fev/09 772.771 772.771
mar/09 483.025 483.025
abr/09 21.102 1.658.735 1.679.837
mai/09 5 3.312.557 3.312.562
jun/09 48 3.802.925 3.802.973
(Continua / Continues)

Ministério da Agricultura, Pecuária e Abastecimento64
MêsMonth
Safras Harvest Total/mês
Total/month2008/09 2009/10 2010/11 2011/12
jul/09 14 4.366.563 4.366.577
ago/09 1.800 4.219.300 4.221.100
set/09 3.934.770 3.934.770
out/09 4.456.440 4.456.440
nov/09 3.808.220 3.808.220
dez/09 2.028.480 2.028.480
jan/10 874.080 874.080
fev/10 265.250 265.250
mar/10 286.000 286.000
abr/10 0 2.471.689 2.471.689
mai/10 18.670 4.113.462 4.132.132
jun/10 0 4.996.929 4.996.929
jul/10 360 5.156.379 5.156.739
ago/10 1.120 5.701.331 5.702.451
set/10 5.186.890 5.186.890
out/10 4.151.412 4.151.412
nov/10 3.199.848 3.199.848
dez/10 1.237.653 1.237.653
jan/11 947.597 947.597
fev/11 513.232 513.232
mar/11 375.888 375.888
abr/11 0 783.261 783.261
mai/11 0 3.809.946 3.809.946
jun/11 0 4.825.817 4.825.817
jul/11 0 5.151.520 5.151.520
ago/11 17.200 5.619.737 5.636.937
set/11 6.387.525 6.387.525
out/11 3.986.767 3.986.767
nov/11 2.786.118 2.786.118
dez/11 1.028.726 1.028.726
jan/12 678.938 678.938
fev/12 627.062 627.062
mar/12 263.172 263.172
abr/12 15.149 15.149
Total 31.506.850 33.033.470 38.069.510 35.963.738
Fonte (Source): Mapa/Sapcana.
(Continuação / Continued)

Anuário Estatístico da Agroenergia – 2012 65
Gráfico 40 – Produção mensal de açúcar no Brasil, em toneladasChart 40 – Monthly production of brazilian sugar, in tonnes
0
1.000.000
2.000.000
3.000.000
4.000.000
5.000.000
6.000.000
7.000.000
abr/0
8
jul/0
8
out/08
jan/09
abr/0
9
jul/0
9
out/09
jan/10
abr/1
0
jul/1
0
out/10
jan/11
abr/1
1
jul/1
1
out/11
jan/12
abr/1
2
Pro
du
ção
de
açú
car
em t
on
elad
as
Sug
ar p
rod
uct
ion
in t
on
nes
Meses / Months
Gráfico 41 – Comparativo de safra na produção mensal de açúcar no Brasil, em toneladasChart 41 – Monthly production of brazilian sugar, in tonnes
safra 2008/09 (harvest 2008/09) safra 2009/10 (harvest 2009/10)safra 2010/11 (harvest 2010/11) safra 2011/12 (harvest 2011/12)
0
1.000.000
2.000.000
3.000.000
4.000.000
5.000.000
6.000.000
7.000.000
abr/0
8
mai/
08
jun/08
jul/0
8
ago/08
set/0
8
out/08
nov/08
dez/08
jan/09
fev/0
9
mar
/09
abr/0
9
mai/
09
jun/09
jul/0
9
ago/09
Pro
du
ção
de
açú
car
em t
on
elad
as
Sug
ar p
rod
uct
ion
in t
on
nes
Meses / Months

Ministério da Agricultura, Pecuária e Abastecimento66
3.2 Exportação3.2 Exports
Tabela 24 – Exportações brasileiras de açúcar em quantidade, valor e preço médio, por ano civil Table 24 – Quantity, value and average price of brazilian sugar exports, by year
AnoYear
Quantidade em mil t Quantity in thousand ton
Valor em milhões de US$
Value in million US$
Preço médio em US$/t Average price in US$/ton
1989 1.053 301 290,70
1990 1.571 526 334,74
1991 1.656 442 266,84
1992 2.411 599 248,39
1993 3.058 787 257,25
1994 3.433 992 289,03
1995 6.239 1.811 307,65
1996 5.379 1.811 299,60
1997 6.381 1.774 278,03
1998 8.371 1.943 232,16
1999 12.100 1.911 157,91
2000 6.502 1.199 184,41
2001 11.168 2.278 203,92
2002 13.354 2.091 156,78
2003 12.914 2.640 165,71
2004 15.764 2.640 167,49
2005 18.870 6.167 326,81
2006 18.870 6.167 326,81
2007 19.358 5.101 263,47
2008 19.473 5.483 281,58
2009 24.294 8.378 344,85
2010 28.000 12.762 455,78
2011 25.359 14.942 589,20
Fonte (Source): MDIC/Secex.Obs.: Nomenclatura Comum do Mercosul 2207.10.00 - 2207.20.19.
Mercosul Common Nomenclature 2207.10.00 - 2207.20.19.

Anuário Estatístico da Agroenergia – 2012 67
Gráfico 42 – Evolução do valor exportado de açúcar brasileiro, por ano civilChart 42 – Value of brazilian sugar exports, by year
0
3.200
6.400
9.600
12.800
16.000
1989
19
90
1991
19
92
1993
19
94
1995
19
96
1997
19
98
1999
20
00
2001
20
02
2003
20
04
2005
20
06
2007
20
08
2009
20
10
2011
Açú
car
exp
ort
ado
em
milh
ões
US$
Ex
po
rted
su
gar
in m
illio
ns
US$
Anos / Years
Gráfico 43 – Evolução do preço médio exportado do açúcar brasileiro, por ano civilChart 43 – Average price of brazilian sugar exports, by year
0
140
280
420
560
700
1989
19
90
1991
19
92
1993
19
94
1995
19
96
1997
19
98
1999
20
00
2001
20
02
2003
20
04
2005
20
06
2007
20
08
2009
20
10
2011
Preç
o m
édio
US$
/t
Ave
rag
e p
rice
US$
/to
n
Anos / Years

Ministério da Agricultura, Pecuária e Abastecimento68
Tabela 25 – Exportação brasileira de açúcar em quantidade, valor e preço médio, por safra Table 25 – Quantity , value and average price of brazilian sugar exports, by harvest
SafrasHarvests
Quantidade em mil t Quantity in thousand ton
Valor em milhões de US$
Value in million US$
Preço médio em US$/t Average price in US$/ton
1989/90 1.386 442 319,00
1990/91 1.597 501 313,50
1991/92 1.746 448 256,30
1992/93 2.269 565 248,94
1993/94 2.858 750 262,53
1994/95 4.225 1.256 297,28
1995/96 5.819 1.778 305,62
1996/97 5.370 1.597 297,36
1997/98 7.388 2.046 276,96
1998/99 8.624 1.843 213,67
1999/00 11.636 1.767 151,90
2000/01 6.949 1.389 199,95
2001/02 11.037 2.198 199,11
2002/03 13.543 2.111 155,84
2003/04 14.048 2.268 161,41
2004/05 16.025 3.113 194,27
2005/06 18.870 6.167 326,81
2006/07 19.597 6.434 328,31
2007/08 18.603 4.765 256,16
2008/09 20.795 6.009 288,96
2009/10 24.088 9.057 375,97
2010/11 27.515 12.970 471,39
2011/12* 24.948 14.771 592,08
Fonte (Source): MDIC/Secex.Nota: * Dados apurados em 15/05/2012.
* Data value at May 15, 2012.Obs.: Nomenclatura Comum do Mercosul 2207.10.00 - 2207.20.19
Mercosul Common Nomenclature 2207.10.00 - 2207.20.19.

Anuário Estatístico da Agroenergia – 2012 69
Gráfico 44 – Evolução da quantidade exportada de açúcar brasileiro, por safraChart 44 – Quantity of brazilian sugar exports, by harvest
-
3.500
7.000
10.500
14.000
17.500
21.000
24.500
28.000
1989
/90
1990
/91
1991
/92
1992
/93
1993
/94
1994
/95
1995
/96
1996
/97
1997
/98
1998
/99
1999
/00
2000
/01
2001
/02
2002
/03
2003
/04
2004
/05
2005
/06
2006
/07
2007
/08
2008
/09
2009
/10
2010
/11
2011
/12*
Açú
car
exp
ort
ado
em
to
nel
adas
Exp
ort
ed s
ug
ar in
to
nn
es
Safras / Harvests
Gráfico 45 – Evolução do valor exportado de açúcar brasileiro, por safraChart 45 – Value of brazilian sugar exports, by harvest
-
2.500
5.000
7.500
10.000
12.500
15.000
1989
/90
1990
/91
1991
/92
1992
/93
1993
/94
1994
/95
1995
/96
1996
/97
1997
/98
1998
/99
1999
/00
2000
/01
2001
/02
2002
/03
2003
/04
2004
/05
2005
/06
2006
/07
2007
/08
2008
/09
2009
/10
2010
/11
2011
/12*
Açú
car
exp
ort
ado
em
milh
ões
US$
Exp
ort
ed s
ug
ar in
mill
ion
s U
S$
Safras / Harvests

Ministério da Agricultura, Pecuária e Abastecimento70
Gráfico 46 – Evolução do preço médio exportado do açúcar brasileiro, por ano safraChart 46 – Average price of brazilian sugar exports, by harvest
-
60
120
180
240
300
360
420
480
540
600
1989
/90
1990
/91
1991
/92
1992
/93
1993
/94
1994
/95
1995
/96
1996
/97
1997
/98
1998
/99
1999
/00
2000
/01
2001
/02
2002
/03
2003
/04
2004
/05
2005
/06
2006
/07
2007
/08
2008
/09
2009
/10
2010
/11
2011
/12*
Preç
o m
édio
US$
/t
Ave
rag
e p
rice
US$
/to
n
Safras / Harvests

Anuário Estatístico da Agroenergia – 2012 71
Tabela 26 – Exportação de açúcar bruto em quantidade, valor e preço médio, por ano civil Table 26 – Quantity, value and average price of brazilian raw sugar exports, by year
AnoYear
Quantidade em mil t Quantity in thousand ton
Valor em milhões de US$
Value in million US$
Preço médio em US$/t
Average price in US$/ton
1989 549 147 267,84
1990 926 326 351,68
1991 978 256 261,95
1992 1.344 330 245,42
1993 2.148 550 256,07
1994 2.743 788 287,23
1995 4.800 1.451 302,21
1996 4.090 1.191 291,10
1997 3.844 1.045 271,94
1998 4.792 1.096 228,73
1999 7.827 1.162 148,50
2000 4.344 761 175,29
2001 7.090 1.401 197,58
2002 7.630 1.111 145,65
2003 8.354 1.350 161,61
2004 9.566 1.511 157,96
2005 11.579 2.382 205,73
2006 12.807 3.936 307,32
2007 12.443 3.130 251,53
2008 13.625 3.650 267,87
2009 17.926 5.979 333,52
2010 20.939 9.307 444,48
2011 20.153 11.549 573,06
Fonte (Source): MDIC/Secex.Obs.: Nomenclatura Comum do Mercosul 2207.10.00 - 2207.20.19.
Mercosul Common Nomenclature 2207.10.00 - 2207.20.19.

Ministério da Agricultura, Pecuária e Abastecimento72
Gráfico 47 – Evolução da quantidade exportada de açúcar bruto brasileiro, por ano civilChart 47 – Quantity of brazilian raw sugar exports, by year
-
2.750
5.500
8.250
11.000
13.750
16.500
19.250
22.000
1989
19
90
1991
19
92
1993
19
94
1995
19
96
1997
19
98
1999
20
00
2001
20
02
2003
20
04
2005
20
06
2007
20
08
2009
20
10
2011
Açú
car
exp
ort
ado
em
to
nel
adas
Ex
po
rted
su
gar
in t
on
nes
Anos / Years
Gráfico 48 – Evolução do valor exportado de açúcar bruto brasileiro, por ano civilChart 48 – Value of brazilian raw sugar exports, by year
-
2.000
4.000
6.000
8.000
10.000
12.000
1989
19
90
1991
19
92
1993
19
94
1995
19
96
1997
19
98
1999
20
00
2001
20
02
2003
20
04
2005
20
06
2007
20
08
2009
20
10
2011
Açú
car
exp
ort
ado
em
milh
ões
US$
Ex
po
rted
su
gar
in m
illio
ns
US$
Anos / Years

Anuário Estatístico da Agroenergia – 2012 73
Gráfico 49 – Evolução do preço médio exportado do açúcar bruto brasileiro, por ano civilChart 49 – Average price of brazilian raw sugar exports, by year
-
100
200
300
400
500
600
1989
19
90
1991
19
92
1993
19
94
1995
19
96
1997
19
98
1999
20
00
2001
20
02
2003
20
04
2005
20
06
2007
20
08
2009
20
10
2011
Preç
o m
édio
USD
/t
Ave
rag
e p
rice
US$
/to
n
Anos / Years

Ministério da Agricultura, Pecuária e Abastecimento74
Tabela 27 – Exportação de açúcar bruto em quantidade, valor e preço médio, por safra Table 27 – Quantity, value and average prices of brazilian raw sugar exports, by harvest
SafrasHarvests
Quantidade em mil t Quantity in thousand ton
Valor em milhões de US$
Value in million US$
Preço médio em US$/t
Average price in US$/ton
1989/90 844 258 305,59
1990/91 840 277 329,25
1991/92 1.066 272 254,67
1992/93 1.249 308 246,57
1993/94 2.028 528 260,33
1994/95 3.402 996 292,70
1995/96 4.451 1.331 299,09
1996/97 4.062 1.178 290,10
1997/98 4.411 1.194 270,64
1998/99 4.880 1.016 208,17
1999/00 7.711 1.116 144,68
2000/01 4.757 1.251 190,97
2001/02 6.543 1.251 191,17
2002/03 8.167 1.203 147,26
2003/04 8.660 1.357 156,67
2004/05 10.406 1.730 166,30
2005/06 11.441 2.542 222,16
2006/07 13.042 4.053 310,76
2007/08 11.886 2.896 243,66
2008/09 14.821 4.086 275,69
2009/10 17.881 6.505 363,78
2010/11 20.575 9.461 459,80
2011/12* 19.882 11.420 574,41
Fonte (Source): MDIC/Secex.Nota: * Dados apurados em 15/05/2012.
* Data value at May 15, 2012.Obs.: Nomenclatura Comum do Mercosul 2207.10.00 - 2207.20.19
Mercosul Common Nomenclature 2207.10.00 - 2207.20.19.

Anuário Estatístico da Agroenergia – 2012 75
Gráfico 50 – Evolução da quantidade exportada de açúcar bruto brasileiro, por safraChart 50 – Quantity of brazilian raw sugar exports, by harvest
-
4.400
8.800
13.200
17.600
22.000
1989
/90
1990
/91
1991
/92
1992
/93
1993
/94
1994
/95
1995
/96
1996
/97
1997
/98
1998
/99
1999
/00
2000
/01
2001
/02
2002
/03
2003
/04
2004
/05
2005
/06
2006
/07
2007
/08
2008
/09
2009
/10
2010
/11
2011
/12*
Açú
car
exp
ort
ado
em
to
nel
adas
Ex
po
rted
su
gar
in t
on
nes
Safras / Harvests
Gráfico 51 – Evolução do valor exportado de açúcar bruto brasileiro, por safraChart 51 – Value of brazilian raw sugar exports, by harvest
-
2.000
4.000
6.000
8.000
10.000
12.000
1989
/90
1990
/91
1991
/92
1992
/93
1993
/94
1994
/95
1995
/96
1996
/97
1997
/98
1998
/99
1999
/00
2000
/01
2001
/02
2002
/03
2003
/04
2004
/05
2005
/06
2006
/07
2007
/08
2008
/09
2009
/10
2010
/11
2011
/12*
Açú
car
exp
ort
ado
em
milh
ões
US$
Ex
po
rted
su
gar
in m
illio
ns
US$
Safras / Harvests
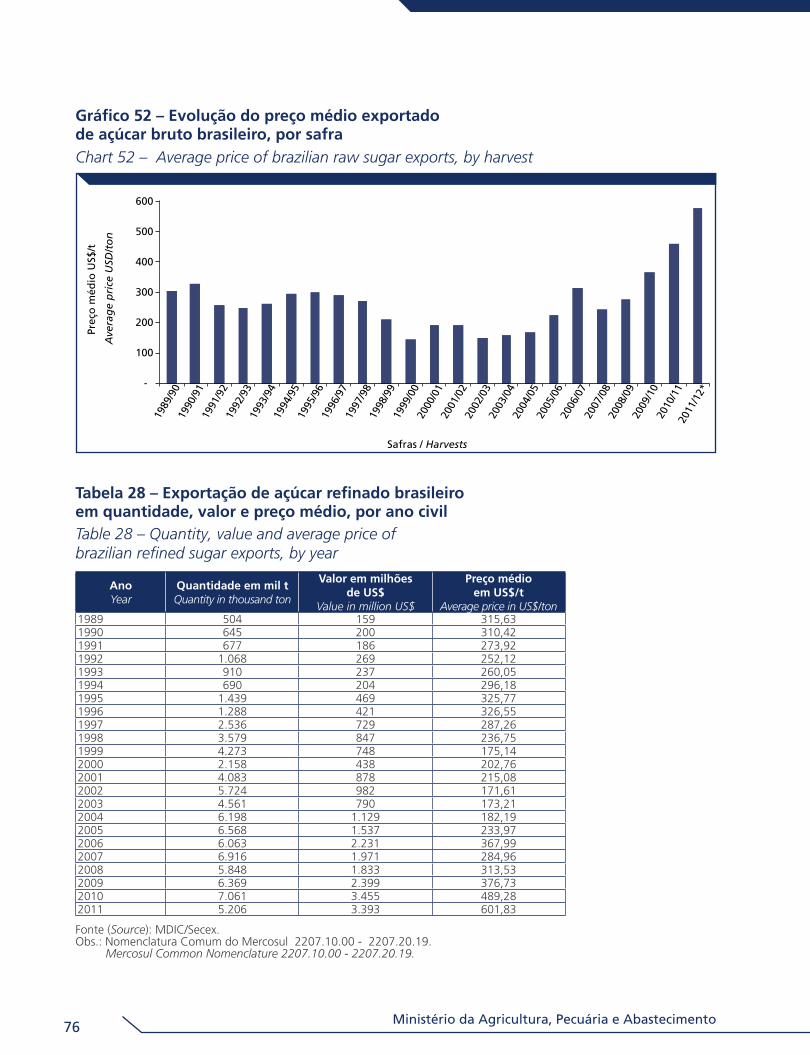
Ministério da Agricultura, Pecuária e Abastecimento76
Gráfico 52 – Evolução do preço médio exportado de açúcar bruto brasileiro, por safraChart 52 – Average price of brazilian raw sugar exports, by harvest
-
100
200
300
400
500
600
1989
/90
1990
/91
1991
/92
1992
/93
1993
/94
1994
/95
1995
/96
1996
/97
1997
/98
1998
/99
1999
/00
2000
/01
2001
/02
2002
/03
2003
/04
2004
/05
2005
/06
2006
/07
2007
/08
2008
/09
2009
/10
2010
/11
2011
/12*
Preç
o m
édio
US$
/t
Ave
rag
e p
rice
USD
/to
n
Safras / Harvests
Tabela 28 – Exportação de açúcar refinado brasileiro em quantidade, valor e preço médio, por ano civil Table 28 – Quantity, value and average price of brazilian refined sugar exports, by year
AnoYear
Quantidade em mil t Quantity in thousand ton
Valor em milhões de US$
Value in million US$
Preço médio em US$/t
Average price in US$/ton1989 504 159 315,631990 645 200 310,421991 677 186 273,921992 1.068 269 252,121993 910 237 260,051994 690 204 296,181995 1.439 469 325,771996 1.288 421 326,551997 2.536 729 287,261998 3.579 847 236,751999 4.273 748 175,142000 2.158 438 202,762001 4.083 878 215,082002 5.724 982 171,612003 4.561 790 173,212004 6.198 1.129 182,192005 6.568 1.537 233,972006 6.063 2.231 367,992007 6.916 1.971 284,962008 5.848 1.833 313,532009 6.369 2.399 376,732010 7.061 3.455 489,282011 5.206 3.393 601,83
Fonte (Source): MDIC/Secex.Obs.: Nomenclatura Comum do Mercosul 2207.10.00 - 2207.20.19.
Mercosul Common Nomenclature 2207.10.00 - 2207.20.19.

Anuário Estatístico da Agroenergia – 2012 77
Gráfico 53 – Evolução da quantidade exportada de açúcar refinado brasileiro, por ano civilChart 53 – Quantity of brazilian refined sugar exports, by year
-
1.000
2.000
3.000
4.000
5.000
6.000
7.000
8.000
1989
19
90
1991
19
92
1993
19
94
1995
19
96
1997
19
98
1999
20
00
2001
20
02
2003
20
04
2005
20
06
2007
20
08
2009
20
10
2011
Açú
car
exp
ort
ado
em
to
nel
adas
Ex
po
rted
su
gar
in t
on
nes
Anos / Years
Gráfico 54 – Evolução do valor exportado de açúcar refinado brasileiro, por ano civilChart 54 – Value of brazilian refined sugar exports, by year
-
500
1.000
1.500
2.000
2.500
3.000
3.500
1989
19
90
1991
19
92
1993
19
94
1995
19
96
1997
19
98
1999
20
00
2001
20
02
2003
20
04
2005
20
06
2007
20
08
2009
20
10
2011
Açú
car
exp
ort
ado
em
milh
ões
US$
Ex
po
rted
su
gar
in m
illio
ns
US$
Anos / Years

Ministério da Agricultura, Pecuária e Abastecimento78
Gráfico 55 Evolução do preço médio exportado de açúcar refinado brasileiro, por ano civilChart 55 – Average price of brazilian refined sugar exports, by year
-
100
200
300
400
500
600
700
1989
19
90
1991
19
92
1993
19
94
1995
19
96
1997
19
98
1999
20
00
2001
20
02
2003
20
04
2005
20
06
2007
20
08
2009
20
10
2011
Preç
o m
édio
US$
/t
Ave
rag
e p
rice
US/
ton
Anos / Years

Anuário Estatístico da Agroenergia – 2012 79
Tabela 29 – Exportação de açúcar refinado brasileiro em quantidade, valor e preço médio, por safra Table 29 – Quantity, value and average price of brazilian refined sugar exports, by harvest
SafrasHarvests
Quantidade em mil t Quantity in thousand ton
Valor em milhões de US$
Value in million US$
Preço médio em US$/t
Average price in US$/ton
1989/90 542 184 339,89
1990/91 757 224 296,02
1991/92 680 176 258,85
1992/93 1.019 257 251,84
1993/94 830 222 267,90
1994/95 822 260 316,22
1995/96 1.368 447 326,90
1996/97 1.309 419 319,90
1997/98 2.976 852 286,33
1998/99 3.744 827 220,83
1999/00 3.926 652 166,07
2000/01 2.192 947 219,45
2001/02 4.494 947 210,67
2002/03 5.376 908 168,89
2003/04 5.389 911 169,02
2004/05 6.180 1.193 193,03
2005/06 6.145 1.567 254,99
2006/07 6.555 2.381 363,23
2007/08 6.717 1.869 278,29
2008/09 5.974 1.923 321,87
2009/10 6.207 2.552 411,07
2010/11 6.939 3.509 505,74
2011/12* 5.066 3.351 661,39
Fonte (Source): MDIC/Secex.Nota: * Dados apurados em 15/05/2012.
* Data value at May 15, 2012.Obs.: Nomenclatura Comum do Mercosul 2207.10.00 - 2207.20.19
Mercosul Common Nomenclature 2207.10.00 - 220.7.20.19

Ministério da Agricultura, Pecuária e Abastecimento80
Gráfico 56 – Evolução na exportação de açúcar refinado brasileiro, por safraChart 56 – Quantity of brazilian refined sugar exports, by harvest
-
1.000
2.000
3.000
4.000
5.000
6.000
7.000
1989
/90
1990
/91
1991
/92
1992
/93
1993
/94
1994
/95
1995
/96
1996
/97
1997
/98
1998
/99
1999
/00
2000
/01
2001
/02
2002
/03
2003
/04
2004
/05
2005
/06
2006
/07
2007
/08
2008
/09
2009
/10
2010
/11
2011
/12*
Açú
car
exp
ort
ado
em
to
nel
adas
Ex
po
rted
su
gar
in t
on
nes
Safras / Harvests
Gráfico 57 – Evolução do valor exportado de açúcar refinado brasileiro, por safraChart 57 – Value of brazilian refined sugar exports, by harvest
-
600
1.200
1.800
2.400
3.000
3.600
1989
/90
1990
/91
1991
/92
1992
/93
1993
/94
1994
/95
1995
/96
1996
/97
1997
/98
1998
/99
1999
/00
2000
/01
2001
/02
2002
/03
2003
/04
2004
/05
2005
/06
2006
/07
2007
/08
2008
/09
2009
/10
2010
/11
2011
/12*
Açú
car
exp
ort
ado
em
milh
ões
US$
Ex
po
rted
su
gar
in m
illio
ns
US$
Safras / Harvest

Anuário Estatístico da Agroenergia – 2012 81
Gráfico 58 – Evolução do preço médio exportado de açúcar refinado brasileiro, por safraChart 58 – Average price of brazilian refined sugar exports, by harvest
-
136
272
408
544
680
1989
/90
1990
/91
1991
/92
1992
/93
1993
/94
1994
/95
1995
/96
1996
/97
1997
/98
1998
/99
1999
/00
2000
/01
2001
/02
2002
/03
2003
/04
2004
/05
2005
/06
2006
/07
2007
/08
2008
/09
2009
/10
2010
/11
2011
/12*
Preç
o m
édio
US$
/t
Ave
rag
e p
rice
US$
/to
n
Safras / Harvest
Gráfico 59 – Evolução da quantidade de açúcar exportado brasileiro, por ano civilChart 59 – Quantity of brazilian sugar exports, by year
-
5.000
10.000
15.000
20.000
25.000
30.000
1989
19
90
1991
19
92
1993
19
94
1995
19
96
1997
19
98
1999
20
00
2001
20
02
2003
20
04
2005
20
06
2007
20
08
2009
20
10
2011
Açú
car
exp
ort
ado
em
to
nel
adas
Ex
po
rted
su
gar
in t
on
nes
Anos / Years

Ministério da Agricultura, Pecuária e Abastecimento82
Tabela 30 – Importação brasileira de açúcar em quantidade, valor e preço médio, por ano civil Table 30 – Quantity, value and average price of brazilian sugar imports, annually
Ano Year
Quantidade em mil t Quantity in thousand ton
Valor em milhões de US$
Value in million US$
Preço médio em US$/t
Average price in US$/ton
1989 0,04 0,02 387,86
1990 0,00 0,01 2.387,41
1991 0,02 0,02 1.013,76
1992 100,44 18,09 180,14
1993 58,75 12,73 216,60
1994 52,99 13,25 249,98
1995 27,98 10,02 358,17
1996 0,06 0,71 11.360,24
1997 0,05 0,24 4.859,70
1998 0,05 0,07 1.419,98
1999 0,03 0,03 1.167,13
2000 0,03 0,03 1.281,23
2001 0,01 0,03 1.841,28
2002 0,02 0,03 1.441,58
2003 0,00 0,02 5.681,25
2004 0,01 0,12 12.043,59
2005 0,01 0,04 5.380,19
2006 0,03 0,08 2.947,27
2007 0,06 0,13 2.130,88
2008 0,02 0,15 7.515,55
2009 0,02 0,14 7.468,75
2010 0,02 0,25 10.141,30
2011 0,04 0,35 9.312,83
Fonte (Source): MDIC/Secex.Obs.: Nomenclatura Comum do Mercosul 2207.10.00 - 2207.20.19.
Mercosul Common Nomenclature 2207.10.00 - 2207.20.19.

Anuário Estatístico da Agroenergia – 2012 83
Gráfico 60 – Evolução da quantidade importada de açúcar no Brasil, por ano civilChart 60 – Quantity of brazilian sugar imports, by year
-
15
30
45
60
75
90
105
1989
19
90
1991
19
92
1993
19
94
1995
19
96
1997
19
98
1999
20
00
2001
20
02
2003
20
04
2005
20
06
2007
20
08
2009
20
10
2011
Açú
car
imp
ort
ado
em
to
nel
adas
Im
po
rted
su
gar
in t
on
nes
Anos / Years
Gráfico 61 – Evolução do preço médio importado de açúcar no Brasil, por ano civilChart 61 – Average price of brazilian sugar imports, by year
-
1.300
2.600
3.900
5.200
6.500
7.800
9.100
10.400
11.700
13.000
1989
19
90
1991
19
92
1993
19
94
1995
19
96
1997
19
98
1999
20
00
2001
20
02
2003
20
04
2005
20
06
2007
20
08
2009
20
10
2011
Preç
o m
édio
US$
/t
Ave
rag
e p
rice
USD
/to
n
Anos / Years

Ministério da Agricultura, Pecuária e Abastecimento84
Gráfico 62 – Evolução do valor importado de açúcar no Brasil, por ano civilChart 62 – Value of brazilian sugar imports, by year
-
2
4
6
8
10
12
14
16
18
20
1989
19
90
1991
19
92
1993
19
94
1995
19
96
1997
19
98
1999
20
00
2001
20
02
2003
20
04
2005
20
06
2007
20
08
2009
20
10
2011
Açú
car
imp
ort
ado
em
milh
ões
US$
Imp
ort
ed s
ug
ar in
mill
ion
s U
S$
Anos / Years
Tabela 31 – Importação brasileira de açúcar em quantidade, valor e preço médio, por safraTable 31 – Quantity, value and average price of brazilian sugar imports, by harvest
SafrasHarvests
Quantidade em mil t Quantity in thousand ton
Valor em milhões de US$
Value in million US$
Preço médio em US$/t Average price in US$/ton
1989/90 0,27 0,02 57,401990/91 0,00 0,00 765,671991/92 32,02 5,52 172,311992/93 75,31 14,02 186,151993/94 67,09 14,78 220,251994/95 65,73 19,09 290,491995/96 0,01 0,24 19.184,721996/97 0,04 0,22 5.915,691997/98 0,04 0,05 1.258,191998/99 0,05 0,07 1.480,841999/00 0,04 0,04 944,192000/01 0,08 0,03 314,782001/02 0,03 0,03 1.192,262002/03 0,01 0,02 2.801,682003/04 0,00 0,03 5.955,222004/05 0,01 0,12 11.576,982005/06 0,01 0,04 5.198,292006/07 0,05 0,11 2.082,172007/08 0,04 0,13 3.246,982008/09 0,04 0,22 5.659,042009/10 0,02 0,15 6.051,912010/11 0,03 0,28 9.475,252011/12* 0,04 0,37 9.515,12
Fonte (Source): MDIC/Secex.Notas: * Dados apurados em 15/05/2012.
* Data value at May 15, 2012.Obs.: Nomenclatura Comum do Mercosul 2207.10.00 - 2207.20.19.
Mercosul Common Nomenclature 2207.10.00 - 2207.20.19.

Anuário Estatístico da Agroenergia – 2012 85
Gráfico 63 – Evolução da quantidade importada de açúcar no Brasil, por safraChart 63 – Quantity of brazilian sugar imports, by harvest
-
10
20
30
40
50
60
70
80
198
9/90
1
990/
91
199
1/92
1
992/
93
199
3/94
1
994/
95
199
5/96
1
996/
97
199
7/98
1
998/
99
199
9/00
2
000/
01
200
1/02
2
002/
03
200
3/04
2
004/
05
200
5/06
2
006/
07
200
7/08
2
008/
09
200
9/10
2
010/
11
2011
/12*
Açú
car
imp
ort
ado
em
to
nel
adas
Im
po
rted
su
gar
in t
on
nes
Safras / Harvests
Gráfico 64 – Evolução do valor importado de açúcar no Brasil, por safraChart 64 – Value of brazilian sugar imports, by harvest
-
4
8
12
16
20
198
9/90
1
990/
91
199
1/92
1
992/
93
199
3/94
1
994/
95
199
5/96
1
996/
97
199
7/98
1
998/
99
199
9/00
2
000/
01
200
1/02
2
002/
03
200
3/04
2
004/
05
200
5/06
2
006/
07
200
7/08
2
008/
09
200
9/10
2
010/
11
2011
/12*
Açú
car
imp
ort
ado
em
milh
ões
US$
Imp
ort
ed s
ug
ar in
mill
ion
s U
S$
Safras / Harvests

Ministério da Agricultura, Pecuária e Abastecimento86
Gráfico 65 – Evolução do preço médio importado de açúcar no Brasil, por safraChart 65 – Average price of brazilian sugar imports, by harvest
-
2.500
5.000
7.500
10.000
12.500
15.000
17.500
20.000
198
9/90
1
990/
91
199
1/92
1
992/
93
199
3/94
1
994/
95
199
5/96
1
996/
97
199
7/98
1
998/
99
199
9/00
2
000/
01
200
1/02
2
002/
03
200
3/04
2
004/
05
200
5/06
2
006/
07
200
7/08
2
008/
09
200
9/10
2
010/
11
2011
/12*
Preç
o m
édio
US$
/t
Ave
rag
e p
rice
US$
ton
Safras / Harvests

Anuário Estatístico da Agroenergia – 2012 87
Tabela 32 – Importação de açúcar bruto no Brasil em quantidade, valor e preço médio, por ano civil Table 32 – Quantity, value and average price of brazilian raw sugar imports, by year
Ano Year
Quantidade em mil t Quantity in thousand ton
Valor em milhões de US$
Value in million US$
Preço médio em US$/t
Average price in US$/ton
1989 0,04 0,02 387,86
1990 0,00 0,00 391,39
1991 - - -
1992 100,44 18,08 180,05
1993 58,73 12,62 214,84
1994 52,96 13,05 246,45
1995 27,91 9,15 327,92
1996 0,00 0,00 693,39
1997 0,00 0,00 1.510,45
1998 0,00 0,00 975,86
1999 0,00 0,00 1.234,13
2000 0,00 0,00 630,53
2001 0,00 0,00 797,00
2002 0,00 0,00 890,21
2003 0,00 0,00 1.796,61
2004 0,00 0,00 5.218,31
2005 0,00 0,00 2.025,90
2006 0,01 0,01 674,40
2007 0,03 0,02 785,39
2008 0,00 0,01 5.347,87
2009 0,01 0,02 3.159,87
2010 0,00 0,03 7.591,99
2011 0,00 0,01 4.948,41
Fonte (Source): MDIC/Secex.Obs.: Nomenclatura Comum do Mercosul 2207.10.00 - 2207.20.19.
Mercosul Common Nomenclature 2207.10.00 - 2207.20.19.

Ministério da Agricultura, Pecuária e Abastecimento88
Gráfico 66 – Evolução da quantidade importada de açúcar bruto no Brasil, por ano civilChart 66 – Quantity of brazilian raw sugar imports, by year
-
20,0
40,0
60,0
80,0
100,0
120,0
1989
19
90
1991
19
92
1993
19
94
1995
19
96
1997
19
98
1999
20
00
2001
20
02
2003
20
04
2005
20
06
2007
20
08
2009
20
10
2011
Açú
car
imp
ort
ado
em
to
nel
adas
Im
po
rted
su
gar
in t
on
nes
Anos / Years
Gráfico 67 – Evolução do valor importado de açúcar bruto no Brasil, por ano civil Chart 67 – Value of brazilian raw sugar imports, by year
-
4
8
12
16
20
1989
19
90
1991
19
92
1993
19
94
1995
19
96
1997
19
98
1999
20
00
2001
20
02
2003
20
04
2005
20
06
2007
20
08
2009
20
10
2011
Açú
car
imp
ort
ado
em
milh
ões
US$
Anos / Years
Imp
ort
ed s
ug
ar in
to
nn
es

Anuário Estatístico da Agroenergia – 2012 89
Gráfico 68 – Evolução do preço médio importado de açúcar bruto no Brasil, por ano civilChart 68 – Average price of brazilian raw sugar imports, by year
-
1.000
2.000
3.000
4.000
5.000
6.000
7.000
8.000
1989
19
90
1991
19
92
1993
19
94
1995
19
96
1997
19
98
1999
20
00
2001
20
02
2003
20
04
2005
20
06
2007
20
08
2009
20
10
2011
Preç
o m
édio
US$
/t
Ave
rag
e p
rice
US$
ton
Anos / Years

Ministério da Agricultura, Pecuária e Abastecimento90
Tabela 33 – Importação de açúcar bruto no Brasil em quantidade, valor e preço médio, por safraTable 33 – Quantity , value and average price of brazilian raw sugar imports, by harvest
SafrasHarvests
Quantidade em mil t Quantity in thousand ton
Valor em milhões de US$
Value in million US$
Preço médio em US$/t Average price in US$/ton
1989/90 0,268 0,015 57,401990/91 0,001 0,001 416,181991/92 32 5 171,841992/93 75 14 184,431993/94 67 15 216,481994/95 66 19 289,581995/96 0,001 0,002 2.297,451996/97 0,019 0,014 750,421997/98 - - -1998/99 0,002 0,002 1.081,761999/00 0,003 0,003 820,262000/01 0,002 0,002 1.050,492001/02 0,002 0,001 778,522002/03 0,002 0,002 834,112003/04 0,0002 0,0004 2.009,902004/05 0,0004 0,001 1.395,522005/06 0,0002 0,001 4.023,042006/07 0,032 0,020 621,772007/08 0,008 0,016 2.138,482008/09 0,023 0,074 3.220,552009/10 0,007 0,024 3.395,352010/11 0,004 0,026 6.325,972011/12* 0,001 0,005 4.196,67
Fonte (Source): MDIC/Secex.Nota: * Dados apurados em 15/05/2012.
* Data value at May 15, 2012.Obs.: Nomenclatura Comum do Mercosul 2207.10.00 - 2207.20.19.
Mercosul Common Nomenclature 2207.10.00 - 2207.20.19.
Gráfico 69 – Evolução na quantidade importada de açúcar bruto no Brasil, por safraChart 69 – Quantity of brazilian raw sugar imports, by harvest
0
10
20
30
40
50
60
70
80
198
9/90
1
990/
91
199
1/92
1
992/
93
199
3/94
1
994/
95
199
5/96
1
996/
97
199
7/98
1
998/
99
199
9/00
2
000/
01
200
1/02
2
002/
03
200
3/04
2
004/
05
200
5/06
2
006/
07
200
7/08
2
008/
09
200
9/10
2
010/
11
2011
/12*
Açú
car
imp
ort
ado
em
to
nel
adas
Im
po
rted
su
gar
in t
on
nes
Safras / Harvests

Anuário Estatístico da Agroenergia – 2012 91
Gráfico 70 – Evolução no valor importado de açúcar bruto no Brasil, por safraChart 70 – Value of brazilian raw sugar imports, by harvest
-
2
4
6
8
10
12
14
16
18
20
198
9/90
1
990/
91
199
1/92
1
992/
93
199
3/94
1
994/
95
199
5/96
1
996/
97
199
7/98
1
998/
99
199
9/00
2
000/
01
200
1/02
2
002/
03
200
3/04
2
004/
05
200
5/06
2
006/
07
200
7/08
2
008/
09
200
9/10
2
010/
11
2011
/12*
Açú
car
imp
ort
ado
em
milh
ões
US$
Im
po
rted
su
gar
in m
illio
ns
US$
Safras / Harvests
Gráfico 71 – Evolução no preço médio de açúcar bruto no Brasil, por safraChart 71 – Average price of brazilian raw sugar, by harvest
-
1.000
2.000
3.000
4.000
5.000
6.000
7.000
198
9/90
1
990/
91
199
1/92
1
992/
93
199
3/94
1
994/
95
199
5/96
1
996/
97
199
7/98
1
998/
99
199
9/00
2
000/
01
200
1/02
2
002/
03
200
3/04
2
004/
05
200
5/06
2
006/
07
200
7/08
2
008/
09
200
9/10
2
010/
11
2011
/12*
Preç
o m
édio
US$
/t
Ave
rag
e p
rice
US$
ton
Safras / Harvests

Ministério da Agricultura, Pecuária e Abastecimento92
Tabela 34 – Importação de açúcar refinado em quantidade, valor e preço médio no Brasil, por ano civil Table 34 – Quantity, value and average price of brazilian refined sugar imports, by year
Ano Year
Quantidade em mil tQuantity in thousand ton
Valor em milhões de US$
Value in million US$
Preço médio em US$/t Average price in US$/ton
1989 - - -1990 0,001 0,005 5.623,721991 0,018 0,018 991,901992 0,002 0,009 6.238,501993 0,017 0,107 13.541,631994 0,030 0,195 6.461,061995 0,078 0,872 11.241,121996 0,059 0,708 11.961,251997 0,048 0,237 4.982,971998 0,047 0,068 1.446,811999 0,027 0,031 1.143,842000 0,023 0,031 1.347,832001 0,013 0,025 1.923,082002 0,017 0,027 1.506,812003 0,004 0,024 5.335,052004 0,010 0,117 11.690,652005 0,007 0,042 6.241,552006 0,015 0,073 4.889,842007 0,036 0,111 3.083,572008 0,018 0,139 7.641,772009 0,011 0,115 10.418,772010 0,021 0,223 10.585,162011 0,036 0,345 9.463,54
Fonte (Source): MDIC/Secex.Obs.: Nomenclatura Comum do Mercosul 2207.10.00 - 2207.20.19.
Mercosul Common Nomenclature 2207.10.00 - 2207.20.19.
Gráfico 72 – Evolução da quantidade importada de açúcar refinado no Brasil, por ano civilChart 72 – Quantity of brazilian refined sugar imports, by year
0
0,01
0,02
0,03
0,04
0,05
0,06
0,07
0,08
1989
19
90
1991
19
92
1993
19
94
1995
19
96
1997
19
98
1999
20
00
2001
20
02
2003
20
04
2005
20
06
2007
20
08
2009
20
10
2011
Açú
car
imp
ort
ado
em
to
nel
adas
Im
po
rted
su
gar
in t
on
nes
Anos /Years

Anuário Estatístico da Agroenergia – 2012 93
Gráfico 73 – Evolução do valor importado de açúcar refinado no Brasil, por ano civilChart 73 – Value of brazilian refined sugar imports, by year
-
0,2
0,4
0,6
0,8
1,0
1989
19
90
1991
19
92
1993
19
94
1995
19
96
1997
19
98
1999
20
00
2001
20
02
2003
20
04
2005
20
06
2007
20
08
2009
20
10
2011
Açú
car
imp
ort
ado
em
milh
ões
US$
Im
po
rted
su
gar
in m
illio
ns
US$
Anos /Years
Gráfico 74 – Evolução do preço médio importado de açúcar refinado no Brasil, por ano civilChart 74 – Average price of refined sugar imports, by year
-
1.750
3.500
5.250
7.000
8.750
10.500
12.250
14.000
1989
19
90
1991
19
92
1993
19
94
1995
19
96
1997
19
98
1999
20
00
2001
20
02
2003
20
04
2005
20
06
2007
20
08
2009
20
10
2011
Preç
o m
édio
US$
/t
Ave
rag
e p
rice
US$
/to
n
Anos / Years

Ministério da Agricultura, Pecuária e Abastecimento94
Tabela 35 – Importação de açúcar refinado no Brasil em quantidade, valor e preço médio, por safra Table 35 – Quantity, value and average price of brazilian refined sugar imports, by harvest
SafrasHarvests
Quantidade em mil t Quantity in thousand ton
Valor em milhões de US$
Value in million US$
Preço médio em US$/t Average price in US$/ton
1989/90 - - - 1990/91 0,001 0,001 1.312,431991/92 0,018 0,018 1.006,041992/93 0,006 0,131 22.549,131993/94 0,019 0,257 13.599,781994/95 0,046 0,073 1.612,581995/96 0,012 0,239 20.741,151996/97 0,018 0,202 10.205,331997/98 0,041 0,051 1.244,751998/99 0,044 0,066 1.520,141999/00 0,038 0,036 944,742000/01 0,082 0,025 2.555,562001/02 0,024 0,029 1.309,512002/03 0,005 0,017 2.824,042003/04 0,005 0,028 7.343,822004/05 0,010 0,116 11.377,132005/06 0,008 0,041 5.935,412006/07 0,020 0,089 4.518,982007/08 0,033 0,114 3.443,802008/09 0,016 0,146 9.013,492009/10 0,017 0,122 7.168,322010/11 0,025 0,253 10.059,462011/12* 0,038 0,365 9.684,60
Fonte (Source): MDIC/Secex.Nota: * Dados apurados em 15/05/2012.
* Data value at May 15, 2012.Obs.: Nomenclatura Comum do Mercosul 2207.10.00 - 2207.20.19.
Mercosul Common Nomenclature 2207.10.00 - 2207.20.19.
Gráfico 75 – Evolução da quantidade importada do açúcar refinado no Brasil, por safraChart 75 – Quantity of brazilian refined sugar imports, by harvest
0
0,01
0,02
0,03
0,04
0,05
0,06
0,07
0,08
0,09
198
9/90
1
990/
91
199
1/92
1
992/
93
199
3/94
1
994/
95
199
5/96
1
996/
97
199
7/98
1
998/
99
199
9/00
2
000/
01
200
1/02
2
002/
03
200
3/04
2
004/
05
200
5/06
2
006/
07
200
7/08
2
008/
09
200
9/10
2
010/
11
2011
/12*
Açú
car
imp
ort
ado
em
to
nel
adas
Im
po
rted
su
gar
in t
on
nes
Safras / Harvests

Anuário Estatístico da Agroenergia – 2012 95
Gráfico 76 – Evolução do valor importado do açúcar refinado no Brasil, por safraChart 76 – Value of brazilian refined sugar imports, by harvest
-
0,1
0,1
0,2
0,2
0,3
0,3
0,4
0,4
198
9/90
1
990/
91
199
1/92
1
992/
93
199
3/94
1
994/
95
199
5/96
1
996/
97
199
7/98
1
998/
99
199
9/00
2
000/
01
200
1/02
2
002/
03
200
3/04
2
004/
05
200
5/06
2
006/
07
200
7/08
2
008/
09
200
9/10
2
010/
11
2011
/12*
Açú
car
imp
ort
ado
em
milh
ões
US$
Im
po
rted
su
gar
in m
illio
ns
US$
Safras / Harvests
Gráfico 77 – Evolução do preço médio importado do açúcar refinado no Brasil, por safraChart 77 – Average price of brazilian refined sugar imports, by harvest
-
5.000
10.000
15.000
20.000
25.000
198
9/90
1
990/
91
199
1/92
1
992/
93
199
3/94
1
994/
95
199
5/96
1
996/
97
199
7/98
1
998/
99
199
9/00
2
000/
01
200
1/02
2
002/
03
200
3/04
2
004/
05
200
5/06
2
006/
07
200
7/08
2
008/
09
200
9/10
2
010/
11
2011
/12*
Preç
o m
édio
US$
/t
Ave
rag
e p
rice
US$
/to
n
Safras / Harvests

Ministério da Agricultura, Pecuária e Abastecimento96
3.4
Mer
cad
o m
un
dia
l3.
4 W
orld
mar
ket
Tab
ela
36 –
Pri
nci
pai
s p
aíse
s p
rod
uto
res
de
açú
car,
em t
on
elad
asTa
ble
36 –
Mai
n su
gar
prod
ucin
g co
untr
ies,
in t
onne
s
19
8419
8519
8619
8719
8819
8919
9019
9119
9219
9319
9419
9519
9619
97
Bras
il (B
razi
l)9.
258.
926
8.45
5.48
47.
999.
473
9.26
5.70
97.
874.
000
7.32
6.00
08.
006.
600
9.45
3.40
09.
925.
400
10.0
97.1
0012
.270
.000
13.8
34.8
0014
.717
.500
16.3
71.2
00
Índi
a (In
dia)
6.63
4.58
27.
015.
972
7.59
4.46
69.
215.
367
10.2
07.4
549.
912.
189
12.0
68.0
4113
.112
.778
13.8
72.6
0111
.750
.000
11.7
44.5
9715
.337
.168
16.8
92.1
9214
.440
.466
Uni
ão
Euro
peia
(E
urop
ean
Uni
on)
13.2
97.3
5913
.860
.040
15.1
11.2
6614
.401
.196
15.3
76.6
5116
.123
.588
17.1
75.4
9215
.994
.608
17.1
01.6
6517
.383
.652
15.7
17.5
4216
.931
.629
17.6
92.2
7318
.582
.544
Chin
a
(Chi
na)
4.30
0.00
04.
800.
000
5.70
0.00
05.
450.
000
4.87
5.00
05.
350.
000
6.25
0.00
06.
943.
600
8.86
3.70
08.
092.
827
6.32
4.78
36.
148.
040
7.09
1.00
07.
415.
000
Esta
dos
Uni
dos
da
Am
éric
a
(U.S
.A.)
5.34
1.50
65.
415.
398
5.68
5.42
26.
630.
725
6.42
9.32
66.
206.
155
5.73
9.85
46.
476.
501
6.80
4.90
77.
045.
400
6.92
0.97
77.
237.
761
6.59
3.49
36.
731.
400
Tailâ
ndia
(T
haila
nd)
2.54
9.69
22.
392.
763
2.71
8.35
12.
531.
587
2.63
8.33
94.
338.
176
3.54
2.21
34.
247.
548
5.07
7.51
43.
825.
325
4.16
7.70
85.
447.
363
6.15
4.13
56.
243.
064
Méx
ico
(M
exic
o)3.
307.
940
3.49
1.55
94.
068.
218
4.06
0.81
43.
908.
666
3.64
5.54
43.
486.
196
3.88
1.95
73.
885.
326
4.35
3.04
43.
849.
315
4.58
8.37
04.
784.
392
5.04
7.62
1
Paqu
istã
o
(Pak
istan
)1.
289.
000
1.35
9.00
01.
263.
000
1.54
0.00
01.
947.
000
2.02
0.00
02.
041.
000
2.22
7.00
02.
543.
000
2.75
0.00
03.
196.
000
3.11
6.00
02.
662.
000
2.63
4.97
1
Aus
trál
ia
(Aus
tral
ia)
3.62
6.51
93.
438.
516
3.43
8.66
23.
510.
846
3.75
9.41
53.
887.
452
3.61
2.28
83.
195.
213
4.36
2.85
14.
488.
301
5.22
2.33
95.
118.
911
5.61
7.69
55.
882.
536
Fede
raçã
o
Russ
a
(Rus
sian
Fede
ratio
n)*
8.58
6.98
48.
260.
896
8.69
5.68
09.
565.
248
8.91
3.07
29.
532.
639
9.15
8.72
56.
897.
500
2.43
6.83
02.
716.
500
1.65
0.00
02.
241.
203
1.85
1.20
21.
337.
230
Out
ros
país
es
(Oth
ers)
40.8
89.7
8439
.700
.559
38.0
42.9
2937
.921
.843
38.4
02.5
6438
.798
.889
40.0
07.9
8739
.960
.872
42.5
53.8
4039
.391
.253
39.3
94.2
4237
.881
.363
40.9
58.4
9540
.294
.830
TOTA
L M
UN
DIA
L
WO
RLD
TO
TAL
99.0
82.2
9298
.190
.187
100.
317.
467
104.
093.
335
104.
331.
487
107.
140.
632
111.
088.
396
112.
390.
977
117.
427.
634
111.
893.
402
110.
457.
503
117.
882.
608
125.
014.
377
124.
980.
862
(Con
tinua
/ C
ontin
ues)

Anuário Estatístico da Agroenergia – 2012 97
19
9819
9920
0020
0120
0220
0320
0420
0520
0620
0720
0820
0920
10
Bras
il (B
razi
l)19
.168
.100
20.6
45.5
0016
.464
.200
20.3
36.1
0023
.567
.315
25.7
30.0
3627
.289
.951
27.4
38.6
5432
.270
.320
34.0
59.8
6333
.045
.360
34.3
05.2
5539
.450
.539
Índi
a (In
dia)
14.2
80.9
6417
.405
.982
20.2
46.9
9719
.906
.213
19.5
24.5
3821
.701
.754
14.4
32.3
8615
.215
.826
22.3
46.5
4629
.090
.294
25.9
36.0
0015
.654
.974
21.1
50.8
46
Uni
ão E
urop
eia
(Eur
opea
n U
nion
)17
.397
.822
18.7
30.7
5817
.853
.992
15.5
00.1
5718
.268
.077
16.5
78.4
0521
.843
.267
21.6
97.6
4617
.579
.659
16.9
04.3
3714
.707
.994
16.3
67.8
8416
.760
.296
Chin
a
(Chi
na)
8.90
3.90
08.
526.
700
7.61
6.30
07.
160.
707
9.80
4.50
011
.433
.000
10.9
12.0
009.
785.
100
10.6
82.0
0013
.895
.000
15.4
65.0
7513
.628
.589
11.6
00.0
00
Esta
dos
Uni
dos
da A
mér
ica
(U
.S.A
.)7.
159.
033
8.24
3.40
08.
080.
428
7.77
4.00
06.
804.
770
7.96
3.60
17.
647.
184
6.78
3.80
07.
034.
246
7.67
7.80
86.
956.
228
6.85
4.89
87.
635.
221
Tailâ
ndia
(T
haila
nd)
4.14
3.33
25.
455.
644
6.15
7.13
85.
370.
310
6.43
7.79
77.
737.
186
7.46
2.22
64.
588.
903
5.64
5.53
57.
146.
607
7.77
4.00
77.
944.
924
6.76
9.97
8
Méx
ico
(M
exic
o)5.
287.
366
5.02
9.86
34.
816.
050
5.61
3.52
95.
073.
149
5.44
1.73
55.
671.
964
5.61
9.28
05.
411.
856
5.42
0.00
05.
939.
800
5.18
0.97
25.
075.
000
Paqu
istã
o
(Pak
istan
)3.
502.
530
3.70
9.16
82.
053.
308
2.71
9.58
43.
334.
373
4.06
3.27
24.
480.
949
2.83
8.84
53.
262.
508
4.35
5.00
04.
996.
822
3.50
0.00
03.
860.
000
Aus
trál
ia
(Aus
tral
ia)
5.08
4.84
15.
513.
649
4.41
6.87
04.
768.
350
5.61
3.52
85.
315.
362
5.53
0.21
95.
393.
079
4.72
9.27
14.
626.
923
4.61
8.77
04.
522.
836
3.63
4.21
8
Fede
raçã
o
Russ
a(R
ussia
n Fe
dera
tion)
*
1.36
9.50
31.
651.
224
1.70
5.27
51.
756.
527
1.75
6.79
61.
892.
000
2.49
5.70
82.
719.
140
3.45
8.88
73.
405.
000
3.78
8.93
53.
601.
554
2.97
3.38
0
Out
ros
país
es(O
ther
s)39
.558
.761
40.0
52.2
9140
.611
.874
39.7
47.4
6141
.905
.801
40.2
68.7
3239
.519
.291
38.6
00.2
5139
.925
.861
39.0
78.1
8438
.381
.437
38.9
11.5
6437
.731
.729
TOTA
L M
UN
DIA
L W
ORL
D T
OTA
L12
5.85
6.15
213
4.96
4.17
913
0.02
2.43
213
0.65
2.93
814
2.09
0.64
414
8.12
5.08
314
7.28
5.14
514
0.68
0.52
415
2.34
6.68
916
5.65
9.01
616
1.61
0.42
815
0.47
3.45
015
6.64
1.20
7
Font
e (S
ourc
e): I
nter
natio
nal S
ugar
Org
aniz
atio
n (IS
O).
Not
a: *
Os
dado
s da
ex-
U.R
.S.S
. até
o a
no d
e 19
91 e
stão
incl
usos
no
cam
po re
fere
nte
à Fe
dera
ção
Russ
a.*
Dat
a fo
r the
Rus
sian
Fed
erat
ion
for t
he y
ears
bef
ore
1991
is a
ctua
lly d
ata
from
the
U.S
.S.R
.
(Con
tinua
ção
/ Con
tinue
d)

Ministério da Agricultura, Pecuária e Abastecimento98
Tab
ela
37 –
Pri
nci
pai
s p
aíse
s co
nsu
mid
ore
s d
e aç
úca
r, em
to
nel
adas
Tabl
e 37
– M
ain
suga
r co
nsum
ing
coun
trie
s, in
ton
nes
19
8419
8519
8619
8719
8819
8919
9019
9119
9219
9319
9419
9519
9619
97
Índi
a
(Indi
a)8.
237.
218
8.97
4.35
88.
693.
726
9.73
1.64
010
.175
.391
10.5
74.7
4711
.074
.505
11.7
20.6
0412
.386
.991
12.9
89.0
0013
.700
.000
13.9
00.0
0015
.254
.240
14.9
70.7
56
Uni
ão
Euro
peia
(E
urop
ean
Uni
on)
10.6
36.4
4710
.731
.536
12.2
11.0
7311
.921
.962
12.2
40.2
7712
.685
.574
13.0
67.2
0913
.000
.607
13.6
82.5
6813
.115
.537
12.7
55.2
9313
.847
.564
14.5
16.8
3214
.551
.868
Chin
a (C
hina
)5.
700.
000
6.35
0.00
06.
700.
000
7.00
0.00
07.
200.
000
7.15
0.00
07.
125.
000
7.35
0.00
07.
615.
000
7.72
0.00
07.
800.
000
8.20
0.00
08.
250.
000
8.25
0.00
0
Bras
il(B
razi
l)6.
201.
430
6.07
9.61
16.
589.
225
6.57
2.93
46.
241.
000
7.40
1.30
06.
614.
800
7.27
6.34
97.
295.
000
7.40
5.00
07.
625.
000
8.00
5.00
08.
295.
000
8.60
0.00
0
Esta
dos
Uni
dos
da
Am
éric
a
(U.S
.A.)
7.66
2.21
17.
275.
744
7.03
6.24
37.
384.
608
7.41
9.98
97.
560.
605
7.84
8.18
77.
887.
197
8.09
7.66
78.
192.
100
8.45
4.12
48.
580.
332
8.70
1.14
58.
800.
000
Fede
raçã
o
Russ
a (R
ussia
n Fe
dera
tion)
*
13.2
00.0
0012
.610
.000
14.0
50.0
0014
.950
.000
14.3
50.0
0013
.150
.000
13.4
00.0
0011
.907
.640
6.14
5.00
05.
033.
603
4.95
6.75
55.
107.
951
5.23
5.23
45.
308.
387
Indo
nési
a(In
done
sia)
1.72
6.00
01.
794.
390
2.12
2.86
32.
350.
000
2.33
2.60
82.
324.
520
2.38
9.22
22.
526.
490
2.44
0.91
32.
723.
989
2.94
1.21
73.
341.
331
3.07
3.75
83.
350.
000
Paqu
istã
o
(Pak
istan
)1.
372.
000
1.46
7.00
01.
678.
000
1.84
8.00
01.
977.
000
2.14
7.00
02.
316.
000
2.55
5.00
02.
670.
000
2.74
7.00
02.
945.
000
2.97
1.00
03.
033.
000
3.02
3.00
0
Méx
ico
(M
exic
o)3.
343.
044
3.54
7.54
13.
451.
415
3.65
7.17
94.
070.
413
4.04
1.85
23.
878.
886
4.54
4.60
64.
301.
376
4.44
8.69
64.
370.
251
4.42
3.28
44.
228.
885
4.23
0.98
8
Egit
o
(Egy
pt)
1.60
0.00
01.
600.
000
1.65
0.00
01.
650.
000
1.77
5.00
01.
650.
000
1.72
5.00
01.
745.
000
1.75
0.00
01.
675.
000
1.70
0.00
01.
775.
000
1.85
0.00
02.
000.
000
Out
ros
país
es
(Oth
ers)
36.8
54.8
5137
.308
.956
36.4
70.1
1837
.812
.865
37.1
30.8
8938
.589
.029
38.4
47.7
3538
.435
.824
45.7
31.6
0245
.121
.781
45.3
02.6
4846
.044
.873
47.4
81.8
1849
.138
.444
TOTA
L M
UN
DIA
L
WO
RLD
TO
TAL
96.5
33.2
0197
.739
.136
100.
652.
663
104.
879.
188
104.
912.
567
107.
274.
627
107.
886.
544
108.
949.
317
112.
116.
117
111.
171.
706
112.
550.
288
116.
196.
335
119.
919.
912
122.
223.
443
(Con
tinua
/ C
ontin
ues)

Anuário Estatístico da Agroenergia – 2012 99
19
9819
9920
0020
0120
0220
0320
0420
0520
0620
0720
0820
0920
10
Índi
a
(Indi
a)15
.272
.009
16.2
77.7
1316
.546
.072
17.2
74.2
5217
.857
.051
18.6
24.7
8719
.858
.302
20.1
09.5
0020
.109
.500
20.8
78.0
0922
.550
.000
24.1
31.4
0022
.827
.000
Uni
ão
Euro
peia
(E
urop
ean
Uni
on)
13.8
18.5
7115
.006
.631
14.1
12.0
9113
.588
.256
14.3
69.5
0414
.137
.374
17.6
91.3
4116
.764
.547
17.3
97.9
6318
.540
.865
18.8
98.6
4117
.796
.386
19.1
45.2
85
Chin
a (C
hina
)8.
300.
000
8.30
0.00
08.
500.
000
8.90
0.00
09.
975.
000
11.0
65.0
0011
.613
.000
11.7
85.0
0011
.975
.000
13.5
00.0
0014
.725
.000
15.0
00.0
0014
.850
.000
Bras
il(B
razi
l)9.
005.
000
9.20
0.00
09.
550.
000
9.72
5.00
010
.519
.936
10.2
17.2
9410
.856
.685
11.9
02.2
5412
.512
.762
12.4
74.4
8812
.596
.765
12.1
99.0
2213
.233
.363
Esta
dos
Uni
dos
da
Am
éric
a
(U.S
.A.)
9.04
9.29
39.
066.
500
9.05
1.07
69.
139.
000
9.07
9.42
48.
844.
183
8.99
3.67
19.
264.
894
9.21
8.58
39.
229.
777
9.88
8.44
89.
668.
330
10.1
73.9
01
Fede
raçã
o
Russ
a (R
ussia
n Fe
dera
tion)
*
5.45
0.00
05.
565.
232
5.70
6.54
15.
847.
844
6.67
2.50
06.
850.
000
6.70
0.00
06.
600.
000
6.50
0.00
06.
500.
000
6.17
9.59
55.
652.
400
5.76
1.10
0
Indo
nési
a(In
done
sia)
2.73
6.00
23.
000.
000
3.37
5.00
03.
500.
000
3.67
5.00
03.
800.
000
3.91
5.00
04.
052.
000
4.33
0.00
04.
690.
000
4.97
5.00
05.
125.
000
5.27
5.00
0
Paqu
istã
o
(Pak
istan
)3.
085.
000
3.19
6.00
03.
295.
000
3.39
0.00
03.
490.
000
3.87
5.20
24.
004.
065
4.07
5.22
73.
950.
988
4.25
0.00
04.
538.
427
4.62
5.00
04.
715.
000
Méx
ico
(M
exic
o)4.
293.
211
4.39
9.99
24.
619.
203
4.85
6.71
05.
068.
706
5.32
8.48
75.
300.
411
4.87
6.75
04.
978.
564
4.94
4.00
05.
030.
500
5.15
2.53
54.
545.
000
Egit
o
(Egy
pt)
2.07
5.00
02.
150.
000
2.25
0.00
02.
325.
000
2.40
0.00
02.
500.
000
2.60
0.00
02.
675.
000
2.70
0.00
02.
700.
000
2.70
0.00
02.
750.
000
2.88
9.99
6
Out
ros
país
es
(Oth
ers)
50.1
43.4
6050
.269
.224
50.1
35.6
4453
.015
.365
53.9
46.1
0156
.172
.595
55.1
70.5
2156
.138
.741
59.5
79.1
0958
.951
.489
60.6
71.6
9959
.132
.506
61.5
77.0
77
TOTA
L M
UN
DIA
L
WO
RLD
TO
TAL
123.
227.
546
126.
431.
292
127.
140.
627
131.
561.
427
137.
053.
222
141.
414.
922
146.
702.
996
148.
243.
913
153.
252.
469
156.
658.
628
162.
754.
075
161.
232.
579
164.
992.
722
Font
e (S
ourc
e): I
nter
natio
nal S
ugar
Org
aniz
atio
n (IS
O).
Not
a: *
Os
dado
s da
ex-
U.R
.S.S
. até
o a
no d
e 19
91 e
stão
incl
usos
no
cam
po r
efer
ente
à F
eder
ação
Rus
sa.
* D
ata
for
the
Russ
ian
Fede
ratio
n fo
r th
e ye
ars
befo
re 1
991
is a
ctua
lly d
ata
from
the
U.S
.S.R
.
(Con
tinua
ção
/ Con
tinue
d)

Ministério da Agricultura, Pecuária e Abastecimento100
Tab
ela
38 –
Pri
nci
pai
s p
aíse
s im
po
rtad
ore
s d
e aç
úca
r, em
to
nel
adas
Tabl
e 38
– M
ain
suga
r im
port
ing
coun
trie
s, in
ton
nes
19
8419
8519
8619
8719
8819
8919
9019
9119
9219
9319
9419
9519
9619
97
Un
ião
Eu
rop
eia
(Eur
opea
n U
nion
)
1.57
1.79
91.
295.
333
1.82
7.70
31.
743.
115
1.67
7.51
71.
772.
577
1.78
9.85
91.
708.
862
1.78
6.10
71.
712.
851
1.83
3.81
31.
786.
548
1.86
8.16
91.
883.
142
Esta
do
s U
nid
os
da
Am
éric
a (U
.S.A
.)
3.02
1.30
22.
274.
669
1.79
6.00
11.
221.
301
1.30
9.86
61.
735.
629
2.50
8.25
02.
354.
493
2.04
5.22
41.
828.
751
1.60
2.94
61.
637.
320
2.86
9.70
92.
953.
039
Índ
ia
(Indi
a)39
3.60
21.
781.
235
1.04
6.47
894
3.20
246
.513
53.0
000
00
02.
653.
756
214.
789
021
5.77
2
Fed
eraç
ão
Ru
ssa
(Rus
sian
Fe
dera
tion)
*
5.70
4.19
34.
476.
969
5.17
1.13
45.
056.
283
4.36
5.85
95.
629.
753
4.08
2.29
94.
904.
990
5.14
3.70
54.
993.
554
2.24
8.15
83.
186.
029
3.27
5.30
02.
984.
951
Ind
on
ésia
(In
done
sia)
5.93
93.
266
82.0
0014
6.00
011
6.00
032
5.48
332
0.14
233
0.59
042
5.00
026
3.00
014
8.26
468
7.96
31.
206.
592
1.98
3.72
7
Irã
(Iran
)60
7.29
962
5.30
365
2.00
058
2.00
028
0.00
038
1.00
060
6.00
068
5.00
073
6.20
050
0.00
065
1.81
596
8.55
786
3.41
51.
350.
283
Ch
ina
(Chi
na)
1.34
7.97
62.
214.
000
1.09
8.02
42.
200.
000
3.95
2.00
01.
606.
000
1.14
7.18
81.
017.
737
1.10
3.40
045
3.81
62.
264.
656
2.93
7.27
61.
254.
853
801.
809
Mal
ásia
(M
alay
sia)
580.
432
619.
039
664.
547
665.
055
746.
091
790.
459
755.
841
719.
260
901.
103
897.
851
981.
969
1.05
6.85
21.
114.
089
1.16
3.35
1
Co
reia
do
Su
l (S
outh
Kor
ea)
838.
217
903.
156
968.
482
1.02
6.71
11.
092.
782
1.15
8.03
61.
097.
380
1.16
0.35
01.
229.
100
1.18
7.54
11.
274.
410
1.31
0.94
71.
401.
731
1.43
6.66
2
Ará
bia
Sa
ud
ita
(Sau
di A
rabi
a)52
2.65
525
9.00
029
1.39
441
2.00
038
9.00
046
9.60
047
9.60
047
1.10
052
1.00
048
9.90
053
7.45
851
3.64
062
8.06
258
1.54
5
Ou
tro
s p
aíse
s(O
ther
s)13
.297
.887
11.9
79.5
7012
.985
.050
13.0
01.4
1612
.380
.162
13.9
18.4
0714
.945
.460
12.9
38.8
9116
.945
.820
16.7
51.2
1716
.024
.258
19.9
66.9
7420
.817
.594
21.5
02.0
45
TOTA
L M
UN
DIA
L W
ORL
D T
OTA
L27
.891
.301
26.4
31.5
4026
.582
.813
26.9
97.0
8326
.355
.790
27.8
39.9
4427
.732
.019
26.2
91.2
7330
.836
.659
29.0
78.4
8130
.221
.503
34.2
66.8
9535
.299
.514
36.8
56.3
26
(Con
tinua
/ C
ontin
ues)

Anuário Estatístico da Agroenergia – 2012 101
19
9819
9920
0020
0120
0220
0320
0420
0520
0620
0720
0820
0920
10
Un
ião
Eu
rop
eia
(Eur
opea
n U
nion
)
1.81
3.85
61.
941.
088
1.89
7.93
21.
844.
169
2.25
0.30
32.
102.
108
2.43
3.59
42.
416.
931
2.64
2.92
13.
281.
335
3.50
5.09
43.
246.
634
3.28
7.34
1
Esta
do
s U
nid
os
da
Am
éric
a (U
.S.A
.)
2.05
6.44
21.
588.
804
1.37
3.70
51.
257.
935
1.37
3.89
21.
498.
623
1.44
6.07
42.
071.
742
2.78
5.81
71.
919.
204
2.62
1.53
52.
570.
317
3.77
1.93
9
Índ
ia
(Indi
a)67
0.35
21.
003.
249
206.
727
48.2
685.
317
01.
215.
688
1.54
6.31
00
00
4.52
3.00
02.
837.
070
Fed
eraç
ão
Ru
ssa
(Rus
sian
Fe
dera
tion)
*
3.73
2.47
86.
446.
540
5.28
8.30
36.
003.
595
5.00
0.61
14.
948.
460
3.62
7.86
73.
572.
567
2.94
1.81
03.
698.
921
2.58
2.70
01.
533.
268
2.39
6.55
1
Ind
on
ésia
(In
done
sia)
2.19
9.26
91.
958.
881
1.55
8.53
21.
306.
722
1.69
4.12
81.
897.
047
1.73
6.59
92.
002.
979
1.57
1.87
13.
067.
235
1.07
4.11
31.
905.
258
2.18
7.26
2
Irã
(Iran
)98
3.60
21.
081.
512
893.
157
723.
118
1.24
0.58
281
0.16
874
4.52
778
7.28
81.
685.
928
1.55
1.98
81.
449.
194
1.10
6.16
21.
811.
168
Ch
ina
(Chi
na)
485.
192
420.
068
673.
492
1.19
7.29
41.
192.
914
784.
014
1.16
0.24
11.
407.
348
1.39
3.88
21.
226.
095
801.
697
1.07
7.31
01.
783.
630
Mal
ásia
(M
alay
sia)
1.06
5.11
81.
172.
238
1.18
2.08
41.
230.
953
1.38
9.23
61.
470.
040
1.38
7.07
91.
353.
006
1.61
4.89
51.
669.
450
1.45
3.74
81.
527.
528
1.71
5.71
0
Co
reia
do
Su
l (S
outh
Kor
ea)
1.37
7.94
51.
374.
321
1.46
2.45
71.
515.
710
1.51
6.81
81.
560.
939
1.59
7.23
61.
623.
437
1.48
3.34
11.
515.
291
1.64
5.21
91.
651.
046
1.64
0.29
1
Ará
bia
Sa
ud
ita
(Sau
di A
rabi
a)60
1.45
845
8.36
164
8.08
064
8.30
569
6.14
667
4.26
983
4.32
51.
069.
157
980.
429
1.21
9.46
61.
529.
865
1.13
4.67
41.
380.
064
Ou
tro
s p
aíse
s(O
ther
s)22
.689
.670
22.4
66.7
3221
.343
.767
25.3
74.7
4626
.623
.557
29.4
77.0
2229
.889
.985
30.1
88.0
3432
.639
.043
29.8
00.8
6131
.765
.651
29.8
07.7
1833
.513
.899
TOTA
L M
UN
DIA
L W
ORL
D T
OTA
L37
.675
.382
39.9
11.7
9436
.528
.236
41.1
50.8
1542
.983
.504
45.2
22.6
9046
.073
.215
48.0
38.7
9949
.739
.937
48.9
49.8
4648
.428
.816
50.0
82.9
1556
.324
.925
Font
e (S
ourc
e): I
nter
natio
nal S
ugar
Org
aniz
atio
n (IS
O).
Not
a: *
Os
dado
s da
ex-
U.R
.S.S
. até
o a
no d
e 19
91 e
stão
incl
usos
no
cam
po r
efer
ente
à F
eder
ação
Rus
sa.
* D
ata
for
the
Russ
ian
Fede
ratio
n fo
r th
e ye
ars
befo
re 1
991
is a
ctua
lly d
ata
from
the
U.S
.S.R
.
(Con
tinua
ção
/ Con
tinue
d)

Ministério da Agricultura, Pecuária e Abastecimento102
Tab
ela
39 –
Pri
nci
pai
s p
aíse
s ex
po
rtad
ore
s d
e aç
úca
r, em
to
nel
adas
Tabl
e 39
– M
ain
suga
r ex
port
ing
coun
trie
s, in
ton
nes
19
8419
8519
8619
8719
8819
8919
9019
9119
9219
9319
9419
9519
9619
97
Bra
sil
(Bra
zil)
3.03
9.50
82.
608.
706
2.55
4.43
72.
424.
049
1.68
5.70
096
4.70
01.
639.
500
1.61
3.50
02.
273.
300
3.00
8.08
03.
615.
800
6.29
8.90
35.
309.
048
6.58
6.39
5
Tailâ
nd
ia
(Tha
iland
)1.
443.
644
1.78
1.00
42.
049.
414
2.07
1.78
31.
961.
223
3.10
5.21
52.
496.
488
2.86
2.73
53.
718.
582
2.40
1.09
62.
720.
162
3.88
7.27
74.
628.
193
4.31
7.13
4
Au
strá
lia
(Aus
tral
ia)
2.59
0.61
32.
651.
424
2.70
9.93
42.
826.
516
2.98
0.03
33.
149.
276
3.06
9.49
12.
456.
025
2.90
7.02
03.
444.
792
4.50
6.37
84.
594.
170
4.28
8.20
74.
462.
364
Un
ião
Eu
rop
eia
(Eur
opea
n U
nion
)
4.39
2.72
44.
280.
366
4.37
3.46
25.
479.
831
4.91
8.23
65.
030.
052
5.37
2.70
74.
861.
686
4.98
2.61
15.
832.
030
5.09
6.85
05.
413.
811
4.20
9.20
65.
151.
941
Gu
atem
ala
(Gua
tem
ala)
304.
371
286.
549
373.
371
299.
222
390.
756
408.
590
549.
461
699.
231
720.
951
721.
386
751.
989
1.01
0.21
386
5.17
697
7.45
6
Emir
ado
s Á
rab
es
Un
ido
s (U
.A.E
.)
00
020
0.00
013
.000
95.0
0016
5.00
016
0.00
016
0.00
017
0.00
021
5.00
022
5.30
237
1.22
167
9.12
6
Índ
ia
(Indi
a)30
8.82
840
.757
43.9
6125
.271
34.3
3629
.651
46.4
6233
5.02
554
9.48
035
2.60
018
.404
193.
895
1.00
9.86
241
8.82
5
Méx
ico
(M
exic
o)0
66.1
9421
9.15
651
8.45
51.
014.
481
334.
184
4.50
025
2.58
66.
850
096
254.
876
696.
345
796.
687
Co
lôm
bia
(C
olom
bia)
182.
980
294.
934
229.
576
96.0
0924
2.98
332
3.24
041
6.33
929
2.90
351
5.26
465
7.62
272
3.61
386
2.38
982
6.01
388
7.75
0
Áfr
ica
do
Su
l(S
outh
Afr
ica)
762.
140
1.02
5.22
687
3.67
71.
104.
922
909.
159
924.
032
833.
422
896.
953
295.
371
61.5
8431
8.09
738
9.78
097
1.76
798
4.20
4
Ou
tro
s p
aíse
s (O
ther
s)15
.488
.600
14.5
95.2
0113
.726
.603
13.3
21.8
3513
.265
.363
13.5
24.4
8213
.874
.722
12.8
34.2
4915
.760
.843
12.5
09.2
1212
.053
.519
9.90
9.05
912
.124
.509
11.5
94.5
09
TOTA
L M
UN
DIA
L W
ORL
D T
OTA
L28
.513
.408
27.6
30.3
6127
.153
.591
28.3
67.8
9327
.415
.270
27.8
88.4
2228
.468
.092
27.2
64.8
9331
.890
.272
29.1
58.4
0230
.019
.908
33.0
39.6
7535
.299
.547
36.8
56.3
91
(Con
tinua
/ C
ontin
ues)

Anuário Estatístico da Agroenergia – 2012 103
19
9819
9920
0020
0120
0220
0320
0420
0520
0620
0720
0820
0920
10
Bra
sil
(Bra
zil)
8.67
5.14
812
.466
.673
6.50
2.37
511
.168
.422
13.3
88.2
4613
.386
.081
16.2
94.7
2818
.399
.239
19.5
30.5
8820
.529
.864
20.1
43.2
1524
.987
.930
28.6
03.6
62
Tailâ
nd
ia
(Tha
iland
)2.
443.
777
3.42
9.92
94.
341.
374
3.36
4.02
24.
203.
826
5.48
4.75
84.
893.
082
3.30
5.22
52.
301.
601
4.73
9.51
95.
110.
298
5.37
3.98
34.
721.
858
Au
strá
lia
(Aus
tral
ia)
4.69
1.49
54.
185.
342
3.86
7.00
33.
545.
484
3.89
3.56
44.
086.
927
4.31
5.04
84.
238.
646
4.15
7.50
73.
916.
432
3.30
0.84
03.
295.
409
4.11
5.95
7
Un
ião
Eu
rop
eia
(Eur
opea
n U
nion
)
6.35
7.20
05.
086.
460
6.20
3.30
46.
059.
598
4.71
8.23
65.
069.
317
4.30
9.95
26.
639.
198
6.68
7.46
11.
625.
989
1.49
3.60
61.
568.
087
2.36
2.25
5
Gu
atem
ala
(Gua
tem
ala)
1.37
1.18
61.
136.
939
1.20
8.82
51.
375.
263
1.23
9.48
31.
090.
199
1.16
5.36
21.
569.
252
1.24
0.91
51.
501.
726
1.33
3.51
21.
654.
978
1.78
6.63
7
Emir
ado
s Á
rab
es
Un
ido
s (U
.A.E
.)
425.
076
549.
401
841.
380
771.
484
958.
407
956.
772
1.53
2.98
098
1.81
61.
847.
078
1.58
7.70
11.
654.
205
1.31
4.19
41.
699.
417
Índ
ia
(Indi
a)85
.774
21.7
1720
1.66
01.
219.
904
1.28
7.68
41.
677.
809
132.
948
38.9
601.
198.
433
2.73
4.37
04.
230.
681
50.9
2193
0.47
2
Méx
ico
(M
exic
o)1.
022.
317
561.
910
263.
009
114.
520
592.
149
160.
238
110.
060
436.
254
745.
838
203.
337
960.
885
810.
664
929.
807
Co
lôm
bia
(C
olom
bia)
773.
778
875.
493
1.04
5.91
791
9.13
81.
128.
836
1.28
7.25
81.
232.
787
1.17
9.64
392
5.56
471
6.38
047
8.44
71.
053.
939
694.
403
Áfr
ica
do
Su
l(S
outh
Afr
ica)
1.08
7.08
899
6.02
91.
291.
110
1.21
6.00
41.
007.
994
1.17
5.54
71.
051.
583
1.23
5.34
41.
146.
109
1.02
6.50
082
9.34
31.
093.
232
618.
575
Ou
tro
s p
aíse
s (O
ther
s)10
.746
.188
10.6
01.8
6210
.787
.849
11.3
97.4
1911
.187
.021
10.8
48.0
6311
.034
.230
10.0
15.0
509.
959.
123
10.3
95.8
578.
897.
071
8.88
0.17
99.
044.
510
TOTA
L M
UN
DIA
L W
ORL
D T
OTA
L37
.679
.027
39.9
11.7
5536
.553
.806
41.1
51.2
5843
.605
.446
45.2
22.9
6946
.072
.760
48.0
38.6
2749
.740
.217
48.9
77.6
7548
.432
.103
50.0
83.5
1655
.507
.553
Font
e (S
ourc
e): I
nter
natio
nal S
ugar
Org
aniz
atio
n (IS
O).
Not
a: *
Os
dado
s da
ex-
U.R
.S.S
. até
o a
no d
e 19
91 e
stão
incl
usos
no
cam
po r
efer
ente
à F
eder
ação
Rus
sa.
* D
ata
for
the
Russ
ian
Fede
ratio
n fo
r th
e ye
ars
befo
re 1
991
is a
ctua
lly d
ata
from
the
U.S
.S.R
.
(Con
tinua
ção
/ Con
tinue
d)

Ministério da Agricultura, Pecuária e Abastecimento104
3.5 Dados consolidados do setor sucroenergético3.5 Consolidated data of cane, sugar and ethanol production
Tabela 40 – Safra: 48/49
Região Region
Estados States
Cana Moída - tMilled sugarcane - tons
Álcool - m³Ethanol - m3
Açúcar - t Sugar - tons
Própria Own
Fornecedores Supplied
TOTALAnidro
AnhydrousHidratado
HydrousTOTAL TOTAL
Cen
tro
-Su
l C
ente
r-So
uth
Espírito Santo
46.110 21.777 67.887 - - - 5.473
Goiás 6.041 - 6.041 - - - 362
Mato Grosso 14.870 15.205 30.075 - - - 1.358
Mato Grosso do Sul
- - - - - - -
Minas Gerais 284.524 247.435 531.959 - - - 45.155
Paraná 108.258 35.406 143.664 - - - 11.143
Rio de Janeiro
936.992 1.677.660 2.614.652 - - - 236.301
Rio Grande do Sul
- - - - - - -
Santa Catarina
5.978 27.704 33.682 - - - 2.382
São Paulo 2.600.617 1.255.927 3.856.544 - - - 348.130
Subtotal 4.003.390 3.281.114 7.284.504 - - - 650.304
No
rte/
No
rdes
teN
orth
/Nor
thea
st
Alagoas 700.552 817.164 1.517.716 - - - 136.104
Amazonas - - - - - - -
Bahia 511.444 221.347 732.791 - - - 56.843
Ceará 6.856 22.029 28.885 - - - 2.114
Maranhão 7.335 - 7.335 - - - 366
Pará 3.250 - 3.250 - - - 49
Paraíba 246.011 225.411 471.422 - - - 38.318
Pernambuco 2.596.962 2.325.205 4.922.167 - - - 473.748
Piauí 1.150 - 1.150 - - - 69
Rio Grande do Norte
47.068 66.384 113.452 - - - 8.968
Sergipe 411.252 173.621 584.873 - - - 47.821
Tocantins - - - - - - -
Subtotal 4.531.880 3.851.161 8.383.041 - - - 764.400
TOTAL 8.535.270 7.132.275 15.667.545 - - - 1.414.704

Anuário Estatístico da Agroenergia – 2012 105
Tabela 41 – Safra: 49/50
Região Region
Estados States
Cana Moída - t Milled sugarcane - tons
Álcool - m³Ethanol - m3
Açúcar - t Sugar - tons
Própria Own
Fornecedores Supplied
TOTALAnidro
AnhydrousHidratado
HydrousTOTAL TOTAL
Cen
tro
-Su
lC
ente
r-So
uth
Espírito Santo
28.327 18.177 46.504 - - - 4.030
Goiás 11.621 261 11.882 - - - 812
Mato Grosso
14.508 7.932 22.440 - - - 989
Mato Grosso do Sul
- - - - - - -
Minas Gerais
340.212 237.238 577.450 - - - 52.089
Paraná 138.714 42.015 180.729 - - - 14.635
Rio de Janeiro
940.170 1.505.785 2.445.955 - - - 229.731
Rio Grande do Sul
- - - - - - -
Santa Catarina
8.320 49.418 57.738 - - - 4.353
São Paulo 2.442.825 1.234.146 3.676.971 - - - 356.748
Subtotal 3.924.697 3.094.972 7.019.669 - - - 663.386
No
rte/
No
rdes
te
Nor
th/N
orth
east
Acre - - - - - - -
Alagoas 479.656 555.199 1.034.855 - - - 95.050
Amazonas - - - - - - -
Bahia 456.946 183.340 640.286 - - - 51.978
Ceará 7.814 15.971 23.785 - - - 1.646
Maranhão 6.860 - 6.860 - - - 347
Pará 4.636 - 4.636 - - - 80
Paraíba 140.719 182.497 323.216 - - - 28.846
Pernambuco 2.036.143 1.837.528 3.873.671 - - - 387.987
Piauí 1.173 - 1.173 - - - 70
Rio Grande do Norte
62.626 53.518 116.144 - - - 8.757
Sergipe 273.486 122.682 396.168 - - - 30.195
Tocantins - - - - - - -
Subtotal 3.470.059 2.950.735 6.420.794 - - - 604.959
TOTAL 7.394.756 6.045.707 13.440.463 - - - 1.268.345

Ministério da Agricultura, Pecuária e Abastecimento106
Tabela 42 – Safra: 50/51
Região Region
Estados States
Cana Moída - t Milled sugarcane - tons
Álcool - m³Ethanol - m3
Açúcar - t Sugar - tons
Própria Own
Fornecedores Supplied
TOTALAnidro
AnhydrousHidratado
HydrousTOTAL TOTAL
Cen
tro
-Su
l C
ente
r-So
uth
Espírito Santo
25.314 47.190 72.504 - - - 6.499
Goiás 19.275 - 19.275 - - - 1.443
Mato Grosso
20.627 9.815 30.442 - - - 1.491
Mato Grosso do Sul
- - - - - - -
Minas Gerais
373.502 245.860 619.362 - - - 55.326
Paraná 242.616 49.711 292.327 - - - 27.054
Rio de Janeiro
878.225 1.544.677 2.422.902 - - - 231.031
Rio Grande do Sul
- - - - - - -
Santa Catarina
11.166 85.977 97.143 - - - 7.027
São Paulo 2.786.448 1.430.367 4.216.815 - - - 403.779
Subtotal 4.357.173 3.413.597 7.770.770 - - - 733.651
No
rte/
No
rdes
teN
orth
/Nor
thea
st
Alagoas 583.745 797.912 1.381.657 - - - 129.660
Amazonas - - - - - - -
Bahia 447.277 176.590 623.867 - - - 56.275
Ceará 6.854 16.193 23.047 - - - 1.781
Maranhão 7.766 - 7.766 - - - 449
Pará 5.659 159 5.818 - - - 163
Paraíba 177.362 195.796 373.158 - - - 34.222
Pernambuco 2.485.291 2.174.230 4.659.521 - - - 481.043
Piauí 700 - 700 - - - 42
Rio Grande do Norte
58.147 48.691 106.838 - - - 8.433
Sergipe 337.107 192.327 529.434 - - - 43.300
Tocantins - - - - - - -
Subtotal 4.109.908 3.601.898 7.711.806 - - - 755.368
TOTAL 8.467.081 7.015.495 15.482.576 - - - 1.489.020

Anuário Estatístico da Agroenergia – 2012 107
Tabela 43 – Safra: 51/52
Região Region
Estados States
Cana Moída - t Milled sugarcane - tons
Álcool - m³Ethanol - m3
Açúcar - t Sugar - tons
Própria Own
Fornecedores Supplied
TOTALAnidro
AnhydrousHidratado
HydrousTOTAL TOTAL
Cent
ro-S
ulCe
nter
-Sou
th
Espírito Santo
24.474 48.739 73.213 - 900 900 6.139
Goiás 20.988 102 21.090 - 96 96 1.439
Mato Grosso 22.587 12.366 34.953 - 71 71 1.764
Mato Grosso do Sul
- - - - - - -
Minas Gerais 448.124 393.599 841.723 - 8.629 8.629 78.477
Paraná 252.434 66.931 319.365 - 4.249 4.249 29.323
Rio de Janeiro
950.560 1.942.341 2.892.901 6.896 21.701 28.597 274.643
Rio Grande do Sul
- - - - 168 168 -
Santa Catarina
10.717 89.500 100.217 - 693 693 7.139
São Paulo 3.033.188 2.073.519 5.106.707 5.117 58.504 - 486.314
Subtotal 4.763.072 4.627.097 9.390.169 12.013 95.011 107.024 885.238
Nor
te/N
orde
ste
Nor
th/N
orth
east
Alagoas 447.436 719.533 1.166.969 1.864 4.104 5.968 106.090
Amazonas - - - - - - -
Bahia 495.561 187.955 683.516 - - - 56.612
Ceará 5.744 21.838 27.582 - - - 1.923
Maranhão 5.244 - 5.244 - - - 303
Pará 6.395 544 6.939 - 14 14 144
Paraíba 146.333 164.756 311.089 - 1.938 1.938 28.941
Pernambuco 2.681.071 2.153.757 4.834.828 34.120 20.917 55.037 474.201
Piauí 650 - 650 - - - 43
Rio Grande do Norte
68.248 69.723 137.971 - - - 10.510
Sergipe 244.375 147.508 391.883 - 381 381 31.702
Tocantins - - - - - - -
Subtotal 4.101.057 3.465.614 7.566.671 35.984 27.354 63.338 710.468
TOTAL 8.864.129 8.092.711 16.956.840 47.997 122.365 170.362 1.595.706

Ministério da Agricultura, Pecuária e Abastecimento108
Tabela 44 – Safra: 52/53
Região Region
Estados States
Cana Moída - t Milled sugarcane - tons
Álcool - m³Ethanol - m3
Açúcar - t Sugar - tons
Própria Own
Fornecedores Supplied
TOTALAnidro
AnhydrousHidratado
HydrousTOTAL TOTAL
Cent
ro-S
ul
Cent
er-S
outh
Espírito Santo
24.243 61.830 86.073 - 811 811 6.455
Goiás 19.941 457 20.398 - 114 114 1.338
Mato Grosso 20.029 17.213 37.242 - 122 122 1.826
Mato Grosso do Sul
- - - - - - -
Minas Gerais 424.939 412.243 837.182 1.597 6.238 7.835 74.806
Paraná 272.978 66.130 339.108 325 4.509 4.834 30.189
Rio de Janeiro
1.020.876 1.992.423 3.013.299 25.712 16.038 41.750 271.248
Rio Grande do Sul
- - - - - - -
Santa Catarina
14.480 113.472 127.952 - 945 945 9.331
São Paulo 3.478.906 2.677.085 6.155.991 12.613 71.589 - 565.381
Subtotal 5.276.392 5.340.853 10.617.245 40.247 100.366 140.613 960.574
Nor
te/N
orde
ste
Nor
th/N
orth
east
Alagoas 682.966 935.570 1.618.536 2.726 6.984 9.710 147.402
Amazonas - - - - - - -
Bahia 567.790 236.285 804.075 - - - 68.565
Ceará 7.056 26.545 33.601 - 136 136 2.219
Maranhão 8.050 - 8.050 - - - 487
Pará 5.428 508 5.936 - 3 3 94
Paraíba 192.564 201.634 394.198 - 2.183 2.183 34.822
Pernambuco 3.366.836 2.654.917 6.021.753 56.181 20.474 76.655 585.543
Piauí 533 - 533 - - - 48
Rio Grande do Norte
86.689 99.640 186.329 - - - 14.170
Sergipe 261.908 167.440 429.348 - 243 243 34.171
Tocantins - - - - - - -
Subtotal 5.179.820 4.322.539 9.502.359 58.907 30.023 88.930 887.521
TOTAL 10.456.212 9.663.392 20.119.604 99.154 130.389 229.543 1.848.096

Anuário Estatístico da Agroenergia – 2012 109
Tabela 45 – Safra: 53/54
Região Region
Estados States
Cana Moída - t Milled sugarcane - tons
Álcool - m³Ethanol - m3
Açúcar - t Sugar - tons
Própria Own
Fornecedores Supplied
TOTALAnidro
AnhydrousHidratado
HydrousTOTAL TOTAL
Cent
ro-S
ul
Cent
er-S
outh
Distrito Federal
- - - - - - -
Espírito Santo 21.244 53.306 74.550 - 581 581 6.341
Goiás 22.416 - 22.416 - 20 20 1.578
Mato Grosso 21.224 15.786 37.010 - 74 74 1.647Mato Grosso do Sul
- - - - - - -
Minas Gerais 552.388 452.095 1.004.483 2.694 5.814 8.508 91.277
Paraná 331.248 63.712 394.960 1.102 2.123 3.225 29.303
Rio de Janeiro 1.153.296 2.141.452 3.294.748 28.324 16.378 44.702 311.852Rio Grande do Sul
- - - - - - -
Santa Catarina
13.586 124.094 137.680 - 1.114 1.114 9.916
São Paulo 4.178.017 3.864.483 8.042.500 50.011 78.556 - 701.611
Subtotal 6.293.419 6.714.928 13.008.347 82.131 104.660 186.791 1.153.525
Nor
te/N
orde
ste
Nor
th/N
orth
east
Acre - - - - - - -
Amapá - - - - - - -
Amazonas - - - - - - -
Bahia 547.067 304.348 851.415 337 - 337 72.192
Ceará 5.183 23.425 28.608 - 20 20 1.900
Maranhão 6.153 - 6.153 - - - 435
Pará 5.395 249 5.644 - 8 8 124
Paraíba 139.942 154.255 294.197 900 755 1.655 26.236
Pernambuco 2.959.215 2.647.271 5.606.486 52.278 19.666 71.944 548.022
Piauí - - - - - - -Rio Grande do Norte
73.832 95.704 169.536 - - - 13.271
Rondônia - - - - - - -
Roraima - - - - - - -
Sergipe 290.226 204.525 494.751 - 225 225 40.761
Tocantins - - - - - - -Subtotal 4.027.013 3.429.777 7.456.790 53.515 20.674 74.189 702.941
TOTAL 10.320.432 10.144.705 20.465.137 135.646 125.334 260.980 1.856.466

Ministério da Agricultura, Pecuária e Abastecimento110
Tabela 46 – Safra: 54/55
Região Region
Estados States
Cana Moída - t Milled sugarcane - tons
Álcool - m³Ethanol - m3
Açúcar - t Sugar - tons
Própria Own
Fornecedores Supplied
TOTALAnidro
AnhydrousHidratado
HydrousTOTAL TOTAL
Cent
ro-S
ul
Cent
er-S
outh
Espírito Santo
25.947 45.312 71.259 - 636 636 6.111
Goiás 18.374 - 18.374 - - - 1.420
Mato Grosso 20.037 14.174 34.211 - 108 108 1.418
Mato Grosso do Sul
- - - - - - -
Minas Gerais 647.349 392.438 1.039.787 1.547 6.849 8.396 95.513
Paraná 379.582 101.506 481.088 733 4.394 5.127 40.359
Rio de Janeiro
1.198.010 1.916.668 3.114.678 21.345 18.252 39.597 280.140
Rio Grande do Sul
- - - - - - -
Santa Catarina
14.198 95.128 109.326 - 1.085 1.085 7.452
São Paulo 4.561.204 4.660.790 9.221.994 80.659 89.501 - 790.061
Subtotal 6.864.701 7.226.016 14.090.717 104.284 120.825 225.109 1.222.474
Nor
te/N
orde
ste
Nor
th/N
orth
east
Alagoas 854.608 1.029.315 1.883.923 4.667 - 4.667 176.031
Amazonas - - - - - - -
Bahia 554.043 287.875 841.918 436 - 436 67.361
Ceará 5.577 20.532 26.109 - - - 1.759
Maranhão 6.096 - 6.096 - - - 369
Pará 2.253 - 2.253 - - - 78
Paraíba 160.160 164.355 324.515 1.004 - 1.004 29.588
Pernambuco 3.073.232 2.723.929 5.797.161 58.099 - 58.099 577.013
Piauí - - - - - - -
Rio Grande do Norte
62.725 91.141 153.866 - - - 12.106
Sergipe 344.470 197.076 541.546 - - - 47.257
Tocantins - - - - - - -
Subtotal 5.063.164 4.514.223 9.577.387 64.206 16.930 81.136 911.562
TOTAL 11.927.865 11.740.239 23.668.104 168.490 137.755 306.245 2.134.037

Anuário Estatístico da Agroenergia – 2012 111
Tabela 47 – Safra: 55/56
Região Region
Estados States
Cana Moída - t Milled sugarcane - tons
Álcool - m³Ethanol - m3
Açúcar - t Sugar - tons
Própria Own
Fornecedores Supplied
TOTALAnidro
AnhydrousHidratado
HydrousTOTAL TOTAL
Cent
ro-S
ul
Cen
ter-S
outh
Espírito Santo
50.948 36.770 87.718 - 619 619 7.959
Goiás 11.440 - 11.440 - - - 858
Mato Grosso 17.885 13.303 31.188 - 118 118 1.125
Mato Grosso do Sul
- - - - - - -
Minas Gerais 647.864 276.853 924.717 3.121 5.835 8.956 86.053
Paraná 416.267 92.106 508.373 657 4.826 5.483 40.404
Rio de Janeiro
1.174.004 1.577.637 2.751.641 20.549 21.096 41.645 256.265
Rio Grande do Sul
- - - - - - -
Santa Catarina
14.272 72.763 87.035 - 741 741 6.301
São Paulo 4.487.195 3.632.919 8.120.114 69.244 62.617 - 705.948
Subtotal 6.819.875 5.702.351 12.522.226 93.571 95.852 189.423 1.104.914
Nor
te/N
orde
ste
Nor
th/N
orth
east
Alagoas 958.712 1.214.748 2.173.460 5.085 4.698 9.783 195.417
Amazonas - - - - - - -
Bahia 456.410 233.974 690.384 780 - 780 57.300
Ceará 7.315 16.362 23.677 - - - 1.682
Maranhão 5.252 - 5.252 - - - 315
Pará 1.136 - 1.136 - 6 6 68
Paraíba 209.990 244.537 454.527 1.310 1.259 2.569 42.926
Pernambuco 3.493.697 3.510.201 7.003.898 64.597 15.279 79.876 666.827
Piauí - - - - - - -
Rio Grande do Norte
79.387 120.101 199.488 - - - 15.319
Sergipe 331.645 173.420 505.065 494 258 752 43.016
Tocantins - - - - - - -
Subtotal 5.543.544 5.513.343 11.056.887 72.266 21.500 93.766 1.022.870
TOTAL 12.363.419 11.215.694 23.579.113 165.837 117.352 283.189 2.127.784

Ministério da Agricultura, Pecuária e Abastecimento112
Tabela 48 – Safra: 56/57
Região Region
Estados States
Cana Moída - t Milled sugarcane - tons
Álcool - m³Ethanol - m3
Açúcar - t Sugar - tons
Própria Own
Fornecedores Supplied
TOTALAnidro
AnhydrousHidratado
HydrousTOTAL TOTAL
Cent
ro-S
ul
Cen
ter-S
outh
Espírito Santo
47.675 19.216 66.891 - 541 541 6.141
Goiás 14.000 - 14.000 - - - 1.123
Mato Grosso 20.762 9.792 30.554 - 94 94 1.404
Mato Grosso do Sul
- - - - - - -
Minas Gerais 602.443 207.275 809.718 1.198 4.540 5.738 74.249
Paraná 459.520 131.726 591.246 - 5.740 5.740 49.400
Rio de Janeiro
1.250.399 1.864.856 3.115.255 7.434 23.386 30.820 286.868
Rio Grande do Sul
- - - - - - -
Santa Catarina
11.269 66.035 77.304 - 694 694 6.880
São Paulo 4.932.639 3.516.448 8.449.087 10.203 86.147 - 784.956
Subtotal 7.338.707 5.815.348 13.154.055 18.835 121.142 139.977 1.211.021
Nor
te/N
orde
ste
Nor
th/N
orth
east
Alagoas 954.583 1.173.709 2.128.292 3.805 6.711 10.516 193.991
Amazonas - - - - - - -
Bahia 435.472 254.940 690.412 4 - 4 63.564
Ceará 13.516 21.135 34.651 - - - 2.585
Maranhão 4.845 - 4.845 - - - 248
Pará - - - - - - -
Paraíba 229.301 297.789 527.090 1.578 1.691 3.269 48.518
Pernambuco 3.477.532 3.586.209 7.063.741 79.613 18.334 97.947 670.673
Piauí 1.673 - 1.673 - - - 70
Rio Grande do Norte
84.214 134.898 219.112 - - - 17.179
Sergipe 364.774 189.677 554.451 577 97 674 46.910
Tocantins - - - - - - -
Subtotal 5.565.910 5.658.357 11.224.267 85.577 26.833 112.410 1.043.738
TOTAL 12.904.617 11.473.705 24.378.322 104.412 147.975 252.387 2.254.759

Anuário Estatístico da Agroenergia – 2012 113
Tabela 49 – Safra: 57/58
Região Region
Estados States
Cana Moída - t Milled sugarcane - tons
Álcool - m³Ethanol - m3
Açúcar - t Sugar - tons
Própria Own
Fornecedores Supplied
TOTALAnidro
AnhydrousHidratado
HydrousTOTAL TOTAL
Cent
ro-S
ulCe
nter
-Sou
th
Espírito Santo
76.095 47.161 123.256 - 992 992 10.628
Goiás 22.109 - 22.109 - - - 1.736
Mato Grosso 26.643 12.038 38.681 - 132 132 1.649
Mato Grosso do Sul
- - - - - - -
Minas Gerais 864.768 374.601 1.239.369 4.547 6.314 10.861 113.663
Paraná 441.413 176.344 617.757 33 7.766 7.799 54.859
Rio de Janeiro
1.529.407 2.745.711 4.275.118 40.141 16.614 56.755 366.859
Rio Grande do Sul
- - - - - - -
Santa Catarina
18.958 107.947 126.905 - 1.174 1.174 10.439
São Paulo 7.117.358 5.584.329 12.701.687 113.186 92.601 - 1.077.362
Subtotal 10.096.751 9.048.131 19.144.882 157.907 125.593 283.500 1.637.196
Nor
te/N
orde
ste
Nor
th/N
orth
east
Alagoas 956.833 1.234.711 2.191.544 3.603 6.234 9.837 208.270
Amazonas - - - - - - -
Bahia 268.027 149.502 417.529 598 - 598 36.299
Ceará 13.620 22.396 36.016 - - - 2.650
Maranhão 3.725 - 3.725 - - - 223
Pará 675 - 675 - 9 9 40
Paraíba 217.305 294.069 511.374 1.721 1.712 3.433 44.764
Pernambuco 3.346.597 3.591.112 6.937.709 80.639 20.094 100.733 679.689
Piauí 2.025 - 2.025 - - - 130
Rio Grande do Norte
73.002 147.040 220.042 - - - 16.695
Sergipe 264.043 164.255 428.298 630 77 707 36.648
Tocantins - - - - - - -
Subtotal 5.145.852 5.603.085 10.748.937 87.191 28.126 115.317 1.025.409
TOTAL 15.242.603 14.651.216 29.893.819 245.098 153.719 398.817 2.662.605

Ministério da Agricultura, Pecuária e Abastecimento114
Tabela 50 – Safra: 58/59
Região Region
Estados States
Cana Moída - t Milled sugarcane - tons
Álcool - m³Ethanol - m3
Açúcar - t Sugar - tons
Própria Own
Fornecedores Supplied
TOTALAnidro
AnhydrousHidratado
HydrousTOTAL TOTAL
Cent
ro-S
ulCe
nter
-Sou
th
Espírito Santo
60.976 53.914 114.890 - 629 629 9.894
Goiás 11.978 18.618 30.596 - - - 2.502
Mato Grosso 25.148 10.386 35.534 - 141 141 1.564
Mato Grosso do Sul
- - - - - - -
Minas Gerais 986.932 606.657 1.593.589 5.196 7.516 12.712 143.665
Paraná 466.231 230.632 696.863 - 7.960 7.960 61.316
Rio de Janeiro
1.621.720 2.901.018 4.522.738 47.642 14.859 62.501 396.317
Rio Grande do Sul
- - - - - - -
Santa Catarina
27.241 165.764 193.005 - 1.784 1.784 15.486
São Paulo 9.021.445 8.017.085 17.038.530 154.409 91.026 - 1.532.423
Subtotal 12.221.671 12.004.074 24.225.745 207.247 123.915 331.162 2.163.166
Nor
te/N
orde
ste
Nor
th/N
orth
east
Alagoas 1.019.094 1.401.986 2.421.080 3.181 28.183 31.364 217.768
Amazonas - - - - - - -
Bahia 450.519 218.190 668.709 - - - 61.535
Ceará 12.548 16.250 28.798 - - - 2.016
Maranhão 3.293 - 3.293 - - - 160
Pará 1.065 - 1.065 - 23 23 64
Paraíba 227.439 278.335 505.774 1.741 2.276 4.017 45.547
Pernambuco 3.944.954 3.715.527 7.660.481 69.369 - 69.369 681.393
Piauí 3.200 - 3.200 - - - 212
Rio Grande do Norte
92.663 178.665 271.328 - 22 22 20.514
Sergipe 288.974 164.905 453.879 189 165 354 39.080
Tocantins - - - - - - -
Subtotal 6.043.749 5.973.858 12.017.607 74.480 30.669 105.149 1.068.288
TOTAL 18.265.420 17.977.932 36.243.352 281.727 154.584 436.311 3.231.454

Anuário Estatístico da Agroenergia – 2012 115
Tabela 51 – Safra: 59/60
Região Region
Estados States
Cana Moída - t Milled sugarcane - tons
Álcool - m³Ethanol - m3
Açúcar - t Sugar - tons
Própria Own
Fornecedores Supplied
TOTALAnidro
AnhydrousHidratado
HydrousTOTAL TOTAL
Cent
ro-S
ulCe
nter
-Sou
th
Espírito Santo
91.523 39.984 131.507 65 150 215 12.032
Goiás 15.732 11.489 27.221 - - - 2.254
Mato Grosso 21.238 8.545 29.783 - 107 107 1.389
Mato Grosso do Sul
- - - - - - -
Minas Gerais 897.574 519.065 1.416.639 4.037 5.142 9.179 133.349
Paraná 423.529 191.568 615.097 - 6.129 6.129 57.824
Rio de Janeiro
1.451.010 2.376.752 3.827.762 42.476 12.060 54.536 369.283
Rio Grande do Sul
- - - - - - -
Santa Catarina
32.570 185.564 218.134 - 2.507 2.507 16.139
São Paulo 6.931.370 7.271.093 14.202.463 190.987 69.916 - 1.251.568
Subtotal 9.864.546 10.604.060 20.468.606 237.565 96.011 333.576 1.843.838
Nor
te/N
orde
ste
Nor
th/N
orth
east
Alagoas 1.220.838 1.598.419 2.819.257 3.510 7.311 10.821 243.804
Amazonas - - - - - - -
Bahia 535.654 251.354 787.008 1.600 - 1.600 73.379
Ceará 16.038 9.829 25.867 - - - 1.836
Maranhão 112 - 112 - - - 6
Pará 1.203 - 1.203 - 23 23 72
Paraíba 251.708 324.003 575.711 1.968 2.821 4.789 52.197
Pernambuco 4.509.060 4.473.938 8.982.998 57.211 62.950 120.161 777.525
Piauí 2.104 - 2.104 - - - 150
Rio Grande do Norte
91.082 164.183 255.265 - 42 42 20.820
Sergipe 304.080 167.426 471.506 305 727 1.032 38.153
Tocantins - - - - - - -
Subtotal 6.931.879 6.989.152 13.921.031 64.594 73.874 138.468 1.207.944
TOTAL 16.796.425 17.593.212 34.389.637 302.159 169.885 472.044 3.051.782

Ministério da Agricultura, Pecuária e Abastecimento116
Tabela 52 – Safra: 60/61
Região Region
Estados States
Cana Moída - t Milled sugarcane - tons
Álcool - m³Ethanol - m3
Açúcar - t Sugar - tons
Própria Own
Fornecedores Supplied
TOTALAnidro
AnhydrousHidratado Hydrous
TOTAL TOTAL
Cent
ro-S
ulCe
nter
-Sou
th
Espírito Santo
87.349 47.402 134.751 - 434 434 12.408
Goiás 19.101 4.901 24.002 - - - 2.046
Mato Grosso 10.996 4.163 15.159 - 34 34 569
Mato Grosso do Sul
- - - - - - -
Minas Gerais 857.611 455.304 1.312.915 2.195 6.748 8.943 120.031
Paraná 598.585 223.725 822.310 - 7.998 7.998 72.814
Rio de Janeiro
1.600.362 2.737.412 4.337.774 18.760 23.835 42.595 402.358
Rio Grande do Sul
- - - - - - -
Santa Catarina
28.995 145.932 174.927 - 1.503 1.503 14.358
São Paulo 8.349.226 7.664.190 16.013.416 116.848 149.887 - 1.438.356
Subtotal 11.552.225 11.283.029 22.835.254 137.803 190.439 328.242 2.062.940
Nor
te/N
orde
ste
Nor
th/N
orth
east
Alagoas 1.356.183 1.693.478 3.049.661 7.662 12.905 20.567 269.350
Amazonas - - - - - - -
Bahia 517.533 189.301 706.834 171 - 171 63.770
Ceará 19.481 10.620 30.101 - - - 2.415
Maranhão 2.046 - 2.046 - - - 96
Pará 285 - 285 - 3 3 17
Paraíba 181.853 239.175 421.028 1.203 2.231 3.434 38.736
Pernambuco 4.525.356 4.240.864 8.766.220 28.450 74.350 102.800 758.864
Piauí 5.224 - 5.224 - - - 388
Rio Grande do Norte
79.706 127.069 206.775 - 123 123 16.940
Sergipe 322.836 202.170 525.006 - 962 962 47.404
Tocantins - - - - - - -
Subtotal 7.010.503 6.702.677 13.713.180 37.486 90.574 128.060 1.197.980
TOTAL 18.562.728 17.985.706 36.548.434 175.289 281.013 456.302 3.260.920

Anuário Estatístico da Agroenergia – 2012 117
Tabela 53 – Safra: 61/62
Região Region
Estados States
Cana Moída - t Milled sugarcane - tons
Álcool - m³Ethanol - m3
Açúcar - t Sugar - tons
Própria Own
Fornecedores Supplied
TOTALAnidro
AnhydrousHidratado
HydrousTOTAL TOTAL
Cent
ro-S
ulCe
nter
-Sou
th
Espírito Santo
83.312 45.860 129.172 - 891 891 12.230
Goiás 17.677 6.922 24.599 - - - 2.093
Mato Grosso 6.839 1.022 7.861 - 14 14 391
Mato Grosso do Sul
- - - - - - -
Minas Gerais 858.708 503.696 1.362.404 1.168 8.207 9.375 128.730
Paraná 625.093 288.820 913.913 - 10.319 10.319 80.880
Rio de Janeiro
1.715.725 2.854.823 4.570.548 23.724 32.082 55.806 446.850
Rio Grande do Sul
- - - - - - -
Santa Catarina
26.558 78.219 104.777 - 1.139 1.139 8.961
São Paulo 8.365.202 6.672.729 15.037.931 105.878 110.368 - 1.416.463
Subtotal 11.699.114 10.452.091 22.151.205 130.770 163.020 293.790 2.096.597
Nor
te/N
orde
ste
Nor
th/N
orth
east
Alagoas 1.422.302 1.926.181 3.348.483 16.759 11.274 28.033 305.258
Amazonas - - - - - - -
Bahia 376.317 138.127 514.444 177 - 177 52.571
Ceará 22.241 12.220 34.461 - - - 2.768
Maranhão 2.152 - 2.152 - - - 111
Pará 80 - 80 - - - 5
Paraíba 253.091 338.914 592.005 1.087 3.679 4.766 54.634
Pernambuco 4.206.878 4.837.556 9.044.434 57.012 42.544 99.556 806.275
Piauí 9.144 - 9.144 - - - 749
Rio Grande do Norte
107.957 150.260 258.217 391 201 592 21.191
Sergipe 297.093 193.878 490.971 - 606 606 45.788
Tocantins - - - - - - -
Subtotal 6.697.255 7.597.136 14.294.391 75.426 58.304 133.730 1.289.349
TOTAL 18.396.369 18.049.227 36.445.596 206.196 221.324 427.520 3.385.946

Ministério da Agricultura, Pecuária e Abastecimento118
Tabela 54 – Safra: 62/63
Região Region
Estados States
Cana Moída - t Milled sugarcane - tons
Álcool - m³Ethanol - m3
Açúcar - t Sugar - tons
Própria Own
Fornecedores Supplied
TOTALAnidro
AnhydrousHidratado
HydrousTOTAL TOTAL
Cent
ro-S
ulCe
nter
-Sou
th
Espírito Santo
88.701 40.673 129.374 - 368 368 11.687
Goiás 13.958 5.312 19.270 - - - 1.584
Mato Grosso 2.459 - 2.459 - - - 160
Mato Grosso do Sul
- - - - - - -
Minas Gerais 688.562 598.243 1.286.805 - 9.150 9.150 116.493
Paraná 498.641 459.732 958.373 - 11.887 11.887 84.597
Rio de Janeiro
1.569.719 2.414.596 3.984.315 7.989 36.018 44.007 392.808
Rio Grande do Sul
- - - - - - -
Santa Catarina
32.124 81.874 113.998 - 1.186 1.186 10.297
São Paulo 8.429.698 7.270.995 15.700.693 45.184 145.215 - 1.440.714
Subtotal 11.323.862 10.871.425 22.195.287 53.173 203.824 256.997 2.058.341
Nor
te/N
orde
ste
Nor
th/N
orth
east
Alagoas 1.188.380 1.369.407 2.557.787 9.602 8.057 17.659 228.784
Amazonas - - - - - - -
Bahia 517.016 130.374 647.390 - - - 57.579
Ceará 26.180 8.944 35.124 - - - 2.793
Maranhão 797 - 797 - - - 41
Pará - - - - - - -
Paraíba 286.020 299.923 585.943 1.551 2.900 4.451 52.137
Pernambuco 3.133.772 3.548.247 6.682.019 36.689 26.588 63.277 612.959
Piauí 10.266 - 10.266 - - - 902
Rio Grande do Norte
95.164 162.854 258.018 127 504 631 20.225
Sergipe 188.577 155.344 343.921 - 702 702 30.940
Tocantins - - - - - - -
Subtotal 5.446.172 5.675.093 11.121.265 47.969 38.751 86.720 1.006.360
TOTAL 16.770.034 16.546.518 33.316.552 101.142 242.575 343.717 3.064.701

Anuário Estatístico da Agroenergia – 2012 119
Tabela 55 – Safra: 63/64
Região Region
Estados States
Cana Moída - t Milled sugarcane - tons
Álcool - m³Ethanol - m3
Açúcar - t Sugar - tons
Própria Own
Fornecedores Supplied
TOTALAnidro
AnhydrousHidratado
HydrousTOTAL TOTAL
Cen
tro
-Su
lC
ente
r-So
uth
Espírito Santo
83.364 43.564 126.928 - 512 512 11.809
Goiás 19.952 6.666 26.618 - 19 19 1.967
Mato Grosso 8.312 1.874 10.186 - 11 11 491
Mato Grosso do Sul
- - - - - - -
Minas Gerais 668.580 466.342 1.134.922 - 9.350 9.350 106.494
Paraná 404.144 772.299 1.176.443 - 10.099 10.099 94.010
Rio de Janeiro
1.291.900 1.947.174 3.239.074 2.885 28.458 31.343 325.243
Rio Grande do Sul
- - - - - - -
Santa Catarina
49.300 158.010 207.310 - 2.055 2.055 15.372
São Paulo 8.307.884 7.938.504 16.246.388 71.857 176.843 - 1.399.115
Subtotal 10.833.436 11.334.433 22.167.869 74.742 227.347 302.089 1.954.502
No
rte/
No
rdes
teN
orth
/Nor
thea
st
Alagoas 1.400.374 1.735.904 3.136.278 3.409 23.040 26.449 274.763
Amazonas - - - - - - -
Bahia 480.368 122.704 603.072 - 783 783 60.062
Ceará 27.795 13.541 41.336 - - - 3.384
Maranhão - - - - - - -
Pará - - - - - - -
Paraíba 272.988 302.789 575.777 637 2.925 3.562 48.383
Pernambuco 3.978.065 4.220.133 8.198.198 16.869 53.992 70.861 697.122
Piauí 13.030 - 13.030 - - - 1.057
Rio Grande do Norte
82.777 141.852 224.629 432 618 1.050 19.298
Sergipe 241.310 207.071 448.381 - 682 682 40.080
Tocantins - - - - - - -
Subtotal 6.496.707 6.743.994 13.240.701 21.347 82.040 103.387 1.144.148
TOTAL 17.330.143 18.078.427 35.408.570 96.089 309.387 405.476 3.098.650

Ministério da Agricultura, Pecuária e Abastecimento120
Tabela 56 – Safra: 64/65
Região Region
Estados States
Cana Moída - t Milled sugarcane - tons
Álcool - m³Ethanol - m3
Açúcar - t Sugar - tons
Própria Own
Fornecedores Supplied
TOTALAnidro
AnhydrousHidratado
HydrousTOTAL TOTAL
Cent
ro-S
ulCe
nter
-Sou
th
Espírito Santo
89.612 82.899 172.511 - 560 560 14.302
Goiás 54.266 6.616 60.882 - - - 4.150
Mato Grosso 6.656 340 6.996 - 22 22 285
Mato Grosso do Sul
- - - - - - -
Minas Gerais 666.433 520.504 1.186.937 - 9.426 9.426 105.488
Paraná 333.624 1.080.522 1.414.146 - 13.333 13.333 127.824
Rio de Janeiro
1.878.342 2.947.103 4.825.445 10.410 33.971 44.381 428.668
Rio Grande do Sul
- - - - - - -
Santa Catarina
49.920 119.663 169.583 - 1.564 1.564 13.216
São Paulo 9.047.495 8.803.947 17.851.442 40.801 154.204 - 1.608.838
Subtotal 12.126.348 13.561.594 25.687.942 51.211 213.080 264.291 2.302.771
Nor
te/N
orde
ste
Nor
th/N
orth
east
Alagoas 1.600.300 1.856.377 3.456.677 13.628 13.717 27.345 309.651
Amazonas - - - - - - -
Bahia 335.814 84.056 419.870 - - - 33.606
Ceará 27.967 13.575 41.542 - - - 3.467
Maranhão 14.973 - 14.973 - - - 1.038
Pará - - - - - - -
Paraíba 284.351 306.337 590.688 673 3.659 4.332 51.975
Pernambuco 4.361.050 4.526.072 8.887.122 43.634 45.046 88.680 792.271
Piauí 13.692 - 13.692 - - - 1.153
Rio Grande do Norte
80.463 149.687 230.150 1.085 186 1.271 19.908
Sergipe 254.944 329.358 584.302 - 1.043 1.043 49.401
Tocantins - - - - - - -
Subtotal 6.973.554 7.265.462 14.239.016 59.020 63.651 122.671 1.262.468
TOTAL 19.099.902 20.827.056 39.926.958 110.231 276.731 386.962 3.565.239

Anuário Estatístico da Agroenergia – 2012 121
Tabela 57 – Safra: 65/66
Região Region
Estados States
Cana Moída - t Milled sugarcane - tons
Álcool - m³Ethanol - m3
Açúcar - t Sugar - tons
Própria Own
Fornecedores Supplied
TOTALAnidro
AnhydrousHidratado
HydrousTOTAL TOTAL
Cen
tro
-Su
lC
ente
r-So
uth
Espírito Santo
69.553 108.683 178.236 - 910 910 15.675
Goiás 76.667 12.465 89.132 - - - 6.405
Mato Grosso 4.399 1.360 5.759 - 3 3 362
Mato Grosso do Sul
- - - - - - -
Minas Gerais 895.624 855.236 1.750.860 2.690 10.514 13.204 154.375
Paraná 505.604 1.210.215 1.715.819 - 15.124 15.124 146.672
Rio de Janeiro
1.797.136 3.506.939 5.304.075 32.999 21.220 54.219 478.431
Rio Grande do Sul
204 2.090 2.294 - - - 175
Santa Catarina
74.812 239.665 314.477 - 3.122 3.122 24.073
São Paulo 12.411.818 15.385.283 27.797.101 238.184 163.703 - 2.525.301
Subtotal 15.835.817 21.321.936 37.157.753 273.873 214.596 488.469 3.351.469
No
rte/
No
rdes
teN
orth
/Nor
thea
st
Alagoas 1.483.424 1.991.700 3.475.124 14.966 7.243 22.209 325.648
Amazonas - - - - - - -
Bahia 387.931 82.644 470.575 - - - 43.162
Ceará 33.427 35.084 68.511 - - - 5.385
Maranhão 31.845 - 31.845 - - - 2.548
Pará - - - - - - -
Paraíba 249.273 312.539 561.812 145 3.452 3.597 50.156
Pernambuco 3.479.633 4.100.470 7.580.103 46.060 39.608 85.668 711.270
Piauí 17.342 - 17.342 - - - 1.293
Rio Grande do Norte
104.535 220.258 324.793 1.230 249 1.479 26.341
Sergipe 211.975 276.906 488.881 - 1.285 1.285 41.565
Tocantins - - - - - - -
Subtotal 5.999.385 7.019.601 13.018.986 62.401 51.837 114.238 1.207.367
TOTAL 21.835.202 28.341.537 50.176.739 336.274 266.433 602.707 4.558.836

Ministério da Agricultura, Pecuária e Abastecimento122
Tabela 58 – Safra: 66/67
Região Region
Estados States
Cana Moída - t Milled sugarcane - tons
Álcool - m³Ethanol - m3
Açúcar - t Sugar - tons
Própria Own
Fornecedores Supplied
TOTALAnidro
AnhydrousHidratado
HydrousTOTAL TOTAL
Cen
tro
-Su
lC
ente
r-So
uth
Espírito Santo
75.890 93.851 169.741 1.023 5 1.028 15.661
Goiás 78.568 24.766 103.334 - 17 17 7.604
Mato Grosso 9.268 23.644 32.912 - 10 10 1.772
Mato Grosso do Sul
- - - - - - -
Minas Gerais 1.103.012 924.373 2.027.385 3.141 11.306 14.447 191.066
Paraná 489.700 824.410 1.314.110 - 13.688 13.688 118.741
Rio de Janeiro
1.655.447 2.896.888 4.552.335 24.788 23.195 47.983 439.147
Rio Grande do Sul
784 56.888 57.672 - - - 4.697
Santa Catarina
68.575 338.494 407.069 - 3.973 3.973 32.666
São Paulo 11.322.551 11.015.047 22.337.598 294.870 224.267 519.137 1.832.152
Subtotal 14.803.795 16.198.361 31.002.156 323.822 276.461 600.283 2.643.505
No
rte/
No
rdes
teN
orth
/Nor
thea
st
Alagoas 1.892.145 2.602.776 4.494.921 12.234 15.110 27.344 418.361
Amazonas - - - - - - -
Bahia 558.509 100.600 659.109 - - - 61.806
Ceará 47.174 31.451 78.625 - - - 6.162
Maranhão 14.177 - 14.177 - 76 76 1.127
Pará - - - - - - -
Paraíba 349.099 435.395 784.494 - 6.462 6.462 66.857
Pernambuco 4.275.660 5.182.789 9.458.449 44.869 45.424 90.293 846.105
Piauí 8.999 - 8.999 - 78 78 681
Rio Grande do Norte
102.321 223.105 325.426 1.202 481 1.683 26.146
Sergipe 254.731 265.964 520.695 - 1.259 1.259 45.087
Tocantins - - - - - - -
Subtotal 7.502.815 8.842.080 16.344.895 58.305 68.890 127.195 1.472.331
TOTAL 22.306.610 25.040.441 47.347.051 382.127 345.351 727.478 4.115.837

Anuário Estatístico da Agroenergia – 2012 123
Tabela 59 – Safra: 67/68
Região Region
Estados States
Cana Moída - t Milled sugarcane - tons
Álcool - m³Ethanol - m3
Açúcar - t Sugar - tons
Própria Own
Fornecedores Supplied
TOTALAnidro
AnhydrousHidratado
HydrousTOTAL TOTAL
Cent
ro-S
ulCe
nter
-Sou
th
Espírito Santo
96.135 130.644 226.779 2.030 - 2.030 21.195
Goiás 92.243 21.782 114.025 - 302 302 8.377
Mato Grosso 12.688 28.786 41.474 - 3 3 2.858
Mato Grosso do Sul
- - - - - - -
Minas Gerais 1.145.586 827.267 1.972.853 3.889 10.414 14.303 185.130
Paraná 548.561 812.080 1.360.641 226 12.604 12.830 119.133
Rio de Janeiro
1.810.925 3.198.755 5.009.680 27.341 23.273 50.614 491.881
Rio Grande do Sul
814 71.823 72.637 - 100 - 6.241
Santa Catarina
44.863 265.807 310.670 - 3.558 3.558 24.804
São Paulo 12.225.262 10.893.191 23.118.453 301.260 194.914 496.174 1.876.007
Subtotal 15.977.077 16.250.135 32.227.212 334.746 245.168 579.914 2.735.626
Nor
te/N
orde
ste
Nor
th/N
orth
east
Alagoas 2.201.157 2.345.081 4.546.238 5.233 17.163 22.396 426.936
Amazonas - - - - - - -
Bahia 452.585 83.698 536.283 - - - 51.941
Ceará 30.167 34.662 64.829 - - - 5.180
Maranhão 10.600 - 10.600 - 110 110 719
Pará - - - - - - -
Paraíba 306.743 411.746 718.489 - 5.032 5.032 61.747
Pernambuco 3.797.208 5.395.404 9.192.612 18.295 48.662 66.957 866.585
Piauí 12.384 - 12.384 - 188 188 968
Rio Grande do Norte
89.750 169.224 258.974 222 508 730 21.890
Sergipe 233.740 253.018 486.758 - 935 935 43.995
Tocantins - - - - - - -
Subtotal 7.134.334 8.692.833 15.827.167 23.750 72.598 96.348 1.479.962
TOTAL 23.111.411 24.942.968 48.054.379 358.496 317.766 676.262 4.215.588

Ministério da Agricultura, Pecuária e Abastecimento124
Tabela 60 – Safra: 68/69
Região Region
Estados States
Cana Moída - t Milled sugarcane - tons
Álcool - m³Ethanol - m3
Açúcar - t Sugar - tons
Própria Own
Fornecedores Supplied
TOTALAnidro
AnhydrousHidratado
HydrousTOTAL TOTAL
Cent
ro-S
ulCe
nter
-Sou
th
Espírito Santo
69.601 110.499 180.100 2.008 - 2.008 16.930
Goiás 75.677 13.687 89.364 - 397 397 7.826
Mato Grosso 13.577 33.044 46.621 - 6 6 3.241
Mato Grosso do Sul
- - - - - - -
Minas Gerais 938.869 553.128 1.491.997 1.466 10.179 11.645 142.288
Paraná 500.623 819.353 1.319.976 - 12.687 12.687 130.261
Rio de Janeiro
1.672.346 2.297.154 3.969.500 10.024 22.585 32.609 381.241
Rio Grande do Sul
391 20.978 21.369 - - - 1.851
Santa Catarina
66.792 164.033 230.825 - 2.390 2.390 18.552
São Paulo 12.294.874 9.000.103 21.294.977 120.795 172.248 293.043 2.012.801
Subtotal 15.632.750 13.011.979 28.644.729 134.293 220.492 354.785 2.714.991
Nor
te/N
orde
ste
Nor
th/N
orth
east
Alagoas 2.521.807 2.532.175 5.053.982 1.638 28.406 30.044 470.335
Amazonas - - - - - - -
Bahia 274.392 62.471 336.863 - - - 29.392
Ceará 39.023 47.653 86.676 - - - 6.881
Maranhão 20.879 - 20.879 - 155 155 1.191
Pará - - - - - - -
Paraíba 316.359 344.754 661.113 - 4.956 4.956 55.680
Pernambuco 3.652.055 4.346.951 7.999.006 7.378 73.575 80.953 761.596
Piauí 15.663 - 15.663 - 135 135 1.200
Rio Grande do Norte
89.845 181.384 271.229 - 1.286 1.286 22.291
Sergipe 174.665 336.760 511.425 - 1.331 1.331 48.187
Tocantins - - - - - - -
Subtotal 7.104.688 7.852.148 14.956.836 9.016 109.844 118.860 1.396.754
TOTAL 22.737.438 20.864.127 43.601.565 143.309 330.336 473.645 4.111.744

Anuário Estatístico da Agroenergia – 2012 125
Tabela 61 – Safra: 69/70
Região Region
Estados States
Cana Moída - t Milled sugarcane - tons
Álcool - m³Ethanol - m3
Açúcar - t Sugar - tons
Própria Own
Fornecedores Supplied
TOTALAnidro
AnhydrousHidratado
HydrousTOTAL TOTAL
Cent
ro-S
ulCe
nter
-Sou
th
Espírito Santo 105.958 139.010 244.968 2.129 2.129 22.388
Goiás 71.030 35.308 106.338 - 769 769 8.704
Mato Grosso 17.790 30.010 47.800 - 40 40 3.741
Mato Grosso do Sul
- - - - - - -
Minas Gerais 1.128.172 766.379 1.894.551 1.783 11.541 13.324 185.747
Paraná 543.087 779.771 1.322.858 - 11.652 11.652 115.922
Rio de Janeiro
2.152.664 2.725.538 4.878.202 9.124 26.679 35.803 463.920
Rio Grande do Sul
684 72.587 73.271 - 195 - 6.434
Santa Catarina
134.522 238.967 373.489 - 4.186 4.186 30.133
São Paulo 12.247.161 8.202.803 20.449.964 76.517 191.617 268.134 1.890.241
Subtotal 16.401.068 12.990.373 29.391.441 89.553 246.679 336.232 2.727.230
Nor
te/N
orde
ste
Nor
th/N
orth
east
Alagoas 2.662.326 3.075.410 5.737.736 2.618 30.947 33.565 536.365
Amazonas - - - - - - -
Bahia 280.757 107.159 387.916 - - - 36.468
Ceará 61.179 77.948 139.127 - - - 10.716
Maranhão 18.777 - 18.777 - 127 127 1.070
Pará - - - - - - -
Paraíba 387.597 360.687 748.284 - 5.391 5.391 62.704
Pernambuco 4.325.261 5.316.570 9.641.831 7.573 75.898 83.471 875.522
Piauí 22.711 - 22.711 - 157 157 1.828
Rio Grande do Norte
103.544 226.672 330.216 700 58 758 28.087
Sergipe 168.603 399.251 567.854 - 1.908 1.908 52.863
Tocantins - - - - - - -
Subtotal 8.030.755 9.563.697 17.594.452 10.891 114.486 125.377 1.605.623
TOTAL 24.431.823 22.554.070 46.985.893 100.444 361.165 461.609 4.332.853

Ministério da Agricultura, Pecuária e Abastecimento126
Tabela 62 – Safra: 70/71
Região Region
Estados States
Cana Moída - t Milled sugarcane - tons
Álcool - m³Ethanol - m3
Açúcar - t Sugar - tons
Própria Own
Fornecedores Supplied
TOTALAnidro
AnhydrousHidratado
HydrousTOTAL TOTAL
Cent
ro-S
ulCe
nter
-Sou
th
Espírito Santo
137.734 170.773 308.507 1.451 - 1.451 25.953
Goiás 104.999 26.492 131.491 - 1.017 1.017 12.310
Mato Grosso 19.199 20.564 39.763 - 167 167 3.080
Mato Grosso do Sul
- - - - - - -
Minas Gerais 1.578.841 775.880 2.354.721 2.398 13.231 15.629 221.151
Paraná 779.766 905.014 1.684.780 - 15.990 15.990 153.433
Rio de Janeiro
2.314.491 3.083.595 5.398.086 18.187 26.234 44.421 487.478
Rio Grande do Sul
8.115 126.898 135.013 - 204 204 11.760
Santa Catarina
136.928 226.870 363.798 - 4.016 4.016 30.060
São Paulo 16.520.686 11.509.612 28.030.298 213.947 222.766 436.713 2.436.462
Subtotal 21.600.759 16.845.698 38.446.457 235.984 283.625 519.609 3.381.686
Nor
te/N
orde
ste
Nor
th/N
orth
east
Alagoas 2.947.494 3.302.200 6.249.694 5.004 23.265 28.270 591.391
Amazonas - - - - - - -
Bahia 472.216 93.655 565.871 - - - 51.128
Ceará 43.868 70.341 114.209 - - - 9.551
Maranhão 846 846 - - - 34
Pará - - - - - - -
Paraíba 368.237 420.943 789.180 - 5.502 5.502 64.258
Pernambuco 3.954.993 6.094.107 10.049.100 11.328 69.418 80.746 943.815
Piauí 16.514 - 16.514 - 140 140 1.405
Rio Grande do Norte
103.636 177.914 281.550 - 782 782 23.605
Sergipe 189.352 374.638 563.990 - 2.101 2.101 52.993
Tocantins - - - - - - -
Subtotal 8.097.156 10.533.798 18.630.954 16.333 101.208 117.541 1.738.180
TOTAL 29.697.915 27.379.496 57.077.411 252.317 384.833 637.150 5.119.866
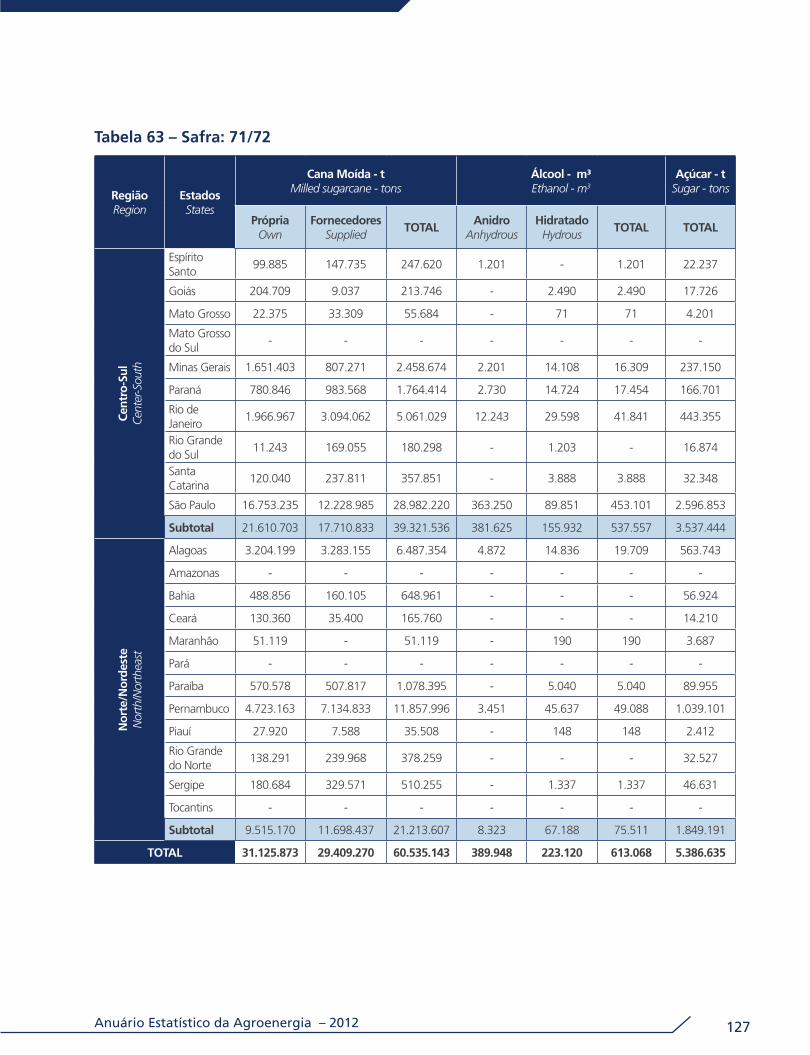
Anuário Estatístico da Agroenergia – 2012 127
Tabela 63 – Safra: 71/72
Região Region
Estados States
Cana Moída - t Milled sugarcane - tons
Álcool - m³Ethanol - m3
Açúcar - t Sugar - tons
Própria Own
Fornecedores Supplied
TOTALAnidro
AnhydrousHidratado
HydrousTOTAL TOTAL
Cent
ro-S
ulCe
nter
-Sou
th
Espírito Santo
99.885 147.735 247.620 1.201 - 1.201 22.237
Goiás 204.709 9.037 213.746 - 2.490 2.490 17.726
Mato Grosso 22.375 33.309 55.684 - 71 71 4.201
Mato Grosso do Sul
- - - - - - -
Minas Gerais 1.651.403 807.271 2.458.674 2.201 14.108 16.309 237.150
Paraná 780.846 983.568 1.764.414 2.730 14.724 17.454 166.701
Rio de Janeiro
1.966.967 3.094.062 5.061.029 12.243 29.598 41.841 443.355
Rio Grande do Sul
11.243 169.055 180.298 - 1.203 - 16.874
Santa Catarina
120.040 237.811 357.851 - 3.888 3.888 32.348
São Paulo 16.753.235 12.228.985 28.982.220 363.250 89.851 453.101 2.596.853
Subtotal 21.610.703 17.710.833 39.321.536 381.625 155.932 537.557 3.537.444
Nor
te/N
orde
ste
Nor
th/N
orth
east
Alagoas 3.204.199 3.283.155 6.487.354 4.872 14.836 19.709 563.743
Amazonas - - - - - - -
Bahia 488.856 160.105 648.961 - - - 56.924
Ceará 130.360 35.400 165.760 - - - 14.210
Maranhão 51.119 - 51.119 - 190 190 3.687
Pará - - - - - - -
Paraíba 570.578 507.817 1.078.395 - 5.040 5.040 89.955
Pernambuco 4.723.163 7.134.833 11.857.996 3.451 45.637 49.088 1.039.101
Piauí 27.920 7.588 35.508 - 148 148 2.412
Rio Grande do Norte
138.291 239.968 378.259 - - - 32.527
Sergipe 180.684 329.571 510.255 - 1.337 1.337 46.631
Tocantins - - - - - - -
Subtotal 9.515.170 11.698.437 21.213.607 8.323 67.188 75.511 1.849.191
TOTAL 31.125.873 29.409.270 60.535.143 389.948 223.120 613.068 5.386.635

Ministério da Agricultura, Pecuária e Abastecimento128
Tabela 64 – Safra: 72/73
Região Region
Estados States
Cana Moída - t Milled sugarcane - tons
Álcool - m³Ethanol - m3
Açúcar - t Sugar - tons
Própria Own
Fornecedores Supplied
TOTALAnidro
AnhydrousHidratado
HydrousTOTAL TOTAL
Cent
ro-S
ulCe
nter
-Sou
th
Espírito Santo
92.230 213.784 306.014 - 1.700 1.700 27.570
Goiás 176.382 5.171 181.553 - 1.955 1.955 17.340
Mato Grosso 9.480 25.736 35.216 - - - 3.183
Mato Grosso do Sul
- - - - - - -
Minas Gerais 1.983.212 1.061.109 3.044.321 2.536 18.602 21.138 282.065
Paraná 750.531 1.104.058 1.854.589 3.047 18.599 21.646 161.978
Rio de Janeiro
2.248.101 4.022.728 6.270.829 14.517 32.739 47.256 560.109
Rio Grande do Sul
11.020 117.900 128.920 - 1.022 1.022 11.927
Santa Catarina
134.154 251.975 386.129 - 4.638 - 33.374
São Paulo 18.230.877 13.507.090 31.737.967 363.346 136.758 500.104 2.836.255
Subtotal 23.635.987 20.309.551 43.945.538 383.446 216.013 599.459 3.933.801
Nor
te/N
orde
ste
Alagoas 3.813.398 3.959.435 7.772.833 2.716 17.712 20.428 653.979
Amazonas - - - - - - -
Bahia 482.432 165.038 647.470 - - - 55.912
Ceará 92.911 77.578 170.489 - - - 13.702
Maranhão 31.045 - 31.045 - 392 392 1.669
Pará - - - - - - -
Paraíba 562.395 721.077 1.283.472 - 3.805 3.805 96.511
Pernambuco 4.817.546 8.218.530 13.036.076 2.728 52.704 55.433 1.093.682
Piauí 29.701 13.455 43.156 - 377 377 2.713
Rio Grande do Norte
126.452 247.778 374.230 - - - 31.278
Sergipe 209.241 356.508 565.749 - 1.078 1.078 49.449
Tocantins - - - - - - -
Subtotal 10.165.121 13.759.399 23.924.520 5.445 76.068 81.513 1.998.897
TOTAL 33.801.108 34.068.950 67.870.058 388.891 292.081 680.972 5.932.698

Anuário Estatístico da Agroenergia – 2012 129
Tabela 65 – Safra: 73/74
Região Region
Estados States
Cana Moída - t Milled sugarcane - tons
Álcool - m³Ethanol - m3
Açúcar - t Sugar - tons
Própria Own
Fornecedores Supplied
TOTALAnidro
AnhydrousHidratado
HydrousTOTAL TOTAL
Cent
ro-S
ulCe
nter
-Sou
th
Espírito Santo
197.566 274.917 472.483 - 1.222 1.222 41.245
Goiás 138.036 63.824 201.860 - 2.121 2.121 18.482
Mato Grosso 13.465 47.079 60.544 - - - 5.124
Mato Grosso do Sul
- - - - - - -
Minas Gerais 2.099.400 1.334.107 3.433.507 1.410 19.479 20.889 316.359
Paraná 726.982 1.159.374 1.886.356 2.670 17.971 20.642 163.115
Rio de Janeiro
2.549.094 4.323.931 6.873.025 180 59.235 59.415 610.688
Rio Grande do Sul
8.958 77.569 86.527 - 300 300 7.898
Santa Catarina
200.447 215.549 415.996 - 4.852 - 33.812
São Paulo 22.689.311 14.754.721 37.444.032 300.243 154.448 454.691 3.510.807
Subtotal 28.623.259 22.251.071 50.874.330 304.504 259.629 564.133 4.707.532
Nor
te/N
orde
ste
Nor
th/N
orth
east
Alagoas 3.923.167 4.867.427 8.790.594 710 21.857 22.567 660.697
Amazonas - - - - - - -
Bahia 412.692 131.887 544.579 - - - 44.127
Ceará 78.682 86.962 165.644 - - - 12.862
Maranhão 17.804 - 17.804 - 94 94 535
Pará - - - - - - -
Paraíba 429.743 829.823 1.259.566 - 2.218 2.218 95.844
Pernambuco 4.235.245 9.009.083 13.244.328 1.002 75.688 76.690 1.080.939
Piauí 31.760 20.176 51.936 - 127 127 3.117
Rio Grande do Norte
127.954 213.301 341.255 - - - 30.987
Sergipe 233.433 315.329 548.762 - 150 150 46.540
Tocantins - - - - - - -
Subtotal 9.490.480 15.473.988 24.964.468 1.712 100.134 101.846 1.975.648
TOTAL 38.113.739 37.725.059 75.838.798 306.215 359.763 665.979 6.683.180

Ministério da Agricultura, Pecuária e Abastecimento130
Tabela 66 – Safra: 74/75
Região Region
Estados States
Cana Moída - t Milled sugarcane - tons
Álcool - m³Ethanol - m3
Açúcar - t Sugar - tons
Própria Own
Fornecedores Supplied
TOTALAnidro
AnhydrousHidratado
HydrousTOTAL TOTAL
Cent
ro-S
ulCe
nter
-Sou
th
Espírito Santo
174.656 192.015 366.671 - 1.390 1.390 37.119
Goiás 269.250 4.903 274.153 - 1.841 1.841 23.794
Mato Grosso 63.283 19.505 82.788 - - - 6.148
Mato Grosso do Sul
- - - - - - -
Minas Gerais 2.382.593 895.595 3.278.188 1.311 20.293 21.604 299.470
Paraná 1.192.780 723.745 1.916.525 1.144 20.203 21.347 172.535
Rio de Janeiro
2.329.393 3.236.680 5.566.073 2 48.770 48.771 512.482
Rio Grande do Sul
8.840 58.185 67.025 - - - 6.114
Santa Catarina
217.905 141.258 359.163 - 5.440 - 31.012
São Paulo 21.885.865 12.993.276 34.879.141 211.166 166.934 378.100 3.346.403
Subtotal 28.524.565 18.265.162 46.789.727 213.624 264.869 478.493 4.435.075
Nor
te/N
orde
ste
Nor
th/N
orth
east
Alagoas 4.805.189 6.217.118 11.022.307 571 20.641 21.213 877.291
Amazonas - - - - - - -
Bahia 383.036 111.260 494.296 - - - 39.905
Ceará 85.607 53.483 139.090 - - - 10.091
Maranhão 12.086 - 12.086 - 265 265 576
Pará 1.429 6.929 8.358 - 90 90 36
Paraíba 675.017 654.216 1.329.233 - 1.392 1.392 110.780
Pernambuco 4.272.788 9.286.264 13.559.052 2.333 90.817 93.150 1.149.842
Piauí 52.128 22.853 74.981 - 383 383 4.887
Rio Grande do Norte
182.149 222.642 404.791 - - - 37.983
Sergipe 318.762 355.960 674.722 - - - 54.379
Tocantins - - - - - - -
Subtotal 10.788.191 16.930.725 27.718.916 2.904 113.587 116.492 2.285.771
TOTAL 39.312.756 35.195.887 74.508.643 216.528 378.457 594.985 6.720.846

Anuário Estatístico da Agroenergia – 2012 131
Tabela 67 – Safra: 75/76
Região Region
Estados States
Cana Moída - t Milled sugarcane - tons
Álcool - m³Ethanol - m3
Açúcar - t Sugar - tons
Própria Own
Fornecedores Supplied
TOTALAnidro
AnhydrousHidratado
HydrousTOTAL TOTAL
Cent
ro-S
ulCe
nter
-Sou
th
Espírito Santo
250.837 205.020 455.857 - 2.003 2.003 38.062
Goiás 241.623 8.532 250.155 - 2.223 2.223 21.835
Mato Grosso 49.071 16.855 65.926 - - - 4.914
Mato Grosso do Sul
- - - - - - -
Minas Gerais 2.124.219 722.962 2.847.181 - 15.556 15.556 257.459
Paraná 1.260.501 645.033 1.905.534 - 19.956 19.956 144.748
Rio de Janeiro
2.706.260 3.677.993 6.384.253 - 55.163 55.163 540.709
Rio Grande do Sul
10.893 54.709 65.602 - - - 5.780
Santa Catarina
256.186 73.814 330.000 - 4.650 - 26.468
São Paulo 20.016.297 10.401.155 30.417.452 218.769 143.517 362.286 2.869.447
Subtotal 26.915.887 15.806.073 42.721.960 218.769 243.068 461.837 3.909.423
Nor
te/N
orde
ste
Nor
th/N
orth
east
Alagoas 4.518.765 5.219.326 9.738.091 937 26.542 27.479 709.283
Amazonas - - - - - - -
Bahia 399.586 104.180 503.766 - - - 42.427
Ceará 109.396 100.372 209.768 - - - 14.668
Maranhão - - - - - - -
Pará 11.516 35.053 46.569 - 730 730 1.341
Paraíba 601.145 528.312 1.129.457 272 534 806 94.218
Pernambuco 3.988.530 8.761.344 12.749.874 12.643 51.881 64.525 1.004.622
Piauí 63.364 28.217 91.581 - 251 251 6.153
Rio Grande do Norte
225.830 267.170 493.000 - - - 45.476
Sergipe 359.863 278.690 638.553 - - - 60.220
Tocantins - - - - - - -
Subtotal 10.277.995 15.322.664 25.600.659 13.853 79.938 93.790 1.978.408
TOTAL 37.193.882 31.128.737 68.322.619 232.621 323.006 555.627 5.887.832

Ministério da Agricultura, Pecuária e Abastecimento132
Tabela 68 – Safra: 76/77
Região Region
Estados States
Cana Moída - t Milled sugarcane - tons
Álcool - m³Ethanol - m3
Açúcar - t Sugar - tons
Própria Own
Fornecedores Supplied
TOTALAnidro
AnhydrousHidratado
HydrousTOTAL TOTAL
Cent
ro-S
ulCe
nter
-Sou
th
Espírito Santo
204.011 226.270 430.281 - 6.952 6.952 33.794
Goiás 235.026 9.085 244.111 - 1.617 1.617 20.311
Mato Grosso 59.754 15.809 75.563 - - - 5.756
Mato Grosso do Sul
- - - - - - -
Minas Gerais 2.312.998 916.958 3.229.956 - 15.958 15.958 284.343
Paraná 1.488.604 812.387 2.300.991 5.015 10.502 15.517 182.185
Rio de Janeiro
2.042.339 3.311.405 5.353.744 5.668 38.305 43.973 386.360
Rio Grande do Sul
16.041 56.702 72.743 - - - 6.140
Santa Catarina
236.711 49.837 286.548 - 4.675 - 24.533
São Paulo 25.629.896 15.671.889 41.301.785 246.911 216.783 463.694 3.563.757
Subtotal 32.225.380 21.070.342 53.295.722 257.593 294.793 552.386 4.507.179
Nor
te/N
orde
ste
Nor
th/N
orth
east
Alagoas 6.094.600 8.403.126 14.497.726 7.424 17.588 25.012 1.120.999
Amazonas - - - - - - -
Bahia 440.887 186.338 627.225 - - - 47.239
Ceará 92.597 174.122 266.719 - - - 23.090
Maranhão - 69.736 69.736 - 857 857 4.260
Pará - - - - 1.425 1.425 -
Paraíba 739.892 837.533 1.577.425 - 57 57 131.764
Pernambuco 4.575.452 11.319.947 15.895.399 35.323 48.919 84.242 1.231.929
Piauí 24.844 22.926 47.770 - 342 342 3.349
Rio Grande do Norte
324.914 400.746 725.660 - - - 69.204
Sergipe 403.013 420.269 823.282 - - - 69.489
Tocantins - - - - - - -
Subtotal 12.696.199 21.834.743 34.530.942 42.747 69.189 111.936 2.701.323
TOTAL 44.921.579 42.905.085 87.826.664 300.340 363.982 664.322 7.208.502

Anuário Estatístico da Agroenergia – 2012 133
Tabela 69 – Safra: 77/78
Região Region
Estados States
Cana Moída - t Milled sugarcane - tons
Álcool - m³Ethanol - m3
Açúcar - t Sugar - tons
Própria Own
Fornecedores Supplied
TOTALAnidro
AnhydrousHidratado
HydrousTOTAL TOTAL
Cent
ro-S
ulCe
nter
-Sou
th
Espírito Santo
211.370 311.050 522.420 - 8.005 8.005 44.806
Goiás 306.342 10.013 316.355 1.266 2.000 3.266 28.931
Mato Grosso 71.560 20.141 91.701 - - - 6.943
Mato Grosso do Sul
- - - - - - -
Minas Gerais 2.985.972 1.682.164 4.668.136 3.704 24.856 28.560 435.102
Paraná 1.737.787 803.416 2.541.203 23.896 3.739 27.634 210.431
Rio de Janeiro
2.785.078 4.781.374 7.566.452 52.152 42.926 95.078 588.782
Rio Grande do Sul
15.196 113.236 128.432 - - - 11.236
Santa Catarina
266.119 83.571 349.690 - 4.907 - 27.517
São Paulo 32.445.860 20.320.495 52.766.355 949.629 145.529 1.095.158 4.098.908
Subtotal 40.825.284 28.125.460 68.950.744 1.030.647 231.962 1.262.609 5.452.657
Nor
te/N
orde
ste
Nor
th/N
orth
east
Alagoas 6.518.711 8.072.317 14.591.028 25.322 14.942 40.263 1.134.342
Amazonas - - - - - - -
Bahia 423.962 195.716 619.678 - - - 46.136
Ceará 177.790 257.496 435.286 6.791 - 6.791 35.786
Maranhão - 138.534 138.534 - 914 914 9.025
Pará 151 88.632 88.783 - 1.357 1.357 3.484
Paraíba 669.708 1.080.812 1.750.520 16.261 1.851 18.112 136.902
Pernambuco 4.669.725 11.488.192 16.157.917 97.928 42.168 140.096 1.321.795
Piauí 11.912 33.453 45.365 - 262 262 2.483
Rio Grande do Norte
374.455 521.631 896.086 - - - 85.175
Sergipe 443.999 515.855 959.854 - - - 80.158
Tocantins - - - - - - -
Subtotal 13.290.413 22.392.638 35.683.051 146.301 61.494 207.795 2.855.285
TOTAL 54.115.697 50.518.098 104.633.795 1.176.948 293.456 1.470.404 8.307.942

Ministério da Agricultura, Pecuária e Abastecimento134
Tabela 70 – Safra: 78/79
Região Region
Estados States
Cana Moída - t Milled sugarcane - tons
Álcool - m³Ethanol - m3
Açúcar - t Sugar - tons
Própria Own
Fornecedores Supplied
TOTALAnidro
AnhydrousHidratado
HydrousTOTAL TOTAL
Cent
ro-S
ulCe
nter
-Sou
th
Espírito Santo
212.602 301.726 514.328 8.259 - 8.259 38.990
Goiás 245.000 9.961 254.961 - 2.345 2.345 23.442
Mato Grosso 99.367 80.850 180.217 670 - 670 12.325
Mato Grosso do Sul
- - - 2.095 - 2.095 -
Minas Gerais 2.869.777 1.503.498 4.373.275 30.791 16.989 47.780 396.442
Paraná 2.115.498 796.358 2.911.856 61.791 5.889 67.680 204.117
Rio de Janeiro
2.273.240 4.566.483 6.839.723 92.105 40.221 132.326 568.237
Rio Grande do Sul
19.736 86.733 106.469 - - - 8.962
Santa Catarina
340.730 97.381 438.111 - 5.776 - 36.596
São Paulo 24.059.680 17.666.744 41.726.424 1.544.130 268.290 1.812.421 3.194.472
Subtotal 32.235.630 25.109.734 57.345.364 1.739.842 339.510 2.079.352 4.483.585
Nor
te/N
orde
ste
Nor
th/N
orth
east
Alagoas 5.737.072 8.127.048 13.864.120 137.843 15.988 153.830 1.125.017
Amazonas - - - - - - -
Bahia 300.883 141.775 442.658 - 1.445 1.445 32.811
Ceará 136.125 340.862 476.987 4.087 - 4.087 43.079
Maranhão 5.166 164.127 169.293 3.745 - 3.745 12.772
Pará - 106.118 106.118 - 1.459 1.459 5.343
Paraíba 690.937 1.114.873 1.805.810 38.963 2.494 41.457 144.409
Pernambuco 4.535.487 11.609.131 16.144.618 151.836 33.834 185.670 1.314.146
Piauí 14.916 30.338 45.254 - 277 277 3.271
Rio Grande do Norte
441.172 620.344 1.061.516 18.513 - 18.513 90.752
Sergipe 486.957 464.191 951.148 768 - 768 87.533
Tocantins - - - - - - -
Subtotal 12.348.715 22.718.807 35.067.522 355.755 55.496 411.251 2.859.134
TOTAL 44.584.345 47.828.541 92.412.886 2.095.597 395.006 2.490.603 7.342.718

Anuário Estatístico da Agroenergia – 2012 135
Tabela 71 – Safra: 79/80
Região Region
Estados States
Cana Moída - t Milled sugarcane - tons
Álcool - m³Ethanol - m3
Açúcar - t Sugar - tons
Própria Own
Fornecedores Supplied
TOTALAnidro
AnhydrousHidratado
HydrousTOTAL TOTAL
Cent
ro-S
ulCe
nter
-Sou
th
Espírito Santo
256.669 382.354 639.023 10.003 - 10.003 52.154
Goiás 347.116 8.462 355.578 3.805 3.639 7.444 24.841
Mato Grosso 178.739 113.444 292.183 9.555 - 9.555 21.669
Mato Grosso do Sul
- - - 13.678 40 13.718 -
Minas Gerais 3.360.949 2.474.302 5.835.251 60.581 15.186 75.767 468.854
Paraná 2.000.743 894.542 2.895.285 84.662 7.289 91.951 195.419
Rio de Janeiro
2.663.916 4.343.560 7.007.476 86.721 52.816 139.537 506.059
Rio Grande do Sul
14.142 74.613 88.755 - - - 7.276
Santa Catarina
397.977 120.052 518.029 - 6.892 - 44.547
São Paulo 36.319.208 23.470.456 59.789.664 2.031.194 441.146 2.472.340 2.756.414
Subtotal 45.539.459 31.881.785 77.421.244 2.300.199 527.008 2.827.207 4.077.233
Nor
te/N
orde
ste
Nor
th/N
orth
east
Alagoas 6.911.049 7.688.205 14.599.254 169.418 56.637 226.055 1.009.431
Amazonas - - - - - - -
Bahia 305.664 95.356 401.020 2.021 - 2.021 32.574
Ceará 151.461 315.262 466.723 2.808 26 2.834 42.641
Maranhão - 171.692 171.692 3.472 3 3.475 14.674
Pará - 108.168 108.168 - 2.956 2.956 5.514
Paraíba 708.301 964.746 1.673.047 50.235 16.775 67.010 125.181
Pernambuco 4.737.528 11.050.612 15.788.140 159.127 76.838 235.965 1.169.470
Piauí 8.333 28.840 37.173 - 436 436 2.858
Rio Grande do Norte
447.243 566.706 1.013.949 24.981 263 25.244 78.910
Sergipe 564.140 400.873 965.013 3.120 129 3.249 87.740
Tocantins - - - - - - -
Subtotal 13.833.719 21.390.460 35.224.179 415.182 154.063 569.245 2.568.993
TOTAL 59.373.178 53.272.245 112.645.423 2.715.381 681.071 3.396.452 6.646.226

Ministério da Agricultura, Pecuária e Abastecimento136
Tabela 72 – Safra: 80/81
Região Region
Estados States
Cana Moída - t Milled sugarcane - tons
Álcool - m³Ethanol - m3
Açúcar - t Sugar - tons
Própria Own
Fornecedores Supplied
TOTALAnidro
AnhydrousHidratado
HydrousTOTAL TOTAL
Cent
ro-S
ulCe
nter
-Sou
th
Espírito Santo
255.582 431.570 687.152 17.677 - 17.677 45.869
Goiás 304.859 5.846 310.705 3.616 5.791 9.407 21.487
Mato Grosso 188.092 114.664 302.756 8.840 1.020 9.860 19.928
Mato Grosso do Sul
- - - 24.176 3.624 27.800 -
Minas Gerais 3.232.155 2.701.918 5.934.073 70.022 34.937 104.959 482.018
Paraná 2.150.568 1.118.546 3.269.114 109.165 32.468 141.633 210.030
Rio de Janeiro
2.590.137 3.848.958 6.439.095 44.080 85.774 129.854 433.262
Rio Grande do Sul
18.445 110.445 128.890 - 875 875 10.482
Santa Catarina
308.869 84.104 392.973 - 5.943 - 61.772
São Paulo 39.214.651 26.752.699 65.967.350 1.545.100 1.062.795 2.607.895 3.968.261
Subtotal 48.263.358 35.168.750 83.432.108 1.822.676 1.233.227 3.055.903 5.253.109
Nor
te/N
orde
ste
Nor
th/N
orth
east
Alagoas 8.841.911 8.826.077 17.667.988 160.485 148.776 309.261 1.215.990
Amazonas - - - - 250 250 -
Bahia 440.055 118.646 558.701 1.262 - 1.262 44.037
Ceará 153.654 271.231 424.885 1.423 3.314 4.737 37.375
Maranhão - 189.449 189.449 2.225 1.481 3.706 17.668
Pará - 135.741 135.741 - 2.796 2.796 8.269
Paraíba 746.526 935.817 1.682.343 32.862 41.475 74.337 131.619
Pernambuco 5.657.650 11.539.637 17.197.287 59.428 145.263 204.691 1.348.756
Piauí 10.537 29.701 40.238 - 198 198 2.949
Rio Grande do Norte
567.032 631.603 1.198.635 23.367 20.935 44.302 89.911
Sergipe 614.473 538.749 1.153.222 1.561 3.371 4.932 104.773
Tocantins - - - - - - -
Subtotal 17.031.838 23.216.651 40.248.489 282.613 367.859 650.472 3.001.347
TOTAL 65.295.196 58.385.401 123.680.597 2.105.289 1.601.086 3.706.375 8.254.456

Anuário Estatístico da Agroenergia – 2012 137
Tabela 73 – Safra: 81/82
Região Region
Estados States
Cana Moída - t Milled sugarcane - tons
Álcool - m³Ethanol - m3
Açúcar - t Sugar - tons
Própria Own
Fornecedores Supplied
TOTALAnidro
AnhydrousHidratado
HydrousTOTAL TOTAL
Cent
ro-S
ulCe
nter
-Sou
th
Espírito Santo
228.385 409.349 637.734 - 15.767 15.767 43.168
Goiás 205.100 981 206.081 - 17.970 17.970 15.598
Mato Grosso 136.362 73.275 209.637 5.100 4.135 9.235 21.419
Mato Grosso do Sul
- - - 11.689 30.422 42.111
Minas Gerais 2.172.378 2.571.764 4.744.142 36.471 97.112 133.583 445.360
Paraná 1.865.372 879.830 2.745.202 55.283 140.320 195.603 182.669
Rio de Janeiro
1.901.755 3.520.776 5.422.531 33.671 120.226 153.897 472.619
Rio Grande do Sul
12.821 85.239 98.060 - 1.833 1.833 8.015
Santa Catarina
440.446 88.960 529.406 - 10.763 - 42.019
São Paulo 24.053.058 19.741.586 43.794.644 871.999 1.961.642 2.833.641 3.915.168
Subtotal 31.015.677 27.371.760 58.387.437 1.014.213 2.400.190 3.414.403 5.146.035
Nor
te/N
orde
ste
Nor
th/N
orth
east
Alagoas 6.876.357 7.531.773 14.408.130 256.451 161.297 417.748 1.188.865
Amazonas - - - - 730 730 -
Bahia 479.683 92.816 572.499 1.723 3.524 5.247 49.827
Ceará 95.787 230.534 326.321 - 10.690 10.690 30.030
Maranhão - 184.190 184.190 - 8.234 8.234 17.351
Pará - 103.394 103.394 - 2.368 2.368 6.685
Paraíba 526.188 909.839 1.436.027 41.816 33.522 75.338 120.917
Pernambuco 4.590.138 9.240.731 13.830.869 120.787 134.591 255.378 1.211.728
Piauí 4.666 18.051 22.717 - 2.520 2.520 1.372
Rio Grande do Norte
282.556 402.312 684.868 16.380 23.905 40.285 66.409
Sergipe 504.346 620.566 1.124.912 1.728 5.454 7.182 96.102
Tocantins - - - - - - -
Subtotal 13.359.721 19.334.206 32.693.927 438.885 386.835 825.720 2.789.286
TOTAL 44.375.398 46.705.966 91.081.364 1.453.098 2.787.025 4.240.123 7.935.321
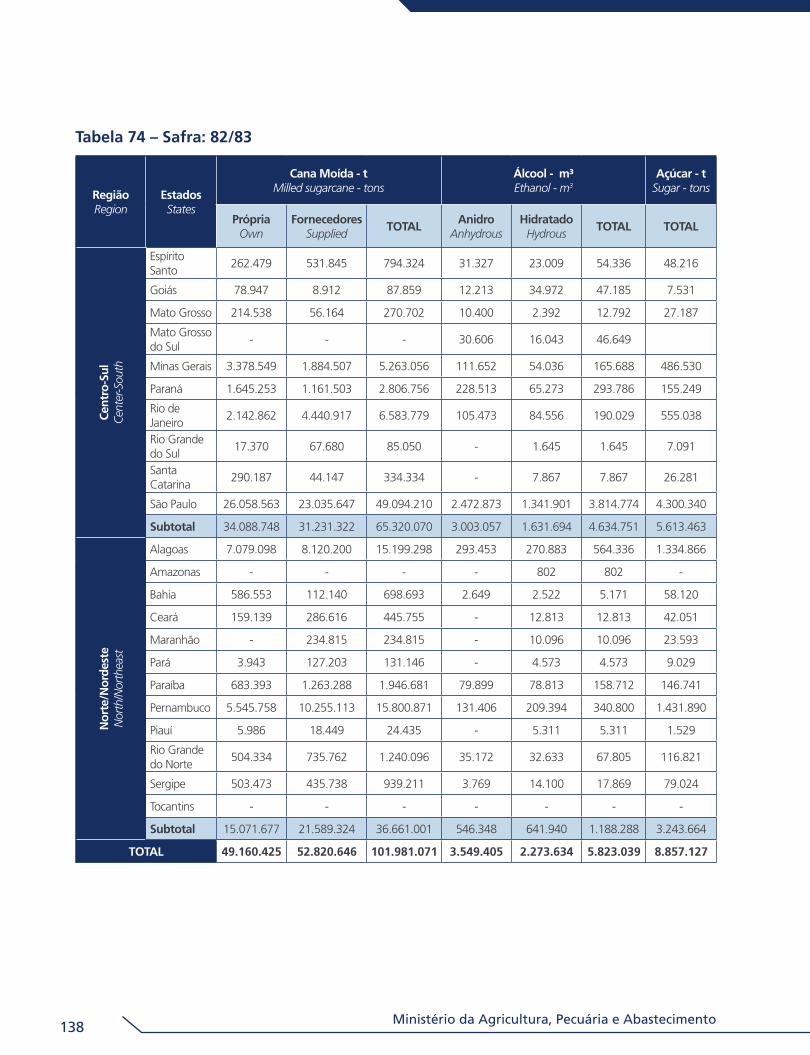
Ministério da Agricultura, Pecuária e Abastecimento138
Tabela 74 – Safra: 82/83
Região Region
Estados States
Cana Moída - t Milled sugarcane - tons
Álcool - m³Ethanol - m3
Açúcar - t Sugar - tons
Própria Own
Fornecedores Supplied
TOTALAnidro
AnhydrousHidratado
HydrousTOTAL TOTAL
Cent
ro-S
ulCe
nter
-Sou
th
Espírito Santo
262.479 531.845 794.324 31.327 23.009 54.336 48.216
Goiás 78.947 8.912 87.859 12.213 34.972 47.185 7.531
Mato Grosso 214.538 56.164 270.702 10.400 2.392 12.792 27.187
Mato Grosso do Sul
- - - 30.606 16.043 46.649
Minas Gerais 3.378.549 1.884.507 5.263.056 111.652 54.036 165.688 486.530
Paraná 1.645.253 1.161.503 2.806.756 228.513 65.273 293.786 155.249
Rio de Janeiro
2.142.862 4.440.917 6.583.779 105.473 84.556 190.029 555.038
Rio Grande do Sul
17.370 67.680 85.050 - 1.645 1.645 7.091
Santa Catarina
290.187 44.147 334.334 - 7.867 7.867 26.281
São Paulo 26.058.563 23.035.647 49.094.210 2.472.873 1.341.901 3.814.774 4.300.340
Subtotal 34.088.748 31.231.322 65.320.070 3.003.057 1.631.694 4.634.751 5.613.463
Nor
te/N
orde
ste
Nor
th/N
orth
east
Alagoas 7.079.098 8.120.200 15.199.298 293.453 270.883 564.336 1.334.866
Amazonas - - - - 802 802 -
Bahia 586.553 112.140 698.693 2.649 2.522 5.171 58.120
Ceará 159.139 286.616 445.755 - 12.813 12.813 42.051
Maranhão - 234.815 234.815 - 10.096 10.096 23.593
Pará 3.943 127.203 131.146 - 4.573 4.573 9.029
Paraíba 683.393 1.263.288 1.946.681 79.899 78.813 158.712 146.741
Pernambuco 5.545.758 10.255.113 15.800.871 131.406 209.394 340.800 1.431.890
Piauí 5.986 18.449 24.435 - 5.311 5.311 1.529
Rio Grande do Norte
504.334 735.762 1.240.096 35.172 32.633 67.805 116.821
Sergipe 503.473 435.738 939.211 3.769 14.100 17.869 79.024
Tocantins - - - - - - -
Subtotal 15.071.677 21.589.324 36.661.001 546.348 641.940 1.188.288 3.243.664
TOTAL 49.160.425 52.820.646 101.981.071 3.549.405 2.273.634 5.823.039 8.857.127

Anuário Estatístico da Agroenergia – 2012 139
Tabela 75 – Safra: 83/84
Região Region
Estados States
Cana Moída - t Milled sugarcane - tons
Álcool - m³Ethanol - m3
Açúcar - t Sugar - tons
Própria Own
Fornecedores Supplied
TOTALAnidro
AnhydrousHidratado
HydrousTOTAL TOTAL
Cent
ro-S
ulCe
nter
-Sou
th
Espírito Santo
228.864 464.155 693.019 31.497 44.358 75.855 29.352
Goiás 94.992 1.525 96.517 39.637 114.461 154.098 7.706
Mato Grosso 203.798 68.719 272.517 6.564 16.417 22.981 25.300
Mato Grosso do Sul
- - 40.090 71.372 111.462
Minas Gerais 3.791.940 2.124.724 5.916.664 115.264 154.858 270.122 490.485
Paraná 1.788.114 1.252.295 3.040.409 138.157 353.447 491.604 150.949
Rio de Janeiro
1.677.548 4.109.399 5.786.947 72.274 131.209 203.483 437.209
Rio Grande do Sul
23.031 81.986 105.017 - 2.774 2.774 8.407
Santa Catarina
270.093 37.213 307.306 - 11.167 - 20.730
São Paulo 27.229.981 23.215.569 50.445.550 1.680.817 3.710.244 5.391.061 4.341.528
Subtotal 35.308.361 31.355.585 66.663.946 2.124.300 4.610.307 6.734.607 5.511.666
Nor
te/N
orde
ste
Nor
th/N
orth
east
Alagoas 7.298.570 7.604.530 14.903.100 205.207 345.185 550.392 1.372.660
Amazonas - - - - 1.568 1.568 -
Bahia 731.983 186.070 918.053 2.260 25.310 27.570 75.479
Ceará 95.511 332.093 427.604 - 11.056 11.056 38.031
Maranhão - 241.017 241.017 4.710 8.686 13.396 25.008
Pará - - - - 1.973 1.973 -
Paraíba 747.976 1.125.923 1.873.899 31.888 135.825 167.713 152.173
Pernambuco 6.031.445 11.862.076 17.893.521 82.177 183.385 265.562 1.707.294
Piauí 5.661 10.669 16.330 - 5.958 5.958 1.029
Rio Grande do Norte
555.050 725.020 1.280.070 18.901 48.631 67.532 122.529
Sergipe 479.207 452.303 931.510 - 16.919 16.919 80.215
Tocantins - - - - - - -
Subtotal 15.945.403 22.539.701 38.485.104 345.143 784.496 1.129.639 3.574.418
TOTAL 51.253.764 53.895.286 105.149.050 2.469.443 5.394.803 7.864.246 9.086.084

Ministério da Agricultura, Pecuária e Abastecimento140
Tabela 76 – Safra: 84/85
Região Region
Estados States
Cana Moída - t Milled sugarcane - tons
Álcool - m³Ethanol - m3
Açúcar - t Sugar - tons
Própria Own
Fornecedores Supplied
TOTALAnidro
AnhydrousHidratado
HydrousTOTAL TOTAL
Cent
ro-S
ulCe
nter
-Sou
th
Espírito Santo
- - 2.055.822 26.668 91.374 118.042 36.520
Goiás - - 3.664.846 50.096 206.019 256.115 14.840
Mato Grosso - - 949.086 4.881 50.489 55.370 -
Mato Grosso do Sul
2.386.583 37.992 134.021 172.013
Minas Gerais - - 9.134.087 72.015 255.809 327.824 520.523
Paraná - - 7.619.854 84.532 320.119 404.651 141.810
Rio de Janeiro
- - 7.640.313 35.270 184.235 219.505 433.230
Rio Grande do Sul
- - 92.208 - 346 346 7.788
Santa Catarina
- - 349.786 - 11.252 11.252 21.849
São Paulo - - 111.887.030 1.515.667 4.507.703 6.023.370 4.105.938
Subtotal - - 145.779.615 1.827.121 5.761.367 7.588.488 5.282.498
Nor
te/N
orde
ste
Nor
th/N
orth
east
Alagoas - - 22.645.120 103.636 601.561 705.197 1.320.338
Amazonas - - 101.389 - 6.061 6.061 -
Bahia - - 1.691.378 4.032 39.311 43.343 100.088
Ceará - - 547.998 - 15.120 15.120 41.788
Maranhão - - 531.676 - 17.701 17.701 32.217
Pará - - 59.425 - 4.233 4.233 -
Paraíba - - 4.783.765 30.578 198.741 229.319 151.722
Pernambuco - - 23.143.963 110.824 343.520 454.344 1.700.356
Piauí - - 152.258 - 11.006 11.006 -
Rio Grande do Norte
- - 2.208.931 26.394 60.123 86.517 109.734
Sergipe - - 1.222.237 - 30.351 30.351 79.414
Tocantins - - - - - - -
Subtotal - - 57.088.140 275.464 1.327.728 1.603.192 3.535.657
TOTAL - - 202.867.755 2.102.585 7.089.095 9.191.680 8.818.155
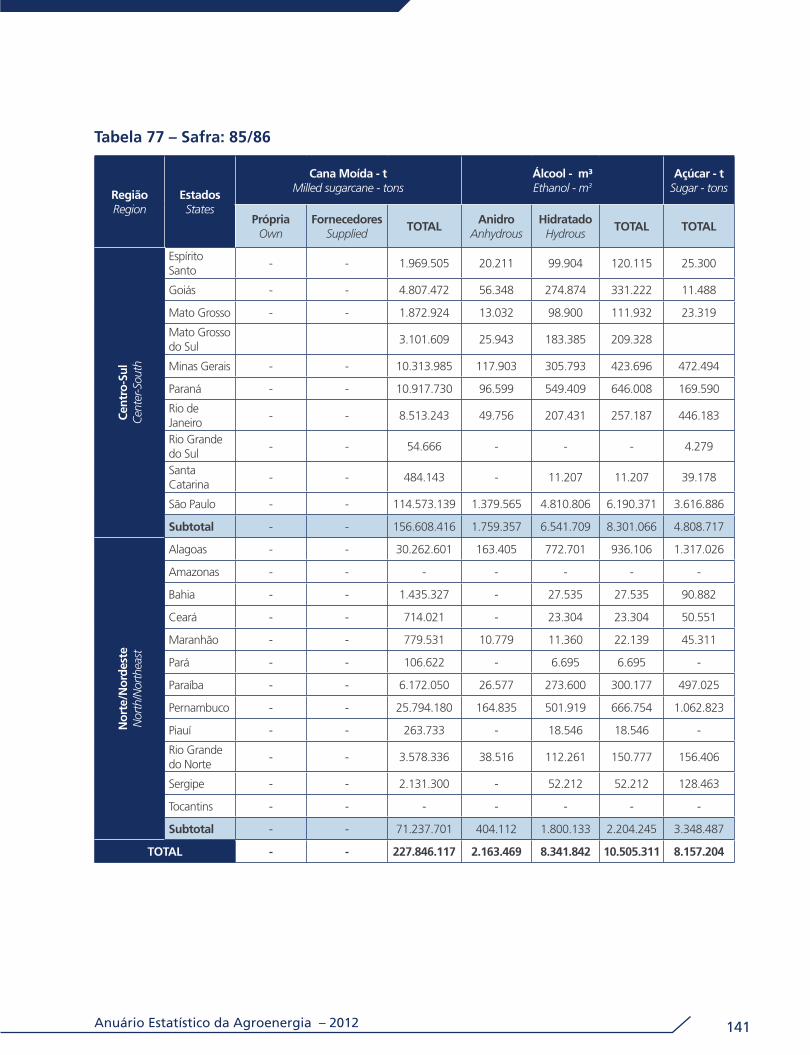
Anuário Estatístico da Agroenergia – 2012 141
Tabela 77 – Safra: 85/86
Região Region
Estados States
Cana Moída - t Milled sugarcane - tons
Álcool - m³Ethanol - m3
Açúcar - t Sugar - tons
Própria Own
Fornecedores Supplied
TOTALAnidro
AnhydrousHidratado
HydrousTOTAL TOTAL
Cent
ro-S
ulCe
nter
-Sou
th
Espírito Santo
- - 1.969.505 20.211 99.904 120.115 25.300
Goiás - - 4.807.472 56.348 274.874 331.222 11.488
Mato Grosso - - 1.872.924 13.032 98.900 111.932 23.319
Mato Grosso do Sul
3.101.609 25.943 183.385 209.328
Minas Gerais - - 10.313.985 117.903 305.793 423.696 472.494
Paraná - - 10.917.730 96.599 549.409 646.008 169.590
Rio de Janeiro
- - 8.513.243 49.756 207.431 257.187 446.183
Rio Grande do Sul
- - 54.666 - - - 4.279
Santa Catarina
- - 484.143 - 11.207 11.207 39.178
São Paulo - - 114.573.139 1.379.565 4.810.806 6.190.371 3.616.886
Subtotal - - 156.608.416 1.759.357 6.541.709 8.301.066 4.808.717
Nor
te/N
orde
ste
Nor
th/N
orth
east
Alagoas - - 30.262.601 163.405 772.701 936.106 1.317.026
Amazonas - - - - - - -
Bahia - - 1.435.327 - 27.535 27.535 90.882
Ceará - - 714.021 - 23.304 23.304 50.551
Maranhão - - 779.531 10.779 11.360 22.139 45.311
Pará - - 106.622 - 6.695 6.695 -
Paraíba - - 6.172.050 26.577 273.600 300.177 497.025
Pernambuco - - 25.794.180 164.835 501.919 666.754 1.062.823
Piauí - - 263.733 - 18.546 18.546 -
Rio Grande do Norte
- - 3.578.336 38.516 112.261 150.777 156.406
Sergipe - - 2.131.300 - 52.212 52.212 128.463
Tocantins - - - - - - -
Subtotal - - 71.237.701 404.112 1.800.133 2.204.245 3.348.487
TOTAL - - 227.846.117 2.163.469 8.341.842 10.505.311 8.157.204

Ministério da Agricultura, Pecuária e Abastecimento142
Tabela 78 – Safra: 86/87
Região Region
Estados States
Cana Moída - t Milled sugarcane - tons
Álcool - m³Ethanol - m3
Açúcar - t Sugar - tons
Própria Own
Fornecedores Supplied
TOTALAnidro
AnhydrousHidratado
HydrousTOTAL TOTAL
Cent
ro-S
ulCe
nter
-Sou
th
Espírito Santo
- - 1.969.505 20.211 99.904 120.115 25.300
Goiás - - 4.807.472 56.348 274.874 331.222 11.488
Mato Grosso - - 1.872.924 13.032 98.900 111.932 23.319
Mato Grosso do Sul
3.101.609 25.943 183.385 209.328
Minas Gerais - - 10.313.985 117.903 305.793 423.696 472.494
Paraná - - 10.917.730 96.599 549.409 646.008 169.590
Rio de Janeiro
- - 8.513.243 49.756 207.431 257.187 446.183
Rio Grande do Sul
- - 54.666 - - - 4.279
Santa Catarina
- - 484.143 - 11.207 11.207 39.178
São Paulo - - 114.573.139 1.379.565 4.810.806 6.190.371 3.616.886
Subtotal - - 156.608.416 1.759.357 6.541.709 8.301.066 4.808.717
Nor
te/N
orde
ste
Nor
th/N
orth
east
Alagoas - - 30.262.601 163.405 772.701 936.106 1.317.026
Amazonas - - - - - - -
Bahia - - 1.435.327 - 27.535 27.535 90.882
Ceará - - 714.021 - 23.304 23.304 50.551
Maranhão - - 779.531 10.779 11.360 22.139 45.311
Pará - - 106.622 - 6.695 6.695 -
Paraíba - - 6.172.050 26.577 273.600 300.177 497.025
Pernambuco - - 25.794.180 164.835 501.919 666.754 1.062.823
Piauí - - 263.733 - 18.546 18.546 -
Rio Grande do Norte
- - 3.578.336 38.516 112.261 150.777 156.406
Sergipe - - 2.131.300 - 52.212 52.212 128.463
Tocantins - - - - - - -
Subtotal - - 71.237.701 404.112 1.800.133 2.204.245 3.348.487
TOTAL - - 227.846.117 2.163.469 8.341.842 10.505.311 8.157.204
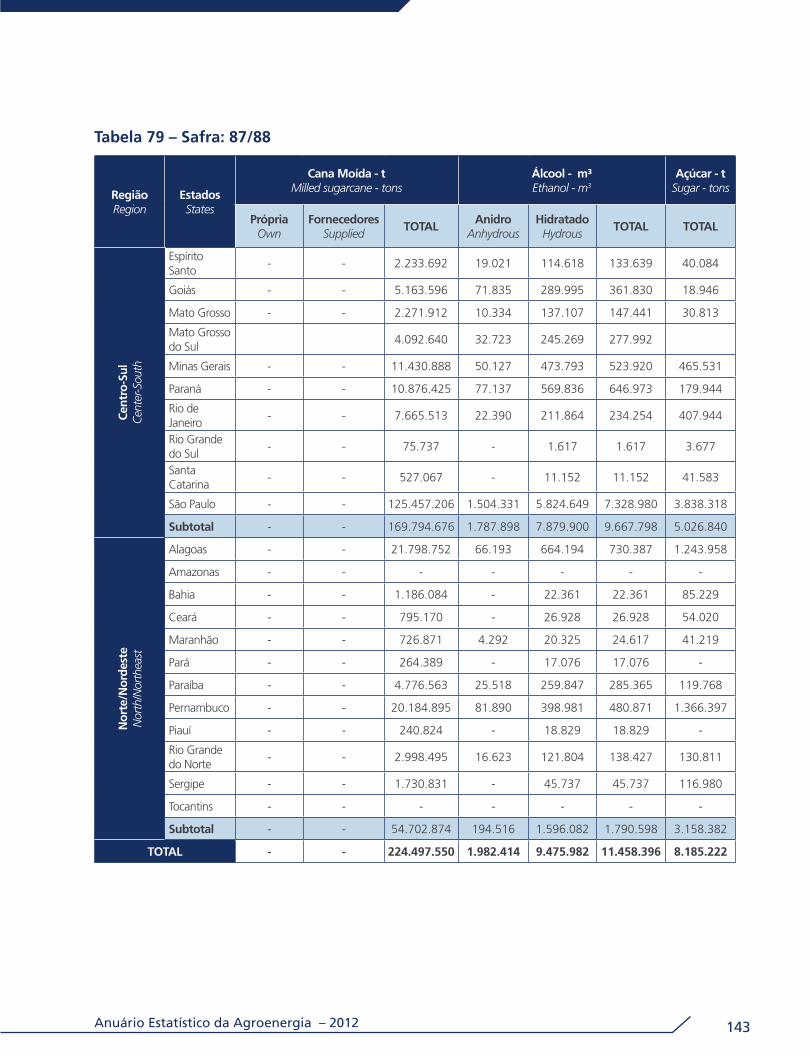
Anuário Estatístico da Agroenergia – 2012 143
Tabela 79 – Safra: 87/88
Região Region
Estados States
Cana Moída - t Milled sugarcane - tons
Álcool - m³Ethanol - m3
Açúcar - t Sugar - tons
Própria Own
Fornecedores Supplied
TOTALAnidro
AnhydrousHidratado
HydrousTOTAL TOTAL
Cent
ro-S
ulCe
nter
-Sou
th
Espírito Santo
- - 2.233.692 19.021 114.618 133.639 40.084
Goiás - - 5.163.596 71.835 289.995 361.830 18.946
Mato Grosso - - 2.271.912 10.334 137.107 147.441 30.813
Mato Grosso do Sul
4.092.640 32.723 245.269 277.992
Minas Gerais - - 11.430.888 50.127 473.793 523.920 465.531
Paraná - - 10.876.425 77.137 569.836 646.973 179.944
Rio de Janeiro
- - 7.665.513 22.390 211.864 234.254 407.944
Rio Grande do Sul
- - 75.737 - 1.617 1.617 3.677
Santa Catarina
- - 527.067 - 11.152 11.152 41.583
São Paulo - - 125.457.206 1.504.331 5.824.649 7.328.980 3.838.318
Subtotal - - 169.794.676 1.787.898 7.879.900 9.667.798 5.026.840
Nor
te/N
orde
ste
Nor
th/N
orth
east
Alagoas - - 21.798.752 66.193 664.194 730.387 1.243.958
Amazonas - - - - - - -
Bahia - - 1.186.084 - 22.361 22.361 85.229
Ceará - - 795.170 - 26.928 26.928 54.020
Maranhão - - 726.871 4.292 20.325 24.617 41.219
Pará - - 264.389 - 17.076 17.076 -
Paraíba - - 4.776.563 25.518 259.847 285.365 119.768
Pernambuco - - 20.184.895 81.890 398.981 480.871 1.366.397
Piauí - - 240.824 - 18.829 18.829 -
Rio Grande do Norte
- - 2.998.495 16.623 121.804 138.427 130.811
Sergipe - - 1.730.831 - 45.737 45.737 116.980
Tocantins - - - - - - -
Subtotal - - 54.702.874 194.516 1.596.082 1.790.598 3.158.382
TOTAL - - 224.497.550 1.982.414 9.475.982 11.458.396 8.185.222

Ministério da Agricultura, Pecuária e Abastecimento144
Tabela 80 – Safra: 88/89
Região Region
Estados States
Cana Moída - t Milled sugarcane - tons
Álcool - m³Ethanol - m3
Açúcar - t Sugar - tons
Própria Own
Fornecedores Supplied
TOTALAnidro
AnhydrousHidratado
HydrousTOTAL TOTAL
Cent
ro-S
ulCe
nter
-Sou
th
Espírito Santo
- - 1.891.605 14.950 92.195 107.145 38.642
Goiás - - 4.467.964 48.718 276.657 325.375 17.475
Mato Grosso - - 2.147.057 10.393 126.566 136.959 25.614
Mato Grosso do Sul
- - 3.877.306 26.838 256.210 283.048 14.801
Minas Gerais - - 9.988.783 26.969 427.941 454.910 448.318
Paraná - - 10.215.462 49.620 599.742 649.362 217.103
Rio de Janeiro
- - 8.901.601 17.812 259.804 277.616 458.050
Rio Grande do Sul
- - 67.642 - 2.684 2.684 1.500
Santa Catarina
- - 373.302 - 2.816 2.816 30.361
São Paulo - - 124.556.258 1.317.626 6.406.549 7.724.175 4.001.349
Subtotal - - 166.486.980 1.512.926 8.451.164 9.964.090 5.253.213
Nor
te/N
orde
ste
Nor
th/N
orth
east
Alagoas - - 21.316.778 85.424 567.486 652.910 1.089.987
Amazonas - - 22.038 - 1.254 1.254 0
Bahia - - 1.223.857 - 21.534 21.534 96.073
Ceará - - 654.757 - 24.190 24.190 40.952
Maranhão - - 623.787 - 24.008 24.008 30.260
Pará - - 249.324 - 11.919 11.919 2788
Paraíba - - 4.677.125 16.115 256.900 273.015 107.838
Pernambuco - - 20.499.498 83.455 414.346 497.801 1.258.725
Piauí - - 286.709 - 21.192 21.192 0
Rio Grande do Norte
- - 2649686 18.570 101.728 120.298 103883
Sergipe - - 1.413.841 - 32.671 32.671 86.338
Tocantins - - - - - 0 -
Subtotal - - 53.617.400 203.564 1.477.228 1.680.792 2.816.844
TOTAL - - 220.104.380 1.716.490 9.928.392 11.644.882 8.070.057

Anuário Estatístico da Agroenergia – 2012 145
Tabela 81 – Safra: 89/90
Região Region
Estados States
Cana Moída - t Milled sugarcane - tons
Álcool - m³Ethanol - m3
Açúcar - t Sugar - tons
Própria Own
Fornecedores Supplied
TOTALAnidro
AnhydrousHidratado
HydrousTOTAL TOTAL
Cent
ro-S
ulCe
nter
-Sou
th
Espírito Santo
- - 1.796.345 11.066 87.305 98.371 31.267
Goiás - - 4.046.581 39.279 240.615 279.894 24.718
Mato Grosso - - 2.543.996 12.201 142.473 154.674 27.681
Mato Grosso do Sul
- - 3.789.328 23.126 229.108 252.234 21.925
Minas Gerais - - 9.370.636 25.710 397.293 423.003 392.345
Paraná - - 10.448.611 43.583 623.679 667.262 178.008
Rio de Janeiro
- - 7.318.089 12.415 228.205 240.620 400.410
Rio Grande do Sul
- - 70.387 - 4.245 4.245 605
Santa Catarina
- - 377.413 - 5.892 5.892 30.905
São Paulo - - 122.674.934 1.135.355 6.639.358 7.774.713 3.031.885
Subtotal - - 162.436.320 1.302.735 8.598.173 9.900.908 4.139.749
Nor
te/N
orde
ste
Nor
th/N
orth
east
Alagoas - - 26.410.502 61.699 820.929 882.628 1.281.447
Amazonas - - 17.214 - 812 812 -
Bahia - - 1.211.661 - 26.964 26.964 87.727
Ceará - - 579.351 - 21.103 21.103 37.522
Maranhão - - 732.838 - 30.445 30.445 26.705
Pará - - 240.687 - 11.819 11.819 4.470
Paraíba - - 4.983.175 6.363 276.947 283.310 111.572
Pernambuco - - 21.886.289 76.670 506.095 582.765 1.316.860
Piauí - - 459.039 - 32.854 32.854 -
Rio Grande do Norte
- - 2.530.074 5.158 111.743 116.901 114.166
Sergipe - - 1.415.193 - 29.826 29.826 93.832
Tocantins - - - - - - -
Subtotal - - 60.466.023 149.890 1.869.537 2.019.427 3.074.300
TOTAL - - 222.902.343 1.452.625 10.467.710 11.920.335 7.214.049

Ministério da Agricultura, Pecuária e Abastecimento146
Tabela 82 – Safra: 90/91
Região Region
Estados States
Cana Moída - t Milled sugarcane - tons
Álcool - m³Ethanol - m3
Açúcar - t Sugar - tons
Própria Own
Fornecedores Supplied
TOTALAnidro
AnhydrousHidratado
HydrousTOTAL TOTAL
Cent
ro-S
ulCe
nter
-Sou
th
Espírito Santo
- - 1.193.648 1.551 60.571 62.122 8.261
Goiás - - 4.257.804 16.540 274.339 290.879 42.095
Mato Grosso - - 3.325.019 10.505 181.002 191.507 23.200
Mato Grosso do Sul
- - 3.977.877 29.611 232.534 262.145 20125
Minas Gerais - - 9.850.491 44.222 383.137 427.359 413.196
Paraná - - 10.751.114 39.844 584.401 624.245 221.113
Rio de Janeiro
- - 4.522.390 4.272 67.172 71.444 280.970
Rio Grande do Sul
- - 38.393 - 2.588 2.588 0
Santa Catarina
- - 463.388 - 8.617 8.617 28.728
São Paulo - - 131.814.535 941.004 6.825.940 7.766.944 3.471.138
Subtotal - - 170.194.659 1.087.549 8.620.301 9.707.850 4.508.826
Nor
te/N
orde
ste
Nor
th/N
orth
east
Alagoas - - 22.617.202 67.011 711.357 778.368 1.234.894
Amazonas - - 0 - - 0 0
Bahia - - 1.052.942 - 18.202 18.202 80.256
Ceará - - 506.233 - 15.949 15.949 35.340
Maranhão - - 594.940 - 31.662 31.662 25.082
Pará - - 184.432 - 10.440 10.440 2500
Paraíba - - 4.570.479 21.117 243.307 264.424 89.935
Pernambuco - - 18.679.258 93.343 424.522 517.865 1.193.512
Piauí - - 464108 - 32.596 32.596 0
Rio Grande do Norte
- - 2169458 17.548 88.666 106.214 92476
Sergipe - - 1.395.449 - 29.735 29.735 102.520
Tocantins - - - - 1.846 1.846 -
Subtotal - - 52.234.501 199.019 1.608.282 1.807.301 2.856.515
TOTAL - - 222.429.160 1.286.568 10.228.583 11.515.151 7.365.341

Anuário Estatístico da Agroenergia – 2012 147
Tabela 83 – Safra: 91/92
Região Region
Estados States
Cana Moída - t Milled sugarcane - tons
Álcool - m³Ethanol - m3
Açúcar - t Sugar - tons
Própria Own
Fornecedores Supplied
TOTALAnidro
AnhydrousHidratado
HydrousTOTAL TOTAL
Cent
ro-S
ulCe
nter
-Sou
th
Espírito Santo
- - 1.750.164 12.255 88.517 100.772 21.083
Goiás - - 4.672.096 39.737 328.464 368.201 53.277
Mato Grosso - - 2.850.880 18.057 205.435 223.492 41.557
Mato Grosso do Sul
- - 3.935.141 29.536 254.154 283.690 28551
Minas Gerais - - 10.434.200 73.464 407.752 481.216 428.528
Paraná - - 11.182.127 98.691 630.922 729.613 235.842
Rio de Janeiro
- - 6.564.082 3.866 149.905 153.771 416.295
Rio Grande do Sul
- - 38.641 - 2.385 2.385 0
Santa Catarina
- - 322.309 - 4.487 4.487 25.962
São Paulo - - 137.281.277 1.526.064 7.052.851 8.578.915 4.509.763
Subtotal - - 179.030.917 1.801.670 9.124.872 10.926.542 5.760.858
Nor
te/N
orde
ste
Nor
th/N
orth
east
Alagoas - - 21.482.547 69.484 665.205 734.689 1.237.085
Amazonas - - 0 - - 0 0
Bahia - - 1.487.154 1.180 34.255 35.435 76.201
Ceará - - 419.862 - 12.772 12.772 31.140
Maranhão - - 539.558 - 26.457 26.457 19.918
Pará - - 168.919 - 7.981 7.981 3285
Paraíba - - 4.415.621 24.517 284.503 309.020 75.719
Pernambuco - - 18.328.157 80.695 437.936 518.631 1.162.024
Piauí - - 383.653 - 30.634 30.634 0
Rio Grande do Norte
- - 1.907.703 9.248 75.426 84.674 103290
Sergipe - - 948.152 - 27.681 27.681 60.942
Tocantins - - 110.000 - 7.717 7.717 -
Subtotal - - 50.191.326 185.124 1.610.567 1.795.691 2.769.604
TOTAL - - 229.222.243 1.986.794 10.735.439 12.722.233 8.530.462

Ministério da Agricultura, Pecuária e Abastecimento148
Tabela 84 – Safra: 92/93
Região Region
Estados States
Cana Moída - t Milled sugarcane - tons
Álcool - m³Ethanol - m3
Açúcar - t Sugar - tons
Própria Own
Fornecedores Supplied
TOTALAnidro
AnhydrousHidratado
HydrousTOTAL TOTAL
Cent
ro-S
ulCe
nter
-Sou
th
Espírito Santo
- - 1.678.052 926 93.998 94.924 29.506
Goiás - - 4.904.219 31.215 279.497 310.712 105.348
Mato Grosso - - 3.152.514 21.600 213.094 234.694 45.600
Mato Grosso do Sul
- - 3.706.409 16.873 227.315 244.188 46.708
Minas Gerais - - 8.707.419 56.000 345.669 401.669 374.227
Paraná - - 11.989.317 97.022 635.342 732.364 232.778
Rio de Janeiro
- - 5.162.845 304 104.734 105.038 316.477
Rio Grande do Sul
- - 52.723 - 2.997 2.997 0
Santa Catarina
- - 350.341 - 5.285 5.285 29.915
São Paulo - - 136.591.597 1.713.774 6.212.089 7.925.863 4.937.618
Subtotal - - 176.295.436 1.937.714 8.120.020 10.057.734 6.118.177
Nor
te/N
orde
ste
Nor
th/N
orth
east
Alagoas - - 21.047.857 143.329 575.307 718.636 1.436.046
Amazonas - - 0 - - 0 0
Bahia - - 1.072.575 - 35.765 35.765 81.426
Ceará - - 286.418 - 5.123 5.123 24.837
Maranhão - - 299.137 - 16.190 16.190 13.485
Pará - - 126.640 - 7.637 7.637 2270
Paraíba - - 3.890.548 24.062 223.852 247.914 85.359
Pernambuco - - 17.278.745 88.477 388.413 476.890 1.322.774
Piauí - - 306.470 - 24.256 24.256 0
Rio Grande do Norte
- - 2.099.847 22.803 74.066 96.869 111792
Sergipe - - 671.003 - 36.357 36.357 67.983
Tocantins - - 85.190 - 6.120 6.120 -
Subtotal - - 47.164.430 278.671 1.393.086 1.671.757 3.145.972
TOTAL - - 223.459.866 2.216.385 9.513.106 11.729.491 9.264.149

Anuário Estatístico da Agroenergia – 2012 149
Tabela 85 – Safra: 93/94
Região Region
Estados States
Cana Moída - t Milled sugarcane - tons
Álcool - m³Ethanol - m3
Açúcar - t Sugar - tons
Própria Own
Fornecedores Supplied
TOTALAnidro
AnhydrousHidratado
HydrousTOTAL TOTAL
Cent
ro-S
ulCe
nter
-Sou
th
Espírito Santo
- - 996.394 968 68.623 69.591 37.780
Goiás - - 4.324.956 31.097 279.267 310.364 152.820
Mato Grosso - - 8.596.855 31.942 211.809 243.751 113.647
Mato Grosso do Sul
- - 4.168.742 35.079 203.810 238.889 73504
Minas Gerais - - 8.103.949 55.670 337.039 392.709 407.330
Paraná - - 10.979.349 67.250 663.447 730.697 304.541
Rio de Janeiro
- - 4.947.386 - 98.089 98.089 351.901
Rio Grande do Sul
- - 50.000 - 3.939 3.939 0
Santa Catarina
- - 346.316 - 3.710 3.710 28.933
São Paulo - - 130.750.491 2.156.803 6.132.892 8.289.695 5.833.316
Subtotal - - 173.264.438 2.378.809 8.002.625 10.381.434 7.303.772
Nor
te/N
orde
ste
Nor
th/N
orth
east
Alagoas - - 15.000.000 76.146 335.928 412.074 736.504
Amazonas - - 0 - - 0 0
Bahia - - 1.018.961 2.319 21.182 23.501 85.350
Ceará - - 131.639 - 1.760 1.760 12.348
Maranhão - - 731.826 - 9.534 9.534 1.216
Pará - - 104.273 - 8.647 8.647 3102
Paraíba - - 1.437.689 9.696 104.161 113.857 15.096
Pernambuco - - 12.554.817 38.672 184.653 223.325 893.760
Piauí - - 250.000 - 18.360 18.360 0
Rio Grande do Norte
- - 1.414.378 16.947 42.103 59.050 75588
Sergipe - - 477.495 - 28.882 28.882 35.399
Tocantins - - 150.000 - 11.761 11.761 -
Subtotal - - 33.271.078 143.780 766.971 910.751 1.858.363
TOTAL - - 206.535.516 2.522.589 8.769.596 11.292.185 9.162.135

Ministério da Agricultura, Pecuária e Abastecimento150
Tabela 86 – Safra: 94/95
Região Region
Estados States
Cana Moída - t Milled sugarcane - tons
Álcool - m³Ethanol - m3
Açúcar - t Sugar - tons
Própria Own
Fornecedores Supplied
TOTALAnidro
AnhydrousHidratado
HydrousTOTAL TOTAL
Cent
ro-S
ulCe
nter
-Sou
th
Espírito Santo
- - 1.912.852 2.310.771 6.395.322 8.706.093 71.568
Goiás - - 5.833.638 77.589 809.178 886.767 205.094
Mato Grosso - - 4.807.252 - - 0 175.755
Mato Grosso do Sul
- - 3.769.729 - 2.738 2.738 66.897
Minas Gerais - - 9.484.614 22.178 213.222 235.400 449.934
Paraná - - 15.530.677 29.270 248.202 277.472 430.985
Rio de Janeiro
- - 5.483.956 36.572 327.620 364.192 389.704
Rio Grande do Sul
- - 46.344 62.778 408.153 470.931 -
Santa Catarina
- - 235.476 10.409 98.868 109.277 19.586
São Paulo - - 148.952.532 25.782 68.207 93.989 6.646.471
Subtotal - - 196.057.070 2.575.349 8.571.510 11.146.859 8.455.994
Nor
te/N
orde
ste
Nor
th/N
orth
east
Alagoas - - 20.067.353 150.528 496.105 646.633 1.586.115
Amazonas - - 0 - 0 -
Bahia - - 1.167.895 - 63.842 63.842 97.753
Ceará - - 160.493 - 2.997 2.997 14.984
Maranhão - - 259.800 215 22.450 22.665 4.302
Pará - - 74.842 - 1.320 1.320 2.210
Paraíba - - 3.316.113 27.328 253.437 280.765 65.885
Pernambuco - - 16.571.282 84.782 323.933 408.715 1.317.483
Piauí - - 328.185 - 27.071 27.071 -
Rio Grande do Norte
- - 2.064.334 29.597 75.007 104.604 110.264
Sergipe - - 620.391 5.671 40.018 45.689 45.946
Tocantins - - 180.033 - 14.750 14.750 -
Subtotal - - 44.810.721 298.121 1.320.930 1.619.051 3.244.942
TOTAL - - 240.867.791 2.873.470 9.892.440 12.765.910 11.700.936

Anuário Estatístico da Agroenergia – 2012 151
Tabela 87 – Safra: 95/96
Região Region
Estados States
Cana Moída - t Milled sugarcane - tons
Álcool - m³Ethanol - m3
Açúcar - t Sugar - tons
Própria Own
Fornecedores Supplied
TOTALAnidro
AnhydrousHidratado
HydrousTOTAL TOTAL
Cent
ro-S
ulCe
nter
-Sou
th
Espírito Santo
- - 154.340.814 2.293.870 5.874.909 8.168.779 49.621
Goiás - - 18.587.422 99.099 979.400 1.078.499 226.021
Mato Grosso - - - - - - 264.538
Mato Grosso do Sul
- - 30.877 - 1.935 1.935 135.190
Minas Gerais - - 3.697.018 21.182 271.001 292.183 441.609
Paraná - - 6.739.557 91.718 285.402 377.120 555.875
Rio de Janeiro
- - 6.474.564 39.861 326.576 366.437 402.065
Rio Grande do Sul
- - 8.472.684 69.073 394.483 463.556 -
Santa Catarina
- - 5.210.882 6.528 101.601 108.129 -
São Paulo - - 1.775.719 15.674 77.839 93.513 7.247.905
Subtotal - - 205.329.537 2.637.005 8.313.146 10.950.151 9.322.824
Nor
te/N
orde
ste
Nor
th/N
orth
east
Alagoas - - 17.771.482 212.650 411.924 624.574 1.479.472
Amazonas - - - - - - -
Bahia - - 2.040.862 - 74.772 74.772 134.876
Ceará - - 466.542 - 25.797 25.797 29.934
Maranhão - - 567.594 3.605 27.976 31.581 63.680
Pará - - 237.779 - 15.226 15.226 2.741
Paraíba - - 2.673.378 19.739 257.944 277.683 45.565
Pernambuco - - 17.122.141 144.900 353.507 498.407 1.412.961
Piauí - - 414.324 - 30.802 30.802 -
Rio Grande do Norte
- - 2.414.482 39.658 79.206 118.864 122.974
Sergipe - - 617.099 - 50.087 50.087 36.057
Tocantins - - 221.355 - 18.815 18.815 -
Subtotal - - 44.547.038 420.552 1.346.056 1.766.608 3.328.260
TOTAL - - 249.876.575 3.057.557 9.659.202 12.716.759 12.651.084

Ministério da Agricultura, Pecuária e Abastecimento152
Tabela 88 – Safra: 96/97
Região Region
Estados States
Cana Moída - t Milled sugarcane - tons
Álcool - m³Ethanol - m3
Açúcar - t Sugar - tons
Própria Own
Fornecedores Supplied
TOTALAnidro
AnhydrousHidratado
HydrousTOTAL TOTAL
Cent
ro-S
ulCe
nter
-Sou
th
Espírito Santo
- - 1.828.660 22.469 86.273 108.742 52.925
Goiás - - 8.238.715 91.463 369.137 460.600 309.107
Mato Grosso - - 8.084.830 159.814 308.400 468.214 301.079
Mato Grosso do Sul
- - 5.404.638 69.912 217.886 287.798 191.674
Minas Gerais - - 9.902.348 117.982 353.994 471.976 464.350
Paraná - - 22.808.959 199.998 1.033.819 1.233.817 783.531
Rio de Janeiro
- - 5.371.642 1.734 103.296 105.030 421.363
Rio Grande do Sul
- - 44.178 - 2.588 2.588 -
Santa Catarina
- - - - - - -
São Paulo - - 170.600.103 3.171.427 5.803.290 8.974.717 7.897.312
Subtotal - - 232.284.073 3.834.799 8.278.683 12.113.482 10.421.341
Nor
te/N
orde
ste
Nor
th/N
orth
east
Alagoas 23.922.887 398.816 474.749 873.565 1.524.832
Amazonas - - - - - - -
Bahia - - 2.378.187 5.861 91.067 96.928 138.010
Ceará - - 404.580 - 17.047 17.047 23.080
Maranhão - - 725.190 3.030 36.959 39.989 25.337
Pará - - 243.255 - 16.534 16.534 3.625
Paraíba - - 4.742.596 35.254 299.740 334.994 79.341
Pernambuco - - 20.771.333 274.118 432.638 706.756 1.227.409
Piauí - - 319.365 - 21.795 21.795 -
Rio Grande do Norte
- - 2.558.041 60.627 66.945 127.572 128.420
Sergipe - - 1.043.931 16.835 54.279 71.114 60.493
Tocantins - - 127.084 - 10.673 10.673 -
Subtotal - - 57.236.449 794.541 1.522.426 2.316.967 3.210.547
TOTAL - - 289.520.522 4.629.340 9.801.109 14.430.449 13.631.888

Anuário Estatístico da Agroenergia – 2012 153
Tabela 89 – Safra: 97/98
Região Region
Estados States
Cana Moída - t Milled sugarcane - tons
Álcool - m³Ethanol - m3
Açúcar - t Sugar - tons
Própria Own
Fornecedores Supplied
TOTALAnidro
AnhydrousHidratado
HydrousTOTAL TOTAL
Cent
ro-S
ulCe
nter
-Sou
th
Espírito Santo
- 2.465.728 107.967 63.121 171.088 50.380
Goiás - - 8.208.018 208.719 298.047 506.766 285.146
Mato Grosso - - 9.788.427 200.680 395.282 595.962 366.705
Mato Grosso do Sul
- - 5.952.034 58.819 334.747 393.566 165.505
Minas Gerais - - 11.928.900 157.605 484.554 642.159 493.695
Paraná - - 24.588.147 416.294 899.645 1.315.939 936.852
Rio de Janeiro
- - 4.926.063 49.189 85.688 134.877 351.420
Rio Grande do Sul
- - 45.459 - 2.986 2.986 -
Santa Catarina
- - - - - - -
São Paulo - - 180.412.538 3.579.877 5.915.383 9.495.260 8.664.587
Subtotal - - 248.315.314 4.779.150 8.479.453 13.258.603 11.314.290
Nor
te/N
orde
ste
Nor
th/N
orth
east
Alagoas - - 23.698.079 383.238 457.838 841.076 1.779.166
Amazonas - - - - - - -
Bahia - - 2.581.225 15.963 85.746 101.709 151.322
Ceará - - 325.613 - 12.554 12.554 21.801
Maranhão - - 898.988 38.178 26.224 64.402 8.599
Pará - - 247.045 - 16.238 16.238 4.735
Paraíba - - 4.873.221 123.852 186.439 310.291 105.395
Pernambuco - - 16.970.757 277.392 277.100 554.492 1.233.317
Piauí - - 337.032 307 24.833 25.140 -
Rio Grande do Norte
- - 2.645.204 44.302 92.666 136.968 155.035
Sergipe - - 1.121.277 37.337 46.768 84.105 73.384
Tocantins - - 184.761 - 16.675 16.675 -
Subtotal - - 53.883.202 920.569 1.243.081 2.163.650 3.532.754
TOTAL - - 302.198.516 5.699.719 9.722.534 15.422.253 14.847.044

Ministério da Agricultura, Pecuária e Abastecimento154
Tabela 90 – Safra: 98/99
Região Region
Estados States
Cana Moída - t Milled sugarcane - tons
Álcool - m³Ethanol - m3
Açúcar - t Sugar - tons
Própria Own
Fornecedores Supplied
TOTALAnidro
AnhydrousHidratado
HydrousTOTAL TOTAL
Cent
ro-S
ulCe
nter
-Sou
th
Espírito Santo
- - 1.941.970 60.988 58.325 119.313 54.235
Goiás - - 8.529.500 215.088 232.441 447.529 341.365
Mato Grosso - - 10.306.270 299.679 227.565 527.244 482.847
Mato Grosso do Sul
- - 6.590.160 139.158 208.054 347.212 250.829
Minas Gerais - - 13.139.661 325.299 314.942 640.241 599.875
Paraná - - 24.286.598 351.933 675.259 1.027.192 1.245.458
Rio de Janeiro
- - 5.199.583 46.358 58.393 104.751 373.959
Rio Grande do Sul
- - 32.493 - 2.022 2.022 -
Santa Catarina
- - - - - - -
São Paulo - - 198.884.741 3.378.527 5.673.137 9.051.664 11.748.707
Subtotal - - 268.910.976 4.817.030 7.450.138 12.267.168 15.097.275
Nor
te/N
orde
ste
Nor
th/N
orth
east
Alagoas - - 18.561.119 385.714 198.409 584.123 1.384.844
Amazonas - - - - - - -
Bahia - - 2.347.225 22.062 54.432 76.494 144.596
Ceará - - 367.684 - 17.122 17.122 12.801
Maranhão - - 1.118.330 37.132 34.784 71.916 14.041
Pará - - 307.650 7.415 8.136 15.551 8.367
Paraíba - - 3.888.104 115.206 144.908 260.114 66.484
Pernambuco - - 15.960.857 213.968 222.293 436.261 1.058.233
Piauí - - 312.580 8.761 14.020 22.781 -
Rio Grande do Norte
- - 2.807.772 43.352 66.496 109.848 127.945
Sergipe - - 1.037.538 29.358 34.828 64.186 46.001
Tocantins - - 20.962 - 1.257 1.257 -
Subtotal - - 46.729.821 862.968 796.685 1.659.653 2.863.312
TOTAL - - 315.640.797 5.679.998 8.246.823 13.926.821 17.960.587

Anuário Estatístico da Agroenergia – 2012 155
Tabela 91 – Safra: 99/00
Região Region
Estados States
Cana Moída - t Milled sugarcane - tons
Álcool - m³Ethanol - m3
Açúcar - t Sugar - tons
Própria Own
Fornecedores Supplied
TOTALAnidro
AnhydrousHidratado
HydrousTOTAL TOTAL
Cent
ro-S
ulCe
nter
-Sou
th
Espírito Santo
1.319.628 807.273 2.126.901 88.697 37.522 126.219 45.341
Goiás 6.760.630 391.466 7.152.096 127.490 187.391 314.881 368.528
Mato Grosso 7.546.401 2.584.491 10.130.892 319.833 224.366 544.199 485.107
Mato Grosso do Sul
6.361.327 1.425.220 7.786.547 180.704 190.274 370.978 319.706
Minas Gerais 9.242.059 4.296.860 13.538.919 373.822 269.989 643.811 802.058
Paraná 21.529.302 2.781.879 24.311.181 411.618 638.712 1.050.330 1.430.250
Rio de Janeiro
2.491.082 2.396.302 4.887.384 70.291 46.424 116.715 353.557
Rio Grande do Sul
- 64.011 64.011 - 4.032 4.032 -
Santa Catarina
- - - - - - -
São Paulo 127.689.253 69.316.781 197.006.034 3.826.559 4.700.732 8.527.291 13.088.229
Subtotal 182.939.682 84.064.283 267.003.965 5.399.014 6.299.442 11.698.456 16.892.776
Nor
te/N
orde
ste
Nor
th/N
orth
east
Alagoas - - 19.315.230 332.436 218.078 550.514 1.215.469
Amazonas - - - - - - -
Bahia - - 2.281.776 38.392 32.256 70.648 144.905
Ceará - - 131.166 - 2.435 2.435 8.180
Maranhão - - 938.174 43.440 13.734 57.174 23.451
Pará - - 521.339 14.160 11.344 25.504 15.960
Paraíba - - 3.418.496 100.953 100.680 201.633 78.030
Pernambuco - - 13.238.714 153.366 186.860 340.226 856.109
Piauí - - 218.022 6.482 8.958 15.440 -
Rio Grande do Norte
- - 1.892.617 33.437 35.459 68.896 96.813
Sergipe - - 1.163.285 19.089 27.750 46.839 48.504
Tocantins - - - - - - -
Subtotal - - 43.118.819 741.755 637.554 1.379.309 2.487.421
TOTAL 182.939.682 84.064.283 310.122.784 6.140.769 6.936.996 13.077.765 19.380.197

Ministério da Agricultura, Pecuária e Abastecimento156
Tabela 92 – Safra: 00/01
Região Region
Estados States
Cana Moída - t Milled sugarcane - tons
Álcool - m³Ethanol - m3
Açúcar - t Sugar - tons
Própria Own
Fornecedores Supplied
TOTALAnidro
AnhydrousHidratado
HydrousTOTAL TOTAL
Cent
ro-S
ulCe
nter
-Sou
th
Espírito Santo
1.671.983 895.016 2.566.999 99.471 51.431 150.902 45.474
Goiás 6.538.447 625.404 7.163.851 140.561 175.867 316.428 397.441
Mato Grosso 6.874.947 1.794.586 8.669.533 268.614 195.693 464.307 369.530
Mato Grosso do Sul
4.554.189 1.966.734 6.520.923 139.172 175.608 314.780 231.674
Minas Gerais 7.508.471 3.202.985 10.711.456 280.392 208.804 489.196 619.704
Paraná 16.606.080 2.331.373 18.937.453 256.628 525.485 782.113 979.943
Rio de Janeiro
1.506.805 2.104.595 3.611.400 53.049 37.918 90.967 279.825
Rio Grande do Sul
- 51.872 51.872 - 3.003 3.003 -
Santa Catarina
- - - - - - -
São Paulo 96.590.528 50.379.238 146.969.766 3.528.710 2.849.911 6.378.621 9.542.382
Subtotal 141.851.450 63.351.803 205.203.253 4.766.597 4.223.720 8.990.317 12.465.973
Nor
te/N
orde
ste
Nor
th/N
orth
east
Alagoas - - 24.393.790 396.835 315.884 712.719 1.989.735
Amazonas - - 186.980 - 3.854 3.854 11.905
Bahia - - 1.920.653 28.920 19.564 48.484 145.670
Ceará - - 65.671 - 783 783 5.350
Maranhão - - 799.490 38.918 8.026 46.944 10.238
Pará - - 340.403 12.192 15.227 27.419 -
Paraíba - - 3.594.320 114.602 103.619 218.221 74.239
Pernambuco - - 14.366.963 163.601 136.163 299.764 1.110.622
Piauí - - 248.289 8.426 8.198 16.624 -
Rio Grande do Norte
- - 2.388.270 33.171 60.615 93.786 134.790
Sergipe - - 1.413.639 21.468 37.152 58.620 71.818
Tocantins - - - - - - -
Subtotal - - 49.718.468 818.133 709.085 1.527.218 3.554.367
TOTAL 141.851.450 63.351.803 254.921.721 5.584.730 4.932.805 10.517.535 16.020.340

Anuário Estatístico da Agroenergia – 2012 157
Tabela 93 – Safra: 01/02
Região Region
Estados States
Cana Moída - t Milled sugarcane - tons
Álcool - m³Ethanol - m3
Açúcar - t Sugar - tons
Própria Own
Fornecedores Supplied
TOTALAnidro
AnhydrousHidratado
HydrousTOTAL TOTAL
Cent
ro-S
ulCe
nter
-Sou
th
Espírito Santo
1.364.929 645.974 2.010.903 76.299 54.721 131.020 22.953
Goiás 8.193.401 688.874 8.882.275 190.143 190.012 380.155 505.843
Mato Grosso 8.345.584 2.327.849 10.673.433 276.007 304.180 580.187 448.750
Mato Grosso do Sul
4.974.789 2.824.124 7.798.913 225.201 171.320 396.521 327.854
Minas Gerais 8.600.694 3.630.126 12.230.820 331.438 193.003 524.441 747.053
Paraná 19.337.840 3.530.927 22.868.767 358.517 590.081 948.598 1.338.013
Rio de Janeiro
1.741.765 1.205.658 2.947.423 23.898 39.957 63.855 212.669
Rio Grande do Sul
- 80.262 80.262 - 5.306 5.306 -
Santa Catarina
- - - - - - -
São Paulo 108.210.903 67.801.529 176.012.432 4.278.472 2.799.276 7.077.748 12.145.392
Subtotal 160.769.905 82.735.323 243.505.228 5.759.975 4.347.856 10.107.831 15.748.527
Nor
te/N
orde
ste
Nor
th/N
orth
east
Alagoas - - 23.124.558 317.513 244.773 562.286 1.678.222
Amazonas - - 201.036 963 1.703 2.666 14.188
Bahia - - 2.048.475 32.898 21.734 54.632 143.448
Ceará - - 73.637 - 1.186 1.186 6.220
Maranhão - - 1.094.115 65.714 9.383 75.097 12.406
Pará - - 283.406 14.048 10.945 24.993 -
Paraíba - - 4.001.051 87.832 138.774 226.606 114.539
Pernambuco - - 14.342.504 120.417 141.516 261.933 1.104.199
Piauí - - 273.691 5.507 13.169 18.676 -
Rio Grande do Norte
- - 2.064.515 46.592 33.273 79.865 116.952
Sergipe - - 1.316.925 27.728 24.296 52.024 55.662
Tocantins - - - - - - -
Subtotal - - 48.823.913 719.212 640.752 1.359.964 3.245.836
TOTAL 160.769.905 82.735.323 292.329.141 6.479.187 4.988.608 11.467.795 18.994.363

Ministério da Agricultura, Pecuária e Abastecimento158
Tabela 94 – Safra: 02/03
Região Region
Estados States
Cana Moída - t Milled sugarcane - tons
Álcool - m³Ethanol - m3
Açúcar - t Sugar - tons
Própria Own
Fornecedores Supplied
TOTALAnidro
AnhydrousHidratado
HydrousTOTAL TOTAL
Cent
ro-S
ulCe
nter
-Sou
th
Espírito Santo
907.411 1.698.154 2.605.565 94.065 59.261 153.326 58.635
Goiás 9.293.459 539.098 9.832.557 253.998 194.520 448.518 577.067
Mato Grosso 9.590.960 2.793.520 12.384.480 326.735 334.237 660.972 546.153
Mato Grosso do Sul
4.470.858 3.804.643 8.275.501 203.411 214.746 418.157 373.715
Minas Gerais 9.057.688 5.239.915 14.297.603 292.073 258.975 551.048 1.033.403
Paraná 20.427.798 3.109.672 23.537.470 397.341 566.118 963.459 1.452.501
Rio de Janeiro
1.554.755 2.782.519 4.337.274 44.499 61.614 106.113 304.420
Rio Grande do Sul
- - - - 6.411 6.411 -
Santa Catarina
- - - - - - -
São Paulo 113.416.245 77.088.673 190.504.918 4.651.283 3.054.998 7.706.281 14.246.237
Subtotal 168.719.174 97.056.194 265.775.368 6.263.405 4.750.880 11.014.285 18.592.131
Nor
te/N
orde
ste
Nor
th/N
orth
east
Alagoas - - 22.645.220 255.820 312.048 567.868 1.994.142
Amazonas - - 255.852 - 3.889 3.889 16.214
Bahia - - 2.213.955 41.577 16.314 57.891 161.111
Ceará - - 88.954 - 976 976 6.260
Maranhão - - 1.105.114 77.355 6.224 83.579 3.149
Pará - - 311.492 16.677 9.749 26.426 -
Paraíba - - 4.335.516 106.613 133.754 240.367 142.865
Pernambuco - - 14.891.497 154.677 152.297 306.974 1.230.998
Piauí - - 284.180 11.229 11.602 22.831 -
Rio Grande do Norte
- - 2.681.857 48.679 50.336 99.015 165.815
Sergipe - - 1.429.746 33.031 28.294 61.325 68.651
Tocantins - - - - - - -
Subtotal - - 50.243.383 745.658 725.483 1.471.141 3.789.205
TOTAL 168.719.174 97.056.194 316.018.751 7.009.063 5.476.363 12.485.426 22.381.336

Anuário Estatístico da Agroenergia – 2012 159
Tabela 95 – Safra: 03/04
Região Region
Estados States
Cana Moída - t Milled sugarcane - tons
Álcool - m³Ethanol - m3
Açúcar - t Sugar - tons
Própria Own
Fornecedores Supplied
TOTALAnidro
AnhydrousHidratado
HydrousTOTAL TOTAL
Cent
ro-S
ulCe
nter
-Sou
th
Espírito Santo
812.418 1.701.020 2.513.438 101.593 49.151 150.744 54.405
Goiás 11.912.472 1.128.581 13.041.053 372.658 273.702 646.360 668.185
Mato Grosso 10.973.970 3.378.194 14.352.164 479.088 313.081 792.169 580.328
Mato Grosso do Sul
5.066.063 3.739.647 8.805.710 218.297 254.496 472.793 402.878
Minas Gerais 8.539.489 10.247.035 18.786.524 387.378 399.898 787.276 1.346.847
Paraná 24.857.886 3.736.509 28.594.395 492.490 712.721 1.205.211 1.858.056
Rio de Janeiro
1.953.022 2.467.060 4.420.082 38.273 66.713 104.986 325.572
Rio Grande do Sul
- 93.836 93.836 - 6.045 6.045 -
Santa Catarina
- - - - - - -
São Paulo 129.255.256 77.258.400 206.513.656 5.831.535 2.919.388 8.750.923 15.215.525
Subtotal 193.370.576 103.750.282 297.120.858 7.921.312 4.995.195 12.916.507 20.451.796
Nor
te/N
orde
ste
Nor
th/N
orth
east
Alagoas 18.987.049 9.770.717 28.757.766 265.579 437.385 702.964 2.441.268
Amazonas 250.881 - 250.881 - 4.375 4.375 17.455
Bahia 2.014.885 121.862 2.136.747 30.665 18.985 49.650 172.105
Ceará 14.686 49.221 63.907 - 317 317 63.907
Maranhão 765.281 538.228 1.303.509 84.256 5.609 89.865 11.118
Pará 419.514 - 419.514 30.696 4.316 35.012 -
Paraíba 1.547.513 3.469.750 5.017.263 126.448 151.315 277.763 168.151
Pernambuco 8.565.263 8.973.129 17.538.392 213.425 168.235 381.660 1.434.156
Piauí 316.252 6.550 322.802 18.026 4.347 22.373 -
Rio Grande do Norte
944.032 1.670.036 2.614.068 45.880 48.990 94.870 173.616
Sergipe 1.232.714 332.462 1.565.176 31.611 32.956 64.567 68.882
Tocantins - - - - - - -
Subtotal 35.058.070 24.931.955 59.990.025 846.586 876.830 1.723.416 4.550.658
TOTAL 228.428.646 128.682.237 357.110.883 8.767.898 5.872.025 14.639.923 25.002.454

Ministério da Agricultura, Pecuária e Abastecimento160
Tabela 96 – Safra: 04/05
Região Region
Estados States
Cana Moída - t Milled sugarcane - tons
Álcool - m³Ethanol - m3
Açúcar - t Sugar - tons
Própria Own
Fornecedores Supplied
TOTALAnidro
AnhydrousHidratado
HydrousTOTAL TOTAL
Cent
ro-S
ulCe
nter
-Sou
th
Espírito Santo
845.181 2.699.910 3.545.091 145.809 63.335 209.144 56.006
Goiás 12.046.568 1.959.288 14.005.856 354.539 362.757 717.296 729.760
Mato Grosso 13.040.722 2.037.531 15.078.253 443.120 371.124 814.244 567.253
Mato Grosso do Sul
4.501.701 5.198.347 9.700.048 207.177 326.403 533.580 508.783
Minas Gerais 12.855.370 8.090.435 20.945.805 327.540 434.102 761.642 1.633.693
Paraná 24.943.595 3.792.742 28.736.337 420.293 764.103 1.184.396 1.779.588
Rio de Janeiro
2.692.250 4.084.608 6.776.858 97.451 101.982 199.433 439.163
Rio Grande do Sul
- 77.997 77.997 - 4.823 4.823 -
Santa Catarina
- - - - - - -
São Paulo 127.273.006 97.915.096 225.188.102 5.198.584 3.758.981 8.957.565 16.381.739
Subtotal 198.198.393 125.855.954 324.054.347 7.194.513 6.187.610 13.382.123 22.095.985
Nor
te/N
orde
ste
Nor
th/N
orth
east
Alagoas 16.392.610 9.637.160 26.029.770 276.449 410.716 687.165 2.388.716
Amazonas 267.767 - 267.767 - 4.671 4.671 17.170
Bahia 1.957.925 310.444 2.268.369 45.103 17.920 63.023 170.048
Ceará 26.329 53.115 79.444 - 153 153 6.225
Maranhão 834.477 440.642 1.275.119 87.190 8.715 95.905 11.881
Pará 580.999 - 580.999 42.230 6.175 48.405 -
Paraíba 1.477.901 3.996.328 5.474.229 156.672 181.275 337.947 165.945
Pernambuco 8.524.230 8.160.637 16.684.867 278.924 136.392 415.316 1.464.335
Piauí 326.115 23.214 349.329 15.126 4.327 19.453 3.431
Rio Grande do Norte
1.025.828 1.891.849 2.917.677 48.109 41.354 89.463 233.847
Sergipe - - 1.465.185 28.172 36.113 64.285 74.491
Tocantins - - - - - - -
Subtotal 31.414.181 24.513.389 57.392.755 977.975 847.811 1.825.786 4.536.089
TOTAL 229.612.574 150.369.343 381.447.102 8.172.488 7.035.421 15.207.909 26.632.074

Anuário Estatístico da Agroenergia – 2012 161
Tabela 97 – Safra: 05/06
Região Region
Estados States
Cana Moída - t Milled sugarcane - tons
Álcool - m³Ethanol - m3
Açúcar - t Sugar - tons
Própria Own
Fornecedores Supplied
TOTALAnidro
AnhydrousHidratado
HydrousTOTAL TOTAL
Cent
ro-S
ulCe
nter
-Sou
th
Espírito Santo
961.082 2.375.464 3.336.546 159.962 41.071 201.033 48.260
Goiás 12.706.198 1.861.809 14.568.007 369.279 360.779 730.058 749.839
Mato Grosso 8.916.753 3.426.176 12.342.929 295.718 475.321 771.039 515.087
Mato Grosso do Sul
4.052.169 4.985.747 9.037.916 184.340 311.251 495.591 400.857
Minas Gerais 14.881.151 9.443.387 24.324.538 397.135 549.707 946.842 1.732.946
Paraná 20.989.876 3.532.897 24.522.773 346.610 674.169 1.020.779 1.483.136
Rio de Janeiro
1.563.128 3.160.256 4.723.384 44.948 83.276 128.224 287.733
Rio Grande do Sul
- 57.976 57.976 - 3.338 3.338 -
Santa Catarina
- - - - - - -
São Paulo 138.548.437 102.674.137 241.222.574 5.073.929 4.928.012 10.001.941 17.188.644
Subtotal 202.618.794 131.517.849 334.136.643 6.871.921 7.426.924 14.298.845 22.406.502
Nor
te/N
orde
ste
Nor
th/N
orth
east
Alagoas 15.166.742 7.087.453 22.254.195 212.334 334.112 546.446 2.079.812
Amazonas 252.672 - 252.672 - 6.009 6.009 14.151
Bahia 2.120.399 271.016 2.391.415 84.147 19.128 103.275 117.485
Ceará 12.906 27.803 40.709 - 1.022 1.022 2.076
Maranhão 310.568 533.888 844.456 42.335 13.808 56.143 11.618
Pará 502.316 - 502.316 33.982 8.193 42.175 -
Paraíba 1.229.579 2.979.164 4.208.743 111.571 156.077 267.648 115.573
Pernambuco 8.019.759 5.778.091 13.797.850 206.110 119.469 325.579 1.226.763
Piauí 437.962 54.407 492.369 26.597 8.486 35.083 7
Rio Grande do Norte
853.506 1.502.762 2.356.268 50.811 22.959 73.770 175.340
Sergipe 845.207 263.845 1.109.052 19.329 28.642 47.971 65.064
Tocantins 95.314 - 95.314 4.108 110 4.218 -
Subtotal 29.846.930 18.498.429 48.345.359 791.324 718.015 1.509.339 3.807.889
TOTAL 232.465.724 150.016.278 382.482.002 7.663.245 8.144.939 15.808.184 26.214.391

Ministério da Agricultura, Pecuária e Abastecimento162
Tabela 98 – Safra: 06/07
Região Region
Estados States
Cana Moída - t Milled sugarcane - tons
Álcool - m³Ethanol - m3
Açúcar - t Sugar - tons
Própria Own
Fornecedores Supplied
TOTALAnidro
AnhydrousHidratado
HydrousTOTAL TOTAL
Cent
ro-S
ulCe
nter
-Sou
th
Espírito Santo
- - 2.890.166 116.468 47.548 164.016 48.949
Goiás - - 16.140.042 382.644 439.327 821.971 768.168
Mato Grosso - - 13.059.354 305.094 442.387 747.481 540.198
Mato Grosso do Sul
- - 11.635.093 207.153 433.690 640.843 574.009
Minas Gerais - - 29.153.432 600.743 699.162 1.299.905 1.915.685
Paraná - - 32.118.523 411.981 921.474 1.333.455 2.168.637
Rio de Janeiro
- - 3.445.153 29.429 58.026 87.455 262.093
Rio Grande do Sul
- - 91.919 - 5.686 5.686 -
Santa Catarina
- - - - - - -
São Paulo - - 265.379.217 5.060.237 5.999.876 11.060.113 20.265.290
Subtotal - - 373.912.899 7.113.749 9.047.176 16.160.925 26.543.029
Nor
te/N
orde
ste
Nor
th/N
orth
east
Alagoas - - 24.642.547 280.036 357.254 637.290 2.217.121
Amazonas - - 224.701 - 5.650 5.650 15.712
Bahia - - 2.278.680 65.324 29.699 95.023 122.571
Ceará - - 27.372 - 1.002 1.002 1.471
Maranhão - - 1.660.264 107.899 20.570 128.469 2.718
Pará - - 697.420 42.698 9.120 51.818 5.210
Paraíba - - 4.909.050 131.433 181.929 313.362 135.878
Pernambuco - - 15.831.843 198.950 143.962 342.912 1.370.149
Piauí - - 706.059 39.202 11.299 50.501 3
Rio Grande do Norte
- - 2.397.446 53.383 24.713 78.096 259.053
Sergipe - - 1.349.324 36.190 26.623 62.813 62.162
Tocantins - - 179.316 9.442 2.125 11.567 -
Subtotal - - 54.904.022 964.557 813.946 1.778.503 4.192.048
TOTAL - - 428.816.921 8.078.306 9.861.122 17.939.428 30.735.077

Anuário Estatístico da Agroenergia – 2012 163
Tabela 99 – Safra: 07/08
Região Region
Estados States
Cana Moída - t Milled sugarcane - tons
Álcool - m³Ethanol - m3
Açúcar - t Sugar - tons
Própria Own
Fornecedores Supplied
TOTALAnidro
AnhydrousHidratado
HydrousTOTAL TOTAL
Cent
ro-S
ulCe
nter
-Sou
th
Espírito Santo
961.177 2.977.567 3.938.744 174.566 77.725 252.291 86.823
Goiás 17.192.895 3.630.675 20.823.570 461.699 728.453 1.190.152 950.602
Mato Grosso 10.046.673 4.516.359 14.563.032 375.561 483.476 859.037 536.233
Mato Grosso do Sul
5.304.443 9.564.620 14.869.063 214.210 662.562 876.772 616.196
Minas Gerais 17.713.186 18.370.541 36.083.727 594.526 1.165.199 1.759.725 2.111.228
Paraná 34.299.298 5.559.746 39.859.044 385.102 1.451.147 1.836.249 2.498.885
Rio de Janeiro
1.442.894 2.388.755 3.831.649 26.954 93.318 120.272 243.471
Rio Grande do Sul
- 128.980 128.980 - 6.818 6.818 -
Santa Catarina
- - - - - - -
São Paulo 157.273.031 139.862.676 297.135.707 5.181.151 8.170.154 13.351.305 19.428.617
Subtotal 244.233.597 186.999.919 431.233.516 7.413.769 12.838.852 20.252.621 26.472.055
Nor
te/N
orde
ste
Nor
th/N
orth
east
Alagoas 19.116.186 10.328.022 29.444.208 383.233 469.674 852.907 2.523.340
Amazonas 318.141 - 318.141 - 8.264 8.264 16.185
Bahia 1.981.325 541.598 2.522.923 85.991 54.544 140.535 102.524
Ceará - 8.250 8.250 - 571 571 -
Maranhão 1.657.868 476.736 2.134.604 123.045 47.119 170.164 13.075
Pará 537.749 37.776 575.525 26.276 9.528 35.804 22.805
Paraíba 1.997.604 3.655.443 5.653.047 149.434 192.832 342.266 173.157
Pernambuco 11.475.341 8.369.074 19.844.415 216.565 291.912 508.477 1.684.094
Piauí 567.406 121.724 689.130 26.644 9.525 36.169 22.255
Rio Grande do Norte
1.755.491 292.259 2.047.750 9.612 39.632 49.244 174.068
Sergipe 927.004 444.679 1.371.683 29.951 19.006 48.957 94.061
Tocantins - - - - - - -
Subtotal 40.334.115 24.275.561 64.609.676 1.050.751 1.142.607 2.193.358 4.825.564
TOTAL 284.567.712 211.275.480 495.843.192 8.464.520 13.981.459 22.445.979 31.297.619

Ministério da Agricultura, Pecuária e Abastecimento164
Tabela 100 – Safra: 08/09
Região Region
Estados States
Cana Moída - t Milled sugarcane - tons
Álcool - m³Ethanol - m3
Açúcar - t Sugar - tons
Própria Own
Fornecedores Supplied
TOTALAnidro
AnhydrousHidratado
HydrousTOTAL TOTAL
Cent
ro-S
ulCe
nter
-Sou
th
Espírito Santo
1.362.906 3.010.342 4.373.248 131.194 143.483 274.677 85.272
Goiás 23.401.582 6.404.464 29.806.046 498.465 1.224.090 1.722.555 957.561
Mato Grosso 11.352.737 2.801.025 14.153.762 352.362 546.159 898.521 389.496
Mato Grosso do Sul
7.183.673 11.017.244 18.200.917 252.528 830.354 1.082.882 657.078
Minas Gerais 18.750.880 23.067.985 41.818.865 581.511 1.634.886 2.216.397 2.238.627
Paraná 35.128.326 9.369.256 44.497.582 432.749 1.605.650 2.038.399 2.444.876
Rio de Janeiro
1.289.923 2.113.489 3.403.412 36.786 89.666 126.452 239.196
Rio Grande do Sul
- 107.184 107.184 - 6.318 6.318 -
Santa Catarina
- - - - - - -
São Paulo 179.386.359 172.891.376 352.277.735 6.255.962 10.648.077 16.904.039 20.195.366
Subtotal 277.856.386 230.782.365 508.638.751 8.541.557 16.728.683 25.270.240 27.207.472
Nor
te/N
orde
ste
Nor
th/N
orth
east
Alagoas 17.482.625 9.826.660 27.309.285 353.360 492.003 845.363 2.200.862
Amazonas 303.350 - 303.350 - 7.963 7.963 14.320
Bahia 1.853.153 688.663 2.541.816 88.457 53.027 141.484 81.177
Ceará 42.863 79.492 122.355 616 8.625 9.241 -
Maranhão 1.446.661 833.499 2.280.160 121.118 60.441 181.559 15.335
Pará 254.125 372.740 626.865 19.651 25.257 44.908 13.726
Paraíba 2.031.577 3.854.401 5.885.978 173.924 216.771 390.695 133.883
Pernambuco 11.012.592 7.936.926 18.949.518 229.974 300.493 530.467 1.521.275
Piauí 743.501 156.680 900.181 33.136 11.417 44.553 38.796
Rio Grande do Norte
2.631.313 555.455 3.186.768 46.284 68.625 114.909 197.914
Rondônia 106.292 106.292 - 7.224 7.224 -
Sergipe 1.360.340 471.374 1.831.714 21.279 68.553 89.832 82.099
Tocantins 55.456 - 55.456 1.125 1.676 2.801 -
Subtotal 39.323.848 24.775.890 64.099.738 1.088.924 1.322.075 2.410.999 4.299.387
TOTAL 317.180.234 255.558.255 572.738.489 9.630.481 18.050.758 27.681.239 31.506.859

Anuário Estatístico da Agroenergia – 2012 165
Tabela 101 – Safra: 09/10
Região Region
Estados States
Cana Moída - t Milled sugarcane - tons
Álcool - m³Ethanol - m3
Açúcar - t Sugar - tons
Própria Own
Fornecedores Supplied
TOTALAnidro
AnhydrousHidratado
HydrousTOTAL TOTAL
Cent
ro-S
ulCe
nter
-Sou
th
Espírito Santo
1.293.756 2.715.870 4.009.626 111.963 124.924 236.887 77.685
Goiás 27.129.534 12.962.895 40.092.429 484.995 1.709.245 2.194.240 1.392.136
Mato Grosso 11.575.615 2.470.017 14.045.632 271.565 553.789 825.354 414.222
Mato Grosso do Sul
11.246.934 12.050.884 23.297.818 236.798 1.030.834 1.267.632 746.761
Minas Gerais 23.086.594 25.211.507 48.298.101 460.941 1.773.530 2.234.471 2.588.671
Paraná 37.595.589 7.907.292 45.502.881 367.385 1.514.002 1.881.387 2.427.177
Rio de Janeiro
1.099.287 2.160.700 3.259.987 9.962 103.297 113.259 176.638
Rio Grande do Sul
- 48.454 48.454 - 2.460 2.460 -
Santa Catarina
- - - - - - -
São Paulo 191.654.761 170.989.994 362.644.755 4.113.387 10.805.244 14.918.631 20.815.404
Subtotal 304.682.070 236.517.613 541.199.683 6.056.996 17.617.325 23.674.321 28.638.694
Nor
te/N
orde
ste
Nor
th/N
orth
east
Alagoas 15.477.992 8.791.767 24.269.759 305.623 320.162 625.785 2.101.248
Amazonas 211.750 - 211.750 - 4.739 4.739 8.679
Bahia 2.047.297 47.250 2.094.547 43.828 74.247 118.075 129.897
Ceará 154.471 - 154.471 - 10.924 10.924 -
Maranhão 1.912.659 296.726 2.209.385 109.746 58.751 168.497 15.868
Pará 460.707 162.702 623.409 4.113 33.521 37.634 24.458
Paraíba 2.532.746 3.709.010 6.241.756 154.398 234.829 389.227 183.818
Pernambuco 10.453.300 7.806.033 18.259.333 140.974 259.045 400.019 1.515.697
Piauí 819.039 195.037 1.014.076 35.807 5.146 40.953 53.884
Rio Grande do Norte
2.689.629 826.049 3.515.678 51.720 69.787 121.507 220.849
Rondônia 111.252 - 111.252 - 8.550 8.550 -
Sergipe 979.061 501.770 1.480.831 12.723 64.098 76.821 57.127
Tocantins 45.160 - 45.160 - 2.433 2.433 -
Subtotal 37.895.063 22.336.344 60.231.407 858.932 1.146.232 2.005.164 4.311.525
TOTAL 342.577.133 258.853.957 601.431.090 6.915.928 18.763.557 25.679.485 32.950.219

Ministério da Agricultura, Pecuária e Abastecimento166
Tabela 102 – Safra: 10/11
Região Region
Estados States
Cana Moída - t Milled sugarcane - tons
Álcool - m³Ethanol - m3
Açúcar - t Sugar - tons
Própria Own
Fornecedores Supplied
TOTALAnidro
AnhydrousHidratado
HydrousTOTAL TOTAL
Cent
ro-S
ulCe
nter
-Sou
th
Espírito Santo
1.213.715 2.311.102 3.524.817 95.117 92.079 187.196 90.083
Goiás 34.773.045 11.924.811 46.697.856 659.432 2.242.242 2.901.674 1.798.457
Mato Grosso 11.362.447 2.298.234 13.660.681 274.146 583.158 857.304 446.110
Mato Grosso do Sul
19.816.878 13.659.625 33.476.503 360.800 1.485.397 1.846.197 1.328.546
Minas Gerais 30.027.571 25.986.033 56.013.604 598.494 2.061.537 2.660.031 3.254.070
Paraná 36.553.008 6.767.910 43.320.918 271.770 1.347.822 1.619.592 3.022.089
Rio de Janeiro
509.685 2.028.038 2.537.723 69.102 69.102 118.250
Rio Grande do Sul
1.309 80.707 82.016 - 5.805 5.805 -
Santa Catarina
- - - - - - -
São Paulo 197.882.438 163.287.279 361.169.717 4.857.709 10.564.524 15.422.233 23.506.910
Subtotal 332.140.096 228.343.739 560.483.835 7.117.468 18.451.666 25.569.134 33.564.515
Nor
te/N
orde
ste
Nor
th/N
orth
east
Acre 33.834 - 33.834 - 1.489 1.489 -
Alagoas 18.676.689 10.281.491 28.958.180 327.624 388.425 716.049 2.499.414
Amazonas 346.992 - 346.992 - 7.140 7.140 19.643
Bahia 2.177.200 614.771 2.791.971 59.200 68.134 127.334 113.582
Ceará 36.262 - 36.262 - 2.545 2.545 -
Maranhão 2.034.397 293.088 2.327.485 141.504 40.284 181.788 8.823
Pará 396.910 124.937 521.847 6.198 16.761 22.959 20.956
Paraíba 2.151.350 3.094.967 5.246.317 124.289 173.569 297.858 182.778
Pernambuco 10.157.911 7.038.193 17.196.104 159.832 225.340 385.172 1.364.783
Piauí 671.550 165.146 836.696 33.109 2.388 35.497 46.297
Rio Grande do Norte
2.229.323 504.131 2.733.454 43.144 40.034 83.178 169.003
Rondônia 120.024 16.666 136.690 - 10.763 10.763 -
Sergipe 1.500.026 558.937 2.058.963 10.400 92.954 103.354 79.716
Tocantins 238.983 - 238.983 4.515 11.973 16.488 -
Subtotal 40.771.451 22.692.327 63.463.778 909.815 1.081.799 1.991.614 4.504.995
TOTAL 372.911.547 251.036.066 623.947.613 8.027.283 19.533.465 27.560.748 38.069.510

Anuário Estatístico da Agroenergia – 2012 167
Tabela 103 – Safra: 11/12*
Região Region
Estados States
Cana Moída - t Milled sugarcane - tons
Álcool - m³Ethanol - m3
Açúcar - t Sugar - tons
Própria Own
Fornecedores Supplied
TOTALAnidro
AnhydrousHidratado
HydrousTOTAL TOTAL
Cent
ro-S
ulCe
nter
-Sou
th
Espírito Santo
1.526.286 2.477.550 4.003.836 137.811 74.605 212.416 122.235
Goiás 34.082.949 11.137.117 45.220.066 724.594 1.950.827 2.675.421 1.752.443
Mato Grosso 10.328.546 2.825.163 13.153.709 329.533 514.078 843.611 398.191
Mato Grosso do Sul
20.948.295 12.911.355 33.859.650 425.824 1.206.000 1.631.824 1.587.746
Minas Gerais 26.891.742 23.350.056 50.241.798 739.945 1.361.765 2.101.710 3.238.313
Paraná 33.789.900 6.729.401 40.519.301 365.888 1.039.446 1.405.334 3.008.029
Rio de Janeiro
566.295 1.641.560 2.207.855 81.118 81.118 129.666
Rio Grande do Sul
71 95.054 95.125 - 6.575 6.575
Santa Catarina
- -
São Paulo 164.444.532 141.191.784 305.636.316 4.772.987 6.866.338 11.639.325 21.112.970
Subtotal 292.578.616 202.359.040 494.937.656 7.496.582 13.100.752 20.597.334 31.349.593
Nor
te/N
orde
ste
Nor
th/N
orth
east
Acre 52.622 - 52.622 - 2.681 2.681 -
Alagoas 16.920.903 10.783.273 27.704.176 347.941 324.355 672.296 2.347.827
Amazonas 286.969 286.969 - 6.432 6.432 15.483
Bahia 1.994.270 563.055 2.557.325 66.694 51.223 117.917 124.035
Ceará 119.896 - 119.896 - 8.392 8.392 -
Maranhão 1.959.552 306.020 2.265.572 147.699 29.505 177.204 9.383
Pará 517.216 149.154 666.370 17.255 21.762 39.017 15.414
Paraíba 2.371.270 4.351.832 6.723.102 149.655 207.833 357.488 269.950
Pernambuco 10.086.612 7.555.624 17.642.236 187.571 170.035 357.606 1.481.148
Piauí 822.982 168.964 991.946 35.587 1.891 37.478 60.068
Rio Grande do Norte
2.324.927 648.374 2.973.301 57.552 48.121 105.673 200.743
Rondônia 136.161 20.930 157.091 12.416 12.416 -
Sergipe 1.393.701 617.545 2.011.246 39.585 57.580 97.165 89.780
Tocantins 1.366.152 - 1.366.152 77.353 33.849 111.202 -
Subtotal 40.353.233 25.164.771 65.518.004 1.126.892 976.075 2.102.967 4.613.831
TOTAL 332.931.849 227.523.811 560.455.660 8.623.474 14.076.827 22.700.301 35.963.424
Fonte: Mapa/SPAE.Nota: * Dados apurados em 15/05/2012.
* Data value at May 15, 2012.

OleaginosasOilseeds
04

Anuário Estatístico da Agroenergia – 2012 169
4.1 Soja4.1 Soybean
4.1.1 Informações técnicas4.1.1 Technical information
Tabela 104 – Informações técnicas da cultura da sojaTable 104 – Technical information of soybean crop
Item Item
DadoData
Ciclo (Cycle) 105 - 135 dias (days) (86 - 162)
Teor de óleo no grão (Grain oil content) 20% (18 - 21)
Teor de farelo do grão (Grain meal content) 80% (79-82)
Produtividade média do grão (Grain average productivity)
2.800kg/ha (1.800 - 4.000)
Rendimento em óleo (Oil yield) 560 kg/ha
Cultivares Registrados no Mapa (Registered cultivars in Mapa)
909 (Glycine max ) 5 (Glycine javanica)
Defensivos registrados no Mapa (Registered pesticides in Mapa)
556
Poder calorífico do óleo in natura (Oil calorific value)
9.421 kcal/kg
Balanço energético do biocombustível (Biofuel energy balance)
1 : 3,95
Fonte (Source): Mapa/SPAE.

Ministério da Agricultura, Pecuária e Abastecimento170
4.1.2 Produção mundial4.1.2 World production
Tabela 105 – Principais países produtores de soja, em milhões de toneladasTable 105 – Main soybean producing countries, in million tons
1998/99 1999/00 2000/01 2001/02 2002/03 2003/04 2004/05 2005/06 2006/07 2007/08 2008/09 2009/10 2010/11 2011/12
EUA (USA) 74,60 72,22 75,06 78,67 75,01 66,78 85,01 83,37 86,77 72,86 80,75 91,42 90,61 83,17
Brasil (Brazil)
30,77 32,34 38,43 41,92 52,02 49,79 51,45 55,03 58,39 60,02 57,17 68,69 75,32 66,68
Argentina (Argentina)
20,00 21,20 27,20 30,00 35,50 33,00 39,00 40,50 48,80 46,20 32,00 54,50 49,00 42,50
China (China)
15,15 14,29 15,40 15,41 16,51 15,39 17,40 16,35 15,97 14,00 15,54 14,98 15,10 13,50
Índia (India)
6,00 5,20 5,25 5,40 4,00 6,80 5,85 6,30 7,69 9,47 9,10 9,70 9,80 11,00
Paraguai (Paraguay)
3,05 2,90 3,40 3,55 4,50 3,91 4,05 4,00 6,20 6,90 4,00 7,20 8,37 4,00
Demais países (Other
countries)
9,72 9,84 9,18 8,31 9,26 9,63 11,41 12,38 12,83 10,58 12,77 14,04 16,49 16,02
Mundo (World)
159,29 157,99 173,92 183,26 196,80 185,30 214,17 217,93 236,65 220,03 211,33 260,84 264,69 236,87
Fonte (Source): USDA, Mapa.
Gráfico 78 – Principais países produtores de soja, em milhões de toneladasChart 78 – Main soybean producing countries, in million tons
0
50
100
150
200
250
300
1998
/99
1999
/00
2000
/01
2001
/02
2002
/03
2003
/04
2004
/05
2005
/06
2006
/07
2007
/08
2008
/09
2009
/10
2010
/11
2011
/12
Pro
du
ção
(m
ilhõ
es d
e to
nel
adas
)
Pro
du
ctio
n (
mill
ion
to
ns)
Safras / Harvests
Demais países (Other countries) Paraguai (Paraguay) Índia (India)
China (China) Argentina (Argentina) Brasil (Brazil)
EUA (USA)

Anuário Estatístico da Agroenergia – 2012 171
Tabela 106 – Produção mundial de óleo de soja, em milhões de toneladasTable 106 – World soybean oil production, in million tons
SafrasHarvests
Produção de óleo (milhões de toneladas)Oil production (million tons)
1998/99 24,65
1999/00 24,74
2000/01 26,80
2001/02 28,84
2002/03 30,31
2003/04 30,16
2004/05 32,53
2005/06 34,50
2006/07 36,53
2007/08 37,83
2008/09 35,89
2009/10 38,89
2010/11 41,24
2011/12 41,95
Fonte (Source): USDA.
Gráfico 79 – Produção mundial de óleo de soja, em milhões de toneladasChart 79 – World soybean oil production, in million tons
0
5
10
15
20
25
30
35
40
45
1998
/99
1999
/00
2000
/01
2001
/02
2002
/03
2003
/04
2004
/05
2005
/06
2006
/07
2007
/08
2008
/09
2009
/10
2010
/11
2011
/12
Pro
du
ção
de
óle
o (
milh
ões
de
ton
elad
as)
O
il p
rod
uct
ion
(m
illio
n t
on
s)
Safras / Harvests
Produção de óleo (milhões de toneladas) / Oil production (million tons)

Ministério da Agricultura, Pecuária e Abastecimento172
4.1.3 Produção nacional4.1.3 National production
Tabela 107 – Série histórica da produção, área plantada e produtividade de soja no BrasilTable 107 – Soybean production, planted area and productivity in Brazil
SafrasHarvests
Produção (milhões de toneladas)
Production (million tons)
Área plantada (milhões de ha)
Planted area (million ha)
Produtividade (kg/ha)Productivity (kg/ha)
1976/77 12,15 6,9 1.7481977/78 9,73 7,8 1.2501978/79 10,20 8,2 1.2511979/80 14,89 8,8 1.7001980/81 15,48 8,7 1.7811981/82 12,89 8,4 1.5361982/83 14,53 8,4 1.7281983/84 15,34 9,2 1.6741984/85 18,21 10,1 1.8081985/86 13,21 9,6 1.3691986/87 17,07 9,2 1.8511987/88 18,13 10,7 1.6931988/89 23,93 12,3 1.9531989/90 20,10 11,6 1.7401990/91 15,39 9,7 1.5801991/92 19,42 9,6 2.0271992/93 23,04 10,7 2.1501993/94 25,06 11,5 2.1791994/95 25,93 11,7 2.2211995/96 23,19 10,7 2.1751996/97 26,16 11,4 2.2991997/98 31,64 13,2 2.3841998/99 30,77 13,0 2.3671999/00 32,34 13,5 2.3952000/01 38,43 14,0 2.7512001/02 41,92 16,3 2.5672002/03 52,02 18,5 2.8162003/04 49,79 21,4 2.3292004/05 51,45 23,3 2.2082005/06 55,03 22,7 2.4192006/07 58,39 20,7 2.823 2007/08 60,02 21,3 2.816 2008/09 57,17 21,74 2.629 2009/10 68,69 23,47 2.927 2010/11 75,32 24,18 3.115 2011/12 66,68 25,02 2.665
Fonte (Source): Mapa/Conab.

Anuário Estatístico da Agroenergia – 2012 173
Gráfico 80 – Série histórica da produção de soja no Brasil, em milhões de toneladasChart 80 – Soybean production in Brazil, in million tons
0
10
20
30
40
50
60
70
80
1976
/77
1978
/79
1980
/81
1982
/83
1984
/85
1986
/87
1988
/89
1990
/91
1992
/93
1994
/95
1996
/97
1998
/99
2000
/01
2002
/03
2004
/05
2006
/07
2008
/09
2010
/11
Pro
du
ção
(m
ilhõ
es d
e to
nel
adas
)
Pro
du
ctio
n (
mill
ion
to
ns)
Safras / Harvests
Gráfico 81 – Série histórica da área plantada de soja no Brasil, em milhões de hectaresChart 81 – Soybean planted area in Brazil, in million hectares
0
5
10
15
20
25
30
1976
/77
1978
/79
1980
/81
1982
/83
1984
/85
1986
/87
1988
/89
1990
/91
1992
/93
1994
/95
1996
/97
1998
/99
2000
/01
2002
/03
2004
/05
2006
/07
2008
/09
2010
/11
Áre
a (m
ilhõ
es d
e h
ecta
res)
A
rea
(mill
ion
s h
ecta
res)
Safras / Harvests

Ministério da Agricultura, Pecuária e Abastecimento174
Gráfico 82 – Série histórica da produtividade de soja no Brasil, em kg/haChart 82 – Soybean productivity in Brazil, in kg/ha
1.000
1.500
2.000
2.500
3.000
3.500
1976
/77
1978
/79
1980
/81
1982
/83
1984
/85
1986
/87
1988
/89
1990
/91
1992
/93
1994
/95
1996
/97
1998
/99
2000
/01
2002
/03
2004
/05
2006
/07
2008
/09
2010
/11
Pro
du
tivi
dad
e (k
g/h
a)
Pro
du
ctiv
ity
(kg
/ha)
Safras / Harvests

Anuário Estatístico da Agroenergia – 2012 175
Tab
ela
108
– Pr
od
uçã
o d
e so
ja n
o B
rasi
l no
per
íod
o d
e 19
77 a
199
4, e
m m
il to
nel
adas
Tabl
e 10
8 –
Soyb
ean
prod
uctio
nin
Braz
il be
twee
n 19
77 t
o 19
94, i
n th
ousa
nd t
ons
Regi
ão/U
F (R
egio
n/St
ate)
19
76/7
719
77/7
8 19
78/7
919
79/8
019
80/8
119
81/8
219
82/8
319
83/8
419
84/8
519
85/8
619
86/8
719
87/8
819
88/8
919
89/9
019
90/9
119
91/9
219
92/9
319
93/9
4
Nor
te (N
orth
)-
--
--
--
--
0,5
1,1
54,7
135,
653
,211
,519
,436
,459
,0
RR-
--
--
--
--
--
--
--
--
16,8
RO-
--
--
--
--
0,5
1,1
7,7
31,2
15,6
5,0
0,2
10,8
-A
C-
--
--
--
--
--
--
--
--
-A
M-
--
--
--
--
--
--
--
--
-A
P-
--
--
--
--
--
--
--
--
-PA
--
--
--
--
--
--
--
--
--
TO-
--
--
--
--
--
47,0
104,
437
,66,
519
,225
,642
,2N
orde
ste
(Nor
thea
st)
--
-2,
23,
80,
44,
536
,484
,615
5,5
156,
337
4,9
638,
726
7,8
564,
352
0,3
682,
11.
018,
4
MA
--
--
--
--
9,0
13,6
8,8
29,2
37,2
6,7
8,3
25,3
91,2
138,
2PI
--
--
--
--
--
-0,
20,
20,
4-
--
12,2
CE-
--
--
--
--
--
--
--
--
-RN
--
--
--
--
--
--
--
--
--
PB-
--
--
--
--
--
--
--
--
-PE
--
--
--
--
--
--
--
--
--
AL
--
--
--
--
-2,
83,
03,
54,
54,
5-
--
-SE
--
--
--
--
--
--
--
--
--
BA-
--
2,2
3,8
0,4
4,5
36,4
75,6
139,
114
4,5
342,
059
6,8
256,
255
6,0
495,
059
0,9
868,
0Ce
ntro
-Oes
te
(Cen
tral
Wes
t)54
0,0
578,
01.
100,
01.
850,
42.
097,
02.
437,
43.
137,
03.
828,
85.
572,
75.
027,
55.
811,
86.
739,
68.
652,
46.
325,
66.
667,
07.
313,
28.
484,
29.
907,
0
MT
450,
08,
026
,011
6,9
230,
036
0,7
606,
093
4,0
1.65
3,6
1.91
0,0
2.38
7,0
2.75
0,0
3.68
9,7
2.90
0,8
2.60
7,0
3.48
4,8
4.19
7,8
4.97
0,0
MS
-47
2,0
849,
01.
267,
21.
413,
01.
468,
41.
786,
01.
916,
92.
561,
71.
900,
42.
308,
82.
548,
22.
860,
01.
934,
42.
299,
71.
929,
32.
229,
02.
439,
8G
O90
,098
,022
5,0
449,
542
9,0
576,
070
3,0
922,
21.
266,
11.
133,
31.
026,
01.
356,
01.
980,
01.
410,
81.
659,
01.
804,
01.
968,
02.
387,
1D
F-
--
16,8
25,0
32,3
42,0
55,7
91,3
83,8
90,0
85,4
122,
779
,610
1,3
95,1
89,4
110,
1Su
dest
e(S
outh
east
)87
5,0
882,
01.
020,
01.
305,
01.
317,
01.
380,
61.
430,
21.
360,
01.
816,
71.
687,
51.
724,
41.
985,
52.
556,
31.
843,
51.
930,
41.
910,
72.
314,
32.
499,
4
MG
95,0
137,
017
0,0
255,
028
5,0
387,
646
4,4
496,
085
3,4
778,
380
1,0
983,
61.
207,
987
4,5
962,
91.
003,
21.
158,
81.
234,
2ES
--
--
--
--
--
--
--
--
--
RJ-
--
--
--
--
--
--
--
--
-SP
780,
074
5,0
850,
01.
050,
01.
032,
099
3,0
965,
886
4,0
963,
390
9,2
923,
41.
001,
91.
348,
496
9,0
967,
590
7,5
1.15
5,5
1.26
5,2
Sul (
Sout
h)10
.730
,08.
266,
08.
080,
011
.729
,812
.067
,09.
072,
59.
961,
210
.115
,310
.737
,56.
336,
59.
377,
98.
972,
311
.946
,211
.611
,26.
221,
39.
655,
011
.525
,111
.575
,4PR
4.60
0,0
3.15
0,0
4.05
0,0
5.42
0,0
5.24
0,0
4.26
2,0
4.32
5,0
4.11
4,0
4.44
8,5
2.56
8,0
3.85
3,9
4.77
0,8
5.05
4,5
4.57
2,0
3.61
7,4
3.41
5,3
4.72
0,0
5.32
7,8
SC48
0,0
440,
043
0,0
728,
068
8,0
559,
043
5,7
597,
357
8,9
507,
546
8,0
586,
562
8,9
600,
624
9,9
448,
251
2,1
556,
0RS
5.65
0,0
4.67
6,0
3.60
0,0
5.58
1,8
6.13
9,0
4.25
1,5
5.20
0,5
5.40
4,0
5.71
0,1
3.26
1,0
5.05
6,0
3.61
5,0
6.26
2,8
6.43
8,6
2.35
4,0
5.79
1,5
6.29
3,0
5.69
1,6
Nor
te/N
orde
ste
(Nor
th/N
orth
east
)-
--
2,2
3,8
0,4
4,5
36,4
84,6
156,
015
7,4
429,
677
4,3
321,
057
5,8
539,
771
8,5
1.07
7,4
Cent
ro-S
ul
(Cen
ter-S
outh
)12
.145
,09.
726,
010
.200
,014
.885
,215
.481
,012
.890
,514
.528
,415
.304
,118
.126
,913
.051
,516
.914
,117
.697
,423
.154
,919
.780
,314
.818
,718
.878
,922
.323
,623
.981
,8
Bras
il (B
razi
l)12
.145
,09.
726,
010
.200
,014
.887
,415
.484
,812
.890
,914
.532
,915
.340
,518
.211
,513
.207
,517
.071
,518
.127
,023
.929
,220
.101
,315
.394
,519
.418
,623
.042
,125
.059
,2
Font
e (S
ourc
e): M
apa/
Con
ab.
(Continua / Continues)

Ministério da Agricultura, Pecuária e Abastecimento176
Tab
ela
109
– Pr
od
uçã
o d
e so
ja n
o B
rasi
l no
per
íod
o d
e 19
95 a
201
2, e
m m
il to
nel
adas
Tabl
e 10
9 –
Soyb
ean
prod
uctio
n in
Bra
zil b
etw
een
1995
to
2012
, in
thou
sand
ton
s
Regi
ão/U
F (R
egio
n/St
ate
)19
94/9
519
95/9
619
96/9
719
97/9
819
98/9
919
99/2
000
2000
/01
2001
/02
2002
/03
2003
/04
2004
/05
2005
/06
2006
/07
2007
/08
2008
/09
2009
/10
2010
/11
2011
/12
Nor
te (N
orth
)45
,514
,228
,699
,812
3,2
177,
021
6,6
367,
455
7,5
913,
71.
419,
91.
255,
21.
079,
91.
472,
31.
414,
01.
691,
71.
977,
22.
148,
7
RR-
4,9
--
-9,
87,
228
,856
,028
,015
,448
,822
,43,
910
,410
,4
RO13
,0-
8,9
14,1
26,1
35,4
76,5
85,0
123,
017
7,9
227,
228
3,0
277,
531
1,5
326,
538
4,3
425,
346
6,2
AC
--
--
--
--
--
--
--
-
AM
--
--
-2,
85,
45,
48,
45,
7-
--
--
-
AP
--
--
--
--
--
--
--
-
PA-
--
5,5
3,3
4,9
1,5
7,3
44,2
95,0
207,
023
8,1
140,
520
1,1
208,
723
2,5
314,
430
3,6
TO32
,59,
319
,780
,293
,813
6,7
138,
626
2,5
377,
760
6,6
921,
370
0,4
646,
591
0,9
856,
41.
071,
01.
227,
11.
368,
5N
orde
ste
(Nor
thea
st)
1.26
7,8
921,
91.
300,
11.
561,
11.
609,
82.
064,
02.
075,
92.
124,
62.
519,
33.
538,
93.
953,
13.
560,
93.
867,
24.
829,
74.
161,
95.
309,
56.
251,
56.
476,
2
MA
169,
619
9,6
252,
030
2,4
390,
543
9,3
483,
056
9,5
654,
992
4,1
997,
51.
025,
11.
084,
01.
262,
897
5,1
1.33
0,6
1.59
9,7
1.77
4,4
PI25
,223
,035
,857
,168
,810
0,0
142,
691
,130
8,2
396,
755
4,4
544,
548
6,0
819,
376
8,8
868,
41.
144,
31.
363,
4
CE-
--
--
--
--
--
--
--
RN-
--
--
--
--
--
--
--
PB-
--
--
--
--
--
--
--
PE-
--
--
--
--
--
--
--
AL
--
--
--
--
--
--
--
-
SE-
--
--
--
--
--
--
--
BA1.
073,
069
9,3
1.01
2,3
1.20
1,6
1.15
0,5
1.52
4,7
1.45
0,3
1.46
4,0
1.55
6,2
2.21
8,1
2.40
1,2
1.99
1,3
2.29
7,2
2.74
7,6
2.41
8,0
3.11
0,5
3.50
7,5
3.33
8,4
Cent
ro-O
este
(C
entr
al W
est)
10.0
84,7
8.84
6,4
10.4
38,1
12.8
89,9
13.3
56,1
15.4
67,6
17.0
01,9
20.5
33,4
23.5
32,5
24.6
13,1
28.9
73,5
27.8
24,7
26.4
94,8
29.1
14,0
29.1
34,9
31.5
86,7
33.9
38,9
34.9
49,7
MT
5.44
0,1
4.68
6,8
5.72
1,3
7.15
0,0
7.13
4,4
8.80
1,2
9.64
0,8
11.7
33,0
12.9
49,4
15.0
08,8
17.9
37,1
16.7
00,4
15.3
59,0
17.8
47,9
17.9
62,5
18.7
66,9
20.4
12,2
21.6
81,2
MS
2.42
6,4
2.04
5,9
2.15
5,8
2.28
1,7
2.74
0,1
2.50
0,9
3.12
9,6
3.27
8,6
4.10
3,8
3.32
4,8
3.86
2,6
4.44
5,1
4.88
1,3
4.56
9,2
4.17
9,7
5.30
7,8
5.16
9,4
4.62
9,5
GO
2.13
3,1
2.04
6,2
2.47
8,0
3.37
2,0
3.41
7,7
4.07
2,6
4.15
8,0
5.42
0,4
6.35
9,6
6.14
7,1
6.98
5,1
6.53
3,5
6.11
4,0
6.54
3,5
6.83
6,2
7.34
2,6
8.18
1,6
8.46
3,0
DF
85,1
67,5
83,0
86,2
63,9
92,9
73,5
101,
411
9,7
132,
418
8,7
145,
714
0,5
153,
415
6,5
169,
417
5,7
176,
0Su
dest
e (S
outh
east
)2.
365,
92.
274,
52.
498,
42.
495,
52.
757,
02.
569,
72.
873,
93.
519,
84.
067,
64.
474,
44.
752,
04.
137,
14.
005,
43.
983,
44.
057,
64.
457,
64.
622,
14.
674,
3
MG
1.18
8,0
1.04
0,2
1.17
6,1
1.38
2,5
1.33
6,0
1.39
6,8
1.49
5,9
1.94
8,5
2.33
2,5
2.65
9,2
3.02
1,6
2.48
2,5
2.56
7,9
2.53
6,9
2.75
1,1
2.87
1,5
2.91
3,6
2.99
8,3
ES-
--
--
--
--
--
--
--
--
-
RJ-
--
--
--
--
--
--
--
--
-
SP1.
177,
91.
234,
31.
322,
31.
113,
01.
421,
01.
172,
91.
378,
01.
571,
31.
735,
11.
815,
21.
730,
41.
654,
61.
437,
51.
446,
51.
306,
51.
586,
11.
708,
51.
676,
0
Sul (
Sout
h)12
.170
,211
.132
,711
.894
,814
.323
,612
.918
,912
.611
,716
.263
,515
.684
,821
.340
,616
.252
,613
.206
,218
.249
,222
.944
,520
.618
,018
.397
,125
.642
,728
.534
,618
.433
,4
PR5.
534,
86.
241,
16.
565,
57.
191,
07.
723,
37.
130,
48.
623,
19.
502,
310
.971
,010
.036
,59.
707,
39.
645,
611
.915
,611
.896
,09.
509,
714
.078
,715
.424
,110
.799
,1
SC48
4,8
489,
355
9,7
517,
043
1,2
516,
352
7,2
546,
573
8,5
656,
764
4,0
827,
51.
104,
394
6,6
974,
81.
345,
21.
489,
21.
107,
7
RS6.
150,
64.
402,
34.
769,
66.
615,
64.
764,
44.
965,
07.
113,
25.
636,
09.
631,
15.
559,
42.
854,
97.
776,
19.
924,
67.
775,
47.
912,
610
.218
,811
.621
,36.
526,
6N
orte
/Nor
dest
e (N
orth
/Nor
thea
st)
1.31
3,3
936,
11.
328,
71.
660,
91.
733,
02.
241,
02.
292,
52.
492,
03.
076,
84.
452,
65.
373,
04.
816,
14.
947,
16.
302,
05.
575,
97.
001,
28.
228,
78.
624,
9
Cent
ro-S
ul
(Cen
ter-S
outh
)24
.620
,822
.253
,624
.831
,329
.709
,029
.032
,030
.649
,036
.139
,339
.738
,048
.940
,745
.340
,146
.931
,650
.211
,053
.444
,753
.715
,451
.589
,661
.687
,067
.095
,658
.057
,4
Bras
il (B
razi
l)25
.934
,123
.189
,726
.160
,031
.369
,930
.765
,032
.890
,038
.431
,842
.230
,052
.017
,549
.792
,752
.304
,655
.027
,158
.391
,860
.017
,457
.165
,568
.688
,275
.324
,366
.682
,3
Font
e (S
ourc
e): M
apa/
Con
ab.

Anuário Estatístico da Agroenergia – 2012 177
Tab
ela
110
– Á
rea
pla
nta
da
de
soja
no
Bra
sil n
o p
erío
do
de
1977
a 1
994,
em
mil
hec
tare
sTa
ble
110
– La
nd u
sed
for
soyb
ean
in B
razi
l bet
wee
n 19
77 t
o 19
94, i
n th
ousa
nd h
ecta
res
Regi
ão/U
F (R
egio
n/St
ate
)19
76/7
719
77/7
8 19
78/7
919
79/8
019
80/8
119
81/8
219
82/8
319
83/8
419
84/8
519
85/8
619
86/8
719
87/8
819
88/8
919
89/9
019
90/9
119
91/9
219
92/9
319
93/9
4
Nor
te (N
orth
)-
--
--
--
--
0,4
0,6
32,3
74,6
42,0
6,3
12,1
20,0
28,7
RR-
--
--
--
--
--
--
--
--
6,0
RO-
--
--
--
--
0,4
0,6
4,3
15,6
7,8
2,4
0,1
4,5
-
AC
--
--
--
--
--
--
--
--
--
AM
--
--
--
--
--
--
--
--
--
AP
--
--
--
--
--
--
--
--
--
PA-
--
--
--
--
--
--
--
--
-
TO-
--
--
--
--
--
28,0
59,0
34,2
3,9
12,0
15,5
22,7
Nor
dest
e (N
orth
east
)-
--
1,9
2,4
1,2
5,0
28,0
73,0
117,
718
0,6
246,
741
0,1
385,
428
2,6
351,
142
2,7
503,
6
MA
--
--
--
--
10,0
8,7
8,5
16,2
21,9
16,0
4,6
21,1
42,7
62,8
PI-
--
--
--
--
--
0,2
0,2
0,4
--
-6,
8
CE-
--
--
--
--
--
--
--
--
-
RN-
--
--
--
--
--
--
--
--
-
PB-
--
--
--
--
--
--
--
--
-
PE-
--
--
--
--
--
--
--
--
-
AL
--
--
--
--
-2,
02,
12,
33,
03,
0-
--
-
SE-
--
--
--
--
--
--
--
--
-
BA-
--
1,9
2,4
1,2
5,0
28,0
63,0
107,
017
0,0
228,
038
5,0
366,
027
8,0
330,
038
0,0
434,
0Ce
ntro
-Oes
te
(Cen
tral
Wes
t)37
8,0
597,
072
0,0
1.11
7,0
1.24
9,0
1.36
4,0
1.64
7,0
2.14
1,9
2.83
7,0
2.81
3,3
2.86
7,8
3.37
9,1
4.05
4,5
3.70
6,0
2.94
6,2
3.28
3,5
3.80
8,6
4.24
4,3
MT
310,
06,
019
,070
,012
8,0
195,
031
7,0
467,
079
5,0
909,
51.
100,
01.
375,
01.
708,
21.
503,
01.
100,
01.
452,
01.
713,
41.
996,
0
MS
-49
4,0
573,
079
2,0
812,
083
2,0
940,
01.
073,
91.
307,
01.
234,
01.
184,
01.
231,
01.
300,
01.
209,
01.
013,
196
9,5
1.06
6,5
1.10
9,0
GO
68,0
97,0
128,
024
7,0
294,
032
0,0
370,
057
1,0
690,
062
1,0
540,
073
0,4
990,
094
0,5
790,
082
0,0
984,
01.
090,
0
DF
--
-8,
015
,017
,020
,030
,045
,048
,843
,842
,756
,353
,543
,142
,044
,749
,3Su
dest
e (S
outh
east
)53
0,0
671,
065
1,0
710,
073
3,0
744,
072
8,0
790,
092
5,0
906,
087
6,7
1.01
0,5
1.18
9,0
1.16
5,0
972,
091
9,0
1.08
4,3
1.17
5,1
MG
85,0
112,
010
3,0
150,
019
0,0
228,
025
8,0
310,
043
1,0
430,
041
5,0
498,
059
5,0
583,
047
2,0
456,
055
1,8
600,
0
ES-
--
--
--
--
--
--
--
--
-
RJ-
--
--
--
--
--
--
--
--
-
SP44
5,0
559,
054
8,0
560,
054
3,0
516,
047
0,0
480,
049
4,0
476,
046
1,7
512,
559
4,0
582,
050
0,0
463,
053
2,5
575,
1
Sul (
Sout
h)6.
041,
06.
512,
06.
780,
06.
927,
06.
709,
06.
284,
06.
032,
06.
203,
06.
239,
05.
807,
05.
296,
06.
038,
06.
524,
66.
253,
05.
535,
45.
016,
55.
381,
45.
550,
0
PR2.
200,
02.
349,
02.
350,
02.
420,
02.
350,
02.
197,
02.
050,
02.
200,
02.
170,
02.
140,
01.
776,
02.
149,
02.
406,
92.
286,
01.
966,
01.
797,
52.
000,
02.
110,
0
SC35
1,0
409,
048
0,0
520,
051
0,0
484,
041
5,0
436,
043
2,0
406,
036
0,0
413,
043
3,7
390,
030
0,0
249,
028
1,4
278,
0
RS3.
490,
03.
754,
03.
950,
03.
987,
03.
849,
03.
603,
03.
567,
03.
567,
03.
637,
03.
261,
03.
160,
03.
476,
03.
684,
03.
577,
03.
269,
42.
970,
03.
100,
03.
162,
0
Nor
te/N
orde
ste
(Nor
th/N
orth
east
)-
--
1,9
2,4
1,2
5,0
28,0
73,0
118,
118
1,2
279,
048
4,7
427,
428
8,9
363,
244
2,7
532,
3
Cent
ro-S
ul
(Cen
ter-S
outh
)6.
949,
07.
780,
08.
151,
08.
754,
08.
691,
08.
392,
08.
407,
09.
134,
910
.001
,09.
526,
39.
040,
510
.427
,611
.768
,111
.124
,09.
453,
69.
219,
010
.274
,310
.969
,4
Bras
il (B
razi
l)6.
949,
07.
780,
08.
151,
08.
755,
98.
693,
48.
393,
28.
412,
09.
162,
910
.074
,09.
644,
49.
221,
710
.706
,612
.252
,811
.551
,49.
742,
59.
582,
210
.717
,011
.501
,7
Font
e (S
ourc
e): M
apa/
Con
ab.

Ministério da Agricultura, Pecuária e Abastecimento178
Tab
ela
111
– Á
rea
pla
nta
da
de
soja
no
Bra
sil n
o p
erío
do
de
1995
a 2
011,
em
mil
hec
tare
sTa
ble
111
– La
nd u
sed
for
soyb
ean
in B
razi
l bet
wee
n 19
95 t
o 20
11, i
n th
ousa
nd h
ecta
res
Regi
ão/U
F (R
egio
n/St
ate
)19
94/9
519
95/9
619
96/9
719
97/9
819
98/9
919
99/2
000
2000
/01
2001
/02
2002
/03
2003
/04
2004
/05
2005
/06
2006
/07
2007
/08
2008
/09
2009
/10
2010
/11
2011
/12
Nor
te (N
orth
)21
,46,
725
,247
,450
,470
,691
,714
1,1
209,
735
2,4
521,
950
7,5
410,
651
7,5
497,
655
8,7
645,
569
8,5
RR-
1,8
--
-3,
53,
012
,020
,010
,05,
515
,08,
01,
43,
73,
7RO
4,8
-3,
34,
78,
711
,825
,028
,641
,059
,574
,410
6,4
90,4
99,8
106,
012
2,9
132,
314
5,5
AC
--
--
--
--
--
--
--
-A
M-
--
--
1,1
2,1
2,1
2,8
1,9
--
--
--
AP
--
--
--
--
--
--
--
--
PA-
--
2,6
1,6
2,3
0,7
2,9
15,5
35,2
69,0
79,7
47,0
71,1
72,2
69,8
104,
810
5,7
TO16
,64,
921
,940
,140
,156
,566
,010
5,0
148,
124
3,6
355,
730
9,5
267,
733
1,6
311,
436
4,6
404,
744
3,6
Nor
dest
e (N
orth
east
)57
5,9
532,
359
3,9
728,
977
2,8
851,
096
2,6
1.12
5,1
1.24
0,7
1.32
3,3
1.44
2,1
1.48
7,1
1.45
4,9
1.58
0,1
1.60
8,0
1.75
8,0
1.94
5,7
2.14
1,5
MA
91,7
89,1
120,
014
4,0
162,
717
5,7
210,
023
8,3
274,
034
2,5
375,
038
2,5
384,
442
1,5
387,
440
4,8
518,
258
1,4
PI13
,610
,217
,928
,629
,940
,062
,086
,811
6,3
159,
319
7,1
232,
021
9,7
253,
627
3,1
336,
538
3,6
447,
3CE
--
--
--
--
--
--
--
--
RN-
--
--
--
--
--
--
--
-PB
--
--
--
--
--
--
--
--
PE-
--
--
--
--
--
--
--
-A
L-
--
--
--
--
--
--
--
-SE
--
--
--
--
--
--
--
--
BA47
0,6
433,
045
6,0
556,
358
0,2
635,
369
0,6
800,
085
0,4
821,
587
0,0
872,
685
0,8
905,
094
7,5
1.01
6,7
1.04
3,9
1.11
2,8
Cent
ro-O
este
(C
entr
al W
est)
4.55
9,8
3.69
4,7
3.98
3,8
5.06
0,2
4.95
5,1
5.49
9,4
5.75
9,5
6.98
5,0
8.04
8,4
9.65
9,3
10.8
57,0
10.7
42,6
9.10
5,1
9.63
4,8
9.90
0,1
10.4
10,7
10.8
19,4
11.4
64,3
MT
2.29
5,4
1.90
5,2
2.09
5,7
2.60
0,0
2.54
8,0
2.90
4,7
3.12
0,0
3.85
3,2
4.41
9,6
5.24
0,5
6.10
5,2
6.19
6,8
5.12
4,8
5.67
5,0
5.82
8,2
6.18
5,5
6.39
8,8
6.94
9,1
MS
1.09
7,9
845,
486
2,3
1.08
6,5
1.05
3,9
1.10
6,6
1.06
4,5
1.19
2,2
1.41
5,1
1.79
7,2
2.03
0,8
1.94
9,6
1.73
7,1
1.73
1,4
1.71
5,8
1.71
2,2
1.76
0,1
1.81
5,5
GO
1.12
2,7
909,
499
1,2
1.33
8,1
1.32
4,7
1.45
4,5
1.54
0,0
1.90
1,9
2.17
0,5
2.57
2,0
2.66
2,0
2.54
2,2
2.19
1,4
2.17
9,7
2.30
7,2
2.46
0,0
2.60
5,6
2.64
4,7
DF
43,8
34,7
34,6
35,6
28,5
33,6
35,0
37,7
43,2
49,6
59,0
54,0
51,8
48,7
48,9
53,0
54,9
55,0
Sude
ste
(Sou
thea
st)
1.16
3,6
1.09
1,6
1.09
7,6
1.13
1,1
1.09
7,6
1.15
2,9
1.17
2,0
1.29
6,7
1.48
8,9
1.82
6,9
1.89
1,6
1.71
7,5
1.46
8,8
1.39
6,0
1.46
0,4
1.59
1,2
1.63
6,9
1.62
2,9
MG
600,
052
8,0
522,
760
1,1
577,
159
4,4
642,
071
9,0
873,
61.
065,
81.
119,
11.
060,
993
0,4
870,
092
9,1
1.01
9,0
1.02
4,1
1.00
5,8
ES-
--
--
--
--
--
--
--
--
-RJ
--
--
--
--
--
--
--
--
--
SP56
3,6
563,
657
4,9
530,
052
0,5
558,
553
0,0
577,
761
5,3
761,
177
2,5
656,
653
8,4
526,
053
1,3
572,
261
2,8
617,
1Su
l (So
uth)
5.35
8,0
5.33
7,9
5.68
0,8
6.19
0,3
6.11
9,3
6.04
9,0
5.98
4,0
6.83
8,3
7.48
7,1
8.21
3,9
8.58
8,5
8.29
4,7
8.24
7,4
8.18
4,7
8.27
7,0
8.92
0,4
9.13
3,5
9.09
1,4
PR2.
120,
62.
311,
52.
496,
42.
820,
02.
769,
22.
832,
92.
818,
03.
291,
43.
637,
63.
935,
94.
148,
43.
982,
53.
978,
53.
977,
34.
069,
24.
504,
64.
590,
54.
445,
9SC
222,
422
2,4
240,
222
0,0
215,
620
7,0
196,
024
1,3
255,
830
7,0
350,
034
4,8
376,
937
3,4
385,
343
9,6
458,
244
8,3
RS3.
015,
02.
804,
02.
944,
23.
150,
33.
134,
53.
009,
12.
970,
03.
305,
63.
593,
73.
971,
04.
090,
13.
967,
43.
892,
03.
834,
03.
822,
53.
976,
24.
084,
84.
197,
2N
orte
/Nor
dest
e (N
orth
/Nor
thea
st)
597,
353
9,0
619,
177
6,3
823,
292
1,6
1.05
4,3
1.26
6,2
1.45
0,4
1.67
5,7
1.96
4,0
1.99
4,6
1.86
5,5
2.09
7,6
2.10
5,6
2.31
6,7
2.59
1,2
2.84
0,0
Cent
ro-S
ul
(Cen
ter-S
outh
)11
.081
,410
.124
,210
.762
,212
.381
,612
.172
,012
.701
,312
.915
,515
.120
,017
.024
,419
.700
,121
.337
,120
.754
,818
.821
,319
.215
,519
.637
,520
.922
,321
.589
,822
.178
,6
Bras
il (B
razi
l)11
.678
,710
.663
,211
.381
,313
.157
,912
.995
,213
.622
,913
.969
,816
.386
,218
.474
,821
.375
,823
.301
,122
.749
,420
.686
,821
.313
,021
.743
,123
.239
,024
.181
,025
.018
,6
Font
e (S
ourc
e): M
apa/
Con
ab.

Anuário Estatístico da Agroenergia – 2012 179
Tab
ela
112
– Pr
od
uti
vid
ade
de
soja
no
Bra
sil n
o p
erío
do
de
1977
a 1
994,
em
kg
/ha
Tabl
e 11
2 –
Soyb
ean
prod
uctiv
ity in
Bra
zil b
etw
een
1977
to
1994
, in
kg/h
a
Regi
ão/U
F (R
egio
n/St
ate
)19
76/7
719
77/7
8 19
78/7
919
79/8
019
80/8
119
81/8
219
82/8
319
83/8
419
84/8
519
85/8
619
86/8
719
87/8
819
88/8
919
89/9
019
90/9
119
91/9
219
92/9
319
93/9
4
Nor
te (N
orth
)-
--
--
--
--
1.25
01.
833
1.69
31.
818
1.26
71.
825
1.60
31.
820
2.05
6
RR-
--
--
--
--
--
--
--
--
2.80
0
RO-
--
--
--
--
1.25
01.
833
1.79
12.
000
2.00
02.
100
2.40
02.
400
-
AC
--
--
--
--
--
--
--
--
--
AM
--
--
--
--
--
--
--
--
--
AP
--
--
--
--
--
--
--
--
--
PA-
--
--
--
--
--
--
--
--
-
TO-
--
--
--
--
--
1.67
91.
769
1.09
91.
675
1.60
01.
650
1.86
0N
orde
ste
(Nor
thea
st)
--
-1.
158
1.58
333
390
01.
300
1.15
91.
321
865
1.52
01.
557
695
1.99
71.
482
1.61
42.
022
MA
--
--
--
--
900
1.56
31.
035
1.80
21.
699
419
1.80
01.
201
2.13
52.
200
PI-
--
--
--
--
--
1.00
01.
000
1.00
0-
--
1.80
0
CE-
--
--
--
--
--
--
--
--
-
RN-
--
--
--
--
--
--
--
--
-
PB-
--
--
--
--
--
--
--
--
-
PE-
--
--
--
--
--
--
--
--
-
AL
--
--
--
--
-1.
400
1.42
91.
522
1.50
01.
500
--
--
SE-
--
--
--
--
--
--
--
--
-
BA-
--
1.15
81.
583
333
900
1.30
01.
200
1.30
085
01.
500
1.55
070
02.
000
1.50
01.
555
2.00
0Ce
ntro
-Oes
te
(Cen
tral
Wes
t)1.
429
968
1.52
81.
657
1.67
91.
787
1.90
51.
788
1.96
41.
787
2.02
71.
994
2.13
41.
707
2.26
32.
227
2.22
82.
334
MT
1.45
21.
333
1.36
81.
670
1.79
71.
850
1.91
22.
000
2.08
02.
100
2.17
02.
000
2.16
01.
930
2.37
02.
400
2.45
02.
490
MS
-95
51.
482
1.60
01.
740
1.76
51.
900
1.78
51.
960
1.54
01.
950
2.07
02.
200
1.60
02.
270
1.99
02.
090
2.20
0
GO
1.32
41.
010
1.75
81.
820
1.45
91.
800
1.90
01.
615
1.83
51.
825
1.90
01.
857
2.00
01.
500
2.10
02.
200
2.00
02.
190
DF
--
-2.
100
1.66
71.
900
2.10
01.
857
2.02
91.
717
2.05
52.
000
2.17
91.
488
2.35
02.
265
2.00
02.
233
Sude
ste
(Sou
thea
st)
1.65
11.
314
1.56
71.
838
1.79
71.
856
1.96
51.
722
1.96
41.
863
1.96
71.
965
2.15
01.
582
1.98
62.
079
2.13
42.
127
MG
1.11
81.
223
1.65
01.
700
1.50
01.
700
1.80
01.
600
1.98
01.
810
1.93
01.
975
2.03
01.
500
2.04
02.
200
2.10
02.
057
ES-
--
--
--
--
--
--
--
--
-
RJ-
--
--
--
--
--
--
--
--
-
SP1.
753
1.33
31.
551
1.87
51.
901
1.92
42.
055
1.80
01.
950
1.91
02.
000
1.95
52.
270
1.66
51.
935
1.96
02.
170
2.20
0
Sul (
Sout
h)1.
776
1.26
91.
192
1.69
31.
799
1.44
41.
651
1.63
11.
721
1.09
11.
771
1.48
61.
831
1.85
71.
124
1.92
52.
142
2.08
6
PR2.
091
1.34
11.
723
2.24
02.
230
1.94
02.
110
1.87
02.
050
1.20
02.
170
2.22
02.
100
2.00
01.
840
1.90
02.
360
2.52
5
SC1.
368
1.07
689
61.
400
1.34
91.
155
1.05
01.
370
1.34
01.
250
1.30
01.
420
1.45
01.
540
833
1.80
01.
820
2.00
0
RS1.
619
1.24
691
11.
400
1.59
51.
180
1.45
81.
515
1.57
01.
000
1.60
01.
040
1.70
01.
800
720
1.95
02.
030
1.80
0N
orte
/Nor
dest
e (N
orth
/Nor
thea
st)
--
-1.
158
1.58
333
390
01.
300
1.15
91.
321
869
1.54
01.
597
751
1.99
31.
486
1.62
32.
024
Cent
ro-S
ul
(Cen
ter-S
outh
)1.
748
1.25
01.
251
1.70
01.
781
1.53
61.
728
1.67
51.
813
1.37
01.
871
1.69
71.
968
1.77
81.
568
2.04
82.
173
2.18
6
Bras
il (B
razi
l)1.
748
1.25
01.
251
1.70
01.
781
1.53
61.
728
1.67
41.
808
1.36
91.
851
1.69
31.
953
1.74
01.
580
2.02
72.
150
2.17
9
Font
e (S
ourc
e): M
apa/
Con
ab.

Ministério da Agricultura, Pecuária e Abastecimento180
Tab
ela
113
– Pr
od
uti
vid
ade
de
soja
no
Bra
sil n
o p
erío
do
de
1995
a 2
012,
em
kg
/ha
Tabl
e 11
3 –
Soyb
ean
prod
uctiv
ity in
Bra
zil b
etw
een
1995
to
2012
, in
kg/h
a
Regi
ão/U
F (R
egio
n/St
ate
)19
94/9
519
95/9
619
96/9
719
97/9
819
98/9
919
99/2
000
2000
/01
2001
/02
2002
/03
2003
/04
2004
/05
2005
/06
2006
/07
2007
/08
2008
/09
2009
/10
2010
/11
2011
/12
Nor
te (N
orth
)2.
126
2.11
91.
135
2.10
52.
444
2.50
72.
362
2.60
42.
659
2.59
32.
721
2.47
32.
630
2.84
52.
841
2.86
63.
063
3.07
6,0
RR-
2.70
0-
--
2.80
02.
400
2.40
02.
800
2.80
02.
800
3.25
02.
800
3.06
02.
800
2.80
0,0
RO2.
700
-2.
700
3.00
03.
000
3.00
03.
060
2.97
23.
000
2.99
03.
054
2.66
03.
070
3.12
23.
080
3.14
63.
215
3.20
4,0
AC
--
--
--
--
--
--
--
-A
M-
--
--
2.57
12.
571
2.57
13.
000
3.00
0-
--
--
-A
P-
--
--
--
--
--
--
--
PA-
--
2.11
52.
038
2.12
02.
100
2.52
02.
850
2.70
03.
000
2.98
72.
990
2.82
82.
890
2.89
53.
000
2.87
2,0
TO1.
957
1.90
090
02.
000
2.34
02.
420
2.10
02.
500
2.55
02.
490
2.59
02.
263
2.41
52.
747
2.75
02.
766
3.03
23.
085,
0N
orde
ste
(Nor
thea
st)
2.20
11.
732
2.18
92.
142
2.08
32.
425
2.15
71.
888
2.03
12.
674
2.74
12.
395
2.65
83.
057
2.58
82.
839
3.21
33.
024,
0
MA
1.85
02.
240
2.10
02.
100
2.40
02.
500
2.30
02.
390
2.39
02.
698
2.66
02.
680
2.82
02.
996
2.51
72.
786
3.08
73.
052,
0PI
1.85
02.
250
2.00
01.
995
2.30
02.
500
2.30
01.
050
2.65
02.
490
2.81
32.
347
2.21
23.
231
2.81
52.
777
2.98
33.
048,
0CE
--
--
--
--
--
--
--
-RN
--
--
--
--
--
--
--
-PB
--
--
--
--
--
--
--
-PE
--
--
--
--
--
--
--
-A
L-
--
--
--
--
--
--
--
SE-
--
--
--
--
--
--
--
BA2.
280
1.61
52.
220
2.16
01.
983
2.40
02.
100
1.83
01.
830
2.70
02.
760
2.28
22.
700
3.03
62.
552
2.88
03.
360
3.00
0,0
Cent
ro-O
este
(C
entr
al W
est)
2.21
22.
394
2.62
02.
547
2.69
52.
813
2.95
22.
940
2.92
42.
548
2.66
92.
590
2.91
03.
022
2.94
33.
044
3.13
73.
049,
0
MT
2.37
02.
460
2.73
02.
750
2.80
03.
030
3.09
03.
045
2.93
02.
864
2.93
82.
695
2.99
73.
145
3.08
23.
036
3.19
03.
120,
0M
S2.
210
2.42
02.
500
2.10
02.
600
2.26
02.
940
2.75
02.
900
1.85
01.
902
2.28
02.
810
2.63
92.
436
3.05
02.
937
2.55
0,0
GO
1.90
02.
250
2.50
02.
520
2.58
02.
800
2.70
02.
850
2.93
02.
390
2.62
42.
570
2.79
03.
002
2.96
33.
060
3.14
03.
200,
0D
F1.
944
1.94
52.
400
2.42
02.
243
2.76
52.
100
2.69
02.
770
2.67
03.
198
2.69
92.
712
3.15
03.
200
3.00
03.
200
3.20
0,0
Sude
ste
(Sou
thea
st)
2.03
32.
084
2.27
62.
206
2.51
22.
229
2.45
22.
714
2.73
22.
449
2.51
22.
409
2.72
72.
853
2.77
82.
891
2.82
42.
880,
0
MG
1.98
01.
970
2.25
02.
300
2.31
52.
350
2.33
02.
710
2.67
02.
495
2.70
02.
340
2.76
02.
916
2.96
12.
965
2.84
52.
981,
0ES
--
--
--
--
--
--
--
--
--
RJ-
--
--
--
--
--
--
--
--
-SP
2.09
02.
190
2.30
02.
100
2.73
02.
100
2.60
02.
720
2.82
02.
385
2.24
02.
520
2.67
02.
750
2.45
92.
760
2.78
82.
716,
0Su
l (So
uth)
2.27
12.
086
2.09
42.
314
2.11
12.
085
2.71
82.
294
2.85
01.
979
1.53
82.
200
2.78
22.
519
2.22
32.
801
3.12
42.
028,
0PR
2.61
02.
700
2.63
02.
550
2.78
92.
517
3.06
02.
887
3.01
62.
550
2.34
02.
422
2.99
52.
991
2.33
73.
140
3.36
02.
429,
0SC
2.18
02.
200
2.33
02.
350
2.00
02.
494
2.69
02.
265
2.88
72.
139
1.84
02.
400
2.93
02.
535
2.53
02.
950
3.25
02.
471,
0RS
2.04
01.
570
1.62
02.
100
1.52
01.
650
2.39
51.
705
2.68
01.
400
698
1.96
02.
550
2.02
82.
070
2.40
02.
845
1.55
5,0
Nor
te/N
orde
ste
(Nor
th/N
orth
east
)2.
199
1.73
72.
146
2.14
02.
105
2.43
22.
174
1.96
82.
121
2.65
72.
736
2.41
52.
652
3.00
42.
648
2.84
53.
176
3.03
7,0
Cent
ro-S
ul
(Cen
ter-S
outh
)2.
222
2.19
82.
307
2.39
92.
385
2.41
32.
798
2.62
82.
875
2.30
22.
200
2.41
92.
840
2.79
52.
627
2.92
93.
108
2.61
8,0
Bras
il (B
razi
l)2.
221
2.17
52.
299
2.38
42.
367
2.41
42.
751
2.57
72.
816
2.32
92.
245
2.41
92.
823
2.81
62.
629
2.92
03.
115
2.66
5,0
Font
e (S
ourc
e): M
apa/
Con
ab.

Anuário Estatístico da Agroenergia – 2012 181
4.1.4 Importação, exportação, processamento e estoque de grão e óleo4.1.4 Import, export, crush and stocks of grain and oil
Tabela 114 – Exportação, importação, processamento e estoque de soja no Brasil, em milhões de toneladasTable 114 – Soybean exports, imports, crush and stocks in Brazil, in million tons
Safras Harvests
Millhões de toneladas Million tons
ProduçãoProduction
ImportaçãoImports
ExportaçãoExports
ProcessamentoCrush
EstoquesStocks
2002/03 52,02 1,30 21,30 27,17 16,042003/04 49,79 0,43 20,30 29,32 15,512004/05 51,45 0,49 20,21 29,25 16,812005/06 55,03 0,07 26,14 28,29 16,642006/07 58,39 0,05 23,66 31,11 18,192007/08 60,02 0,14 25,32 32,11 19,102008/09 57,17 0,05 30,02 31,87 12,292009/10 68,69 0,18 28,40 33,70 16,292010/11 75,32 0,03 29,16 35,93 22,942011/12* 66,68 0,02 7,89 36,00 13,18
Fonte (Source): Mapa; MDIC; USDA.Elaboração (Elaboration): Mapa/SPAE.Nota: *Dados de importação e exportação são do periodo de setembro a abril.
* Imports and export data are from the period of september to april.NCM: 1201.00.10 e 1201.00.90
Tabela 115 – Exportação, importação, consumo e estoque de óleo de soja no Brasil, em milhões de toneladasTable 115 – Soybean oil exports, imports, consumption and stocks in Brazil, in million tons
Safras Harvests
Millhões de toneladas Million tons
ProduçãoProduction
ImportaçãoImports
ExportaçãoExports
ConsumoConsumption
EstoquesStocks
2002/03 5,21 0,08 2,71 2,92 0,422003/04 5,88 0,03 2,69 2,95 0,372004/05 5,65 0,00 2,49 3,09 0,522005/06 5,43 0,03 2,45 3,11 0,392006/07 5,97 0,01 2,44 3,40 0,512007/08 6,16 0,07 2,35 3,96 0,292008/09 6,12 0,00 2,05 4,28 0,242009/10 6,47 0,04 1,43 5,01 0,282010/11 6,90 0,00 1,60 5,27 0,252011/12* 6,91 0,00 1,12 5,45 0,14
Fonte (Source): Mapa; MDIC; USDA.Elaboração (Elaboration): Mapa/SPAE.Nota: *Dados de importação e exportação são do período de setembro a abril.
* Imports and export data are from the period of september to april.NCM: 1507.10.00, 1507.90.11, 1507.90.19 e 1507.90.90

Ministério da Agricultura, Pecuária e Abastecimento182
Gráfico 83 – Exportação, importação, processamento e estoque de soja no Brasil, em milhões de toneladasChart 83 – Soybean exports, imports, crush and stocks in Brazil, in million tons
0
10
20
30
40
50
60
70
80
2002
/03
2003
/04
2004
/05
2005
/06
2006
/07
2007
/08
2008
/09
2009
/10
2010
/11
2011
/12*
Milh
ões
de
ton
elad
as
Mill
ion
s to
ns
Safras / Harvests
Produção (Production) Importação (Imports) Exportação (Exports)
Processamento (Crush) Estoques (Stocks)
Gráfico 84 – Exportação, importação, consumo e estoque de óleo de soja no Brasil, em milhões de toneladasChart 84 – Soybean oil exports, imports, consumption and stocks in Brazil, in million tons
0
1
2
3
4
5
6
7
8
2002
/03
2003
/04
2004
/05
2005
/06
2006
/07
2007
/08
2008
/09
2009
/10
2010
/11
2011
/12*
Milh
ões
de
ton
elad
as
Mill
ion
s to
ns
Safras / Harvests
Produção (Production) Importação (Imports) Exportação (Exports)
Consumo (Consumption) Estoques (Stocks)

Anuário Estatístico da Agroenergia – 2012 183
4.2 Palma de óleo/dendê 4.2 Palm Oil
4.2.1 Informações técnicas4.2.1 Technical information
Tabela 116 – Informações técnicas da cultura da palmaTable 116 – Technical information of palm oil crop
ItemItem
DadoData
Ciclo (Cycle) 25 anos (years)
Teor de óleo no cacho (Bunch oil content) 22%
Produtividade média de cacho (Bunch average productivity)
10.000 kg/ha (3.000 - 25.000)
Rendimento em óleo (Oil yield) 4.000 kg/ha (2.000 - 8.000)
Cultivares Registrados no Mapa (Registered Cultivars in Mapa)
21 (Elaeis guineensis Jacq)
2 (Elaeis guineensis Jacq. x Elaeis oleifera )
1 (Elaeis oleifera)
Defensivos registrados no Mapa (Registered pesticides in Mapa)
3
Poder calorífico do óleo in natura (Oil calorific value)
8.946 kcal/kg
Poder calorífico do biocombustível (Biofuel calorific value)
9.530 kcal/kg
Balanço energético do biocombustível (Biofuel energy balance)
1 : 8,60
Fonte (Source): Mapa/SPAE.

Ministério da Agricultura, Pecuária e Abastecimento184
4.2.2 Produção mundial4.2.2 World production
Tabela 117 – Principais países produtores de óleo de palma, em milhões de toneladasTable 117 – Main palm oil producing countries, in million tons
2002/03 2003/04 2004/05 2005/06 2006/07 2007/08 2008/09 2009/10 2010/11 2011/12
Indonésia (Indonesia)
10,30 11,97 13,56 15,56 16,60 18,00 20,50 22,00 23,60 25,40
Malásia (Malaysia)
13,18 13,42 15,19 15,49 15,29 17,57 17,26 17,76 18,21 18,70
Tailândia (Thailand)
0,64 0,84 0,82 0,78 1,17 1,05 1,54 1,35 1,29 1,55
Nigéria (Nigeria)
0,54 0,61 0,65 0,69 0,77 0,82 0,85 0,85 0,85 0,85
Colômbia (Colombia)
0,77 0,78 0,79 0,80 0,81 0,83 0,76 0,77 0,78 0,89
Demais países (Other countries)
2,28 2,38 2,51 2,66 2,70 2,68 2,94 3,13 3,22 3,29
Mundo (World)
27,71 30,00 33,52 35,98 37,34 40,95 43,85 45,86 47,95 50,67
Fonte (Source): USDA; Mapa.
Gráfico 85 – Principais países produtores de óleo de palma, em milhões de toneladasChart 85 – Main palm oil producing countries, in million tons
0
10
20
30
40
50
60
2002
/03
2003
/04
2004
/05
2005
/06
2006
/07
2007
/08
2008
/09
2009
/10
2010
/11
2011
/12
Pro
du
ção
(m
ilhõ
es d
e to
nel
adas
) Pr
od
uct
ion
(m
illio
ns
ton
s)
Safras / Harvests
Demais países (Other countries) Colômbia (Colombia) Nigéria (Nigeria) Tailândia (Thailand) Malásia (Malaysia) Indonésia (Indonesia)

Anuário Estatístico da Agroenergia – 2012 185
4.2.3 Produção nacional4.2.3 National production
Tabela 118 – Série histórica da produção, produtividade e área plantada de palma e óleo de palma no BrasilTable 118 – Palm oil production, productivity and land used in Brazil
AnoYear
Produção em cacho (mil toneladas)
Bunch production (thousand tons)
Área plantadaPlanted area
Produtividade em cacho (t/ha)Bunch productivity
(ton/ha)
Produção de óleo
(mil toneladas)Oil production (thousand tons)
Produtividade de óleo (t/ha)Oil productivity
(ton/ha)
Área em formação
(mil hectares)Formation land (thousand ha)
Área em produção
(mil hectares)Production land (thousand ha)
Área total (mil hectares)Total land used (thousand ha)
1961 20 - - 2,0 10 4,4 2,2
1962 25 - - 2,3 11 5,5 2,4
1963 27 - - 2,4 11 5,9 2,5
1964 32 - - 2,9 11 7,0 2,4
1965 42 - - 4,0 11 9,2 2,3
1966 55 - - 5,2 11 12,1 2,3
1967 49 - - 4,6 11 10,8 2,3
1968 51 - - 4,9 10 11,2 2,3
1969 58 - - 5,5 11 12,8 2,3
1970 23 - - 2,2 10 5,1 2,3
1971 26 - - 2,5 10 5,7 2,3
1972 27 - - 2,7 10 5,9 2,2
1973 30 - - 2,9 10 6,6 2,3
1974 32 - - 3,1 10 7,0 2,3
1975 35 - - 3,3 11 7,7 2,3
1976 45 - - 4,3 10 9,9 2,3
1977 60 - - 5,7 11 13,2 2,3
1978 75 - - 7,1 11 16,5 2,3
1979 80 - - 7,6 11 17,6 2,3
1980 60 - - 5,7 11 13,2 2,3
1981 70 - - 6,6 11 15,4 2,3
1982 80 - - 7,6 11 17,6 2,3
1983 90 - - 8,6 10 19,8 2,3
1984 115 - - 11,0 10 25,3 2,3
1985 145 - - 13,5 11 31,9 2,4
1986 155 - - 14,5 11 34,1 2,4
1987 195 - - 18,0 11 42,9 2,4
1988 230 - - 21,0 11 50,6 2,4
1989 268 - - 25,0 10 59,0 2,2
1990 328 - - 33,0 10 72,2 2,2
1991 331 - - 33,0 10 72,8 2,2
1992 306 - - 31,0 10 67,3 2,2
1993 231 - - 23,0 10 50,8 2,2
1994 308 - - 31,0 10 67,8 2,2
1995 328 - - 33,0 10 72,2 2,2
1996 352 - - 36,0 10 77,4 2,2
(Continua / Continues)

Ministério da Agricultura, Pecuária e Abastecimento186
AnoYear
Produção em cacho (mil toneladas)
Bunch production (thousand tons)
Área plantadaPlanted area
Produtividade em cacho (t/ha)Bunch productivity
(ton/ha)
Produção de óleo
(mil toneladas)Oil production (thousand tons)
Produtividade de óleo (t/ha)Oil productivity
(ton/ha)
Área em formação
(mil hectares)Formation land (thousand ha)
Área em produção
(mil hectares)Production land (thousand ha)
Área total (mil hectares)Total land used (thousand ha)
1997 360 - - 36,0 10 79,2 2,1
1998 380 - - 38,0 10 83,6 2,2
1999 400 - - 40,0 10 88,0 2,2
2000 450 - - 45,0 10 99,0 2,2
2001 460 - - 45,0 10 101,2 2,2
2002 450 - - 45,0 10 99,0 2,2
2003 516 - - 51,6 10 113,5 2,2
2004 550 - - 55,0 10 121,0 2,2
2005 560 - - 56,0 10 123,2 2,2
2006 590 - - 59,0 10 129,8 2,3
2007 660 - - 66,0 10 145,2 2,3
2008 759 - - 76,0 10 167,0 2,2
2009 914 - - 91,0 10 201,1 2,3
2010* 1130 43 69 112,5 16 248,6 3,6
Fonte (Source): Mapa; FAO; Conab - dados estimados (estimated data).Elaboração (Elaboration): Mapa/SPAE.Nota: * A partir de 2010, dados coletados pela Conab
* Since the 2010, data collected by Conab
Gráfico 86 – Séria histórica da produção de cachos de palma no Brasil, em mil toneladasChart 86 – Palm oil bunch production in Brazil, in thousand tons
0
200
400
600
800
1.000
1.200
196
1
196
3
196
5
196
7
196
9
197
1
197
3
197
5
197
7
197
9
198
1
198
3
198
5
198
7
198
9
199
1
199
3
199
5
199
7
199
9
200
1
200
3
200
5
200
7
200
9
Pro
du
ção
de
cach
os
(mil
ton
elad
as)
Bu
nch
pro
du
ctio
n (
tho
usa
nd
to
ns)
Anos / Years
(Continuação / Continued)

Anuário Estatístico da Agroenergia – 2012 187
Gráfico 87 – Séria histórica da produção de óleo de palma no Brasil, em mil toneladasChart 87 – Palm oil production in Brazil, in thousand tons
0
50
100
150
200
250
300
196
1
196
4
196
7
197
0
197
3
197
6
197
9
198
2
198
5
198
8
199
1
199
4
199
7
200
0
200
3
200
6
200
9
Pro
du
ção
de
óle
o (
mil
ton
elad
as)
Oil
pro
du
ctio
n (
tho
usa
nd
to
ns)
Anos / Years
Gráfico 88 – Série histórica da área plantada de palma no Brasil, em mil hectaresChart 88 – Palm oil planted area in Brazil, in thousand hectares
0
20
40
60
80
100
120
196
1
196
4
196
7
197
0
197
3
197
6
197
9
198
2
198
5
198
8
199
1
199
4
199
7
200
0
200
3
200
6
200
9
Áre
a (m
il h
ecta
res)
Are
a (t
ho
usa
nd
s h
ecta
res)
Anos / Years

Ministério da Agricultura, Pecuária e Abastecimento188
Gráfico 89 – Série histórica da produtividade de óleo de palma no Brasil, em t/haChart 89 – Palm oil productivity in Brazil, in ton/ha
2
2,2
2,4
2,6
2,8
3
3,2
3,4
3,6
3,8
196
1
196
3
196
5
196
7
196
9
197
1
197
3
197
5
197
7
197
9
198
1
198
3
198
5
198
7
198
9
199
1
199
3
199
5
199
7
199
9
200
1
200
3
200
5
200
7
200
9
Pro
du
tivi
dad
e d
e ó
leo
(t/
ha)
O
il p
rod
uct
ivit
y (t
on
/ha)
Anos / Years
Gráfico 90 – Série histórica da produtividade de cacho de palma no Brasil, em t/haChart 90 – Palm oil bunch productivity in Brazil, in ton/ha
9
10
11
12
13
14
15
16
17
196
1
196
3
196
5
196
7
196
9
197
1
197
3
197
5
197
7
197
9
198
1
198
3
198
5
198
7
198
9
199
1
199
3
199
5
199
7
199
9
200
1
200
3
200
5
200
7
200
9
Pro
du
tivi
dad
e d
e ca
cho
(t/
ha)
B
un
ch p
rod
uct
ivit
y (t
on
/ha)
Anos / Years

Anuário Estatístico da Agroenergia – 2012 189
4.2.4 Importação, exportação e consumo de óleo de palma e palmiste4.2.4 Import, export and consumption of palm oil and palm kernel
Tabela 119 – Exportação, importação e consumo de óleo de palma no Brasil, em mil toneladasTable 119 – Palm oil exports, imports and consumption in Brazil, in thousand tons
Anos Years
Mil toneladas Thousand tons
ProduçãoProduction
ImportaçãoImports
ExportaçãoExports
ConsumoConsumption
2002 99,0 9,3 7,3 101,02003 113,5 24,4 0,6 137,32004 121,0 21,1 13,7 128,42005 123,2 39,3 44,9 117,62006 129,8 86,7 24,7 191,82007 145,2 98,6 2,4 241,42008 167,0 158,4 9,0 316,42009 201,1 128,3 24,6 304,82010 248,6 155,8 16,5 387,92011 - 214,5 46,5 167,9
Fonte (Source): Mapa; MDIC; FAO.Elaboração (Elaboration): Mapa/SPAE.NCM 1511.10.00 e 1511.90.00
Gráfico 91 – Exportação, importação e consumo de óleo de palma no Brasil, em mil toneladasChart 91 – Palm oil exports, imports and consumption in Brazil, in thousand tons
0
50
100
150
200
250
300
350
400
450
2002 2003 2004 2005 2006 2007 2008 2009 2010 2011
Óle
o d
e p
alm
a (m
il to
nel
adas
)
Palm
oil
(th
ou
san
d t
on
s)
Anos / Years
Produção (Production) Importação (Imports)
Exportação (Exports) Consumo (Consumption)

Ministério da Agricultura, Pecuária e Abastecimento190
Tabela 120 – Produção, exportação, importação e consumo de óleo de palmiste no Brasil, em mil toneladasTable 120 – Palm kernel oil production, exports, imports and consumption in Brazil, in thousand tons
Anos Years
Mil toneladas Thousand tons
ProduçãoProduction
ImportaçãoImports
ExportaçãoExports
ConsumoConsumption
2002 6,8 36,0 0,0 42,72003 7,7 30,8 0,0 38,52004 8,3 31,6 0,1 39,72005 8,4 41,9 0,1 50,22006 8,9 60,3 0,2 69,02007 9,9 87,8 0,4 97,32008 11,4 103,8 0,4 114,82009 13,7 132,0 0,3 145,42010 17,0 176,8 0,8 193,02011 - 155,5 5,7 149,8
Fonte (Source): Mapa; MDIC; FAO.Elaboração (Elaboration): Mapa/SPAE.NCM 1513.21.10 e 1513.29.10
Gráfico 92 – Produção, exportação, importação e consumo de óleo de palmiste no Brasil, em mil toneladasChart 92 – Palm kernel oil production, exports, imports and consumption in Brazil, in thousand tons
Produção (Production) Importação (Imports)
Exportação (Exports) Consumo (Consumption)
0
50
100
150
200
250
2002 2003 2004 2005 2006 2007 2008 2009 2010 2011
Óle
o d
e p
alm
iste
(m
il to
nel
adas
)
Palm
ker
nel
oil
(th
ou
san
d t
on
s)
Anos / Years

Anuário Estatístico da Agroenergia – 2012 191
Tabela 121 – Produção, exportação, importação e consumo de óleo de palma e palmiste no Brasil, em mil toneladasTable 121 – Palm oil and palm kernel oil production, exports, imports and consumption in Brazil, in thousand tons
Anos Years
Mil toneladas Thousand tons
ProduçãoProduction
ImportaçãoImports
ExportaçãoExports
ConsumoConsumption
2002 105,8 45,3 7,4 143,72003 121,3 55,2 0,7 175,82004 129,3 52,7 13,8 168,22005 131,6 81,2 45,0 167,82006 138,7 147,0 24,9 260,82007 155,1 186,4 2,8 338,72008 178,4 262,2 9,4 431,22009 214,8 260,3 24,9 450,22010 265,6 332,6 17,3 580,92011 - 369,9 52,2 317,7
Fonte (Source): Mapa; MDIC; FAO.Elaboração (Elaboration): Mapa/SPAE.NCM 1511.10.90, 1511.90.00, 1513.21.10 e 1513.29.10
Gráfico 93 – Produção, exportação, importação e consumo de óleo de palma e palmiste no Brasil, em mil toneladasChart 93 – Palm oil and palm kernel oil production, exports, imports and consumption in Brazil, in thousand tons
Produção (Production) Importação (Imports)
Exportação (Exports) Consumo (Consumption)
0
100
200
300
400
500
600
700
2002 2003 2004 2005 2006 2007 2008 2009 2010 2011 Óle
o d
e p
alm
a e
pal
mis
te (
mil
ton
elad
as)
Palm
oil
and
pal
m k
ern
el o
il (t
ho
usa
nd
to
ns)
Anos / Years

Ministério da Agricultura, Pecuária e Abastecimento192
4.3 Girassol4.3 Sunflower4.3.1 Informações técnicas4.3.1 Technical information
Tabela 122 – Informações técnicas da cultura de girassolTable 122 – Technical information of sunflower crop
ItemItem
VerãoSummer harvest
SafrinhaWinter harvest
Ciclo (Cycle) 90 - 140 dias/days (65 - 165) 90 - 140 dias/days (65 - 165)Teor de óleo no grão (aquênio) (Grain oil content)
42% - 45% (40 - 47) 42% - 45% (40 - 47)
Teor de farelo (Grain meal content)
53% - 60% 53% - 60%
Produtividade média em grãos (Gain average productivity)
1.800kg/ha (1.500 - 2.800) 1.300kg/ha (1.000 - 1.800)
Rendimento em farelo (Meal yield)
990 kg/ha 715 kg/ha
Rendimento em óleo (Oil yield) 774 kg/ha 559 kg/haCultivares registrados no Mapa (Registered cultivars in Mapa)
217 (Helianthus annuus L.)1 (Helianthus debilis Nutt.)
Defensivos registrados no Mapa (Registered pesticides in Mapa)
17
Balanço energético do biocombustível (Biofuel energy balance)
1 : 2,37
Fonte (Source): Mapa.

Anuário Estatístico da Agroenergia – 2012 193
4.3.
2 Pr
od
uçã
o m
un
dia
l4.
3.2
Wor
ld p
rodu
ctio
n
Tab
ela
123
– Pr
inci
pai
s p
aíse
s p
rod
uto
res
de
gir
asso
l, e
m m
ilh
ões
de
ton
elad
asTa
ble
123
– M
ain
sunfl
ower
pro
duci
ng c
ount
ries,
in m
illio
n to
ns
1998
/99
1999
/00
2000
/01
2001
/02
2002
/03
2003
/04
2004
/05
2005
/06
2006
/07
2007
/08
2008
/09
2009
/10
2010
/11
2011
/12
Ucr
ânia
(U
krai
ne)
2,27
2,72
3,46
2,25
3,27
4,25
3,05
4,70
5,30
4,20
7,00
6,36
8,40
9,50
Rú
ssia
(R
ussi
a)3,
004,
153,
922,
673,
694,
854,
806,
456,
755,
657,
356,
435,
359,
63
Arg
enti
na
(Arg
entin
a)7,
106,
003,
053,
843,
703,
243,
603,
803,
504,
652,
442,
303,
673,
40
Ch
ina
(Chi
na)
0,93
1,80
1,95
1,48
1,95
1,74
1,55
1,93
1,50
1,25
1,79
1,96
2,30
2,15
Fran
ça (F
ranc
e)1,
681,
921,
811,
581,
501,
491,
461,
521,
391,
311,
581,
701,
641,
89EU
A (U
SA)
2,39
1,97
1,61
1,55
1,11
1,21
0,93
1,82
0,97
1,30
1,55
1,38
1,24
0,93
Dem
ais
país
es
(Oth
er c
ount
ries)
8,76
8,60
7,49
8,04
8,72
9,93
9,91
9,77
10,4
08,
6611
,56
10,2
610
,69
11,6
0
Mu
nd
o
(Wor
ld)
26,1
327
,16
23,2
921
,41
23,9
426
,71
25,3
029
,99
29,8
127
,02
33,2
730
,39
33,2
939
,10
Font
e (S
ourc
e): U
SDA

Ministério da Agricultura, Pecuária e Abastecimento194
Gráfico 94 – Principais países produtores de girassol, em milhões de toneladasChart 94 – Main sunflower producing countries, in million tons
0
5
10
15
20
25
30
35
40
45
1998
/99
1999
/00
2000
/01
2001
/02
2002
/03
2003
/04
2004
/05
2005
/06
2006
/07
2007
/08
2008
/09
2009
/10
2010
/11
2011
/12
Pro
du
ção
(m
ilhõ
es d
e to
nel
adas
) P
rod
uct
ion
(m
illio
n t
on
s)
Safras / Harvest
Demais países (Other countries)
EUA (USA)
França (France)
China (China)
Argentina (Argentina) Rússia (Russia)
Ucrânia (Ukraine)
Tabela 124 – Produção mundial de óleo de girassol, em milhões de toneladasTable 124 – World sunflower oil production, in million tons
SafrasHarvests
Produção de óleo (milhões de toneladas)Oil production (million tons)
1998/99 9,181999/00 9,632000/01 8,432001/02 7,422002/03 8,122003/04 9,132004/05 9,182005/06 10,572006/07 10,612007/08 9,932008/09 11,842009/10 11,662010/11 12,212011/12 14,15
Fonte (Source): USDA.

Anuário Estatístico da Agroenergia – 2012 195
Gráfico 95 – Produção mundial de óleo de girassol, em milhões de toneladasChart 95 – World sunflower oil production, in million tons
0
2
4
6
8
10
12
14
16
1998
/99
1999
/00
2000
/01
2001
/02
2002
/03
2003
/04
2004
/05
2005
/06
2006
/07
2007
/08
2008
/09
2009
/10
2010
/11
2011
/12
Pro
du
ção
de
óle
o (
milh
ões
de
ton
elad
as)
Oil
pro
du
ctio
n (
mill
ion
to
ns)
Safras / Harvest
4.3.3 Produção nacional4.3.3 National production
Tabela 125 – Série histórica da produção, área plantada e produtividade de girassol no BrasilTable 125 – Sunflower production, planted area and productivity in Brazil
SafrasHarvests
Produção (mil toneladas)
Production (thousand tons)
Área plantada (mil ha)
Planted area (thousand ha)
Produtividade (kg/ha)
Productivity (kg/ha)1997/98 15,8 12,4 1.2741998/99 49,0 44,3 1.1061999/00 97,4 58,0 1.6792000/01 56,3 37,0 1.5222001/02 71,0 52,6 1.3502002/03 56,4 43,2 1.3062003/04 85,4 55,1 1.5572004/05 68,1 50,1 1.3592005/06 93,6 66,9 1.3992006/07 106,1 75,4 1.4052007/08 147,1 111,3 1.3232008/09 109,4 75,0 1.4602009/10 80,6 71,0 1.1372010/11 83,1 66,4 1.2502011/12 112,8 75,5 1.494
Fonte (Source): Mapa/Conab.
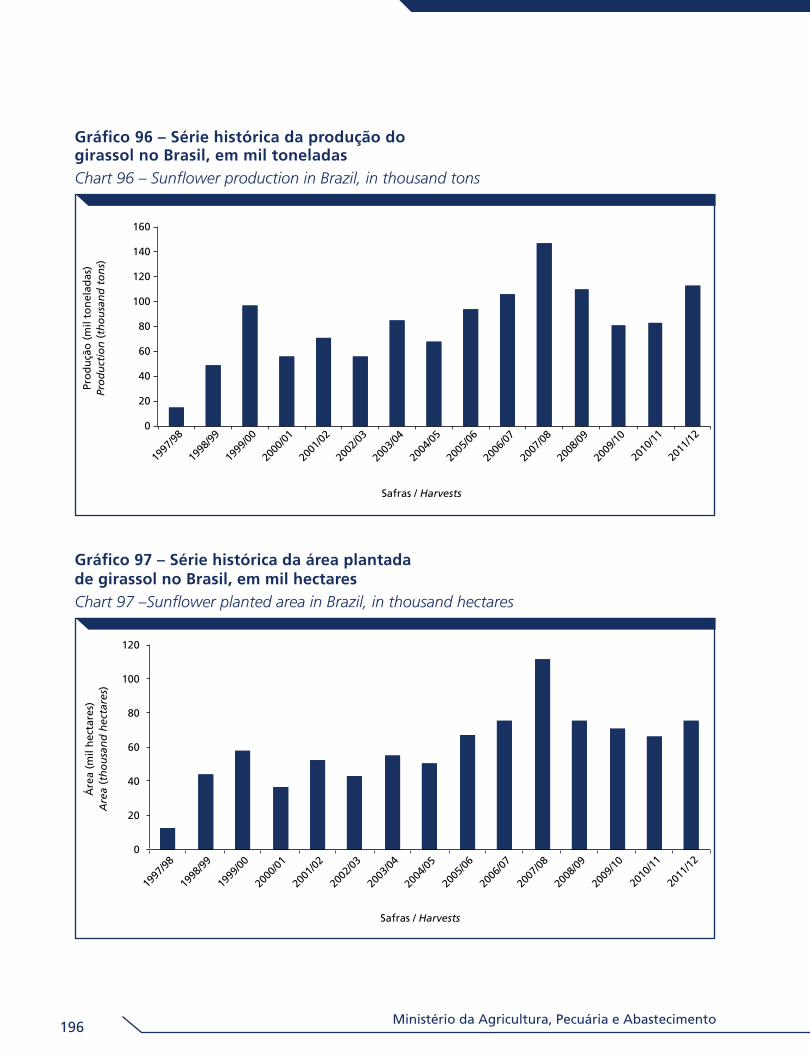
Ministério da Agricultura, Pecuária e Abastecimento196
Gráfico 96 – Série histórica da produção do girassol no Brasil, em mil toneladasChart 96 – Sunflower production in Brazil, in thousand tons
0
20
40
60
80
100
120
140
160
1997
/98
1998
/99
1999
/00
2000
/01
2001
/02
2002
/03
2003
/04
2004
/05
2005
/06
2006
/07
2007
/08
2008
/09
2009
/10
2010
/11
2011
/12
Pro
du
ção
(m
il to
nel
adas
) Pr
od
uct
ion
(th
ou
san
d t
on
s)
Safras / Harvests
Gráfico 97 – Série histórica da área plantada de girassol no Brasil, em mil hectaresChart 97 –Sunflower planted area in Brazil, in thousand hectares
0
20
40
60
80
100
120
1997
/98
1998
/99
1999
/00
2000
/01
2001
/02
2002
/03
2003
/04
2004
/05
2005
/06
2006
/07
2007
/08
2008
/09
2009
/10
2010
/11
2011
/12
Áre
a (m
il h
ecta
res)
A
rea
(th
ou
san
d h
ecta
res)
Safras / Harvests

Anuário Estatístico da Agroenergia – 2012 197
Gráfico 98 – Série histórica da produtividade de girassol no Brasil, em kg/haChart 98 – Sunflower productivity in Brazil, in kg/ha
1.000
1.100
1.200
1.300
1.400
1.500
1.600
1.700
1.800
1997
/98
1998
/99
1999
/00
2000
/01
2001
/02
2002
/03
2003
/04
2004
/05
2005
/06
2006
/07
2007
/08
2008
/09
2009
/10
2010
/11
2011
/12
Pro
du
tivi
dad
e (k
g/h
a)
Pro
du
ctiv
ity
(kg
/ha)
Safras / Harvests

Ministério da Agricultura, Pecuária e Abastecimento198
Tab
ela
126
– Pr
od
uçã
o d
e g
iras
sol n
o B
rasi
l no
per
íod
o d
e 19
98 a
201
2, e
m m
il to
nel
adas
Tabl
e 12
6 –
Sunfl
ower
pro
duct
ion
in B
razi
l bet
wee
n 19
98 t
o 20
12, i
n th
ousa
nd t
ons
Regi
ão/U
F
(Reg
ion/
Stat
e)
1997
/98
1998
/99
1999
/200
020
00/0
120
01/0
220
02/0
320
03/0
420
04/0
520
05/0
620
06/0
720
07/0
820
08/0
920
09/1
020
10/1
120
11/1
2
Nor
te (N
orth
)-
--
--
--
--
--
--
--
RR-
--
--
--
--
--
--
--
RO-
--
--
--
--
--
--
--
AC
--
--
--
--
--
--
--
-A
M-
--
--
--
--
--
--
--
AP
--
--
--
--
--
--
--
-PA
--
--
--
--
--
--
--
-TO
--
--
--
--
--
--
--
-N
orde
ste
(Nor
thea
st)
--
--
--
--
-0,
92,
82,
30,
91,
70,
2
MA
--
--
--
--
--
--
--
-PI
--
--
--
--
--
--
--
-CE
--
--
--
--
--
1,6
1,5
0,9
1,5
0,1
RN-
--
--
--
--
0,9
1,2
0,8
-0,
1-
PB-
--
--
--
--
--
--
--
PE-
--
--
--
--
--
--
--
AL
--
--
--
--
--
--
--
-SE
--
--
--
--
--
--
--
-BA
--
--
--
--
--
--
-0,
10,
1Ce
ntro
-Oes
te
(Cen
tral
Wes
t)12
,243
,490
,846
,361
,647
,372
,449
,258
,769
,011
4,8
75,5
63,1
64,0
101,
2
MT
3,2
4,1
4,1
3,7
3,9
4,3
15,1
24,0
27,5
29,2
81,4
67,5
41,7
49,0
75M
S2,
94,
728
,05,
710
,712
,119
,012
,918
,910
,96,
42,
65,
56,
17,
4G
O6,
134
,658
,736
,946
,630
,537
,911
,911
,928
,527
,05,
415
,98,
918
,8D
F-
--
-0,
40,
40,
40,
40,
40,
4-
--
--
Sude
ste
(Sou
thea
st)
1,5
2,7
2,7
2,8
2,6
3,0
3,0
3,8
3,3
3,3
--
-6,
46,
2
MG
--
--
--
--
--
--
-6,
46,
2ES
--
--
--
--
--
--
--
-RJ
--
--
--
--
--
--
--
-SP
1,5
2,7
2,7
2,8
2,6
3,0
3,0
3,8
3,3
3,3
--
--
-Su
l (So
uth)
2,1
2,9
3,9
7,2
6,8
6,1
10,4
15,1
31,6
32,9
29,5
31,6
16,6
11,0
5,2
PR0,
91,
71,
70,
80,
80,
80,
45,
81,
63,
61,
01,
00,
90,
30,
1SC
--
--
--
--
--
--
--
-RS
1,2
1,2
2,2
6,4
6,0
5,3
10,0
9,3
30,0
29,3
28,5
30,6
15,7
10,7
5,1
Nor
te/
Nor
dest
e (N
orth
/N
orth
east
)
--
--
--
--
-0,
92,
82,
30,
91,
70,
2
Cent
ro-S
ul
(Cen
ter-S
outh
)15
,849
,097
,456
,371
,056
,485
,868
,193
,610
5,2
144,
310
7,1
79,7
81,4
112,
6
Bras
il (B
razi
l)15
,849
,097
,456
,371
,056
,485
,868
,193
,610
6,1
147,
110
9,4
80,6
83,1
112,
8
Font
e (S
ourc
e): M
apa/
Con
ab.

Anuário Estatístico da Agroenergia – 2012 199
Tab
ela
127
– Á
rea
pla
nta
da
de
gir
asso
l no
Bra
sil n
o p
erío
do
de
1998
a 2
012,
em
mil
hec
tare
sTa
ble
127
– Su
nflow
er p
lant
ed a
rea
in B
razi
l bet
wee
n 19
98 t
o 20
12, i
n th
ousa
nd h
ecta
res
Reg
ião
/UF
(R
egio
n/St
ate)
1997
/98
1998
/99
1999
/200
020
00/0
120
01/0
220
02/0
320
03/0
420
04/0
520
05/0
620
06/0
7 20
07/0
8 20
08/0
920
09/1
020
10/1
120
11/1
2
No
rte
(Nor
th)
--
--
--
--
--
--
--
-R
R-
--
--
--
--
--
--
--
RO
--
--
--
--
--
--
--
-A
C-
--
--
--
--
--
--
--
AM
--
--
--
--
--
--
--
-A
P-
--
--
--
--
--
--
--
PA-
--
--
--
--
--
--
--
TO-
--
--
--
--
--
--
--
No
rdes
te
(Nor
thea
st)
--
--
--
--
-0,
84,
73,
51,
42,
10,
4
MA
--
--
--
--
--
--
--
-PI
--
--
--
--
--
--
--
-C
E-
--
--
--
--
-2,
31,
91,
41,
90,
3R
N-
--
--
--
--
0,8
2,4
1,6
-0,
1-
PB-
--
--
--
--
--
--
--
PE-
--
--
--
--
--
--
--
AL
--
--
--
--
--
--
--
-SE
--
--
--
--
--
--
--
-B
A-
--
--
--
--
--
--
0,1
0,1
Cen
tro
-Oes
te
(Cen
tral
Wes
t)9,
640
,453
,429
,945
,735
,545
,836
,543
,549
,187
,547
,255
,850
,866
,9
MT
2,7
3,2
3,2
2,6
2,6
3,1
9,3
16,0
17,3
22,0
60,4
41,3
40,6
39,9
50M
S1,
83,
116
,13,
88,
39,
013
,111
,718
,58,
95,
42,
43,
84,
64,
9G
O5,
134
,134
,123
,534
,523
,123
,18,
57,
417
,921
,73,
511
,46,
312
DF
--
--
0,3
0,3
0,3
0,3
0,3
0,3
--
--
-Su
des
te
(Sou
thea
st)
0,7
1,5
1,5
1,9
1,9
2,0
2,0
2,3
2,2
2,2
--
-5,
44,
8
MG
--
--
--
--
--
--
-5,
44,
8ES
--
--
--
--
--
--
--
-R
J-
--
--
--
--
--
--
--
SP0,
71,
51,
51,
91,
92,
02,
02,
32,
22,
2-
--
--
Sul (
Sout
h)2,
12,
43,
15,
25,
05,
77,
311
,321
,223
,319
,124
,313
,88,
13,
4PR
1,2
1,5
1,5
0,5
0,5
0,5
0,3
5,3
1,2
2,1
0,7
0,7
0,7
0,2
0,1
SC-
--
--
--
--
--
--
--
RS
0,9
0,9
1,6
4,7
4,5
5,2
7,0
6,0
20,0
21,2
18,4
23,6
13,1
7,9
3,3
No
rte/
No
rdes
te
(Nor
th/
Nor
thea
st)
--
--
--
--
-0,
84,
73,
51,
42,
10,
4
Cen
tro
-Su
l (C
ente
r-So
uth)
12,4
44,3
58,0
37,0
52,6
43,2
55,1
50,1
66,9
74,6
106,
671
,569
,664
,375
,1
Bra
sil (
Braz
il)12
,444
,358
,037
,052
,643
,255
,150
,166
,975
,411
1,3
75,0
71,0
66,4
75,5
Font
e (S
ourc
e): M
apa/
Con
ab.

Ministério da Agricultura, Pecuária e Abastecimento200
Tab
ela
128
– Pr
od
uti
vid
ade
de
gir
asso
l no
Bra
sil n
o p
erío
do
de
1998
a 2
012,
em
kg
/ha
Tabl
e 12
8 –
Sunfl
ower
pro
duct
ivity
in B
razi
l bet
wee
n 19
98 t
o 20
12, i
n kg
/ha
Regi
ão/U
F
(Reg
ion/
Stat
e)19
97/9
819
98/9
919
99/2
000
2000
/01
2001
/02
2002
/03
2003
/04
2004
/05
2005
/06
2006
/07
2007
/08
2008
/09
2009
/10
2010
/11
2011
/12
Nor
te (N
orth
)-
--
--
--
--
--
--
--
RR-
--
--
--
--
--
--
--
RO-
--
--
--
--
--
--
--
AC
--
--
--
--
--
--
--
-A
M-
--
--
--
--
--
--
--
AP
--
--
--
--
--
--
--
-PA
--
--
--
--
--
--
--
-TO
--
--
--
--
--
--
--
-N
orde
ste
(Nor
thea
st)
--
--
--
--
-1.
100
608
676
640
776
463
MA
--
--
--
--
--
--
--
-PI
--
--
--
--
--
--
--
-CE
--
--
--
--
--
717
815
640
788
400
RN-
--
--
--
--
1.10
050
351
273
664
2-
PB-
--
--
--
--
--
--
--
PE-
--
--
--
--
--
--
--
AL
--
--
--
--
--
--
--
-SE
--
--
--
--
--
--
--
-BA
--
--
--
--
--
--
-67
265
0Ce
ntro
-Oes
te
(Cen
tral
Wes
t)1.
271
1.07
41.
700
1.54
91.
348
1.33
21.
581
1.34
81.
349
1.40
31.
312
1.60
11.
132
1.25
91.
512
MT
1.18
51.
266
1.26
61.
418
1.50
01.
400
1.62
01.
500
1.59
01.
325
1.34
81.
635
1.02
81.
228
1.50
0M
S1.
611
1.50
31.
740
1.51
01.
290
1.34
21.
450
1.10
01.
020
1.22
01.
185
1.10
01.
450
1.31
71.
500
GO
1.19
61.
015
1.72
01.
570
1.35
01.
320
1.64
01.
400
1.61
01.
590
1.24
21.
550
1.39
51.
411
1.56
9D
F-
--
-1.
390
1.39
01.
390
1.39
01.
300
1.37
2-
--
--
Sude
ste
(Sou
thea
st)
2.14
31.
800
1.80
01.
474
1.36
81.
500
1.50
01.
652
1.50
01.
500
--
-1.
185
1.29
2
MG
--
--
--
--
--
--
1.18
51.
292
ES-
--
--
--
--
--
--
--
RJ-
--
--
--
--
--
--
--
SP2.
143
1.83
01.
830
1.47
51.
350
1.50
01.
500
1.65
21.
500
1.50
0-
--
--
Sul (
Sout
h)1.
000
1.20
81.
258
1.38
51.
360
1.07
01.
425
1.33
61.
491
1.41
01.
549
-1.
208
1.36
01.
534
PR75
01.
135
1.13
51.
500
1.50
01.
500
1.30
01.
100
1.30
01.
714
1.49
71.
371
1.31
81.
382
1.05
0SC
--
--
--
--
--
--
--
-RS
1.33
31.
350
1.40
01.
360
1.33
71.
020
1.43
01.
550
1.50
01.
380
1.55
11.
296
1.20
21.
359
1.54
9N
orte
/N
orde
ste
(Nor
th/
Nor
thea
st)
--
--
--
--
-1.
100
608
676
640
776
463
Cent
ro-S
ul
(Cen
ter-S
outh
)1.
274
1.10
61.
679
1.52
21.
350
1.30
61.
557
1.35
91.
399
1.40
81.
354
1.49
81.
147
1.26
51.
499
Bras
il (B
razi
l)1.
274
1.10
61.
679
1.52
21.
350
1.30
61.
557
1.35
91.
399
1.40
51.
323
1.46
01.
137
1.25
01.
494
Font
e (S
ourc
e): M
apa/
Con
ab.

Anuário Estatístico da Agroenergia – 2012 201
4.3.4 Importação, exportação, consumo e estoques de grão e óleo4.3.4 Import, export and consumption of palm oil and palm kernel
Tabela 129 – Produção, exportação, importação, consumo e estoque de girassol no Brasil, em mil toneladasTable 129 – Sunflower production, exports, imports, consumption and stocks in Brazil, in thousand tons
Safras Harvests
Mil toneladas Thousand tons
ProduçãoProduction
ImportaçãoImports
ExportaçãoExports
Consumo e estoqueConsumption and stoks
2002/03 56,40 5,66 0,05 62,012003/04 85,80 6,76 0,00 92,562004/05 68,10 2,69 0,01 70,782005/06 93,60 1,88 0,14 95,332006/07 106,10 2,19 0,67 107,632007/08 147,10 1,42 0,01 148,512008/09 109,40 3,59 0,04 112,952009/10 80,60 1,46 0,01 82,052010/11 82,70 4,07 0,03 86,742011/12* 112,80 3,74 0,00 116,54
Fonte (Source): Mapa; MDIC.Elaboração (Elaboration): Mapa/SPAE.Nota: *Dados de importação e exportação são do período de setembro a abril.
*Imports and export data are from the period of september to april.NCM: 1206.00.10 e 1206.00.90
Gráfico 99 – Produção, exportação, importação, consumo e estoque de girassol no Brasil, em mil toneladasChart 99 – Sunflower production, exports, imports, consumption and stocks in Brazil, in thousand tons
Produção (Production) Importação (Imports)
Exportação (Exports) Consumo (Consumption)
0
20
40
60
80
100
120
140
160
2002/03
2003/04
2004/05
2005/06
2006/07
2007/08
2008/09
2009/10
2010/11
2011/12*
Gir
asso
l (m
il to
nel
adas
) Su
nfl
ow
er (
tho
usa
nd
to
ns)
Safras / Harvests

Ministério da Agricultura, Pecuária e Abastecimento202
Tabela 130 – Exportação e importação de óleo de girassol no Brasil, em mil toneladasTable 130 – Sunflower oil exports and imports in Brazil, in thousand tons
Safras Harvests
Mil toneladas Thousand tons
ImportaçãoImports
ExportaçãoExports
2002/03 25,13 3,03
2003/04 18,34 4,142004/05 12,79 7,262005/06 6,08 0,372006/07 23,83 4,422007/08 18,21 11,622008/09 15,21 3,432009/10 27,28 0,832010/11 30,09 0,622011/12* 28,44 0,32
Fonte (Source): Mapa e MDIC.Elaboração (Elaboration): Mapa/SPAE.Nota: *Dados de importação e exportação são do período de setembro a abril.
*Imports and export data are from the period of september to april.NCM: 1512.11.10, 1512.19.10, 1512.19.11 e 1512.19.19
Gráfico 100 – Exportação e importação de óleo de girassol no Brasil, em mil toneladasChart 100 – Sunflower oil exports and imports in Brazil, in thousand tons
-
5,00
10,00
15,00
20,00
25,00
30,00
35,00
2002
/03
2003
/04
2004
/05
2005
/06
2006
/07
2007
/08
2008
/09
2009
/10
2010
/11
2011
/12*
Óle
o d
e g
iras
sol (
mil
ton
elad
as)
Sun
flo
wer
oil
(th
ou
san
d t
on
s)
Safras / Harvests
Importação (Imports) Exportação (Exports)

Anuário Estatístico da Agroenergia – 2012 203
4.4 Algodão4.4 Cotton4.4.1 Informações técnicas4.4.1 Technical information
Tabela 131 – Informações técnicas da cultura de algodãoTable 131 – Technical information of cotton crop
ItemItem
DadoData
Ciclo (Cycle) 120 - 180 dias (days) (100 - 120)Teor de óleo do caroço (Seed oil content) 19% (18 - 20)Teor de farelo do caroço (Seed meal content)
80% - 82 %
Produtividade média de caroço de algodão (Cottonseed average productivity)
1.900 kg/ha (1.300 - 1.500)
Rendimento em caroço (Cottonseed yield) 58% - 72%Rendimento em pluma (Cotton yield) 28% - 42%Rendimento em óleo vegetal (Oil yield) 361 kg/ha
Cultivares registrados no Mapa (Registered cultivars in Mapa )
83 (Gossypium hirsutum L.)22 (Gossypium hirsutum L. var. latifolium Hutch)
2 (Gossypium hirsutum L. var. marie galante (Watt) Hutch)
16 (Gossypium L)Defensivos registrados no Mapa (Registered pesticides in Mapa)
494
Poder calorífico do biocombustível (Biofuel calorific value)
9.520 kcal/kg
Fonte (Source): Mapa.
4.4.2 Produção mundial4.4.2 World production
Tabela 132 – Principais países produtores de caroço de algodão, em milhões de toneladasTable 132 – Main cottonseed producing countries, in million tons
1998/99 1999/00 2000/01 2001/02 2002/03 2003/04 2004/05 2005/06 2006/07 2007/08 2008/09 2009/10 2010/11 2011/12China (China) 7,35 6,25 7,20 8,66 8,02 8,33 10,75 10,08 12,60 13,13 13,03 12,54 11,95 13,13
Índia (India) 4,57 4,32 3,88 4,37 3,76 6,48 8,25 8,48 7,74 8,52 8,02 9,80 10,8 11,30EUA (USA) 4,94 6,02 6,10 7,21 6,11 4,97 6,74 6,76 7,66 6,82 4,55 3,76 5,53 4,87Paquistão (Pakistan) 2,24 3,05 2,91 2,95 2,77 2,78 3,95 3,61 3,51 3,05 3,09 4,18 3,76 4,62
Brasil (Brazil) 0,85 1,14 1,53 1,25 1,38 2,14 2,09 1,67 2,48 2,61 1,94 2,10 3,35 3,39Uzbesquistão (Uzbekistan) 1,63 1,84 1,56 1,74 1,63 1,46 1,85 1,97 1,90 1,90 1,63 1,53 1,6 1,65
Turquia (Turkey) 1,37 1,29 1,28 1,41 1,48 1,46 1,47 1,26 1,38 1,14 0,65 0,60 0,69 1,05
Demais países (Other countries) 7,31 7,14 7,02 7,39 6,17 6,62 7,97 7,55 6,05 5,33 5,24 4,59 5,82 6,60
Mundo (World) 30,26 31,05 31,48 34,96 31,32 34,35 43,08 41,37 43,32 42,49 38,15 39,10 43,5 46,61
Fonte (Source): USDA, Mapa.

Ministério da Agricultura, Pecuária e Abastecimento204
Gráfico 101 – Principais países produtores de caroço de algodão, em milhões de toneladasChart 101 – Main cottonseed producing countries, in million tons
0
10
20
30
40
1998
/99
1999
/00
2000
/01
2001
/02
2002
/03
2003
/04
2004
/05
2005
/06
2006
/07
2007
/08
2008
/09
2009
/10
2010
/11
2011
/12
Pro
du
ção
(m
ilhõ
es d
e to
nel
adas
) Pr
od
uct
ion
(m
illio
ns
ton
s)
Safras / Harvests
Demais países (Other countries) Turquia (Turkey) Uzbesquistão (Uzbekistan) Brasil (Brazil) Paquistão (Pakistan) EUA (USA) Índia (India) China (China)
Tabela 133 – Produção mundial de óleo de algodão, em milhões de toneladasTable 133 – World cotton oil production, in million tons
SafrasHarvests
Produção (milhões de toneladas)Production (million tons)
1994/95 3,591995/96 3,931996/97 3,691997/98 3,691998/99 3,531999/00 3,562000/01 3,542001/02 3,802002/03 3,502003/04 3,852004/05 4,782005/06 4,902006/07 5,132007/08 5,242008/09 4,852009/10 4,642010/11 4,992011/12 5,33
Fonte (Source): USDA.

Anuário Estatístico da Agroenergia – 2012 205
Gráfico 102 – Produção mundial de óleo de algodão, em milhões de toneladasChart 102 – World cotton oil production, in million tons
3,0
3,4
3,8
4,2
4,6
5,0
5,4
5,8
1994
/95
1995
/96
1996
/97
1997
/98
1998
/99
1999
/00
2000
/01
2001
/02
2002
/03
2003
/04
2004
/05
2005
/06
2006
/07
2007
/08
2008
/09
2009
/10
2010
/11
2011
/12
Safras / Harvests
Oil
pro
du
ctio
n (
mill
ion
s to
ns)
Pro
du
ção
de
óle
o (
milh
ões
de
ton
elad
as)

Ministério da Agricultura, Pecuária e Abastecimento206
4.4.3 Produção nacional4.4.3 National production
Tabela 134 – Série histórica da produção, área plantada e produtividade de caroço de algodão no BrasilTable 134 – Cottonseed production, planted area and productivity in Brazil
SafrasHarvests
Produção de caroço de algodão (mil toneladas)Production of cottonseed
(million tons)
Área plantada (mil hectares)
Planted area (million ha)
Produtividade do caroço de algodão
(em kg/ha)Productivity of cottonseed
(kg/ha)1976/77 1.176 4.096 2871977/78 990 3.926 2521978/79 1.075 3.624 2971979/80 1.106 4.071 2721980/81 1.116 4.137 2701981/82 1.291 3.827 3371982/83 1.081 3.625 2981983/84 1.301 3.107 4191984/85 1.787 3.707 4821985/86 1.478 3.325 4441986/87 1.172 2.161 5431987/88 1.611 2.576 6251988/89 1.326 2.230 5951989/90 1.229 1.964 6261990/91 1.357 1.939 7001991/92 1.254 1.971 6361992/93 774 1.277 6061993/94 951 1.238 7681994/95 998 1.229 8121995/96 762 953 8001996/97 568 658 8641997/98 763 880 8681998/99 924 694 1.3311999/00 1.187 824 1.4412000/01 1.522 868 1.7532001/02 1.245 748 1.6652002/03 1.365 735 1.8572003/04 2.009 1.100 1.9082004/05 2.129 1.179 1.8052005/06 1.686 856 1.9692006/07 2.384 1.097 2.1732007/08 2.505 1.077 2.3252008/09 1.891 843 2.2422009/10 1.843 836 2.2052010/11 3.229 1.400 2.3062011/12 3.222 1.391 2.315
Fonte (Source): Mapa/Conab.

Anuário Estatístico da Agroenergia – 2012 207
Gráfico 103 – Série histórica da produção de caroço de algodão no Brasil, em mil toneladasChart 103 – Cottonseed production in Brazil, in tousand tons
500
1.000
1.500
2.000
2.500
3.000
3.500
1976
/77
1978
/79
1980
/81
1982
/83
1984
/85
1986
/87
1988
/89
1990
/91
1992
/93
1994
/95
1996
/97
1998
/99
2000
/01
2002
/03
2004
/05
2006
/07
2008
/09
2010
/11
Pro
du
ção
(m
il to
nel
adas
) Pr
od
uct
ion
(th
ou
san
d t
on
s)
Safras / Harvests
Gráfico 104 – Série histórica da área plantada de algodão no Brasil, em mil toneladasChart 104 – Cotton planted area in Brazil, in tousand tons
-
500
1.000
1.500
2.000
2.500
3.000
3.500
4.000
4.500
1976
/77
1978
/79
1980
/81
1982
/83
1984
/85
1986
/87
1988
/89
1990
/91
1992
/93
1994
/95
1996
/97
1998
/99
2000
/01
2002
/03
2004
/05
2006
/07
2008
/09
2010
/11
Áre
a p
lan
tad
a (m
il h
ecta
res)
Pl
ante
d A
rea
(mill
ion
hec
tare
s)
Safras / Harvests

Ministério da Agricultura, Pecuária e Abastecimento208
Gráfico 105 – Série histórica da produtividade de caroço de algodão no Brasil, em kg/haChart 105 – Cottonseed productivity in Brazil, in kg/ha
0
500
1.000
1.500
2.000
2.500
1976
/77
1978
/79
1980
/81
1982
/83
1984
/85
1986
/87
1988
/89
1990
/91
1992
/93
1994
/95
1996
/97
1998
/99
2000
/01
2002
/03
2004
/05
2006
/07
2008
/09
2010
/11
Pro
du
tivi
dad
e (k
g/h
a)
Pro
du
ctiv
ity
(kg
/ha)
Safras / Harvests

Anuário Estatístico da Agroenergia – 2012 209
Tabela 135 – Série histórica do rendimento de pluma e de caroço no Brasil, em porcentagem Table 135 – Cotton and seed yield in Brazil, in percentage
SafrasHarvests
Rendimento de caroço (%)Cottonseed yield (%)
Rendimento de pluma (%)Cotton yield (%)
1976/77 66,7 33,31977/78 67,0 33,01978/79 66,4 33,61979/80 65,7 34,31980/81 65,2 34,81981/82 65,5 34,51982/83 64,8 35,21983/84 65,9 34,11984/85 64,9 35,11985/86 65,1 34,91986/87 64,9 35,11987/88 65,1 34,91988/89 65,2 34,81989/90 64,9 35,11990/91 65,4 34,11991/92 65,3 34,71992/93 64,8 35,21993/94 66,3 33,71994/95 65,0 35,01995/96 65,0 35,01996/97 65,0 35,01997/98 65,0 35,01998/99 64,0 36,01999/00 62,9 37,12000/01 61,8 38,22001/02 61,7 38,32002/03 61,7 38,32003/04 61,6 38,42004/05 62,1 37,92005/06 61,9 38,12006/07 61,0 39,02007/08 61,0 39,02008/09 60,9 39,12009/10 60,7 39,32010/11 62,2 37,82011/12 62,3 37,7
Fonte (Source): Mapa/Conab.

Ministério da Agricultura, Pecuária e Abastecimento210
Gráfico 106 – Série histórica do rendimento de pluma e caroço no Brasil, em porcentagemChart 106 – Cotton and seed yield in Brazil, in percentage
0%
10%
20%
30%
40%
50%
60%
70%
80%
90%
100%
1976
/77
1978
/79
1980
/81
1982
/83
1984
/85
1986
/87
1988
/89
1990
/91
1992
/93
1994
/95
1996
/97
1998
/99
2000
/01
2002
/03
2004
/05
2006
/07
2008
/09
2010
/11
Ren
dim
ento
(p
orc
enta
gem
)
Yie
ld (
per
cen
tag
e)
Safras / Harvests
Rendimento de pluma (%) (Cotton yield (%)) Rendimento de caroço (%) (Cottonseed yield (%))

Anuário Estatístico da Agroenergia – 2012 211
Tab
ela
136
– Pr
od
uçã
o d
e ca
roço
de
alg
od
ão n
o B
rasi
l no
per
íod
o d
e 19
77 a
199
4, e
m m
il to
nel
adas
Tabl
e 13
6 –
Cot
tons
eed
prod
uctio
n in
Bra
zil b
etw
een
1977
to
1994
, in
thou
sand
ton
s
Regi
ão/U
F (R
egio
n/St
ate)
1976
/77
1977
/78
1978
/79
1979
/80
1980
/81
1981
/82
1982
/83
1983
/84
1984
/85
1985
/86
1986
/87
1987
/88
1988
/89
1989
/90
1990
/91
1991
/92
1992
/93
1993
/94
Nor
te (N
orth
)-
--
--
4,2
5,8
6,9
3,3
5,2
2,3
8,1
21,5
20,4
20,3
12,5
22,8
26,6
RR-
--
--
--
--
--
--
--
--
-RO
--
--
--
--
--
-3,
517
,117
,117
,110
,420
,724
,6A
C-
--
--
--
--
--
--
--
--
-A
M-
--
--
--
--
--
--
--
--
-A
P-
--
--
--
--
--
--
--
--
-PA
--
--
-4,
25,
86,
93,
35,
22,
34,
64,
43,
33,
22,
1-
2,0
TO-
--
--
--
--
--
--
--
2,1
2,1
-N
orde
ste
(Nor
thea
st)
420,
142
2,5
324,
031
6,2
248,
333
4,1
155,
942
8,7
383,
129
4,2
167,
535
5,5
256,
516
0,0
216,
715
3,0
85,0
223,
7
MA
4,7
6,3
8,4
7,0
10,1
8,1
5,6
6,4
5,3
6,7
4,4
3,0
1,4
0,6
0,3
0,3
1,2
1,2
PI9,
315
,216
,114
,012
,114
,46,
123
,325
,925
,626
,823
,036
,210
,814
,713
,813
,827
,8CE
163,
318
5,7
126,
712
7,9
74,3
147,
346
,617
7,5
112,
349
,723
,488
,160
,743
,848
,323
,110
,058
,0RN
70,2
60,7
32,3
28,8
31,1
40,7
9,6
51,5
21,7
13,4
4,5
21,8
19,0
6,8
28,5
10,9
0,7
20,7
PB81
,769
,858
,461
,551
,954
,228
,380
,547
,619
,913
,317
,428
,09,
928
,217
,42,
113
,1PE
58,3
41,9
38,4
32,6
22,5
14,3
11,5
28,0
26,9
9,1
6,6
12,1
9,7
3,7
6,8
5,3
0,4
4,0
AL
14,0
12,3
12,2
9,4
12,6
18,2
11,2
14,5
16,0
16,5
11,2
14,2
8,3
2,3
4,8
4,3
0,2
9,2
SE2,
32,
63,
51,
73,
54,
72,
34,
36,
58,
94,
46,
02,
72,
20,
80,
4-
1,9
BA16
,328
,028
,033
,330
,232
,234
,742
,712
0,9
144,
472
,916
9,9
90,5
79,9
84,3
77,5
56,6
87,8
Cent
ro-
Oes
te
(Cen
tral
Wes
t)81
,670
,275
,479
,185
,484
,194
,510
5,5
160,
913
7,6
102,
114
9,5
136,
813
7,7
181,
817
1,7
150,
020
4,0
MT
--
2,2
2,6
2,6
3,3
2,7
6,4
13,6
11,7
7,3
25,3
36,7
37,9
68,1
55,6
62,4
80,5
MS
29,2
31,6
40,7
41,8
36,4
39,9
39,8
38,2
71,6
64,5
49,3
50,4
50,7
45,5
49,6
61,2
37,5
54,6
GO
52,4
38,6
32,5
34,7
46,4
40,9
52,0
60,9
75,7
61,4
45,5
73,8
49,4
54,3
64,1
54,9
50,1
68,9
DF
--
--
--
--
--
--
--
--
--
Sude
ste
(Sou
thea
st)
418,
130
9,6
360,
635
3,4
412,
339
8,0
372,
537
6,2
579,
456
2,5
455,
253
7,8
395,
836
1,6
298,
729
4,3
186,
421
2,8
MG
57,4
58,6
40,7
35,7
53,3
52,0
71,5
52,2
130,
210
6,7
61,4
73,6
47,8
53,4
69,1
51,4
50,4
51,1
ES-
--
--
--
--
--
--
--
--
-RJ
--
--
--
--
--
--
--
--
--
SP36
0,7
251,
031
9,9
317,
735
9,0
346,
030
1,0
324,
044
9,2
455,
839
3,8
464,
234
8,0
308,
222
9,6
242,
913
6,0
161,
7Su
l (So
uth)
256,
218
7,2
315,
335
7,0
369,
747
0,3
452,
438
4,1
659,
847
8,5
445,
356
0,0
515,
354
8,8
639,
362
2,1
330,
028
3,9
PR25
6,2
187,
231
5,3
357,
036
9,7
470,
345
2,4
384,
165
9,8
478,
544
5,3
560,
051
5,3
548,
863
9,3
622,
133
0,0
283,
9SC
--
--
--
--
--
--
--
--
--
RS-
--
--
--
--
--
--
--
--
- N
orte
/N
orde
ste
(N
orth
/N
orth
east
)
420,
142
2,5
324,
031
6,2
248,
333
8,3
161,
743
5,6
386,
429
9,4
169,
836
3,6
278,
018
0,4
237,
016
5,5
107,
825
0,3
Cent
ro-S
ul
(Cen
ter-
Sout
h)75
5,9
567,
075
1,3
789,
586
7,4
952,
491
9,4
865,
81.
400,
11.
178,
61.
002,
61.
247,
31.
047,
91.
048,
11.
119,
81.
088,
166
6,4
700,
7
Bras
il (B
razi
l)1.
176,
098
9,5
1.07
5,3
1.10
5,7
1.11
5,7
1.29
0,7
1.08
1,1
1.30
1,4
1.78
6,5
1.47
8,0
1.17
2,4
1.61
0,9
1.32
5,9
1.22
8,5
1.35
6,8
1.25
3,6
774,
295
1,0
Font
e (S
ourc
e): M
apa/
Con
ab.

Ministério da Agricultura, Pecuária e Abastecimento212
Tab
ela
137
– Pr
od
uçã
o d
e ca
roço
de
alg
od
ão n
o B
rasi
l no
per
íod
o d
e 19
95 a
201
2, e
m m
il to
nel
adas
Tabl
e 13
7 –
Cot
tons
eed
prod
uctio
n in
Bra
zil b
etw
een
1995
to
2012
, in
thou
sand
ton
s
Regi
ão/U
F
(Reg
ion/
Stat
e)19
94/9
519
95/9
619
96/9
719
97/9
819
98/9
919
99/2
000
2000
/01
2001
/02
2002
/03
2003
/04
2004
/05
2005
/06
2006
/07
2007
/08
2008
/09
2009
/10
2010
/11
2011
/12
Nor
te (N
orth
)20
,211
,85,
04,
12,
81,
22,
30,
63,
67,
63,
1-
1,6
3,7
5,4
8,4
11,6
22,9
RR-
--
-2,
0-
--
--
--
--
--
--
RO18
,29,
84,
23,
30,
80,
42,
3-
--
--
--
--
--
AC
--
--
--
--
--
--
--
--
--
AM
--
--
--
--
--
--
--
--
--
AP
--
--
--
--
--
--
--
--
--
PA2,
02,
00,
80,
8-
0,8
--
--
--
--
--
--
TO-
--
--
--
0,6
3,6
7,6
3,1
-1,
63,
75,
48,
411
,622
,9N
orde
ste
(Nor
thea
st)
142,
713
0,0
104,
942
,866
,417
5,9
127,
314
9,2
212,
346
7,5
543,
253
7,3
738,
583
1,8
626,
265
2,7
1.06
6,6
996,
3
MA
--
--
--
5,0
5,3
7,1
13,9
13,5
13,0
16,9
28,3
25,5
26,3
43,4
42,9
PI25
,217
,310
,81,
12,
94,
31,
61,
93,
06,
56,
824
,916
,131
,821
,312
,440
,745
,1CE
24,0
23,4
11,7
10,8
27,1
51,8
8,1
10,8
8,1
9,0
4,3
5,2
2,4
2,2
1,7
1,3
2,0
1,1
RN9,
916
,910
,11,
22,
29,
72,
47,
88,
18,
86,
86,
25,
44,
03,
01,
01,
40,
1PB
13,7
14,0
11,0
1,6
4,5
19,2
2,0
5,8
8,2
14,8
10,4
4,5
1,2
2,2
2,3
0,1
0,6
0,3
PE7,
05,
43,
90,
70,
73,
11,
72,
82,
11,
61,
31,
50,
91,
61,
31,
00,
40,
7A
L1,
83,
23,
52,
61,
32,
98,
46,
04,
82,
82,
02,
83,
02,
70,
50,
30,
10,
1SE
0,9
0,5
0,9
0,2
0,2
0,2
--
--
--
--
--
--
BA60
,249
,353
,024
,627
,584
,798
,110
8,8
170,
941
0,1
498,
047
9,2
692,
675
9,0
570,
661
0,3
978,
090
6,0
Cent
ro-
Oes
te
(Cen
tral
W
est)
251,
923
7,1
230,
039
6,3
625,
676
0,7
1.13
3,0
886,
095
0,4
1.37
1,8
1.34
3,1
1.00
7,8
1.50
4,0
1.57
4,5
1.19
8,6
1.13
7,9
2.03
3,4
2.09
1,6
MT
72,2
61,6
64,6
175,
037
7,4
536,
584
2,1
617,
565
9,5
971,
596
2,2
814,
31.
224,
91.
298,
996
0,6
912,
71.
626,
41.
714,
2M
S83
,366
,236
,560
,576
,373
,010
6,2
99,7
99,8
118,
111
1,4
67,0
110,
210
9,7
89,5
87,2
139,
615
2,0
GO
96,4
109,
312
8,9
160,
817
1,9
149,
718
1,5
165,
418
6,3
276,
226
0,6
121,
116
5,6
165,
914
8,5
138,
026
6,4
225,
4D
F-
--
--
1,5
3,2
3,4
4,8
6,0
8,9
5,4
3,3
--
-1,
0-
Sude
ste
(Sou
thea
st)
256,
516
0,8
153,
320
0,5
157,
016
9,8
154,
415
3,2
153,
619
2,8
189,
012
1,2
122,
083
,852
,144
,011
5,1
109,
4
MG
50,1
43,0
52,3
76,3
53,7
67,3
50,1
52,3
53,4
79,6
88,4
54,2
63,1
49,4
35,7
33,9
70,4
67,3
ES-
--
--
--
--
--
--
--
-0,
00,
0RJ
--
--
--
--
--
--
--
--
0,0
0,0
SP20
6,4
117,
810
1,0
124,
210
3,3
102,
510
4,3
100,
910
0,2
113,
210
0,6
67,1
58,9
34,4
16,4
10,1
44,7
42,1
Sul (
Sout
h)32
6,3
222,
075
,011
9,7
72,0
79,8
104,
955
,944
,959
,550
,719
,417
,510
,98,
30,
11,
91,
5PR
326,
322
2,0
75,0
119,
772
,079
,810
4,9
55,9
44,9
59,5
50,7
19,4
17,5
10,9
8,3
0,1
1,9
1,5
SC-
--
--
--
--
--
--
--
--
-RS
--
--
--
--
--
--
--
--
--
Nor
te/
Nor
dest
e
(Nor
th/
Nor
thea
st)
162,
914
1,8
109,
946
,969
,217
7,1
129,
614
9,8
215,
947
5,1
546,
253
7,3
740,
183
5,5
631,
666
1,1
1.07
8,2
1.01
9,2
Cent
ro-S
ul (C
ente
r-So
uth)
834,
761
9,9
458,
371
6,5
854,
61.
010,
31.
392,
31.
095,
11.
148,
91.
624,
11.
582,
91.
148,
41.
643,
51.
669,
21.
259,
01.
182,
02.
150,
42.
202,
5
Bras
il (B
razi
l)99
7,6
761,
756
8,2
763,
492
3,8
1.18
7,4
1.52
1,9
1.24
4,9
1.36
4,8
2.09
9,2
2.12
9,1
1.68
5,7
2.38
3,6
2.50
4,7
1.89
0,6
1.84
3,1
3.22
8,6
3.22
1,7
Font
e (S
ourc
e): M
apa/
Con
ab.

Anuário Estatístico da Agroenergia – 2012 213
Tab
ela
138
– Á
rea
pla
nta
da
de
alg
od
ão n
o B
rasi
l no
per
íod
o d
e 19
77 a
199
4, e
m m
il h
ecta
res
Tabl
e 13
8 –
Cot
ton
plan
ted
area
in B
razi
l bet
wee
n 19
77 t
o 19
94, i
n th
ousa
nd h
ecta
res
Regi
ão/U
F (R
egio
n/St
ate)
1976
/77
1977
/78
1978
/79
1979
/80
1980
/81
1981
/82
1982
/83
1983
/84
1984
/85
1985
/86
1986
/87
1987
/88
1988
/89
1989
/90
1990
/91
1991
/92
1992
/93
1993
/94
Nor
te
(Nor
th)
--
--
-10
,212
,615
,08,
013
,013
,014
,226
,223
,723
,715
,125
,129
,1
RR-
--
--
--
--
--
--
--
--
-RO
--
--
--
--
--
-3,
215
,515
,515
,510
,020
,024
,0A
C-
--
--
--
--
--
--
--
--
-A
M-
--
--
--
--
--
--
--
--
-A
P-
--
--
--
--
--
--
--
--
-PA
--
--
-10
,212
,615
,08,
013
,013
,011
,010
,78,
28,
25,
1-
5,1
TO-
--
--
--
--
--
--
--
5,1
5,1
-N
orde
ste
(Nor
thea
st)
3.24
7,7
3.07
5,3
2.87
8,3
3.28
0,0
3.33
3,3
2.94
3,9
2.68
5,0
2.31
7,0
2.47
8,0
2.22
0,3
1.18
3,3
1.44
3,3
1.26
6,7
892,
680
9,3
720,
749
6,1
567,
0
MA
44,4
47,1
51,1
52,0
59,8
53,6
32,0
42,0
36,0
32,8
23,6
17,0
10,9
3,0
1,8
1,8
4,5
4,5
PI14
1,2
127,
015
6,6
165,
017
3,0
200,
019
4,0
183,
020
4,0
218,
020
0,0
204,
018
7,0
156,
011
2,4
83,1
83,1
62,1
CE1.
296,
01.
294,
01.
256,
81.
365,
01.
436,
01.
208,
81.
147,
679
5,0
810,
075
7,5
368,
045
6,0
400,
028
8,0
225,
623
8,7
206,
420
8,0
RN55
9,9
552,
238
9,4
617,
044
0,0
440,
042
7,4
440,
049
9,0
340,
086
,815
8,0
148,
510
4,5
114,
845
,016
,549
,0PB
666,
756
6,8
600,
063
8,0
727,
066
0,0
560,
853
0,0
530,
038
0,0
157,
310
5,0
126,
580
,099
,886
,837
,228
,7PE
300,
927
8,8
245,
327
1,0
309,
020
0,0
162,
013
0,0
160,
014
7,0
83,3
83,5
67,0
35,0
51,8
40,1
13,5
17,6
AL
99,3
62,8
72,9
81,0
91,0
86,5
80,2
68,5
80,0
92,0
57,7
68,6
46,0
15,8
22,4
20,0
6,7
45,3
SE15
,916
,420
,415
,015
,037
,018
,523
,530
,043
,027
,824
,213
,811
,95,
53,
01,
09,
3BA
123,
413
0,2
85,8
76,0
82,5
58,0
62,5
105,
012
9,0
210,
017
8,8
327,
026
7,0
198,
417
5,2
202,
212
7,2
142,
5Ce
ntro
-O
este
(C
entr
al
Wes
t)
141,
511
1,6
86,1
80,2
91,6
85,7
84,9
88,8
146,
012
3,5
101,
714
5,8
123,
113
2,9
170,
918
1,7
134,
716
5,1
MT
--
5,2
4,4
6,6
4,9
4,0
7,0
15,0
16,5
14,0
30,0
43,4
43,0
71,0
57,0
60,0
72,6
MS
68,4
45,6
45,8
44,4
47,0
41,8
43,5
34,8
67,0
62,0
52,7
52,7
45,0
42,7
48,0
69,7
36,2
39,8
GO
73,1
66,0
35,1
31,4
38,0
39,0
37,4
47,0
64,0
45,0
35,0
63,1
34,7
47,2
51,9
55,0
38,5
52,7
DF
--
--
--
--
--
--
--
--
--
Sude
ste
(Sou
thea
st)
416,
344
9,3
373,
237
4,0
406,
041
3,8
398,
835
4,0
535,
052
3,5
471,
052
2,0
398,
640
4,1
363,
134
4,7
250,
223
5,6
MG
116,
212
1,3
99,3
90,0
103,
095
,885
,311
0,0
155,
016
7,5
147,
016
9,0
126,
811
4,1
119,
511
4,7
100,
790
,6ES
--
--
--
--
--
--
--
--
--
RJ-
--
--
--
--
--
--
--
--
-SP
300,
132
8,0
273,
928
4,0
303,
031
8,0
313,
524
4,0
380,
035
6,0
324,
035
3,0
271,
829
0,0
243,
623
0,0
149,
514
5,0
Sul (
Sout
h)29
0,4
290,
028
6,0
336,
730
5,8
373,
044
3,4
332,
554
0,0
445,
039
2,0
450,
841
5,0
510,
557
1,8
709,
037
1,0
241,
0PR
290,
429
0,0
286,
033
6,7
305,
837
3,0
443,
433
2,5
540,
044
5,0
392,
045
0,8
415,
051
0,5
571,
870
9,0
371,
024
1,0
SC-
--
--
--
--
--
--
--
--
-RS
--
--
--
--
--
--
--
--
--
Nor
te/
Nor
dest
e (N
orth
/N
orth
east
)
3.24
7,7
3.07
5,3
2.87
8,3
3.28
0,0
3.33
3,3
2.95
4,1
2.69
7,6
2.33
2,0
2.48
6,0
2.23
3,3
1.19
6,3
1.45
7,5
1.29
2,9
916,
383
3,0
735,
852
1,2
596,
1
Cent
ro-S
ul
(Cen
ter-
Sout
h)84
8,2
850,
974
5,3
790,
980
3,4
872,
592
7,1
775,
31.
221,
01.
092,
096
4,7
1.11
8,6
936,
71.
047,
51.
105,
81.
235,
475
5,9
641,
7
Bras
il (B
razi
l)4.
095,
93.
926,
23.
623,
64.
070,
94.
136,
73.
826,
63.
624,
73.
107,
33.
707,
03.
325,
32.
161,
02.
576,
12.
229,
61.
963,
81.
938,
81.
971,
21.
277,
11.
237,
8
Font
e (S
ourc
e): M
apa/
Con
ab.

Ministério da Agricultura, Pecuária e Abastecimento214
Tab
ela
139
– Á
rea
pla
nta
da
de
alg
od
ão n
o B
rasi
l no
per
íod
o d
e 19
95 a
201
2, e
m m
il h
ecta
res
Tabl
e 13
9 –
Cot
ton
plan
ted
area
in B
razi
l bet
wee
n 19
95 t
o 20
12, i
n th
ousa
nd h
ecta
res
Regi
ão/U
F (R
egio
n/St
ate)
1994
/95
1995
/96
1996
/97
1997
/98
1998
/99
1999
/200
020
00/0
120
01/0
220
02/0
320
03/0
420
04/0
520
05/0
620
06/0
720
07/0
8 20
08/0
920
09/1
020
10/1
120
11/1
2
Nor
te (N
orth
)25
,117
,17,
36,
33,
31,
32,
60,
32,
43,
81,
4-
0,7
1,6
2,8
4,0
5,5
10,0
RR-
--
-2,
5-
--
--
--
--
--
--
RO20
,012
,05,
24,
20,
80,
52,
6-
--
--
--
--
--
AC
--
--
--
--
--
--
--
--
--
AM
--
--
--
--
--
--
--
--
--
AP
--
--
--
--
--
--
--
--
--
PA5,
15,
12,
12,
1-
0,8
--
--
--
--
--
--
TO-
--
--
--
0,3
2,4
3,8
1,4
-0,
71,
62,
84,
05,
510
,0N
orde
ste
(Nor
thea
st)
467,
636
8,9
294,
221
7,0
152,
724
9,0
151,
615
7,4
167,
029
6,2
330,
930
0,5
353,
037
3,6
330,
828
8,3
450,
546
1,7
MA
--
--
--
2,4
3,1
3,3
6,9
9,0
7,3
7,3
12,3
12,8
11,3
18,1
18,6
PI55
,359
,033
,214
,65,
313
,88,
18,
99,
813
,215
,013
,813
,214
,611
,25,
917
,820
,3CE
121,
880
,036
,041
,164
,110
9,0
29,4
20,3
14,0
16,8
10,2
9,7
7,3
4,5
3,8
2,7
3,1
2,1
RN56
,246
,525
,018
,214
,123
,719
,719
,720
,523
,018
,414
,112
,77,
99,
03,
03,
80,
5PB
36,9
29,9
24,1
14,6
13,9
24,2
8,4
10,2
12,3
24,6
19,5
8,5
5,1
4,0
5,2
0,5
1,0
0,6
PE18
,812
,38,
52,
82,
611
,87,
38,
06,
24,
73,
73,
22,
93,
12,
52,
50,
81,
5A
L12
,615
,616
,012
,86,
97,
321
,017
,014
,69,
58,
110
,211
,011
,63,
11,
60,
60,
6SE
9,0
5,1
3,1
1,7
1,3
1,3
0,3
--
--
--
--
--
-BA
157,
012
0,5
148,
311
1,2
44,5
57,9
55,0
70,2
86,3
197,
524
7,0
233,
729
3,5
315,
628
3,2
260,
840
5,3
417,
5Ce
ntro
-O
este
(C
entr
al
Wes
t)
204,
219
8,2
164,
733
9,5
361,
240
6,2
541,
545
1,5
441,
363
2,1
658,
446
5,6
665,
965
8,4
481,
652
3,4
893,
587
1,5
MT
72,6
58,1
55,2
109,
920
3,3
268,
439
2,0
312,
830
0,3
438,
445
1,6
366,
054
2,0
541,
838
7,4
428,
172
3,5
719,
9M
S65
,763
,725
,549
,047
,746
,750
,445
,443
,654
,558
,930
,045
,644
,136
,938
,661
,062
,0G
O65
,976
,484
,018
0,6
110,
290
,497
,691
,795
,413
5,6
143,
766
,776
,772
,557
,356
,710
8,3
89,6
DF
--
--
-0,
71,
51,
62,
03,
64,
22,
91,
6-
--
0,7
0,0
Sude
ste
(Sou
thea
st)
249,
617
0,9
132,
120
0,5
126,
611
3,9
104,
310
0,9
95,1
121,
813
2,5
74,2
64,5
37,3
22,5
19,9
49,7
46,7
MG
77,0
50,1
53,6
78,8
53,6
48,2
38,6
37,8
35,2
49,3
54,2
30,4
32,5
20,6
15,3
15,0
31,6
29,6
ES-
--
--
--
--
--
--
--
--
0,0
RJ-
--
--
--
--
--
--
--
--
0,0
SP17
2,6
120,
878
,512
1,7
73,0
65,7
65,7
63,1
59,9
72,5
78,3
43,8
32,0
16,7
7,2
4,9
18,1
17,1
Sul (
Sout
h)28
2,0
197,
459
,211
6,6
50,1
53,4
68,4
37,6
29,3
46,1
56,2
15,9
12,7
6,5
5,5
0,1
1,1
1,5
PR28
2,0
197,
459
,211
6,6
50,1
53,4
68,4
37,6
29,3
46,1
56,2
15,9
12,7
6,5
5,5
0,1
1,1
1,5
SC-
--
--
--
--
--
--
--
--
-RS
--
--
--
--
--
--
--
--
--
Nor
te/
Nor
dest
e (N
orth
/N
orth
east
)
492,
738
6,0
301,
522
3,3
156,
025
0,3
154,
215
7,7
169,
430
0,0
332,
330
0,5
353,
737
5,2
333,
629
2,3
456,
047
1,7
Cent
ro-S
ul
(Cen
ter-
Sout
h)73
5,8
566,
535
6,0
656,
653
7,9
573,
571
4,2
590,
056
5,7
800,
084
7,1
555,
774
3,1
702,
250
9,6
543,
494
4,3
919,
7
Bras
il (B
razi
l)1.
228,
595
2,5
657,
587
9,9
693,
982
3,8
868,
474
7,7
735,
11.
100,
01.
179,
485
6,2
1.09
6,8
1.07
7,4
843,
283
5,7
1.40
0,3
1.39
1,4
Font
e (S
ourc
e): M
apa/
Con
ab.

Anuário Estatístico da Agroenergia – 2012 215
Tab
ela
140
– Pr
od
uti
vid
ade
de
caro
ço d
e al
go
dão
no
Bra
sil n
o p
erío
do
de
1977
a 1
994,
em
kg
/ha
Tabl
e 14
0 –
Cot
tons
eed
prod
uctiv
ity in
Bra
zil b
etw
een
1977
to
1994
in B
razi
l, in
kg/
ha
Regi
ão/U
F (R
egio
n/St
ate)
1976
/77
1977
/78
1978
/79
1979
/80
1980
/81
1981
/82
1982
/83
1983
/84
1984
/85
1985
/86
1986
/87
1987
/88
1988
/89
1989
/90
1990
/91
1991
/92
1992
/93
1993
/94
No
rte
(Nor
th)
--
--
-41
246
046
041
340
017
757
082
186
185
782
890
891
4
RR
--
--
--
--
--
--
--
--
--
RO
--
--
--
--
--
-1.
094
1.10
31.
103
1.10
31.
040
1.03
51.
025
AC
--
--
--
--
--
--
--
--
--
AM
--
--
--
--
--
--
--
--
--
AP
--
--
--
--
--
--
--
--
--
PA-
--
--
412
460
460
413
400
177
418
411
402
390
412
-39
2TO
--
--
--
--
--
--
--
-41
241
2-
No
rdes
te
(Nor
thea
st)
129
137
113
9674
113
5818
515
513
314
224
620
217
926
821
217
139
5
MA
106
134
164
135
169
151
175
152
147
204
186
176
128
200
167
167
267
267
PI66
120
103
8570
7231
127
127
117
134
113
194
6913
116
616
644
8C
E12
614
410
194
5212
241
223
139
6664
193
152
152
214
9748
279
RN
125
110
8347
7193
2211
743
3952
138
128
6524
824
242
422
PB12
312
397
9671
8250
152
9052
8516
622
112
428
320
056
456
PE19
415
015
712
073
7271
215
168
6279
145
145
106
131
132
3022
7A
L14
119
616
711
613
821
014
021
220
017
919
420
718
014
621
421
530
203
SE14
515
917
211
323
312
712
418
321
720
715
824
819
618
514
513
3-
204
BA
132
215
326
438
366
555
555
407
937
688
408
520
339
403
481
383
445
616
Cen
tro
-O
este
(C
entr
al
Wes
t)
577
629
876
986
932
981
1.11
31.
188
1.10
21.
114
1.00
41.
025
1.11
11.
036
1.06
494
51.
114
1.23
6
MT
--
423
591
394
673
675
914
907
709
521
843
846
881
959
975
1.04
01.
109
MS
427
693
889
941
774
955
915
1.09
81.
069
1.04
093
595
61.
127
1.06
61.
033
878
1.03
61.
372
GO
717
585
926
1.10
51.
221
1.04
91.
390
1.29
61.
183
1.36
41.
300
1.17
01.
424
1.15
01.
235
998
1.30
11.
307
DF
--
--
--
--
--
--
--
--
--
Sud
este
(S
outh
east
)1.
004
689
966
945
1.01
696
293
41.
063
1.08
31.
074
966
1.03
099
389
582
385
474
590
3
MG
494
483
410
397
517
543
838
475
840
637
418
436
377
468
578
448
500
564
ES-
--
--
--
--
--
--
--
--
-R
J-
--
--
--
--
--
--
--
--
-SP
1.20
276
51.
168
1.11
91.
185
1.08
896
01.
328
1.18
21.
280
1.21
51.
315
1.28
01.
063
943
1.05
691
01.
115
Sul (
Sout
h)88
264
61.
102
1.06
01.
209
1.26
11.
020
1.15
51.
222
1.07
51.
136
1.24
21.
242
1.07
51.
118
877
889
1.17
8PR
882
646
1.10
21.
060
1.20
91.
261
1.02
01.
155
1.22
21.
075
1.13
61.
242
1.24
21.
075
1.11
887
788
91.
178
SC-
--
--
--
--
--
--
--
--
-R
S-
--
--
--
--
--
--
--
--
-N
ort
e/N
ord
este
(N
orth
/N
orth
east
)
129
137
113
9674
115
6018
715
513
414
224
921
519
728
522
520
742
0
Cen
tro
-Su
l (C
ente
r-So
uth)
891
666
1.00
899
81.
080
1.09
299
21.
117
1.14
71.
079
1.03
91.
115
1.11
91.
001
1.01
388
188
21.
092
Bra
sil (
Braz
il)28
725
229
727
227
033
729
841
948
244
454
362
559
562
670
063
660
676
8
Font
e (S
ourc
e): M
apa/
Con
ab.

Ministério da Agricultura, Pecuária e Abastecimento216
Tab
ela
141
– Pr
od
uti
vid
ade
de
caro
ço d
e al
go
dão
no
Bra
sil n
o p
erío
do
de
1995
a 2
012,
em
kg
/ha
Tabl
e 14
1 –
Cot
tons
eed
prod
uctiv
ity in
Bra
zil b
etw
een
1995
to
2012
, in
kg/h
a
Regi
ão/U
F (R
egio
n/St
ate)
1994
/95
1995
/96
1996
/97
1997
/98
1998
/99
1999
/200
020
00/0
120
01/0
220
02/0
320
03/0
420
04/0
520
05/0
620
06/0
720
07/0
820
08/0
920
09/1
020
10/1
120
11/1
2
Nor
te (N
orth
)80
569
068
565
184
892
388
52.
000
1.50
02.
000
2.19
1-
2.32
52.
312
1.92
22.
105
2.12
32.
288
RR-
--
-80
0-
--
--
--
--
--
--
RO91
081
780
878
61.
000
800
885
--
--
--
--
--
-A
C-
--
--
--
--
--
--
--
--
-A
M-
--
--
--
--
--
--
--
--
-A
P-
--
--
--
--
--
--
--
--
-PA
392
392
381
381
-1.
000
--
--
--
--
--
--
TO-
--
--
--
2.00
01.
500
2.00
02.
191
-2.
325
2.31
21.
922
2.10
52.
123
2.28
8N
orde
ste
(Nor
thea
st)
305
352
357
197
435
706
840
948
1.27
11.
578
1.64
11.
788
2.09
22.
226
1.89
32.
263
2.36
72.
158
MA
--
--
--
2.08
31.
710
2.15
22.
014
1.50
01.
781
2.30
62.
306
1.99
32.
324
2.39
72.
306
PI45
629
332
575
547
312
198
213
306
492
452
1.80
51.
216
2.17
31.
897
2.08
72.
287
2.22
3CE
197
293
325
263
423
475
276
532
579
536
422
536
325
484
468
488
657
481
RN17
636
340
466
156
409
122
396
395
383
372
442
432
504
329
325
369
101
PB37
146
845
611
032
479
323
856
966
760
253
352
724
153
445
511
956
549
4PE
372
439
459
250
269
263
233
350
339
340
352
472
322
509
503
390
468
455
AL
143
205
219
203
188
397
400
353
329
295
248
271
271
239
161
195
208
195
SE10
098
290
118
154
154
--
--
--
--
--
--
BA38
340
935
722
161
81.
463
1.78
41.
550
1.98
02.
076
2.01
62.
050
2.36
02.
405
2.01
52.
340
2.41
32.
170
Cent
ro-
Oes
te
(Cen
tral
W
est)
1.23
41.
196
1.39
61.
167
1.73
21.
873
2.09
21.
962
2.15
42.
170
2.04
02.
164
2.25
92.
391
2.48
92.
174
2.27
62.
400
MT
994
1.06
01.
170
1.59
21.
856
1.99
92.
148
1.97
42.
196
2.21
62.
131
2.22
52.
260
2.39
72.
480
2.13
22.
248
2.38
1M
S1.
268
1.03
91.
431
1.23
51.
600
1.56
32.
107
2.19
62.
289
2.16
71.
891
2.23
22.
417
2.48
62.
425
2.26
02.
288
2.45
2G
O1.
463
1.43
11.
535
890
1.56
01.
656
1.86
01.
804
1.95
32.
037
1.81
41.
816
2.15
92.
288
2.59
32.
433
2.45
95.
215
DF
--
--
-2.
143
2.13
32.
125
2.40
01.
667
2.13
01.
879
2.07
7-
--
1.49
0-
Sude
ste
(Sou
thea
st)
1.02
894
11.
160
1.00
01.
240
1.49
11.
480
1.51
81.
615
1.58
31.
427
1.63
31.
891
2.24
82.
314
2.21
32.
315
2.34
1
MG
651
858
976
968
1.00
21.
396
1.29
81.
384
1.51
71.
615
1.63
11.
781
1.94
12.
400
2.33
52.
262
2.22
72.
271
ES-
--
--
--
--
--
--
--
--
0RJ
--
--
--
--
--
--
--
--
-0
SP1.
196
975
1.28
71.
021
1.41
51.
560
1.58
81.
599
1.67
31.
561
1.28
51.
531
1.84
12.
062
2.26
92.
062
2.46
92.
461
Sul (
Sout
h)1.
157
1.12
51.
267
1.02
71.
437
1.49
41.
534
1.48
71.
532
1.29
190
31.
223
1.38
01.
673
1.50
71.
272
1.75
81.
000
PR1.
157
1.12
51.
267
1.02
71.
437
1.49
41.
534
1.48
71.
532
1.29
190
31.
223
1.38
01.
673
1.50
71.
272
1.75
81.
767
SC-
--
--
--
--
--
--
--
--
-RS
--
--
--
--
--
--
--
--
--
Nor
te/
Nor
dest
e
(Nor
th/
Nor
thea
st)
331
367
365
210
444
708
840
950
1.27
41.
584
1.64
41.
788
2.09
22.
227
1.89
32.
261
2.36
42.
160
Cent
ro-S
ul
(Cen
ter-
Sout
h)1.
134
1.09
41.
287
1.09
11.
589
1.76
21.
949
1.85
62.
031
2.03
01.
869
2.06
72.
212
2.37
72.
471
2.17
52.
277
2.39
5
Bras
il (B
razi
l)81
280
086
486
81.
331
1.44
11.
753
1.66
51.
857
1.90
81.
805
1.96
92.
173
2.32
52.
242
2.20
52.
306
2.31
5
Font
e (S
ourc
e): M
apa/
Con
ab.

Anuário Estatístico da Agroenergia – 2012 217
Tab
ela
142
– R
end
imen
to d
e p
lum
a d
e al
go
dão
no
Bra
sil,
no
per
íod
o d
e 19
77 a
199
4, e
m p
orc
enta
gem
Tabl
e 14
2 –
Cot
ton
yiel
d in
Bra
zil b
etw
een
1977
to
1994
, in
perc
enta
ge
Reg
ião
/UF
(Reg
ion/
Stat
e)19
76/7
719
77/7
8 19
78/7
919
79/8
019
80/8
119
81/8
219
82/8
319
83/8
419
84/8
519
85/8
619
86/8
719
87/8
819
88/8
919
89/9
019
90/9
119
91/9
219
92/9
319
93/9
4
No
rte
(Nor
th)
--
--
-30
,030
,130
,331
,330
,730
,330
,831
,130
,831
,030
,930
,933
,8
RR
--
--
--
--
--
--
--
--
--
RO
--
--
--
--
--
-31
,431
,031
,031
,031
,131
,033
,9A
C-
--
--
--
--
--
--
--
--
-A
M-
--
--
--
--
--
--
--
--
-A
P-
--
--
--
--
--
--
--
--
-PA
--
--
-30
,030
,130
,331
,330
,730
,330
,331
,329
,830
,430
,0-
33,3
TO-
--
--
--
--
--
--
--
30,0
30,0
-N
ord
este
(N
orth
east
)30
,030
,030
,030
,130
,730
,531
,230
,532
,333
,032
,833
,032
,433
,132
,633
,133
,732
,8
MA
29,9
30,0
30,0
30,0
29,9
30,2
30,0
30,4
30,3
31,6
31,3
31,8
30,0
25,0
25,0
25,0
33,3
33,3
PI30
,130
,030
,030
,030
,130
,129
,930
,030
,931
,030
,930
,930
,930
,831
,031
,031
,032
,0C
E30
,030
,030
,030
,130
,130
,030
,030
,031
,031
,031
,031
,031
,030
,931
,031
,031
,032
,0R
N29
,930
,030
,230
,330
,029
,929
,929
,930
,930
,930
,831
,030
,931
,331
,031
,030
,031
,9PB
30,0
30,1
30,0
30,1
30,1
29,8
30,0
30,0
30,9
31,1
31,1
31,0
30,9
31,3
31,1
31,0
30,0
32,1
PE30
,030
,130
,130
,029
,929
,930
,330
,031
,031
,131
,330
,931
,230
,231
,331
,233
,332
,2A
L30
,030
,129
,929
,930
,030
,030
,030
,031
,031
,030
,931
,130
,832
,431
,430
,633
,331
,9SE
30,3
29,7
30,0
29,2
30,0
29,9
30,3
29,5
30,9
31,0
31,3
31,0
30,8
31,3
27,3
33,3
-32
,1B
A30
,030
,030
,030
,034
,934
,934
,934
,835
,034
,935
,035
,034
,935
,035
,035
,035
,034
,0C
entr
o-
Oes
te
(Cen
tral
W
est)
35,0
35,0
35,0
35,0
35,0
35,0
35,1
35,0
35,0
35,0
35,0
35,0
35,0
35,0
35,8
35,0
35,0
34,0
MT
--
35,3
35,0
35,0
35,3
35,7
34,7
35,2
35,0
34,8
35,1
34,9
35,0
36,6
35,0
35,0
34,0
MS
35,0
35,0
35,0
35,0
35,0
35,0
35,1
35,0
35,0
35,0
35,0
35,0
34,9
35,0
35,7
35,0
35,0
34,0
GO
35,0
35,0
35,0
35,0
35,0
35,0
35,0
35,0
35,0
35,0
35,0
35,0
35,0
35,0
35,0
35,0
35,0
34,0
DF
--
--
--
--
--
--
--
--
--
Sud
este
(S
outh
east
)35
,035
,035
,035
,935
,935
,935
,835
,935
,835
,035
,035
,035
,035
,034
,535
,035
,034
,0
MG
35,0
35,0
35,0
35,0
35,0
35,0
35,0
35,0
35,0
35,0
35,0
35,0
35,0
35,0
35,0
35,0
35,0
34,0
ES-
--
--
--
--
--
--
--
--
-R
J-
--
--
--
--
--
--
--
--
-SP
35,0
35,0
35,0
36,0
36,0
36,0
36,0
36,0
36,0
35,0
35,0
35,0
35,0
35,0
34,3
35,0
35,0
34,0
Sul (
Sout
h)35
,035
,035
,036
,036
,036
,036
,036
,036
,036
,036
,036
,036
,036
,035
,035
,036
,034
,0PR
35,0
35,0
35,0
36,0
36,0
36,0
36,0
36,0
36,0
36,0
36,0
36,0
36,0
36,0
35,0
35,0
36,0
34,0
SC-
--
--
--
--
--
--
--
--
-R
S-
--
--
--
--
--
--
--
--
-N
ort
e/N
ord
este
(N
orth
/N
orth
east
)
30,0
30,0
30,0
30,1
30,7
30,4
31,1
30,5
32,3
33,0
32,8
32,9
32,3
32,8
32,5
32,9
33,2
32,9
Cen
tro
-Su
l (C
ente
r-So
uth)
35,0
35,0
35,0
35,9
35,8
35,9
35,8
35,8
35,8
35,4
35,4
35,5
35,5
35,5
35,0
35,0
35,5
34,0
Bra
sil (
Braz
il)33
,333
,033
,634
,334
,834
,535
,234
,135
,134
,935
,134
,934
,835
,134
,634
,735
,233
,7
Font
e (S
ourc
e): M
apa/
Con
ab.

Ministério da Agricultura, Pecuária e Abastecimento218
Tab
ela
143
– R
end
imen
to d
e p
lum
a d
e al
go
dão
no
Bra
sil n
o p
erío
do
de
1995
a 2
012,
em
po
rcen
tag
emTa
ble
143
– C
otto
n yi
eld
in B
razi
l bet
wee
n 19
95 t
o 20
12, i
n pe
rcen
tage
Regi
ão/U
F (R
egio
n/St
ate)
1994
/95
1995
/96
1996
/97
1997
/98
1998
/99
1999
/200
020
00/0
120
01/0
220
02/0
320
03/0
420
04/0
520
05/0
620
06/0
720
07/0
820
08/0
920
09/1
020
10/1
120
11/1
2
Nor
te (N
orth
)35
,035
,235
,134
,934
,933
,334
,333
,335
,736
,736
,5-
38,0
38,0
39,0
39,0
39,0
39,0
RR
--
--
35,5
--
--
--
--
--
--
-R
O35
,035
,135
,435
,333
,333
,334
,3-
--
--
--
--
--
AC
--
--
--
--
--
--
--
--
--
AM
--
--
--
--
--
--
--
--
--
AP
--
--
--
--
--
--
--
--
--
PA35
,535
,533
,333
,3-
33,3
--
--
--
--
--
--
TO-
--
--
--
33,3
35,7
36,7
36,5
38,0
38,0
39,0
39,0
39,0
39,0
No
rdes
te
(Nor
thea
st)
35,0
35,0
35,0
34,9
35,0
34,5
37,5
37,3
38,9
38,7
38,6
38,4
39,3
39,3
39,3
39,9
39,3
39,3
MA
--
--
--
36,7
36,9
37,7
37,4
37,5
37,5
38,5
38,5
38,5
39,0
39,0
39,0
PI34
,935
,034
,935
,335
,633
,833
,334
,533
,333
,033
,036
,036
,036
,038
,039
,539
,539
,5C
E35
,035
,035
,034
,935
,034
,033
,133
,333
,132
,833
,035
,035
,035
,035
,035
,035
,035
,0R
N34
,935
,034
,833
,335
,334
,033
,333
,333
,132
,833
,035
,035
,035
,035
,035
,035
,035
,0PB
35,1
34,9
34,9
33,3
34,8
34,0
33,3
33,3
33,3
33,0
33,0
35,0
35,0
35,0
35,0
35,0
35,0
35,0
PE34
,634
,935
,036
,436
,434
,032
,033
,332
,333
,333
,033
,033
,033
,033
,035
,035
,035
,0A
L35
,734
,735
,235
,035
,034
,133
,333
,333
,331
,733
,033
,033
,033
,033
,035
,035
,035
,0SE
35,7
37,5
35,7
33,3
33,3
33,3
--
--
--
--
--
--
BA
35,0
35,0
35,0
34,9
35,0
35,0
38,5
38,5
40,0
39,3
38,9
38,7
39,5
39,5
39,5
40,0
39,3
39,3
Cen
tro
-O
este
(C
entr
al
Wes
t)
35,0
35,0
35,0
35,0
36,6
38,2
38,6
38,6
38,4
38,5
37,8
38,1
39,0
39,0
39,0
39,0
36,9
36,8
MT
35,0
35,0
35,0
35,0
37,5
38,5
38,8
38,8
38,5
38,7
37,7
38,2
39,0
39,0
39,0
39,0
36,5
36,5
MS
35,0
35,0
34,9
35,0
36,0
37,5
38,5
38,5
38,5
38,5
38,2
38,0
38,5
38,5
39,0
39,0
39,0
39,0
GO
35,0
35,0
35,0
35,0
35,0
37,5
38,0
38,0
38,0
38,0
38,0
37,5
39,0
39,0
39,0
38,8
37,9
37,9
DF
--
--
-34
,838
,539
,338
,538
,138
,038
,039
,0-
38,8
38,8
Sud
este
(S
outh
east
)35
,035
,035
,035
,034
,335
,636
,736
,737
,937
,837
,237
,237
,737
,738
,539
,239
,139
,1
MG
35,0
34,9
35,0
35,0
35,0
36,5
37,0
37,0
37,5
37,5
37,5
37,5
37,5
37,5
38,5
39,2
39,2
39,2
ES-
--
--
--
--
--
--
--
--
-R
J-
--
--
--
--
--
--
--
--
-SP
35,0
35,0
35,0
35,0
34,0
35,0
36,5
36,5
38,0
38,0
37,0
37,0
38,0
38,0
38,5
39,0
39,0
39,0
Sul (
Sout
h)35
,035
,035
,035
,035
,035
,035
,735
,735
,335
,335
,335
,337
,037
,038
,038
,038
,038
,0PR
35,0
35,0
35,0
35,0
35,0
35,0
35,7
35,7
35,3
35,3
35,3
35,3
37,0
37,0
38,0
38,0
38,0
38,0
SC-
--
--
--
--
--
--
--
--
-R
S-
--
--
--
--
--
--
--
--
-N
ort
e/N
ord
este
(N
orth
/N
orth
east
)
35,0
35,0
35,0
34,9
35,0
34,5
37,4
37,3
38,9
38,7
38,5
38,4
39,3
39,3
39,3
39,9
39,3
39,3
Cen
tro
-Su
l (C
ente
r-So
uth)
35,0
35,0
35,0
35,0
36,1
37,5
38,2
38,2
38,2
38,3
37,7
38,0
38,9
38,9
39,0
39,0
37,0
37,0
Bra
sil (
Braz
il)35
,035
,035
,035
,036
,037
,138
,238
,138
,338
,437
,938
,139
,039
,039
,139
,337
,837
,7
Font
e (S
ourc
e): M
apa/
Con
ab.

Anuário Estatístico da Agroenergia – 2012 219
Tab
ela
144
– R
end
imen
to d
e ca
roço
de
alg
od
ão n
o B
rasi
l, n
o p
erío
do
de
1977
a 1
994,
em
po
rcen
tag
emTa
ble
144
– C
otto
nsee
d yi
eld
in B
razi
l bet
wee
n 19
77 t
o 19
94, i
n pe
rcen
tage
Regi
ão/U
F (R
egio
n/St
ate)
1976
/77
1977
/78
1978
/79
1979
/80
1980
/81
1981
/82
1982
/83
1983
/84
1984
/85
1985
/86
1986
/87
1987
/88
1988
/89
1989
/90
1990
/91
1991
/92
1992
/93
1993
/94
Nor
te (N
orth
)-
--
--
70,0
69,9
69,7
68,8
69,3
69,7
69,2
68,9
69,2
69,0
69,1
69,1
66,2
RR-
--
--
--
--
--
--
--
--
-RO
--
--
--
--
--
-68
,669
,069
,069
,068
,969
,066
,1A
C-
--
--
--
--
--
--
--
--
-A
M-
--
--
--
--
--
--
--
--
-A
P-
--
--
--
--
--
--
--
--
-PA
--
--
-70
,069
,969
,768
,869
,369
,769
,768
,870
,269
,670
,0-
66,7
TO-
--
--
--
--
--
--
--
70,0
70,0
-N
orde
ste
(Nor
thea
st)
70,0
70,0
70,0
69,9
69,3
69,5
68,8
69,5
67,7
67,0
67,2
67,0
67,6
66,9
67,4
66,9
66,3
67,2
MA
70,1
70,0
70,0
70,0
70,1
69,8
70,0
69,6
69,7
68,4
68,8
68,2
70,0
75,0
75,0
75,0
66,7
66,7
PI69
,970
,070
,070
,069
,969
,970
,170
,069
,169
,069
,169
,169
,169
,269
,069
,069
,068
,0CE
70,0
70,0
70,0
69,9
69,9
70,0
70,0
70,0
69,0
69,0
69,0
69,0
69,0
69,1
69,0
69,0
69,0
68,0
RN70
,170
,069
,869
,770
,070
,170
,170
,169
,169
,169
,269
,069
,168
,769
,069
,070
,068
,1PB
70,0
69,9
70,0
69,9
69,9
70,2
70,0
70,0
69,1
68,9
68,9
69,0
69,1
68,8
68,9
69,0
70,0
67,9
PE70
,069
,969
,970
,070
,170
,169
,770
,069
,068
,968
,869
,168
,869
,868
,768
,866
,767
,8A
L70
,069
,970
,170
,170
,070
,070
,070
,069
,069
,069
,168
,969
,267
,668
,669
,466
,768
,1SE
69,7
70,3
70,0
70,8
70,0
70,1
69,7
70,5
69,1
69,0
68,8
69,0
69,2
68,8
72,7
66,7
-67
,9BA
70,0
70,0
70,0
70,0
65,1
65,1
65,1
65,2
65,0
65,1
65,0
65,0
65,1
65,0
65,0
65,0
65,0
66,0
Cent
ro-
Oes
te
(Cen
tral
W
est)
65,0
65,0
65,0
65,0
65,0
65,0
64,9
65,0
65,0
65,0
65,0
65,0
65,0
65,0
64,2
65,0
65,0
66,0
MT
--
64,7
65,0
65,0
64,7
64,3
65,3
64,8
65,0
65,2
64,9
65,1
65,0
63,4
65,0
65,0
66,0
MS
65,0
65,0
65,0
65,0
65,0
65,0
64,9
65,0
65,0
65,0
65,0
65,0
65,1
65,0
64,3
65,0
65,0
66,0
GO
65,0
65,0
65,0
65,0
65,0
65,0
65,0
65,0
65,0
65,0
65,0
65,0
65,0
65,0
65,0
65,0
65,0
66,0
DF
--
--
--
--
--
--
--
--
--
Sude
ste
(Sou
thea
st)
65,0
65,0
65,0
64,1
64,1
64,1
64,2
64,1
64,2
65,0
65,0
65,0
65,0
65,0
65,5
65,0
65,0
66,0
MG
65,0
65,0
65,0
65,0
65,0
65,0
65,0
65,0
65,0
65,0
65,0
65,0
65,0
65,0
65,0
65,0
65,0
66,0
ES-
--
--
--
--
--
--
--
--
-RJ
--
--
--
--
--
--
--
--
--
SP65
,065
,065
,064
,064
,064
,064
,064
,064
,065
,065
,065
,065
,065
,065
,765
,065
,066
,0Su
l (So
uth)
65,0
65,0
65,0
64,0
64,0
64,0
64,0
64,0
64,0
64,0
64,0
64,0
64,0
64,0
65,0
65,0
64,0
66,0
PR65
,065
,065
,064
,064
,064
,064
,064
,064
,064
,064
,064
,064
,064
,065
,065
,064
,066
,0SC
--
--
--
--
--
--
--
--
--
RS-
--
--
--
--
--
--
--
--
-N
orte
/N
orde
ste
(Nor
th/
Nor
thea
st)
70,0
70,0
70,0
69,9
69,3
69,6
68,9
69,5
67,7
67,0
67,2
67,1
67,7
67,2
67,5
67,1
66,8
67,1
Cent
ro-S
ul
(Cen
ter-
Sout
h)65
,065
,065
,064
,164
,264
,164
,264
,264
,264
,664
,664
,564
,564
,565
,065
,064
,566
,0
Bras
il (B
razi
l)66
,767
,066
,465
,765
,265
,564
,865
,964
,965
,164
,965
,165
,264
,965
,465
,364
,866
,3
Font
e (S
ourc
e): M
apa/
Con
ab.

Ministério da Agricultura, Pecuária e Abastecimento220
Tab
ela
145
– R
end
imen
to d
e ca
roço
de
alg
od
ão n
o B
rasi
l, n
o
per
íod
o d
e 19
95 a
201
2, e
m p
orc
enta
gem
Tabl
e 14
5 –
Cot
tons
eed
yiel
d in
Bra
zil b
etw
een
1995
to
2012
, in
perc
enta
ge
Reg
ião
/UF
(Reg
ion/
Stat
e)19
94/9
519
95/9
619
96/9
719
97/9
819
98/9
919
99/2
000
2000
/01
2001
/02
2002
/03
2003
/04
2004
/05
2005
/06
2006
/07
2007
/08
2008
/09
2009
/10
2010
/11
2011
/12
Nor
te (N
orth
)65
,064
,864
,965
,165
,166
,765
,766
,764
,363
,363
,5-
62,0
62,0
61,0
61,0
61,0
61,0
RR
--
--
64,5
--
--
--
--
--
--
-R
O65
,064
,964
,664
,766
,766
,765
,7-
--
--
--
--
--
AC
--
--
--
--
--
--
--
--
--
AM
--
--
--
--
--
--
--
--
--
AP
--
--
--
--
--
--
--
--
--
PA64
,564
,566
,766
,7-
66,7
--
--
--
--
--
--
TO-
--
--
--
66,7
64,3
63,3
--
62,0
62,0
61,0
61,0
61,0
61,0
No
rdes
te
(Nor
thea
st)
65,0
65,0
65,0
65,1
65,0
65,5
62,5
62,7
61,1
61,3
61,4
61,6
60,7
60,7
60,7
60,1
60,7
60,7
MA
--
--
--
63,3
63,1
62,3
62,6
62,5
62,5
61,5
61,5
61,5
61,0
61,0
61,0
PI65
,165
,065
,164
,764
,466
,266
,765
,566
,767
,067
,064
,064
,064
,062
,060
,560
,560
,5C
E65
,065
,065
,065
,165
,066
,066
,966
,766
,967
,267
,065
,065
,065
,065
,065
,065
,065
,0R
N65
,165
,065
,266
,764
,766
,066
,766
,766
,967
,267
,065
,065
,065
,065
,065
,065
,065
,0PB
64,9
65,1
65,1
66,7
65,2
66,0
66,7
66,7
66,7
67,0
67,0
65,0
65,0
65,0
65,0
65,0
65,0
65,0
PE65
,465
,165
,063
,663
,666
,068
,066
,767
,766
,767
,067
,067
,067
,067
,065
,065
,065
,0A
L64
,365
,364
,865
,065
,065
,966
,766
,766
,768
,367
,067
,067
,067
,067
,065
,065
,065
,0SE
64,3
62,5
64,3
66,7
66,7
66,7
--
--
--
--
--
--
BA
65,0
65,0
65,0
65,1
65,0
65,0
61,5
61,5
60,0
60,7
61,1
61,3
60,5
60,5
60,5
60,0
60,7
60,7
Cen
tro
-O
este
(C
entr
al
Wes
t)
65,0
65,0
65,0
65,0
63,4
61,8
61,4
61,4
61,6
61,5
62,2
61,9
61,0
61,0
61,0
61,0
63,1
63,2
MT
65,0
65,0
65,0
65,0
62,5
61,5
61,2
61,2
61,5
61,3
62,3
61,8
61,0
61,0
61,0
61,0
63,5
63,5
MS
65,0
65,0
65,1
65,0
64,0
62,5
61,5
61,5
61,5
61,5
61,8
62,0
61,5
61,5
61,0
61,0
61,0
61,0
GO
65,0
65,0
65,0
65,0
65,0
62,5
62,0
62,0
62,0
62,0
62,0
62,5
61,0
61,0
61,0
61,2
62,1
62,1
DF
--
--
-65
,261
,560
,761
,561
,962
,062
,061
,0-
--
61,2
61,2
Sud
este
(S
outh
east
)65
,065
,065
,065
,065
,764
,463
,363
,362
,162
,262
,862
,862
,362
,361
,560
,860
,960
,9
MG
65,0
65,1
65,0
65,0
65,0
63,5
63,0
63,0
62,5
62,5
62,5
62,5
62,5
62,5
61,5
60,8
60,8
60,8
ES-
--
--
--
--
--
--
--
--
-R
J-
--
--
--
--
--
--
--
--
-SP
65,0
65,0
65,0
65,0
66,0
65,0
63,5
63,5
62,0
62,0
63,0
63,0
62,0
62,0
61,5
61,0
61,0
61,0
Sul (
Sout
h)65
,065
,065
,065
,065
,065
,064
,364
,364
,764
,764
,764
,763
,063
,062
,062
,062
,062
,0PR
65,0
65,0
65,0
65,0
65,0
65,0
64,3
64,3
64,7
64,7
64,7
64,7
63,0
63,0
62,0
62,0
62,0
62,0
SC-
--
--
--
--
--
--
--
--
-R
S-
--
--
--
--
--
--
--
--
-N
ort
e/N
ord
este
(N
orth
/N
orth
east
)
65,0
65,0
65,0
65,1
65,0
65,5
62,6
62,7
61,1
61,3
61,5
61,6
60,7
60,7
60,7
60,1
60,7
60,7
Cen
tro
-Su
l (C
ente
r-So
uth)
65,0
65,0
65,0
65,0
63,9
62,5
61,8
61,8
61,8
61,7
62,3
62,0
61,1
61,1
61,0
61,0
63,0
63,0
Bra
sil (
Braz
il)65
,065
,065
,065
,064
,062
,961
,861
,961
,761
,662
,161
,961
,061
,060
,960
,762
,262
,3
Font
e (S
ourc
e): M
apa/
Con
ab.

Anuário Estatístico da Agroenergia – 2012 221
4.5 Amendoim4.5 Peanut4.5.1 Informações técnicas4.5.1 Technical information
Tabela 146 – Informações técnicas da cultura do amendoimTable 146 – Technical information of peanut crop
ItemItem
Amendoim das águasRain harvest
Amendoim das secasDry harvest
Ciclo (Cycle) 85 - 140 dias/days 85 - 140 dias (days)
Teor de óleo (Oil content) 45% (40 - 52) 45% (40 - 52)
Teor de farelo nos grãos (Grain meal content)
48% - 60% 48% - 60%
Produtividade média em casca (Averege productivity in shell)
2.400 kg/ha (1.500 - 4.000) 2.400 kg/ha (1.500 - 4.000)
Rendimento em grãos (Grain yield)
71% (70 - 75) 71% (70 - 75)
Produtividade média em grãos (Grain average productivity)
1.750 kg/ha (1.000 - 2.800) 1.750 kg/ha (1.000 - 2.800)
Rendimento em óleo vegetal (Oil yield)
788 kg/ha 788 kg/ha
Cultivares registrados no Mapa (Registered cultivars in Mapa)
25 (Arachis hypogaea L.)
Defensivos registrados no Mapa (Registered pesticides in Mapa)
121
Fonte (Source): Mapa.

Ministério da Agricultura, Pecuária e Abastecimento222
4.5.2 Produção mundial4.5.2 World production
Tabela 147 – Principais países produtores de amendoim, em milhões de toneladasTable 147 – Main peanut producing countries, in million tons
1998/99 1999/00 2000/01 2001/02 2002/03 2003/04 2004/05 2005/06 2006/07 2007/08 2008/09 2009/10 2010/11 2011/12
China (China) 11,89 12,64 14,44 14,42 14,82 13,42 14,34 14,34 12,89 13,03 14,29 14,71 15,64 16,00
Índia (India) 7,45 5,50 5,70 7,60 5,20 7,70 7,00 6,30 5,39 6,80 6,25 4,90 5,85 5,50
Nigéria (Nigeria)
1,43 1,45 1,47 1,49 1,51 1,51 1,52 1,52 1,52 1,55 1,55 1,55 1,55 1,55
Indonésia (Indonesia)
0,93 1,02 1,04 1,03 1,09 1,13 1,15 1,17 1,20 1,15 1,25 1,25 1,25 1,25
Senegal (Senegal)
0,54 0,76 1,00 0,90 0,26 0,45 0,57 0,70 0,46 0,33 0,45 1,03 1,29 0,70
EUA (USA) 1,80 1,74 1,48 1,94 1,51 1,88 1,95 2,21 1,57 1,67 2,34 1,68 1,89 1,65
Demais países (Other
countries)
5,78 5,95 5,98 6,25 5,96 6,52 6,86 6,80 7,64 7,86 8,34 8,24 8,41 8,81
Mundo (World)
29,82 29,06 31,11 33,63 30,35 32,61 33,39 33,04 30,67 32,39 34,47 33,36 35,88 35,46
Fonte (Source): USDA; Mapa.
Gráfico 107 – Principais países produtores de amendoim, em milhões de toneladasChart 107 – Main peanut producing countries, in million tons
0
5
10
15
20
25
30
35
40
1998
/99
1999
/00
2000
/01
2001
/02
2002
/03
2003
/04
2004
/05
2005
/06
2006
/07
2007
/08
2008
/09
2009
/10
2010
/11
2011
/12
Pro
du
ção
(m
ilhõ
es d
e to
nel
adas
)
Pro
du
ctio
n (
mill
ion
to
ns)
Safras / Harvests
Demais países (Other countries)
EUA (USA)
Senegal (Senegal)
Indonésia (Indonesia)
Nigéria (Nigeria)
Índia (India)
China (China)

Anuário Estatístico da Agroenergia – 2012 223
Tabela 148 – Produção mundial de óleo de amendoim, em milhões de toneladasTable 148 – World peanut oil production, in million tons
SafrasHarvest
Produção de óleo (milhões de toneladas)Oil production (million tons)
1998/99 4,4
1999/00 4,2
2000/01 4,3
2001/02 5,1
2002/03 4,6
2003/04 5,0
2004/05 5,1
2005/06 5,0
2006/07 4,5
2007/08 4,9
2008/09 5,0
2009/10 4,7
2010/11 5,1
2011/12 5,3
Fonte (Source): Mapa; USDA.
Gráfico 108 – Produção mundial de óleo de amendoim, em milhões de toneladasChart 108 – World peanut oil production, in million tons
0,0
1,0
2,0
3,0
4,0
5,0
6,0
1998
/99
1999
/00
2000
/01
2001
/02
2002
/03
2003
/04
2004
/05
2005
/06
2006
/07
2007
/08
2008
/09
2009
/10
2010
/11
2011
/12
Pro
du
ção
de
óle
o (
milh
ões
de
ton
elad
as)
Oil
Pro
du
ctio
n (
mill
ion
to
ns)
Safras / Harvest

Ministério da Agricultura, Pecuária e Abastecimento224
4.5.3 Produção nacional4.5.3 National production
Tabela 149 – Série histórica da produção, área plantada e produtividade de amendoim no BrasilTable 149 – Peanut production, planted area and productivity in Brazil
SafrasHarvests
Produção (mil toneladas)
Production (thousand tons)
Área plantada (mil hectares)
Planted area (thousand ha)
Produtividade (em kg/ha)Productivity (kg/ha)
1976/77 314,3 222,4 1.4131977/78 342,4 250,8 1.3651978/79 458,4 285,6 1.6051979/80 524,6 336,5 1.5591980/81 320,3 222,0 1.4431981/82 384,2 254,0 1.3711982/83 274,6 209,3 1.3121983/84 219,7 139,4 1.5761984/85 326,6 187,8 1.7391985/86 212,6 162,0 1.3121986/87 202,3 143,7 1.4081987/88 167,9 98,5 1.7051988/89 148,6 89,2 1.6661989/90 143,9 90,0 1.5991990/91 138,8 87,4 1.5881991/92 163,7 97,5 1.6791992/93 146,6 82,4 1.7791993/94 159,6 90,8 1.7581994/95 142,5 93,2 1.5291995/96 138,8 81,4 1.7051996/97 137,2 88,5 1.5501997/98 183,5 100,0 1.8351998/99 172,4 96,7 1.7831999/00 171,6 104,0 1.6502000/01 196,7 102,4 1.9212001/02 189,4 93,9 2.0172002/03 174,9 84,5 2.0702003/04 217,3 98,2 2.2132004/05 301,6 129,5 2.3292005/06 267,7 113,1 2.3672006/07 225,7 102,6 2.2002007/08 303,1 115,2 2.6312008/09 300,6 113,8 2.6422009/10 226,0 84,1 2.6872010/11 226,5 84,7 2.6742011/12 296,7 101,4 2.926
Fonte (Source): Mapa/Conab.

Anuário Estatístico da Agroenergia – 2012 225
Gráfico 109 – Série histórica da produção de amendoim no Brasil, em mil toneladasChart 109 – Peanuts production in Brazil, in thousand tons
100
150
200
250
300
350
400
450
500
550
1976
/77
1978
/79
1980
/81
1982
/83
1984
/85
1986
/87
1988
/89
1990
/91
1992
/93
1994
/95
1996
/97
1998
/99
2000
/01
2002
/03
2004
/05
2006
/07
2008
/09
2010
/11
Pro
du
ção
(m
il to
nel
adas
)
Pro
du
ctio
n (
tho
usa
nd
to
ns)
Safras / Harvests
Gráfico 110 – Série histórica da área plantada de amendoim no Brasil, em mil hectaresChart 110 – Peanuts planted area in Brazil, in thousand hectares
50
100
150
200
250
300
350
400
1976
/77
1978
/79
1980
/81
1982
/83
1984
/85
1986
/87
1988
/89
1990
/91
1992
/93
1994
/95
1996
/97
1998
/99
2000
/01
2002
/03
2004
/05
2006
/07
2008
/09
2010
/11
Áre
a (m
il h
ecta
res)
A
rea
(th
ou
san
d h
ecta
res)
Safras / Harvests

Ministério da Agricultura, Pecuária e Abastecimento226
Gráfico 111 – Série histórica da produtividade de amendoim no Brasil, em kg/haChart 111 – Peanuts productivity in Brazil, in kg/ha
1.200
1.400
1.600
1.800
2.000
2.200
2.400
2.600
2.800
3.000
3.200
1976
/77
1978
/79
1980
/81
1982
/83
1984
/85
1986
/87
1988
/89
1990
/91
1992
/93
1994
/95
1996
/97
1998
/99
2000
/01
2002
/03
2004
/05
2006
/07
2008
/09
2010
/11
Pro
du
tivi
dad
e (k
g/h
a)
Pro
du
ctiv
ity
(kg
/ha)
Safras / Harvests

Anuário Estatístico da Agroenergia – 2012 227
Tab
ela
150
– Pr
od
uçã
o d
e am
end
oim
no
Bra
sil n
o p
erío
do
de
1977
a 1
994,
em
mil
ton
elad
asTa
ble
150
– Pe
anut
pro
duct
ion
in B
razi
l bet
wee
n 19
77 t
o 19
94, i
n th
ousa
nd t
ons
Reg
ião
/UF
(Reg
ion/
Stat
e)19
76/7
719
77/7
8 19
78/7
919
79/8
019
80/8
119
81/8
219
82/8
319
83/8
419
84/8
519
85/8
619
86/8
719
87/8
819
88/8
919
89/9
019
90/9
119
91/9
219
92/9
319
93/9
4
Nor
te (N
orth
)-
--
--
--
--
--
--
--
--
-R
R-
--
--
--
--
--
--
--
--
-R
O-
--
--
--
--
--
--
--
--
-A
C-
--
--
--
--
--
--
--
--
-A
M-
--
--
--
--
--
--
--
--
-A
P-
--
--
--
--
--
--
--
--
-PA
--
--
--
--
--
--
--
--
--
TO-
--
--
--
--
--
--
--
--
-N
ord
este
(N
orth
east
)5,
44,
94,
84,
43,
84,
93,
94,
14,
17,
07,
17,
16,
66,
88,
07,
53,
26,
0
MA
--
--
--
--
--
--
--
--
--
PI-
--
--
--
--
--
--
--
--
-C
E1,
61,
41,
00,
40,
40,
70,
30,
50,
50,
71,
01,
00,
70,
71,
31,
20,
11,
1R
N-
--
--
--
--
--
--
--
--
-PB
0,4
0,5
0,6
0,6
0,4
0,6
0,6
0,9
0,9
1,3
0,9
1,1
1,1
1,0
1,0
0,6
0,1
0,9
PE-
--
--
--
--
--
--
--
--
-A
L-
--
--
--
--
--
--
--
--
-SE
--
--
--
--
-1,
41,
41,
61,
51,
41,
51,
50,
11,
4B
A3,
43,
03,
23,
43,
03,
63,
02,
72,
73,
63,
83,
43,
33,
74,
24,
22,
92,
6C
entr
o-
Oes
te
(Cen
tral
W
est)
43,7
27,1
37,0
39,0
20,3
10,4
8,5
3,9
4,4
3,0
5,9
2,3
0,6
0,6
0,5
0,5
0,4
0,3
MT
14,2
-1,
30,
8-
-0,
30,
2-
0,5
1,7
1,7
0,1
0,1
0,1
0,1
0,1
-M
S28
,125
,031
,436
,520
,110
,07,
93,
34,
32,
54,
20,
60,
50,
50,
50,
50,
30,
3G
O1,
42,
14,
31,
70,
20,
40,
30,
40,
1-
--
--
--
--
DF
--
--
--
--
--
--
--
--
--
Sud
este
(S
outh
east
)21
3,0
251,
734
0,4
392,
123
3,3
286,
322
1,8
188,
328
6,1
190,
416
9,2
145,
913
1,7
127,
212
0,6
141,
513
3,4
143,
9
MG
-4,
16,
611
,46,
25,
71,
81,
71,
71,
51,
61,
31,
11,
01,
00,
91,
92,
0ES
--
--
--
--
--
--
--
--
--
RJ
--
--
--
--
--
--
--
--
--
SP21
3,0
247,
633
3,8
380,
722
7,1
280,
622
0,0
186,
628
4,4
188,
916
7,6
144,
613
0,6
126,
211
9,6
140,
613
1,5
141,
9Su
l (So
uth)
52,2
58,7
76,2
89,1
62,9
46,6
40,4
23,4
32,0
12,2
20,1
12,6
9,7
9,3
9,7
14,2
9,6
9,4
PR42
,750
,470
,380
,154
,638
,032
,014
,925
,56,
414
,56,
73,
93,
54,
15,
23,
93,
2SC
--
-1,
51,
82,
12,
02,
1-
--
--
--
--
-R
S9,
58,
35,
97,
56,
56,
56,
46,
46,
55,
85,
65,
95,
85,
85,
69,
05,
76,
2N
ort
e/N
ord
este
(N
orth
/N
orth
east
)
5,4
4,9
4,8
4,4
3,8
4,9
3,9
4,1
4,1
7,0
7,1
7,1
6,6
6,8
8,0
7,5
3,2
6,0
Cen
tro
-Su
l (C
ente
r-So
uth)
308,
933
7,5
453,
652
0,2
316,
534
3,3
270,
721
5,6
322,
520
5,6
195,
216
0,8
142,
013
7,1
130,
815
6,2
143,
415
3,6
Bra
sil (
Braz
il)31
4,3
342,
445
8,4
524,
632
0,3
348,
227
4,6
219,
732
6,6
212,
620
2,3
167,
914
8,6
143,
913
8,8
163,
714
6,6
159,
6
Font
e (S
ourc
e): M
apa/
Con
ab.

Ministério da Agricultura, Pecuária e Abastecimento228
Tab
ela
151
– Pr
od
uçã
o d
e am
end
oim
no
Bra
sil n
o p
erío
do
de
1995
a 2
012,
em
mil
ton
elad
asTa
ble
151–
Pea
nut p
rodu
ctio
n in
Bra
zil b
etw
een
1995
to 2
012,
in th
ousa
nd to
ns
Reg
ião
/UF
(Reg
ion/
Stat
e)19
94/9
519
95/9
619
96/9
719
97/9
819
98/9
919
99/2
000
2000
/01
2001
/02
2002
/03
2003
/04
2004
/05
2005
/06
2006
/07
2007
/08
2008
/09
2009
/10
2010
/11
2011
/12
Nor
te (N
orth
)-
--
--
--
--
--
--
6,3
8,4
9,2
4,9
8,4
RR
--
--
--
--
--
--
--
--
--
RO
--
--
--
--
--
--
--
--
--
AC
--
--
--
--
--
--
--
--
--
AM
--
--
--
--
--
--
--
--
--
AP
--
--
--
--
--
--
--
--
--
PA-
--
--
--
--
--
--
--
--
-TO
--
--
--
--
--
--
-6,
38,
49,
24,
98,
4N
ord
este
(N
orth
east
)6,
56,
36,
45,
35,
66,
45,
45,
610
,014
,511
,012
,710
,911
,811
,010
,510
,99,
6
MA
--
--
--
--
--
--
--
--
--
PI-
--
--
--
--
--
--
--
--
-C
E1,
51,
31,
10,
91,
01,
30,
30,
60,
50,
50,
71,
00,
51,
11,
40,
42,
61,
2R
N-
--
--
--
--
--
--
--
--
-PB
0,6
0,6
0,5
0,2
0,2
0,7
0,7
0,4
0,5
1,1
1,1
2,3
1,6
1,6
0,7
0,1
0,2
0,3
PE-
--
--
--
--
--
--
--
--
-A
L-
--
--
--
--
--
--
--
--
-SE
1,4
1,4
1,8
1,2
1,4
1,4
1,4
1,2
1,2
1,3
1,4
1,4
1,6
1,9
2,1
1,9
1,9
1,9
BA
3,0
3,0
3,0
3,0
3,0
3,0
3,0
3,4
7,8
11,6
7,7
7,9
7,2
7,2
6,8
8,1
6,2
6,2
Cen
tro
-O
este
(C
entr
al
Wes
t)
--
--
--
--
--
33,2
27,9
16,0
12,6
14,5
7,8
7,5
7,1
MT
--
--
--
--
--
19,9
21,3
9,7
6,2
12,9
7,8
7,5
7,1
MS
--
--
--
--
--
12,2
4,7
1,2
--
--
-G
O-
--
--
--
--
-1,
21,
95,
16,
41,
6-
--
DF
--
--
--
--
--
--
--
--
--
Sud
este
(S
outh
east
)12
7,1
121,
711
9,2
166,
615
5,3
154,
917
4,1
167,
915
0,6
188,
824
5,7
211,
817
9,4
248,
424
4,8
180,
018
7,0
260,
4
MG
1,7
1,5
1,4
1,5
1,9
5,1
9,6
10,5
4,2
13,1
19,6
4,0
6,0
12,0
10,7
9,5
8,1
8,3
ES-
--
--
--
--
--
--
--
--
-R
J-
--
--
--
--
--
--
--
--
-SP
125,
412
0,2
117,
816
5,1
153,
414
9,8
164,
515
7,4
146,
417
5,7
226,
120
7,8
173,
423
6,4
234,
117
0,5
178,
925
2,1
Sul (
Sout
h)8,
910
,811
,611
,611
,510
,317
,215
,914
,314
,011
,815
,319
,424
,021
,918
,516
,211
,2PR
2,7
5,0
5,2
5,0
4,9
3,7
10,3
8,6
7,4
7,9
7,8
8,8
12,5
17,2
15,6
12,0
9,7
5,7
SC-
--
--
--
--
--
--
--
--
-R
S6,
25,
86,
46,
66,
66,
66,
97,
36,
96,
14,
06,
56,
96,
86,
36,
56,
55,
5N
ort
e/N
ord
este
(N
orth
/N
orth
east
)
6,5
6,3
6,4
5,3
5,6
6,4
5,4
5,6
10,0
14,5
11,0
12,7
10,9
18,1
19,4
19,7
15,8
18,0
Cen
tro
-Su
l (C
ente
r-So
uth)
136,
013
2,5
130,
817
8,2
166,
816
5,2
191,
318
3,8
164,
920
2,8
290,
725
5,1
214,
828
5,0
281,
220
6,3
210,
727
8,7
Bra
sil (
Braz
il)14
2,5
138,
813
7,2
183,
517
2,4
171,
619
6,7
189,
417
4,9
217,
330
1,6
267,
722
5,7
303,
130
0,6
226,
022
6,5
296,
7
Font
e (S
ourc
e): M
apa/
Con
ab.

Anuário Estatístico da Agroenergia – 2012 229
Tab
ela
152
– Á
rea
pla
nta
da
de
amen
do
im n
o B
rasi
l no
per
íod
o d
e 19
77 a
199
4, e
m m
il h
ecta
res
Tabl
e 15
2 –
Pean
ut p
lant
ed a
rea
in B
razi
l bet
wee
n 19
77 t
o 19
94, i
n th
ousa
nd h
ecta
res
Reg
ião
/UF
(Reg
ion/
Stat
e)19
76/7
719
77/7
8 19
78/7
919
79/8
019
80/8
119
81/8
219
82/8
319
83/8
419
84/8
519
85/8
619
86/8
719
87/8
819
88/8
919
89/9
019
90/9
119
91/9
219
92/9
319
93/9
4
No
rte
(Nor
th)
--
--
--
--
--
--
--
--
--
RR
--
--
--
--
--
--
--
--
--
RO
--
--
--
--
--
--
--
--
--
AC
--
--
--
--
--
--
--
--
--
AM
--
--
--
--
--
--
--
--
--
AP
--
--
--
--
--
--
--
--
--
PA-
--
--
--
--
--
--
--
--
-TO
--
--
--
--
--
--
--
--
--
No
rdes
te
(Nor
thea
st)
4,5
4,0
3,9
4,2
3,7
3,5
3,4
3,7
3,7
6,1
6,4
6,5
6,4
6,1
7,2
7,4
6,5
5,5
MA
--
--
--
--
--
--
--
--
--
PI-
--
--
--
--
--
--
--
--
-C
E1,
81,
41,
01,
30,
50,
90,
70,
70,
70,
60,
90,
90,
80,
81,
31,
31,
31,
0R
N-
--
--
--
--
--
--
--
--
-PB
0,4
0,5
0,6
0,6
0,7
0,6
0,7
1,0
1,0
1,5
1,2
1,4
1,4
1,2
1,1
1,3
1,3
1,0
PE-
--
--
--
--
--
--
--
--
-A
L-
--
--
--
--
--
--
--
--
-SE
--
--
--
--
-1,
31,
41,
31,
41,
31,
31,
31,
31,
2B
A2,
32,
12,
32,
32,
52,
02,
02,
02,
02,
72,
92,
92,
82,
83,
53,
52,
62,
3C
entr
o-
Oes
te
(Cen
tral
W
est)
30,2
22,6
22,2
27,8
12,1
8,1
6,5
3,0
3,6
3,2
4,6
1,8
0,4
0,4
0,3
0,3
0,3
0,2
MT
10,0
-0,
90,
6-
-0,
20,
2-
0,3
1,3
1,3
0,1
0,1
0,1
0,1
0,1
-M
S19
,321
,118
,726
,311
,97,
96,
12,
53,
62,
93,
30,
50,
30,
30,
30,
30,
20,
2G
O0,
91,
52,
60,
90,
20,
20,
20,
3-
--
--
--
--
-D
F-
--
--
--
--
--
--
--
--
-Su
des
te
(Sou
thea
st)
144,
917
5,7
207,
924
2,2
161,
520
7,3
167,
611
4,3
160,
713
3,4
117,
479
,174
,676
,072
,281
,868
,478
,2
MG
-3,
24,
56,
44,
03,
81,
81,
81,
81,
51,
51,
31,
21,
11,
11,
01,
41,
4ES
--
--
--
--
--
--
--
--
--
RJ
--
--
--
--
--
--
--
--
--
SP14
4,9
172,
520
3,4
235,
815
7,5
203,
516
5,8
112,
515
8,9
131,
911
5,9
77,8
73,4
74,9
71,1
80,8
67,0
76,8
Sul (
Sout
h)42
,848
,551
,662
,344
,735
,131
,818
,419
,819
,315
,311
,17,
87,
57,
77,
97,
26,
9PR
33,9
40,2
44,4
54,6
37,5
27,1
24,0
10,6
13,0
13,3
9,8
5,8
2,8
2,5
2,8
2,9
2,2
1,9
SC-
--
1,0
1,2
1,4
1,4
1,4
0,3
--
--
--
--
-R
S8,
98,
37,
26,
76,
06,
66,
46,
46,
56,
05,
55,
35,
05,
04,
95,
05,
05,
0N
ort
e/N
ord
este
(N
orth
/N
orth
east
)
4,5
4,0
3,9
4,2
3,7
3,5
3,4
3,7
3,7
6,1
6,4
6,5
6,4
6,1
7,2
7,4
6,5
5,5
Cen
tro
-Su
l (C
ente
r-So
uth)
217,
924
6,8
281,
733
2,3
218,
325
0,5
205,
913
5,7
184,
115
5,9
137,
392
,082
,883
,980
,290
,075
,985
,3
Bra
sil (
Braz
il)22
2,4
250,
828
5,6
336,
522
2,0
254,
020
9,3
139,
418
7,8
162,
014
3,7
98,5
89,2
90,0
87,4
97,5
82,4
90,8
Font
e (S
ourc
e): M
apa/
Con
ab.

Ministério da Agricultura, Pecuária e Abastecimento230
Tab
ela
153
– Á
rea
pla
nta
da
de
amen
do
im n
o B
rasi
l no
per
íod
o d
e 19
95 a
201
2, e
m m
il h
ecta
res
Tabl
e 15
3 –
Pean
ut p
lant
ed a
rea
in B
razi
l bet
wee
n 19
95 t
o 20
12, i
n th
ousa
nd h
ecta
res
Reg
ião
/UF
(Reg
ion/
Stat
e)19
94/9
519
95/9
619
96/9
719
97/9
819
98/9
919
99/2
000
2000
/01
2001
/02
2002
/03
2003
/04
2004
/05
2005
/06
2006
/07
2007
/08
2008
/09
2009
/10
2010
/11
2011
/12
Nor
te (N
orth
)-
--
--
--
--
--
--
2,1
2,7
3,0
1,7
1,9
RR
--
--
--
--
--
--
--
--
--
RO
--
--
--
--
--
--
--
--
--
AC
--
--
--
--
--
--
--
--
--
AM
--
--
--
--
--
--
--
--
--
AP
--
--
--
--
--
--
--
--
--
PA-
--
--
--
--
--
--
--
--
-TO
--
--
--
--
--
--
-2,
12,
73,
01,
71,
9N
ord
este
(N
orth
east
)5,
85,
96,
76,
06,
16,
76,
46,
27,
79,
79,
211
,110
,510
,510
,710
,812
,012
,1
MA
--
--
--
--
--
--
--
--
--
PI-
--
--
--
--
--
--
--
--
-C
E1,
10,
90,
90,
90,
90,
90,
60,
50,
40,
50,
60,
80,
70,
81,
11,
02,
02,
2R
N-
--
--
--
--
--
--
--
--
-PB
0,6
0,6
0,7
0,2
0,2
0,8
0,8
0,5
0,5
1,1
1,1
1,9
1,9
1,4
1,2
0,4
0,6
0,5
PE-
--
--
--
--
--
--
--
--
-A
L-
--
--
--
--
--
--
--
--
-SE
1,2
1,2
1,3
1,1
1,2
1,2
1,2
1,0
1,0
1,1
1,2
1,2
1,4
1,6
1,7
1,6
1,6
1,6
BA
2,9
3,2
3,8
3,8
3,8
3,8
3,8
4,2
5,8
7,0
6,3
7,2
6,5
6,7
6,7
7,8
7,8
7,8
Cen
tro
-O
este
(C
entr
al
Wes
t)
--
--
--
--
--
11,8
10,2
6,7
5,1
5,0
3,2
3,0
2,9
MT
--
--
--
--
--
7,1
7,3
4,0
2,5
4,5
3,2
3,0
2,9
MS
--
--
--
--
--
4,2
1,9
0,6
--
--
-G
O-
--
--
--
--
-0,
51,
02,
12,
60,
5-
--
DF
--
--
--
--
--
--
--
--
--
Sud
este
(S
outh
east
)80
,767
,773
,886
,283
,189
,386
,078
,568
,279
,999
,482
,175
,086
,984
,658
,560
,377
,5
MG
1,4
1,2
1,2
1,1
1,2
2,3
4,1
4,5
2,7
6,7
9,8
2,5
3,0
5,6
3,7
3,2
3,0
2,6
ES-
--
--
--
--
--
--
--
--
-R
J-
--
--
--
--
--
--
--
--
-SP
79,3
66,5
72,6
85,1
81,9
87,0
81,9
74,0
65,5
73,2
89,6
79,6
72,0
81,3
80,9
55,3
57,3
74,9
Sul (
Sout
h)6,
77,
88,
07,
87,
58,
010
,09,
28,
68,
69,
19,
710
,410
,610
,88,
67,
77,
0PR
1,7
2,8
2,9
2,7
2,7
3,2
5,1
4,1
3,7
3,9
4,5
5,1
5,8
6,1
6,5
4,5
3,8
3,3
SC-
--
--
--
--
--
--
--
--
-R
S5,
05,
05,
15,
14,
84,
84,
95,
14,
94,
74,
64,
64,
64,
54,
34,
13,
93,
7N
ort
e/N
ord
este
(N
orth
/N
orth
east
)
5,8
5,9
6,7
6,0
6,1
6,7
6,4
6,2
7,7
9,7
9,2
11,1
10,5
12,6
13,4
13,8
13,7
14,0
Cen
tro
-Su
l (C
ente
r-So
uth)
87,4
75,5
81,8
94,0
90,6
97,3
96,0
87,7
76,8
88,5
120,
310
2,0
92,1
102,
610
0,4
70,3
71,0
87,4
Bra
sil
(Bra
zil)
93,2
81,4
88,5
100,
096
,710
4,0
102,
493
,984
,598
,212
9,5
113,
110
2,6
115,
211
3,8
84,1
84,7
101,
4
Font
e (S
ourc
e): M
apa/
Con
ab.
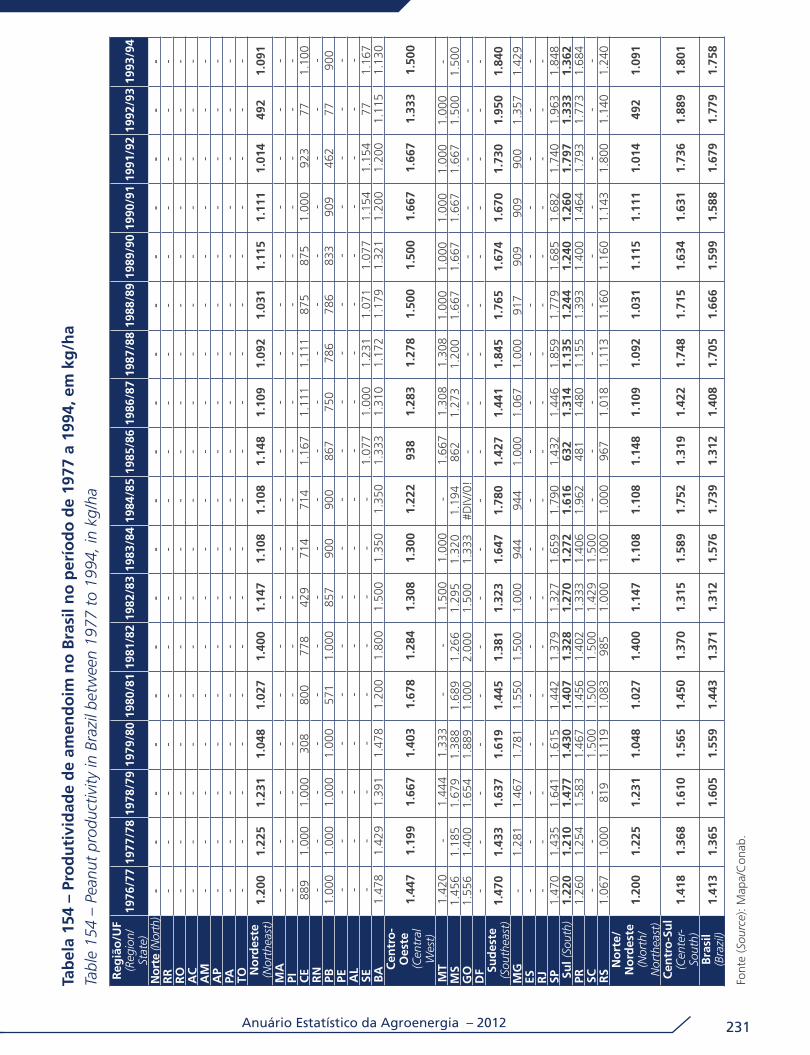
Anuário Estatístico da Agroenergia – 2012 231
Tab
ela
154
– Pr
od
uti
vid
ade
de
amen
do
im n
o B
rasi
l no
per
íod
o d
e 19
77 a
199
4, e
m k
g/h
aTa
ble
154
– Pe
anut
pro
duct
ivity
in B
razi
l bet
wee
n 19
77 t
o 19
94, i
n kg
/ha
Reg
ião
/UF
(Reg
ion/
Stat
e)19
76/7
719
77/7
8 19
78/7
919
79/8
019
80/8
119
81/8
219
82/8
319
83/8
419
84/8
519
85/8
619
86/8
719
87/8
819
88/8
919
89/9
019
90/9
119
91/9
219
92/9
319
93/9
4
Nor
te (N
orth
)-
--
--
--
--
--
--
--
--
-R
R-
--
--
--
--
--
--
--
--
-R
O-
--
--
--
--
--
--
--
--
-A
C-
--
--
--
--
--
--
--
--
-A
M-
--
--
--
--
--
--
--
--
-A
P-
--
--
--
--
--
--
--
--
-PA
--
--
--
--
--
--
--
--
--
TO-
--
--
--
--
--
--
--
--
-N
ord
este
(N
orth
east
)1.
200
1.22
51.
231
1.04
81.
027
1.40
01.
147
1.10
81.
108
1.14
81.
109
1.09
21.
031
1.11
51.
111
1.01
449
21.
091
MA
--
--
--
--
--
--
--
--
--
PI-
--
--
--
--
--
--
--
--
-C
E88
91.
000
1.00
030
880
077
842
971
471
41.
167
1.11
11.
111
875
875
1.00
092
377
1.10
0R
N-
--
--
--
--
--
--
--
--
-PB
1.00
01.
000
1.00
01.
000
571
1.00
085
790
090
086
775
078
678
683
390
946
277
900
PE-
--
--
--
--
--
--
--
--
-A
L-
--
--
--
--
--
--
--
--
-SE
--
--
--
--
-1.
077
1.00
01.
231
1.07
11.
077
1.15
41.
154
771.
167
BA
1.47
81.
429
1.39
11.
478
1.20
01.
800
1.50
01.
350
1.35
01.
333
1.31
01.
172
1.17
91.
321
1.20
01.
200
1.11
51.
130
Cen
tro
-O
este
(C
entr
al
Wes
t)
1.44
71.
199
1.66
71.
403
1.67
81.
284
1.30
81.
300
1.22
293
81.
283
1.27
81.
500
1.50
01.
667
1.66
71.
333
1.50
0
MT
1.42
0-
1.44
41.
333
--
1.50
01.
000
-1.
667
1.30
81.
308
1.00
01.
000
1.00
01.
000
1.00
0-
MS
1.45
61.
185
1.67
91.
388
1.68
91.
266
1.29
51.
320
1.19
486
21.
273
1.20
01.
667
1.66
71.
667
1.66
71.
500
1.50
0G
O1.
556
1.40
01.
654
1.88
91.
000
2.00
01.
500
1.33
3#D
IV/0
!-
--
--
--
--
DF
--
--
--
--
--
--
--
--
--
Sud
este
(S
outh
east
)1.
470
1.43
31.
637
1.61
91.
445
1.38
11.
323
1.64
71.
780
1.42
71.
441
1.84
51.
765
1.67
41.
670
1.73
01.
950
1.84
0
MG
-1.
281
1.46
71.
781
1.55
01.
500
1.00
094
494
41.
000
1.06
71.
000
917
909
909
900
1.35
71.
429
ES-
--
--
--
--
--
--
--
--
-R
J-
--
--
--
--
--
--
--
--
-SP
1.47
01.
435
1.64
11.
615
1.44
21.
379
1.32
71.
659
1.79
01.
432
1.44
61.
859
1.77
91.
685
1.68
21.
740
1.96
31.
848
Sul (
Sout
h)1.
220
1.21
01.
477
1.43
01.
407
1.32
81.
270
1.27
21.
616
632
1.31
41.
135
1.24
41.
240
1.26
01.
797
1.33
31.
362
PR1.
260
1.25
41.
583
1.46
71.
456
1.40
21.
333
1.40
61.
962
481
1.48
01.
155
1.39
31.
400
1.46
41.
793
1.77
31.
684
SC-
--
1.50
01.
500
1.50
01.
429
1.50
0-
--
--
--
--
-R
S1.
067
1.00
081
91.
119
1.08
398
51.
000
1.00
01.
000
967
1.01
81.
113
1.16
01.
160
1.14
31.
800
1.14
01.
240
No
rte/
No
rdes
te
(Nor
th/
Nor
thea
st)
1.20
01.
225
1.23
11.
048
1.02
71.
400
1.14
71.
108
1.10
81.
148
1.10
91.
092
1.03
11.
115
1.11
11.
014
492
1.09
1
Cen
tro
-Su
l (C
ente
r-So
uth)
1.41
81.
368
1.61
01.
565
1.45
01.
370
1.31
51.
589
1.75
21.
319
1.42
21.
748
1.71
51.
634
1.63
11.
736
1.88
91.
801
Bra
sil
(Bra
zil)
1.41
31.
365
1.60
51.
559
1.44
31.
371
1.31
21.
576
1.73
91.
312
1.40
81.
705
1.66
61.
599
1.58
81.
679
1.77
91.
758
Font
e (S
ourc
e): M
apa/
Con
ab.

Ministério da Agricultura, Pecuária e Abastecimento232
Tab
ela
155
– Pr
od
uti
vid
ade
de
amen
do
im n
o B
rasi
l no
per
íod
o d
e 19
95 a
201
2, e
m k
g/h
aTa
ble
155
– Pe
anut
s pr
oduc
tivity
in B
razi
l 199
5 to
201
2, in
kg/
ha
Reg
ião
/UF
(Reg
ion/
Stat
e)19
94/9
519
95/9
619
96/9
719
97/9
819
98/9
919
99/2
000
2000
/01
2001
/02
2002
/03
2003
/04
2004
/05
2005
/06
2006
/07
2007
/08
2008
/09
2009
/10
2010
/11
2011
/12
Nor
te (N
orth
)-
--
--
--
--
--
--
3.00
03.
100
3.07
52.
897
4.41
3R
R-
--
--
--
--
--
--
--
--
-R
O-
--
--
--
--
--
--
--
--
-A
C-
--
--
--
--
--
--
--
--
-A
M-
--
--
--
--
--
--
--
--
-A
P-
--
--
--
--
--
--
--
--
-PA
--
--
--
--
--
--
--
--
--
TO-
--
--
--
--
--
--
3.00
03.
100
3.07
52.
897
4.41
3N
ord
este
(N
orth
east
)1.
121
1.06
895
588
391
895
584
490
31.
299
1.49
51.
194
1.14
11.
041
1.12
41.
030
975
908
796
MA
--
--
--
--
--
--
--
--
--
PI-
--
--
--
--
--
--
--
--
-C
E1.
364
1.44
41.
222
1.00
01.
111
1.44
450
01.
200
1.25
01.
000
1.20
01.
314
750
1.43
61.
293
389
1.27
756
0R
N-
--
--
--
--
--
--
--
--
-PB
1.00
01.
000
714
1.00
01.
000
875
875
800
1.00
01.
000
975
1.20
085
01.
110
596
282
300
580
PE-
--
--
--
--
--
--
--
--
-A
L-
--
--
--
--
--
--
--
--
-SE
1.16
71.
167
1.38
51.
091
1.16
71.
167
1.16
71.
200
1.20
01.
182
1.20
01.
180
1.17
61.
204
1.20
71.
196
1.20
01.
200
BA
1.03
493
878
978
978
978
978
981
01.
345
1.65
71.
230
1.10
01.
100
1.07
01.
019
1.04
080
079
4C
entr
o-
Oes
te
(Cen
tral
W
est)
--
--
--
--
--
2.81
42.
737
2.39
72.
464
2.90
82.
432
2.50
02.
450
MT
--
--
--
--
--
2.79
62.
920
2.42
82.
461
2.87
02.
432
2.50
02.
450
MS
--
--
--
--
--
2.90
02.
450
2.00
0-
--
--
GO
--
--
--
--
--
2.34
61.
942
2.45
02.
467
3.25
1-
--
DF
--
--
--
--
--
--
--
--
--
Sud
este
(S
outh
east
)1.
575
1.79
81.
615
1.93
31.
869
1.73
52.
024
2.13
92.
208
2.36
32.
472
2.58
02.
391
2.85
92.
894
3.07
73.
101
3.36
0
MG
1.21
41.
250
1.16
71.
364
1.58
32.
217
2.34
12.
333
1.55
61.
955
2.00
01.
600
2.00
02.
143
2.89
22.
969
2.70
03.
192
ES-
--
--
--
--
--
--
--
--
-R
J-
--
--
--
--
--
--
--
--
-SP
1.58
11.
808
1.62
31.
940
1.87
31.
722
2.00
92.
127
2.23
52.
400
2.52
32.
611
2.40
82.
908
2.89
43.
083
3.12
23.
366
Sul (
Sout
h)1.
328
1.38
51.
450
1.48
71.
533
1.28
81.
720
1.72
81.
663
1.62
81.
295
1.58
11.
866
2.26
32.
032
2.14
82.
105
1.59
8PR
1.58
81.
786
1.79
31.
852
1.81
51.
156
2.02
02.
098
2.00
02.
026
1.72
51.
730
2.15
72.
814
2.40
72.
661
2.55
11.
735
SC-
--
--
--
--
--
--
--
--
-R
S1.
240
1.16
01.
255
1.29
41.
375
1.37
51.
408
1.43
11.
408
1.29
887
51.
415
1.50
01.
517
1.46
51.
584
1.67
11.
475
No
rte/
No
rdes
te
(Nor
th/
Nor
thea
st)
1.12
11.
068
955
883
918
955
844
903
1.29
91.
495
1.19
41.
141
1.04
11.
436
1.44
71.
431
1.15
51.
287
Cen
tro
-Su
l (C
ente
r-So
uth)
1.55
61.
755
1.59
91.
896
1.84
11.
698
1.99
32.
096
2.14
72.
292
2.41
62.
501
2.33
22.
778
2.80
22.
934
2.96
83.
189
Bra
sil (
Braz
il)1.
529
1.70
51.
550
1.83
51.
783
1.65
01.
921
2.01
72.
070
2.21
32.
329
2.36
72.
200
2.63
12.
642
2.68
72.
674
2.92
6
Font
e (S
ourc
e): M
apa/
Con
ab.

Anuário Estatístico da Agroenergia – 2012 233
4.5.4 Importação e exportação de óleo4.5.4 Import and expor of oil
Tabela 156 – Exportação e importação de óleo de amendoim no Brasil, em mil toneladasTable 156 – Peanuts oil exports and imports in Brazil, in thousand tons
Safras Harvests
Mil toneladas Thousand tons
ImportaçãoImports
ExportaçãoExports
2002/03 0,08 2,992003/04 0,05 7,512004/05 0,05 16,272005/06 0,04 22,012006/07 0,05 10,382007/08 0,03 14,752008/09 0,02 32,492009/10 0,02 24,882010/11 0,01 23,002011/12* 0,02 16,36
Fonte (Source): Mapa; MDIC.Elaboração (Elaboration): Mapa/SPAE.Nota: *Dados de importação e exportação são do período de setembro a abril.
* Imports and export data are from the period of september to april.NCM: 1508.10.00 e 1508.90.00
Gráfico 112 – Exportação e importação de óleo de amendoim no Brasil, em mil toneladasChart 112 – Peanuts oil exports and imports in Brazil, in thousand tons
0
5
10
15
20
25
30
35
2002/03 2003/04 2004/05 2005/06 2006/07 2007/08 2008/09 2009/10 2010/11 2011/12*
Mil
tone
lada
s
Thou
sand
ton
s
Safras / Harvests
Importação (Imports) Exportação (Exports)

Ministério da Agricultura, Pecuária e Abastecimento234
4.6 Mamona4.6 Castorbean
4.6.1 Informações técnicas4.6.1 Technical information
Tabela 157 – Informações técnicas da cultura de mamonaTable 157 – Technical information of castorbean crop
ItemItem
Dados Data
Ciclo (Cycle) 105 - 135 dias (days) (86 - 162)
Teor de óleo na baga (Oil bunch content) 20% (45 - 50)
Teor de farelo (Meal oil content) 50% - 55 %
Produtividade média em grão (Grain average productivity)
1.000 kg/ha (700 - 2.000)
Rendimento em óleo (Oil yield) 4.700 kg/ha
Cultivares registrados no Mapa (Registered cultivars in Mapa)
23 (Ricinus communis L.)
Defensivos registrados no Mapa (Registered pesticides in Mapa)
1
Poder calorífico do óleo in natura (Oil calorific value)
8.913 kcal/kg
Poder calorífico do biocombustível (Biofuel calorific value)
9.046 kcal/kg
Balanço energético do biocombustível (Biofuel energy balance)
1 : 1,85
Fonte (Source): Mapa.

Anuário Estatístico da Agroenergia – 2012 235
4.6.2 Produção nacional4.6.2 National production
Tabela 158 – Série histórica de produção, área plantada e produtividade de mamona no BrasilTable 158 – Castorbean production, planted area and productivity in Brazil
SafrasHarvests
Produção (mil toneladas)Production (thousand tons)
Área (mil hectares)Planted area (thousand ha)
Produtividade (kg/ha)Productivity (kg/ha)
1976/77 202 250 8061977/78 393 344 11411978/79 346 372 9291979/80 302 440 6881980/81 264 445 5931981/82 202 469 4291982/83 189 318 5951983/84 225 415 5411984/85 393 485 8101985/86 272 441 6171986/87 115 298 3871987/88 181 268 6781988/89 126 279 4531989/90 118 242 4891990/91 134 239 5601991/92 116 181 6421992/93 38 136 2761993/94 63 117 5371994/95 44 78 5701995/96 48 122 3921996/97 96 150 6431997/98 19 133 1421998/99 31 93 3351999/00 107 195 5502000/01 80 161 4952001/02 72 126 5742002/03 86 128 6732003/04 107 166 6462004/05 210 215 9752005/06 104 148 7032006/07 94 156 6022007/08 123 163 7582008/09 93 158 5872009/10 101 158 6372010/11 141 219 6442011/12 73 145 504
Fonte (Source): Mapa/Conab.

Ministério da Agricultura, Pecuária e Abastecimento236
Gráfico 113 – Série histórica de produção de mamona no Brasil, em mil toneladasChart 113 – Castorbean production in Brazil, in thousand tons
0
50
100
150
200
250
300
350
400
450
1976
/77
1978
/79
1980
/81
1982
/83
1984
/85
1986
/87
1988
/89
1990
/91
1992
/93
1994
/95
1996
/97
1998
/99
2000
/01
2002
/03
2004
/05
2006
/07
2008
/09
2010
/11
Pro
du
ção
(m
il to
nel
adas
)
Pro
du
ctio
n (
tho
usa
nd
to
ns)
Safras / Harvests
Gráfico 114 – Série histórica da área plantada de mamona no Brasil, em mil hectaresChart 114 – Castorbean planted area in Brazil, in thousand hectares
0
100
200
300
400
500
600
1976
/77
1978
/79
1980
/81
1982
/83
1984
/85
1986
/87
1988
/89
1990
/91
1992
/93
1994
/95
1996
/97
1998
/99
2000
/01
2002
/03
2004
/05
2006
/07
2008
/09
2010
/11
Áre
a (m
il h
ecta
res)
A
rea
(th
ou
san
d h
ecta
res)
Safras / Harvests

Anuário Estatístico da Agroenergia – 2012 237
Gráfico 115 – Série histórica da produtividade de mamona no Brasil, em kg/haChart 115 – Castorbean productivity in Brazil, in kg/ha
0
200
400
600
800
1000
1200
1976
/77
1978
/79
1980
/81
1982
/83
1984
/85
1986
/87
1988
/89
1990
/91
1992
/93
1994
/95
1996
/97
1998
/99
2000
/01
2002
/03
2004
/05
2006
/07
2008
/09
2010
/11
Pro
du
tivi
dad
e (k
g/h
a)
Pro
du
ctiv
ity
(kg
/ha)
Safras / Harvests

Ministério da Agricultura, Pecuária e Abastecimento238
Tab
ela
159–
Pro
du
ção
de
mam
on
a n
o B
rasi
l no
per
íod
o d
e 19
77 a
199
3, e
m m
il to
nel
adas
Tabl
e 15
9– C
asto
rbea
n pr
oduc
tion
in B
razi
l bet
wee
n 19
77 t
o 19
93, i
n th
ousa
nd t
ons
Regi
ão/U
F
(Reg
ion/
Stat
e)19
76/7
719
77/7
8 19
78/7
919
79/8
019
80/8
119
81/8
219
82/8
319
83/8
419
84/8
519
85/8
619
86/8
719
87/8
819
88/8
919
89/9
019
90/9
119
91/9
219
92/9
3
Nor
te (N
orth
)-
--
--
--
--
--
--
--
--
RR-
--
--
--
--
--
--
--
--
RO-
--
--
--
--
--
--
--
--
AC
--
--
--
--
--
--
--
--
-A
M-
--
--
--
--
--
--
--
--
AP
--
--
--
--
--
--
--
--
-PA
--
--
--
--
--
--
--
--
-TO
--
--
--
--
--
--
--
--
-N
orde
ste
(Nor
thea
st)
139,
528
2,7
208,
415
7,9
183,
111
5,0
113,
214
3,9
297,
721
7,2
65,8
144,
710
0,6
95,6
116,
610
0,1
29,3
MA
0,5
0,1
0,1
0,1
--
--
--
--
--
--
-PI
3,0
3,5
3,0
4,3
5,9
5,0
2,0
3,1
9,0
18,5
3,4
13,8
15,0
12,1
12,0
6,5
2,6
CE18
,018
,013
,512
,09,
08,
84,
16,
512
,815
,95,
611
,713
,77,
511
,39,
80,
1RN
-1,
50,
8-
--
--
--
--
--
--
-PB
--
-1,
10,
30,
40,
40,
60,
51,
30,
71,
41,
00,
20,
30,
3-
PE18
,019
,621
,010
,87,
910
,83,
811
,420
,426
,64,
014
,318
,39,
622
,98,
70,
1A
L-
--
--
--
--
--
--
--
--
SE-
--
--
--
--
--
--
--
--
BA10
0,0
240,
017
0,0
129,
616
0,0
90,0
102,
912
2,3
255,
015
4,9
52,1
103,
552
,666
,270
,174
,826
,5Ce
ntro
-O
este
(C
entr
al W
est)
4,0
10,4
-4,
54,
74,
55,
99,
912
,92,
91,
20,
30,
40,
10,
3-
-
MT
4,0
10,4
-0,
40,
30,
71,
22,
85,
10,
8-
--
--
--
MS
--
-4,
14,
43,
84,
77,
17,
82,
11,
20,
30,
40,
10,
3-
-G
O-
--
--
--
--
--
--
--
--
DF
--
--
--
--
--
--
--
--
-Su
dest
e (S
outh
east
)30
,053
,457
,439
,925
,032
,031
,132
,139
,020
,827
,823
,217
,516
,513
,313
,26,
4
MG
3,0
6,4
5,4
5,9
7,0
5,3
7,0
6,3
9,3
4,6
3,1
4,3
2,4
1,6
0,4
0,8
2,7
ES-
--
--
--
--
--
--
--
--
RJ-
--
--
--
--
--
--
--
--
SP27
,047
,052
,034
,018
,026
,724
,125
,829
,716
,224
,718
,915
,114
,912
,912
,43,
7Su
l (So
uth)
28,0
46,0
80,0
100,
051
,050
,039
,038
,943
,431
,320
,313
,17,
86,
03,
62,
71,
8PR
28,0
46,0
80,0
100,
051
,050
,039
,038
,943
,431
,320
,313
,17,
86,
03,
62,
71,
8SC
--
--
--
--
--
--
--
--
-RS
--
--
--
--
--
--
--
--
-N
orte
/N
orde
ste
(Nor
th/
Nor
thea
st)
139,
528
2,7
208,
415
7,9
183,
111
5,0
113,
214
3,9
297,
721
7,2
65,8
144,
710
0,6
95,6
116,
610
0,1
29,3
Cent
ro-S
ul
(Cen
ter-
Sout
h)62
,010
9,8
137,
414
4,4
80,7
86,5
76,0
80,9
95,3
55,0
49,3
36,6
25,7
22,6
17,2
15,9
8,2
Bras
il (B
razi
l)20
1,5
392,
534
5,8
302,
326
3,8
201,
518
9,2
224,
839
3,0
272,
211
5,1
181,
312
6,3
118,
213
3,8
116,
037
,5
Font
e (S
ourc
e): M
apa/
Con
ab.

Anuário Estatístico da Agroenergia – 2012 239
Tab
ela
160
– Pr
od
uçã
o d
e m
amo
na
no
Bra
sil n
o p
erío
do
de
1994
a 2
012,
em
mil
ton
elad
asTa
ble
160
–Cas
torb
ean
prod
uctio
n in
Bra
zil b
etw
een
1994
to
2012
, in
thou
sand
ton
s
Reg
ião
/UF
(R
egio
n/St
ate)
1993
/94
1994
/95
1995
/96
1996
/97
1997
/98
1998
/99
1999
/200
020
00/0
120
01/0
220
02/0
320
03/0
420
04/0
520
05/0
620
06/0
7 20
07/0
8 20
08/0
920
09/1
020
10/1
120
11/1
2
Nor
te (N
orth
)-
--
--
--
--
--
--
--
--
--
RR
--
--
--
--
--
--
--
--
--
-R
O-
--
--
--
--
--
--
--
--
--
AC
--
--
--
--
--
--
--
--
--
-A
M-
--
--
--
--
--
--
--
--
--
AP
--
--
--
--
--
--
--
--
--
-PA
--
--
--
--
--
--
--
--
--
-TO
--
--
--
--
--
--
--
--
--
-N
ord
este
(N
orth
east
)57
,743
,245
,895
,117
,828
,593
,573
,268
,183
,810
4,5
202,
095
,786
,911
3,4
80,5
88,3
129,
967
,8
MA
--
--
--
--
--
--
--
--
--
-PI
1,6
1,6
--
--
--
--
4,8
10,0
7,0
4,5
1,1
1,5
1,8
1,6
1,4
CE
4,0
4,0
0,3
1,2
0,4
0,4
2,2
1,4
1,7
1,7
8,8
15,1
8,3
5,9
11,4
14,2
6,0
26,3
27,1
RN
--
3,2
0,2
0,1
0,1
--
--
-1,
40,
70,
4-
--
0,2
-PB
0,1
0,1
--
--
--
--
--
--
--
--
-PE
7,9
7,9
2,9
3,4
0,1
0,3
0,6
0,4
0,4
0,2
1,9
6,1
4,8
3,4
1,6
2,6
3,7
2,8
3,3
AL
--
--
--
--
--
--
--
--
--
-SE
--
--
--
--
--
--
--
--
--
-B
A44
,129
,639
,490
,317
,227
,790
,771
,466
,081
,989
,016
9,4
74,9
72,7
99,3
62,2
76,8
99,0
36,0
Cen
tro
-O
este
(C
entr
al
Wes
t)
--
--
--
--
--
--
--
--
--
-
MT
--
--
--
--
--
--
--
--
--
-M
S-
--
--
--
--
--
--
--
--
--
GO
--
--
--
--
--
--
--
--
--
-D
F-
--
--
--
--
--
--
--
--
--
Sud
este
(S
outh
east
)3,
71,
01,
81,
31,
02,
613
,96,
74,
32,
52,
86,
77,
56,
69,
912
,010
,07,
84,
6
MG
0,7
0,3
0,4
0,2
0,2
1,6
10,9
3,0
1,0
1,4
1,7
4,2
4,6
3,6
8,4
10,2
9,0
6,4
3,2
ES-
--
--
--
--
--
--
--
--
--
RJ
--
--
--
--
--
--
--
--
--
-SP
3,0
0,7
1,4
1,1
0,8
1,0
3,0
3,7
3,3
1,1
1,1
2,5
2,9
3,0
1,5
1,8
1,0
1,4
1,4
Sul (
Sout
h)1,
3-
--
--
--
--
-1,
10,
70,
2-
-2,
33,
60,
6PR
1,3
--
--
--
--
--
1,1
0,7
0,2
--
2,3
3,6
0,6
SC-
--
--
--
--
--
--
--
--
--
RS
--
--
--
--
--
--
--
--
--
-N
ort
e/N
ord
este
(N
orth
/N
orth
east
)
57,7
43,2
45,8
95,1
17,8
28,5
93,5
73,2
68,1
83,8
104,
520
2,0
95,7
86,9
113,
480
,588
,312
9,9
67,8
Cen
tro
-Su
l (C
ente
r-So
uth)
5,0
1,0
1,8
1,3
1,0
2,6
13,9
6,7
4,3
2,5
2,8
7,8
8,2
6,8
9,9
12,0
12,3
11,4
5,2
Bra
sil (
Braz
il)62
,744
,247
,696
,418
,831
,110
7,4
79,9
72,4
86,3
107,
320
9,8
103,
993
,712
3,3
92,5
100,
614
1,3
73,0
Font
e (S
ourc
e): M
apa/
Con
ab.

Ministério da Agricultura, Pecuária e Abastecimento240
Tab
ela
161
– Á
rea
pla
nta
da
de
mam
on
a n
o B
rasi
l no
per
íod
o d
e 19
77 a
199
3, e
m m
il h
ecta
res
Tabl
e 16
1 –
Cas
torb
ean
plan
ted
area
in B
razi
l bet
wee
n 19
77 t
o 19
93, i
n th
ousa
nd h
ecta
res
Reg
ião
/UF
(R
egio
n/St
ate)
1976
/77
1977
/78
1978
/79
1979
/80
1980
/81
1981
/82
1982
/83
1983
/84
1984
/85
1985
/86
1986
/87
1987
/88
1988
/89
1989
/90
1990
/91
1991
/92
1992
/93
Nor
te (N
orth
)-
--
--
--
--
--
--
--
--
RR
--
--
--
--
--
--
--
--
-R
O-
--
--
--
--
--
--
--
--
AC
--
--
--
--
--
--
--
--
-A
M-
--
--
--
--
--
--
--
--
AP
--
--
--
--
--
--
--
--
-PA
--
--
--
--
--
--
--
--
-TO
--
--
--
--
--
--
--
--
-N
ord
este
(N
orth
east
)20
7,1
268,
828
5,2
353,
537
5,7
406,
425
3,9
342,
941
0,0
391,
925
4,9
236,
125
6,0
221,
822
3,8
166,
612
9,5
MA
0,5
0,3
0,1
0,1
--
--
--
--
--
--
-PI
3,1
5,0
6,0
8,9
12,6
15,2
7,7
7,8
18,0
24,6
19,4
12,8
14,3
13,7
10,4
8,1
6,4
CE
30,0
30,0
30,0
24,0
15,0
19,1
15,2
10,0
17,0
17,7
21,7
19,5
16,7
14,2
13,9
14,0
4,5
RN
-1,
51,
1-
--
--
--
--
--
--
-PB
--
-2,
01,
31,
31,
21,
11,
01,
92,
02,
01,
50,
50,
50,
50,
3PE
30,9
36,9
32,5
30,2
26,8
30,0
24,0
22,0
34,0
38,0
19,0
26,4
35,8
32,0
36,0
34,8
3,3
AL
0,6
0,4
0,5
0,3
--
--
--
--
--
--
-SE
--
--
--
--
--
--
--
--
-B
A14
2,0
194,
721
5,0
288,
032
0,0
340,
820
5,8
302,
034
0,0
309,
719
2,8
175,
418
7,7
161,
416
3,0
109,
211
5,0
Cen
tro
-O
este
(C
entr
al
Wes
t)
3,8
8,7
6,0
3,7
4,0
3,9
5,3
8,4
10,0
2,7
0,9
0,2
0,3
0,1
0,2
--
MT
3,8
8,7
6,0
0,3
0,4
0,7
1,2
2,5
4,0
0,7
--
--
--
-M
S-
--
3,4
3,6
3,2
4,1
5,9
6,0
2,0
0,9
0,2
0,3
0,1
0,2
--
GO
--
--
--
--
--
--
--
--
-D
F-
--
--
--
--
--
--
--
--
Sud
este
(S
outh
east
)21
,642
,833
,633
,733
,229
,031
,336
,037
,024
,325
,520
,316
,815
,212
,112
,25,
1
MG
3,5
8,5
8,6
6,5
6,4
6,0
7,0
7,0
10,0
8,3
6,5
5,9
4,6
3,2
0,4
1,9
2,1
ES-
--
--
--
--
--
--
--
--
RJ
--
--
--
--
--
--
--
--
-SP
18,1
34,3
25,0
27,2
26,8
23,0
24,3
29,0
27,0
16,0
19,0
14,4
12,2
12,0
11,7
10,3
3,0
Sul (
Sout
h)17
,423
,747
,448
,732
,030
,027
,528
,028
,022
,516
,210
,95,
64,
42,
81,
91,
2PR
17,4
23,7
47,4
48,7
32,0
30,0
27,5
28,0
28,0
22,5
16,2
10,9
5,6
4,4
2,8
1,9
1,2
SC-
--
--
--
--
--
--
--
--
RS
--
--
--
--
--
--
--
--
-N
ort
e/N
ord
este
(N
orth
/N
orth
east
)
207,
126
8,8
285,
235
3,5
375,
740
6,4
253,
934
2,9
410,
039
1,9
254,
923
6,1
256,
022
1,8
223,
816
6,6
129,
5
Cen
tro
-Su
l (C
ente
r-So
uth)
42,8
75,2
87,0
86,1
69,2
62,9
64,1
72,4
75,0
49,5
42,6
31,4
22,7
19,7
15,1
14,1
6,3
Bra
sil (
Braz
il)24
9,9
344,
037
2,2
439,
644
4,9
469,
331
8,0
415,
348
5,0
441,
429
7,5
267,
527
8,7
241,
523
8,9
180,
713
5,8
Font
e (S
ourc
e): M
apa/
Con
ab.

Anuário Estatístico da Agroenergia – 2012 241
Tab
ela
162
– Á
rea
pla
nta
da
de
mam
on
a n
o B
rasi
l no
per
íod
o d
e 19
94 a
201
2, e
m m
il h
ecta
res
Tabl
e 16
2 –
Cas
torb
ean
plan
ted
area
in B
razi
l bet
wee
n 19
94 t
o 20
12, i
n th
ousa
nd h
ecta
res
Regi
ão/U
F
(Reg
ion/
Stat
e)19
93/9
419
94/9
519
95/9
619
96/9
719
97/9
819
98/9
919
99/2
000
2000
/01
2001
/02
2002
/03
2003
/04
2004
/05
2005
/06
2006
/07
2007
/08
2008
/09
2009
/10
2010
/11
2011
/12
Nor
te (N
orth
)-
--
--
--
--
--
--
--
--
--
RR-
--
--
--
--
--
--
--
--
--
RO-
--
--
--
--
--
--
--
--
--
AC
--
--
--
--
--
--
--
--
--
-A
M-
--
--
--
--
--
--
--
--
--
AP
--
--
--
--
--
--
--
--
--
-PA
--
--
--
--
--
--
--
--
--
-TO
--
--
--
--
--
--
--
--
--
-N
orde
ste
(Nor
thea
st)
112,
676
,311
9,9
148,
613
1,9
90,9
177,
915
5,6
123,
212
6,3
163,
820
9,8
142,
215
1,2
155,
914
8,0
146,
820
9,4
139,
1
MA
--
--
--
--
--
--
--
--
--
-PI
1,9
1,9
--
--
--
--
3,7
12,0
15,8
13,4
2,7
2,1
2,9
4,6
3,2
CE4,
94,
90,
42,
11,
10,
62,
62,
41,
91,
99,
318
,010
,19,
626
,435
,730
,556
,456
,7RN
--
3,9
0,3
0,3
0,3
--
--
-2,
20,
80,
70,
1-
-0,
30,
1PB
0,1
0,1
--
--
--
--
--
--
--
--
-PE
14,3
7,8
6,1
5,6
0,5
0,9
1,2
1,2
1,3
0,8
2,5
8,2
7,4
6,4
3,7
4,4
8,3
7,3
8,1
AL
--
--
--
--
--
--
--
--
--
-SE
--
--
--
--
--
--
--
--
--
-BA
91,4
61,6
109,
514
0,6
130,
089
,117
4,1
152,
012
0,0
123,
614
8,3
169,
410
8,1
121,
112
3,0
105,
810
5,1
140,
871
,0Ce
ntro
-Oes
te
(Cen
tral W
est)
--
--
--
--
--
--
--
--
--
-
MT
--
--
--
--
--
--
--
--
--
-M
S-
--
--
--
--
--
--
--
--
--
GO
--
--
--
--
--
--
--
--
--
-D
F-
--
--
--
--
--
--
--
--
--
Sude
ste
(Sou
thea
st)
3,1
1,3
1,6
1,4
0,7
2,0
17,5
5,8
2,9
2,0
2,4
4,3
5,2
4,3
6,8
9,5
9,0
7,9
4,9
MG
0,7
0,6
0,4
0,4
0,1
1,3
15,5
3,5
0,9
1,3
1,7
3,0
3,3
2,4
5,6
8,3
8,5
7,2
4,2
ES-
--
--
--
--
--
--
--
--
--
RJ-
--
--
--
--
--
--
--
--
--
SP2,
40,
71,
21,
00,
60,
72,
02,
32,
00,
70,
71,
31,
91,
91,
21,
20,
50,
70,
7Su
l (So
uth)
1,0
--
--
--
--
--
1,0
0,5
0,1
--
1,9
2,0
1,0
PR1,
0-
--
--
--
--
-1,
00,
50,
1-
-1,
92,
01,
0SC
--
--
--
--
--
--
--
--
--
-RS
--
--
--
--
--
--
--
--
--
-N
orte
/N
orde
ste
(Nor
th/
Nor
thea
st)
112,
676
,311
9,9
148,
613
1,9
90,9
177,
915
5,6
123,
212
6,3
163,
820
9,8
142,
215
1,2
155,
914
8,0
146,
820
9,4
139,
1
Cent
ro-S
ul
(Cen
ter-S
outh
)4,
11,
31,
61,
40,
72,
017
,55,
82,
92,
02,
45,
35,
74,
46,
89,
510
,99,
95,
9
Bras
il (B
razil
)11
6,7
77,6
121,
515
0,0
132,
692
,919
5,4
161,
412
6,1
128,
316
6,2
215,
114
7,9
155,
616
2,7
157,
515
7,7
219,
314
5,0
Font
e (S
ourc
e): M
apa/
Con
ab.

Ministério da Agricultura, Pecuária e Abastecimento242
Tab
ela
163
– Pr
od
uti
vid
ade
de
mam
on
a n
o B
rasi
l no
per
íod
o d
e 19
77 a
199
3, e
m k
g/h
aTa
ble
163
– C
asto
rbea
n pr
oduc
tivity
in
Braz
il be
twee
n 19
77 t
o 19
93, i
n kg
/ha
Reg
ião
/UF
(R
egio
n/St
ate)
1976
/77
1977
/78
1978
/79
1979
/80
1980
/81
1981
/82
1982
/83
1983
/84
1984
/85
1985
/86
1986
/87
1987
/88
1988
/89
1989
/90
1990
/91
1991
/92
1992
/93
Nor
te (N
orth
)-
--
--
--
--
--
--
--
--
RR
--
--
--
--
--
--
--
--
-R
O-
--
--
--
--
--
--
--
--
AC
--
--
--
--
--
--
--
--
-A
M-
--
--
--
--
--
--
--
--
AP
--
--
--
--
--
--
--
--
-PA
--
--
--
--
--
--
--
--
-TO
--
--
--
--
--
--
--
--
-N
ord
este
(N
orth
east
)67
41.
052
731
447
487
283
446
420
726
554
258
613
393
431
521
601
226
MA
1.00
033
31.
000
1.00
0-
--
--
--
--
--
--
PI96
870
050
048
346
832
926
039
750
075
217
51.
078
1.04
988
31.
150
800
400
CE
600
600
450
500
600
461
270
650
753
898
258
600
820
528
810
700
17R
N-
1.00
072
7-
--
--
--
--
--
--
-PB
--
-55
023
130
833
354
550
068
435
070
066
740
060
066
020
PE58
353
164
635
829
536
015
851
860
070
021
154
251
130
063
525
016
AL
--
--
--
--
--
--
--
--
-SE
--
--
--
--
--
--
--
--
-B
A70
41.
233
791
450
500
264
500
405
750
500
270
590
280
410
430
685
230
Cen
tro
-O
este
(C
entr
al
Wes
t)
1.05
31.
195
-1.
216
1.17
51.
154
1.11
31.
179
1.29
01.
074
1.33
31.
500
1.33
31.
000
1.50
0-
-
MT
1.05
31.
195
-1.
333
750
1.00
01.
000
1.12
01.
275
1.14
3-
--
--
--
MS
--
-1.
206
1.22
21.
188
1.14
61.
203
1.30
01.
050
1.33
31.
500
1.33
31.
000
1.55
0-
-G
O-
--
--
--
--
--
--
--
--
DF
--
--
--
--
--
--
--
--
-Su
des
te
(Sou
thea
st)
1.38
91.
248
1.70
81.
184
753
1.10
399
489
21.
054
856
1.09
01.
143
1.04
21.
086
1.09
91.
082
1.25
5
MG
857
753
628
908
1.09
488
31.
000
900
930
554
477
729
522
500
920
410
1.27
0ES
--
--
--
--
--
--
--
--
-R
J-
--
--
--
--
--
--
--
--
SP1.
492
1.37
02.
080
1.25
067
21.
161
992
890
1.10
01.
013
1.30
01.
313
1.23
81.
242
1.10
01.
200
1.24
0Su
l (So
uth)
1.60
91.
941
1.68
82.
053
1.59
41.
667
1.41
81.
389
1.55
01.
391
1.25
31.
202
1.39
31.
364
1.28
61.
421
1.50
0PR
1.60
91.
941
1.68
82.
053
1.59
41.
667
1.41
81.
389
1.55
01.
391
1.25
31.
202
1.39
31.
364
1.27
01.
421
1.50
0SC
--
--
--
--
--
--
--
--
-R
S-
--
--
--
--
--
--
--
--
No
rte/
No
rdes
te
(Nor
th/
Nor
thea
st)
674
1.05
273
144
748
728
344
642
072
655
425
861
339
343
152
160
122
6
Cen
tro
-Su
l (C
ente
r-So
uth)
1.44
91.
460
1.57
91.
677
1.16
61.
375
1.18
61.
117
1.27
11.
111
1.15
71.
166
1.13
21.
147
1.13
91.
128
1.30
2
Bra
sil (
Braz
il)80
61.
141
929
688
593
429
595
541
810
617
387
678
453
489
560
642
276
Font
e (S
ourc
e): M
apa/
Con
ab.

Anuário Estatístico da Agroenergia – 2012 243
Tab
ela
164
– Pr
od
uti
vid
ade
de
mam
on
a n
o B
rasi
l no
per
íod
o d
e 19
94 a
201
2, e
m k
g/h
aTa
ble
164
– C
asto
rbea
n pr
oduc
tivity
in B
razi
l bet
wee
n 19
94 t
o 20
12, i
n kg
/ha
Regi
ão/U
F
(Reg
ion/
Stat
e)19
93/9
419
94/9
519
95/9
619
96/9
719
97/9
819
98/9
919
99/2
000
2000
/01
2001
/02
2002
/03
2003
/04
2004
/05
2005
/06
2006
/07
2007
/08
2008
/09
2009
/10
2010
/11
2011
/12
Nor
te (N
orth
)-
--
--
--
--
--
--
--
--
--
RR-
--
--
--
--
--
--
--
--
--
RO-
--
--
--
--
--
--
--
--
--
AC
--
--
--
--
--
--
--
--
--
-A
M-
--
--
--
--
--
--
--
--
--
AP
--
--
--
--
--
--
--
--
--
-PA
--
--
--
--
--
--
--
--
--
-TO
--
--
--
--
--
--
--
--
--
-N
orde
ste
(Nor
thea
st)
512
566
382
640
135
314
526
470
553
663
638
963
673
575
727
543
601
621
488
MA
--
--
--
--
--
--
--
--
-PI
842
842
--
--
--
--
1.30
083
044
033
841
569
760
835
045
3CE
816
816
790
571
364
606
855
590
900
900
950
840
825
614
430
397
196
467
478
RN-
-83
066
733
323
0-
--
--
630
870
630
635
--
757
351
PB1.
000
1.00
0-
--
--
--
--
--
--
--
PE55
21.
013
480
607
200
348
500
312
300
300
770
740
650
530
430
585
444
386
405
AL
--
--
--
--
--
--
--
--
--
SE-
--
--
--
--
--
--
--
--
-BA
482
481
360
642
132
311
521
470
550
663
600
1.00
069
360
080
758
873
070
507
Cent
ro-
Oes
te
(Cen
tral
W
est)
--
--
--
--
--
--
--
--
--
-
MT
--
--
--
--
--
--
--
--
--
-M
S-
--
--
--
--
--
--
--
--
--
GO
--
--
--
--
--
--
--
--
--
-D
F-
--
--
--
--
--
--
--
--
--
Sude
ste
(Sou
thea
st)
1.19
476
91.
125
929
-1.
300
794
1.15
51.
483
1.25
01.
167
1.55
81.
442
1.53
41.
456
1.26
81.
111
983
932
MG
1.00
050
01.
000
500
2.00
01.
250
702
860
1.12
01.
100
1.00
01.
400
1.40
01.
500
1.50
51.
229
1.05
988
976
2ES
--
--
--
--
--
--
--
--
--
RJ-
--
--
--
--
--
--
--
--
-SP
1.25
01.
000
1.15
41.
100
1.33
31.
420
1.50
01.
610
1.65
01.
570
1.60
01.
900
1.50
01.
576
1.22
61.
540
1.99
81.
950
1.95
0Su
l (So
uth)
1.30
0-
--
--
--
--
-1.
100
1.40
01.
670
--
1.20
01.
798
600
PR1.
300
--
--
--
--
--
1.05
01.
300
1.67
0-
-1.
200
1.79
860
0SC
--
--
--
--
--
--
--
--
--
RS-
--
--
--
--
--
--
--
--
-N
orte
/N
orde
ste
(Nor
th/
Nor
thea
st)
512
566
382
640
135
314
526
470
553
663
638
963
673
575
727
543
601
621
488
Cent
ro-S
ul
(Cen
ter-
Sout
h)1.
220
769
1.12
592
91.
429
1.30
079
41.
155
1.48
31.
250
1.16
71.
472
1.43
91.
537
1.45
61.
268
1.12
71.
148
875
Bras
il (B
razi
l)53
757
039
264
314
233
555
049
557
467
364
697
570
360
275
858
763
764
450
4
Font
e (S
ourc
e): M
apa/
Con
ab.

Ministério da Agricultura, Pecuária e Abastecimento244
4.6.3 Importação, exportação, consumo e estoques de grão e óleo4.6.3 Import, export, consumption and stocks of grain and oil
Tabela 165 – Produção, exportação, importação, consumo e estoque de mamona no Brasil, em mil toneladasTable 165 – Castorbean production, exports, imports, consumption and stocks in Brazil, in thousand tons
Safras Harvests
Mil toneladas Thousand tons
ProduçãoProduction
ImportaçãoImports
ExportaçãoExports
Consumo e estoqueConsumption and stoks
2002/03 86,30 16,44 0,03 102,712003/04 107,30 8,26 - 115,562004/05 209,80 9,46 0,04 219,212005/06 103,90 6,99 0,01 110,882006/07 93,70 1,16 0,02 94,842007/08 123,30 - - 123,302008/09 92,50 - - 92,502009/10 100,60 - - 100,602010/11 165,10 - - 165,102011/12* 73,00 1,44 - 74,44
Fonte (Source): Mapa; MDIC.Elaboração (Elaboration): Mapa/SPAE.Nota: *Dados de importação e exportação são do período de setembro a abril.
* Imports and export data are from period of september to april.NCM: 1207.30.10 e 1207.30.90
Tabela 166 – Exportação e importação de óleo de mamona no Brasil, em mil toneladasTable 166 – Castorbean oil exports and import in Brazils, in thousand tons
Safras Harvests
Mil toneladas Thousand tons
ImportaçãoImports
ExportaçãoExports
2002/03 0,12 3,702003/04 1,58 0,682004/05 0,02 10,222005/06 0,01 4,272006/07 0,03 2,622007/08 9,87 0,202008/09 5,17 0,682009/10 10,63 0,912010/11 5,12 11,862011/12* 2,72 0,52
Fonte (Source): Mapa e MDIC.Elaboração (Elaboration): Mapa/SPAE.Nota: *Dados de importação e exportação são do período de setembro a abril.
* Imports and export data are from period of september to april.NCM: 1515.30.00

Anuário Estatístico da Agroenergia – 2012 245
Gráfico 116 – Produção, exportação, importação, consumo e estoque de mamona no Brasil, em mil toneladasChart 116 – Castorbean production, exports, imports, consumption and stocks in Brazil, in thousand tons
0
50
100
150
200
250
2002
/03
2003
/04
2004
/05
2005
/06
2006
/07
2007
/08
2008
/09
2009
/10
2010
/11
2011
/12*
Mil
ton
elad
as
Tho
usa
nd
to
ns
Safras / Harvests
Produção (Production) Importação (Imports)
Exportação (Exports) Consumo e estoque (Consumption and stoks)
Gráfico 117 – Exportação e importação de óleo de mamona no Brasil, em mil toneladasChart 117 – Castorbean oil exports and imports in Brazil, in thousand tons
0
2
4
6
8
10
12
14
2002
/03
2003
/04
2004
/05
2005
/06
2006
/07
2007
/08
2008
/09
2009
/10
2010
/11
2011
/12*
Mil
ton
elad
as
Tho
usa
nd
to
ns
Safras / Harvests
Importação (Imports) Exportação (Exports)

Ministério da Agricultura, Pecuária e Abastecimento246
4.7 Canola4.7 Rapeseed
4.7.1 Informações técnicas4.7.1 Technical information
Tabela 167 – Informações técnicas da cultura da canolaTable 167 – Technical information of rapeseed crop
ItemItem
DadoData
Ciclo (Cycle) 120 dias (days) (84 - 195)Teor de óleo no grão (Grain oil content) 40% (38 - 45)Teor de farelo (Grain meal content) 60% (55 - 62)Produtividade média em grãos (Gain average productivity)
1.433 kg/ha (1.100 - 2.400)
Rendimento em óleo (Oil yield) 573 kg/haCultivares registrados no Mapa (Registered cultivars in Mapa)
14 (Brassica napus var. oleifera Delile)
Defensivos registrados no Mapa (Registered pesticides in Mapa)
1
Balanço energético do biocombustível (Biofuel energy balance)
1 : 2,9
Fonte (Source): Embrapa; Mapa.
4.7.2 Produção mundial4.7.2 World production
Tabela 168 – Principais países produtores de canola, em milhões de toneladasTable 168 – Main rapeseed producing countries, in million tons
1998/99 1999/00 2000/01 2001/02 2002/03 2003/04 2004/05 2005/06 2006/07 2007/08 2008/09 2009/10 2010/11 2011/12
China (China) 8,30 10,13 11,38 11,33 10,55 11,42 13,18 13,05 10,97 10,57 12,10 13,66 13,10 13,00Canadá (Canada)
7,64 8,80 7,21 4,93 4,18 6,77 7,73 9,66 9,00 9,60 12,64 12,42 12,77 14,17
Índia (India) 4,90 5,11 3,73 4,50 3,60 6,80 6,50 7,00 5,80 5,45 6,70 6,40 7,10 6,50Alemanha (Germany)
3,39 4,29 3,59 4,16 3,83 3,63 5,28 5,05 5,34 5,32 5,16 6,31 5,75 3,87
França (France)
3,70 4,45 3,57 2,87 3,36 3,41 4,00 4,49 4,12 4,63 4,74 5,62 4,82 5,33
Polônia (Poland)
1,10 1,13 0,96 1,06 0,95 0,79 1,63 1,45 1,65 2,13 2,11 2,51 2,24 1,90
Demais países (Other
countries)
6,89 8,53 7,16 7,14 6,07 6,52 7,82 8,06 8,28 10,82 14,46 13,66 14,50 15,65
Mundo (World)
35,92 42,44 37,60 35,99 32,54 39,34 46,14 48,76 45,16 48,52 57,91 60,58 60,55 60,41
Fonte (Source):USDA

Anuário Estatístico da Agroenergia – 2012 247
Gráfico 118 – Principais países produtores de canola, em milhões de toneladasChart 118 – Main rapeseed producing countries, in million tons
0
10
20
30
40
50
60
70
1998
/99
1999
/00
2000
/01
2001
/02
2002
/03
2003
/04
2004
/05
2005
/06
2006
/07
2007
/08
2008
/09
2009
/10
2010
/11
2011
/12
Pro
du
ção
(m
ilhõ
es d
e to
nel
adas
)
Pro
du
ctio
n (
mill
ion
to
ns)
Safras / Harvest
Demais países (Other countries)
Polônia (Poland)
França (France)
Alemanha (Germany)
Índia (India)
Canadá (Canada) China (China)
Tabela 169 – Produção mundial de óleo de canola, em milhões de toneladasTable 169 – World rapeseed oil production, in million tons
SafrasHarvests
Produção de óleo (milhões de toneladas)Oil production (million tons)
1998/99 12,1
1999/00 13,6
2000/01 13,3
2001/02 13,1
2002/03 12,3
2003/04 14,2
2004/05 15,7
2005/06 17,1
2006/07 17,1
2007/08 18,3
2008/09 20,5
2009/10 22,3
2010/11 23,6
2011/12 23,6
Fonte (Source): USDA.

Ministério da Agricultura, Pecuária e Abastecimento248
Gráfico 119 – Produção mundial de óleo de canola, em milhões de toneladasChart 119 – World rapeseed oil production, in million tons
0,0
5,0
10,0
15,0
20,0
25,0
1998/99
1999/00
2000/01
2001/02
2002/03
2003/04
2004/05
2005/06
2006/07
2007/08
2008/09
2009/10
2010/11
2011/12
Pro
du
ção
de
óle
o (
milh
ões
de
ton
elad
as)
Oil
pro
du
ctio
n (
mill
ion
to
ns)
Safras / Harvest
4.7.3 Produção nacional4.7.3 National production
Tabela 170 – Série histórica de produção, área plantada e produtividade de canola no BrasilTable 170 – Rapeseed production, planted area and productivity in Brazil
SafrasHarvests
Produção (mil toneladas)Production (thousand tons)
Área plantada (mil hectares)Planted area (thousand ha)
Produtividade (kg/ha)Productivity (kg/ha)
1980/81 2,5 2,5 1.0001981/82 12,5 15,0 8001982/83 15,0 16,0 8501983/84 10,0 11,0 8001984/85 10,0 11,0 7001985/86 10,0 11,0 7001986/87 10,0 11,0 7001987/88 10,0 11,0 8001988/89 10,0 11,0 8001989/90 10,0 11,0 8001990/91 10,0 11,0 8001991/92 10,0 11,0 8001992/93 10,0 11,0 8001993/94 16,0 15,0 1.0501994/95 12,5 12,5 1.0001995/96 7,5 7,0 1.1501996/97 10,0 7,5 1.1001997/98 12,0 10,0 1.2001998/99 25,0 15,0 1.6001999/00 32,5 25,0 1.3002000/01 40,0 25,0 1.7002001/02 42,5 25,0 1.7502002/03 55,0 31,0 1.7002003/04 55,0 32,5 1.6502004/05 55,0 32,5 1.6502005/06 71,0 42,5 1.6502006/07 76,0 45,0 1.7002007/08 77,5 46,0 1.7002008/09 77,5 46,0 1.7002009/10 42,2 31,0 1.3612010/11 69,7 46,3 1.5052011/12 51,3 38,8 1.322
Fonte (Source): Tomm et al., 2009.Obs: A partir da safra 2009/10, dados coletados pela Conab.
Since the harvest 2009/10, data collected by Conab.

Anuário Estatístico da Agroenergia – 2012 249
Gráfico 120 – Série histórica de produção de canola no Brasil, em mil toneladasChart 120 – Rapeseed production in Brazil, in thousand tons
0,0
10,0
20,0
30,0
40,0
50,0
60,0
70,0
80,0
90,0 19
80/8
1
1982
/83
1984
/85
1986
/87
1988
/89
1990
/91
1992
/93
1994
/95
1996
/97
1998
/99
2000
/01
2002
/03
2004
/05
2006
/07
2008
/09
2010
/11
Pro
du
ção
(m
il to
nel
adas
)
Pro
du
ctio
n (
tho
usa
nd
to
ns)
Safras / Harvests
Gráfico 121 – Série histórica da área plantada de canola no Brasil, em mil hectaresChart 121 – Castorbean planted area in Brazil, in thousand hectares
0,0
5,0
10,0
15,0
20,0
25,0
30,0
35,0
40,0
45,0
50,0
1980
/81
1982
/83
1984
/85
1986
/87
1988
/89
1990
/91
1992
/93
1994
/95
1996
/97
1998
/99
2000
/01
2002
/03
2004
/05
2006
/07
2008
/09
2010
/11
Áre
a p
lan
tad
a (m
il h
a)
Plan
ted
are
a (t
ho
usa
nd
ha)
Safras / Harvests

Ministério da Agricultura, Pecuária e Abastecimento250
Gráfico 122 – Série histórica da produtividade de canola no Brasil, em kg/haChart 122 – Castorbean productivity in Brazil, in kg/ha
0
200
400
600
800
1.000
1.200
1.400
1.600
1.800
2.000
1980
/81
1982
/83
1984
/85
1986
/87
1988
/89
1990
/91
1992
/93
1994
/95
1996
/97
1998
/99
2000
/01
2002
/03
2004
/05
2006
/07
2008
/09
2010
/11
Pro
du
tivi
dad
e (k
g/h
a)
Pro
du
ctiv
ity
(kg
/ha)
Safras / Harvests

Anuário Estatístico da Agroenergia – 2012 251
Tabela 171 – Produção de canola no Brasil no período de 2010 a 2011, em mil toneladasTable 171 – Rapeseed production in Brazil between 2010 to 2011, in thousand tons
Região/UF (Region/State)
2009/10 2010/11 2011/12
Norte (North) - - -
RR - - -
RO - - -
AC - - -
AM - - -
AP - - -
PA - - -
TO - - -
Nordeste (Northeast)
- - -
MA - - -
PI - - -
CE - - -
RN - - -
PB - - -
PE - - -
AL - - -
SE - - -
BA - - -
Centro-Oeste (Central West)
2,2 4,1 2,4
MT - - -
MS 2,2 4,1 2,4
GO - - -
DF - - -
Sudeste (Southeast)
- - -
MG - - -
ES - - -
RJ - - -
SP - - -
Sul (South) 40,0 65,6 49,6
PR 7,8 19,8 15,6
SC - 0,5 0,3
RS 32,2 45,3 33,7
Norte/Nordeste (North/Northeast)
- - -
Centro-Sul (Center-South)
42,2 69,7 52,0
Brasil (Brazil) 42,2 69,7 52,0
Fonte (Source): Mapa/Conab.

Ministério da Agricultura, Pecuária e Abastecimento252
Tabela 172 – Área plantada de canola no Brasil no período de 2010 a 2011, em mil hectaresTable 172 – Rapeseed planted area in Brazil between 2010 to 2011, in thousand hectares
Região/UF (Region/State)
2009/10 2010/11 2011/12
Norte (North) - - -RR - - -RO - - -AC - - -AM - - -AP - - -PA - - -TO - - -
Nordeste (Northeast)
- - -
MA - - -PI - - -CE - - -RN - - -PB - - -PE - - -AL - - -SE - - -BA - - -
Centro-Oeste (Central West)
1,9 3,3 2,3
MT - - -MS 1,9 3,3 2,3GO - - -DF - - -
Sudeste (Southeast)
- - -
MG - - -ES - - -RJ - - -SP - - -
Sul (South) 29,1 43,0 40,1PR 6,1 12,6 13,5SC - 0,4 0,4RS 23,0 30,0 26,2
Norte/Nordeste (North/Northeast)
- - -
Centro-Sul (Center-South)
31,0 46,3 42,4
Brasil (Brazil) 31,0 46,3 42,4
Fonte (Source): Mapa/Conab.

Anuário Estatístico da Agroenergia – 2012 253
Tabela 173 – Produtividade de canola no Brasil no período de 2010 a 2011, em kg/haTable 173 – Rapeseed productivity in Brazil between 2010 to 2011, in kg/ha
Região/UF (Region/State)
2009/10 2010/11 2011/12
Norte (North) - - -RR - - -RO - - -AC - - -AM - - -AP - - -PA - - -TO - - -
Nordeste (Northeast)
- - -
MA - - -PI - - -CE - - -RN - - -PB - - -PE - - -AL - - -SE - - -BA - - -
Centro-Oeste (Central West)
1.158,0 1.242,0 1.043,0
MT - - -MS 1.135,0 1.242,0 1.043,0GO - - -DF - - -
Sudeste (Southeast)
- - -
MG - - -ES - - -RJ - - -SP - - -
Sul (South) 1.375,0 1.526,0 1.237,0PR 1.278,0 1.572,0 1.152,0SC - 1.200,0 775,0RS 1.400,0 1.510,0 1.287,0Norte/Nordeste (North/Northeast)
- - -
Centro-Sul (Center-South)
1.361,0 1.505,0 1.226,0
Brasil (Brazil) 1.361,0 1.505,0 1.226,0
Fonte (Source): Mapa/Conab.

BiodieselBiodiesel
05

Anuário Estatístico da Agroenergia – 2012 255
5.1 Produção nacional5.1 National production
Tabela 174 – Produção de biodiesel no Brasil, em m³Table 174 – Biodiesel production in Brazil, in m³
MesesMonths
AnosYears
2005 2006 2007 2008 2009 2010 2011 2012Janeiro January
0 1.075 17.109 76.784 90.352 147.435 186.327 190.936
Fevereiro February
0 1.043 16.933 77.085 80.224 178.049 176.783 212.489
Março March
8 1.725 22.637 63.680 131.991 214.150 233.465 193.460
Abril April
13 1.786 18.773 64.350 105.458 184.897 200.381
Maio May
26 2.578 26.005 75.999 103.663 202.729 220.484
Junho June
23 6.490 27.158 102.767 141.139 204.940 231.573
Julho July
7 3.331 26.718 107.786 154.557 207.434 249.897
Agosto August
57 5.102 43.959 109.534 167.086 231.160 247.934
Setembro September
2 6.735 46.013 132.258 160.538 219.988 233.971
Outubro October
34 8.581 53.609 126.817 156.811 199.895 237.885
Novembro November
281 16.025 56.401 118.014 166.192 207.868 237.189
Dezembro December
285 14.531 49.016 112.053 150.042 187.856 216.870
Total Ano Total year
736 69.002 404.329 1.167.128 1.608.053 2.386.399 2.672.760 596.886
Fonte (Source): ANP.
Gráfico 123 – Produção mensal de biodiesel no Brasil, em m³Chart 123 – Monthly biodiesel production in Brazil, in m³
-
50.000
100.000
150.000
200.000
250.000
300.000
jan/05
mai/
05
set/0
5
jan/06
mai/
06
set/0
6
jan/07
mai/
07
set/0
7
jan/08
mai/
08
set/0
8
jan/09
mai/
09
set/0
9
jan/10
mai/
10
set/1
0
jan/11
mai/
11
set/1
1
jan/12
Pro
du
ção
em
m3
Pro
du
ctio
n in
m3
Meses / Months

Ministério da Agricultura, Pecuária e Abastecimento256
5.2 Leilões ANP5.2 ANP auctions
Tabela 175 - Volumes arrematados na região Norte do 1° ao 23° leilões de biodiesel na ANP, em m3
Table 175 - Volumes sold in North region in 1° to 23° ANP biodiesel auctions, in m³
Volume Arrematado no leilão (m³)
Volume sold in auction ( m³)
Empresa (UF)Companies (State)
Ag
rop
alm
a (P
A)
DV
H (
PA)
Nu
bra
s (P
A)
Am
azo
nb
io
(RO
)
Ou
ro V
erd
e (R
O)
Bio
tin
s (T
O)
Bra
sil
Eco
die
sel (
TO)
Reg
ião
No
rte
(N
orth
Reg
ion)
1° leilão (1° auction)
5.000 5.000
2° leilão (2° auction)
3° leilão (3° auction)
2.200 2.200
4° leilão (4° auction)
90.000 90.000
5° leilão (5° auction)
6° leilão (6° auction)
25.000 25.000
7° leilão (7° auction)
1.000 10.000 11.000
8° leilão (8° auction)
1.500 1.500
9° leilão (9° auction)
300 1.600 1.900
10° leilão (10° auction)
600 600
11° leilão (11° auction)
1.200 500 1.700
12° leilão (12° auction)
700 200 120 1.600 18.000 20.620
13° leilão (13° auction)
1.080 100 1.180
14° leilão (14° auction)
1.600 1.000 2.500 1.500 8.900 15.500
15° leilão (15° auction)
1.400 3.200 1.500 9.000 15.100
16° leilão (16° auction)
1.300 3.200 1.580 18.000 24.080
17° leilão (17° auction)
1.000 600 1.000 1.250 20.000 23.850
18° leilão (18° auction)
400 1.400 4.700 17.000 23.500
19° leilão (19° auction)
1.400 5.000 12.500 18.900
20° leilão (20° auction)
1.350 2.900 25.000 29.250
21° leilão (21° auction)
850 4.500 21.500 26.850
22° leilão (22° auction)
3.600 25.500 29.100
23° leilão (23° auction)
1.350 4.050 25.200 30.600
Fonte (Source): ANP; MME.Elaboração (Elaboration): Mapa/SPAE.

Anuário Estatístico da Agroenergia – 2012 257
Tabela 176 - Volumes arrematados na região Nordeste do 1° ao 23° leilões de biodiesel na ANP, em m3
Table 176 - Volumes sold in Northeast region in 1° to 23° ANP biodiesel auctions, in m³
Volume Arrematado
no leilão (m³)Volume sold in auction ( m³)
Empresa (UF)Companies (State)
Biob
rax
(BA
)
Bras
il Ec
odie
sel (
BA)
Com
anch
e (B
A)
IBR
(BA
)
Petr
obra
s (B
A)
Bras
il Ec
odie
sel (
CE)
Petr
obra
s (C
E)
Bra
sil E
cod
iese
l (M
A)
Bras
il Ec
odie
sel (
PI)
Regi
ão N
orde
ste
(Nor
thea
st R
egio
n)
1° leilão (1° auction)
38.000 38.000
2° leilão (2° auction)
20.000 1.780 21.780
3° leilão (3° auction)
40.000 40.000
4° leilão (4° auction)
80.000 88.200 50.000 218.220
5° leilão (5° auction)
6.000 9.000 2.000 17.000
6° leilão (6° auction)
41.000 15.000 43.000 99.000
7° leilão (7° auction)
5.000 5.000
8° leilão (8° auction)
21.600 11.300 19.800 52.700
9° leilão (9° auction)10° leilão
(10° auction)21.600 5.900 3.000 21.600 52.100
11° leilão (11° auction)
5.000 1.000 4.000 10.000
12° leilão (12° auction)
12.000 4.000 18.000 9.000 6.000 49.000
13° leilão (13° auction)
9.000 9.000 11.280 11.280 15.000 100 55.660
14° leilão (14° auction)
12.000 6.000 11.280 11.280 15.000 100 55.660
15° leilão (15° auction)
12.000 11.280 100 11.280 14.800 100 49.560
16° leilão (16° auction)
13.314 16.500 100 15.600 19.000 100 64.614
17° leilão (17° auction)
15.000 6.000 20.000 20.000 14.000 75.000
18° leilão (18° auction)
700 20.000 20.000 40.700
19° leilão (19° auction)
100 11.000 12.000 12.200 200 35.500
20° leilão (20° auction)
10.500 33.000 15.000 500 59.000
21° leilão (21° auction)
5.000 100 16.000 10.000 10.000 41.100
22° leilão (22° auction)
23.000 10.000 33.000
23° leilão (23° auction)
21.500 31.950 10.000 100 63.550
Fonte (Source): ANP; MME.Elaboração (Elaboration): Mapa/SPAE.

Ministério da Agricultura, Pecuária e Abastecimento258
Tab
ela
177
- V
olu
mes
arr
emat
ado
s n
a re
giã
o C
entr
o-O
este
do
1°
ao 2
3° le
ilões
de
bio
die
sel n
a A
NP,
em
m3
Tabl
e 17
7- V
olum
es s
old
in C
ente
r W
est
regi
on in
1°
to 2
3° A
NP
biod
iese
l auc
tions
, in
m³
Vo
lum
e A
rrem
atad
o
no
leilã
o (
m³)
Volu
me
sold
in
auct
ion
( m³)
Emp
resa
(U
F)C
ompa
nies
(Sta
te)
Binatural (GO)
Bionasa (GO)
Caramuru - Ipameri (GO)
Caramuru - São Simão (GO)
Granol (GO)
Minerva (GO)
Biocar (MS)
Delta (MS)
ADM (MT)
Agrenco (MT)
AgroSoja (MT)
Araguassu (MT)
Barrálcool (MT)
Beira Rio (MT)
Biocamp (MT)
Bio-óleo (MT)
Biopar (MT)
CLV (MT)
Cooperbio (MT)
Cooperfeliz (MT)
Fiagril (MT)
Grupal (MT)
Renobrás (MT)
SSIL (MT)
Trans. Caibiense (MT)
Região Centro-Oeste (Center West Region)
1° le
ilão
(1
° au
ctio
n)5.
000
5.00
038
.000
48.0
00
2° le
ilão
(2
° au
ctio
n)1.
320
36.0
0090
038
.220
3° le
ilão
(3
° au
ctio
n)4°
leilã
o
(4°
auct
ion)
40.0
005.
000
10.0
0027
.500
82.5
00
5° le
ilão
(5
° au
ctio
n)28
.000
28.0
00
6° le
ilão
(6
° au
ctio
n)30
.000
15.0
0013
.000
58.0
00
7° le
ilão
(7
° au
ctio
n)3.
000
8.00
020
.000
4.00
010
.000
45.0
00
8° le
ilão
(8
° au
ctio
n)15
.000
20.0
0016
.950
39.6
002.
500
7.50
012
.000
113.
550
9° le
ilão
(9°
auct
ion)
3.00
04.
420
16.9
5030
01.
200
25.8
70
10°
leilã
o
(10°
auc
tion)
16.0
0017
.500
33.9
003.
000
6.00
06.
000
17.5
0099
.900
11°
leilã
o
(11°
auc
tion)
5.50
03.
000
150
750
5.00
01.
200
15.6
00
12°
leilã
o
(12°
auc
tion)
6.00
019
.500
26.0
0049
.100
4.10
050
06.
000
450
1.68
04.
000
15.0
0013
2.33
0
13°
leilã
o
(13°
auc
tion)
27.5
6015
.000
15.0
002.
400
6.00
02.
000
15.0
0082
.960
14°
leilã
o
(14°
auc
tion)
6.04
830
.000
31.0
002.
160
49.1
003.
800
8.00
08.
500
660
1.60
05.
000
11.0
9221
.500
1.05
017
9.51
0
15°
leilã
o
(15°
auc
tion)
5.50
030
.000
36.0
002.
160
49.1
003.
500
8.50
08.
500
600
1.50
06.
000
14.0
0021
.500
186.
860
16°
leilã
o
(16°
auc
tion)
15.0
0034
.330
44.1
002.
160
68.7
604.
400
900
8.91
010
.350
720
1.68
07.
070
19.0
0025
.500
360
1.08
024
4.32
0
17°
leilã
o
(17°
auc
tion)
16.0
0040
.400
40.0
002.
000
68.0
003.
000
1.00
010
.000
700
10.0
0060
07.
100
17.0
0025
.000
2.90
024
3.70
0
18°
leilã
o
(18°
auc
tion)
15.0
0021
.500
43.0
0041
.900
1.40
068
.000
5.00
02.
200
5.00
050
011
.000
5.00
07.
000
21.0
0021
.400
1.00
030
02.
700
272.
900
19°
leilã
o
(19°
auc
tion)
20.0
0061
.000
44.1
0060
040
.000
1.00
050
016
.100
5.20
01.
500
22.7
0030
029
.300
7.00
020
03.
000
252.
500
20°
leilã
o
(20°
auc
tion)
11.7
5021
.500
23.5
0038
.000
2.00
06.
000
68.2
005.
200
1.00
03.
300
11.5
004.
000
3.00
015
.500
350
17.5
004.
000
6.00
024
2.20
0
21°
leilã
o
(21°
auc
tion)
13.0
0019
.500
40.5
0044
.100
2.00
09.
000
13.2
502.
350
10.5
006.
000
24.0
0045
033
.000
6.30
025
022
4.20
0
22°
leilã
o
(22°
auc
tion)
19.5
003.
000
23.5
0038
.500
29.5
002.
000
7.50
061
.400
2.00
06.
800
16.5
0019
.500
400
31.3
006.
000
250
2.20
026
9.85
0
23°
leilã
o (2
3°
auct
ion)
20.9
0023
.900
26.2
0039
.800
38.1
001.
600
1.50
011
.000
16.0
501.
000
7.20
012
.600
13.7
0020
039
.100
6.15
04.
000
263.
000
Font
e (S
ourc
e): A
NP;
MM
E.El
abor
ação
(Ela
bora
tion)
: Map
a/SP
AE.

Anuário Estatístico da Agroenergia – 2012 259
Tab
ela
178
- V
olu
mes
arr
emat
ado
s n
a re
giã
o S
ud
este
do
1°
ao 2
3° le
ilões
de
bio
die
sel n
a A
NP,
em
m3
Tabl
e 17
8 -
Volu
mes
sol
d in
Sou
thea
st r
egio
n in
1°
to 2
3° A
NP
biod
iese
l auc
tions
, in
m³
Vo
lum
e A
rrem
atad
o
no
leilã
o (
m³)
Volu
me
sold
in a
uctio
n ( m
³)
Emp
resa
(U
F)C
ompa
nies
(Sta
te)
Abdiesel (MG)
Biominas (MG)
Biosep (MG)
B-100 (MG)
Petrobras (MG)
Soyminas (MG)
Cesbra (RJ)
Ponte Di Ferro (RJ)
Biopetro (SP)
Biocapital (SP)
Bioverde (SP)
Bracol (Bertin) (SP)
Granol (SP)
Fertibom (SP)
JBS (SP)
Innovatti (SP)
Orlândia (SP)
Ponte Di Ferro (SP)
SP Bio (SP)
Região Sudeste (Southeast Region)
1° le
ilão
(1°
auct
ion)
8.70
018
.300
27.0
00
2° le
ilão
(2°
auct
ion)
31.0
0060
.000
19.0
0011
0.00
0
3° le
ilão
(3
° au
ctio
n)1.
800
6.00
07.
800
4° le
ilão
(4
° au
ctio
n)2.
651
2.65
1
5° le
ilão
(5
° au
ctio
n)6°
leilã
o (6
° au
ctio
n)50
.000
50.0
00
7° le
ilão
(7
° au
ctio
n)5.
000
5.00
0
8° le
ilão
(8
° au
ctio
n)15
.000
15.0
0030
.000
9° le
ilão
(9
° au
ctio
n)7.
950
14.0
0021
.950
10°
leilã
o (1
0° a
uctio
n)15
.000
9.00
010
.500
8.00
042
.500
11°
leilã
o
(11°
auc
tion)
3.50
04.
500
8.00
0
12°
leilã
o
(12°
auc
tion)
450
1.50
026
.500
9.50
014
.000
5.00
056
.950
13°
leilã
o
(13°
auc
tion)
11.2
8025
.000
9.50
014
.000
6.32
066
.100
14°
leilã
o (1
4° a
uctio
n)60
011
.280
4.00
027
.000
11.0
6019
.000
7.00
075
080
.690
15°
leilã
o
(15°
auc
tion)
2.16
011
.280
4.00
026
.500
11.0
0020
.000
7.50
02.
016
84.4
56
16°
leilã
o
(16°
auc
tion)
2.16
016
.500
4.30
030
.500
17.6
4023
.230
8.52
02.
160
4.99
611
0.00
6
17°
leilã
o
(17°
auc
tion)
100
2.05
020
.000
4.30
025
.000
15.0
0020
.000
8.00
02.
100
96.5
50
18°
leilã
o
(18°
auc
tion)
2.10
020
.000
1.00
025
.700
10.0
0026
.700
5.20
04.
000
94.7
00
19°
leilã
o
(19°
auc
tion)
2.10
012
.500
2.10
03.
700
2.50
039
.300
1.00
04.
500
101.
000
20°
leilã
o
(20°
auc
tion)
20.0
002.
000
1.10
026
.500
9.00
06.
000
19.6
002.
000
86.2
00
21°
leilã
o
(21°
auc
tion)
2.50
09.
500
14.0
0043
.500
24.8
0030
027
.500
122.
100
22°
leilã
o
(22°
auc
tion)
2.50
021
.000
11.2
5029
.600
20.0
0014
.000
23.5
001.
250
123.
100
23°
leilã
o
(23°
auc
tion)
2.35
021
.600
33.0
0020
.500
13.5
0025
.300
600
4.50
012
1.35
0
Font
e (S
ourc
e): A
NP;
MM
E.El
abor
ação
(Ela
bora
tion)
: Map
a/SP
AE.

Ministério da Agricultura, Pecuária e Abastecimento260
Tabela 179 - Volumes arrematados na região Sul do 1° ao 23° leilões de biodiesel na ANP, em m3
Table 179 - Volumes sold in South region in 1° to 23° ANP biodiesel auctions, in m³
Volume Arrematado
no leilão (m³)Volume sold in auction ( m³)
Empresa (UF)Companies (State)
Bio
par
(PR
)
Bsb
ios
(PR
)
Bra
sil E
cod
iese
l (R
S)
Bsb
ios
(RS)
Cam
era
Ijuí (
RS)
Gra
no
l (R
S)
Ole
op
lan
(R
S)
Olf
ar (
RS)
Reg
ião
Su
l (So
uth
Regi
on)
1° leilão (1° auction)
18.300 18.300
2° leilão (2° auction)
3° leilão (3° auction)
4° leilão (4° auction)
80.000 66.629 10.000 156.629
5° leilão (5° auction)
6° leilão (6° auction)
32.000 30.000 10.000 72.000
7° leilão (7° auction)
10.000 10.000
8° leilão (8° auction)
21.600 18.700 14.000 11.950 66.250
9° leilão (9° auction)
2.000 2.000 7.280 5.000 16.280
10° leilão (10° auction)
14.400 13.500 20.000 21.000 68.900
11° leilão (11° auction)
5.000 6.000 7.200 3.500 9.000 30.700
12° leilão (12° auction)
6.000 20.100 17.000 28.000 71.100
13° leilão (13° auction)
3.000 18.000 18.600 27.000 42.500 109.100
14° leilão (14° auction)
8.640 21.000 28.500 30.000 40.500 128.640
15° leilão (15° auction)
5.024 21.000 27.500 30.000 40.500 124.024
16° leilão (16° auction)
6.930 14.850 30.000 35.900 44.300 131.980
17° leilão (17° auction)
5.900 20.000 30.000 30.000 40.000 125.900
18° leilão (18° auction)
5.500 20.000 17.000 31.000 34.200 36.000 24.500 168.200
19° leilão (19° auction)
5.000 24.700 10.500 31.700 59.700 47.500 28.000 207.100
20° leilão (20° auction)
3.000 20.000 24.500 28.000 12.250 32.000 42.500 21.000 183.250
21° leilão (21° auction)
7.750 12.500 25.000 22.500 28.500 67.000 57.500 25.000 245.750
22° leilão (22° auction)
500 21.600 28.500 22.300 53.000 54.300 30.000 210.200
23° leilão (23° auction)
6.000 23.200 27.100 28.600 38.700 55.400 40.000 219.000
Fonte (Source): ANP; MME.Elaboração (Elaboration): Mapa/SPAE.

Anuário Estatístico da Agroenergia – 2012 261
Tab
ela
180
- V
olu
mes
arr
emat
ado
s d
o 1
° ao
23°
leilõ
es d
e b
iod
iese
l na
AN
P, e
m m
3Ta
ble
180
- Vo
lum
es s
old
in 1
° to
23°
AN
P bi
odie
sel a
uctio
ns, i
n m
³R
egiõ
es/
Regi
ons
1°2°
3
° 4
° 5
° 6°
7°
8
° 9
°10
°11
°12
° 13
° 14
° 15
° 16
° 17
° 18
° 19
° 20
° 21
° 22
° 23
°
Reg
ião
N
ort
e (N
orth
Re
gion
)
5.00
0 0
2.20
0 90
.000
0
25.0
00
11.0
00
1.50
0 1.
900
600
1.70
0 20
.620
1.
180
15.5
00
15.1
00
24.0
80
23.8
50
23.5
00
18.9
00
29.2
50
26.8
50
29.1
00
30.6
00
Reg
ião
N
ord
este
(N
orth
east
Re
gion
)
38.0
00
21.7
80
40.0
00
218.
220
17.0
00
99.0
00
5.00
0 52
.700
0
52.1
00
10.0
00
49.0
00
55.6
60
55.6
60
49.5
60
64.6
14
75.0
00
40.7
00
35.5
00
59.0
00
41.1
00
33.0
00
63.5
50
Reg
ião
C
entr
o-
Oes
te
(Cen
ter W
est
Regi
on)
48.0
00
38.2
20
0 82
.500
28
.000
58
.000
45
.000
11
3.55
0 25
.870
99
.900
15
.600
13
2.33
0 82
.960
17
9.51
0 18
6.86
0 24
4.32
0 24
3.70
0 27
2.90
0 25
2.50
0 24
2.30
0 22
4.20
0 26
9.85
0 26
3.00
0
Reg
ião
Su
des
te
(Sou
thea
st
Regi
on)
27.0
00
110.
000
7.80
0 2.
651
0 50
.000
5.
000
30.0
00
21.9
50
42.5
00
8.00
0 56
.950
66
.100
80
.690
84
.456
11
0.00
6 96
.550
94
.700
10
1.00
0 86
.200
12
2.10
0 12
3.10
0 12
1.35
0
Reg
ião
Su
l (So
uth
Regi
on)
18.3
00
0 0
156.
629
0 72
.000
10
.000
66
.250
16
.280
68
.900
30
.700
71
.100
10
9.10
0 12
8.64
0 12
4.02
4 13
1.98
0 12
5.90
0 16
8.20
0 20
7.10
0 18
3.25
0 24
5.75
0 21
0.20
0 21
9.00
0
Bra
sil
136.
300
170.
000
50.0
00
550.
000
45.0
00
304.
000
76.0
00
264.
000
66.0
00
264.
000
66.0
00
330.
000
315.
000
460.
000
460.
000
575.
000
565.
000
600.
000
615.
000
600.
000
660.
000
665.
250
697.
500
Font
e (S
ourc
e): A
NP.

Ministério da Agricultura, Pecuária e Abastecimento262
Gráfico 124 – Volumes arrematados por região do 1° ao 23° leilões de biodiesel na ANP, em m³Chart 124 – Volume sold by region in 1° to 23° ANP biodiesel auctions, in m³
0
100.000
200.000
300.000
400.000
500.000
600.000
700.000
800.000
1° 2° 3° 4° 5° 6° 7° 8° 9° 10° 11° 12° 13° 14° 15° 16° 17° 18° 19° 20° 21° 22° 23°
m3
Leilões / Auctions
Região Norte (North Region) Região Sul (South Region) Região Sudeste (Southeast Region) Região Centro-Oeste (Center West Region) Região Nordeste (Northeast Region)
Gráfico 125 – Participação das regiões no 1° ao 23° leilões de biodiesel na ANP, em porcentagemChart 125 – Region participation in 1° to 23° ANP biodiesel auctions, in percentage
0%
10%
20%
30%
40%
50%
60%
70%
80%
90%
100%
4° 5° 6° 7° 8° 9° 10° 11° 12° 13° 14° 15° 16° 17° 18° 19° 20° 21°
Leilões / Auctions
Região Sul (South Region)
Região Sudeste (Southeast Region)
Região Centro-Oeste (Center West Region)
Região Nordeste (Northeast Region)
Região Norte (North Region)

Anuário Estatístico da Agroenergia – 2012 263
Tabela 181 - Preço médio arrematado nos leilões de biodieselTable 181 - Average price of biodiesel sold in auctions
Preço médio em R$/lAverage price in R$/ l
1º 1,902º 1,863º 1,754º 1,745º 1,746° 1,877° 1,868° 2,699° 2,6910° 2,6011° 2,6112° 2,3913° 2,1614° 2,3115° 2,2716° 2,3317° 2,2418° 2,1119° 1,7420° 2,3021° 2,0522° 2,2123° 2,40
Fonte (Source): ANP; MME.Obs.: A partir do 22° leilão o valor utilizado para o preço médio incluirá o Fator de Ajuste Logístico (FAL).
Since to 22° action the value of average price inclue Adjustment Factor Logistic (FAL).
Gráfico 126 – Preço médio arrematado de biodiesel nos leilões da ANPChart 126 – Average price of biodiesel sold in ANP auctions
1,5
1,7
1,9
2,1
2,3
2,5
2,7
2,9
1º 2º 3º 4º 5º 6° 7° 8° 9° 10° 11° 12° 13° 14° 15° 16° 17° 18° 19° 20° 21° 22° 23°
Preç
o m
édio
em
R$/
l M
ediu
m p
rice
in R
$/l
Leilões / Auctions

Ministério da Agricultura, Pecuária e Abastecimento264
5.3
Mat
éria
-pri
ma
uti
lizad
a n
a p
rod
uçã
o5.
3 Sh
are
of r
aw m
ater
ials
use
d in
bio
dies
el p
rodu
ctio
n in
Bra
zil
Tab
ela
182
– Pa
rtic
ipaç
ão d
as m
atér
ias-
pri
mas
uti
lizad
as n
a p
rod
uçã
o d
e b
iod
iese
l no
Bra
sil,
em p
orc
enta
gem
Tabl
e 18
2 –
Shar
e of
raw
mat
eria
ls u
sed
in b
iodi
esel
pro
duct
ion
in B
razi
l, in
per
cent
age
Mês
Mon
th
Óle
o de
so
jaSo
ybea
n O
il
Gor
dura
bo
vina
Bovi
ne fa
t
Óle
o de
al
godã
oCo
tton
seed
oil
Óle
o de
fr
itur
a us
ado
Use
d fr
ying
oil
Gor
dura
de
fran
goCh
icke
n fa
t
Gor
dura
de
por
coPo
rk fa
t
Óle
o de
pa
lma
Palm
oil
Óle
o de
am
endo
im
Pean
ut o
il
Óle
o de
gi
rass
olSu
nflow
er o
il
Óle
o de
m
amon
a Ca
stor
bean
oil
Óle
o de
sé
sam
oSe
sam
e oi
l
Óle
o de
na
bo-
forr
agei
roRa
dish
oil*
Out
ros
mat
eria
is
grax
osO
ther
fatt
y m
ater
ials
out/
0878
,50
16,1
02,
542,
86no
v/08
82,1
710
,70
3,54
3,49
dez/
0878
,40
16,4
42,
442,
68ja
n/09
71,1
624
,54
3,25
1,05
fev/
0973
,68
19,2
54,
962,
11m
ar/0
985
,37
10,9
41,
592,
10ab
r/09
76,3
719
,36
2,04
2,33
mai
/09
81,3
316
,11
2,56
0,00
jun/
0981
,10
14,0
32,
971,
90ju
l/09
78,7
014
,62
4,11
2,57
ago/
0983
,29
10,3
32,
603,
78se
t/09
74,8
816
,27
6,16
2,69
out/
0977
,35
15,4
84,
292,
88no
v/09
75,0
417
,79
5,10
2,07
dez/
0971
,90
19,4
45,
640,
080,
000,
330,
320,
040,
050,
002,
19ja
n/10
77,1
317
,07
4,62
0,16
0,01
0,60
0,02
0,00
0,11
0,28
fev/
1082
,94
12,1
22,
390,
120,
282,
15m
ar/1
085
,58
11,1
71,
510,
240,
030,
031,
43ab
r/10
83,8
713
,51
0,49
0,17
0,05
0,09
0,42
0,09
1,31
mai
/10
83,8
414
,35
0,32
0,19
0,11
0,23
0,11
0,85
jun/
1084
,11
12,5
30,
480,
400,
150,
891,
44ju
l/10
85,8
110
,73
2,43
0,02
0,25
0,76
ago/
1080
,95
13,8
83,
570,
220,
210,
071,
1se
t/10
81,3
613
,36
4,11
0,19
0,09
0,18
0,10
0,05
0,56
out/
1082
,92
12,9
23,
180,
200,
010,
130,
010,
65no
v/10
80,6
213
,68
3,56
0,18
0,01
0,02
0,33
1,61
dez/
1075
,22
20,5
82,
410,
280,
010,
260,
50,
74ja
n/11
82,9
313
,60
2,02
0,26
0,03
0,27
0,01
0,86
(Con
tinua
/ C
ontin
ues)

Anuário Estatístico da Agroenergia – 2012 265
Mês
Mon
th
Óle
o de
so
jaSo
ybea
n O
il
Gor
dura
bo
vina
Bovi
ne fa
t
Óle
o de
al
godã
oCo
tton
seed
oil
Óle
o de
fr
itur
a us
ado
Use
d fr
ying
oil
Gor
dura
de
fran
goCh
icke
n fa
t
Gor
dura
de
por
coPo
rk fa
t
Óle
o de
pa
lma
Palm
oil
Óle
o de
am
endo
im
Pean
ut o
il
Óle
o de
gi
rass
olSu
nflow
er o
il
Óle
o de
m
amon
a Ca
stor
bean
oil
Óle
o de
sé
sam
oSe
sam
e oi
l
Óle
o de
na
bo-
forr
agei
roRa
dish
oil*
Out
ros
mat
eria
is
grax
osO
ther
fatt
y m
ater
ials
fev/
1183
,97
12,4
22,
070,
540,
290,
7m
ar/1
183
,66
13,8
20,
790,
370,
390,
95ab
r/11
83,7
613
,66
0,72
0,43
0,01
0,25
1,18
mai
/11
83,7
613
,36
0,89
0,42
0,01
0,41
1,16
jun/
1183
,26
12,3
42,
170,
900,
010,
430,
90ju
l/11
86,2
79,
022,
830,
620,
181,
07ag
o/11
85,2
07,
794,
010,
490,
030,
32,
17se
t/11
78,5
213
,00
4,95
0,50
0,05
0,45
0,11
2,41
out/
1171
,74
17,3
26,
340,
460,
050,
490,
140,
013,
44no
v/11
72,9
816
,34
5,55
0,20
0,03
0,33
0,44
4,14
dez/
1171
,13
18,6
64,
690,
630,
040,
370,
394,
08ja
n/12
74,5
415
,63
7,72
0,52
0,04
0,33
0,25
0,97
fev/
1271
,10
17,9
57,
250,
520,
020,
191,
671,
29m
ar/1
275
,74
17,8
02,
880,
660,
030,
342,
54
Font
e (S
ourc
e): A
NP.
Elab
oraç
ão (E
labo
ratio
n): M
apa/
SPA
E.N
ota:
* R
apha
nus
sativ
us L
. var
. ole
iferu
s St
okes
.
(Con
tinua
ção
/ Con
tinue
d)

Ministério da Agricultura, Pecuária e Abastecimento266
Gráfico 127 – Participação das matérias-primas utilizadas na produção de biodiesel no Brasil, em porcentagemChart 127 – Share of raw materials used in biodiesel production in Brazil, in percentage
0%
10%
20%
30%
40%
50%
60%
70%
80%
90%
100%
out/08
dez/08
fev/0
9
abr/0
9
jun/09
ago/09
out/09
dez/09
fev/1
0
abr/1
0
jun/10
ago/10
out/10
dez/10
fev/1
1
abr/1
1
jun/11
ago/11
out/11
dez/11
fev/1
2
Meses / Months
Outros (Others) Óleo de algodão (Cottonseed oil)
Gordura bovina (Bovine fat) Óleo de soja (Soybean Oil)

Florestas EnergéticasEnergy Forests
06

Ministério da Agricultura, Pecuária e Abastecimento268
6.1 Informações técnicas6.1 Technical informations
Tabela 183 – Informações técnicas da cultura do eucaliptos e pinusTable 183 – Technical information of eucalyptus and pines crop
ItemItem
DadoData
Ciclo (Cycle) 3 ciclos de 7 anos, total de 21 anos (3 cycles of 7 years, 21 years in total)
Produtividade média (Average productivity)
1667 árvores/ha – 1100-2200 (1667 trees/ha – 1100-2200)
Rendimento (Yield) 25-50 m³/ha/ano (25-50 m³ /ha/year)
Espécies indicadas para fins energéticos (Species suitable for energy forestry)
Eucalyptus dunnii
Eucalyptus benthamii
Eucalyptus grandis
Eucalyptus saligna
Eucalyptus camaldulensis
Eucalyptus tereticornis
Eucalyptus cloeziana
Cultivares Registrados no Mapa (Registered Cultivars in Mapa)
5 Eucalyptus benthamii Maiden e Cambage6 Eucalyptus brassiana S.T. Blake x Eucalyptus grandis W. Hill ex
Maiden1 Eucalyptus brassiana S.T. Blake x Eucalyptus urophylla S.T. Blake3 Eucalyptus camaldulensis Dehnh. x Eucalyptus grandis W. Hill ex
Maiden4 Eucalyptus camaldulensis Dehnh. x Eucalyptus urophylla S.T. Blake
9 Eucalyptus cloeziana F. Muell.6 Eucalyptus dunnii Maiden
1 Eucalyptus grandis W. Hill ex Maiden x Eucalyptus dunnii Maiden130 Eucalyptus grandis W. Hill ex Maiden x Eucalyptus urophylla S.T.
Blake1 Eucalyptus grandis W. Hill ex Maiden x Eucalyptus resinifera Sm.
1 Eucalyptus grandis W. Hill ex Maiden x Eucalyptus spp.9 Eucalyptus saligna Sm.
1 Eucalyptus saligna Sm. x Eucalyptus tereticornis Sm.37 Eucalyptus spp.
1 Eucalyptus tereticornis Sm.2 Eucalyptus tereticornis Sm. x Eucalyptus urophylla S.T. Blake
1 Eucalyptus urophylla S.T. Blake x Eucalyptus spp.1 Eucalyptus camaldulensis Dehnh. x Eucalyptus tereticornis Sm.
55 Eucalyptus grandis W. Hill ex Maiden4 Eucalyptus camaldulensis Dehn.78 Eucalyptus urophylla S.T. Blake
5 Eucalyptus pellita F. Muell.2 Eucalyptus pilularis Sm.
5 Eucalyptus platyphylla F. Muell.1 Eucalyptus pyrocarpa L.A.S. Johnson e Blaxell
(Continua / Continues)

Anuário Estatístico da Agroenergia – 2012 269
ItemItem
DadoData
1 Corymbia maculata7 Eucalyptus citriodora Hook.2 Eucalyptus maculata Hook.
7 Corymbia citriodora (Hook.) K.D. Hill x Corymbia torelliana (F. Muell.) K.D. Hill & L.A.S. Johnson
1 Eucalyptus grandis W. Hill ex Maiden x Eucalyptus urophylla S.T. Blake x Eucalyptus tereticornis Sm
1 Eucalyptus nitens (H. Deane & Maiden) Maiden21 Pinus taeda L.
1 Pinus caribaea var. bahamensis Barret & Golfari1 Pinus caribaea var. caribaea Barrett & Golfari
1 Pinus elliottii Engelm.1 Pinus elliottii Englem var. elliottii1 Pinus oocarpa Schiede ex Schltdl.1 Pinus caribaea var. Hondurensis1 Pinus kesiya Royle ex Gordon
3 Pinus patula Schiede ex Schltdl. et Cham.2 Pinus caribaea Morelet var. hondurensis (Sénéclauze) W. H. G. Barret
& Golfari1 Pinus elliotti Engelm. x Pinus caribaea Morelet var. hondurensis
1 Pinus maximinoi H. E. Moore
2 Pinus tecunumanii Eguiluz & J. P. Perry
Defensivos agrícolas registrados no Mapa (Registered pesticides in Mapa)
52 (Eucalipto/Eucalyptus)
33 (Pinus/Pines)
Fonte (Source): Mapa; Embrapa.
6.2 Carvão vegetal6.2 Wood charcoal6.2.1 Informações técnicas6.2.1 Technical information
Tabela 184 – Informações técnicasTable 184 – Technical information
ItemItem
DadoData
Densidade (Density) 250 kg/m3
Poder calorífico inferior (Inferior calorific value)
6.460 kcal/kg
Fonte (Source): MME.
(Continuação / Continued)

Ministério da Agricultura, Pecuária e Abastecimento270
6.2.
2 Pr
od
uçã
o m
un
dia
l6.
2.2
Wor
ld p
rodu
ctio
n
Tab
ela
185
– Pr
inci
pai
s p
aíse
s p
rod
uto
res
de
carv
ão v
eget
al, e
m m
ilhõ
es d
e to
nel
adas
Tabl
e 18
5 –
Mai
n ch
arco
al p
rodu
cing
cou
ntrie
s, in
mill
ion
tons
19
6119
6219
6319
6419
6519
6619
6719
6819
6919
7019
7119
7219
7319
7419
7519
7619
7719
7819
7919
8019
8119
8219
8319
8419
85B
rasi
l (B
razi
l)*-
--
--
--
--
2,74
3,12
3,61
3,83
4,78
5,71
5,18
5,27
5,39
6,35
7,19
6,83
6,92
7,78
9,63
10,0
8
Ch
ina
(C
hina
)1,
652
1,66
51,
679
1,69
21,
706
1,72
1,73
41,
748
1,76
21,
776
1,79
11,
827
1,83
31,
877
1,88
21,
964
1,96
61,
931
1,93
11,
925
1,94
91,
948
1,93
61,
902
1,87
8
Rep
úb
lica
Dem
ocr
átic
a d
o C
on
go
(D
emoc
ratic
Re
publ
ic o
f C
ongo
)
0,27
80,
288
0,29
80,
309
0,32
0,33
10,
343
0,35
50,
368
0,38
10,
386
0,39
90,
402
0,41
10,
433
0,45
80,
475
0,50
30,
523
0,53
90,
557
0,58
20,
603
0,61
70,
641
Etió
pia
(E
thio
pia)
--
--
--
--
--
--
--
--
--
--
--
--
-
Ind
ia
(Indi
a)0,
850,
871
0,89
10,
912
0,93
40,
956
0,97
91,
002
1,02
51,
051,
081
1,12
11,
147
1,18
21,
186
1,22
61,
235
1,25
21,
312
1,32
71,
347
1,37
1,38
21,
411
1,43
2
Nig
éria
(N
iger
ia)
0,77
10,
794
0,81
80,
843
0,86
80,
894
0,92
10,
949
0,97
81,
007
1,01
41,
055
1,07
61,
087
1,14
91,
168
1,19
81,
279
1,31
11,
357
1,46
91,
545
1,65
81,
745
1,77
3
Dem
ais
paí
ses
(Oth
er
coun
trie
s)
12,8
9213
,044
13,1
0113
,58
13,8
1914
,111
14,3
8914
,725
15,0
2512
,644
12,6
6112
,786
12,8
8612
,658
12,0
2113
,011
13,4
4314
,034
13,5
4913
,558
14,3
3914
,842
14,7
9513
,66
13,8
95
Mu
nd
o
(Wor
ld)
16,4
4316
,662
16,7
8717
,336
17,6
4718
,012
18,3
6618
,779
19,1
5819
,598
20,0
5320
,798
21,1
7421
,995
22,3
8123
,007
23,5
8724
,389
24,9
7625
,896
26,4
9127
,207
28,1
5428
,965
29,6
99
19
8619
8719
8819
8919
9019
9119
9219
9319
9419
9519
9619
9719
9819
9920
0020
0120
0220
0320
0420
0520
0620
0720
0820
0920
10B
rasi
l (B
razi
l)*10
,63
10,3
511
,02
12,2
710
,02
8,78
8,07
8,49
8,59
7,91
7,29
7,01
6,39
7,05
7,71
7,03
7,35
8,66
10,0
99,
899,
569,
969,
896,
347,
38
Ch
ina
(C
hina
)1,
883
1,87
51,
866
1,89
81,
929
1,92
91,
904
1,86
61,
849
1,84
51,
841
1,84
81,
842
1,82
51,
796
1,79
1,78
31,
777
1,77
1,76
41,
763
1,74
91,
741
1,73
31,
725
Rep
úb
lica
Dem
ocr
átic
a d
o C
on
go
(D
emoc
ratic
Re
publ
ic o
f C
ongo
)
0,65
90,
681
0,70
90,
747
0,79
10,
856
0,94
11,
056
1,14
11,
199
1,24
61,
289
1,33
31,
381
1,43
11,
482
1,53
41,
589
1,64
51,
704
1,76
41,
826
1,89
1,95
62,
025
Etió
pia
(E
thio
pia)
--
--
--
-2,
384
2,48
22,
554
2,59
32,
677
2,73
72,
821
2,90
82,
983
3,06
3,13
93,
223,
303
3,38
53,
469
3,55
53,
643
3,73
4
Ind
ia
(Indi
a)1,
455
1,47
81,
477
1,49
1,50
61,
544
1,56
41,
587
1,60
71,
617
1,61
71,
627
1,63
81,
651,
661
1,67
42,
782,
881,
714
1,72
71,
741,
752
1,76
52,
882,
88
Nig
éria
(N
iger
ia)
1,86
71,
982,
022,
075
2,13
12,
212,
314
2,42
2,54
22,
646
2,76
32,
872
2,92
23,
006
3,08
53,
165
3,24
83,
333
3,42
3,51
3,59
23,
676
3,76
23,
853,
94
Dem
ais
paí
ses
(Oth
er
coun
trie
s)
14,0
1914
,874
15,1
3310
,691
12,2
2914
,677
14,5
3412
,178
16,8
7318
,228
18,3
7417
,318
18,9
5919
,177
18,0
9819
,263
19,6
5420
,531
21,3
4422
,337
22,8
7424
,56
26,1
9924
,641
25,4
78
Mu
nd
o
(Wor
ld)
30,5
1331
,238
32,2
2529
,171
28,6
0629
,996
29,3
2729
,981
35,0
8435
,999
35,7
2434
,641
35,8
2136
,91
36,6
8937
,387
39,4
0941
,909
43,2
0344
,235
44,6
7846
,992
48,8
0245
,043
47,1
62
Font
e (S
ourc
e): F
AO
; MM
E*.

Anuário Estatístico da Agroenergia – 2012 271
Gráfico 128 – Principais países produtores de carvão vegetal, em milhões de toneladasChart 128 – Main charcoal producing countries, in million tons
0
10
20
30
40
50
60
1961
1963
1965
1967
1969
1971
1973
1975
1977
1979
1981
1983
1985
1987
1989
1991
1993
1995
1997
1999
2001
2003
2005
2007
2009
Pro
du
ção
(m
ilhõ
es d
e to
nel
adas
)
Pro
du
ctio
n (
mill
ion
to
ns)
Ano / Year
Etiópia (Ethiopia) República Democrática do Congo (Democratic Republic of Congo) China (China)
India (India) Brasil (Brazil)* Demais países (Other countries) Nigéria (Nigeria)

Ministério da Agricultura, Pecuária e Abastecimento272
6.2.3 Produção nacional6.2.3 National production
Tabela 186 – Série histórica da produção de carvão vegetal e seu equivalente energético no BrasilTable 186 – Charcoal production and energy equivalent in Brazil
AnoYear
Produção de carvão vegetal (milhões de toneladas)
Wood charcoal Production (million tons)
Equivalente energético (milhões de tep)Energy equivalent (million toe)
1970 2,74 1,771971 3,12 2,011972 3,61 2,331973 3,83 2,481974 4,78 3,091975 5,71 3,691976 5,18 3,351977 5,27 3,401978 5,39 3,481979 6,35 4,101980 7,19 4,641981 6,83 4,411982 6,92 4,471983 7,78 5,031984 9,63 6,221985 10,08 6,511986 10,63 6,871987 10,35 6,681988 11,02 7,121989 12,27 7,931990 10,02 6,471991 8,78 5,671992 8,07 5,211993 8,49 5,481994 8,59 5,551995 7,91 5,111996 7,29 4,711997 7,01 4,531998 6,39 4,131999 7,05 4,562000 7,71 4,982001 7,03 4,542002 7,35 4,752003 8,66 5,592004 10,09 6,512005 9,89 6,392006 9,56 6,182007 9,96 6,432008 9,89 6,392009 6,34 4,102010 7,38 4,77
Fonte (Source): MME.

Anuário Estatístico da Agroenergia – 2012 273
Gráfico 129 – Série histórica de produção de carvão vegetal e seu equivalente enrgético no BrasilChart 129 – Charcoal production and energy equivalent in Brazil
0
2
4
6
8
10
12
14
0
2
4
6
8
10
12
14
1970
1972
1974
1976
1978
1980
1982
1984
1986
1988
1990
1992
1994
1996
1998
2000
2002
2004
2006
2008
2010
Milh
ões
de
tep
M
illio
n t
oe
Milh
ões
de
ton
elad
as
Mill
ion
to
ns
Ano / Year
Produção de Carvão Vegetal (Wood Charcoal Production) Equivalente Energético (Energy Equivalent)

Ministério da Agricultura, Pecuária e Abastecimento274
6.2.4 Importação e exportação6.2.4 Import and export
Tabela 187 – Importação e exportação de carvão vegetal no Brasil, em mil toneladasTable 187 – Charcoal imports and exports in Brazil, in thousand tons
AnoYear
Importação (mil toneladas)Import (thousand tons)
Exportação (mil toneladas)Export (thousand tons)
1970 0,00 0,001971 0,00 0,001972 0,00 0,001973 0,00 0,001974 0,00 0,001975 0,00 0,001976 0,00 0,001977 0,00 0,001978 0,00 0,001979 0,00 0,001980 0,00 0,001981 0,00 0,001982 0,00 0,001983 0,00 0,001984 0,00 0,001985 0,00 0,001986 0,00 0,001987 0,00 0,001988 0,00 0,001989 0,00 0,001990 0,00 0,001991 0,00 0,001992 0,00 0,001993 2,00 18,001994 6,00 11,001995 16,00 10,001996 8,00 0,001997 6,91 5,201998 10,32 9,601999 9,51 9,052000 20,03 8,362001 18,20 9,992002 23,12 12,642003 24,78 13,782004 52,13 28,552005 90,30 14,942006 158,46 12,722007 304,27 12,802008 355,47 4,872009 84,76 6,492010 124,18 2,812011 110,46 0,93
Fonte (Source): MME; MDIC.Obs.: Desde 1997 dados do MDIC.
Since 1997 data from MDIC.NCM: 4402.10.00 e 4402.90.00.
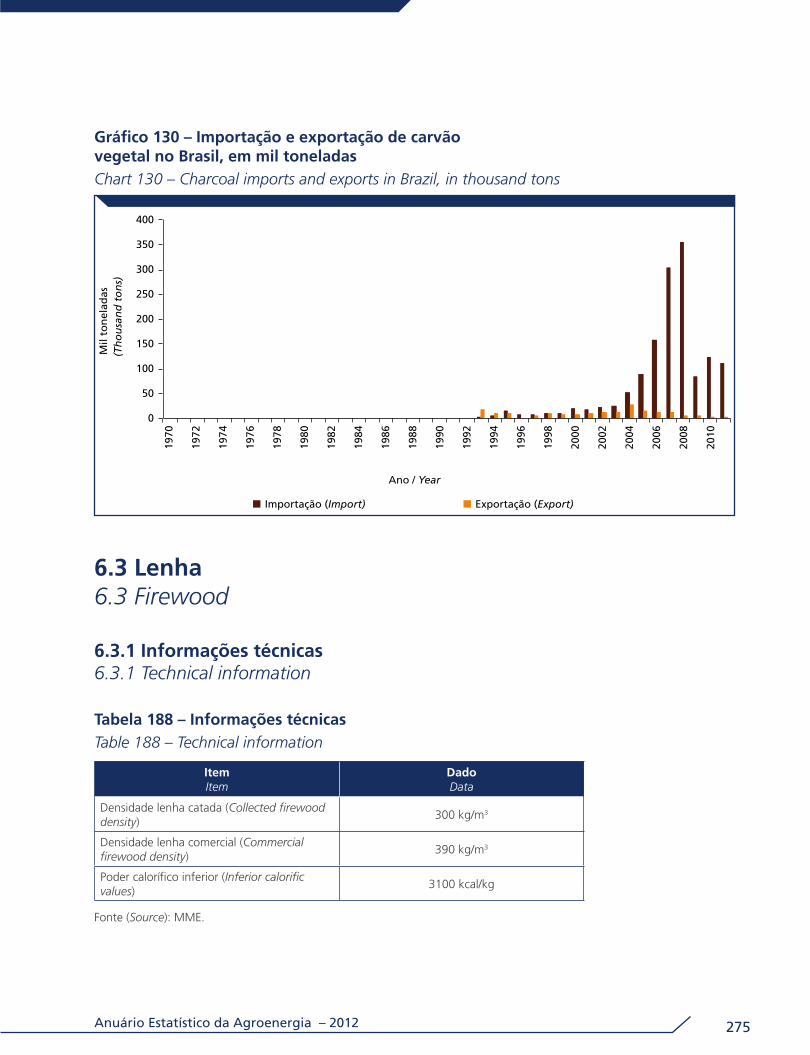
Anuário Estatístico da Agroenergia – 2012 275
Gráfico 130 – Importação e exportação de carvão vegetal no Brasil, em mil toneladasChart 130 – Charcoal imports and exports in Brazil, in thousand tons
0
50
100
150
200
250
300
350
400
1970
1972
1974
1976
1978
1980
1982
1984
1986
1988
1990
1992
1994
1996
1998
2000
2002
2004
2006
2008
2010
Mil
ton
elad
as
(Th
ou
san
d t
on
s)
Ano / Year
Importação (Import) Exportação (Export)
6.3 Lenha6.3 Firewood
6.3.1 Informações técnicas6.3.1 Technical information
Tabela 188 – Informações técnicasTable 188 – Technical information
ItemItem
DadoData
Densidade lenha catada (Collected firewood density)
300 kg/m3
Densidade lenha comercial (Commercial firewood density)
390 kg/m3
Poder calorífico inferior (Inferior calorific values)
3100 kcal/kg
Fonte (Source): MME.

Ministério da Agricultura, Pecuária e Abastecimento276
6.3.
2 Pr
od
uçã
o m
un
dia
l6.
3.2
Wor
ld p
rodu
ctio
n
Tab
ela
189
– Pr
inci
pai
s p
aíse
s p
rod
uto
res
de
len
ha,
em
milh
ões
de
ton
elad
asTa
ble
189
– M
ain
firew
ood
prod
ucin
g co
untr
ies,
in m
illio
n to
ns
1961
1962
1963
1964
1965
1966
1967
1968
1969
1970
1971
1972
1973
1974
1975
1976
1977
1978
1979
1980
1981
1982
1983
1984
1985
Bra
sil
(Bra
zil)*
--
--
--
--
-91
,47
89,7
688
,80
87,0
985
,45
83,3
981
,45
77,6
873
,83
71,7
670
,55
69,8
565
,22
65,2
267
,60
64,2
9
Ch
ina
(C
hina
)96
,73
97,3
697
,99
98,6
299
,26
99,8
810
0,53
101,
1610
1,80
102,
4710
3,84
106,
2710
7,14
109,
9011
0,30
114,
0811
3,53
111,
0111
0,24
109,
1710
9,46
108,
5510
7,07
104,
5110
2,46
Rep
úb
lica
Dem
ocr
átic
a d
o C
on
go
(D
emoc
ratic
Re
publ
ic o
f C
ongo
)
6,28
6,47
6,67
6,87
7,08
7,30
7,52
7,75
7,99
8,23
8,37
8,62
8,73
8,93
9,30
9,70
10,0
010
,45
10,8
111
,12
11,4
511
,86
12,2
412
,53
12,9
6
Etió
pia
(E
thio
pia)
--
--
--
--
--
--
--
--
--
--
--
--
-
Ind
ia
(Indi
a)53
,38
54,5
355
,71
56,9
158
,13
59,3
760
,65
61,9
663
,30
64,6
666
,42
68,6
570
,15
72,0
872
,43
74,2
074
,84
75,7
779
,16
80,0
081
,32
83,3
084
,51
86,5
888
,26
Nig
éria
(N
iger
ia)
12,5
012
,60
12,7
012
,80
12,9
113
,01
13,1
113
,22
13,3
213
,43
13,2
713
,50
13,4
813
,35
13,7
613
,71
13,7
714
,33
14,3
714
,54
15,2
715
,64
16,3
016
,70
16,5
7
Dem
ais
paí
ses
(Oth
er
coun
trie
s)
348,
1234
3,41
344,
8134
6,92
344,
9834
6,87
345,
3834
3,90
340,
7834
3,13
342,
7834
2,39
340,
1934
2,28
343,
0734
5,10
347,
3835
1,44
358,
2736
4,71
369,
5838
1,73
381,
7938
8,26
390,
10
Mu
nd
o
(Wor
ld)
517,
0151
4,38
517,
8852
2,12
522,
3652
6,43
527,
2052
8,00
527,
1853
1,92
534,
6853
9,44
539,
6954
6,53
548,
8555
6,79
559,
5356
3,01
572,
8557
9,55
587,
0760
1,08
601,
9160
8,58
610,
34
19
8619
8719
8819
8919
9019
9119
9219
9319
9419
9519
9619
9719
9819
9920
0020
0120
0220
0320
0420
0520
0620
0720
0820
0920
10B
rasi
l (B
razi
l)*61
,42
62,5
859
,21
55,4
650
,46
49,6
247
,28
44,5
444
,42
42,1
041
,62
41,6
942
,91
43,5
743
,98
44,2
146
,44
49,0
950
,81
52,0
052
,95
52,6
154
,39
53,5
053
,31
Ch
ina
(C
hina
)10
1,65
100,
2198
,72
98,9
899
,13
97,5
794
,44
91,3
688
,63
86,5
184
,73
83,1
481
,45
79,9
878
,53
77,0
875
,65
74,2
672
,89
71,5
470
,21
68,9
167
,63
66,3
765
,14
Rep
úb
lica
Dem
ocr
átic
a d
o C
on
go
(D
emoc
ratic
Re
publ
ic o
f C
ongo
)
13,2
613
,61
14,0
414
,60
15,2
416
,10
17,1
818
,56
19,5
820
,27
20,7
521
,15
21,5
321
,96
22,3
922
,80
23,2
123
,64
24,0
724
,52
24,8
825
,26
25,6
426
,03
26,4
3
Etió
pia
(E
thio
pia)
--
--
--
-26
,34
27,1
027
,68
28,0
228
,67
29,0
329
,60
30,1
830
,64
31,1
231
,60
32,1
032
,60
33,0
233
,51
33,9
834
,46
34,9
3815
Ind
ia
(Indi
a)90
,09
91,9
692
,51
93,8
295
,30
97,2
097
,94
98,8
999
,36
99,5
495
,70
95,7
095
,70
95,7
095
,70
95,7
010
3,69
104,
2610
4,82
105,
3910
5,66
105,
9210
6,18
106,
4510
6,70
85
Nig
éria
(N
iger
ia)
16,9
917
,53
17,4
717
,52
17,5
717
,85
18,2
318
,64
19,1
619
,58
19,9
020
,24
20,1
520
,31
20,4
820
,60
20,7
220
,85
20,9
921
,14
21,2
621
,39
21,5
221
,66
21,8
0745
Dem
ais
paí
ses
(Oth
er
coun
trie
s)
391,
3938
8,26
387,
9138
8,67
398,
0140
9,08
399,
8436
3,71
358,
2036
1,35
359,
9237
0,31
358,
7237
2,59
376,
1037
1,42
369,
5737
2,57
375,
3738
1,84
387,
1138
7,41
385,
1933
2,54
336,
12
Mu
nd
o
(Wor
ld)
613,
3961
1,58
610,
6661
3,60
625,
2563
7,81
627,
6361
7,50
612,
0361
4,94
609,
0161
9,20
606,
5862
0,13
623,
3761
8,23
623,
9862
7,19
630,
2463
7,03
642,
1464
2,40
640,
1464
1,00
644,
4496
5
Font
e (S
ourc
e): F
AO
, MM
E* .O
bs.:
Dad
os d
a FA
O c
onsi
dera
ndo
dens
idad
e m
édia
par
a le
nha
cata
da e
com
erci
al d
e 34
5kg/
m³.
FAO
dat
a re
gard
ing
the
firew
ood
aver
age
dens
ity o
f 34
5kg/
m³.

Anuário Estatístico da Agroenergia – 2012 277
Gráfico 131 – Principais países produtores de lenha, em milhões de toneladasChart 131 – Main firewood producing countries, in million tons
0
100
200
300
400
500
600
700
800
1961
1963
1965
1967
1969
1971
1973
1975
1977
1979
1981
1983
1985
1987
1989
1991
1993
1995
1997
1999
2001
2003
2005
2007
2009
Pro
du
ção
(m
ilhõ
es d
e to
nel
adas
)
Pr
od
uct
ion
(m
illio
n t
on
s)
Ano / Year
Etiópia (Ethiopia) República Democrática do Congo (Democratic Republic of Congo) China (China)
India (India) Brasil (Brazil)* Demais países (Other countries) Nigéria (Nigeria)

Ministério da Agricultura, Pecuária e Abastecimento278
6.3.3 Produção nacional6.3.3 National production
Tabela 190 – Série histórica de produção, transformação e equivalente energético da lenha no BrasilTable 190 – Firewood production, transformation and energy equivalent in Brazil
AnoYear
Lenha Firewood
Lenha utilizada na produção de carvão vegetal
Firewood for charcoal production
Lenha utilizada na geração de energia elétrica
Firewood for eletric energy generation
Lenha sem transformação* Firewood without transformation
Produção (milhões de toneldadas)Production
(million tons)
Equivalente energético
(milhões de tep) Energy
equivalent (million toe)
Quantidade (milhões de toneladas)
Quantity (million tons)
Equivalente energético
(milhões de tep) Energy
equivalent (million toe)
Quantidade (milhões de toneladas)
Quantity (million tons)
Equivalente energético
(milhões de tep) Energy
equivalent (million toe)
Quantidade (milhões de toneladas)
Quantity (million tons)
Equivalente energético
(milhões de tep) Energy equivalent
(million toe)
1970 102,79 31,86 11,28 3,50 0,04 0,01 91,47 28,361971 102,65 31,82 12,84 3,98 0,04 0,01 89,76 27,831972 103,73 32,16 14,88 4,61 0,05 0,02 88,80 27,531973 102,94 31,91 15,79 4,90 0,05 0,02 87,09 27,001974 105,20 32,61 19,69 6,11 0,05 0,02 85,45 26,491975 106,99 33,17 23,55 7,30 0,06 0,02 83,39 25,851976 102,89 31,89 21,36 6,62 0,07 0,02 81,45 25,251977 99,47 30,83 21,72 6,73 0,07 0,02 77,68 24,081978 96,15 29,81 22,23 6,89 0,09 0,03 73,83 22,891979 98,02 30,39 26,17 8,11 0,09 0,03 71,76 22,241980 100,31 31,10 29,63 9,19 0,13 0,04 70,55 21,871981 98,15 30,43 28,14 8,72 0,16 0,05 69,85 21,651982 93,94 29,12 28,52 8,84 0,20 0,06 65,22 20,221983 97,57 30,25 32,07 9,94 0,28 0,09 65,22 20,221984 107,59 33,35 39,64 12,29 0,36 0,11 67,60 20,951985 106,25 32,94 41,52 12,87 0,46 0,14 64,29 19,931986 105,74 32,78 43,82 13,58 0,50 0,15 61,42 19,041987 105,77 32,79 42,64 13,22 0,56 0,17 62,58 19,401988 105,09 32,58 45,41 14,08 0,47 0,15 59,21 18,361989 106,34 32,97 50,52 15,66 0,36 0,11 55,46 17,191990 92,09 28,55 41,24 12,79 0,39 0,12 50,46 15,641991 86,17 26,71 36,17 11,21 0,38 0,12 49,62 15,381992 80,97 25,10 33,21 10,29 0,48 0,15 47,28 14,661993 80,04 24,81 34,95 10,84 0,55 0,17 44,54 13,811994 80,22 24,87 35,38 10,97 0,42 0,13 44,42 13,771995 75,07 23,27 32,57 10,10 0,40 0,12 42,10 13,051996 70,90 21,98 28,87 8,95 0,42 0,13 41,62 12,901997 69,91 21,67 27,77 8,61 0,45 0,14 41,69 12,921998 68,61 21,27 25,29 7,84 0,43 0,13 42,91 13,301999 71,40 22,13 27,40 8,49 0,45 0,14 43,57 13,512000 74,40 23,06 29,96 9,29 0,47 0,15 43,98 13,632001 72,41 22,45 27,84 8,63 0,36 0,11 44,21 13,702002 75,97 23,55 29,11 9,03 0,42 0,13 46,44 14,402003 83,76 25,96 34,28 10,63 0,39 0,12 49,09 15,222004 90,93 28,19 39,70 12,31 0,41 0,13 50,81 15,752005 91,68 28,42 39,27 12,17 0,41 0,13 52,00 16,122006 91,92 28,50 38,31 11,88 0,67 0,21 52,95 16,412007 92,32 28,62 39,15 12,14 0,55 0,17 52,61 16,312008 94,28 29,23 38,89 12,06 1,00 0,31 54,39 16,862009 79,39 24,61 25,18 7,81 0,71 0,22 53,50 16,582010 84,10 26,07 27,86 8,64 0,85 0,26 53,31 16,53
Fonte (Source): MME.Nota: * Lenha sem tranformação = Produção total de lenha - Lenha para carvão - Lenha para energia.
* Firewood without transformation = Total firewood production - Firewood for charcoal - Firewood for energy.

Anuário Estatístico da Agroenergia – 2012 279
Gráfico 132 – Série histórica da transformação dada à lenha no BrasilChart 132 – Firewood transformation in Brazil
0
20
40
60
80
100
120
1970
1972
1974
1976
1978
1980
1982
1984
1986
1988
1990
1992
1994
1996
1998
2000
2002
2004
2006
2008
2010
Milh
ões
de
ton
elad
as
Mill
ion
to
ns
Ano / Year
Lenha sem transformação (Firewood without transformation)
Lenha utilizada para geração elétrica (Firewood used in eletric generation)
Lenha utilizada na produção de carvão (Firewood used in wood charcoal)
Gráfico 133 – Série histórica da lenha sem transformação e seu equivalente energético no BrasilChart 133 – Firewood without transformation and energy equivalent in Brazil
0
10
20
30
40
50
60
70
80
90
100
0
10
20
30
40
50
60
70
80
90
100
1970
1972
1974
1976
1978
1980
1982
1984
1986
1988
1990
1992
1994
1996
1998
2000
2002
2004
2006
2008
2010
Milh
ões
de
tep
M
illio
n t
oe
Milh
ões
de
ton
elad
as
Mill
ion
to
ns
Ano / Year
Quantidade (Quantity) Equivalente energético (Energy equivalent)

Ministério da Agricultura, Pecuária e Abastecimento280
Tabela 191 – Importação e exportação de lenha no Brasil, em mil toneladasTable 191 – Firewood imports and exports in Brazil, in thousand tons
AnoYear
Importação (mil toneladas)Import (thousand tons)
Exportação (mil toneladas)Export (thousand tons)
1989 0,00 0,00
1990 2,06 0,00
1991 0,11 0,00
1992 3,78 0,00
1993 7,80 0,00
1994 3,89 0,00
1995 3,44 0,00
1996 4,91 0,00
1997 2,04 0,00
1998 12,32 0,01
1999 0,40 0,00
2000 0,01 0,00
2001 0,03 0,00
2002 0,01 0,00
2003 0,01 0,00
2004 0,00 0,00
2005 0,00 0,01
2006 0,00 0,00
2007 0,14 0,00
2008 0,02 0,00
2009 0,03 0,00
2010 0,06 0,03
2011 0,16 0,01
Fonte (Source): MDIC.NCM 44.01.10.00.

Anuário Estatístico da Agroenergia – 2012 281
Gráfico 134 – Importação e exportação de lenha no Brasil, em mil toneladasChart 134 – Firewood imports and exports in Brazil, in thousand tons
0,00
2,00
4,00
6,00
8,00
10,00
12,00
14,00
1989
1991
1993
1995
1997
1999
2001
2003
2005
2007
2009
2011
Mil
ton
elad
as
Tho
usa
nd
to
ns
Ano / Year
Importação (Import) Exportação (Export)

Ministério da Agricultura, Pecuária e Abastecimento282
Alcopar – Associação de Produtores de Álcool e Açúcar do Estado do ParanáProducers Association of Alcohol and Sugar of the State of Paraná
ANP – Agência Nacional do Petróleo, Gás Natural e BiocombustíveisNational Agency of Petroleum, Natural Gas and Biofuels
Conab – Companhia Nacional de AbastecimentoNational Supply Company
Embrapa – Empresa Brasileira de Pesquisa AgropecuáriaBrazilian Agricultural Research Corporation
FAO – Organização das Nações Unidas para Agricultura e Alimentação/The Food and Agriculture Organization of the United Nations
F.O. Licht´S – Agra Informa Ltda.
IBGE – Instituto Brasileiro de Geografia e Estatística Brazilian Institute of Geography and Statistics
Mapa – Ministério da Agricultura, Pecuária e AbastecimentoMinistry of Agriculture, Livestock and Food Supply
MDIC – Ministério do Desenvolvimento, Indústria e Comércio ExteriorMinistry of Development, Industry and Foreign Trade
MME – Ministério de Minas e EnergiaMinistry of Mines and Energy
EPE – Empresa Brasileira de Pesquisa EnergéticaBrazilian Energy Research Corporation
OIA – Organização Internacional do Açúcar International Sugar Organization
USDA – Departamento de Agricultura dos Estados UnidosUnited States Department of Agriculture
Unica – União da Indústria de Cana-de-açúcarSugarcane Industry Association
Siglas / Acronyms

9 788579 910708
ISBN 978-85-7991-070-8