Embed Size (px)
Citation preview

Mayank Mishra
A Bayesian approach toNDT Data Fusion for St.Torcato Church
Portugal�����3


A Bayesian approach to NDT Data Fusion for St. Torcato Church Mayank MISHRA
DECLARATION
Name: Mayank MISHRA
Email: [email protected]
Title of theMsc Dissertation: A Bayesian approach to NDT Data Fusion for St. Torcato Church
Supervisor(s): Prof. Luís F. Ramos and Prof. Tiago Filipe Silva Miranda
Year: 2012 / 2013
I hereby declare that all information in this document has been obtained and presented in accordance withacademic rules and ethical conduct. I also declare that, as required by these rules and conduct, I have fullycited and referenced all material and results that are not original to this work.
I hereby declare that the MSc Consortium responsible for the Advanced Masters in Structural Analysis ofMonuments and Historical Constructions is allowed to store and make available electronically the presentMSc Dissertation.
University: University of Minho, Portugal
Date: July 2013
Signature: ____________________________
Erasmus Mundus Programme
ADVANCED MASTERS IN STRUCTURAL ANALYSIS OF MONUMENTS AND HISTORICAL CONSTRUCTIONS i


A Bayesian approach to NDT Data Fusion for St. Torcato Church Mayank MISHRA
Dedicated to the memory of my Late Grandmother, Priyamvada Mishra.
Erasmus Mundus Programme
ADVANCED MASTERS IN STRUCTURAL ANALYSIS OF MONUMENTS AND HISTORICAL CONSTRUCTIONS iii


A Bayesian approach to NDT Data Fusion for St. Torcato Church Mayank MISHRA
ACKNOWLEDGEMENTS
This thesis involves support of so many people directly or indirectly right from beginning till end of my thesis.I can’t possibly write all forms of support I got over this SAHC masters so please spare me if I missedsomeone. Among all of support, I would like to express by special thanks to:
• Professor Luís Ramos, my supervisor who guided me throughout the thesis by giving his ideas andsupport to me and the interesting discussions we had helped me a lot to make my thesis go in rightdirection. He provided me with all the data from St Torcato church and kept giving me suggestionsfrom time to time on how to include every single piece of information to arrive to a more confidentvalue of parameter.
• Professor Tiago Filipe Miranda, my co-supervisor who helped me a lot with Bayesian updating whichI had no idea from beginning but he patiently explained me his research paper and excel sheets.After he explained me his excel sheets which he had done for Bayesian updating then it was veryeasy for me to put into Matlab the algorithm he explained me and making Graphical User Interfacewas simple from that point.
• Erasmus Mundus consortium whom I owe the most as they provided me full support throughout thecourse and without them it won’t be even possible for me to finish this course.
• PhD student Marisa Pinheiro who helped me to calculate weightage factors for different NDT dataand explaining me her research which modified my approach to find elastic modulus. Elizabethmanning who helped me figuring out the data from St. Torcato church and giving her suggestionsand some advice about how to deal with it.
• For the coursework I would thank Professors who taught me in Padova Paolo Franchetti, PauloLourenço, Carlo Pellegrino, Flippo Casarin, Pere Roca, Luca Pela, Petr Kabele, Luigia Binda, EnricoGarbin, Claudio Modena, Milos Drdácký, Graça Vasconcelos, Enric Vázquez, Jirí Bláha, SA3 tutorMichele Frizzarin and SA7 guide Giulia Bettiol.
• Ana Fonseca, SAHC Secretariat for helping me in solving all the problems I faced in Guimarães. ElisaTrovo from University of Padova for her support to complete all my paperwork in Italy and serving asa mentor right from the start.
My dear parents Shri Vijay Kant Mishra and Kavita Mishra who encouraged me to go for further studieswhom I missed them throughout out the year. My brother Shashank who kept me motivated by makingme smile. My grandmother Priyamvada Mishra in heaven, for all support she gave me throughout my lifeand all the memories she has left in my heart will keep me motivated throughout my life. My fellow SAHCfriends which I met during this programme in Padova and Guimarães which will I will remember all mylife and how this course helped me to learn their culture from different countries. Last but not the leasttypesetting program LATEXwhich made formatting of the thesis much easy. The SAHC Masters was nodoubt the best thing which has happened to me and has made an indelible impression on me.
Erasmus Mundus Programme
ADVANCED MASTERS IN STRUCTURAL ANALYSIS OF MONUMENTS AND HISTORICAL CONSTRUCTIONS v


A Bayesian approach to NDT Data Fusion for St. Torcato Church Mayank MISHRA
ABSTRACT
The main objective of this thesis is to combine information gathered from different Non Destructive tests(NDT) (direct and indirect) and fuse it by using Bayesian approach. Many time practitioners workingwith NDT data want to choose parameters based on results of different NDT tests with different levels ofreliability and uncertainty quantification. As suggested by literature the use of a single technique mightnot suffice to gain information and the combination of different techniques is recommended. Also for thecase of masonry structures it might not be possible to perform destructive tests but since the parameterhas to be estimated based on information provided by various NDT data sources coupled with literatureinformation.
NDT data from San Torcato Church was used in this thesis to test a Methodology to transform the data intoa single and uniform format by the help of Bayesian approach. A simple Matlab Toolbox NDT_FUSIONwas developed and tested with different models available and modified later by using a Trust Factor whichtakes into account the weightage of different NDT tests. The developed toolbox is very easy to use since ithas Graphical user interface (GUI) and does not required practitioner to learn the complex mathematicsinvolved in calculation behind the Bayesian black box. The data fusion was done at different levels andsteps so every time an updating takes place we arrive to a more realistic value of parameter.
Two geomechanical parameters namely the Elastic modulus (E) and compressive strength ( fc) of graniteblocks from St. Torcato Church were studied in this thesis. The normal probability distribution function forthe parameter of interest was calculated by using Jeffrey’s Prior and Conjugate Prior, considering differentlevels of initial knowledge. The Elastic modulus (E) was updated by using data from Literature knowledge,sonic, ultrasonic and direct compressive strength tests to arrive to a more certain value in form of a posteriordistribution. In both the cases the raw data from direct and indirect sources was processed and combinedwith data fusion toolbox to transform values into statistical distribution. The reliability confidence intervalsof parameters were updated every time a new data becomes available providing more broad information.Different levels of uncertainty are present in data fusion system proposed in this report starting from theliterature knowledge to direct compression test core data which were quantified and addressed in this thesis.
The tests of different reliability levels were weighed by circulating a survey form among professors andgraduate students experts in the field to take their opinion. The results of the surveys come was thecalculation of Trust Factor to update the spread of the parameters and incorporate in the model to obtainbetter predication of the parameters. The application developed comes with a Matlab compiler runtime(MCR) installer which allows the application to run on computers without the prerequisite of having Matlabinstalled.
Keywords: NDT Data fusion, Bayesian updating, Uncertainty, Mechanical parameter.
Erasmus Mundus Programme
ADVANCED MASTERS IN STRUCTURAL ANALYSIS OF MONUMENTS AND HISTORICAL CONSTRUCTIONS vii


A Bayesian approach to NDT Data Fusion for St. Torcato Church Mayank MISHRA
RESUMO
Quando na inspeção e diagnóstico de estruturas se utilizam diferentes métodos de ensaios destrutivose não destrutivos, pela natureza dos seus resultados (qualitativos e/ou quantitativos), existem muitasincertezas associadas na quantificação de parâmetros mecânicos essenciais para as análises estruturais.Tal como a literatura da especialidade sugere, o uso de uma técnica de inspeção isolada pode não sersuficiente para obter-se a informação desejada, tornando-se recomendável a utilização de diferentestécnicas ou métodos para corroborar os resultados. No caso de construções históricas muitas vezes nãoé possível realizar ensaios destrutivos, sendo apenas realizados ensaios não destrutivos que, muitasvezes, oferecem apenas resultados qualitativos, sendo usual combinar métodos e ensaios com valores dereferência existentes na literatura mas caracterizados por terem grande dispersão de resultados.
O objetivo principal da presente dissertação é combinar os resultados obtidos por via de diferentesensaios não-destrutivos (diretos e indiretos) e fundi-los usando uma metodologia com recurso á inferênciabayesiana e a técnicas de fusão de dados. Os ensaios não destrutivos realizados na igreja de S. Torcatoem Guimarães foram usados para validar a metodologia. Como resultado foi elaborada uma toolbox nosoftware Matlab que permite a fusão de diferentes dados para a estimativa de parâmetros mecânicos, taiscomo o módulo de elasticidade ou a resistência à compressão do granito utilizado na construção da igreja.A toolbox tem uma interface gráfica simples de utilizar e permite uma análise incremental, obtendo-se nofinal valores médios, desvios padrão e intervalos de confiança para cada parâmetro em estudo.
Tendo em consideração as incertezas e as diferenças entre os diferentes métodos de ensaio, foi tambémadicionado à metodologia um fator de confiança aplicável a cada método de ensaio. Para tal foi realizadoum inquérito a um conjunto de especialista e utilizadores de ensaios não-destrutivos. Esse inquéritopermitiu aferir a confiança do utilizador perante a utilização de um método na quantificação de umparãmetro estrutural, quando comparado com outros diferentes métodos. À metodologia adotadainicialmente foi então aplicado o fator de confiança majorando ou minorando as incertezas associadas acada método.
Palavras Chave: Fusão de dados, análise Bayesiana, incertezas, estimativa de parâmetros mecânicos
Erasmus Mundus Programme
ADVANCED MASTERS IN STRUCTURAL ANALYSIS OF MONUMENTS AND HISTORICAL CONSTRUCTIONS ix


A Bayesian approach to NDT Data Fusion for St. Torcato Church Mayank MISHRA
Contents
Page
1 INTRODUCTION 11.1 General considerations . . . . . . . . . . . . . . . . . . . . . . . . . . . . . . . . . . . . . . 11.2 Objectives . . . . . . . . . . . . . . . . . . . . . . . . . . . . . . . . . . . . . . . . . . . . . . 11.3 Chapter-wise breakup . . . . . . . . . . . . . . . . . . . . . . . . . . . . . . . . . . . . . . . 2
2 TESTING AND MONITORING TECHNIQUES FOR MASONRY CONSTRUCTIONS 52.1 Non-Destructive Techniques (NDT) . . . . . . . . . . . . . . . . . . . . . . . . . . . . . . . . 6
2.1.1 Visual Inspection . . . . . . . . . . . . . . . . . . . . . . . . . . . . . . . . . . . . . . 62.1.2 Sonic Testing . . . . . . . . . . . . . . . . . . . . . . . . . . . . . . . . . . . . . . . . 62.1.3 Cover meter / Ferroscan Tests . . . . . . . . . . . . . . . . . . . . . . . . . . . . . . 82.1.4 Schmidt Hammer . . . . . . . . . . . . . . . . . . . . . . . . . . . . . . . . . . . . . . 92.1.5 Coin tap test . . . . . . . . . . . . . . . . . . . . . . . . . . . . . . . . . . . . . . . . 92.1.6 Ultrasonic Testing . . . . . . . . . . . . . . . . . . . . . . . . . . . . . . . . . . . . . 102.1.7 Acoustic Emission . . . . . . . . . . . . . . . . . . . . . . . . . . . . . . . . . . . . . 112.1.8 Resistivity measurements . . . . . . . . . . . . . . . . . . . . . . . . . . . . . . . . . 122.1.9 Infrared measurements . . . . . . . . . . . . . . . . . . . . . . . . . . . . . . . . . . 122.1.10 Georadar . . . . . . . . . . . . . . . . . . . . . . . . . . . . . . . . . . . . . . . . . . 132.1.11 Conductivity Measurements . . . . . . . . . . . . . . . . . . . . . . . . . . . . . . . . 14
2.2 Minor-Destructive Testing (MDT) . . . . . . . . . . . . . . . . . . . . . . . . . . . . . . . . . 142.2.1 Single and Double Flat jack tests . . . . . . . . . . . . . . . . . . . . . . . . . . . . . 142.2.2 Dilatometer techniques . . . . . . . . . . . . . . . . . . . . . . . . . . . . . . . . . . 162.2.3 Endoscopy . . . . . . . . . . . . . . . . . . . . . . . . . . . . . . . . . . . . . . . . . 16
2.3 Destructive tests . . . . . . . . . . . . . . . . . . . . . . . . . . . . . . . . . . . . . . . . . . 172.3.1 Compression tests . . . . . . . . . . . . . . . . . . . . . . . . . . . . . . . . . . . . . 17
2.4 Crack Monitoring . . . . . . . . . . . . . . . . . . . . . . . . . . . . . . . . . . . . . . . . . . 182.4.1 Glass Crack Meters . . . . . . . . . . . . . . . . . . . . . . . . . . . . . . . . . . . . 182.4.2 Crack Meters . . . . . . . . . . . . . . . . . . . . . . . . . . . . . . . . . . . . . . . . 18
2.5 Computers in NDT . . . . . . . . . . . . . . . . . . . . . . . . . . . . . . . . . . . . . . . . . 192.6 Discussion of NDT methods used for St Torcato case study . . . . . . . . . . . . . . . . . . 192.7 Conclusions . . . . . . . . . . . . . . . . . . . . . . . . . . . . . . . . . . . . . . . . . . . . . 20
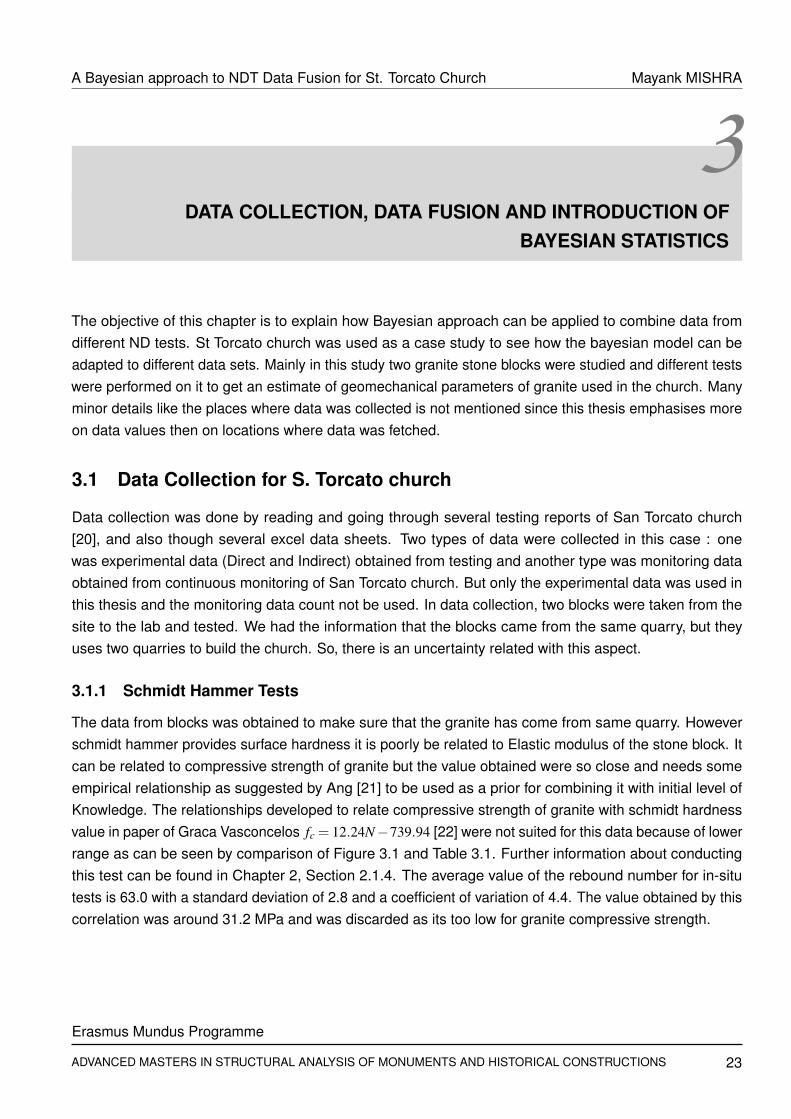
3 DATA COLLECTION, DATA FUSION AND INTRODUCTION OF BAYESIAN STATISTICS 23
Erasmus Mundus Programme
ADVANCED MASTERS IN STRUCTURAL ANALYSIS OF MONUMENTS AND HISTORICAL CONSTRUCTIONS xi

A Bayesian approach to NDT Data Fusion for St. Torcato Church Mayank MISHRA
3.1 Data Collection for S. Torcato church . . . . . . . . . . . . . . . . . . . . . . . . . . . . . . . 233.1.1 Schmidt Hammer Tests . . . . . . . . . . . . . . . . . . . . . . . . . . . . . . . . . . 233.1.2 Granite Sonic Tests . . . . . . . . . . . . . . . . . . . . . . . . . . . . . . . . . . . . 243.1.3 Granite Ultrasonic tests . . . . . . . . . . . . . . . . . . . . . . . . . . . . . . . . . . 263.1.4 Granite cylinder compression tests . . . . . . . . . . . . . . . . . . . . . . . . . . . . 27
3.2 Data Fusion . . . . . . . . . . . . . . . . . . . . . . . . . . . . . . . . . . . . . . . . . . . . . 283.2.1 Definition and General overview . . . . . . . . . . . . . . . . . . . . . . . . . . . . . 283.2.2 Levels of Data fusion . . . . . . . . . . . . . . . . . . . . . . . . . . . . . . . . . . . . 303.2.3 Different techniques of data fusion . . . . . . . . . . . . . . . . . . . . . . . . . . . . 30
3.2.3.1 Probabilistic Fusion . . . . . . . . . . . . . . . . . . . . . . . . . . . . . . . 303.2.3.2 Data fusion using Artificial Intelligence (AI) . . . . . . . . . . . . . . . . . . 30
3.2.4 Performed Data fusion using S. Torcato as case study . . . . . . . . . . . . . . . . . 313.2.4.1 Data Fusion from Direct and Indirect data sources . . . . . . . . . . . . . . 32
3.3 Introduction to Bayesian Statistical theory . . . . . . . . . . . . . . . . . . . . . . . . . . . . 343.3.1 Bayesian inference . . . . . . . . . . . . . . . . . . . . . . . . . . . . . . . . . . . . . 353.3.2 Bayesian inference using Jeffreys prior . . . . . . . . . . . . . . . . . . . . . . . . . 363.3.3 Bayesian inference using conjugate prior . . . . . . . . . . . . . . . . . . . . . . . . 37
3.4 Dealing with different uncertainties . . . . . . . . . . . . . . . . . . . . . . . . . . . . . . . . 38
4 BAYESIAN RELATIONSHIPS FOR ESTIMATING COMPRESSIVE STRENGTH AND ELASTICMODULUS OF STONE GRANITE BLOCKS 414.1 Estimation of mean granite strength ( fc) when only core compressive
strength testing data is available using approach by Kryviak et al. . . . . . . . . . . . . . . . 424.1.1 Prior information . . . . . . . . . . . . . . . . . . . . . . . . . . . . . . . . . . . . . . 424.1.2 Bayesian updating and test results . . . . . . . . . . . . . . . . . . . . . . . . . . . . 43
4.2 Estimation of mean granite strength when only core compressivestrength testing data is available using Jeffreys prior . . . . . . . . . . . . . . . . . . . . . . 44
4.3 Estimation of mean granite strength when only core compressivestrength testing data is available using conjugate prior . . . . . . . . . . . . . . . . . . . . . 454.3.1 Conclusions and Results . . . . . . . . . . . . . . . . . . . . . . . . . . . . . . . . . 47
4.4 Update of Elastic Modulus of Granite E using Bayesian Technique . . . . . . . . . . . . . . 484.4.1 Determination of Posterior using Jeffreys prior for Elastic Modulus of granite . . . . . 484.4.2 Bayesian Model Incorporating data from sonic tests using conjugate prior . . . . . . 494.4.3 Bayesian Model Incorporating data from sonic and ultrasonic tests . . . . . . . . . . 514.4.4 Conclusions from Bayesian model to calculate Elastic modulus (E) . . . . . . . . . . 53
5 DESCRIPTION OF MATLAB TOOLBOX MADE FOR DATA FUSION AND CALCULATIONSOF TRUST FACTOR (T) 555.1 Description of Matlab toolbox NDT_FUSION and NDT_FUSION_TRUST . . . . . . . . . . 555.2 Need for trust factor for NDT tests . . . . . . . . . . . . . . . . . . . . . . . . . . . . . . . . 56
5.2.1 Description of the survey form used for calculation of weights for different tests . . . 56
xii
Erasmus Mundus Programme
ADVANCED MASTERS IN STRUCTURAL ANALYSIS OF MONUMENTS AND HISTORICAL CONSTRUCTIONS
A Bayesian approach to NDT Data Fusion for St. Torcato Church Mayank MISHRA
5.2.2 Methodology for calculating weightage of each NDT test . . . . . . . . . . . . . . . . 575.2.3 Calculations Explained- The weighting factor determination . . . . . . . . . . . . . . 595.2.4 Weightage factor for for NDT tests used in calculating elastic modulus of granite block 59
5.3 Weightage factor for NDT tests used in calculating granite compressive strength . . . . . . 615.3.1 The Weighting factor determination for calculating compressive strength . . . . . . . 61
5.4 Proposal for Trust Factors . . . . . . . . . . . . . . . . . . . . . . . . . . . . . . . . . . . . . 625.5 Calculated trust factors for two NDT tests . . . . . . . . . . . . . . . . . . . . . . . . . . . . 62
5.5.1 Compressive strength of granite blocks including proposed trust factor . . . . . . . . 625.5.2 Modified Algorithm for data fusion . . . . . . . . . . . . . . . . . . . . . . . . . . . . 635.5.3 Results including trust factor for compressive strength ( fc) of granite block . . . . . . 635.5.4 Elastic modulus of granite blocks including proposed trust factor . . . . . . . . . . . 65
5.6 Conclusion including trust factor . . . . . . . . . . . . . . . . . . . . . . . . . . . . . . . . . 66
6 CONCLUSIONS AND FUTURE RESEARCH 696.1 Conclusions . . . . . . . . . . . . . . . . . . . . . . . . . . . . . . . . . . . . . . . . . . . . . 696.2 Future Research . . . . . . . . . . . . . . . . . . . . . . . . . . . . . . . . . . . . . . . . . . 70
A Supplementary Material for Simulation Algorithm and MCMC 75
B MATLAB CODES FOR DIFFERENT BAYESIAN MODELS 77
C FORM for Survey for preference of NDT tests 83
D Calculation to calculate weightage of each NDT test 95
E MANUAL TO USE MATLAB TOOLBOX FOR DATA FUSION 97
Erasmus Mundus Programme
ADVANCED MASTERS IN STRUCTURAL ANALYSIS OF MONUMENTS AND HISTORICAL CONSTRUCTIONS xiii


A Bayesian approach to NDT Data Fusion for St. Torcato Church Mayank MISHRA
List of Figures
1.1 San Torcato Church [1] . . . . . . . . . . . . . . . . . . . . . . . . . . . . . . . . . . . . . 1
2.1 Classification of different tests used in masonry and historical constructions . . . . . . . . 52.2 Hammer to generate pulse for sonic test [2] . . . . . . . . . . . . . . . . . . . . . . . . . . 72.3 Installation of Grid for sonic test [2] . . . . . . . . . . . . . . . . . . . . . . . . . . . . . . . 72.4 Distribution of sonic velocities [2] . . . . . . . . . . . . . . . . . . . . . . . . . . . . . . . . 72.5 Histogram of velocities [2] . . . . . . . . . . . . . . . . . . . . . . . . . . . . . . . . . . . . 72.6 Direct Test [3] . . . . . . . . . . . . . . . . . . . . . . . . . . . . . . . . . . . . . . . . . . . 72.7 Semi-Direct test [3] . . . . . . . . . . . . . . . . . . . . . . . . . . . . . . . . . . . . . . . . 72.8 Indirect Test [3] . . . . . . . . . . . . . . . . . . . . . . . . . . . . . . . . . . . . . . . . . . 72.9 Hilti Ferroscan PS200 - Scanner [2] . . . . . . . . . . . . . . . . . . . . . . . . . . . . . . 82.10 Testing of wall by ferroscan [2] . . . . . . . . . . . . . . . . . . . . . . . . . . . . . . . . . 82.11 Display on Ferroscan screen [2] . . . . . . . . . . . . . . . . . . . . . . . . . . . . . . . . 82.12 Details of imported Ferroscan survey file on computer [2] . . . . . . . . . . . . . . . . . . 82.13 Scmidt Hammer [6] . . . . . . . . . . . . . . . . . . . . . . . . . . . . . . . . . . . . . . . . 92.14 Sonic resonance method/coin tap test [8] . . . . . . . . . . . . . . . . . . . . . . . . . . . 102.15 a) A Scan plot b) Typical Ultrasonic pulse echo system [9] . . . . . . . . . . . . . . . . . 102.16 Ultrasonic Test setup [10] . . . . . . . . . . . . . . . . . . . . . . . . . . . . . . . . . . . . 112.17 Performing Ultrasonic Test [10] . . . . . . . . . . . . . . . . . . . . . . . . . . . . . . . . . 112.18 Ultrasonic Test crack values [10] . . . . . . . . . . . . . . . . . . . . . . . . . . . . . . . . 112.19 Acoustic Emission system [12] . . . . . . . . . . . . . . . . . . . . . . . . . . . . . . . . . 122.20 Set up for resistivity measurement [13] . . . . . . . . . . . . . . . . . . . . . . . . . . . . . 122.21 Detection of hidden tie rods using thermal vision [10] . . . . . . . . . . . . . . . . . . . . . 132.22 Target wall [10] . . . . . . . . . . . . . . . . . . . . . . . . . . . . . . . . . . . . . . . . . . 132.23 Radargram profile showing several voids [10] . . . . . . . . . . . . . . . . . . . . . . . . . 132.24 Detection of hidden tie rods using thermal vision [10] . . . . . . . . . . . . . . . . . . . . . 142.25 Procedure flat jack test [10] . . . . . . . . . . . . . . . . . . . . . . . . . . . . . . . . . . . 152.26 a) Double flat jack test on regular stone masonry b) Stress strain curve [10] . . . . . . . . 152.27 Phases of the dilatometer test [15] . . . . . . . . . . . . . . . . . . . . . . . . . . . . . . . 162.28 Execution of endoscopic investigation (left) and it’s endoscopic picture (right) [16] . . . . . 172.29 Compression testing on a concrete specimen [17] . . . . . . . . . . . . . . . . . . . . . . 182.30 Glass pieces inserted into the wall to monitor cracks [2] . . . . . . . . . . . . . . . . . . . 18
Erasmus Mundus Programme
ADVANCED MASTERS IN STRUCTURAL ANALYSIS OF MONUMENTS AND HISTORICAL CONSTRUCTIONS xv

A Bayesian approach to NDT Data Fusion for St. Torcato Church Mayank MISHRA
2.31 Different types of Crack Meters a) Manual Crack Meters b) Electronic Crack Meter (LVDT)[18] . . . . . . . . . . . . . . . . . . . . . . . . . . . . . . . . . . . . . . . . . . . . . . . . 19
3.1 Figure showing correlation of Schimdt Hammer rebound number and compressive strengthof granite [22] . . . . . . . . . . . . . . . . . . . . . . . . . . . . . . . . . . . . . . . . . . . 24
3.2 Figure showing different stages of Compression test on a granite cylinder a)Stone 2b)Drilling of sample c) Setup to measure elastic modulus d)Failure during compressiontest [20] . . . . . . . . . . . . . . . . . . . . . . . . . . . . . . . . . . . . . . . . . . . . . . 27
3.3 Illustration of human data fusion system [24] . . . . . . . . . . . . . . . . . . . . . . . . . 283.4 Illustration of Data Fusion system combining diverse data sets into a unified (fused) data set 293.5 Figure Illustrating a two layer Perceptron neural network . . . . . . . . . . . . . . . . . . . 313.6 Illustration of Data Fusion system using Bayesian approach for San Torcato Church . . . 323.7 Illustration of Data Fusion system using Bayesian approach in case of indirect and direct
sources of data [28] . . . . . . . . . . . . . . . . . . . . . . . . . . . . . . . . . . . . . . . 333.8 Ven Diagram representing the Probability of two events . . . . . . . . . . . . . . . . . . . 343.9 Scheme of the updating process [34] . . . . . . . . . . . . . . . . . . . . . . . . . . . . . . 363.10 The decision cycle [30] . . . . . . . . . . . . . . . . . . . . . . . . . . . . . . . . . . . . . 363.11 Figure showing various types of uncertainties addressed . . . . . . . . . . . . . . . . . . 38
4.1 Different researches done in geomechanical parameters using Bayesian approach . . . . 424.2 Prior and Posterior density functions for Granite compressive strength fc in MPa using
core data only [31] . . . . . . . . . . . . . . . . . . . . . . . . . . . . . . . . . . . . . . . . 444.3 Posterior density functions for Granite compressive strength fc in MPa using Jeffreys Prior
for sample size n=6 & n=25 . . . . . . . . . . . . . . . . . . . . . . . . . . . . . . . . . . . 454.4 Prior and Posterior density functions for Granite compressive strength fc in Mpa using
conjugate distribution . . . . . . . . . . . . . . . . . . . . . . . . . . . . . . . . . . . . . . 464.5 Data Fusion system using Bayesian approach for updating Compressive strength fc in
case of data from Literature and core compressive strength data for granite . . . . . . . . 474.6 The Normal distribution for Literature values of Elastic Modulus (E) of granite . . . . . . . 484.7 Posterior density functions for Granite Elastic Modulus for normal case using Jeffreys Prior 494.8 Posterior density functions for Granite Elastic Modulus E before and after updating
considering data from Literature, sonic and direct compressive strength data . . . . . . . 504.9 Data Fusion system using Bayesian approach for updating Elastic modulus E in case of
data from sonic tests and compressive strength data . . . . . . . . . . . . . . . . . . . . . 514.10 Posterior density functions for Granite Elastic Modulus E before and after updating
considering data from Literature, Sonic, Ultrasonic and direct compressive strength data . 524.11 Data Fusion system using Bayesian approach for updating Elastic modulus E in case of
data from sonic, Ultrasonic and compressive strength data . . . . . . . . . . . . . . . . . 524.12 Elastic modulus updating after different steps without trust factor . . . . . . . . . . . . . . 53
5.1 Graphical User Interface (GUI) for updating elastic modulus . . . . . . . . . . . . . . . . . 555.2 Graphical User Interface (GUI) for updating elastic modulus using trust factors T1 and T2 . 56
xvi
Erasmus Mundus Programme
ADVANCED MASTERS IN STRUCTURAL ANALYSIS OF MONUMENTS AND HISTORICAL CONSTRUCTIONS

A Bayesian approach to NDT Data Fusion for St. Torcato Church Mayank MISHRA
5.3 Membership function of fuzzy delphi method [40] . . . . . . . . . . . . . . . . . . . . . . . 585.4 Weighing factors for NDT test used to find Elastic modulus . . . . . . . . . . . . . . . . . 605.5 Weighing factors for NDT test used to find compressive strength of granite block . . . . . 625.6 Proposed trust factor for NDT tests . . . . . . . . . . . . . . . . . . . . . . . . . . . . . . . 635.7 Weighing factors for NDT test used to find compressive strength of granite block without
schmidt hammer . . . . . . . . . . . . . . . . . . . . . . . . . . . . . . . . . . . . . . . . . 635.8 Prior and Posterior density functions for Granite compressive strength fc in MPa using
conjugate distribution including trust factors . . . . . . . . . . . . . . . . . . . . . . . . . . 645.9 Data Fusion system using Bayesian approach for updating Compressive strength fc in
case of data from Literature and core compressive strength data for granite including trustfactors for n=6 samples . . . . . . . . . . . . . . . . . . . . . . . . . . . . . . . . . . . . . 65
5.10 Posterior density functions for Granite Elastic Modulus E before and after updatingconsidering data from Literature, Sonic, Ultrasonic and direct compressive strength dataincluding trust factors . . . . . . . . . . . . . . . . . . . . . . . . . . . . . . . . . . . . . . 66
5.11 Data Fusion system using Bayesian approach for updating Elastic modulus E in case ofdata from sonic, Ultrasonic and compressive strength data including trust factors . . . . . 66
5.12 Plot showing update for elastic modulus after each data step with trust factor . . . . . . . 67
6.1 Prior 1 (X1) with and without trust factor . . . . . . . . . . . . . . . . . . . . . . . . . . . . 696.2 Prior 2 (X2) with and without trust factor . . . . . . . . . . . . . . . . . . . . . . . . . . . . 696.3 Posterior distribution (X) with and without trust factor . . . . . . . . . . . . . . . . . . . . . 69
E.1 Screenshot showing data fusion results of Figure 5.11 for last step including trust factors 98E.2 Bayes estimator . . . . . . . . . . . . . . . . . . . . . . . . . . . . . . . . . . . . . . . . . 98
Erasmus Mundus Programme
ADVANCED MASTERS IN STRUCTURAL ANALYSIS OF MONUMENTS AND HISTORICAL CONSTRUCTIONS xvii


A Bayesian approach to NDT Data Fusion for St. Torcato Church Mayank MISHRA
List of Tables
2.1 Different possibilities to use NDT or MDT according to parameter of interest . . . . . . . . 202.2 Summary of NDT Methods adapted from [19] . . . . . . . . . . . . . . . . . . . . . . . . . 21
3.1 Table showing Schmidt hammer test results for San Torcato Church [20] . . . . . . . . . . 243.2 Granite sonic test results (Block and in-situ) [20] . . . . . . . . . . . . . . . . . . . . . . . . 243.3 Granite Stone Block 1 Direct sonic test results [20] . . . . . . . . . . . . . . . . . . . . . . 253.4 Granite Stone Block 2 Direct sonic test results [20] . . . . . . . . . . . . . . . . . . . . . . 253.5 Torcato church granite Direct sonic test results In-situ [20] . . . . . . . . . . . . . . . . . . 253.6 Granite Stone Block 1 Semi-Direct sonic test results [20] . . . . . . . . . . . . . . . . . . . 253.7 Granite Stone Block 2 Semi-Direct sonic test results [20] . . . . . . . . . . . . . . . . . . . 253.8 Granite Stone Block 1 Indirect sonic test results [20] . . . . . . . . . . . . . . . . . . . . . . 253.9 Granite Stone Block 2 Indirect sonic test results [20] . . . . . . . . . . . . . . . . . . . . . . 253.10 Granite Ultrasonic test results (Block and in-situ) [20] . . . . . . . . . . . . . . . . . . . . . 263.11 Granite Stone Block 1 Direct Ultrasonic test results [20] . . . . . . . . . . . . . . . . . . . . 263.12 Granite Stone Block 2 Direct Ultrasonic test results [20] . . . . . . . . . . . . . . . . . . . . 263.13 Granite Stone Blocks Semi-Direct Ultrasonic test results [20] . . . . . . . . . . . . . . . . . 263.14 Granite Stone S. Torcato Semi-Direct Ultrasonic test [20] . . . . . . . . . . . . . . . . . . . 263.15 Granite Stone Block 1 InDirect Ultrasonic test results [20] . . . . . . . . . . . . . . . . . . . 273.16 Granite Stone Block 2 InDirect Ultrasonic test results [20] . . . . . . . . . . . . . . . . . . . 273.17 Granite compression test results [20] . . . . . . . . . . . . . . . . . . . . . . . . . . . . . . 283.18 Range of parameter values for granite [Engineering Toolbox] . . . . . . . . . . . . . . . . . 33
4.1 Prior and posterior values for granite strength fc in MPa using constant mean and variance 434.2 Posterior values for granite strength fc in MPa using Jeffreys prior . . . . . . . . . . . . . . 444.3 Prior and Posterior estimates of compressive strength fc in MPa using Conjugate prior . . 464.4 Guideline table for choosing Elastic Modulus for Rocks [38] . . . . . . . . . . . . . . . . . . 484.5 Posterior values for granite Elastic modulus(E) using Jeffreys prior . . . . . . . . . . . . . . 494.6 Values for granite Elastic modulus (E) for sonic velocity data (Block) generated using Monte
Carlo simulation with uncertainty in Poisson ratio ν and Density ρ . . . . . . . . . . . . . . 504.7 Prior and Posterior estimates of E (Normal Distribution) in GPa . . . . . . . . . . . . . . . 504.8 Values for granite elastic modulus (E) for sonic velocity data (block) generated using Monte
Carlo simulation with uncertainty in Poisson ratio ν and density ρ . . . . . . . . . . . . . . 514.9 Values for granite elastic modulus (E) for ultrasonic velocity data (block) generated using
Monte Carlo simulation with uncertainty in Poisson ratio ν and density ρ . . . . . . . . . . 51
Erasmus Mundus Programme
ADVANCED MASTERS IN STRUCTURAL ANALYSIS OF MONUMENTS AND HISTORICAL CONSTRUCTIONS xix

A Bayesian approach to NDT Data Fusion for St. Torcato Church Mayank MISHRA
4.10 Prior and Posterior estimates of E (Normal Distribution) in GPa considering sonic andultrasonic data . . . . . . . . . . . . . . . . . . . . . . . . . . . . . . . . . . . . . . . . . . . 51
5.1 Sample question of the form . . . . . . . . . . . . . . . . . . . . . . . . . . . . . . . . . . . 575.2 Sample question of the form [40] . . . . . . . . . . . . . . . . . . . . . . . . . . . . . . . . 575.3 All acceptable responses for survey: Part 1 . . . . . . . . . . . . . . . . . . . . . . . . . . . 595.4 All acceptable responses for survey . . . . . . . . . . . . . . . . . . . . . . . . . . . . . . . 615.5 Proposed Trust Factor for NDT tests used to find Compressive strength ( fc) . . . . . . . . 645.6 Proposed Trust Factor for NDT tests used to find Compressive strength ( fc) without Schmidt
Hammer test . . . . . . . . . . . . . . . . . . . . . . . . . . . . . . . . . . . . . . . . . . . . 645.7 Prior and Posterior estimates of compressive strength fc in MPa using Conjugate prior and
including trust factors . . . . . . . . . . . . . . . . . . . . . . . . . . . . . . . . . . . . . . . 645.8 Proposed Trust Factors for NDT tests used to find Elastic Modulus (E) . . . . . . . . . . . . 655.9 Prior and Posterior estimates of E (Normal Distribution) in GPa considering sonic and
ultrasonic data including trust factors . . . . . . . . . . . . . . . . . . . . . . . . . . . . . . 65
E.1 Posterior estimates of E (normal distribution) in GPa . . . . . . . . . . . . . . . . . . . . . 98
xx
Erasmus Mundus Programme
ADVANCED MASTERS IN STRUCTURAL ANALYSIS OF MONUMENTS AND HISTORICAL CONSTRUCTIONS

A Bayesian approach to NDT Data Fusion for St. Torcato Church Mayank MISHRA
1INTRODUCTION
1.1 General considerations
In many cases it is not possible to carry on destructive tests on historical constructions and one has to relyon data got from non-destructive tests and convert them into meaningful information. Data sources mightalso vary from qualitative to quantitative, so it becomes difficult for practitioner to arrive at some reasonablevalue of parameter due to so many complexities in data. This thesis takes Saint Torcato church (Figure 1.1)which is located in a small village near Guimãraes as a case study to fuse data using Bayesian inference.
Figure 1.1: San Torcato Church [1]
Several ND tests have already been carried out in the church and a monitoring system has been installedto control the current condition and to assess the success of the future intervention. This thesis aims atanalyzing the recent ND test carried out on Saint Torcato church. The main objective of this thesis is tocombine the information gained from different ND techniques using Bayesian approach to arrive to a morecertain value of parameter for helping the practitioners in their decision making. Instead of choosing somerandom value for the modelling purposes for example for a parameter the model incorporates some criteriato select a more certain value with less uncertainty in it.
1.2 Objectives
The main aim is the development of methodologies for merging the information gained with different NDTmethods, by means of data fusion and sensitivity analysis. As indicated in the literature review, most
Erasmus Mundus Programme
ADVANCED MASTERS IN STRUCTURAL ANALYSIS OF MONUMENTS AND HISTORICAL CONSTRUCTIONS 1

A Bayesian approach to NDT Data Fusion for St. Torcato Church Mayank MISHRA
researchers confirm that the use of single and isolated non-destructive techniques might not be sufficientto reliably detect or confirm a particular feature (object, feature, damage, etc.) with the exception of simplecases, which is not the case of historic masonry constructions. Therefore, it is necessary to apply differenttechniques within the same area or object. Secondly, different techniques use different theories anddifferent results, which imply a large knowledge of all these techniques by the practitioner. Therefore, theobjective of this thesis is to combine data produced by all different techniques, or a suitable combination oftechniques, convert them into a single and uniform format and process them as a whole (or in steps) usingdata fusion methodologies (bayesian approach in this case).
1.3 Chapter-wise breakup
The thesis has been divided into several chapters:
Chapter 1: Introduction and Objectives of the thesis are presented.
Chapter 2: Literature review on different ND testing and monitoring techniques that can be used formonuments and historical constructions mentioning if they are direct/indirect and what parameter theymeasure. Also, how different NDT techniques can be used to correlate with geomechanical parameterslike Elastic modulus (E) and compressive strength ( fc) of granite blocks is studied.
Chapter 3: Bayesian interface to combine data from different tests is presented and explained. Theformulation to model uncertainties on uncertainties is presented along with its modified form including trustfactor.
Chapter 4: Collecting data form different ND testing, monitoring reports of S. Torcato Church related to itsstructural condition and conservation. The Chapter will includes the identification of the level of informationavailable about the construction safety and conservation. Also this chapter proposes a method to combineinformation in different stages of data collection and finally update the posterior to its final form.
Subsequently, the raw data is fused in an attempt to have in a single result the contributions from differenttechniques. The choice of the techniques to fuse will depend on their ability to contribute positively to afeature the other techniques will fail or whose contribution is not relevant, or, on the possibility to confirmwith high reliability a particular feature. The aim of this task is to look for a combination of analytical and insitu techniques capable providing broad information of the structure/construction with reliable confidenceintervals.
Chapter 5: This chapter mentioned the calculation of Trust Factor. Before this proposed factor weightage ofeach NDT test with respect to each other is calculated by using AHP- Analytic Hierarchy Process. Resultsgot from Chapter 5 are again recalculated to include the result of trust factor and see how it affects theresults.
2
Erasmus Mundus Programme
ADVANCED MASTERS IN STRUCTURAL ANALYSIS OF MONUMENTS AND HISTORICAL CONSTRUCTIONS
A Bayesian approach to NDT Data Fusion for St. Torcato Church Mayank MISHRA
A simple Graphical User Interface (GUI) was also presented in Matlab to explain and carry out this fusionprocess of combining data. The data is considered from St. Torcato church used as a case study andfinally the Elastic modulus (E) and compressive strength of granite blocks ( fc) is estimated by this method.
Chapter 6: The previous task will lead to recommendations for designers and practitioners. Results willbe regularly analysed and re-implemented during Chapters 1 to 7 and they will be reported. Also futureresearch work is presented in this chapter which can be done after calculating the parameters compressivestrength ( fc) and elastic modulus of stone (E). A need for use of Trust factor is emphasised in this approachwhich can be used to scale the importance of different tests and carry out the update process.
Erasmus Mundus Programme
ADVANCED MASTERS IN STRUCTURAL ANALYSIS OF MONUMENTS AND HISTORICAL CONSTRUCTIONS 3


A Bayesian approach to NDT Data Fusion for St. Torcato Church Mayank MISHRA
2TESTING AND MONITORING TECHNIQUES FOR MASONRY
CONSTRUCTIONS
The structural monuments and Historical constructions needs to be inspected since they posses risk owingto their old construction for ensuring safety of the people. The testing methods come into two classes-Destructive in which there is some damage in the building tested and Non-destructive testing (NDT) whichas such poses no damage to component being inspected. In this chapter, a list of NDT tests (See figure2.1) will be presented and how they can be correlated to get geomechanical properties of the material.
Different tests formasonry constructions
NDT MDT Destructive tests
Visual inspection
Sonic testing
Ferroscan/Cover meter
Schmidt hammer
Coin tap test
Ultrasonic testing
Acoustic emission
Resistivity measurements
Infrared measurements
Georadar
Conductivity measurements
Flat Jack tests
Endoscopy
Dilatometer techniques
Direct compression test
Figure 2.1: Classification of different tests used in masonry and historical constructions
Erasmus Mundus Programme
ADVANCED MASTERS IN STRUCTURAL ANALYSIS OF MONUMENTS AND HISTORICAL CONSTRUCTIONS 5

A Bayesian approach to NDT Data Fusion for St. Torcato Church Mayank MISHRA
Since in monuments and historic constructions many things needs to be conserved like art work, graffiti andpainting, NDT is a good option as far as inspection is concerned. Many tests are defined for investigatingthe quality of masonry some of which are explained later in this chapter.The most common NDT techniquesfor monuments are used in tandem to provide information about hidden characteristics and state ofdegradation of masonry structures.These tests can be used to evaluate many important information likedetection of voids and discontinuities inside masonry, location of reinforcement, determination of physicalproperties of a material like compressive strength, elastic modulus, width of cracks, corrosion etc. Thedefects mentioned above start with minor flaws at early stage and develop into more severe flaws if notdetected in time and intervened.
These tests can vary from the type of data they provide i.e. qualitative and/or quantitative and often thecombination of these tests is needed to reach a conclusion. For example sonic tests can give qualitativeinformation about a void present inside masonry or the sonic velocities can be correlated to some otherproperty like elastic modulus or compressive strength. For example in case of Schmidt hammer resultsa correlation like is used to convert rebound number into equivalent compressive strength ( fc). This listmentioned in this chapter is not exhaustive but contains most of them which are frequently used in case ofmasonry structures.
2.1 Non-Destructive Techniques (NDT)
2.1.1 Visual Inspection
This is most widely used of all the nondestructive tests for preliminary survey as its simple and easy toapply, quickly carried out with minimal equipments and usually lowest in cost. This is one of the most basicmethods to get a rough idea depending upon what scale we want to look in. For example visual inspectioncan be used to detect wide prominent cracks by naked eye or with help of some supplemental aids likemagnifying glass. Tools like image processing can be used in tandem to improve the quality of visualinspection. Also the images obtained can also be enhanced by using smoothing and filtering facilities.Thetest is very qualitative in nature and doesn’t provide any value to a parameter of interest.
2.1.2 Sonic Testing
The is done by constructing a square grid 80 cm x 80 cm (see Figure 2.3) spacing 20 cm in horizontaldirection and 20 cm in vertical on a masonry wall in both inside and outside faces of the wall. A hammer(Figure 2.2) is used to generate pulse which is received by the receiver at the other end of the wall ofknown thickness. After this test sonic velocity contours (Figure 2.4) and sonic velocity histograms (Figure2.5) are plotted to get an idea of masonry wall characteristics. Sonic testing can be interpreted that if thedistribution of velocities is not homogeneous which is indicative of a masonry with remarkable voids anddefects. Further research needs to be done on correlation like this to get a better understanding of theknowledge of level of the building. This method has been used to evaluate homogeneity of the material,depth of surface cracks, presence of voids and to get an estimate of average compressive strength and
6
Erasmus Mundus Programme
ADVANCED MASTERS IN STRUCTURAL ANALYSIS OF MONUMENTS AND HISTORICAL CONSTRUCTIONS

A Bayesian approach to NDT Data Fusion for St. Torcato Church Mayank MISHRA
elastic modulus of the material. The basis for determining the sonic velocity goes by measuring the timedifference between the signal between the transmitter and receiver. The three set up of the tests can beseen from Figures 2.6, 2.7 and 2.8 depending upon location of transmitter and receiver.
Figure 2.2: Hammer to generate pulse for sonic test[2]
Figure 2.3: Installation of Grid for sonic test [2]
Figure 2.4: Distribution of sonic velocities [2] Figure 2.5: Histogram of velocities [2]
The test can be done in several transmission modes namely direct, indirect and semidirect tests shown inFigure 2.6, 2.7, and 2.8. The test data can be related to compressive strength and elastic modulus to getsome quantitative information about the parameter of interest.
Figure 2.6: Direct Test [3]Figure 2.7: Semi-Direct test [3] Figure 2.8: Indirect Test [3]
Erasmus Mundus Programme
ADVANCED MASTERS IN STRUCTURAL ANALYSIS OF MONUMENTS AND HISTORICAL CONSTRUCTIONS 7

A Bayesian approach to NDT Data Fusion for St. Torcato Church Mayank MISHRA
2.1.3 Cover meter / Ferroscan Tests
The instrument commercially known as cover meter uses electromagnetic methods to determine thelocation and thickness of concrete above the reinforcement bars. The principle is based on the fact thatsteel rods embedded in concrete change electromagnetic field around the coils positioned in iron-coreinducted in covermeter. It is a battery power equipment which determines the position of reinforcement,measures depth of the concrete cover and estimates the diameter of the rebar [4] in a structure in anon-destructive manner (Figure 2.9) . Its principle of operation is based on generation and detection ofelectromagnetic fields by conductive material. The intensity of the field generated depends on the depthand diameter of the rebar. Figure 2.10 demonstrates how the scanner is moved along the grid in horizontaland vertical directions to obtain a scan image (Figure 2.12) which in turn can be viewed in the monitor(Figure 2.11) and then later on computer screen.
Figure 2.9: Hilti Ferroscan PS200 - Scanner [2] Figure 2.10: Testing of wall by ferroscan [2]
Figure 2.11: Display on Ferroscan screen [2]Figure 2.12: Details of imported Ferroscan surveyfile on computer [2]
8
Erasmus Mundus Programme
ADVANCED MASTERS IN STRUCTURAL ANALYSIS OF MONUMENTS AND HISTORICAL CONSTRUCTIONS

A Bayesian approach to NDT Data Fusion for St. Torcato Church Mayank MISHRA
It is a very useful equipment to find out problems when the depth of the concrete cover is inadequate andwhere rebar is corroded. Also when engineering defects are present from the beginning it can be used totest the distance of rebars without use of traditional drilling techniques which are destructive in nature. Thisis a very good test for building inspection and quality control. This scan helps in cases where constructiondrawings get lost or we need to find the reinforcement positions and sizes since load carrying capacitydepends solely on them. There might be some error in cases when concrete is penetrated with salinewater since it may effect the electrical conductivity of concrete.
2.1.4 Schmidt Hammer
Schmidt hammer test shown in Figure 2.13 is a non-destructive test which measures hardness of a material(Rebound value R) which can be correlated to the Compressive strength ( fc) by help of conversion charts .The test is an indirect test since it doesn’t give compressive strength value directly. The rebound reading(10-100) is affected by the orientation of hammer, when used in a vertical position (on the underside ofa suspended slab for example) gravity will increase the rebound distance of the mass and vice versa fora test conducted on a floor slab. The test is more useful when comparison is made between samples.For example in San Torcato church test was performed on granite which came from similar quarry andcompared with original sample to prove that they are similar in characteristics. Attention must be paid toBS 1881 Point 202 [5] which states that the use of universal calibrations, such as those produced by themanufacturers of rebound hammers, can lead to serious errors and should be avoided. The conversioncharts are mostly available for concrete only and for new material they need to be calibrated by doing tests.
Figure 2.13: Scmidt Hammer [6]
2.1.5 Coin tap test
This is a simple variation of impact echo method to detect defect or cavities behind linings of tunnels orareas of rendered wall where rendering has separated from stonework. The procedure is very simplein which the wall is tapped with a lightweight hammer and the ringing or echo change in frequency is
Erasmus Mundus Programme
ADVANCED MASTERS IN STRUCTURAL ANALYSIS OF MONUMENTS AND HISTORICAL CONSTRUCTIONS 9

A Bayesian approach to NDT Data Fusion for St. Torcato Church Mayank MISHRA
observed in the defected area. The method is very effective since human ear is much sensitive to resonantfrequencies. One application of this test was to identify debonding of metal plates [7] glued to underside ofconcrete deck on a bridge in scotland.
Figure 2.14: Sonic resonance method/coin tap test [8]
2.1.6 Ultrasonic Testing
This method uses ultrasonic waves ( f > 20 KHz) for material examination and detection of internal flaws.As shown in Figure 2.15 by measuring the time difference betwenn the two waves the thickness or thelocation of the defect can be easily measured.
do = vt1/2 (2.1)
wheredo= distance of the defect from specimen,v= Speed of ultrasonic wave in the medium,t1= Time measured between the two peaks.
Figure 2.15: a) A Scan plot b) Typical Ultrasonic pulse echo system [9]
10
Erasmus Mundus Programme
ADVANCED MASTERS IN STRUCTURAL ANALYSIS OF MONUMENTS AND HISTORICAL CONSTRUCTIONS

A Bayesian approach to NDT Data Fusion for St. Torcato Church Mayank MISHRA
Also by measuring the velocity it can be correlated to other properties of the material like Elastic modulus(E) etc. The technique can range from pulse echo in which single probe is used to measure and transmitthe signal (pulse echo) and pitch catch in which two transducers are used (through transmission) andboth have their advantages and disadvantages. The velocity results can be related to geomechanicalparameters to obtain some estimate of Elastic modulus. The Figures 2.16, 2.17 and 2.18 show the steps tocarry out a Ultrasonic test on a crack and interpret the result. As seen from Figure 2.18 it can be interpretedthat crack can go up to 40 cm at some location of wall being inspected.
Figure 2.16: Ultrasonic Test setup[10]
Figure 2.17: PerformingUltrasonic Test [10]
Figure 2.18: Ultrasonic Test crackvalues [10]
2.1.7 Acoustic Emission
Acoustic emission works in the principle that when a crack opens, the energy released in form of acousticemission and high frequency stress waves can be recorded and analysed. Its main application comesin the area of crack monitoring and defect localisation [11]. Sources of AE vary from natural events likeearthquakes and rockbursts to the initiation and growth of cracks, slip and dislocation movements, melting,twinning, and phase transformations in metals. It has to be supplemented with techniques like signalprocessing and filtering to obtain good optimum results. The methods finds its applicability in laboratorymuch better than on site monitoring since it can be time consuming. Unfortunately, AE systems can onlyqualitatively gauge extent of damage is contained in a structure. In order to obtain quantitative resultsabout size, depth, and overall acceptability of a part, other NDT methods (often ultrasonic testing) arenecessary. They allow us to estimate the depth of all important cracks observed through crack patternsurvey (See Figure 2.19). However it is difficult to interpret the results of acoustic emission tests with thegeomechanical parameters.
Erasmus Mundus Programme
ADVANCED MASTERS IN STRUCTURAL ANALYSIS OF MONUMENTS AND HISTORICAL CONSTRUCTIONS 11

A Bayesian approach to NDT Data Fusion for St. Torcato Church Mayank MISHRA
Figure 2.19: Acoustic Emission system [12]
2.1.8 Resistivity measurements
This method is a version of electrical resistivity method (See figure 2.20) used to find corrosion rates withina reinforced concrete structure. In this method the electrode is used to map the electrical resistivity throughout the length of the beam. The changes of resistivity can be related to the ability of corrosion currentsto flow though the reinforced concrete beam which can be function of water cement (w/c) ratio, moistureand salt content. Some precautions should be used like the contact must be very good to use this methodwhich can be accomplished by drilling of small holes.
Figure 2.20: Set up for resistivity measurement [13]
2.1.9 Infrared measurements
In Infra-red thermography the heat at any temperature is converted into a thermal image using Infra-redcameras. The buildings with defects (cavities, moisture presence, change of material etc) differ in amounts
12
Erasmus Mundus Programme
ADVANCED MASTERS IN STRUCTURAL ANALYSIS OF MONUMENTS AND HISTORICAL CONSTRUCTIONS

A Bayesian approach to NDT Data Fusion for St. Torcato Church Mayank MISHRA
of infra-red radiation. For example the building free with defects and concrete surface even colour willappear uniform when viewed from infra-red camera. If the concrete surface has cracks then they will heatup faster under solar radiation and hot spots will appear on thermal scan. These areas which appear ashot spots can be examined more closely for further investigation. This methods has gained much popularityin assessment of large buildings with high rise apartment blocks [14] . Figure 2.21 shows the detection ofhidden tie rods using thermovision. The method can be active of passive depending upon if forced heatingis applied to structure or not.
Figure 2.21: Detection of hidden tie rods using thermal vision [10]
2.1.10 Georadar
This is also a NDT method used for masonry and to locate presence of large voids, inclusion of differentmaterials, presence of moisture levels and morphology of the wall section in multiple leaf masonry. Figure2.22 and Figure 2.23 shown below shows the interpretation of radar gram test results on a target wall forone value of depth slice showing presence of a local void due to the energetic reflection.
Figure 2.22: Target wall [10]Figure 2.23: Radargram profile showing severalvoids [10]
Erasmus Mundus Programme
ADVANCED MASTERS IN STRUCTURAL ANALYSIS OF MONUMENTS AND HISTORICAL CONSTRUCTIONS 13

A Bayesian approach to NDT Data Fusion for St. Torcato Church Mayank MISHRA
2.1.11 Conductivity Measurements
As we know electrical conductivity depends on degree of water saturation and their electrical properties.Electromagnetic waves propagated inside structure can give information on materials investigated. Theequipment can be non-contacting but some problems might be caused when reinforcing rods are inside.As ingress of water inside masonry is of great engineering importance it needs to be monitored. Theycan be used to give various measurements like moisture content, salt content and presence of metalreinforcements, pipes, etc in the wall.
Figure 2.24: Detection of hidden tie rods using thermal vision [10]
2.2 Minor-Destructive Testing (MDT)
2.2.1 Single and Double Flat jack tests
Strength of masonry is an important consideration in finding out the condition of the building. In case ofheritage building removing parts of the masonry is unacceptable and requires some tests which do notalter building. Testing of masonry strength by flatjacks is a minor destructive testing (since some portionsof mortar have to be removed for testing) plus instead of loading the whole wall only a small portion of wallis loaded by a small hydraulic jack instead of whole wall. The things that we can measure using flatjackare: (1). compressive strength of masonry if it is allowed to test until masonry fails. (2). Elastic modulus (inlinear part) since the stress (σ ) vs strain relation (ε) is given. and (3). in plane shear strength.
To start the test first a layer of mortar is cut from the masonry wall and then a thin flat jack is inserted intothe mortar layer which has been cut. Since there is some cut so it comes into minor destructive testing.Because of the cut there is stress relaxation since distance will be less than before. The flat jack will slowlytry to increase the pressure so as to restore it into old settings. The extensometer can be used to measuredisplacement after cutting and then during the testing process.
14
Erasmus Mundus Programme
ADVANCED MASTERS IN STRUCTURAL ANALYSIS OF MONUMENTS AND HISTORICAL CONSTRUCTIONS

A Bayesian approach to NDT Data Fusion for St. Torcato Church Mayank MISHRA
(a) Rectangular flat jack (b) Drilling of the mortar joint
Figure 2.25: Procedure flat jack test [10]
The Figure 2.25 shows how a cut is made in brick masonry since its easy to make rectangular cut for thistype (as opposed to irregular stone masonry where it is difficult to find joints). Then after this step a secondcut is made from 40-50 cm from first one and 2nd jack is inserted in that cut. Then since the masonrysample is delimited by these two jacks so it can perform axial compression test on this part of samplesandwiched between two jacks. The LVDTs can give axial and transverse strains attached to this masonrysample. Various loading and unloading cycles have to be performed to give a better idea of elastic modulusand if test allows we can continue it to find ultimate strength of sample until it collapses.
Figure 2.26: a) Double flat jack test on regular stone masonry b) Stress strain curve [10]
Erasmus Mundus Programme
ADVANCED MASTERS IN STRUCTURAL ANALYSIS OF MONUMENTS AND HISTORICAL CONSTRUCTIONS 15

A Bayesian approach to NDT Data Fusion for St. Torcato Church Mayank MISHRA
The state of stress in a flat jack test is given by : [10]
S f = K jKaPf (2.2)
where:S f = calculated stress value,K j = jack calibration constant (≤ 1),Ka = jack/slot area constant (≤ 1),Pf = flat-jack pressure.
Interpretation of Data of Flatjack tests can be in terms of Elastic modulus values. The double flat-jack testallows to measure the modulus of elasticity which can be used to classify different kinds of masonries. Forexample, Levels of masonry according to elasticity modulus are Masonry of rural buildings E < 900 N/mm2,Masonry of Civil buildings 900 N/mm2 < E < 1500 N/mm2, and Masonry of Monumental buildings E > 2000N/mm2 [10].
2.2.2 Dilatometer techniques
In this test shown in Figure 2.27 the perforation is made by the help of drill and then a cylindrical tubeconforming with the dimensions of the specimen is introduced in it so it can expand inside the hole. Aftergetting test data of the curve pressure given by the tube and increase of volume obtained can be used toestimate the module of deformation of the masonry. This is a quantitative test as it gives us directly thevalue of deformability modulus of masonry.
Figure 2.27: Phases of the dilatometer test [15]
2.2.3 Endoscopy
Endoscopy is simply an extension of the essential visual survey (Section 2.1.1) into areas inaccessibleto the naked eye. The equipment ranges from relatively simple borescopes consisting of a light source,a small diameter rigid tube with built-in optics and an eye-piece to complex controllable systems withnumerous specialised attachments. By drilling a hole (normally less than 12 mm) and inserting the tube, it
16
Erasmus Mundus Programme
ADVANCED MASTERS IN STRUCTURAL ANALYSIS OF MONUMENTS AND HISTORICAL CONSTRUCTIONS

A Bayesian approach to NDT Data Fusion for St. Torcato Church Mayank MISHRA
is possible to inspect voids under floors or behind panelling for example. Any hidden problems such asfungal growth can, in theory, be identified. The more sophisticated and expensive equipment is fully flexibleand can be steered by wires built into the casing. Systems are available down to 6 mm diameter, andmore specialised systems down to less than 2 mm. It is possible to attach still or closed-circuit televisioncamera (CCTV) to the eye-piece to record the findings on a videotape (Video boroscopy). The theory isfairly simple, but in practice it can be very difficult to retain a sense of scale of the image observed, andkeep track of the location and orientation of the tip. The focal range, depth of field and strength of light isgreatly reduced in the smaller diameter systems.
Figure 2.28: Execution of endoscopic investigation (left) and it’s endoscopic picture (right) [16]
Endoscopic technique allows one to observe, inspect and document masonry panels in their sectionand generally hidden portions of structures. Endoscopy can be applied for a lot of different uses:documentation of structural elements (walls, floors, vaults) in order to investigate their materials, techniquesand construction phases; analysis of degradation and instability (moisture, cracks); evaluation of effectivenessof intervention in progress. However, endoscopy requires execution of a small hole, it is therefore amicro-invasive test, but sometimes it provides detailed and reliable information difficulty to obtain usingother techniques, especially if non-invasive.
2.3 Destructive tests
2.3.1 Compression tests
This tests are Destructive in nature and requires samples to be take out from core or casted and thentested with Universal Testing Machine (UTM). They are direct tests since they give directly the compressivestrength of the material. These tests can also be used to find Young’s modulus of the material by placingLVDTs at approximately one third and two thirds of the specimen’s height. The Figure 2.29 shows a testperformed on a concrete sample to measure its strength against compression. This test for concrete
Erasmus Mundus Programme
ADVANCED MASTERS IN STRUCTURAL ANALYSIS OF MONUMENTS AND HISTORICAL CONSTRUCTIONS 17

A Bayesian approach to NDT Data Fusion for St. Torcato Church Mayank MISHRA
specimen is most widely used test to measure its compressive strength with concrete specimen rangingfrom cubes & cylinders.
Figure 2.29: Compression testing on a concrete specimen [17]
2.4 Crack Monitoring
2.4.1 Glass Crack Meters
This is a very qualitative way to monitor cracks. It consists of pieces of glass installed (See Figure 2.30)where the crack propagates and if the glass cracks or shows any damage then it means that the crack hasopened.
Figure 2.30: Glass pieces inserted into the wall to monitor cracks [2]
2.4.2 Crack Meters
The displacement transducers (LVDT) are available with different operating ranges and the square ofthe frequency signal is directly proportional to the amount of displacement. These units are used incrackmeters and rod extensometers. The crackmeters allows us to measure displacement of a crack in
18
Erasmus Mundus Programme
ADVANCED MASTERS IN STRUCTURAL ANALYSIS OF MONUMENTS AND HISTORICAL CONSTRUCTIONS

A Bayesian approach to NDT Data Fusion for St. Torcato Church Mayank MISHRA
different axes up-to accuracy of 0.1 to 1.00 mm. These crackmeters (Figure 2.31) are quick and easy toread, adaptable to data loggers or data acquisition system.
Figure 2.31: Different types of Crack Meters a) Manual Crack Meters b) Electronic Crack Meter (LVDT)[18]
2.5 Computers in NDT
Visualisation of NDT data can be very tedious job and time consuming. But with advent of softwares fordata analysis the task is becoming more simpler and less prone to misinterpretation. Many visualisationtools available for different NDT tests: for example Surfer for sonic tests, FerroScan software for Ferroscandata to mention a few. Graphic possibilities of computers enable us to get us a overall view in differentNDT tests. There has been a continuos development in visualisation of NDT techniques and display ofinformation with enhance data analysis tools. Quality images are produced to ease the communicationof data and interpretation with other scientists working in this area. The use of colours have been a veryefficient development for data visualisation and readability of an image. The coloured images (Example seeFigure 2.4) can be seen much easier in identifying stress points, locating extremes and defective regions ofmaterial.
2.6 Discussion of NDT methods used for St Torcato case study
Certainly the advent of computers (See Section 2.5) and data loggers have decreased the time of performingNDT survey but the results must be interpreted with great care. Also there is a urgent need in scientificcommunity to develop some standards for NDT surveys for interpretation of results in relation to structures.One of the challenges can be to combine the results of different NDT techniques with different reliabilitytechniques and fuse them together to obtain value for engineers and scientists for decision making. So, tosummarise a wide range of NDT methods can be used depending on what kind of information is required,on which scale, economy, ease of use etc.However in the case study data from St. Torcato was used tocalculate the parameter of interest (Elastic modulus and compressive strength of granite blocks). There aredifferent possibilities of using NDT/MDT tests according to parameter desired. The list is summarized intable 2.1. In this table many tests correlate with the geomechanical properties of the material and each testcan vary in their complexity to reliability of data one gets from these tests.
Erasmus Mundus Programme
ADVANCED MASTERS IN STRUCTURAL ANALYSIS OF MONUMENTS AND HISTORICAL CONSTRUCTIONS 19

A Bayesian approach to NDT Data Fusion for St. Torcato Church Mayank MISHRA
Table 2.1: Different possibilities to use NDT or MDT according to parameter of interest
Correlation with Geomechanical parameters
Parameter List of methods Application Direct measurement
Elastic Modulus (E)
Sonic velocity In-situ NoUltrasonic testing In-situ NoSchmidt Hammer In-situ NoDilatometer In-situ YesFlat jack test In-situ YesDirect compression test Lab Yes
Compressive strength ( fc)Schmidt hammer In-situ NoFlat jack test In-situ YesDirect compression test Lab Yes
Diameter of rebar (d)Cover meter In-situ YesThermography In-situ No
Concrete cover (cc) Cover meter In-situ YesState of stress of masonry(σ ,ε) Flat jack test In-situ YesCrack depths (d) Ultrasonic testing In-situ Yes
Width of crack (w mm)Glass crack meters In-situ NoDisplacement transducers In-situ Yes
In most of cases the data with low reliability will show a large standard deviation than with data whichhas more reliability. Series of data coming at different times from St. Torcato church was used in to get areliable estimate of the parameter. For this thesis we have only used literature knowledge, schmidt hammerwith direct compression test to evaluate the compressive strength ( fc) of the granite block. And for secondparameter literature knowledge, sonic, ultrasonic tests and direct compression tests were used to calculatethe value of elastic modulus (E) for the granite block. Summarised Table 2.2 discusses the advantages anddisadvantages of NDT methods and how we can use these methods to calculate the desired parameter.
2.7 Conclusions
The ND tests and the laboratory tests should be used in sequence to characterize the masonry typologyand mechanical behaviour of masonry material. In some cases in monuments when its not possible toremove material so the parameters have to be deduced by carrying only NDT tests and the data comingfrom these tests needs to be combined in a logical way to arise to a conclusion. In some cases whenno direct relation is available to characterize masonry then some range can be used on previous studiescarried out on other masonry samples. Also some minimum number of tests should be carried out toget data with some reliability keeping in mind the budget allocated to the testing scheme. Still a greatdeal of research is necessary for the interpretation of the NDT results and for their correlation to masonrycharacteristics.
20
Erasmus Mundus Programme
ADVANCED MASTERS IN STRUCTURAL ANALYSIS OF MONUMENTS AND HISTORICAL CONSTRUCTIONS

A Bayesian approach to NDT Data Fusion for St. Torcato Church Mayank MISHRA
Table 2.2: Summary of NDT Methods adapted from [19]
Inspectionmethod
Parameter measured Advantage Disadvantage Cost
Visual Surface condition Quick; modest skillsrequired
Superficial Low
Sonics Wave velocity;tomographiccross-sections
Moderately slow;gives usefulinformation on majorelements
Requires skill tointerpret data
ModerateHigh
Cover meter Concrete cover anddiameter of rebars
Relatively quick Error when concrete ispenetrated with salinewater
ModerateHigh
Schmidthammer
Rebound number Simple to use,equipmentinexpensive andreadily available
No direct relationship tostrength or deformationproperties
Low
Coin tap test Change in frequency Procedure to performtest very simple
Superficial Low
Ultrasonics Wave velocity, locationof defect
High penetratingpower,Greateraccuracy, portableequipment
technical knowledgeis required for thedevelopment ofinspection procedures,Couplants needed
ModerateHigh
Acousticemission
Energy released inform of stress waves
High sensitivity,localisation of failurezone by time of arrivalmeasurement
Only estimatequalitatively howmuch damage is in thematerial
High
Resistivity Changes in resistivity Shallow investigationsare rapid
Deep investigationsrequire long cablesand much time, datainterpretation difficult
Moderate
Infraredmeasurement
Amounts of infraredradiation
Visual image easyto interpret, locatedhidden tie bars
Qualitative image,not much informationgained about otherthings
High
Radar Electromagnetic wavevelocity
Quick; can give goodpenetration; can givegood image of internalstructure
Poor penetrationthrough clay infill andsalt contaminatedfill; requires skill tounderstand data
Moderatelyhigh
Conductivity Relative conductivity Quick; gives relativeconductivities overa large area to amaximum depth of 1.5m
Limited depthpenetration of 1.5m; complements radar
Low
Dilatometer Modulus ofdeformation ofmasonry
Quantitative test,gives direct estimateof parameter
Requires skill tointerpret data
Moderate
Erasmus Mundus Programme
ADVANCED MASTERS IN STRUCTURAL ANALYSIS OF MONUMENTS AND HISTORICAL CONSTRUCTIONS 21

A Bayesian approach to NDT Data Fusion for St. Torcato Church Mayank MISHRA
3DATA COLLECTION, DATA FUSION AND INTRODUCTION OF
BAYESIAN STATISTICS
The objective of this chapter is to explain how Bayesian approach can be applied to combine data fromdifferent ND tests. St Torcato church was used as a case study to see how the bayesian model can beadapted to different data sets. Mainly in this study two granite stone blocks were studied and different testswere performed on it to get an estimate of geomechanical parameters of granite used in the church. Manyminor details like the places where data was collected is not mentioned since this thesis emphasises moreon data values then on locations where data was fetched.
3.1 Data Collection for S. Torcato church
Data collection was done by reading and going through several testing reports of San Torcato church[20], and also though several excel data sheets. Two types of data were collected in this case : onewas experimental data (Direct and Indirect) obtained from testing and another type was monitoring dataobtained from continuous monitoring of San Torcato church. But only the experimental data was used inthis thesis and the monitoring data count not be used. In data collection, two blocks were taken from thesite to the lab and tested. We had the information that the blocks came from the same quarry, but theyuses two quarries to build the church. So, there is an uncertainty related with this aspect.
3.1.1 Schmidt Hammer Tests
The data from blocks was obtained to make sure that the granite has come from same quarry. Howeverschmidt hammer provides surface hardness it is poorly be related to Elastic modulus of the stone block. Itcan be related to compressive strength of granite but the value obtained were so close and needs someempirical relationship as suggested by Ang [21] to be used as a prior for combining it with initial level ofKnowledge. The relationships developed to relate compressive strength of granite with schmidt hardnessvalue in paper of Graca Vasconcelos fc = 12.24N−739.94 [22] were not suited for this data because of lowerrange as can be seen by comparison of Figure 3.1 and Table 3.1. Further information about conductingthis test can be found in Chapter 2, Section 2.1.4. The average value of the rebound number for in-situtests is 63.0 with a standard deviation of 2.8 and a coefficient of variation of 4.4. The value obtained by thiscorrelation was around 31.2 MPa and was discarded as its too low for granite compressive strength.
Erasmus Mundus Programme
ADVANCED MASTERS IN STRUCTURAL ANALYSIS OF MONUMENTS AND HISTORICAL CONSTRUCTIONS 23

A Bayesian approach to NDT Data Fusion for St. Torcato Church Mayank MISHRA
Figure 3.1: Figure showing correlation of SchimdtHammer rebound number and compressive strengthof granite [22]
Stone No Rebound No.Stone no 1. 62.6Stone no 2. 62.5Stone no 3. 63.3Stone no 4. 63.7
Table 3.1: Table showing Schmidt hammer testresults for San Torcato Church [20]
3.1.2 Granite Sonic Tests
The sonic tests were done on 5 points on northwest wall of west tower and the same comparison wasmade with the granite blocks. Some values shown in table 3.5 are a bit low which shows discontinuity inrubble masonry with voids. The same sample taken from the quarry was used to perform three types oftests: direct, semi-direct and indirect. The velocity can be used as a indicative to get an idea about thevoids present inside the wall. The table 3.2 gives an idea about what test was performed on granite blocksand what was done on masonry wall. For carrying out the data fusion process, results of direct sonic testsof granite stone blocks from Table 3.3 and 3.4 were taken into account since they show less coefficient ofvariation than the other indirect and semi-direct tests. The velocities obtained from Table 3.8 and 3.9 werelower since there were difficulties in distinguishing P-wave from R-wave. The table 3.2 shows which testswere available for sonic tests for blocks and in-situ for comparison in both cases. However only direct testdata was used in the model. Other data from the table can also be used with some additional uncertainty.
Table 3.2: Granite sonic test results (Block and in-situ) [20]
Results from sonic testingSerial number Test Type Lab In-situ
1 Direct sonic 3 3
2 Semi-direct sonic 3 7
3 Indirect sonic 3 7
24
Erasmus Mundus Programme
ADVANCED MASTERS IN STRUCTURAL ANALYSIS OF MONUMENTS AND HISTORICAL CONSTRUCTIONS

A Bayesian approach to NDT Data Fusion for St. Torcato Church Mayank MISHRA
Table 3.3: Granite Stone Block 1 Direct sonictest results [20]
Results from sonic testing Stone Block 1Surfaces velocity [m/s] COV
A-C 4751 15.3D-E 5332 16.7ALL 4945 15.8
Table 3.4: Granite Stone Block 2 Direct sonictest results [20]
Results from sonic testing Stone Block 2Surfaces velocity [m/s] COV
A-C 4542 16.1D-E 4508 18.6ALL 4530 17.0
Table 3.5: Torcato church granite Direct sonic test results In-situ [20]
Results from sonic testing S.Torcato In-situ DirectS.No Location Avg. Velocity [m/s] COV
1 P1 2073 1.842 P2 4220 4.543 P3 3244 2.394 P4 3821 3.385 P5 3322 2.39
Mean 3336 2.91
Table 3.6: Granite Stone Block 1 Semi-Directsonic test results [20]
Results from sonic testing Stone Block 1Surfaces Distance b/w
points (m)velocity[m/s]
COV
B2-C2 0.14 3737 57.7B2-C4 0.22 4523 37.8B4-C2 0.22 6016 33.9B4-C4 0.28 4589 21.8ALL 4716 20.1
Table 3.7: Granite Stone Block 2 Semi-Directsonic test results [20]
Results from sonic testing Stone Block 2Surfaces Distance b/w
points (m)velocity[m/s]
COV
B5-B1 0.14 5875 28.3B5-B2 0.22 4779 16.9B5-B3 0.22 3872 39.5B4-B3 0.283 4854 38.1ALL 4845 30.7
Table 3.8: Granite Stone Block 1 Indirect sonictest results [20]
Results from sonic testing Stone Block 1Surfaces Distance
b/w points(m)
velocity[m/s]
COV
B6-B1 0.25 2714 29.5B6-B2 0.20 4133 42.8B5-B2 0.15 4279 48.7B5-B3 0.10 3083 46.2ALL 3552 21.7
Table 3.9: Granite Stone Block 2 Indirect sonictest results [20]
Results from sonic testing Stone Block 2Surfaces Distance
b/w points(m)
velocity[m/s]
COV
B5-B1 0.20 3116 26.9B5-B2 0.15 2066 15.2B5-B3 0.10 3167 50.8B4-B3 0.05 4500 24.8ALL 3212 31.1
Erasmus Mundus Programme
ADVANCED MASTERS IN STRUCTURAL ANALYSIS OF MONUMENTS AND HISTORICAL CONSTRUCTIONS 25

A Bayesian approach to NDT Data Fusion for St. Torcato Church Mayank MISHRA
3.1.3 Granite Ultrasonic tests
The same kind of tests which were performed on sonic were repeated for ultrasonic range details of whichare explained in Report no 6 [20]. Also these tests were not good since the analysis of signal was doneinternally making it impossible to know which wave form was used in determining the results. The table3.10 shows which tests were available ultrasonic for blocks and in-situ for comparison in both cases.
Table 3.10: Granite Ultrasonic test results (Block and in-situ) [20]
Results from Ultrasonic testsSerial number Test Type Lab In-situ
1 Direct Ultrasonic 3 7
2 Semi-direct Ultrasonic 3 3
3 Indirect Ultrasonic 3 7
Table 3.11: Granite Stone Block 1 DirectUltrasonic test results [20]
Results from Ultrasonic testing Stone Block 1Surfaces velocity [m/s]A-C 3836D-E 3885ALL 3852
Table 3.12: Granite Stone Block 2 DirectUltrasonic test results [20]
Results from Ultrasonic testing Stone Block 2Surfaces velocity [m/s]A-C 3694D-E 3849ALL 3750
Table 3.13: Granite Stone Blocks Semi-DirectUltrasonic test results [20]
Semi-Direct Ultrasonic testing Stone BlocksSurfaces velocity [m/s] COVB2-C2 3720 4.3B2-C4 3589 4.0B4-C2 3862 0.7B4-C4 3742 2.2ALL 3728 3.6
Table 3.14: Granite Stone S. TorcatoSemi-Direct Ultrasonic test [20]
Ultrasonic testing Insitu San TorcatoSurfaces velocity [m/s] COV
A2-B2 4729 5.6A2-B4 4422 10.1A4-B2 4671 9.8A4-B4 4438 11.7ALL 4565 8.7
The other test data with high coefficient of variation (COV) was discarded due to more variability and lessreliability. The same argument can be used as the tests can also be incorporated with additional uncertaintymaking the model more complex.
26
Erasmus Mundus Programme
ADVANCED MASTERS IN STRUCTURAL ANALYSIS OF MONUMENTS AND HISTORICAL CONSTRUCTIONS

A Bayesian approach to NDT Data Fusion for St. Torcato Church Mayank MISHRA
Table 3.15: Granite Stone Block 1 InDirectUltrasonic test results [20]
Results from Ultrasonic testing Stone Block 2Surfaces Distance b/w
points (m)velocity[m/s]
C1-C2 0.05 4630C1-C3 0.10 3922C1-C4 0.15 2650C1-C5 0.20 2747C1-C6 0.25 2283C1-C7 0.30 2627C1-C8 0.35 2513ALL 3053
Table 3.16: Granite Stone Block 2 InDirectUltrasonic test results [20]
Results from Ultrasonic testing Stone Block 1Surfaces Distance
b/w points(m)
velocity[m/s]
C1-C2 0.05 4630C1-C3 0.10 3257C1-C4 0.15 3119C1-C5 0.20 3106C1-C6 0.25 3153C1-C7 0.30 2290ALL 3259
3.1.4 Granite cylinder compression tests
Since in Section 3.1.1 it was presented that granite blocks from same quarry have similar hardness values.It is reasonable to assume that the compression tests and young’s modulus values on cylinders should bealmost similar [20]. The six cores were drilled from Stone block 2 with a diameter of 75 mm and a heightequal to 155 mm. Also 3 LVDT’s were placed at approximately one third of specimen height to measurethe Elastic Modulus. This test is a direct test to measure the compressive strength and elastic modulus.
Figure 3.2: Figure showing different stages of Compression test on a granite cylinder a)Stone 2 b)Drillingof sample c) Setup to measure elastic modulus d)Failure during compression test [20]
Erasmus Mundus Programme
ADVANCED MASTERS IN STRUCTURAL ANALYSIS OF MONUMENTS AND HISTORICAL CONSTRUCTIONS 27

A Bayesian approach to NDT Data Fusion for St. Torcato Church Mayank MISHRA
Table 3.17: Granite compression test results [20]
Results from core testingCore number Compressive
strengthYoung’s Modulus 2nd
Cycle (GPa)Young’s Modulus 3rd
Cycle (GPa)1 79.6 – –2 87.2 31.4 32.53 85.2 29.8 33.34 66.9 32.1 33.25 77.8 32.8 33.36 73.8 31.4 33.3
Average 78.4 31.5 33.1Std Deviation 7.5 1.1 0.3
COV% 9.5 3.5 1.1
3.2 Data Fusion
3.2.1 Definition and General overview
Data fusion (data integration) sometimes known as information fusion is the process to combine differentsources and different points in time into a representation that provides effective support for human orautomated decision making. Moving from Biology to technology the most simple example of data fusionsystem can be given by the human brain (Figure 3.3). It integrates information from different senses(sensors) for e.g. eyes, ear, nose etc to arrive to a conclusion. For example while watching television soundof a voice combined with visual information helps in identifying a person. For sensor level data fusion anytype of sensor data can be fused with the condition they should represent the same measurement and ifnot then it has to be processed to obtain an identical format. Most of the data fusion is done to integrateinformation from multiple sensors. Chair and Varshney [23] produced an optimised data fusion algorithm toweight each signal coming from sensors according to their reliability. Same kind of technique is applied inthis report in which different NDT tests are weighed according to survey from experts and then fused usingBayesian methodology.
Figure 3.3: Illustration of human data fusion system [24]
28
Erasmus Mundus Programme
ADVANCED MASTERS IN STRUCTURAL ANALYSIS OF MONUMENTS AND HISTORICAL CONSTRUCTIONS

A Bayesian approach to NDT Data Fusion for St. Torcato Church Mayank MISHRA
The information coming from different sources can be conflicting, incomplete or vague and needs tobe combined from different sources to help practitioners in decision making. Data fusion is defined assynergistic use of information coming from different sources to understand the phenomenon [24]. TheFlowchart shown in Figure 3.4 shows the concept of data fusion when the information is combined usingBayesian techniques to reach to a higher confidence level. The whole methodology behind Data Fusionprocess is to combine information from Literature and multiple NDT tests of different reliability levels to geta more accurate picture and assessment of parameters of interest than possible with a single NDT method.A Bayesian approach is used to combine data from different indirect and direct tests for San Torcato in thiscase study. The role of data fusion is its use to manage uncertainty and improve accuracy and providea rational and mathematically valid approach to fuse the data from different test to help in the decisionmaking process of selecting proper parameters. There is some difference between data fusion and dataintegration which is used to describe the combining of data, whereas data fusion is integration followed byreduction or replacement. Data integration might be viewed as set combination wherein the larger set isretained, whereas fusion is a set reduction technique with improved confidence.
Data Source 1
Data Source 2
Data Source 3
Bayesian FUSED DATAData Sources
∫∫∫
Figure 3.4: Illustration of Data Fusion system combining diverse data sets into a unified (fused) data set
The different NDT techniques used for monuments were described in Chapter 2 with their advantages anddisadvantages. In addition the efficiency of different models to incorporate data is also presented in thisthesis. In brief different NDT techniques were studied with different probability approaches to NDT datafusion and their efficiency in combining information was assessed using different statistical models. Themain role of Data fusion through several publications is its ability to manage uncertainties and improve theaccuracy of the system. In this study for fusion center we can get, for e.g.. information from sonic tests thatcan be supplemented from core testing data to obtain the missing information.Data fusion in the field of NDT is still a new concept and it still needs to be understood and practisedby engineers. Some research papers using NDT data fusion using Bayesian techniques related togeomechanical parameters include:
1. Assessment of bridges using Bayesian updating in which yield strength of reinforcement bars andconcrete cover was updated using NDT tests [25].
2. Bayesian assessment of the characteristic concrete compressive strength using combined vagueinformative piers for updating strength distribution of concrete [26].
3. Bayesian methodology for updating geomechanical parameters and uncertainty quantification [27]
Erasmus Mundus Programme
ADVANCED MASTERS IN STRUCTURAL ANALYSIS OF MONUMENTS AND HISTORICAL CONSTRUCTIONS 29
A Bayesian approach to NDT Data Fusion for St. Torcato Church Mayank MISHRA
One of the most important examples of data fusion is to combine information coming from different NDTsensors and improve the performance of inspection. The data fusion technologies are used in many fieldslike target tracking, robotics, traffic control, image processing depending upon the popularity.
Bayes theorem is basically a plan of changing beliefs in face of evidence (NDT data in our case). The morethe evidence is related to beliefs, the stronger the hypothesis becomes after each Bayesian updating. Inthis thesis we have calculated Elastic modulus of granite (E) and compressive strength ( fc) as more andmore test data become available and starting with only vague knowledge about the parameter and thenarriving to the posterior as our evidence correlates to our beliefs.
3.2.2 Levels of Data fusion
Data fusion can occur basically at three levels
1. First Level:Raw data: This involves fusion of Raw data. Most of the applications of Multi-sensordata fusion are focused on this area.
2. Second Level:Decision: Fusion at Decision level. In this format data may be different but needs tobe converted to the format desired as it has to be in identical format to qualify for fusion.
3. Third Level:Fusion: This is the last level in which the data has to be fed in Data fusion center andprocessed by a mathematical algorithm to produce a coherent global result.
We have addressed levels 2 and 3 in this thesis. There are many methodologies of data fusion but wehave focussed only on Bayesian approach in this case.
3.2.3 Different techniques of data fusion
3.2.3.1 Probabilistic Fusion
Probabilistic methods rely on the probabilistic distribution functions (PDF) to express data uncertainty. Themost commonly used is Bayesian Fusion which fuses pieces of data from various sources. One can applyBayes estimator each time and update the PDF by fusing it with new information. The data fusion algorithmimplemented in this case took the form of probabilistic inference processes such as the Bayesian inferencetheory.
3.2.3.2 Data fusion using Artificial Intelligence (AI)
In these systems data association takes the place by emulating the decision making ability of humanbrain. The efficiency of these systems depend on amount of knowledge and training they undergo beforeusing them for new data. One of the most common used (AI) systems are artificial neural networks. Theycome with processing units or nodes and are trained in order to solve problems. The training is doneby the help of historical data and known outcomes and then they can be tested. The weight of eachnode (See Equation 3.1) is adjusted after each trained data set by some algorithm specified to the neuralnetwork system. They find their applicability in areas where its difficult to specify a algorithm and come
30
Erasmus Mundus Programme
ADVANCED MASTERS IN STRUCTURAL ANALYSIS OF MONUMENTS AND HISTORICAL CONSTRUCTIONS

A Bayesian approach to NDT Data Fusion for St. Torcato Church Mayank MISHRA
with processing units known as neurons (Figure 3.5). Each node can act as an unit to process the inputdata and an output signal expressed as:
y = f (∑wixi) (3.1)
where y is the output associated to input node i, wi is the weight associated to the input node and xi is theinput at node i. Detailed information has not been discussed since it is beyond scope of this thesis.
DATA #1
DATA #2
DATA #3
DATA #4
FUSED DATA
Hiddenlayer
Inputlayer
Outputlayer
Figure 3.5: Figure Illustrating a two layer Perceptron neural network
3.2.4 Performed Data fusion using S. Torcato as case study
After collecting data from S Torcato church, it was analysed and used for the fusion process. The testswere of two types: Direct and Indirect tests. The metho dology to combine data from these two differenttypes of sources is presented in section 3.2.4.1 and explained with the help of flowchart in Figure 3.6.However acoustic emission data could not be incorporated in this approach since no correlation was foundto relate it with desired parameters of interest. However, the data fusion was done stepwise i.e dealing withtwo data sources at a time and then combining them into a single data source. The single data source wasthen combined with the next data to get another single data in an uniform format. Most trustworthy data i.edata from direct test was combined in last steps of data fusion process.
Erasmus Mundus Programme
ADVANCED MASTERS IN STRUCTURAL ANALYSIS OF MONUMENTS AND HISTORICAL CONSTRUCTIONS 31

A Bayesian approach to NDT Data Fusion for St. Torcato Church Mayank MISHRA
Directsonic test
Indirectsonic test
Semi-directsonic test
DirectUltrasonic
test
IndirectUltrasonic
test
Semi-directUltrasonic
test
Sonictest data
Ultrasonictest data
Compressivestrengthtest data
LiteratureKnowledge
DATAFUSIONCENTER
Bayesian
FUSED DATA∫∑
Figure 3.6: Illustration of Data Fusion system using Bayesian approach for San Torcato Church
3.2.4.1 Data Fusion from Direct and Indirect data sources
For using the Bayes theorem to update the prior to posterior it is mandatory to have the new data inthe same format as prior distribution. So the indirect data has to be converted into equivalent E datato use Bayes theorem. The first thing suggested is that the data type should be same i.e if the datafrom source is telling some other parameter must be converted into equivalent data [21] by developingsome regression relationship or by using some empirical formulas with some uncertainty. The three stepprocedure described by Tang is shown by the help of flowchart in Figure 3.7. Tang [28] suggested a threestep procedure. The initial prior is obtained by combining the indirect test data with prior pdf to obtainthe posterior PDF. The posterior PDF is considered as a prior for the second set of data and an anotherupdated posterior is obtained. This posterior got from two indirect test data is considered as prior when wecombine this with the direct test data to obtain the final Posterior distribution taken into account all typesand sets of data.So to illustrate this first, lets say for example data from Ultrasonic tests i.e velocity was converted intodynamic elastic modulus (based on vibration and wave propagation) Ed values by using Equation 3.2
Ed = v2p(1+ν)(1−2ν)
(1−ν)ρ (3.2)
32
Erasmus Mundus Programme
ADVANCED MASTERS IN STRUCTURAL ANALYSIS OF MONUMENTS AND HISTORICAL CONSTRUCTIONS

A Bayesian approach to NDT Data Fusion for St. Torcato Church Mayank MISHRA
where ν= Poisson ratio of material, ρ= density of the material and vp= P-wave velocity. Since in this caseE = f (v,ν ,ρ) and all the input parameters are associated with some uncertainty, the values of E weregenerated using Monte Carlo simulations and the mean and variance from the generated values wasfound and assigned suitable reliability values depending upon the type of data in the fusion system. TheTable 3.18 shows the range of uncertainty parameters on the three input parameters depending upon thecharacteristic of granite.
Table 3.18: Range of parameter values for granite [Engineering Toolbox]
Parameter Rangevultrasonic(m/s) (Stone Block) 3694–3885vsonic (m/s)(Stone Block) 4508–5332ν 0.2–0.3ρ (kg/m3) 2600–2800
As we obtain the range of values of Elastic modulus for rock E to be 20-50 Gpa can be used as a prior forcombining it with indirect data source1.
PriorInformation
Indirectdata
Source 1
∑
Posterior
Indirectdata
Source 2
∑
Posterior
Directdata
Source
∑
FUSED DATA.
∫∫
∫
∫
∫
∫P(θ |x)
Figure 3.7: Illustration of Data Fusion system using Bayesian approach in case of indirect and directsources of data [28]
Flowchart shown in Figure 3.7 represents the different stages of data fusion process. At stage 1 wecombine the information from literature which was subjective in nature with indirect source of data to arriveto a posterior. This posterior 1 acts as a prior for the second stage of fusion process and is combinedwith indirect data source 2 to get posterior. Again the posterior acts as a prior and is combined with directsource of data to arrive to a final posterior distribution of interest. The number to fusion processes canbe limited by the amount of data sources and also if one wants to use initial knowledge present in theliterature into the model of data fusion using Bayesian methodology. Bayesian statistics combines priorknowledge with observed data. This can be done by updating previous knowledge that is prior with newknowledge gathered over time and obtaining the posterior. The Bayesian approach enables us to updateour beliefs as probabilities in this case as new data is available and arrive to more accurate estimations ofthe parameters under study. The main objectives of this thesis are:
• To explain how Bayesian analysis can be used to combine data to arrive from prior to posterior.
• To present different data fusion methodologies used on San torcato church.
• To study and compare how different models can arrive to various intervals of parameters under study.
Erasmus Mundus Programme
ADVANCED MASTERS IN STRUCTURAL ANALYSIS OF MONUMENTS AND HISTORICAL CONSTRUCTIONS 33

A Bayesian approach to NDT Data Fusion for St. Torcato Church Mayank MISHRA
The Framework presented and formulated is applied to two cases in San Torcato church one is the updateof the Elastic Modulus (E) of the granite blocks and another one is the update of Compressive strength ( fc)of the same blocks.
3.3 Introduction to Bayesian Statistical theory
For two events shown in Figure 3.8 and using the Venn diagram the intersection region in white colour isthe conditional probability P(A|B) of event A given B and is defined as
P(A|B) = P(A∩B)P(B)
(3.3)
A B
Figure 3.8: Ven Diagram representing the Probability of two events
Since all events are mutually exclusive B j, Bayes rule is given by:
P(Bi|A) =P(Bi)P(A|Bi)
∑nj=1 P(B j)P(A∩B j)
(3.4)
where:P(Bi|A): Posterior probability of Bi;P(A|Bi): The conditional term is the likelihood;P(Bi): Prior probability of event Bi.
The Bayesian updating is done by use of relationships 3.3 and 3.4 [29]. The basic Bayesian interface can besummarised as it starts with a prior probability which is updated to a posterior probability as new informationis conveyed to the system. All the A events associate conditional probability based only on new data. Inmonitoring the data is continuously measured and sometimes the strength and deformability parametersalso experience some change in value due to several factors like aging of structure, atmospheric conditions,decay, etc. The Flowchart of Figure 3.10 represents the general decision engineering cycle [30] whichcan be adapted to our case of updating parameters of San Torcato church. It starts from determiningthe parameters under some uncertainty and included in engineering models. Then as more and moredata is gathered related to the parameters they are updated with less uncertainty and used in engineeringcalculations. The process is complex since different types of data are available from different tests like
34
Erasmus Mundus Programme
ADVANCED MASTERS IN STRUCTURAL ANALYSIS OF MONUMENTS AND HISTORICAL CONSTRUCTIONS

A Bayesian approach to NDT Data Fusion for St. Torcato Church Mayank MISHRA
Schmidt hammer, sonic, ultrasonic and compressive strength data. Also data present is of different reliabilitylevels and even the parameter of interest is not measured directly in some cases. The Bayesian approachto deal with this data makes the process easier and more rational as data is coming from different sourcesand different stages of the project ([31], [27]).
Bayesian methods deal with uncertainties into a mathematical form by using probability functions for therandom variables and these functions are updated as more and more information is available. The wholeprocess is composed of 3 steps [32] : (1) Setting up of a joint probability distribution function; (2) update theknowledge as more data is obtained to compute the posterior; (3) Evaluate the model to see if conclusionsfrom it make sense and analysing how results change considering several modelling assumptions.
The flowchart shown in Figure 3.9 explains the overall updating process which takes place. First the prioris chosen with the help of some professional judgement or test results from previous knowledge includingsome uncertainties (rather than randomness). As the data is gathered concerning the parameters it isupdated to a posterior. The main key for this whole process is to the prior as the new evidence is presented.Choice of prior can vary from very accurate prior with less standard deviation to even no knowledge whichis Jeffrey’s prior presented here. It is reasonable to assume prior as a normal distribution (for mathematicalconsiderations) for modelling of many mechanical parameters [33] . When the posterior (p(θ |x)) andthe prior (p(θ )) has the same parametric form is called conjugacy. For example, the Gaussian family isconjugate to itself (or self-conjugate) with respect to a Gaussian likelihood function: if the likelihood functionis Gaussian, choosing a Gaussian prior over the mean will ensure that the posterior distribution is alsoGaussian. A conjugate prior is an algebraic convenience, giving a closed-form expression for the posterior:otherwise a difficult numerical integration may be necessary. All members of the exponential family haveconjugate priors.
3.3.1 Bayesian inference
The whole process allows to arrive from prior distribution p(θ) to a posterior distribution p(θ |x) using thelikelihood of data. Since we arrive at the posterior by integrating more knowledge we expect it to beless variable than the former (however some exceptions can occur arise which are explained later forcompressive strength data). The Bayesian inference in this case used two types of priors : Jeffreys andconjugate prior to arrive to a posterior distribution. The parameters of interest are considered randomvariable with variable moments which means that mean (µ) and variance (σ2) are random variable followingsome distribution (Refer Equations 3.13 and 3.14). In this report, both mean (µ) and variance (σ2) of Eare considered to be random variables and are updated as new data is obtained. The concept of variablemoments rather than fixed ones intends to incorporate several levels of uncertainty in the model. In otherwords, it tends to integrate the innovative concept of uncertainty on uncertainty. Both the formulations arepresented in this Chapter. The figure 3.9 shows the general updating scheme which can also be adaptedfrom data from S. torcato church.
Erasmus Mundus Programme
ADVANCED MASTERS IN STRUCTURAL ANALYSIS OF MONUMENTS AND HISTORICAL CONSTRUCTIONS 35

A Bayesian approach to NDT Data Fusion for St. Torcato Church Mayank MISHRA
Previousresults
JudgementEmpirical
Knowledge
PriorTheory
Updating
Posterior
New Data
Figure 3.9: Scheme of the updatingprocess [34]
CollectInformation
Deterministic(Model)Phase
Probabilistic(Model Phase)
- Expressprobabilitiesand createprobabilistic
models-Sensitivity
analysis-EliminateVariables
Updating
Decision
Information(Model) Phase
-Createinformation
models-Expected values
of information-Probabilistic
sensitivityanalysis
Figure 3.10: The decision cycle [30]
3.3.2 Bayesian inference using Jeffreys prior
In this case it will be assumed that mean and variance are independent of each other and assume a vagueprior distributions for these two parameters. For the normal model they are given below:
p(µ) ∝ c, −∞ < µ < ∞ (3.5)
p(σ) ∝1
σ2 , σ2 > 0 (3.6)
This is our equivalent Jeffreys prior for (µ,σ2).
p(µ,σ2) ∝1
σ2 , −∞ < µ < ∞, σ2 > 0 (3.7)
It is necessary to draw some inference from this improper prior to reach to a posterior distribution as moreobservations X=(x1,x2, .......xn,) are obtained.
36
Erasmus Mundus Programme
ADVANCED MASTERS IN STRUCTURAL ANALYSIS OF MONUMENTS AND HISTORICAL CONSTRUCTIONS

A Bayesian approach to NDT Data Fusion for St. Torcato Church Mayank MISHRA
p(µ,σ2|X) ∝ p(µ,σ2)p(x|µ,σ2) ∝ σ−n−2exp
{− 1
2σ2 [(n−1)s2 +n(x−µ)2]
}(3.8)
wheres =
1n−1 ∑(xi− x)2 (3.9)
This Equation 3.8 shows that conditional posterior is a normal distribution with mean x and variance σ2/n,and marginal posterior for σ2 is a inverse χ2 distribution of the form:
µ,σ2|X → N(
x,σ2
n
)(3.10)
(n−1)s2
σ2 → χ2n−1 (3.11)
3.3.3 Bayesian inference using conjugate prior
For conjugate prior distribution, the joint distribution of µ and σ2 has the form:
p(µ,σ2) ∝
√no
σ2 exp{− no
2σo(µ−µo)
2]
}×( 1
σ2o
){ νo2 +1}
× exp(− So
2σ2o
)(3.12)
no= Initial size of sample;So= Initial sum of the squared differences between the values and their mean;µo= Initial mean;
σo= Standard deviation Initial sample.It can be stated that the prior is a product of the density of a inverted gamma distribution with argumentσ2 and degrees of freedom νo and density of normal distribution (µ) with variance proportional to σ2. Sofinally to conclude this conjugate prior is a normal-gamma distribution with four parameters: µo, σo, no andνo. Therefore, the prior on µ conditional on σ2 is a normal with mean µo and variance σ2/no.
µ|σ2 N(
µo,σ2
no
)(3.13)
1σ2
o Γ
(νo
2,So
2
)(3.14)
The two equations 3.13 and 3.14 are related to each other since one equations gives value of another.The appearance of σ2 in the conditional distribution of µ|σ2 means that µ and σ2 are interdependent. Forinstance, if σ2 is large, then prior distribution with high variance is induced on µ. Since this formulationconsiders conjugate distributions, the posterior distributions for the parameters will follow the same form asthe priors. The equations for posterior mean and marginal posterior density of 1/σ2 will follow the sameparameters but a bit modified and are explained below:
µ|σ2,x N(
µ1,σ2
n1
)(3.15)
Erasmus Mundus Programme
ADVANCED MASTERS IN STRUCTURAL ANALYSIS OF MONUMENTS AND HISTORICAL CONSTRUCTIONS 37
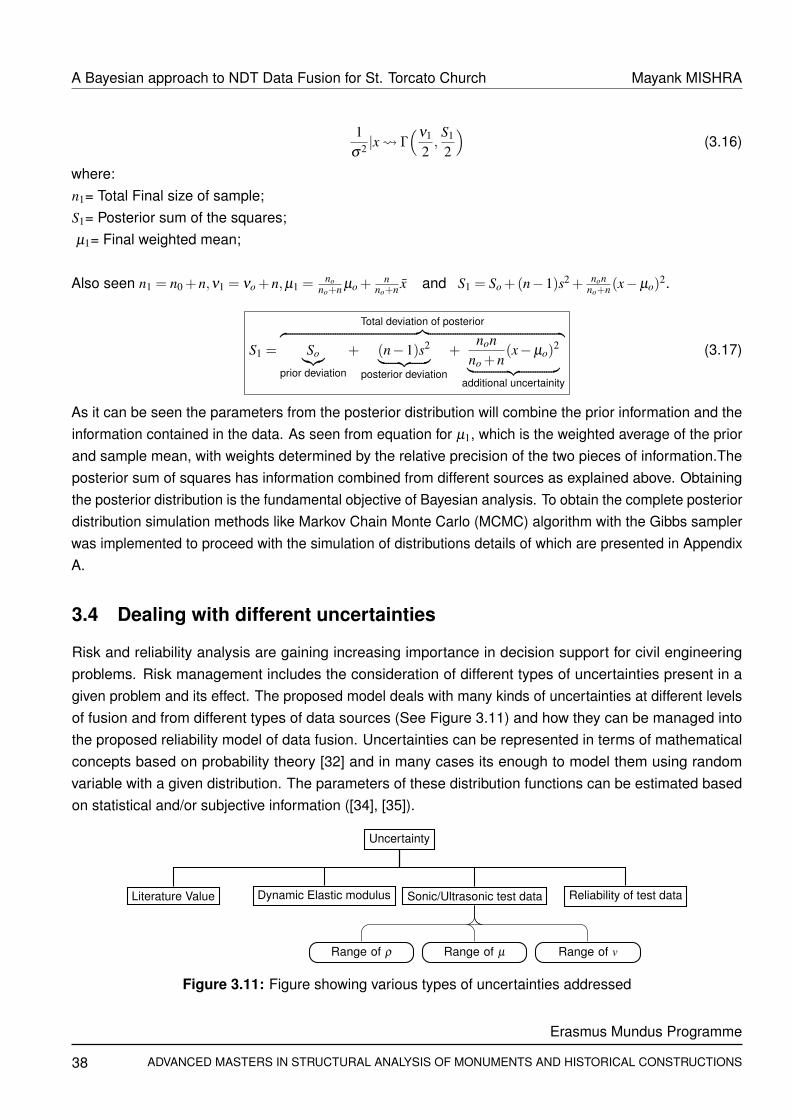
A Bayesian approach to NDT Data Fusion for St. Torcato Church Mayank MISHRA
1σ2 |x Γ
(ν1
2,S1
2
)(3.16)
where:n1= Total Final size of sample;S1= Posterior sum of the squares;µ1= Final weighted mean;
Also seen n1 = n0 +n,ν1 = νo +n,µ1 =no
no+n µo +n
no+n x and S1 = So +(n−1)s2 + nonno+n(x−µo)
2.
S1 =
Total deviation of posterior︷ ︸︸ ︷So︸︷︷︸
prior deviation
+ (n−1)s2︸ ︷︷ ︸posterior deviation
+non
no +n(x−µo)
2︸ ︷︷ ︸additional uncertainity
(3.17)
As it can be seen the parameters from the posterior distribution will combine the prior information and theinformation contained in the data. As seen from equation for µ1, which is the weighted average of the priorand sample mean, with weights determined by the relative precision of the two pieces of information.Theposterior sum of squares has information combined from different sources as explained above. Obtainingthe posterior distribution is the fundamental objective of Bayesian analysis. To obtain the complete posteriordistribution simulation methods like Markov Chain Monte Carlo (MCMC) algorithm with the Gibbs samplerwas implemented to proceed with the simulation of distributions details of which are presented in AppendixA.
3.4 Dealing with different uncertainties
Risk and reliability analysis are gaining increasing importance in decision support for civil engineeringproblems. Risk management includes the consideration of different types of uncertainties present in agiven problem and its effect. The proposed model deals with many kinds of uncertainties at different levelsof fusion and from different types of data sources (See Figure 3.11) and how they can be managed intothe proposed reliability model of data fusion. Uncertainties can be represented in terms of mathematicalconcepts based on probability theory [32] and in many cases its enough to model them using randomvariable with a given distribution. The parameters of these distribution functions can be estimated basedon statistical and/or subjective information ([34], [35]).
Uncertainty
Literature Value Dynamic Elastic modulus Sonic/Ultrasonic test data
Range of ρ Range of µ Range of v
Reliability of test data
Figure 3.11: Figure showing various types of uncertainties addressed
38
Erasmus Mundus Programme
ADVANCED MASTERS IN STRUCTURAL ANALYSIS OF MONUMENTS AND HISTORICAL CONSTRUCTIONS
A Bayesian approach to NDT Data Fusion for St. Torcato Church Mayank MISHRA
At the step I, the data from literature sources from granite comes with uncertainty since type of granite, age,etc is not known so a range was taken to start with the model. Also while dealing with sonic/ultrasonic datathe values of velocity (v), density (ρ) of granite and poisons ratio (µ) were not known so again some rangewas taken (For intervals adopted refer Table 3.18). The elastic modulus population was generated by usingMonte Carlo simulation for different values of the above three parameters mentioned above. Also the elasticmodulus computed using these tests is dynamic elastic modulus which is not exactly the Young’s moduluswhich we are looking for from compression tests. So this needs to be multiplied by some conversion factorwhich can be modelled as an additional uncertainty. Currently in the scope of this thesis no factor wasused. The last and most important uncertainty dealt in this thesis is the framework to modify the standarddeviation considering the difference in the quality of data. (For example data coming from high quality insitu tests will be much more trustworthy than schmidt hammer test). All these uncertainties mentioned areincluded in the model in the form of standard deviation and can be reduced as more data is obtained.
Erasmus Mundus Programme
ADVANCED MASTERS IN STRUCTURAL ANALYSIS OF MONUMENTS AND HISTORICAL CONSTRUCTIONS 39


A Bayesian approach to NDT Data Fusion for St. Torcato Church Mayank MISHRA
4BAYESIAN RELATIONSHIPS FOR ESTIMATING COMPRESSIVE
STRENGTH AND ELASTIC MODULUS OF STONE GRANITE BLOCKS
This chapter presents two case studies in which the in situ strength of granite ( fc) and Elastic modulus(E) is found out by combining results from Literature and NDT tests (Direct and Indirect). Besides coretests (Direct), NDT tests like pulse velocity and rebound hammer (Indirect) can also be used to give someestimate regarding strength of granite and elastic modulus of rock. In this case we are testing everythingon granite blocks so we assume all the Bayesian models for concrete holds for granite also with few minormodifications. Due to economic reasons it is preferred to obtain some data from NDT testing on samplesbefore doing core tests and to develop regression relationship between them. Also it is not possible inmany cases to take sample out of cultural heritage buildings as mentioned in guidelines of ICOMOS [36]due to policy of minimum intrusion.
Vague prior information is available for assessment of structures and needs to be combined with otherexperimental data to arrive at a better estimate. To include more information as the structure tests arecarried out Bayesian methods [21] provide a more rational and consistent approach to encompass thisnew information. Many classical relationships to arrive at a fixed value of strength are available but theyare valid when the amount of data is higher so the statistical procedures is needed to convert data in anuniform format. In this first study test data was used to predict in-situ compressive strength of granite.Since core specimens cannot be taken out for testing from church similar tests were done from the stonewhich was supposed to come from same quarry and results were similar [20]. Bayesian relationships areused in this case which can combine small or large amounts of data with prior knowledge which can bequalitative or quantitative in nature. It is very beneficial to use when the data supply is intermittent andfrequent update of random variable is necessary. In this chapter various Bayesian approaches are used tocombine data and comparison is made between different approaches.
The following timeline shows the different research carried out in Bayesian updating of mechanicalparameters. The same have been applied to the data of San Torcato church to arise to some definitivevalue and confidence interval for the parameters. The timelines shown in Figure 4.1 cite the differentresearches done in geomechanical parameters using Bayesian approach. For the Fusion process themodel used considers both mean (µ) and standard deviation (σ ) to have moments [27] enabling modeluncertainties to a great extent. Along with this uncertainties arising from literature and sonic/ultrasonicvelocities are also put into this model to arrive to the posterior estimates of parameter and charactersticvalues (5% lower fractile).
Erasmus Mundus Programme
ADVANCED MASTERS IN STRUCTURAL ANALYSIS OF MONUMENTS AND HISTORICAL CONSTRUCTIONS 41

A Bayesian approach to NDT Data Fusion for St. Torcato Church Mayank MISHRA
1985 1990 1995 2000 2005 2010 2015Kryv
iak and Scanlon
M. Sykora
Caspeele
and Taerw
e
Miranda et al
Figure 4.1: Different researches done in geomechanical parameters using Bayesian approach
4.1 Estimation of mean granite strength ( fc) when only core compressivestrength testing data is available using approach by Kryviak et al.
4.1.1 Prior information
It is common to use a normal distribution for the compressive strength of concrete [37] which we are usingin case of granite also. Therefore, the probability density function for the strength of the granite block canbe expressed as
f (x) =1√2πσ
e
(− (x−µ)2
2σ2
)(4.1)
where:x: random variable usually concrete strength, granite in this case;σ2: variance of random variable;µ: mean or expected value of the random variable.
In order to use Bayes theorem in this case it is pertinent to predict mean µ and σ2 based on some priorinformation (construction documents) or by some experience. If they cannot be predicted the starting pointcan be a prior with a large variance. Since a prior distribution for mean strength is required and as such noinformation was available for granite compressive strength so mean value (µ)=100 and a value of variance(σ )=20 based on literature was chosen. So the prior pdf was given by [31]:
f (µ) =1√
2πσpriore
(−(
x−µprior)2
2σ2prior
)(4.2)
where:-µprior: Assumed mean of granite compressive strength, 100 MPaσ2: assumed value of prior variance of mean compressive strength, (20 MPa)2
µ: random variable, i.e mean granite compressive strength.
42
Erasmus Mundus Programme
ADVANCED MASTERS IN STRUCTURAL ANALYSIS OF MONUMENTS AND HISTORICAL CONSTRUCTIONS

A Bayesian approach to NDT Data Fusion for St. Torcato Church Mayank MISHRA
After this step of choosing the prior the next step was the determination of the likelihood function. Thelikelihood will give the conditional probability of obtaining test data assuming a mean of µ and since all thepopulation comes from same population variance σ2
o can be assumed same for all datas. The likelihoodfunction is given by:
f (xi|µ) =1√
2πσoe
(− (x−µ)2
2σ2o
)(4.3)
where xi: Granite compressive strength of ith core.
4.1.2 Bayesian updating and test results
The test results for granite compressive strength can be taken from Table 3.17 in chapter 3. The tableshows a total of 6 tests for compressive strength. The posterior PDF can be determined using the testresults i=1 to 6 (Table 3.17) ( fc=[79.6 87.2 85.2 66.9 77.8 73.8]) using the following given by [31] :
f (xi|µ) =1√
2πσpriore
(− (x−µpost)
2
2σ2prior
)(4.4)
where σpost =1
nσ2
o+ 1
σ2prior
and µpost =
σ2o
n µprior +σ2priorx
σ2o
n +σ2prior
The plots for the granite concrete strength using this method considering only core data given (See Table3.17) and the comparison for prior and posterior is shown in Figure 4.2.
Table 4.1: Prior and posterior values for granite strength fc in MPa using constant mean and variance
Parameter Prior Posteriorµ 100 78.9σ 20 3.0395% confidence for mean 67.1-132.9 73.9-83.9
This approach is simple and does not has much mathematical formulation however it fails to deal withmany uncertainties. The approach presented in the next section bit complex but treats different kinds ofuncertainties explained in Section 3.4. However the data from Schmidt hammer could not be integratedwith the data from literature and core compressive strength tests since there was no proper correlation toconvert the indirect test data into equivalent compressive strength data.
Erasmus Mundus Programme
ADVANCED MASTERS IN STRUCTURAL ANALYSIS OF MONUMENTS AND HISTORICAL CONSTRUCTIONS 43

A Bayesian approach to NDT Data Fusion for St. Torcato Church Mayank MISHRA
40 60 80 100 120 140 1600
0.02
0.04
0.06
0.08
0.1
0.12
0.14
Granite block compressive strength (MPa)
Pro
babili
ty D
ensity
Normal Prior from literature
Normal Posteior using the approach from Kryviak et al.
Figure 4.2: Prior and Posterior density functions for Granite compressive strength fc in MPa using coredata only [31]
4.2 Estimation of mean granite strength when only core compressivestrength testing data is available using Jeffreys prior
The results obtained by using Jeffreys prior [27] were not suitable in this case (See Table 4.2) since theygive a very high value of mean and variance. Reason may be the use of χ2 distribution function with lowdegrees of freedom is more skewed and does not provide good results. If a higher number of test resultswere available then this problem might be reduced and give better accurate results.
Table 4.2: Posterior values for granite strength fc in MPa using Jeffreys prior
Parameter Prior Posterior(n=6)
Posterior(n=25)
Posterior(n=50)
Posterior(n=100)
µ 100 92.21 80.47 79.34 78.94σ 20 71.64 10.99 9.17 8.2395%confidencefor mean
67.1–132.9 -22.6–216.4 62.4–98.6 64.25–94.44 65.14–92.50
44
Erasmus Mundus Programme
ADVANCED MASTERS IN STRUCTURAL ANALYSIS OF MONUMENTS AND HISTORICAL CONSTRUCTIONS

A Bayesian approach to NDT Data Fusion for St. Torcato Church Mayank MISHRA
−150 −100 −50 0 50 100 150 200 250 300 3500
0.005
0.01
0.015
0.02
0.025
0.03
0.035
0.04
Granite block compressive strength fc(MPa)
Pro
babili
ty D
ensity
Normal Posterior − Jefferys n=6
Normal Posterior − Jefferys n=25
Figure 4.3: Posterior density functions for Granite compressive strength fc in MPa using Jeffreys Prior forsample size n=6 & n=25
The results of Jeffreys prior may be used in case when sample size is large. The sample size which weused n=6 shows higher standard deviation and a large confidence interval which might not be suited in thiscase. Further a high number of tests will decrease the standard deviation from current value of 7.5 to lowervalue which will further improve the model accuracy. This factor was not taken into account while doing thesimulations.
4.3 Estimation of mean granite strength when only core compressivestrength testing data is available using conjugate prior
In this framework the Bayesian approach is used to update the parameter when new data is available.Regarding the initial level of knowledge considered two approaches were used: no knowledge was presentabout the parameter and second prior distribution was available based on some data about the parameter.The Bayesian approach is used to reduce uncertainty related to parameters actual value. In the approach[27] they Bayesian technique is used to update geomechanical parameter E by considering the mean andstandard deviation as random variable and arriving at a more reliable value of E. As seen the uncertaintyis represented by the standard deviation the random variable and our interest is to develop a Bayesianframework to reduce uncertainty and increase reliability of the parameter.The same thing was done in this case but since this approach requires a initial value of no to start with
Erasmus Mundus Programme
ADVANCED MASTERS IN STRUCTURAL ANALYSIS OF MONUMENTS AND HISTORICAL CONSTRUCTIONS 45

A Bayesian approach to NDT Data Fusion for St. Torcato Church Mayank MISHRA
so 6 samples were considered and was make sure that the values of these samples satisfy the criteria ofsample mean (µsample=100) and standard deviation (σsample=20) for comparison purposes with previousresults. The results were also studied parametrically by varying the prior information, the variance byusing trust factor and amount of data obtained. The study was performed using data obtained from realinvestigation.
Table 4.3: Prior and Posterior estimates of compressive strength fc in MPa using Conjugate prior
Parameter Prior Posterior (n=6) Posterior (n=50) Posterior (n=100)µ – 89.21 89.20 89.20σ(µ) – 4.21 1.49 1.06σ – 14.43 15.02 15.06σ(σ) – 3.10 1.07 0.7595% confidence for mean – 82.21–96.21 86.21–91.67 87.4–90.95µpop 100 89.25 89.24 89.19σpopulation 20 18.98 16.47 16.1895% confidence for populationmean
67.1–132.9 58.02–120.48 62.18–116.13 62.5-115.82
where:µ = mean value of the mean; σ(µ) = standard deviation of mean value; σ = mean value of the standarddeviation; σ(σ) = standard deviation of mean value of standard deviation; µpop = mean value of thepopulation mean; σpopulation = standard deviation of the population mean.
20 40 60 80 100 120 140 1600
0.005
0.01
0.015
0.02
0.025
Granite block compressive strength fc(MPa)
Pro
bab
ility
De
nsity
Normal − Prior
Normal Posterior − n=6
Normal Posterior − n=50
Normal Posterior − n=100
Figure 4.4: Prior and Posterior density functions for Granite compressive strength fc in Mpa using conjugatedistribution
46
Erasmus Mundus Programme
ADVANCED MASTERS IN STRUCTURAL ANALYSIS OF MONUMENTS AND HISTORICAL CONSTRUCTIONS

A Bayesian approach to NDT Data Fusion for St. Torcato Church Mayank MISHRA
4.3.1 Conclusions and Results
Since the number of observation data are so small to improve the prior so it can be only said that it gives aconservative value of mean = 89.25 which means the updating did take place but was not good enough todrag the mean further down.
Prior Information,Literature
(E,σ) = (100,20)
Core compressivestrength test data,
granite blocks (6 tests)(E,σ) = (78.4,7.5)
∑
FUSED DATA(E,σ) =
(89.25,18.98)
∫
∫Posterior
Figure 4.5: Data Fusion system using Bayesian approach for updating Compressive strength fc in case ofdata from Literature and core compressive strength data for granite
In these cases, Bayesian updating does not decrease uncertainty by greater extend since the initial meanvalue of fc and the value of new data were considerably different. As it can be seen from Figure 4.4, asnumber of samples increases there is a increase in reliability interval of the parameter. One of the mostimportant thing while increasing number of tests is as they increase sigma will decrease which was nottaken account in this case. Had this factor taken into account the graphs will be clearly separated.
Erasmus Mundus Programme
ADVANCED MASTERS IN STRUCTURAL ANALYSIS OF MONUMENTS AND HISTORICAL CONSTRUCTIONS 47

A Bayesian approach to NDT Data Fusion for St. Torcato Church Mayank MISHRA
4.4 Update of Elastic Modulus of Granite E using Bayesian Technique
From the database of elastic modulus (See Table 4.4) the granite modulus interval was estimated to be20-50 GPa (Prior Information). This interval was used to establish to establish prior parameters namely,mean (µ) = 35 and standard deviation (σ ) = 7.5 to cover the range given in Table 4.4 on choosing elasticmodulus for rocks. Choosing these interval range allows us to cover 95 % of confidence interval (µ−2σ ≤ E≤ µ +2σ ) as shown in Figure 4.6. Same calculations were performed to obtain the posterior distribution asdone in Chapter 4 , Section 4.3. The normal distribution was used to model the geomechanical parameterE. The matrix for E value [31.4 29.8 32.1 32.8 31.4 32.5 33.3 33.2 33.3 33.3] was used as got from Table3.17 from doing compressive test on granite blocks. The new values from compressive strength direct testdata show mean (µ) of 32.3 and standard deviation (σ ) of 1.1551.
Rock Type Modulus ofElasticity (GPa)
Limestone 3–27Dolomite 7–15Limestone(very hard) 70Sandstone 10–20Quartz-sandstone 60–120Greywacke 10–14Siltstone 3–14Granite - slightly altered 10–20Granite - good 20–50Quartzite - Micaceous 28Quartzite - sound 50–80Dolerite 70–100Basalt 50Andesite 20–50Amphibolite 90
Table 4.4: Guideline table for choosingElastic Modulus for Rocks [38]
68.2%
95%
99.7%
12.5 20 27.5 35 42.5 50 57.5
·10−2
Standard deviations
Figure 4.6: The Normal distribution for Literature values ofElastic Modulus (E) of granite
4.4.1 Determination of Posterior using Jeffreys prior for Elastic Modulus of granite
The results obtained by using an non-informative Jeffreys prior for estimating the elastic modulus for graniteblocks are shown in Table 4.5 and the distribution is plotted in figure 4.7. The results obtained by jeffreysprior mainly depend on the variance of direct compression test results, since no initial knowledge wasconsidered.
48
Erasmus Mundus Programme
ADVANCED MASTERS IN STRUCTURAL ANALYSIS OF MONUMENTS AND HISTORICAL CONSTRUCTIONS

A Bayesian approach to NDT Data Fusion for St. Torcato Church Mayank MISHRA
Table 4.5: Posterior values for granite Elastic modulus(E) using Jeffreys prior
Parameter Posteriorµ 32.64σ 1.6495% confidence for mean 29.93–35.35
26 28 30 32 34 36 380
0.05
0.1
0.15
0.2
0.25
Value of E (GPa)
Pro
babili
ty D
ensity
Normal posterior − Jeffreys
Figure 4.7: Posterior density functions for Granite Elastic Modulus for normal case using Jeffreys Prior
4.4.2 Bayesian Model Incorporating data from sonic tests using conjugate prior
The model proposed in the Section 3.2.4.1 on data fusion Chapter 3.2 Flowchart [3.2.4.1] was used inwhich the values of E = f (vs,ν ,ρ) [Table 3.18] were generated using Monte Carlo simulation methods. Atotal of 10000 values were generated by writing a simple Matlab code using equation 3.2 with velocity,Poisson’s ratio and density varying randomly over their specified range. Mean and standard deviation ofthem was found which was combined with the initial knowledge of Elastic modulus from the literature andposterior was obtained. The used Matlab code is presented in appendix B.Since no weight or preference of the values available from literature is known so 50% weightage was givento both of them to arrive to a posterior which acts as a prior when combining it with data from the directtests to get to a Final posterior. The flowchart of Figure 4.9 summarises all the results with respectivevalues.
Erasmus Mundus Programme
ADVANCED MASTERS IN STRUCTURAL ANALYSIS OF MONUMENTS AND HISTORICAL CONSTRUCTIONS 49

A Bayesian approach to NDT Data Fusion for St. Torcato Church Mayank MISHRA
Table 4.6: Values for granite Elastic modulus (E) for sonic velocity data (Block) generated using MonteCarlo simulation with uncertainty in Poisson ratio ν and Density ρ
Parameter Value (GPa)E 31.51σ 5.06
Table 4.7: Prior and Posterior estimates of E (Normal Distribution) in GPa
Parameter Literature 1st Update 2nd Updateµ – 33.20 32.54σ(µ) – 0.66 0.53σ – 6.59 5.29σ(σ) – 0.47 0.3895% confidence interval for mean – 32.12-34.29 31.67-33.40µpop 35 33.21 32.52σpopulation 7.5 7.25 5.8295% confidence interval for population mean 20.3-49.7 21.28-45.14 22.94-42.10
10 20 30 40 50 60 700
0.01
0.02
0.03
0.04
0.05
0.06
0.07
Value of E (GPa)
Pro
babili
ty D
ensity
Normal Prior from Literature
Normal posterior−Conjugate 1st Update
Normal posterior−Conjugate Final
Figure 4.8: Posterior density functions for Granite Elastic Modulus E before and after updating consideringdata from Literature, sonic and direct compressive strength data
The updated mean of E was closer to the mean obtained from direct compression tests and a significantimpact on reducing uncertainties was obtained. However, since the initial deviation for literature data was a
50
Erasmus Mundus Programme
ADVANCED MASTERS IN STRUCTURAL ANALYSIS OF MONUMENTS AND HISTORICAL CONSTRUCTIONS

A Bayesian approach to NDT Data Fusion for St. Torcato Church Mayank MISHRA
bit more so the mean of final posterior didn’t decrease by a large amount. The standard deviation valuewas reduced to 22.8 % with direct impact on a substantial narrowing of the 95 % Cl for the mean. Theuncertainty in the E was clearly reduced by using this methodology. When comparing it with Jeffreys prior(Table 4.5), the uncertainty is higher for the conjugate distributions. The fact is due to consideration of theprior information uncertainty which does not exist using Jeffreys prior.
Prior (1) Information,Literature
(E,σ) = (35,7.5)
Sonic test data, Insitu(E,σ) = (31.51,5.06)
∑
Posterior 1(E,σ) =
(33.21,7.25)
Direct dataSource,(E,σ) =
(31.87,1.83)
∑
FUSED DATA(E,σ) =
(32.52,5.82)
∫
∫1st Update
∫
∫2nd Update
Figure 4.9: Data Fusion system using Bayesian approach for updating Elastic modulus E in case of datafrom sonic tests and compressive strength data
4.4.3 Bayesian Model Incorporating data from sonic and ultrasonic tests
Same steps as stated in Section 4.4.2 for generation of values were repeated and the two tables 4.8 and4.9 for sonic and ultrasonic data were obtained.
Table 4.8: Values for granite elastic modulus(E) for sonic velocity data (block) generatedusing Monte Carlo simulation with uncertainty inPoisson ratio ν and density ρ
Parameter Value
E 31.51σ 5.06
Table 4.9: Values for granite elastic modulus(E) for ultrasonic velocity data (block) generatedusing Monte Carlo simulation with uncertainty inPoisson ratio ν and density ρ
Parameter Value
E 32.20σ 2.16
Table 4.10: Prior and Posterior estimates of E (Normal Distribution) in GPa considering sonic and ultrasonicdata
Parameter Literature 1st Update 2nd Update 3rd Updateµ – 33.20 32.70 32.28σ(µ) – 0.66 0.54 0.44σ – 6.59 5.33 4.35σ(σ) – 0.47 0.38 0.3195% confidenceinterval for mean
– 32.12-34.29 31.82-33.59 31.57-33.00
µpop 35 33.21 32.70 32.26σpopulation 7.5 7.25 5.89 4.8095% confidenceinterval forpopulation mean
20.3-49.7 21.28-45.14 23.00-42.39 24.37-40.15
Erasmus Mundus Programme
ADVANCED MASTERS IN STRUCTURAL ANALYSIS OF MONUMENTS AND HISTORICAL CONSTRUCTIONS 51

A Bayesian approach to NDT Data Fusion for St. Torcato Church Mayank MISHRA
As in this case, it can be seen that the mean doesn’t change significantly but the impact on uncertainty isimportant.
10 20 30 40 50 60 700
0.01
0.02
0.03
0.04
0.05
0.06
0.07
0.08
0.09
0.1
Value of E (GPa)
Pro
babili
ty D
ensity
Normal Prior from Literature
Normal posterior−Conjugate 1st Update
Normal posterior−Conjugate 2nd Update
Normal posterior−Conjugate Final
Figure 4.10: Posterior density functions for Granite Elastic Modulus E before and after updating consideringdata from Literature, Sonic, Ultrasonic and direct compressive strength data
The flowchart of Figure 4.9 below summarises all the results with respective values. As seen the finalvalue is closer to the value obtained from direct compression test results of elastic modulus E. However,same logic applied when comparing the values obtained from conjugate and Jeffreys prior since the valuesobtained from conjugate prior show more deviation than Jeffreys prior. The standard deviation values wasreduced to 36 % in this case as compared to 22.8 % with direct impact on a substantial narrowing of the 95% Cl for the mean. This model takes into account all the data from different NDT and Destructive testsfrom S. Torcato case study and presents good results after fusion of data from many steps.
Prior (1)Information,Literature(E,σ) =(35,7.5)
Sonic testdata, Insitu(E,σ) =
(31.51,5.06)
∑
Posterior 1(E,σ) =
(33.21,7.25)
Ultrasonic dataSource, Block
(E,σ) =(32.20,2.16)
∑
Posterior 2(E,σ) =
(32.70,5.89)
Direct dataSource, Block
(E,σ) =(31.87,1.83)
∑
FUSED DATA(E,σ) =
(32.26,4.80)
∫
∫1st Update
∫
∫2nd Update
∫
∫3rd Update
Figure 4.11: Data Fusion system using Bayesian approach for updating Elastic modulus E in case of datafrom sonic, Ultrasonic and compressive strength data
52
Erasmus Mundus Programme
ADVANCED MASTERS IN STRUCTURAL ANALYSIS OF MONUMENTS AND HISTORICAL CONSTRUCTIONS

A Bayesian approach to NDT Data Fusion for St. Torcato Church Mayank MISHRA
4.4.4 Conclusions from Bayesian model to calculate Elastic modulus (E)
The Figure 4.12 summarises the change in elastic modulus mean values and standard deviation. The errorbars on the y-axis represent the standard deviation of the parameter/ Cl intervals and can be seen there isreduction from 7.5 to 4.8 in their values. The numbers on x axis represent different stages of data fetchingand are mentioned below:
1. Literature database
2. Sonic test data
3. Ultrasonic test data
4. Direct compression strength test data
As it can be seen from 1 to 4 there is uncertainty reduction for all levels. For the normal distribution casethe standard deviation of the mean (σ(µ)) was reduced from 0.66 GPa to 0.44 Gpa, i.e 33% decrease fromthe value of prior 2. The mean of the standard deviation (σ ) underwent a 34 % decrease from 6.59 GPato 4.35 GPa. Also for the population values the updating process allowed a significant reduction on thedispersion measures which means the uncertainty of the parameter.
1 2 3 426
28
30
32
34
36
38
40
42
(32.26,4.8)(32.7,5.89)(33.21,7.25)
(35,7.5)
Ela
stic
Mod
ulus
E(G
pa)
Figure 4.12: Elastic modulus updating after different steps without trust factor
Erasmus Mundus Programme
ADVANCED MASTERS IN STRUCTURAL ANALYSIS OF MONUMENTS AND HISTORICAL CONSTRUCTIONS 53


A Bayesian approach to NDT Data Fusion for St. Torcato Church Mayank MISHRA
5DESCRIPTION OF MATLAB TOOLBOX MADE FOR DATA FUSION AND
CALCULATIONS OF TRUST FACTOR (T)
A simple Matlab [39] toolbox (NDT_FUSION) was created to fuse data and arrive to a more certain valueof parameter of interest using Bayesian methodology. A screenshot of the GUI is shown in the Figure 4.10and how to use manual is in Appendix E. The GUI was tested for values from the paper of [27] and thesame values and graph for elastic modulus (E) was obtained same as mentioned in the paper (Table 6).However this GUI needs some modifications to include Trust factor (see Section 5.2) to give more logicalresults for cases in which the reliability of data from different tests are different. We can apply this Bayesestimator updating (Figure 4.10) each time and update the probability distribution function and confidenceinterval of the parameter by fusing it with new piece of data.In the second part of this chapter the calculations for trust factors are explained and the results includingthis trust factor in the Bayesian model are shown. Since, no guideline for using trust factor was statedpreviously so some values are proposed and parametric study needs to be done for different choice oftrust factors. Some of the values proposed for choosing trust factor are mentioned in the conclusions insection 6.2.
5.1 Description of Matlab toolbox NDT_FUSION and NDT_FUSION_TRUST
Figure 5.1: Graphical User Interface (GUI) for updating elastic modulus
Erasmus Mundus Programme
ADVANCED MASTERS IN STRUCTURAL ANALYSIS OF MONUMENTS AND HISTORICAL CONSTRUCTIONS 55

A Bayesian approach to NDT Data Fusion for St. Torcato Church Mayank MISHRA
The GUI (NDT_FUSION) (See Figure 5.1) was replaced my new modified GUI (NDT_FUSION _TRUST)including trust factor T1 and T2. Screenshot of which is shown in the Figure 5.2. The calculation of Trustfactor are explained later in this section.
Figure 5.2: Graphical User Interface (GUI) for updating elastic modulus using trust factors T1 and T2
5.2 Need for trust factor for NDT tests
The Trust Factor (TF) is intended to introduce the subjective concept of having more confidence in theresults of some tests than others. As some tests are more important than others and this fact should beinputted in the Bayesian approach. For all the NDT tests above there is a need for some factor to scaleour responses mainly the standard deviation (σ ) by dividing it with factor less than 1 or in case of lesstrustworthy results multiplying it by factor less than 1. Since in some cases the data from indirect tests hasless spread than that from direct tests so it needs to have some correction to give correct results otherwisethe data from indirect tests will have more contribution in final result. To scale the tests a survey wascarried out by asking Professors and P.hd students expert in NDT field to fill their preference form by givingthem rating among different tests using AHP- Analytic Hierarchy Process [40]. Their ratings along withsome mathematical formulations applied and explained later in this chapter helps us to find the trust factorto scale our responses.
5.2.1 Description of the survey form used for calculation of weights for different tests
The survey is meant for people expert in area of NDT testing. The survey form is to find the importancegiven to each NDT method relative to another for evaluating a certain parameter of interest for exampleElastic Modulus (E) in survey 1 and Compressive strength ( fc) in survey 2. The survey uses AHP- Analytic
56
Erasmus Mundus Programme
ADVANCED MASTERS IN STRUCTURAL ANALYSIS OF MONUMENTS AND HISTORICAL CONSTRUCTIONS

A Bayesian approach to NDT Data Fusion for St. Torcato Church Mayank MISHRA
Hierarchy Process scale shown in Table 5.2 to rate each test as compared with another. The table isdivided into 9 scales from 1-9.For example if method A is 2 times more important than method B, then it also implies method B is 1/2times more important than method A to be consistent in filling the form.Example: How is knowledge from Literature more important in relation to other tests for evaluating value ofelastic modulus of stone?
Table 5.1: Sample question of the form
Sonic Ultrasonic Direct Compression test1/5 1/2 1/8
Table 5.2: Sample question of the form [40]
Intensity ofImportance
Definition Explanation
1 Equal Importance Two activities contribute equally to the objective2 Weak –3 Moderate Importance Experience and Judgment slightly favor one
activity over another4 Moderate plus –5 Strong Importance Experience and Judgment strongly favor one
activity over another6 Strong plus –7 Very strong or
demonstratedimportance
The evidence of favoring one activity overanother is of highest possible order, itsdominance demonstrated in practice
8 Very, very strong –9 Extreme importance The evidence favoring one activity over another
is of the highest possible order of affirmation
5.2.2 Methodology for calculating weightage of each NDT test
To calculate the relative weights a fuzzy approach based in three step is needed as mentioned below:1. First the three triangular fuzzy numbers (TFNs) [See Equation 5.1] are computed and can be seen fromFigure 5.3 as they represent pessimistic, moderate and optimistic estimate of opinions given by experts foreach survey.
ai j = (αi j,δi j,γi j) (5.1)
αi j = Min(βi jk), k = 1, .......,n (5.2)
Erasmus Mundus Programme
ADVANCED MASTERS IN STRUCTURAL ANALYSIS OF MONUMENTS AND HISTORICAL CONSTRUCTIONS 57

A Bayesian approach to NDT Data Fusion for St. Torcato Church Mayank MISHRA
Figure 5.3: Membership function of fuzzy delphi method [40]
δi j =
(n
∏k=1
βi jk
)1/n
, k = 1, .......,n (5.3)
γi j = Max(βi jk), k = 1, .......,n (5.4)
As we can see the fuzzy numbers αi j ≤ δi j ≤ γi j, αi j,δi j,γi j ∈ [1/9,1]⋃[1,9] and αi j,δi j,γi j are calculated by
using equations 5.2, 5.3 and 5.4 respectively where :αi j- Indicates the lower bound.βi jk- Relative intensity of importance of expert k between activities i and j.γi j- Indicates the upper bound.n- number of people in survey.
2. After step 2 the fuzzy positive reciprocal matrix is obtained as given below:
Ai j = [ai j], ai j× a ji ≈ 1,∀ i, j = 1,2, ....,n (5.5)
Or
A =
(1,1,1) (α12,δ12,γ12) (α13,δ13,γ13)
(1/γ12,1/δ12,1/α12) (1,1,1) (α23,δ23,γ23)
(1/γ13,1/δ13,1/α13) (1/γ23,1/δ23,1/α23) (1,1,1)
3. Last step will be calculation of relative fuzzy weights of evaluation factors.
Zi = [ai j⊗ .......⊗ ain]1/n (5.6)
Wi = Zi⊗ (Zi⊕ ...⊕ Zn)−1 (5.7)
58
Erasmus Mundus Programme
ADVANCED MASTERS IN STRUCTURAL ANALYSIS OF MONUMENTS AND HISTORICAL CONSTRUCTIONS

A Bayesian approach to NDT Data Fusion for St. Torcato Church Mayank MISHRA
where a1⊗ a2=(α1×α2,β1×β2,γ1× γ2); Explanation of symbols is given below:⊗ : Multiplication of fuzzy numbers⊕ : Addition of fuzzy numbersWi = (ω1,ω2, .....ωn): Row vector consists of fuzzy weight of ith factor.The defuzzification is explained later in calculations done for calculating the different weight factors
explained in this thesis.
5.2.3 Calculations Explained- The weighting factor determination
Among the 11 people who filled the survey, 8 were university professors and 3 were Phd students whohad some experience about NDT testing methods. Based on their responses, the method was applied asexplained in Section 5.2.2. Only one response was not filled with proper factors and was rejected. It doesnot satisfy the criteria αi j,δi j,γi j ∈ [1/9,1]
⋃[1,9]. All the individual responses which we got are attached in
appendix C. The response of survey 1 in which weightage factors for calculating Elastic modulus E werefound to be mainly biased on direct test results. Direct compression results were ranked much higher thanother results. However the literature knowledge, sonic and ultrasonic results were put in same categorysince there was not much difference in responses. Some people preferred one result while some anotherso the weights came out to be almost same for these three tests. Similar trends were observed for the caseof NDT tests for calculating granite block compressive strength test ( fc). The respondents preferred directcompression test much more than literature values and schmidt hammer tests. All the conclusions deducedin this section about the weights can be easily seen by checking the results obtained later in this section.
5.2.4 Weightage factor for for NDT tests used in calculating elastic modulus of graniteblock
1. The matrix is presented below which we have got from the survey responses.
Table 5.3: All acceptable responses for survey: Part 1
Test method LiteratureKnowledge
Sonic testing UltrasonicTesting
Direct compressivetest
LiteratureKnowledge
1 (1/2,2,1/5,1/2,3,7,3,1/3,1/5,1)
(1/3,1/2,1/5,1/5,5,9,4,1/3,1/3,1/2)
(1/7,1/7,1/8,1/9,1/8,1/3,1/8,1/5,1/3,1/8)
Sonic testing Positivereciprocal
1 (1/2,1/3,1,1/2,3,5,1/4,1,1/5,1/2)
(1/6,1/8,1/5,1/8,1/8,1/9,1/5,1/9,1/3,1/7)
UltrasonicTesting
Positivereciprocal
Positivereciprocal
1 (1/5,1/5,1/5,1/5,1/8,1/9,1/6,1/9,1/3,1/6)
Directcompressivetest
Positivereciprocal
Positivereciprocal
Positivereciprocal
1
2. Following outline above from Table 5.3 , we obtain a fuzzy positive reciprocal matrix A.
Erasmus Mundus Programme
ADVANCED MASTERS IN STRUCTURAL ANALYSIS OF MONUMENTS AND HISTORICAL CONSTRUCTIONS 59

A Bayesian approach to NDT Data Fusion for St. Torcato Church Mayank MISHRA
A =
(1,1,1) (1/5,0.91691,7) (1/5,0.7628,9) (1/9,0.1618,1/3)
(1/7,1.0906,5) (1,1,1) (1/5,0.70711,5) (1/9,0.15431,1/3)
(1/9,1.3110,5) (1/5,1.41421,5) (1,1,1) (1/9,0.17215,1/3)
(3,6.1804,9) (3,6.48046,9) (3,5.809,9) (1,1,1)
3. Calculation of relative fuzzy weights of the evaluation factors.
Z1 = [a11⊗ a12⊗ a13⊗ a14]1/4 = [0.2582,0.5800,2.1407]
Z2 = [a21⊗ a22⊗ a23⊗ a24]1/4 = [0.2374,0.5873,1.6990]
Z3 = [a31⊗ a32⊗ a33⊗ a34]1/4 = [0.2229,0.7516,1.6990]
Z4 = [a41⊗ a42⊗ a43⊗ a44]1/4 = [2.2795,3.9192,5.1961]
∑ Z = [2.9980,5.8381,10.7348]
W1 = Z1⊗ (Z1⊕ Z2⊕ Z3⊕ Z4)−1 = [0.0241,0.0993,0.7140]
W2 = Z2⊗ (Z1⊕ Z2⊕ Z3⊕ Z4)−1 = [0.0221,0.1006,0.5667],
W3 = Z3⊗ (Z1⊕ Z2⊕ Z3⊕ Z4)−1 = [0.0208,0.1287,0.5667],
W4 = Z4⊗ (Z1⊕ Z2⊕ Z3⊕ Z4)−1 = [0.2123,0.6713,1.7332]
Therefore, W1 = (∏3i=1 ωi)
1/3 =0.1195, W2 = 0.1080 ,W3 = 0.1149 ,W4 = 0.6275 .The weighing factors for three NDT tests for finding the Elastic modulus are Literature values (0.1195),sonic testing (0.1080), ultrasonic testing (0.1149) and Direct compression test (0.6275). So the surveyresults we arrive to the following weight-age factors given in form of tree (Figure 5.4).
Total Rating (1.0)
Literature Knowledge(0.1195)
Sonic testing(0.1080)
UltraSonic testing(0.1149)
Direct compression test(0.6275)
Figure 5.4: Weighing factors for NDT test used to find Elastic modulus
60
Erasmus Mundus Programme
ADVANCED MASTERS IN STRUCTURAL ANALYSIS OF MONUMENTS AND HISTORICAL CONSTRUCTIONS

A Bayesian approach to NDT Data Fusion for St. Torcato Church Mayank MISHRA
5.3 Weightage factor for NDT tests used in calculating granite compressivestrength
Same steps were repeated as done in Section 5.2.2.
5.3.1 The Weighting factor determination for calculating compressive strength
1. The matrix is presented below which we have got from the survey responses.
Table 5.4: All acceptable responses for survey
Test method LiteratureKnowledge
SchmidtHammer
Direct compressivetest
LiteratureKnowledge
1 (1/2,1,1/3,1/5,7,5,6,3,1/5,1/2)
(1/8,1/8,1/8,1/9,1/7,1/7,1/8,1/6,1/3,1/7)
SchmidtHammer
Positivereciprocal
1 (1/7,1/8,1/5,1/6,1/8,1/9,1/8,1/8,1/3,1/5)
Directcompressivetest
Positivereciprocal
Positivereciprocal
1
From this matrix compute the triangular fuzzy numbers. Details of which are presented in Appendix D
2. Following outline above, we obtain a fuzzy positive reciprocal matrix A
A =
(1,1,1) (1/5,1.07702,7) (1/9,0.146,1/3)
(0.14285,0.92848,5) (1,1,1) (1/9,0.15614,1/5)
(6,6.8504,9) (5,6.4045,9) (1,1,1)
3. Calculation of relative fuzzy weights of the evaluation factors.
Z1 = [a11⊗ a12⊗ a13]1/3 = [0.2811,0.5397,1.3264]
Z2 = [a21⊗ a22⊗ a23]1/3 = [0.2513,0.5247,1]
Z3 = [a31⊗ a32⊗ a33]1/3 = [3.1072,3.53,4.3267]
∑ Zi = [3.6396,4.5944,6.6531]
W1 = Z1⊗ (Z1⊕ Z2⊕ Z3)−1 = [0.0423,0.1175,0.3644]
W2 = Z2⊗ (Z1⊕ Z2⊕ Z3)−1 = [0.0378,0.1142,0.2748],
Erasmus Mundus Programme
ADVANCED MASTERS IN STRUCTURAL ANALYSIS OF MONUMENTS AND HISTORICAL CONSTRUCTIONS 61
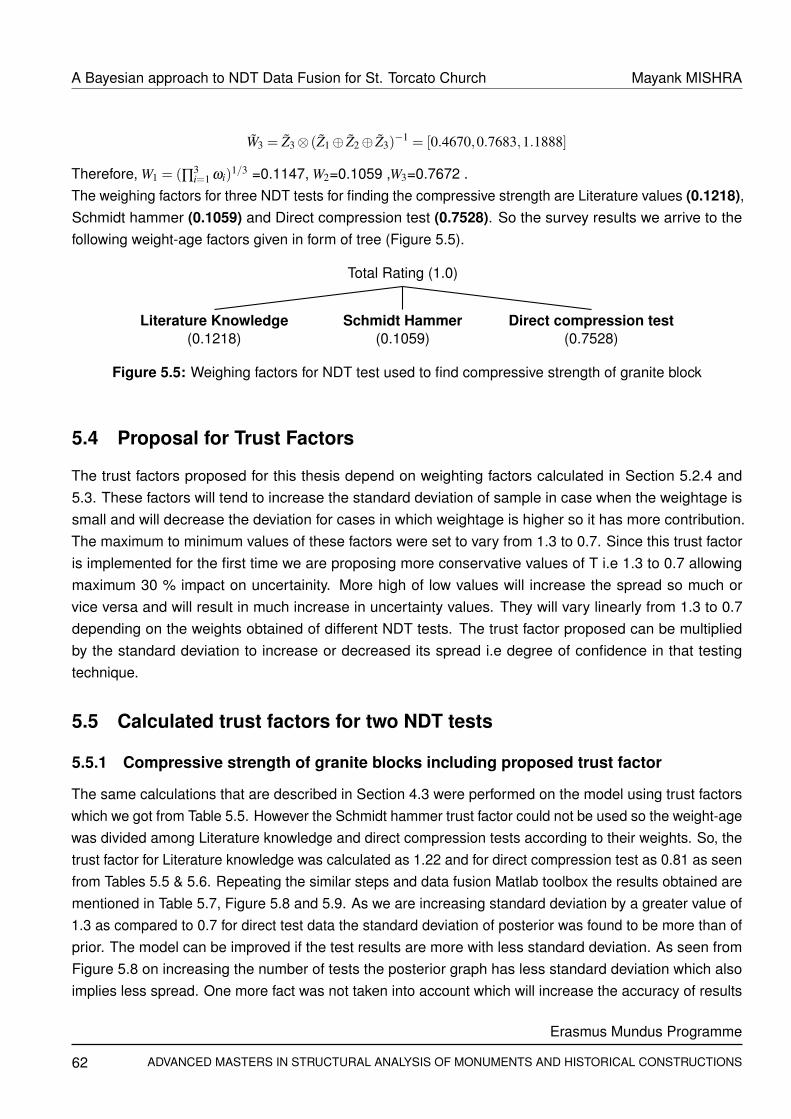
A Bayesian approach to NDT Data Fusion for St. Torcato Church Mayank MISHRA
W3 = Z3⊗ (Z1⊕ Z2⊕ Z3)−1 = [0.4670,0.7683,1.1888]
Therefore, W1 = (∏3i=1 ωi)
1/3 =0.1147, W2=0.1059 ,W3=0.7672 .The weighing factors for three NDT tests for finding the compressive strength are Literature values (0.1218),Schmidt hammer (0.1059) and Direct compression test (0.7528). So the survey results we arrive to thefollowing weight-age factors given in form of tree (Figure 5.5).
Total Rating (1.0)
Literature Knowledge(0.1218)
Schmidt Hammer(0.1059)
Direct compression test(0.7528)
Figure 5.5: Weighing factors for NDT test used to find compressive strength of granite block
5.4 Proposal for Trust Factors
The trust factors proposed for this thesis depend on weighting factors calculated in Section 5.2.4 and5.3. These factors will tend to increase the standard deviation of sample in case when the weightage issmall and will decrease the deviation for cases in which weightage is higher so it has more contribution.The maximum to minimum values of these factors were set to vary from 1.3 to 0.7. Since this trust factoris implemented for the first time we are proposing more conservative values of T i.e 1.3 to 0.7 allowingmaximum 30 % impact on uncertainity. More high of low values will increase the spread so much orvice versa and will result in much increase in uncertainty values. They will vary linearly from 1.3 to 0.7depending on the weights obtained of different NDT tests. The trust factor proposed can be multipliedby the standard deviation to increase or decreased its spread i.e degree of confidence in that testingtechnique.
5.5 Calculated trust factors for two NDT tests
5.5.1 Compressive strength of granite blocks including proposed trust factor
The same calculations that are described in Section 4.3 were performed on the model using trust factorswhich we got from Table 5.5. However the Schmidt hammer trust factor could not be used so the weight-agewas divided among Literature knowledge and direct compression tests according to their weights. So, thetrust factor for Literature knowledge was calculated as 1.22 and for direct compression test as 0.81 as seenfrom Tables 5.5 & 5.6. Repeating the similar steps and data fusion Matlab toolbox the results obtained arementioned in Table 5.7, Figure 5.8 and 5.9. As we are increasing standard deviation by a greater value of1.3 as compared to 0.7 for direct test data the standard deviation of posterior was found to be more than ofprior. The model can be improved if the test results are more with less standard deviation. As seen fromFigure 5.8 on increasing the number of tests the posterior graph has less standard deviation which alsoimplies less spread. One more fact was not taken into account which will increase the accuracy of results
62
Erasmus Mundus Programme
ADVANCED MASTERS IN STRUCTURAL ANALYSIS OF MONUMENTS AND HISTORICAL CONSTRUCTIONS

A Bayesian approach to NDT Data Fusion for St. Torcato Church Mayank MISHRA
0 0.1 0.2 0.3 0.4 0.5 0.6 0.7 0.8 0.9 10
0.2
0.4
0.6
0.8
1
1.2
1.4
Weighing factor for NDT test (w)
Trus
tfac
tor(
T)
Trust factor T = 1.3 - 0.6 w
Figure 5.6: Proposed trust factor for NDT tests
by a greater extend as the test samples increase the test becomes more reliable and standard deviation islower. If this fact is taken into account the model will show much better results and the graphs of proir andposterior can be easily distinguishable.
5.5.2 Modified Algorithm for data fusion
The equation 3.17 was modified to Eq. 5.8 to take into account proposed trust factors in the data fusionalgorithm.
S1modi f ied =
Total deviation of posterior including trust factors︷ ︸︸ ︷T1So︸︷︷︸
prior deviation with T1
+ T2(n−1)s2︸ ︷︷ ︸posterior deviation with T2
+non
no +n(x−µo)
2︸ ︷︷ ︸additional uncertainity
and Somodi f ied = T1So (5.8)
5.5.3 Results including trust factor for compressive strength ( fc) of granite block
Total Rating (1.0)
Literature Knowledge(0.1365)
Direct compression test(0.8440)
Figure 5.7: Weighing factors for NDT test used to find compressive strength of granite block withoutschmidt hammer
Erasmus Mundus Programme
ADVANCED MASTERS IN STRUCTURAL ANALYSIS OF MONUMENTS AND HISTORICAL CONSTRUCTIONS 63

A Bayesian approach to NDT Data Fusion for St. Torcato Church Mayank MISHRA
Table 5.5: Proposed Trust Factor for NDT tests used to find Compressive strength ( fc)
NDT Test Weightage (w) Value of Trust Factor (T)Literature Knowledge 0.1218 1.23
Schmidt Hammer 0.1059 1.24Direct Compression test 0.7528 0.85
Table 5.6: Proposed Trust Factor for NDT tests used to find Compressive strength ( fc) without SchmidtHammer test
NDT Test Weightage (w) Value of Trust Factor (T)Literature Knowledge 0.1365 1.22
Direct Compression test 0.8440 0.81
Table 5.7: Prior and Posterior estimates of compressive strength fc in MPa using Conjugate prior andincluding trust factors
Parameter Prior Posterior(n=6)
Posterior(n=25)
Posterior(n=50)
Posterior(n=100)
µ – 89.20 89.20 89.20 89.20σ(µ) – 4.59 2.29 1.63 1.14σ – 15.54 16.14 16.22 16.27σ(σ) – 3.35 1.64 1.15 0.8195% confidence formean
– 81.66–96.75 85.43–92.97 86.52–91.9 87.31–91.09
µpop 100 89.22 89.21 89.20 89.23σpopulation 20 20.49 18.50 17.94 17.4095% confidence forpopulation mean
55.52–122.92 56.85–121.67 58.79–119.64 59.70–118.70 60.64-117.88
20 40 60 80 100 120 140 1600
0.005
0.01
0.015
0.02
0.025
Granite blocks compressive strength fc (Mpa)
Pro
babili
ty D
ensity
Normal Prior
Normal Posteior− Conjugate n=25
Figure 5.8: Prior and Posterior density functions for Granite compressive strength fc in MPa usingconjugate distribution including trust factors
64
Erasmus Mundus Programme
ADVANCED MASTERS IN STRUCTURAL ANALYSIS OF MONUMENTS AND HISTORICAL CONSTRUCTIONS

A Bayesian approach to NDT Data Fusion for St. Torcato Church Mayank MISHRA
Prior Information,Literature (T=1.22)(E,σ) = (100,20)
Core compressivestrength test
data (T=0.81),granite blocks
(E,σ) = (78.4,7.5)
∑
FUSED DATA(E,σ) =
(89.22,20.49)
∫
∫Posterior
Figure 5.9: Data Fusion system using Bayesian approach for updating Compressive strength fc in case ofdata from Literature and core compressive strength data for granite including trust factors for n=6 samples
5.5.4 Elastic modulus of granite blocks including proposed trust factor
Table 5.8: Proposed Trust Factors for NDT tests used to find Elastic Modulus (E)
NDT Test Weightage (w) Value of Trust Factor (T)Literature Knowledge 0.1195 1.23
Sonic Testing 0.1080 1.24Ultrasonic Testing 0.1149 1.23
Direct Compression test 0.6275 0.92
In this case, since all the results are available so no distribution of weights was done for missing tests andthe trust factors calculated in Table 5.6 were used. The flowchart of Figure 5.11 summarizes the resultswith inclusion of trust factor.The results shown in flowchart of 5.11 similar trend as the results for compressive strength with increase instandard deviation as the trust factor increase the uncertainty of the sample.
Table 5.9: Prior and Posterior estimates of E (Normal Distribution) in GPa considering sonic and ultrasonicdata including trust factors
Parameter Literature Prior 2 Prior 3 Posterior 3µ – 33.25 32.72 32.30σ(µ) – 1.42 1.36 1.27σ – 6.89 6.58 6.19σ(σ) – 1.03 0.98 0.9195% confidenceinterval for mean
– 30.91-35.59 30.49-34.95 30.20-34.40
µpop 35 33.24 32.73 32.32σpopulation 7.5 8.38 8.00 7.5295% confidenceinterval forpopulation mean
20.3-49.7 19.44-47.04 19.56-45.89 19.95-44.68
Erasmus Mundus Programme
ADVANCED MASTERS IN STRUCTURAL ANALYSIS OF MONUMENTS AND HISTORICAL CONSTRUCTIONS 65

A Bayesian approach to NDT Data Fusion for St. Torcato Church Mayank MISHRA
0 10 20 30 40 50 600
0.01
0.02
0.03
0.04
0.05
0.06
Value of Elastic modulus of granite block E (GPa) including trust factors
Pro
ba
bili
ty D
en
sity
Normal Prior from literature
Normal Posteior− Conjugate 1st update
Normal Posteior− Conjugate 2nd update
Normal Posteior− Conjugate final
Figure 5.10: Posterior density functions for Granite Elastic Modulus E before and after updating consideringdata from Literature, Sonic, Ultrasonic and direct compressive strength data including trust factors
Prior (1)Information,Literature(T=1.23)(E,σ) =(35,7.5)
Sonic testdata, Insitu
(T=1.24)(E,σ) =
(31.51,5.06)
∑
Posterior 1(T=1.235)(E,σ) =
(33.24,8.38)
Ultrasonicdata Source,
Block (T=1.23)(E,σ) =
(32.20,2.16)
∑
Posterior2 (T=1.23)(E,σ) =
(32.73,8.00)
Direct dataSource, Block
(T=0.92)(E,σ) =
(31.87,1.83)
∑
FUSED DATA(E,σ) =
(32.32,7.52)
∫
∫Prior 2
∫
∫
Prior 3
∫
∫Posterior 3
Figure 5.11: Data Fusion system using Bayesian approach for updating Elastic modulus E in case of datafrom sonic, Ultrasonic and compressive strength data including trust factors
5.6 Conclusion including trust factor
As seen from the figure 5.12 standard deviation got a bit increased since for trust factor the fusion of datais done at may steps. Since, the data fusion in flowchart of figure 5.11 occurred in many time steps andevery time the trust factor was included it was multiplied by some factor. This approach will be useful indata fusion applications where it is done in one step with less introduction of uncertainty in data. The
66
Erasmus Mundus Programme
ADVANCED MASTERS IN STRUCTURAL ANALYSIS OF MONUMENTS AND HISTORICAL CONSTRUCTIONS
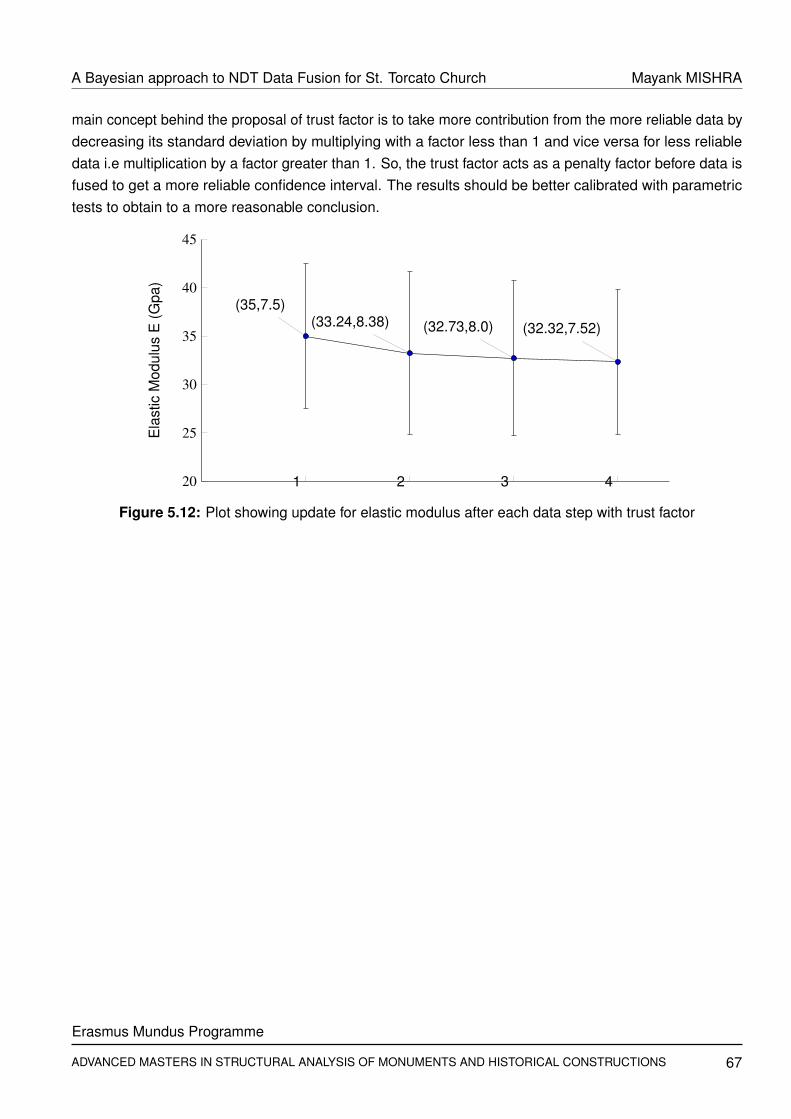
A Bayesian approach to NDT Data Fusion for St. Torcato Church Mayank MISHRA
main concept behind the proposal of trust factor is to take more contribution from the more reliable data bydecreasing its standard deviation by multiplying with a factor less than 1 and vice versa for less reliabledata i.e multiplication by a factor greater than 1. So, the trust factor acts as a penalty factor before data isfused to get a more reliable confidence interval. The results should be better calibrated with parametrictests to obtain to a more reasonable conclusion.
1 2 3 420
25
30
35
40
45
(32.32,7.52)(32.73,8.0)(33.24,8.38)(35,7.5)
Ela
stic
Mod
ulus
E(G
pa)
Figure 5.12: Plot showing update for elastic modulus after each data step with trust factor
Erasmus Mundus Programme
ADVANCED MASTERS IN STRUCTURAL ANALYSIS OF MONUMENTS AND HISTORICAL CONSTRUCTIONS 67


A Bayesian approach to NDT Data Fusion for St. Torcato Church Mayank MISHRA
6CONCLUSIONS AND FUTURE RESEARCH
6.1 Conclusions
The methodology developed involves data fusion at different levels and from subjective, indirect and directsources of data which is a new concept. Using Bayesian approach to combine information and dealingwith certain levels of uncertainty at different levels to formulate the deformability modulus and compressivestrength can be considered as main contribution of these thesis. The developed NDT Data fusion Matlabtoolbox has the following advantages:
• Combines information from different NDT tests (direct and indirect) to fuse it into single uniformformat;
• Includes trust factor which weights the importance of each test on the basis of user trust in the testingprocedure;
• To present the final parameter in a numerical format easy to interpret by the practitioners;
• Draws the distribution of both prior and posterior for comparison of the parameter;
• Comes with a MCR installer which makes nonobligatory to install Matlab for running this program.
−40 −20 0 20 40 60 80 1000
0.005
0.01
0.015
0.02
0.025
0.03
0.035
0.04
Pro
ba
bili
ty D
en
sity
X1
X1 with T=1.5
Figure 6.1: Prior 1 (X1) with andwithout trust factor
+
5 10 15 20 25 30 35 40 45 50 550
0.01
0.02
0.03
0.04
0.05
0.06
0.07
Pro
ba
bili
ty D
en
sity
X2
X2 with T=0.8
Figure 6.2: Prior 2 (X2) with andwithout trust factor
=
15 20 25 30 35 40 45 500
0.01
0.02
0.03
0.04
0.05
0.06
0.07
0.08
0.09
Pro
ba
bili
ty D
en
sity
X
X with T=0.8
Figure 6.3: Posterior distribution(X) with and without trust factor
For fusion system to work properly, we would recommend collection of large amount of experimental dataprior to fusion, on different types of NDT tests to built a database to assign prior probabilities to each NDTtests. The Figure 6.1 shows prior 1 (X1) dotted line and Figure 6.2 prior 2 (X2) dotted line combine togive posterior distribution (X = X1 + X2) also by dotted line shown in Figure 6.3 without including any trustfactors for different NDT tests. After the survey for example the prior 1 was modified to prior 1 with trustfactor shown in Figure 6.1 and the prior 2 by applying a factor of 1.3 and prior 2 to prior 2 with trust factor
Erasmus Mundus Programme
ADVANCED MASTERS IN STRUCTURAL ANALYSIS OF MONUMENTS AND HISTORICAL CONSTRUCTIONS 69

A Bayesian approach to NDT Data Fusion for St. Torcato Church Mayank MISHRA
by applying trust of 0.7 as shown in Figure 6.2. By doing this the posterior in Figure 6.3 got a bit changedwith mean closer to prior 2 mean but shows a bit more spread since we are increasing the prior deviationby a higher value and mean is closer to mean of prior 2.
The model works well when the amount of data available is considerable. It was also seen that the resultsare presented with associated probability intervals and favour the input with maximum degree of confidence.The fusion from NDT test results would not gain much importance in the posterior if the results are poorfrom the input data i.e with larger standard deviation and less weightage associated with them. In theadvanced NDT fusion system proposed many uncertainties could be coupled with information providedfrom different data sources to make inferences.
6.2 Future Research
The project aims in proposing the development of a prototype system which can help practitioners to fusedata from different NDT tests and arrive to a more certain value of parameter. The developed Standaloneapplication can be developed for iPhones so it must be free from the constraints of having computer allthe time. At present we have made two Matlab toolboxes NDT_FUSION & NDT_FUSION_TRUST thatuses Bayesian algorithm to compute reliable intervals levels of parameters. These toolboxes comes witha MCR installer which has no need to have Matlab preinstalled in computer. Similar toolboxes can bedeveloped to compute E using Monte Carlo methodology. The same algorithm can be used to developan applet for Handheld devices like iPhone and other devices like personal digital assistants (PDA) whichcan be used by engineers working in field. These devices already have an operating system installedwhich supports these applications and are easy to carry, portable and can be used even at remote locations.
One of the main issues is the bias in the trust factor which are handled before in this report. Many peoplehave different opinions about the reliability of different NDT tests and they assign different importance todifferent tests. A parametric study needs to done for determining trust factors since the factors which weproposed are on conservative side. The study can also be used to optimise the number of tests from NDTand core when a predetermined amount of money is allotted for a project. Variance can be minimised byusing a balance between the two tests keeping in mind the cost factor.
Different combinations shown in the next page can be tried for calculating the trust factor and doing aparametric study on which combination yield more reliable results. Also different case studies can bestudies like for example data from flat jack tests of elastic modulus can be fused with literature knowledge.It is a growing field and many colleges have separate departments on Information fusion to carry out thedesired task.
70
Erasmus Mundus Programme
ADVANCED MASTERS IN STRUCTURAL ANALYSIS OF MONUMENTS AND HISTORICAL CONSTRUCTIONS

A Bayesian approach to NDT Data Fusion for St. Torcato Church Mayank MISHRA
0 0.1 0.2 0.3 0.4 0.5 0.6 0.7 0.8 0.9 10
0.2
0.4
0.6
0.8
1
1.2
1.4
Weighing factor for NDT test (w)
Trus
tfac
tor(
T)
Trust factor T1
0 0.1 0.2 0.3 0.4 0.5 0.6 0.7 0.8 0.9 10
0.2
0.4
0.6
0.8
1
1.2
1.4
Weighing factor for NDT test (w)
Trus
tfac
tor(
T)
Trust factor T2
0 0.1 0.2 0.3 0.4 0.5 0.6 0.7 0.8 0.9 10
0.2
0.4
0.6
0.8
1
1.2
1.4
Weighing factor for NDT test (w)
Trus
tfac
tor(
T)
Trust factor T3
0 0.1 0.2 0.3 0.4 0.5 0.6 0.7 0.8 0.9 10
0.5
1
1.5
2
2.5
Weighing factor for NDT test (w)
Trus
tfac
tor(
T)
Trust factor T4
0 0.1 0.2 0.3 0.4 0.5 0.6 0.7 0.8 0.9 10
0.5
1
1.5
2
2.5
3
Weighing factor for NDT test (w)
Trus
tfac
tor(
T)
Trust factor T5
0 0.1 0.2 0.3 0.4 0.5 0.6 0.7 0.8 0.9 10
0.2
0.4
0.6
0.8
1
1.2
1.4
Weighing factor for NDT test (w)
Trus
tfac
tor(
T)
Trust factor T6
0 0.1 0.2 0.3 0.4 0.5 0.6 0.7 0.8 0.9 10
0.2
0.4
0.6
0.8
1
1.2
1.4
Weighing factor for NDT test (w)
Trus
tfac
tor(
T)
Trust factor T7
0 0.1 0.2 0.3 0.4 0.5 0.6 0.7 0.8 0.9 10
0.2
0.4
0.6
0.8
1
1.2
1.4
Weighing factor for NDT test (w)
Trus
tfac
tor(
T)
Trust factor T8
Erasmus Mundus Programme
ADVANCED MASTERS IN STRUCTURAL ANALYSIS OF MONUMENTS AND HISTORICAL CONSTRUCTIONS 71


List of Symbols, Abbreviations, and Notation
Symbol Meaning Page
E Elastic modulus 2
fc Compressive strength 2
GUI Graphical User Interface 3
R Rebound value 9
do Distance of the defect fromspecimen 10
v Speed of ultrasonic wave in themedium 10
t1 Time measured between thetwo peaks 10
AE Acoustic Emission 11
S f Calculated stress value 16
K j Jack calibration constant (≤ 1) 16
Ka Jack/slot area constant (≤ 1) 16
Pf Flat-jack pressure 16
UTM Universal testing machine 17
COV Coefficient of variation 24
LVDT Linear variable displacementtransducer 27
Ed Dynamic Elastic Modulus 32
vp Velocity of P-wave 32
ν Poisons ratio of material 32
ρ Density of the material 32
LNEC Laboratório Nacional deEngenharia 35
So Initial sum of the squareddifferences between the valuesand their mean 37
Γ Gamma distribution 37
S1 Posterior sum of the squares 38
MCMC Markov Chain Monte Carlo 38
Symbol Meaning Page
x Random variable, usuallyconcrete strength, granite in thiscase 42
σ2 Variance of random variable 42
µ mean of expected value ofrandom variable 42
PDF Probability density function 43
σpost Posterior deviation 43
µpost Posterior mean 43
Cl Confidence interval 52
σ(µ) Standrd deviation of the mean 53
T Trust Factor 55
AHP Analytic Hierarchy Process 56
TFNs Triangular fuzzy numbers 57
αi j Indicates the lower bound 58
βi jk Relative intensity of importanceof expert k between activities iand j 58
γi j Indicates the upper bound 58
n number of people in survey 58
A Fuzzy positive reciprocal matrix 58
⊗ Multiplication of fuzzy numbers 59
⊕ Addition of fuzzy numbers 59
Wi Row vector consists of fuzzyweight of ith factor 59
S1modi f ied Modified posterior sum ofsquares 63
MCR Matlab compiler runtime 70
PDA Personal digital assistants 70


Supplementary Material for Simulation Algorithm and MCMC Appendix A
ASupplementary Material for Simulation Algorithm and MCMC
Simulation Algorithm and MCMC
Erasmus Mundus Programme
ADVANCED MASTERS IN STRUCTURAL ANALYSIS OF MONUMENTS AND HISTORICAL CONSTRUCTIONS 75

Supplementary Material for Simulation Algorithm and MCMC Appendix A
Simulation Algorithms:-For generating populations when parameters are variable many simulation algorithms exist. In this reportwe have used Markov Chain Monte Carlo (MCMC) which consists of series of draws in which samplevalues of distribution only depend on the last value. In probability theory, a Markov chain for randomvariable x1,x2,x3, ......,xn for any time t, xt depends only on most recent value xt−1. Gibbs sampler is usedfor Markov chain algorithm in this report.
To explain the Gibbs sampler let us consider a problem with two parameters x1 and x2 in which theconditional distributions p(x1| x2) and p(x2| x1) are known, and it is necessary to compute one or bothmarginal distribution p(x1) and p(x2). The Gibbs sampler starts with an initial value x0
2 for x2 and obtains x01
from the conditional distribution p(x1| x2= x02). Then the sampler uses x0
1 to generate a new value x12 drawing
from the conditional distribution based on the value x11, p(x2| x1= x0
1). In mathematical terms the samplesare taken from the two conditional distributions in the following sequence:
xt1 = p(x1|x2 = xt−1
2 ) (A.1)
xt2 = p(x2|x1 = xt
1) (A.2)
This sequence of draws is a Markov chain because the values at step t only depend on the value at stept-1. If the sequence is run long enough the distribution of the current draws converges to the simulateddistribution.
More specifically, to implement the Gibbs sampler, for instance in the case of the normal model withconjugate priors for unknown mean and variance, it is first necessary to obtain draws from the marginalposterior distribution of the variance and then simulate the mean value from the conditional posteriordistribution on the variance and data. The mathematical form of this procedure is the following:
1σ2(1) |x Γ
(ν1
2,S1
2
)(A.3)
µ1|σ2,x N
(µ1,
σ2(1)
n1
)(A.4)
.......
1σ2(t) |x Γ
(ν1
2,S1
2
)(A.5)
µt |σ2,x N
(µ1,
σ2(t)
n1
)(A.6)
76
Erasmus Mundus Programme
ADVANCED MASTERS IN STRUCTURAL ANALYSIS OF MONUMENTS AND HISTORICAL CONSTRUCTIONS
Matlab Codes Appendix B
BMATLAB CODES FOR DIFFERENT BAYESIAN MODELS
MATLAB CODE FOR DATA FUSION
Erasmus Mundus Programme
ADVANCED MASTERS IN STRUCTURAL ANALYSIS OF MONUMENTS AND HISTORICAL CONSTRUCTIONS 77

Matlab Codes Appendix B
MATLABCODE FOR Fc; WITH CONSTANT MEAN AND VARIANCE
1 % Gaussian D i s t r i b u t i o n Basian updat ing only core s t reng th i s given2 STD_prior = 20;3 MEAN_prior = 100;4 x = 35 :0 .1 :150 ;5 f = ( 1 / ( STD_prior * sqrt (2 * pi ) ) ) *exp ( −0.5* ( ( x−MEAN_prior ) / STD_prior ) . ^ 2 ) ;6 hold on ;7 p=plot ( x , f ) ;8 set ( p , ’ Color ’ , ’ red ’ , ’ LineWidth ’ , 1 . )9 legend ( ’ p r i o r ’ )
10 conf idence_5_pr io r=norminv (0 .05 ,100 ,20)11 conf idence_95_pr io r=norminv (0 .95 ,100 ,20)12 n=6;13 x_bar =78.4;14 STD_o=7.5 ;15 STD_post=sqrt ( ( STD_o^2 * STD_prior ^2) / ( STD_o^2+n* STD_prior ^2) ) ;16 MEAN_post=( STD_prior ^2* x_bar+STD_o^2* MEAN_prior / n ) /17 ( STD_prior ^2+(STD_o^2 / n ) ) ;18 g = ( 1 / ( STD_post * sqrt (2 * pi ) ) ) *exp ( −0.5* ( ( x−MEAN_post ) / STD_post ) . ^ 2 ) ;19 plot ( x , g ) ;20 legend ( ’ p r i o r ’ , ’ p o s t e r i o r ’ )21 t i t l e ( ’Mean Compressive Strength o f g r a n i t e from only core data ’ ) ;22 xlabel ( ’ Gran i te compressive Strength ’ ) ;23 ylabel ( ’ P r o b a b i l i t y Densi ty ’ ) ;24 conf idence_5_post=norminv (0 .05 ,MEAN_post , STD_post )25 conf idence_95_post=norminv (0 .95 ,MEAN_post , STD_post )
MATLABCODE FOR Fc; JEFFREYS PRIOR
1 for i =1:100002 p1=rand ( ) ;3 c h i i n v = ch i2 i nv ( p1 , 9 ) ;4 c2 ( i ) =12.0083/ c h i i n v ;5 d2 ( i ) =sqrt ( c2 ( i ) ) ;6 p r i o r ( i ) = norminv ( p1 ,32 .3 , c2 ( i ) / 10 ) ;7 p r i o r s im ( i ) = norminv ( p1 , p r i o r ( i ) , c2 ( i ) ^0 .5 )8 end9 average_c2=mean( c2 )
10 average_d2=mean( d2 )11 average_pr ior=mean( p r i o r )12 average_pr iors im=mean( p r i o r s im ) %mean of poster ioR
78
Erasmus Mundus Programme
ADVANCED MASTERS IN STRUCTURAL ANALYSIS OF MONUMENTS AND HISTORICAL CONSTRUCTIONS

Matlab Codes Appendix B
13 std_c2=std ( c2 )14 std_d2=std ( d2 ) %STD of p o s t e r i o r15 s t d _ p r i o r =std ( p r i o r )16 s td_p r i o r s im =std ( p r i o r s im ) %STD of p o s t e r i o r17 confidence_5_mean=norminv (0 .05 , average_pr ior , s t d _ p r i o r )18 conf idence_5_populat ion=norminv (0 .05 , average_pr iors im , s td_p r i o r s im )19 confidence_95_mean=norminv (0 .95 , average_pr ior , s t d _ p r i o r )20 conf idence_95_populat ion=norminv (0 .95 , average_pr iors im , s td_p r i o r s im )21 STD_post = s td_p r i o r s im ;22 MEAN_post = average_pr iors im ;23 mu = average_pr iors im ;24 sd = s td_p r i o r s im ;25 i x = mu−3*sd :1e−3:mu+4*sd ; %covers more than 99% of the curve26 i y = pdf ( ’ normal ’ , i x , mu, sd ) ;27 plot ( i x , i y ) ;28 hold on ;29 STD_prior = 15;30 MEAN_prior = 35;31 x = 1 0 : 0 . 1 : 6 0 ;32 f = ( 1 / ( STD_prior * sqrt (2 * pi ) ) ) * exp ( −0.5* ( ( x−MEAN_prior ) / STD_prior ) . ^ 2 ) ;33 hold on ;34 p=plot ( x , f ) ;35 xlabel ( ’ Gran i te E l a s t i c Modulus E (GPa) ’ )36 ylabel ( ’ P r o b a b i l i t y Densi ty ’ )37 set ( p , ’ Color ’ , ’ red ’ , ’ LineWidth ’ , 1 . )38 legend ( ’ Pos te r io r−J e f f r e y s E ’ , ’ p r i o r f o r E ’ )39 conf idence_5_pr io r=norminv (0 .05 ,35 ,15)40 conf idence_95_pr io r=norminv (0 .95 ,35 ,15)
MATLABCODE FOR Fc; CONJUGATE PRIOR AND POSTERIOR DISTRIBUTION
1 for i =1:100002 p1=rand ( ) ;3 p2=rand ( ) ;4 invsigmao2 ( i ) = gaminv ( p1 , 7 . 5 , 1 / 68 4 ) ;5 sigmao ( i ) = (1 / invsigmao2 ( i ) ) ^ 0 . 5 ;6 p r i o r ( i ) = norminv ( p2 ,32 .3 , sigmao ( i ) / ( 1 4 ^ 0 . 5 ) ) ;7 p r i o r s im ( i ) = norminv ( p2 , p r i o r ( i ) , sigmao ( i ) ) ;8 end9 average_sigmao=mean( sigmao )
10 average_pr ior=mean( p r i o r )11 average_pr iors im=mean( p r i o r s im ) %mean of p o s t e r i o r
Erasmus Mundus Programme
ADVANCED MASTERS IN STRUCTURAL ANALYSIS OF MONUMENTS AND HISTORICAL CONSTRUCTIONS 79

Matlab Codes Appendix B
12 std_sigmao=std ( sigmao )13 s t d _ p r i o r =std ( p r i o r )14 s td_p r i o r s im =std ( p r i o r s im ) %STD of p o s t e r i o r15 confidence_5_mean=norminv (0 .05 , average_pr ior , s t d _ p r i o r )16 conf idence_5_populat ion=norminv (0 .05 , average_pr iors im , s td_p r i o r s im )17 confidence_95_mean=norminv (0 .95 , average_pr ior , s t d _ p r i o r )18 conf idence_95_populat ion=norminv (0 .95 , average_pr iors im , s td_p r i o r s im )19 mu = average_pr iors im ;20 sd = s td_p r i o r s im ;21 i x = mu−3*sd :1e−3:mu+4*sd ; %covers more than 99% of the curve22 i y = pdf ( ’ normal ’ , i x , mu, sd ) ;23 plot ( i x , i y , ’−− ’ ) ;24 hold on ;25 mu1 = 35;26 sd1 = 15;27 i x1 = 0:1e−3:100; %covers more than 99% of the curve28 i y1 = pdf ( ’ normal ’ , ix1 , mu1, sd1 ) ;29 p=plot ( ix1 , i y1 ) ;30 xlabel ( ’ Value o f E (GPa) ’ )31 ylabel ( ’ P r o b a b i l i t y Densi ty ’ )32 t i t l e ( ’ P r i o r P o s t e r i o r p r o b a b i l i t y dens i t y f u nc t i o ns o f E33 using conjucate p r i o r d i s t r i b u t i o n s ’ )34 set ( p , ’ Color ’ , ’ red ’ , ’ LineWidth ’ , 1 . )35 legend ( ’ Normal Pos te r io r−Conjucate ’ , ’ P r i o r mean−Normal ’ )
MATLABCODE FOR generation values of E using Monte Carlo Similulation
1 for i =1:10002 p1=rand ( 1 ) ;3 p2=rand ( 1 ) ;4 p3=rand ( 1 ) ;5 v_ lb= 3244;6 v_ub= 4220;7 poissons_lb =0 .2 ;8 poissons_ub =0.3 ;9 dens i t y_ l b =2600;
10 densi ty_ub =2800;11 poissons ( i ) =0 .2+(0 .1 ) . * p1 ;12 dens i t y ( i ) = dens i t y_ lb + ( ( density_ub−dens i t y_ l b ) . * p2 ) ;13 v ( i ) =v_ lb +(976*p3 ) ;14 r ( i ) =(1+ poissons ( i ) ) . * (1 − (2* poissons ( i ) ) ) /(1− poissons ( i ) ) ;15 E( i ) =( v ( i ) . ^ 2 ) . * dens i t y ( i ) . * r ( i )
80
Erasmus Mundus Programme
ADVANCED MASTERS IN STRUCTURAL ANALYSIS OF MONUMENTS AND HISTORICAL CONSTRUCTIONS

Matlab Codes Appendix B
16 end17 avg_v= mean( v )18 avg_densi ty= mean( dens i t y )19 avg_poissons= mean( poissons )20 avg_E= mean(E)21 std_E=std (E)22
23
24
25 % avg_v = 3732.426 % avg_densi ty = 2700.527 % avg_poissons = 0.2500828 % avg_E = 3.1372e+1029 % std_E = 5.0638e+09
Erasmus Mundus Programme
ADVANCED MASTERS IN STRUCTURAL ANALYSIS OF MONUMENTS AND HISTORICAL CONSTRUCTIONS 81


Survey FORM for ranking preference for different NDT tests Appendix C
CFORM for Survey for preference of NDT tests
SURVEY FORMS FILLED FOR NDTRATINGS AMONG DIFFERENT TESTS
Erasmus Mundus Programme
ADVANCED MASTERS IN STRUCTURAL ANALYSIS OF MONUMENTS AND HISTORICAL CONSTRUCTIONS 83

Survey for preference of ND or MD test in finding Elastic Modulus of stones 1. How is knowledge from Literature values more important in relation to other tests for evaluating value of
elastic modulus of stones?
2. How is knowledge from Sonic testing more important in relation to other tests for evaluating value of elasticmodulus of stones?
3. How is knowledge from Ultrasonic testing more important in relation to other tests for evaluating value ofelastic modulus of stones?
4. How is knowledge from Direct compression tests more important in relation to other tests for evaluatingvalue of elastic modulus of stones?
PART B: Survey for preference of NDT test in finding Compressive Strength of stones 1. How is knowledge from Literature values more important in relation to other tests for evaluating value of
compressive strength of stone?
2. How is knowledge from Schmidt Hammer more important in relation to other tests for evaluating value ofcompressive strength of stone?
3. How is knowledge from Direct compression test more important in relation to other tests for evaluatingvalue of compressive strength of stone?
Literature Sonic testing Ultrasonic testing Direct compression tests (samples in Lab)
1/2 1/3 1/7
Sonic testing Literature values Ultrasonic testing Direct compression tests (samples in Lab)
2 1/2 1/6
Ultrasonic testing Literature values Sonic testing Direct compression tests (samples in Lab)
3 2 1/5
Direct compression tests (samples in Lab)
Literature values Ultrasonic testing Sonic testing 7 5 6
Literature values Schmidt Hammer Direct compression tests (samples in lab)
1/2 1/8
Schmidt Hammer Literature values Direct compression tests (samples in lab)
2 1/7
Direct compression test (samples in lab)
Literature values Schmidt Hammer 8 7
Survey FORM for ranking preference for different NDT tests Appendix C
84
Erasmus Mundus Programme
ADVANCED MASTERS IN STRUCTURAL ANALYSIS OF MONUMENTS AND HISTORICAL CONSTRUCTIONS

PART A: Survey for preference of ND or MD test in finding Elastic Modulusof stones
1. How is knowledge from Literature values more important in relation to other tests for evaluating value ofelastic modulus of stones?
2. How is knowledge from Sonic testing more important in relation to other tests for evaluating value of elasticmodulus of stones?
3. How is knowledge from Ultrasonic testing more important in relation to other tests for evaluating value ofelastic modulus of stones?
4. How is knowledge from Direct compression tests more important in relation to other tests for evaluatingvalue of elastic modulus of stones?
PART B: Survey for preference of NDT test in finding Compressive Strength of stones
1. How is knowledge from Literature values more important in relation to other tests for evaluating value ofcompressive strength of stone?
2. How is knowledge from Schmidt Hammer more important in relation to other tests for evaluating value ofcompressive strength of stone?
3. How is knowledge from Direct compression test more important in relation to other tests for evaluatingvalue of compressive strength of stone?
remark1: ultrasonic testing gives a dynamic modulus, which is not always comparable to the values obtained from compression tests, so it is rather difficult to make the above comparison.
remark2: this survey questions the ‘importance’ and I assumed that importance means ‘how well does the test give you the actual, standardized, correct value’. If I also have to take into account the impact of the method, the importance of the NDT’s of course becomes larger.---
Literature Sonic testing Ultrasonic testing
Direct compression tests (samples in Lab)
2 1/2 1/7
Sonic testing Literature values Ultrasonic testing
Direct compression tests (samples in Lab)
1/2 1/3 1/8
Ultrasonic testing Literature values Sonic testing
Direct compression tests (samples in Lab)
2 3 1/5
Direct compression tests (samples in Lab)
Literature values Ultrasonic testing Sonic testing 7 5 8
Literature values Schmidt Hammer
Direct compression tests (samples in lab)
1 1/8
Schmidt Hammer Literature values
Direct compression tests (samples in lab)
1 1/8
Direct compression test (samples in lab)
Literature values Schmidt Hammer 8 8
Survey FORM for ranking preference for different NDT tests Appendix C
Erasmus Mundus Programme
ADVANCED MASTERS IN STRUCTURAL ANALYSIS OF MONUMENTS AND HISTORICAL CONSTRUCTIONS 85

PART A: Survey for preference of ND or MD test in finding Elastic Modulus of stones 1. How is knowledge from Literature values more important in relation to other tests for evaluating value of
elastic modulus of stones?
2. How is knowledge from Sonic testing more important in relation to other tests for evaluating value of elasticmodulus of stones?
3. How is knowledge from Ultrasonic testing more important in relation to other tests for evaluating value ofelastic modulus of stones?
4. How is knowledge from Direct compression tests more important in relation to other tests for evaluatingvalue of elastic modulus of stones?
PART B: Survey for preference of NDT test in finding Compressive Strength of stones 1. How is knowledge from Literature values more important in relation to other tests for evaluating value of
compressive strength of stone?
2. How is knowledge from Schmidt Hammer more important in relation to other tests for evaluating value ofcompressive strength of stone?
3. How is knowledge from Direct compression test more important in relation to other tests for evaluatingvalue of compressive strength of stone?
Literature Sonic testing Ultrasonic testing
Direct compression tests (samples in Lab)
1/5 1/5 1/8
Sonic testing Literature values Ultrasonic testing
Direct compression tests (samples in Lab)
5 1 1/5
Ultrasonic testing Literature values Sonic testing
Direct compression tests (samples in Lab)
5 1 1/5
Direct compression tests (samples in Lab)
Literature values Ultrasonic testing Sonic testing 8 5 1
Literature values Schmidt Hammer
Direct compression tests (samples in lab)
1/3 1/8
Schmidt Hammer Literature values
Direct compression tests (samples in lab)
3 1/5
Direct compression test (samples in lab)
Literature values Schmidt Hammer 8 5
Survey FORM for ranking preference for different NDT tests Appendix C
86
Erasmus Mundus Programme
ADVANCED MASTERS IN STRUCTURAL ANALYSIS OF MONUMENTS AND HISTORICAL CONSTRUCTIONS
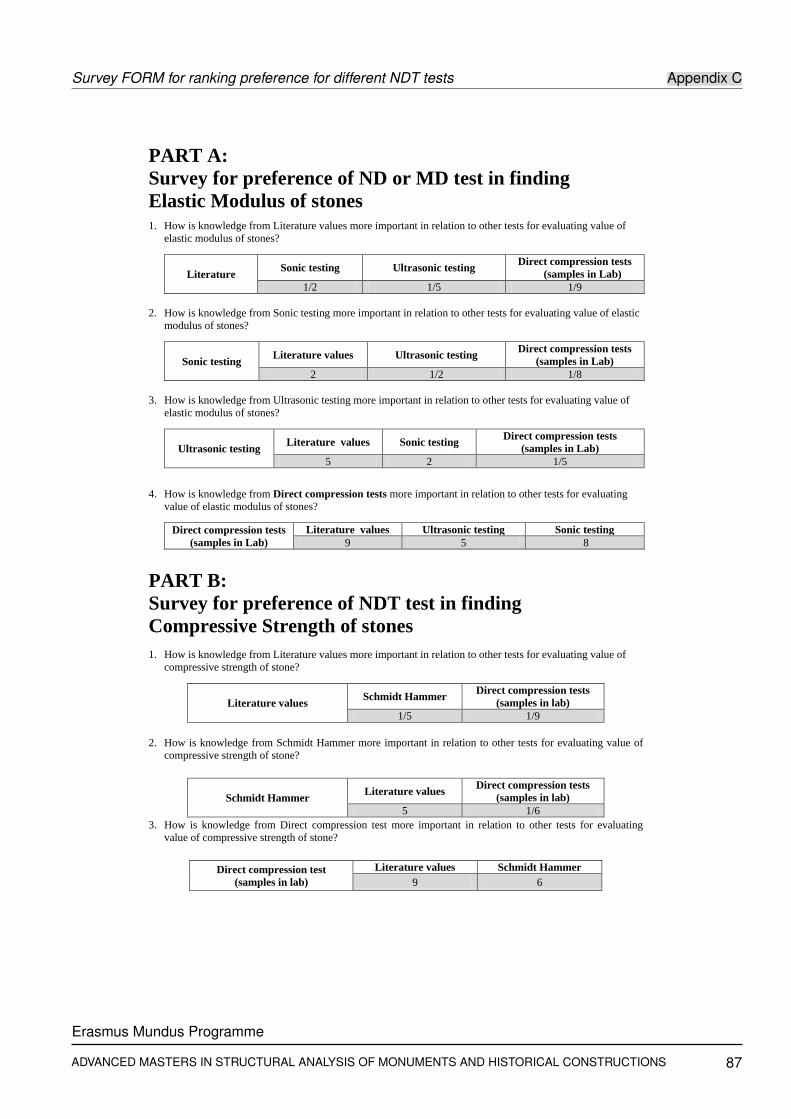
PART A: Survey for preference of ND or MD test in finding Elastic Modulus of stones 1. How is knowledge from Literature values more important in relation to other tests for evaluating value of
elastic modulus of stones?
2. How is knowledge from Sonic testing more important in relation to other tests for evaluating value of elasticmodulus of stones?
3. How is knowledge from Ultrasonic testing more important in relation to other tests for evaluating value ofelastic modulus of stones?
4. How is knowledge from Direct compression tests more important in relation to other tests for evaluatingvalue of elastic modulus of stones?
PART B: Survey for preference of NDT test in finding Compressive Strength of stones 1. How is knowledge from Literature values more important in relation to other tests for evaluating value of
compressive strength of stone?
2. How is knowledge from Schmidt Hammer more important in relation to other tests for evaluating value ofcompressive strength of stone?
3. How is knowledge from Direct compression test more important in relation to other tests for evaluatingvalue of compressive strength of stone?
Literature Sonic testing Ultrasonic testing
Direct compression tests (samples in Lab)
1/2 1/5 1/9
Sonic testing Literature values Ultrasonic testing
Direct compression tests (samples in Lab)
2 1/2 1/8
Ultrasonic testing Literature values Sonic testing
Direct compression tests (samples in Lab)
5 2 1/5
Direct compression tests (samples in Lab)
Literature values Ultrasonic testing Sonic testing 9 5 8
Literature values Schmidt Hammer
Direct compression tests (samples in lab)
1/5 1/9
Schmidt Hammer Literature values
Direct compression tests (samples in lab)
5 1/6
Direct compression test (samples in lab)
Literature values Schmidt Hammer 9 6
Survey FORM for ranking preference for different NDT tests Appendix C
Erasmus Mundus Programme
ADVANCED MASTERS IN STRUCTURAL ANALYSIS OF MONUMENTS AND HISTORICAL CONSTRUCTIONS 87

PART A: Survey for preference of ND or MD test in finding Elastic Modulus of stones 1. How is knowledge from Literature values more important in relation to other tests for evaluating value of
elastic modulus of stones?
2. How is knowledge from Sonic testing more important in relation to other tests for evaluating value of elasticmodulus of stones?
3. How is knowledge from Ultrasonic testing more important in relation to other tests for evaluating value ofelastic modulus of stones?
4. How is knowledge from Direct compression tests more important in relation to other tests for evaluatingvalue of elastic modulus of stones?
PART B: Survey for preference of NDT test in finding Compressive Strength of stones 1. How is knowledge from Literature values more important in relation to other tests for evaluating value of
compressive strength of stone?
2. How is knowledge from Schmidt Hammer more important in relation to other tests for evaluating value ofcompressive strength of stone?
3. How is knowledge from Direct compression test more important in relation to other tests for evaluatingvalue of compressive strength of stone?
Literature Sonic testing Ultrasonic testing
Direct compression tests (samples in Lab)
3 5 1/8
Sonic testing Literature values Ultrasonic testing
Direct compression tests (samples in Lab)
1/3 3 1/8
Ultrasonic testing Literature values Sonic testing
Direct compression tests (samples in Lab)
1/5 1/3 1/8
Direct compression tests (samples in Lab)
Literature values Ultrasonic testing Sonic testing 8 9 9
Literature values Schmidt Hammer
Direct compression tests (samples in lab)
7 1/7
Schmidt Hammer Literature values
Direct compression tests (samples in lab)
1/7 1/8
Direct compression test (samples in lab)
Literature values Schmidt Hammer 7 9
Survey FORM for ranking preference for different NDT tests Appendix C
88
Erasmus Mundus Programme
ADVANCED MASTERS IN STRUCTURAL ANALYSIS OF MONUMENTS AND HISTORICAL CONSTRUCTIONS

PART A: Survey for preference of ND or MD test in finding Elastic Modulus of stones 1. How is knowledge from Literature values more important in relation to other tests for evaluating value of
elastic modulus of stones?
2. How is knowledge from Sonic testing more important in relation to other tests for evaluating value of elasticmodulus of stones?
3. How is knowledge from Ultrasonic testing more important in relation to other tests for evaluating value ofelastic modulus of stones?
4. How is knowledge from Direct compression tests more important in relation to other tests for evaluatingvalue of elastic modulus of stones?
PART B:
Survey for preference of NDT test in finding Compressive Strength of stones 1. How is knowledge from Literature values more important in relation to other tests for evaluating value of
compressive strength of stone?
2. How is knowledge from Schmidt Hammer more important in relation to other tests for evaluating value ofcompressive strength of stone?
3. How is knowledge from Direct compression test more important in relation to other tests for evaluatingvalue of compressive strength of stone?
Literature Sonic testing Ultrasonic testing
Direct compression tests (samples in Lab)
7 9 1/3
Sonic testing Literature values Ultrasonic testing
Direct compression tests (samples in Lab)
1/7 5 1/9
Ultrasonic testing Literature values Sonic testing
Direct compression tests (samples in Lab)
1/9 1/5 1/9
Direct compression tests (samples in Lab)
Literature values Ultrasonic testing Sonic testing 3 9 7
Literature values Schmidt Hammer
Direct compression tests (samples in lab)
5 1/7
Schmidt Hammer Literature values
Direct compression tests (samples in lab)
1/5 1/9
Direct compression test (samples in lab)
Literature values Schmidt Hammer 7 9
Survey FORM for ranking preference for different NDT tests Appendix C
Erasmus Mundus Programme
ADVANCED MASTERS IN STRUCTURAL ANALYSIS OF MONUMENTS AND HISTORICAL CONSTRUCTIONS 89

PART A: Survey for preference of ND or MD test in finding Elastic Modulus of stones 1. How is knowledge from Literature values more important in relation to other tests for evaluating value of
elastic modulus of stones?
2. How is knowledge from Sonic testing more important in relation to other tests for evaluating value of elasticmodulus of stones?
3. How is knowledge from Ultrasonic testing more important in relation to other tests for evaluating value ofelastic modulus of stones?
4. How is knowledge from Direct compression tests more important in relation to other tests for evaluatingvalue of elastic modulus of stones?
PART B: Survey for preference of NDT test in finding Compressive Strength of stones 1. How is knowledge from Literature values more important in relation to other tests for evaluating value of
compressive strength of stone?
2. How is knowledge from Schmidt Hammer more important in relation to other tests for evaluating value ofcompressive strength of stone?
3. How is knowledge from Direct compression test more important in relation to other tests for evaluatingvalue of compressive strength of stone?
Literature Sonic testing Ultrasonic testing
Direct compression tests (samples in Lab)
6 5 1/9
Sonic testing Literature values Ultrasonic testing
Direct compression tests (samples in Lab)
1/6 5/6 1/54
Ultrasonic testing Literature values Sonic testing
Direct compression tests (samples in Lab)
1/5 6/5 1/45
Direct compression tests (samples in Lab)
Literature values Ultrasonic testing Sonic testing 9 45 54
Literature values Schmidt Hammer
Direct compression tests (samples in lab)
9 1/9
Schmidt Hammer Literature values
Direct compression tests (samples in lab)
1/9 1/81
Direct compression test (samples in lab)
Literature values Schmidt Hammer 9 81
Comment [h1]: Sei que estes valores estão for a da escala, mas mantive coerência entre as diferenças relativas na 1ª questão
Comment [h2]: O mesmo que na part A
Survey FORM for ranking preference for different NDT tests Appendix C
90
Erasmus Mundus Programme
ADVANCED MASTERS IN STRUCTURAL ANALYSIS OF MONUMENTS AND HISTORICAL CONSTRUCTIONS

PART A: Survey for preference of ND or MD test in finding Elastic Modulus of stones 1. How is knowledge from Literature values more important in relation to other tests for evaluating value of
elastic modulus of stones?
2. How is knowledge from Sonic testing more important in relation to other tests for evaluating value of elasticmodulus of stones?
3. How is knowledge from Ultrasonic testing more important in relation to other tests for evaluating value ofelastic modulus of stones?
4. How is knowledge from Direct compression tests more important in relation to other tests for evaluatingvalue of elastic modulus of stones?
PART B: Survey for preference of NDT test in finding Compressive Strength of stones 1. How is knowledge from Literature values more important in relation to other tests for evaluating value of
compressive strength of stone?
2. How is knowledge from Schmidt Hammer more important in relation to other tests for evaluating value ofcompressive strength of stone?
3. How is knowledge from Direct compression test more important in relation to other tests for evaluatingvalue of compressive strength of stone?
Literature Sonic testing Ultrasonic testing
Direct compression tests (samples in Lab)
3 4 1/8
Sonic testing Literature values Ultrasonic testing
Direct compression tests (samples in Lab)
1/3 1/4 1/5
Ultrasonic testing Literature values Sonic testing
Direct compression tests (samples in Lab)
1/4 1/3 1/6
Direct compression tests (samples in Lab)
Literature values Ultrasonic testing Sonic testing 8 8 9
Literature values Schmidt Hammer
Direct compression tests (samples in lab)
6 1/8
Schmidt Hammer Literature values
Direct compression tests (samples in lab)
1/6 1/8
Direct compression test (samples in lab)
Literature values Schmidt Hammer 8 9
Survey FORM for ranking preference for different NDT tests Appendix C
Erasmus Mundus Programme
ADVANCED MASTERS IN STRUCTURAL ANALYSIS OF MONUMENTS AND HISTORICAL CONSTRUCTIONS 91

PART A: Survey for preference of ND or MD test in finding Elastic Modulus of stones 1. How is knowledge from Literature values more important in relation to other tests for evaluating value of
elastic modulus of stones?
2. How is knowledge from Sonic testing more important in relation to other tests for evaluating value of elasticmodulus of stones?
3. How is knowledge from Ultrasonic testing more important in relation to other tests for evaluating value ofelastic modulus of stones?
4. How is knowledge from Direct compression tests more important in relation to other tests for evaluatingvalue of elastic modulus of stones?
PART B: Survey for preference of NDT test in finding Compressive Strength of stones 1. How is knowledge from Literature values more important in relation to other tests for evaluating value of
compressive strength of stone?
2. How is knowledge from Schmidt Hammer more important in relation to other tests for evaluating value ofcompressive strength of stone?
3. How is knowledge from Direct compression test more important in relation to other tests for evaluatingvalue of compressive strength of stone?
Literature Sonic testing Ultrasonic testing
Direct compression tests (samples in Lab)
1/3 1/3 1/5
Sonic testing Literature values Ultrasonic testing
Direct compression tests (samples in Lab)
3 1 1/9
Ultrasonic testing Literature values Sonic testing
Direct compression tests (samples in Lab)
3 1 1/9
Direct compression tests (samples in Lab)
Literature values Ultrasonic testing Sonic testing 5 9 9
Literature values Schmidt Hammer
Direct compression tests (samples in lab)
3 1/6
Schmidt Hammer Literature values
Direct compression tests (samples in lab)
1/3 1/8
Direct compression test (samples in lab)
Literature values Schmidt Hammer 6 8
Survey FORM for ranking preference for different NDT tests Appendix C
92
Erasmus Mundus Programme
ADVANCED MASTERS IN STRUCTURAL ANALYSIS OF MONUMENTS AND HISTORICAL CONSTRUCTIONS

PART A: Survey for preference of ND or MD test in finding Elastic Modulus of stones 1. How is knowledge from Literature values more important in relation to other tests for evaluating value of
elastic modulus of stones?
2. How is knowledge from Sonic testing more important in relation to other tests for evaluating value of elasticmodulus of stones?
3. How is knowledge from Ultrasonic testing more important in relation to other tests for evaluating value ofelastic modulus of stones?
4. How is knowledge from Direct compression tests more important in relation to other tests for evaluatingvalue of elastic modulus of stones?
PART B: Survey for preference of NDT test in finding Compressive Strength of stones 1. How is knowledge from Literature values more important in relation to other tests for evaluating value of
compressive strength of stone?
2. How is knowledge from Schmidt Hammer more important in relation to other tests for evaluating value ofcompressive strength of stone?
3. How is knowledge from Direct compression test more important in relation to other tests for evaluatingvalue of compressive strength of stone?
Literature Sonic testing Ultrasonic testing
Direct compression tests (samples in Lab)
1 1 1
Sonic testing Literature values Ultrasonic testing
Direct compression tests (samples in Lab)
5 3 1
Ultrasonic testing Literature values Sonic testing
Direct compression tests (samples in Lab)
3 5 1
Direct compression tests (samples in Lab)
Literature values Ultrasonic testing Sonic testing 3 3 3
Literature values Schmidt Hammer
Direct compression tests (samples in lab)
1 1
Schmidt Hammer Literature values
Direct compression tests (samples in lab)
5 1
Direct compression test (samples in lab)
Literature values Schmidt Hammer 3 3
Survey FORM for ranking preference for different NDT tests Appendix C
Erasmus Mundus Programme
ADVANCED MASTERS IN STRUCTURAL ANALYSIS OF MONUMENTS AND HISTORICAL CONSTRUCTIONS 93
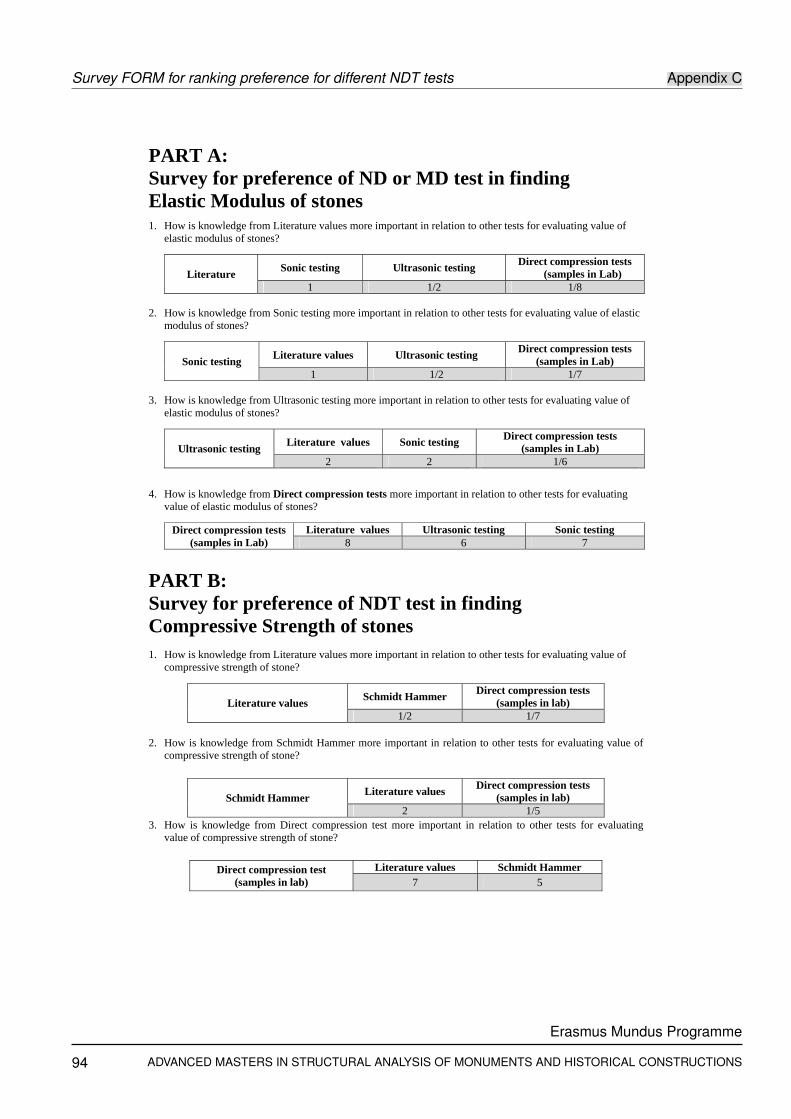
PART A: Survey for preference of ND or MD test in finding Elastic Modulus of stones 1. How is knowledge from Literature values more important in relation to other tests for evaluating value of
elastic modulus of stones?
2. How is knowledge from Sonic testing more important in relation to other tests for evaluating value of elasticmodulus of stones?
3. How is knowledge from Ultrasonic testing more important in relation to other tests for evaluating value ofelastic modulus of stones?
4. How is knowledge from Direct compression tests more important in relation to other tests for evaluatingvalue of elastic modulus of stones?
PART B: Survey for preference of NDT test in finding Compressive Strength of stones 1. How is knowledge from Literature values more important in relation to other tests for evaluating value of
compressive strength of stone?
2. How is knowledge from Schmidt Hammer more important in relation to other tests for evaluating value ofcompressive strength of stone?
3. How is knowledge from Direct compression test more important in relation to other tests for evaluatingvalue of compressive strength of stone?
Literature Sonic testing Ultrasonic testing
Direct compression tests (samples in Lab)
1 1/2 1/8
Sonic testing Literature values Ultrasonic testing
Direct compression tests (samples in Lab)
1 1/2 1/7
Ultrasonic testing Literature values Sonic testing
Direct compression tests (samples in Lab)
2 2 1/6
Direct compression tests (samples in Lab)
Literature values Ultrasonic testing Sonic testing 8 6 7
Literature values Schmidt Hammer
Direct compression tests (samples in lab)
1/2 1/7
Schmidt Hammer Literature values
Direct compression tests (samples in lab)
2 1/5
Direct compression test (samples in lab)
Literature values Schmidt Hammer 7 5
Survey FORM for ranking preference for different NDT tests Appendix C
94
Erasmus Mundus Programme
ADVANCED MASTERS IN STRUCTURAL ANALYSIS OF MONUMENTS AND HISTORICAL CONSTRUCTIONS

Weightage for different NDT tests Appendix D
DCalculation to calculate weightage of each NDT test
CALCULATIONS EXPLAINED TO FINDWEIGHTS FOR DIFFERENT NDT TESTS
Erasmus Mundus Programme
ADVANCED MASTERS IN STRUCTURAL ANALYSIS OF MONUMENTS AND HISTORICAL CONSTRUCTIONS 95

Weightage for different NDT tests Appendix D
Sample Calculations:ai j = (αi j,δi j,γi j),αi j = Min(βi jk),δi j =
(∏
nk=1 βi jk
)1/n,γi j = Max(βi jk)
In all the responses n=8, and subscript ij represents that i and j vary from 1 to 3. For example B121=1/2,B124=1/5, B134=1/9, B235=1/8, B211=2, B214=5, B314=9, B325=7, ... etc.Similarly the triangular fuzzy numbers given by Equations 5.2, 5.3 and 5.4.For example α12 = Min(B12k) = 1/5,α13 = Min(B13k) = 1/9,α23 = Min(B23k) = 1/9
δ12 =(∏
8k=1 β12k
)= 1.46311,δ23 =
(∏
8k=1 β23k
)= 0.13769,δ13 =
(∏
8k=1 β13k
)= 0.1320
γ12 = Max(β12k) = 7,γ13 = Max(β13k) = 1/6,γ23 = Max(β23k) = 1/5
According to the positive reciprocal rule αi j ≤ δi j ≤ γi j, αi j,δi j,γi j ∈ [1/9,1]⋃[1,9]
α31 = (1/γ13,1/δ13,1/α13) = (6,1/0.1320,9) = (6,7.57575,9)
Similarly α32 = (1/γ32,1/δ32,1/α32) = (5,7.26269,9)
96
Erasmus Mundus Programme
ADVANCED MASTERS IN STRUCTURAL ANALYSIS OF MONUMENTS AND HISTORICAL CONSTRUCTIONS

Supplementary Material for Matlab toolbox developed Appendix E
EMANUAL TO USE MATLAB TOOLBOX FOR DATA FUSION
MATLAB DATA FUSION TOOLBOXNDT_FUSION _TRUST
Erasmus Mundus Programme
ADVANCED MASTERS IN STRUCTURAL ANALYSIS OF MONUMENTS AND HISTORICAL CONSTRUCTIONS 97

The toolbox based on principle of bayes estimator (Figure E.2) consists on the left side with number ofsamples for two tests n1 and n2, mean µ1 and µ2 of these data samples along with the standard deviationσ1 and σ2 of these two tests. The trust on these two tests can be filled in the boxes of T1 and T2.Output also comes in graphical form so one can compare the prior and posterior in two plots with differentlines. In case of no knowledge of trust factor, both values can be put equal to 1. The results from thetoolbox are summarised in Table E.1.
Figure E.1: Screenshot showing data fusion results of Figure 5.11 for last step including trust factors
Figure E.2: Bayes estimator
Parameter Posterior
µ 32.30
σ(µ) 1.28
σ 6.12
σ(σ) 0.92
95% confidence interval for mean 30.20-34.40
µpop 32.31
σpopulation 7.53
95% confidence interval for population mean 19.92-44.70
Table E.1: Posterior estimates of E (normal distribution) in GPa
98
Erasmus Mundus Programme
ADVANCED MASTERS IN STRUCTURAL ANALYSIS OF MONUMENTS AND HISTORICAL CONSTRUCTIONS

Bibliography
[1] L. F. Ramos, R. Aguilar, P. B. Lourenco, and S. Moreira, “Dynamic structural health monitoring of sainttorcato church,” Mechanical systems and Signal processing, Elsevier, vol. 35, pp. 1–15, February2013.
[2] A. Agzamova, C. Grande, and M. Mishra, “Seismic verification and inspection of donghi building; acase study,” Master’s thesis, University of Padova, March 2013.
[3] L. F. B. Miranda, “Ensaios acústicos e de macacos planos em alvenarias resistentes,” Ph.D.dissertation, Universidade do Porto, Junho 2011.
[4] J. Alldred, Ed., Improvements to the orthogonal method for determining reinforcing bar diameter usinga cover meter, vol. 2, no. 11-5, Proceedings of Six international conference on international faults andrepair. Engineering Technics Press, 1995.
[5] Recommendations for Surface Hardness Testing by Rebound Hammer, pt. 202 ed., BS 1881, 1986.
[6] Wikipedia. (2013, May) Notes on schmidt hammer. [Online]. Available: http://en.wikipedia.org/wiki/Schmidt
[7] M. Force and R. Mackie, “Non-destructive evaluation of a bonded externally reinforced concrete bridgeusing the frequency response function method,” ICCI, University of Arizona, vol. 8, no. 1031, January1996.
[8] N. composites, “Interactive knowledge base on nde of composites, introduction coin and tap testing.”
[9] S. Salamone, “Non-destructive testing special topic,” Class notes, October 2010.
[10] L. Binda, “Insitu general purpose ndt and mdt-investigation for the diagnosis of historic buildings:Application at different scales,” Department of Structural Engineering, Politechnico of Milan, Italy,2003.
[11] B. Raj and B. Jha, “Fundamentals of acoustic emission,” British Journal of Non Destructive Testing,Springer Verlag, 1993.
[12] “Introduction to acoustic emission testing,” June 2013. [Online]. Available: www.ndt-ed.org
[13] Proceq. (2013, June) Concrete resistivity method. [Online]. Available: http://www.canin-concrete-corrosion.com/analyzing-methods.html
Erasmus Mundus Programme
ADVANCED MASTERS IN STRUCTURAL ANALYSIS OF MONUMENTS AND HISTORICAL CONSTRUCTIONS 99

[14] C. Stanley and R. Balendran, “Developments in assessing the structural integrity of applied surfacesto concrete buildings and structures using infra-red thermography,” vol. 3, pp. 39–44, July 1995.
[15] I. Lombillo, L. Villegas, and J. Elices, “Minor destructive techniques applied to the mechanicalcharacterization of historical rubble stone masonry structures,” Structural Survey, vol. 28, no. 1, pp.53–70, 2010.
[16] A. Bianco, “Endoscopic analysis supporting issues of historic stratigraphic investigations: the casehistory of saint domenico monastery in naples-italy.” 18th world conference on Nondestructive testing,2012.
[17] Wikipedia. (2013, June) Concrete compressive testing. [Online]. Available: http://en.wikipedia.org/wiki/Compressive_strength
[18] “Rst instruments innovation in geotechnical instruments,” June 2013. [Online]. Available:http://www.rstinstruments.com/
[19] D. McCann and M. Forde, “Review of ndt methods in the assessment of concrete and masonrystructures,” NDT and E International, vol. 34, pp. 71–84, 2001.
[20] “Assessment of san torcato church: Non destructive survey and proposed measures, improved andinnovative techniques for the diagnosis and monitoring of historical masonry.” University of Minho,Tech. Rep. 6, 2013.
[21] A. H. Ang. and W. Tang, “Probabilistic concepts in engineering planning and design,” John Wiley andSons Ltd., Chickhester, England, vol. I, 1975.
[22] G. Vasconcelos, P. B. Lourenco, C. Alves, and J. Pamplona, “Prediction of the mechanical propertiesof granites by ultrasonic pulse velocity and schmidt hammer hardness,” June 2007.
[23] Z. Chair and P. Varshney, “Optimal data fusion in multiple sensors detection system,” Institute ofElectrical and Electronics Engineers Transactions on Aerospace and Electronic Systems, vol. 22,no. 1, pp. 98–101, Jan 1986.
[24] X. E. Gros, NDT Data fusion. John Wiley and Sons, NY, 1997, no. ISBN 0 470 23724 4.
[25] M. Sykora, “Assessment of bridges using bayesian updating,” Third international conference onReliability, safety and diagnosis of transport structures and means, University of Pardubice, CzechRepublic, 2008.
[26] R. Caspeele and L. Taerwe, “Bayesian assessment of the characteristic concrete compressive strengthusing combined vague-informative piers,” Elsevier, vol. 28, pp. 342–350, 2012.
[27] T. Miranda, A. G. Correia, and L. R. Sousa, “Bayesian methodology for updating geomechanicalparameters and uncertainty quantification,” International Journal of Rock Mechanics and Miningsciences, no. 1144-1153, 2009.
100
Erasmus Mundus Programme
ADVANCED MASTERS IN STRUCTURAL ANALYSIS OF MONUMENTS AND HISTORICAL CONSTRUCTIONS

[28] W. Tang, “A bayesian evaluation of information for foundation engineering design,” First InternationalConference for applications of Statistics and Probability to Soil and Structural Engineering, pp.174–185, 1971.
[29] Bases for design of structures- Assesment of existing structures, ISO 13822, 2003.
[30] E. Haas C, “Updating the decision aids for tunnelling,” SCE J Constr Eng Management, no. 128, 2002.
[31] G. J. Kryviak and A. Scanton, “Bayesian analysis of in-situ data for estimating the compressivestrength of existing structures,” Master’s thesis, University of Alberta, Canada, July 1986.
[32] M. O Ditlevson, Structural reliability methods. New York: Wiley, 1996.
[33] L. Report, “Lnec collaboration in the geotechnics and geotechnical studies concerning the hydrauliccircuit of venda nova ii,” Lisboa, Portugal, Tech. Rep. 47/1/7084, 1983.
[34] M. Faber, “Risk and safety in civil, surveying and environmental engineering,” 2005.
[35] A. Gelman, J. Carlin, H. Stern, and D. Rubin, Bayesian data analysis. London: Chapman and Hall,2004.
[36] I.-I. scientific committee for analysis, restroration of structures, and architechtural heritage,“Recommendations for the analysis, conservation and structural restoration of architectural heritage,”November 2005.
[37] M. Mirza S.A., Hatzinikolas and J. MacGregor, “Statistical descriptions of strength of concrete,” ASCEJournal of the Structural Division, vol. 105, no. ST6, pp. 1021–1037, 1979.
[38] S. Jade and T. G. Sitharam, “Characterization of strength and deformation of jointed rock mass basedon statistical analysis,” vol. Inernational journal of Geomechanics, ASCE, 2003.
[39] MATLAB, version 7.10.0 (R2010a). Natick, Massachusetts: The MathWorks Inc., 2010.
[40] Y. C. Liu and C. S. Chen, “A new approach for application of rock mass classification on rock slopestability assessment,” Engineering Geology, Elsevier, vol. 89, pp. 129–143, November 2006.
Erasmus Mundus Programme
ADVANCED MASTERS IN STRUCTURAL ANALYSIS OF MONUMENTS AND HISTORICAL CONSTRUCTIONS 101