Embed Size (px)
Citation preview

A Review of Hemorheology: Measuring Techniques and Recent Advances
Patrícia C. Sousa(1), Fernando T. Pinho(2), Manuel A. Alves(1), Mónica S.N. Oliveira(3)*
(1)Departamento de Engenharia Química, CEFT, Faculdade de Engenharia da Universidade do
Porto, Rua Dr. Roberto Frias, 4200-465 Porto, Portugal.
(2) CEFT, Departamento de Engenharia Mecânica, Faculdade de Engenharia da Universidade do
Porto, Rua Dr. Roberto Frias, 4200-465 Porto, Portugal.
(3)James Weir Fluids Laboratory, Department of Mechanical and Aerospace Engineering,
University of Strathclyde, Glasgow G1 1XJ, UK (E-mail: [email protected])
Abstract
Significant progress has been made over the years on the topic of hemorheology, not
only in terms of the development of more accurate and sophisticated techniques, but
also in terms of understanding the phenomena associated with blood components, their
interactions and impact upon blood properties. The rheological properties of blood are
strongly dependent on the interactions and mechanical properties of red blood cells, and
a variation of these properties can bring further insight into the human health state and
can be an important parameter in clinical diagnosis.
In this article, we provide both a reference for hemorheological research and a resource
regarding the fundamental concepts in hemorheology. This review is aimed at those
starting in the field of hemodynamics, where blood rheology plays a significant role, but
also at those in search of the most up-to-date findings (both qualitative and quantitative)
* Corresponding author

in hemorheological measurements and novel techniques used in this context, including
technical advances under more extreme conditions such as in large amplitude oscillatory
shear flow or under extensional flow, which impose large deformations comparable to
those found in the microcirculatory system and in diseased vessels. Given the
impressive rate of increase in the available knowledge on blood flow, this review is also
intended to identify areas where current knowledge is still incomplete, and which have
the potential for new, exciting and useful research. We also discuss the most important
parameters that can lead to an alteration of blood rheology, and which as a consequence
can have a significant impact on the normal physiological behavior of blood.
KEYWORDS: hemorheology, blood viscosity, blood viscoelasticity, RBC
deformability, RBC aggregation,

3
1. Introduction
Understanding the rheological properties and flow dynamics of whole human blood is
of great importance for the early detection, diagnosis and therapy of circulatory
disorders as well as for the development of cardiovascular devices and prosthesis, such
as blood pumps, heart valves or stents. With clear evidence that the rheological
properties of blood are related with diseases, such as cardiovascular disorders
(Dintenfass 1979; Koenig et al. 1998), myocardial infarction (Jan et al. 1975;
Marcinkowska-Gapinska et al. 2007), arterial hypertension (Lo Presti et al. 2014),
diabetes mellitus (Le Devehat et al. 2004), cholesterol and triglyceride levels (Moreno
et al. 2015) and sickle cell anaemia (Drasler et al. 1989), routine screening of
hemorheological measurements could provide useful information for monitoring the
development of such diseases.
Most investigations on rheological material functions concern steady shear
measurements of whole blood. Other investigations have focused on transient and
oscillatory flows, usually conducted under small amplitude deformation conditions
(SAOS) (Vlastos et al. 1997; Picart et al. 1998; Yilmaz and Gundogdu 2008). The flow
of blood in physiological conditions typically involves large deformations, large
deformation rates and periodic forcing with large amplitude (Caro et al. 1974) and
consequently valuable information can be obtained from the characterization of blood
under more extreme conditions, such as in large amplitude oscillatory shear flow
(LAOS) (Sousa et al. 2013) or under conditions of extensional flow (Sousa et al. 2011)
since these can be observed in diseased vessels (e.g. stenosis) and in vessel bifurcations.
Despite the many advances of rheological techniques, which have confirmed the non-
Newtonian nature of blood, current viscometer/rheometer systems and measurement

4
methodologies are still complex and blood viscosity measurements are not yet routinely
implemented to provide relevant clinical information. On the other hand, emerging
microfluidic technologies have been investigated for various clinical purposes including
the analysis of blood samples from patients. The potential of these systems lies on their
small characteristic length and time scales, which besides enhanced portability, avoid
the need for time consuming blood treatment prior to the measurement, and reduce the
required sample volume.
Over the years, there have been a number of excellent reviews on different topics on the
broad subject of hemorheology (Replogle et al. 1967; Thurston 1996; Thurston and
Henderson 2007; Yilmaz and Gundogdu 2008). In the present review, we also focus on
recent technical advances for the rheological characterization of blood using
commercial instruments under less standard flow conditions (e.g. LAOS, extensional
flows) and a diversity of novel micro-scale based techniques. The use of these
technologies provided new data for the characterization of blood and new insights into
its behavior under a broader range of flow conditions, which we compile and discuss in
detail. We start by setting the background for those less experienced in the field with an
introductory section, where the composition of blood is summarized, highlighting its
constituents and functions, followed by a brief historical perspective of hemorheology,
underlining the major developments in this area and finalizing with an up-to-date
summary of the most important rheological properties of blood. Section 2 focuses on
the experimental techniques used to measure blood and plasma rheological properties,
followed by a detailed review on hemorheology on Section 3, including recent data on
transient rheological characterization. In Section 3.1 we discuss whole blood viscosity,
in Section 3.2 we focus on its thixotropy and yield stress, and in Section 3.3 we address

5
blood viscoelasticity. Finally, the concluding remarks and new directions for future
investigation of blood rheology are outlined in Section 4.
1.1. Blood constituents
Blood is a concentrated suspension of corpuscles or formed elements, including red
blood cells (RBC) or erythrocytes, white blood cells (WBC) or leukocytes, and platelets
or thrombocytes in an intercellular liquid, the plasma (cf. Fig. 1) and accounts for 6‒8%
of body weight in healthy humans (Waite 2006). The density of blood under normal
conditions is 1056±9 kg m-3 (Eguchi and Karino 2008).
Figure 1 – near here
Plasma is mainly composed of water at a concentration of approximately 90 – 92 % by
volume and several solutes, such as proteins (e.g. fibrinogen, albumin and cholesterol);
lipids; glucids; and various electrolytes, essentially Na+, K+, Ca2+ and Cl– (Thiriet
2008). Plasma accounts for approximately 55% of the blood volume (Thiriet 2008) and
has a density of about 1021 kg m-3 (Shung 2006). The molecular weight of plasma
proteins can vary by approximately two orders of magnitude (Cokelet and Meiselman
2007). Fibrinogen, which is essential in blood coagulation, occurs in different molecular
weights, with the largest protein representing approximately 70% of the fibrinogen
present in plasma (molecular weight of 340 kDa).
The erythrocytes (density of 1100 kg m-3 (Thiriet 2008)) are the most important cells in
terms of their influence on blood properties and transport phenomena due to their
overwhelming presence and multiple functions. The volume percentage of RBC in

6
blood is called hematocrit, Hct, and in healthy humans, typically varies between 38 –
46% in women and 42 – 53% in men (Thiriet 2008). The RBC are biconcave discs
freely suspended in plasma, having typically 6-8 µm in diameter and 2 µm in thickness,
as illustrated in Fig. 2. Inside the red blood cells there is a concentrated hemoglobin
solution, which behaves as an incompressible viscous fluid. The cell membrane is made
of a lipid bilayer and a cytoskeleton formed by protein molecules, and shows a complex
rheological response with viscoelastic behavior (Puig-De-Morales-Marinkovic et al.
2007; Li et al. 2014). While at rest, RBC have a biconcave shape as shown in Fig. 2,
aligning as ellipsoids with rotation of the membrane in arterial flow (Fischer et al. 1978)
and deforming under the action of significant external forces, but returning to their
original shape when the forces cease unless lysis of the cells occurs (Thiriet 2008). The
ability to adjust their shape reversibly is crucial for flowing through capillaries with
diameters smaller than their cellular dimensions at rest (Secomb 1987) and perform
their main function of transporting nutrients to different parts of the body. It is well
known that certain diseases, such as malaria and diabetes mellitus, are associated with
reduced RBC deformation and may lead to perfusion of peripheral tissues (Simchon et
al. 1987), blockage of the capillaries or cause ischemia (Lee et al. 2009).
Figure 2 – near here
1.2. Brief historical background of hemorheology
Early hemorheology investigations reported blood as a Newtonian fluid (Langstroth
1919; Pirofsky 1953). Interestingly, Poiseuille’s law was derived by the French
physician Jean Léonard Marie Poiseuille, when he aimed to determine the pressure drop

7
in capillary blood flow assuming a Newtonian fluid model (Sutera and Skalak 1993).
Non-Newtonian characteristics were observed early in the 20th century, with Hess
(1915) reporting that although blood viscosity at high shear rates could be described
using Newton’s law of viscosity, the apparent shear viscosity increased as the pressure
drop decreased. He then linked such phenomenon to the ability of RBC to form
aggregates at low shear rates. This was arguably the first observation of the non-
Newtonian rheological behavior of blood linked with its structure. The dependence of
blood viscosity on flow conditions has later been quantified by means of steady
rheological measurements, as reported in the investigations of Pirofsky (1953), Chien et
al. (1966), Chien (1970) and Thurston (1979). The aggregating properties of RBC were
first described by John Hunter in 1786 (Bishop et al. 2001).
During the second half of the 20th century the viscoelastic characteristics of blood were
recognized in the pioneering work of Thurston (1972), who reported results of unsteady
pipe flow with blood. Thurston found that blood stores elastic energy with increasing
strain deformation, corroborating the previous work of Schmid-Schonbein et al. (1968),
who reported the ability of RBC to form aggregates and to deform elastically. Later, the
viscoelastic nature of blood was investigated in more detail in several works (Thurston
1972; Thurston 1979; Thurston 1996). Most of the investigations on plasma rheology
consider blood plasma to have a Newtonian behavior (Harkness 1971; Koenig et al.
1998), but a few argue that it cannot be considered a Newtonian fluid (Sharma and Bhat
1992; Brust et al. 2013).
In summary, the wealth of blood cells characteristics and their interactions result in a
complex rheological behavior, such as viscoelasticity, shear-thinning and thixotropy
(Thurston 1979). In addition, blood has also been reported to have a small yield stress
(Morris et al. 1987; Picart et al. 1998). Besides the rheological properties of blood and

8
the physiological conditions (hematocrit, red blood cell deformability and aggregation),
other parameters that affect blood dynamics are the blood pressure, the vessel shape and
vessel wall properties. In addition, another important physiological property that also
affects hemorheology is the Fåhræus effect. Fåhraeus (1929) investigated the flow of
RBC suspensions with different aggregation levels in glass capillaries and observed that
increasing the aggregation led to a radial migration of the cells toward the center of the
tube, and consequently to a cell-depleted layer near the vessel walls, as illustrated in
Fig. 3.
Figure 3 – near here
The near-wall plasma enriched zone is thin, but impacts strongly on the relation
between flow rate and pressure drop. The reduction of the red blood cell concentration
near the wall leads to a decrease of the apparent blood viscosity and shear stress, and
consequently may lead to inaccurate measurements when using small diameter
capillaries for blood rheology characterization. In particular, below a critical diameter of
0.3 mm, Fahraeus and Lindqvist (1931) found that the viscosity decreases markedly, as
a consequence of a more effective radial migration of the red blood cells away from the
vessel walls in relative terms, a behavior known as the Fåhræus-Lindqvist effect. In
addition, the wall effect on blood viscosity was found to be negligible when the tube
diameter is larger than about 0.4 mm (Fahraeus and Lindqvist 1931). It is interesting to
note that a similar phenomenon was previously observed by Bingham and Green
(1919), albeit in qualitative terms, when they investigated the rheological behavior of
paints.

9
2. Experimental methods for rheological measurements
Different methods have been employed over the years to measure whole blood and
plasma rheological properties, with most works focusing on the rheological
characteristics under shear flow. We can divide the experimental methods for
rheological measurements in two main groups, depending on their size: one using
conventional devices, which we term “macro-scale” devices and the other using “micro-
scale” devices. Conventional methods are the most common and most investigated, but
the interest in micro-systems for rheological measurements has been growing
considerably over the last decade because of the small blood samples required and also
because such devices can be cheap, portable and easily disposable, features which are
important also for implementation in routine clinical diagnosis. Whatever the technique
used, the ideal procedure should: (1) use a small blood sample that can be easily
collected from the donor; (2) ensure no blood coagulation during collection and
measurement, but avoiding the use of anticoagulant if possible; (3) be able to perform
the measurement for a range of relevant temperatures, including normal body
temperature, T ≅ 37ºC; (4) enforce simple and straightforward handling of blood
sample; (5) provide known and controllable flow kinematics so that the principle of
measurement is amenable to analytical mathematical solution (Muramoto and Nagasaka
2011).

10
2.1. Macro-scale rheological devices
2.1.1. Mechanical methods
The characterization of blood rheology (e.g. shear viscosity, yield stress and viscoelastic
properties) has been mostly based on mechanical methods, in which the fluid
experiences a shear flow and the resistance to the fluid motion is measured. In
particular, rotational rheometers are extensively used, with emphasis on the parallel
plates, cone and plate and the coaxial cylinders or Couette geometries. In this section we
focus on the experimental techniques for the measurement of blood and plasma shear
viscosity as well as yield stress and viscoelastic properties of blood.
• Blood and plasma shear viscosity. The foundations of blood rheology result
from a multiplicity of experiments performed using a range of “classical” instruments:
falling ball viscometer, capillary viscometer, tube viscometers and rotational rheometers
(Bishop et al. 2001; Rosencranz and Bogen 2006). Techniques such as the falling ball
viscometer, or the capillary tube, were widely employed in early investigations
(Rosencranz and Bogen 2006). For example, early measurements of plasma viscosity
were performed using a capillary viscometer, also known as Harkness viscometer
(Harkness 1971), which was recommended as a standard measuring method for plasma
viscosity (Haematology 1984) due to the simple and low-cost set-up, as well as the
small amount of sample required, and the short duration of the test. However, this
method is particularly suited for measurement of the viscosity of Newtonian fluids.
Currently, there are several commercially available instruments based on different
principles and techniques, which yield identical results if properly used (Baskurt et al.
2009). Commercially available rotational rheometers (Fig. 4a) are some of the most

11
versatile and commonly used devices for rheological characterization under shear. This
type of rheometers has seen important improvements over the years, but also presents
some disadvantages for measuring blood rheological properties, especially if to be used
in a medical context. These systems are, in general, bulky, complex to use, and time-
consuming. Issues related to the sedimentation of the cells and to the formation of a
cell-depleted layer near the walls need to be carefully monitored to avoid erroneous
measurements, particularly depending on the gap used for the measurement of blood
rheology, which can be minimized using roughened surfaces (Merrill 1969; Sousa et al.
2013).
Most of the “classic” measurement systems require a relatively high volume of blood;
usually more than 1 ml is necessary depending on the apparatus used. In order to
overcome this limitation, and reduce the measurement time, oscillating torsional
viscometers have been proposed, making blood rheological tests faster, more direct and
feasible (Mark et al. 2006; Eugster et al. 2007; Travagli et al. 2008). As an example,
Eugster et al. (2007) developed an oscillating viscometer based on a glass capillary
which only requires 7 µl of blood for measuring blood viscosity.
Figure 4 – near here
Automatic tube-type viscometers have also been developed (Kim et al. 2000; Alexy et
al. 2005) including a system able to measure the whole blood viscosity within 2 minutes
at shear rates ranging from 1 to 375 s-1 (Kim et al. 2000). A falling-ball viscometer (Fig.
4c), used to measure the shear viscosity of whole blood and RBC suspensions,
demonstrated high sensitivity to changes in blood viscosity, and can be useful clinically

12
for detecting abnormal blood viscosity values (Eguchi and Karino 2008) and thus can
potentially be converted into screening platforms (Mark et al. 2006).
• Yield stress. Different factors can affect the measurement of blood yield stress,
namely the torque accuracy and sensitivity of the instrument used at low shear rates, the
cell sedimentation and the plasma layer formation, which is particularly relevant at low
shear rates due to the formation of cell aggregates. Most of the yield stress values
reported in the literature were determined using an indirect technique by extrapolating
rheological data obtained using a Couette-type rheometer. In order to avoid the wall slip
phenomenon, Picart et al. (1998) used a Couette rheometer in which the measuring
system had roughened surfaces. Blood yield stress was also measured using a settling
technique (Charm and Kurland 1967) and by recording stress relaxation curves (Benis
and Lacoste 1968), both of which are direct measurement techniques. The values of the
blood yield stress reported in the literature present a significant variability, which can be
attributed to donor-to-donor variability, but also to deficiencies of the different
measurements methods used (Picart et al. 1998).
• Viscoelastic properties of blood. Properties such as the storage ( )G′ and loss
( )G′′ moduli (or alternatively the viscous ( )η′ and elastic ( )η′′ components of the
complex viscosity), are usually measured in small amplitude oscillatory shear flows
(SAOS). In this type of experiment, a part of the measurement geometry oscillates to a
preset maximum strain (an angle, typically small, in a rotational rheometer) and the
time-dependent response is measured. The imposed strain is small in order to keep the
sample microstructure unaffected, which allows probing the viscoelastic behavior in the
linear regime. In addition to the geometries commonly used for measuring other

13
rheological properties of blood, porous media have also been used to measure G′ and
G′′ . Porous media can exhibit tortuosity comparable to that of the vessels and were
used to determine Maxwell relaxation times and to assess the importance of the blood
elasticity relative to viscosity (Thurston and Henderson 2006). However, in this case,
the cell aggregation phenomenon occurs to a small extent due to the restricted space in
the pores, thus affecting the measurement of the complex viscosity. It is known that for
a tube dimension smaller than about ten red-blood-cell diameters the formation of a cell
depletion layer affects significantly the measurements (Thurston and Henderson 2006),
which may well hinder rheological measurements with this type of device. It is
important to note that the rheological measurements can be affected not only by the
confinement size of the geometry used but also by the possible sedimentation of the
RBC (Thurston and Henderson 2007), and proper care should be taken to minimize
these effects. The use of roughened surfaces is common to reduce wall slip and the
formation of a cell free layer at the wall and procedures that involve a homogenization
step have been proposed to minimize RBC sedimentation (Marton et al. 2001; Lee et al.
2007; Sousa et al. 2013).
LAOS tests can be used in the measurement of the nonlinear viscoelastic response of
blood, which can be associated with its internal structure. In LAOS (and SAOS), an
oscillatory shear stress or strain is imposed to the sample and the other one is
monitored, i.e. if the strain is imposed the shear stress is measured, and the viscous and
elastic components of the viscoelastic sample are quantified. The imposed variable
follows a sinusoidal evolution in time and for LAOS the corresponding response is no
longer sinusoidal, containing higher harmonic contributions. The odd harmonics are
related with the rheological response of the sample, while the even harmonics are due to
experimental deficiencies (Ewoldt et al. 2008; Hyun et al. 2011). A technique

14
commonly used to analyze the material response is the Fourier transform, which is used
to determine the storage and loss moduli of the viscoelastic sample (Hyun et al. 2011).
The elastic properties of blood plasma have also been measured under uniaxial
extensional flow (Brust et al. 2013). A capillary breakup extensional rheometer
(CaBER), similar to the commercial apparatus illustrated in Fig. 4b, was employed to
measure a characteristic relaxation time of blood in extensional flow. In this technique a
fluid sample is placed between two circular plates, which are separated by a small
distance and then the plates are separated and the liquid thread thins spontaneously until
the occurrence of breakup, under the combined action of capillary and extensional
resisting forces, which for viscoelastic fluids is essentially a viscoelastic force. The
diameter of the filament (D(t)) is monitored as function of time and for a viscoelastic
fluid, the filament diameter decreases exponentially and the relaxation time of the fluid
is determined by fitting the experimental data in the linear region of log[D(t)] as a
function of time. The drawback is that for fluids having a low viscosity and small
elasticity, the filament thinning is very rapid, inertia may not be negligible and it is
difficult to monitor filament time evolution with good resolution under these conditions.
In addition, in the final stage of the thinning process, the filament diameter is of the
order of a few microns, which is comparable to the RBC dimensions, and can lead to
inaccurate measurements for whole blood extensional rheology measurements.
2.1.2. Optical methods
An optical technique for measuring whole-blood viscosity based on laser-induced
capillary waves was introduced by Muramoto and Nagasaka (2011). Pulsed YAG laser
beams are used to heat the whole-blood sample and to generate a capillary wave, which
is then detected by a diffracted probing laser beam at the heated region. The intensity of

15
the diffracted probing beam is converted into viscosity and surface tension
measurements of the blood sample. Despite the short time and the small sample volume
required, a wide range of viscosities can be measured using this method.
Another method that was investigated involves fluorescent viscosity-sensitive dyes,
referred to as molecular rotors (Haidekker et al. 2002). Due to their high sensitivity,
spatial and temporal resolution, these molecular probes are a good alternative to
mechanical methods for measuring blood plasma viscosities. Upon photoexcitation, the
fluorescent molecules form twisted intramolecular charge transfer states.
Photoexcitation leads to an electron transfer and the quantum yield of a molecule rotor
increases with decreasing free volume of the solvent, which is related with viscosity.
The emission intensity of molecular rotors depends on the viscosity of the solvent. In
the measurements of whole blood viscosity, the use of fluorescent molecular rotors
shows some difficulties. In particular, blood protein binding may affect the
measurements (Akers et al. 2005), which are also affected by the optical properties of
the fluid, dye concentration and dye-solvent interactions. In addition, the use of
fluorescent sensors also requires a calibration of the measurement system.
2.2. Micro-scale rheological devices
2.2.1. Microfluidics for rheological measurements
Microfluidics is an interesting alternative to commercial viscometers and rheometers
and is gaining increased popularity. This technological field allows the miniaturization
of macro-systems into micro-devices, which can integrate different processes generating
point-of-care diagnostic devices that can be used in medicine and in life science

16
research besides applications in many other areas. The microchips typically used are
cheap to fabricate, easy to handle and use, require very small volume samples (typically
in the range between nano- and micro-liters) and consequently produce small amounts
of waste and can be combined with optical systems for visualization (Fig. 5a).
Figure 5 – near here
Microfluidic devices able to operate as blood viscometers have been developed in order
to overcome the drawbacks of the macro-scale devices and are a promising tool for use
in clinical practice because of their fast response and minimum fluid requirement. Such
micro-devices have been used to measure the shear viscosity (Srivastava et al. 2005;
Zeng and Zhao 2009; Smith et al. 2010) and viscoelasticity (Brust et al. 2013; Kang and
Lee 2013) of blood. Microfluidic viscometers are based on a range of different
principles as reviewed by Ong et al. (2010), such as capillary pressure-driven flow
(Srivastava et al. 2005), electrical impedance spectroscopy (Zeng and Zhao 2009),
laser-induced capillary wave (Taguchi et al. 2009) and oscillating micro-structure
induced by an electrostatic driving force (Smith et al. 2010). For instance, in the micro
viscometer proposed by Srivastava et al. (2005), which is illustrated in Fig.5c, the
pressure drop over the channel length is used to determine the plasma viscosity. The
device requires a sample volume of 600 nL and is able to perform the measurement in
less than 100 s. However, microfluidic devices often require a syringe pump or, in some
cases, a pressurized reservoir and connecting tubes to be combined with the microchip
in order to promote the blood flow, which typically implies larger sample volumes. An
exception is the micro-optical capillary sensor based on laser-induced capillary wave
developed by Taguchi et al. (2009), in which the sample is placed directly on the

17
sensor. Measurements using distilled water with a pigment have been performed for a
proof-of-concept, but the device is yet to be tested with real blood. Two potential
shortcomings of the method are the possible occurrence of sample evaporation and the
micro-sensor being affected by surrounding vibrations. Due to the reduced measurement
times required in these devices, it is expected that the addition of an anticoagulant to the
blood sample is less critical, although it continues to be used in some works (Zeng and
Zhao 2009). Interestingly, the shear rates reported in these investigations is in the
approximate range between 1 and 103 s-1, which is similar to the reliable range of shear
rates used in macro-scale apparatus.
It is well known that an adequate temperature control in the measurement of rheological
properties of blood is very important. Recently, a microfluidic viscometer that uses an
array of microchannels equipped with a temperature controller was developed by Kang
and Yang (2013). The temperature of the fluid within the channel was controlled using a
Peltier system, micro-sized thermocouples and a feedback controller, which increases
substantially the complexity of the microfabrication process. In addition, the micro-
device requires the use of a reference fluid and the blood viscosity is measured by
counting the number of indicating channels in the array which are filled with blood and
with the reference fluid.
In terms of viscoelasticity, Kang and Lee (2013) proposed to measure a characteristic
relaxation time of blood by controlling the transient blood flow in a microfluidic device
analogue of a Wheatstone bridge (Fig. 5b). The microfluidic channel consists of one
channel connecting two side channels and the characteristic time of blood, an important
parameter for evaluating blood viscoelasticity, is determined examining the area of the
connecting channel that is filled with blood for a certain pressure drop in both side
channels. The determination of the area of the channel filled with blood is based on

18
image processing. This type of micro-device avoids the use of integrated sensors in the
microchip and the need for calibration, although a reference fluid is required.
An interesting approach in microfluidics is taking advantage of the shape of the micro-
channel to impose controllable deformations. Recently, the blood plasma viscoelasticity
was assessed in a microchannel containing a contraction-expansion geometry (Fig. 5d)
in order to promote a strong extensional flow (Brust et al. 2013). Measurements of the
pressure drop in the channel revealed a nonlinear flow resistance with the increase of
plasma flow rate, which is a typical behavior of a viscoelastic fluid.
In order to study the effects of extensional flow on RBC deformation, microchannels
with a hyperbolic converging region (Fig5e) have been used due to the acceleration
imposed by the converging section (Lee et al. 2009; Yaginuma et al. 2013). Such type
of microfluidic devices that generate a strong extensional flow field are promising tools
that can be applied in the detection and diagnosis of several diseases related to RBC
deformability.
There are clear advantages of using microfluidics for measuring blood rheological
properties as discussed above, but there are also some drawbacks that need to be
considered, namely red blood cell clogging, measurement stability associated with weak
signals and reproducibility. In addition, the formation of the cell-free layer is an added
challenge in the rheological measurements at the micro-scale. Incidentally, Faivre et al.
(2006) found that in a microchannel with an abrupt contraction followed by an abrupt
expansion, the cellular content in the middle of the downstream channel increases 24%
for a flow rate of 200 µL/h and an initial hematocrit of 16 (v/v)%.

19
2.2.2. Microrheology and other micro-scale techniques
Microrheology techniques allow the measurements of the rheological properties of a
complex fluid from the motion of colloidal probes directly embedded in the sample
since the time-dependent trajectories of tracer particles dispersed in the fluid can be
related to the linear viscoelastic properties of that fluid (Yao et al. 2009). These
techniques, which can be divided between active and passive microrheology (cf. Table
1), are useful to perform in situ measurements and have also been used to assess the
elastic character of blood. Contrarily to microfluidics, microrheology techniques
typically do not require the use of accessories such as tubes and syringes for promoting
the fluid flow and only requires the volume sample to fill the sample chamber, using
volume samples of the order of 10 µL (Yao et al. 2009).
Active microrheology techniques involve the active manipulation of small probe
particles using external applied forcings, whereas in passive microrheology techniques
the tracer particles’ motion is induced by thermal fluctuations (Squires and Mason
2010). Active microrheology techniques typically use optical tweezers, magnetic
manipulation techniques or atomic force microscopy (Neuman and Nagy 2008).
Optical tweezers have been extensively used to investigate the mechanical (Dao et al.
2003; Lim et al. 2004; Li et al. 2009) and electrical properties of RBC (Fontes et al.
2011). In this non-invasive method, a highly focused beam of light focused through a
microscope objective attracts and traps a high refractive index particle as sketched in
Fig. 6a. Using optical tweezers it is possible to measure particle displacements of the
order of nanometers with applied forces in the pN range (Yao et al. 2009). The
technique requires a microscope and a high numerical aperture objective able to focus
efficiently the laser beam. When a cell is attached to such a trapped particle, moving the
focused laser beam forces the particle to move through the surrounding material,

20
Table 1. Microrheology and other micro-scale techniques used in the investigation of blood
viscoelasticity.
Technique Principle Measurement Advantages Disadvantages References
Act
ive
mic
rorh
eolo
gy Optical tweezers
Applied
external
forcing
Deformability/
viscoelastic
character of
RBC
Non-invasive;
Precise measure of pN forces;
Complex equipment required;
Non-uniform deformation
Dao et al. (2003); Lim et al. (2004); Li et al. (2009); Fontes et al. (2011) Magnetic
manipulation Non-invasive;
Selectivity of the magnetic beads
Difficult measurement;
Sensitivity
Puig-De-Morales-Marinkovic et al. (2007); Li et al. (2014)
Atomic force microscopy
Simple and rapid sample preparation;
pN resolution;
Measurements under near-physiological conditions
Large size and high stiffness of the cantilevers;
Possible interaction between AFM tip and molecule under study
Bremmell et al. (2006)
Pass
ive
mic
rorh
eolo
gy
Thermal fluctuations
Viscoelastic moduli of whole blood
Linear viscoelastic regime since there is no external stress applied
Requirements in the probes selection;
Temperature control
Campo-Deaño et al. (2013)
Oth
er te
chni
ques
Micropipette aspiration
Applied negative pressure
Mechanical properties of RBC
Simple technique;
For individual cells;
Precise measure of pN forces
Time-consuming Artmann et al. (1997)
Filtration Applied negative pressure
Deformability of RBC
Relatively simple instruments;
High reproducibility
Selectivity: feasible only for reasonably deformable cells;
Blockage of the pores
Koutsouris et al. (1988)
Rheoscopy
Shear flow Deformability of RBC
Visualization;
For individual cells
Complex design of the equipment
Dobbe et al. (2004)
Ektacytometry
Volume samples lower than 50 µL;
Measurement in less than 1 min
Complex equipment
Shin et al. (2007); Baskurt et al. (2009)
21
corresponding to the application of a local stress and the resultant displacement can be
converted in terms of viscoelastic response using image analysis. The accuracy of the
results depends on the precision of the image analysis technique which is typically of
the order of 1 pixel but sub-pixel resolution can be achieved to measure the mechanical
properties of RBC (Li et al. 2009).
Figure 6 – near here
Similarly to the optical tweezers, in magnetic twisting cytometry techniques spherical
beads are attached to the cell cytoskeleton in order to generate stresses. A torque is
applied to each bead, which causes the twist of the magnetic microparticle bounded to
the membrane receptor and the resultant bead rotation is measured. Magnetic twisting
cytometry generates larger range of stresses than in optical tweezers, in which a
unidirectional force is applied to a single attached bead. The nature and magnitude of
the applied stress in magnetic twisting torque cytometry and optical tweezers may lead
to differences in the results obtained using both techniques (Laurent et al. 2002). The
storage modulus of RBC was investigated using optical magnetic twisting cytometry
and its numerical analog, the twisting torque cytometry (Puig-De-Morales-Marinkovic
et al. 2007; Li et al. 2014).
Valuable information concerning physical properties, as well as alterations in RBC, can
be obtained using atomic force microscopy (AFM). This technique provides nanoscale
topographic resolution and has been used to investigate the elastic properties of RBC
(Bremmell et al. 2006). Micro-spheres are attached to a cantilever (Fig. 6b), which is
used to scan the sample surface. In a force profile mode, the probe approaches the cell
surface, contacts and then retracts. The force profile becomes nonlinear and reflects the

22
mechanical properties of the cells (Neuman and Nagy 2008). AFM allows
measurements of inter- and intra-molecular interaction forces with pN resolution.
Recently, Steffen et al. (2013) measured the dextran-induced aggregation of RBC using
atomic force microscopy-based single cell force spectroscopy. Different dextran
molecules were used and the corresponding interaction energy between red blood cells
was measured. The results obtained for the interaction energy can be described by the
depletion theory, although a detailed investigation of the cause for stronger adhesion
energies is still lacking.
Passive microrheology uses the Brownian motion of tracer particles to measure the
rheology and structure of a material. The mean squared displacement (MSD) of the
particles is measured and related to the viscosity of the material by the Stokes-Einstein
equation, which is valid for Newtonian fluids. For a viscoelastic material, the
generalized Stokes-Einstein relationship is used with the Newtonian viscosity replaced
by the frequency-dependent complex viscosity of the material (Squires and Mason
2010). Hence, the time-evolution of the MSD of tracers can be used to obtain the linear
viscoelastic moduli of the sample. Campo-Deaño et al. (2013) employed passive
microrheology techniques in order to measure the viscoelastic properties of whole blood
by measuring the storage and loss moduli. These techniques require the use of a
microscope and corresponding optical accessories. In addition, care must be taken when
choosing the colloidal probes in order to ensure its sphericity, polydispersity and the
absence of interactions between the particles and the medium (Breedveld and Pine
2003). In this type of measurements the temperature may be difficult to control or it
may be difficult to reach the physiological temperature, which is desirable for whole
blood measurements. Campo-Deaño et al. (2013) performed the measurements at 27 ºC
and used the time-temperature superposition method, which is a common practice in

23
polymeric samples when the range of temperatures is modest, to infer the viscoelastic
moduli of human blood at 37 ºC.
Micropipette aspiration techniques have been extensively used to measure the
mechanical properties of RBC membranes. Here, a glass micropipette is used to apply a
negative pressure onto the RBC membrane leading to the aspiration of the cell
membrane into the pipette and progressive membrane deformation is measured as a
function of time using optical microscopy. The internal diameter of the micropipette and
the applied pressure can be selected to control the extent of the deformation. The elastic
modulus, viscosity and characteristic time for relaxation of the cell membrane can be
determined by matching the experimentally observed changes of the cell, namely the
aspiration length, for a given pressure and configuration with analytical models (Dao et
al. 2003). Micropipette aspiration is an advantageous technique for mechanical
characterization of cells since it is simple, relatively inexpensive and can provide forces
as low as pN. Investigations of the human RBC membrane using this technique found
an implied in-plane shear modulus of 4-10mN/m, a relaxation time of 0.10-0.13 s and a
membrane viscosity of 0.6-2.7 µN.s.m-1 (Lim et al. 2004). However, in micropipette
aspiration, as well as in AFM and optical trap techniques, the deformation in
nonuniform.
Other techniques have been used for measuring RBC deformability, such as filtration
through pores of 3–5 µm in diameter with the transit time being determined during the
measurement; rheoscopy; and ektacytometry (Shin et al. 2007). In rheoscopy, the cells
are subject to simple shear flow in a rotating cone-plate system and a microscope is
required for focusing the middle plane between the cone and the plate. In ektacytometry
a laser beam is projected through a RBC suspension and the resulting diffraction pattern

24
analyzed in order to determine the RBC shape and consequently deformability. A
comparison between instruments commercially available for ektacytometry was
performed by Baskurt et al. (2009), using the LORCA (Laser assisted optical rotational
cell analyzer, Mechatronics Instruments BV, Zwaag, The Netherlands), the Rheodyn
SSD (Myrenne GmbH, Roetgen, Germany) and the RheoScan-D (RheoMeditech, Seoul,
Korea) systems. The LORCA (Fig. 6c2) and the Rheodyn SSD systems cannot be
strictly classified as micro-scale instruments given their characteristic dimensions; the
RheoScan-D (Fig. 6c1) on the other hand combines microfluidics with laser-diffraction
techniques. Shin et al. (2007) compared the deformability of RBC at various shear
stresses measured using the RheoScan-D and the LORCA systems and the results
obtained with both instrument were found to be in excellent agreement.
3. Hemorheology
Hemorheology deals with the flow and deformation behavior of blood and its formed
elements (Popel and Johnson 2005). The complex RBC aggregation and deformation
hysteretic processes have been extensively investigated and found to be relevant in the
context of hemorheology as discussed in the following sections. A list summarizing
relevant investigations on blood shear rheology performed in the last two decades is
presented in Table 2.
3.1. Steady shear viscosity of blood
The combined effects of aggregation and deformation of RBC impart a shear-thinning
rheological behavior to blood as illustrated in Fig. 7 and are known to be closely linked
to the presence of plasma proteins. In healthy human whole blood, RBC form
25
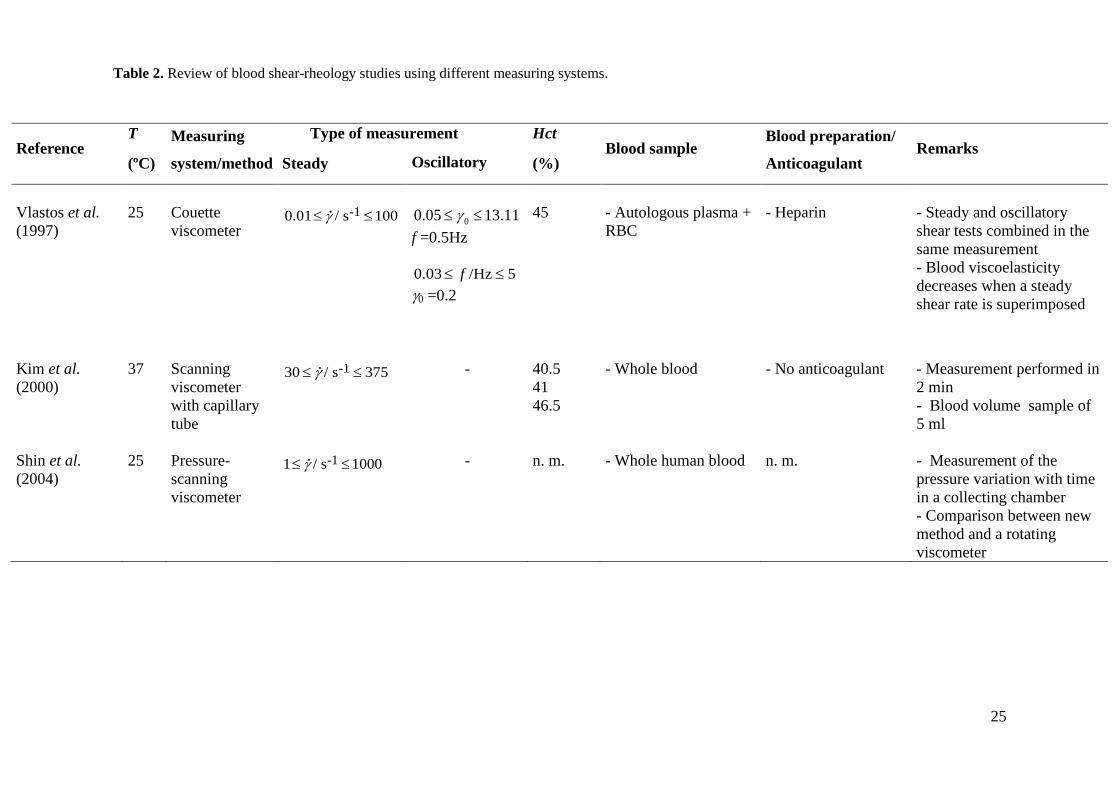
Table 2. Review of blood shear-rheology studies using different measuring systems.
Reference T
(ºC)
Measuring
system/method
Type of measurement Hct
(%) Blood sample
Blood preparation/
Anticoagulant Remarks
Steady Oscillatory
Vlastos et al. (1997)
25
Couette viscometer
-10.01 / s 100γ≤ ≤
00.05 13.11γ≤ ≤
f =0.5Hz 0.03 /Hz 5f≤ ≤ γ0 =0.2
45
- Autologous plasma + RBC
- Heparin
- Steady and oscillatory shear tests combined in the same measurement - Blood viscoelasticity decreases when a steady shear rate is superimposed
Kim et al. (2000)
37
Scanning viscometer with capillary tube
-130 / s 375γ≤ ≤
-
40.5 41 46.5
- Whole blood
- No anticoagulant
- Measurement performed in 2 min - Blood volume sample of 5 ml
Shin et al. (2004)
25
Pressure-scanning viscometer
-11 / s 1000γ≤ ≤
-
n. m.
- Whole human blood
n. m.
- Measurement of the pressure variation with time in a collecting chamber - Comparison between new method and a rotating viscometer

26
Table 2. (continued)
Reference T
(ºC)
Measuring
system/method
Type of measurement Hct
(%) Blood sample
Blood preparation/
Anticoagulant Remarks
Steady Oscillatory
Alexy et al. (2005)
37
Computerized scanning capillary viscometer
-11 / s 1500γ≤ ≤
-
28-56
- Whole blood - RBC in plasma
- EDTA
- Comparison between: new method and a cone-plate; new method and Couette
Mark et al. (2006)
37
Oscillating resonator probe
-
20-60
- RBC in Dextran 40 - RBC in Dextran 70
- EDTA
- Measurement system into the vacutainer tube for blood withdrawal - Comparison between new method and Couette system
Eugster et al. (2007)
37
Oscillating torsional resonator viscometer
-
20-60
- Whole blood
- EDTA
- Couette viscometer for comparison purposes
Eguchi and Karino (2008)
37
Falling ball viscometer
-
20-60
- Whole blood - RBC in serum - RBC in Tyrodes-albumin solution
- Sodium citrate
- Cone-plate viscometer for comparison purposes

27
Table 2. (continued)
Legend: n.m. – not mentioned; γ (s-1) – shear rate; f (Hz) – frequency; 0γ (-) – strain amplitude; G′ (Pa) – storage modulus; G′′ (Pa) – loss modulus; ω (rad s-1) –
angular frequency; LAOS – large amplitude oscillatory shear.
Reference T
(ºC)
Measuring
system/method
Type of measurement Hct
(%) Blood sample
Blood preparation/
Anticoagulant Remarks
Steady Oscillatory
Travagli et al. (2008)
37
Oscillating torsional viscometer
-
0-100
- Whole blood - RBC in plasma
- EDTA
- Rheometer with cone-plate geometry for comparison purposes
Muramoto and Nagasaka (2011)
37
Laser-induced capillary wave viscometer
-
(capillary wave)
39.2 44.6
- Whole blood
- Heparin
- Volume sample of 90 µl - Blood considered as Newtonian fluid
Campo-Deaño et al. (2013)
27
Passive microrheology
-
-13 / rad s 600ω< ≤
44
- Whole blood
- EDTA
- Viscoelasticity quantified in terms of G′ and G′′
Sousa et al. (2013)
37
Rotational rheometer Plate-plate (rough surface)
-11 / s 350γ≤ ≤
(LAOS)
41.3 41.6
- Whole blood
- EDTA
- Anticoagulant has no influence on rheological results - Viscoelastic behavior found with the viscous character more marked than the elastic one

28
aggregates at low shear rates and as a consequence blood resistance to flow is increased
with whole blood shear viscosity being about one hundred times higher than that of
water. Increasing the shear rate disrupts the aggregate structures above a critical shear
rate, leading to shear-thinning behavior, as shown in Fig. 7. An initial lower degree of
aggregation of RBC involves weaker attractive forces between the cells, causing a lower
critical shear rate at which disaggregation of the RBC occurs (Thurston 1979). As RBC
are dispersed, deformed and aligned with flow direction due to higher flow velocities
(shear rates), the shear viscosity decreases substantially by approximately two orders of
magnitude, as shown in Fig. 7 and its value is about three times the shear viscosity of
water.
The aggregation of normal RBC taking place at low shear rates leads to a higher
apparent viscosity than when RBC are suspended in a non-aggregating medium such as
11% (v/v) albumin-Ringer solution in plasma (Chien 1970). The differences between
the flow curves for normal blood and for a suspension of RBC in the albumin-Ringer
solution shown in Fig. 7 demonstrate the impact of cell aggregation on the shear-
thinning properties at low shear rates. Fig. 7 also shows that when erythrocytes harden,
as occurs in some diseases, the shear-thinning behavior is weakened or even lost due to
the lower capability of the hardened RBC to deform under shear and to form aggregates.
Figure 7 – near here
During a cardiac cycle the flow is pulsatile, with pressure and flow velocity varying in
time and space in the vascular network. Consequently, as a shear rate dependent
property, whole blood viscosity also changes in time and location. At low velocities, the
apparent viscosity of blood increases in bulk shear flow due to the reduced deformation

29
of RBC with decreasing levels of shear stress/rate and the tendency of RBC to
aggregate (Pozrikidis 2003).
Figure 8 compares blood viscosity measurements by different authors under steady
shear. Figure 8(a) includes data at different hematocrit levels, ranging from 41.2% to
51.7%, measured at the physiological temperature (37ºC) using different methodologies,
whereas Fig. 8(b) shows an overview of different flow curves measured at a range of
lower temperatures (T = 4ºC and 37ºC) but over a narrower range of hematocrit values,
from 41.3% to 46%. Due to the diversity of conditions used in different investigations,
namely the hematocrit levels, temperature of measurement, range of shear rates, or the
blood sample preparation method, it is difficult to make a direct comparison between
them. Nevertheless, the shear-thinning behavior of blood viscosity is clear and in spite
of the differences in the values of the Hct, the viscosity data obtained by different
authors agrees well, particularly at high shear rates, as shown in Fig. 8(a). It is important
to note that the data presented in Fig. 8 was obtained with human blood samples. Care
must be taken when comparing data obtained using animal blood due to the large
variation in size, heart rate, life style between animals as reviewed by Rampling (2007).
For instance, Johnn et al. (1992) found that the blood viscosity of 31 mammals
investigated may vary by some 2-fold at high shear rates and 18-fold at low shear rates
due to the variation in Hct and plasma viscosity.
Figure 8 – near here
Blood viscosity is affected by the variability of the characteristics inherent to the blood
donor as well as by the following important parameters:

30
• Hematocrit - It is well documented that blood steady shear viscosity increases
exponentially with the hematocrit, as illustrated in Fig. 9, and that the variation of the
viscosity is more pronounced at lower than at higher shear rates attesting the effect of
the hematocrit on the values of the viscosity and on the shear-thinning behavior
(Cokelet and Meiselman 2007).
Figure 9 – near here
• Temperature - The normal body temperature, also known as euthermia or
normothermia, is approximately 37 ºC, but lower temperatures are also important in
various medical procedures such as surgery and it is thus of significant importance to
understand the influence of temperature on the rheological properties of blood.
Many rheological measurements using human blood were conducted at low
temperatures and therefore significant differences in steady shear rheology are observed
(cf. Fig. 8(a) and 8(b)). The dependence of the viscosity on temperature in a narrow
range can be described mathematically using an Arrhenius type equation, known as
Andrade’s equation (Barnes 2000). Thurston (1996) measured the plasma viscosity as
well as the viscous and elastic components of the complex viscosity under oscillatory
flow conditions by applying a constant frequency of 2 Hz and a strain of 1 for
temperatures ranging from 9ºC to 42ºC. The equations found by Thurston, valid only for
the conditions described above, are summarized in Table 3.
The effect of temperature on RBC aggregation and deformability and consequently on
rheological properties of blood is also important. In fact, temperature plays a significant
role in terms of cell function and dynamics. As discussed previously, blood viscosity
increases with a decrease of temperature, while the aggregation index of RBC decreases

31
when temperature is decreased (Lim et al. 2010). This can be explained by the fact that
plasma viscosity increases when the temperature decreases and the rate of formation of
RBC aggregates is delayed, with plasma being considered as an attenuating medium for
RBC suspensions.
Table 3. Summary of the equations describing the variation of the plasma viscosity and of the
viscous and elastic components of the complex viscosity with temperature obtained by Thurston
(1996) in the range 9 < T [ºC] < 42.
Plasma Blood (Hct = 47 %)
0.01017 [ºC]plasma[mPa s] 3.362 10η −= × T
0.01264 [ºC] [mPa s] 21.47 10η −′ = × T
0.01022 [ºC] [mPa s] 4.213 10η −′′ = × T
In addition, temperature also plays a ubiquitous role in the deformability of intact
(Artmann et al. 1998) or pathologic (Mills et al. 2007) red blood cells. Artmann et al.
(1998) found that intact human RBC experience the passage through a 1.3 µm
micropipette only in the narrow range of temperatures of 36.4 ± 0.3ºC due to the
elastomeric fluid/gel-like transition of hemoglobin. Furthermore, the deformability of
pathologic RBC harboring Plasmodium falciparum is significantly reduced at febrile
temperatures (41ºC) compared with normal physiological temperature (Mills et al.
2007).
• Anticoagulant - The addition of anticoagulants for carrying out blood
measurements, which delays the blood coagulation and consequently allows for longer
measurement times, has been argued to change blood rheological properties when
inadequate concentrations are used. Sousa et al. (2013) showed recently that the use of

32
ethylenediaminetetraacetic acid (EDTA) at the maximum concentration (1.8 mg/ml)
recommended by the International Society for Clinical Hemorheology (Baskurt et al.
2009) has no significant influence upon the whole blood shear viscosity but care must
be taken regarding the type and amount of anticoagulant added to the blood sample.
The shear-thinning behavior is frequently modelled using a Generalized Newtonian
fluid (GNF) model with the blood shear-thinning viscosity described by simple
equations, such as: Ostwald-de Waele power law model, Carreau model, Carreau-
Yasuda model, Casson model, and Herschel-Bulkley model, see Table 4. These models
can describe accurately the shear-thinning behavior but are not able to account for
elasticity.
Table 4. Non-Newtonian fluid models commonly used to describe blood shear viscosity. Note
that the shear stress and shear rate are related asτ ηγ= .
Model Equation
Power Law 1nkη γ −=
Carreau - Yasuda ( )0
(1 )/[1 ]a n a
η ηη η
Λγ∞
∞ −
−= +
+
(The Carreau model is obtained using a = 2,
Cross
( )0
11 m
η ηη η Λγ
∞
∞
−=
− +
Casson 0 kτ τ γ= +
Herschel-Bulkley 0
nkτ τ γ= +
Legend: η ‒ shear viscosity; 0η ‒ zero-shear rate viscosity; η∞ ‒ viscosity at high shear rates; k –
consistency index; n – power law index; Λ ‒ time constant; m, a – dimensionless parameters; γ - shear
rate;τ - shear stress; 0τ - yield stress.

33
There are other more complex models that consider the viscoelastic characteristics of
blood. For example, Campo-Deaño et al. (2013) reported the fit to the shear viscosity as
well as the viscoelastic moduli of whole blood using two commonly used viscoelastic
multi-mode models, namely the simplified Phan-Thien-Tanner (sPTT) and the Giesekus
models, while Owens (2006) proposed a new and more complex model that describes
the viscoelastic behavior of blood. However, these more complex models that account
for viscoelasticity are not used as often precisely due to the increased complexity. For a
more complete description of blood rheology models the reader is referred to the
reviews by Yilmaz and Gundogdu (2008) and Campo-Deaño et al. (2015), who report
on more complex constitutive equations as well as on the parameters of the models that
better fit experimental data.
3.2. Blood thixotropy and yield stress
Thixotropy is the reduction of viscosity with time in a fluid sample subjected to a
constant shear rate (Barnes 2000), an effect which occurs due to shear-induced changes
in the fluid microstructure. Another manifestation of thixotropy is the hysteresis found
in fluid properties, such as the viscosity and shear stress, in a cycle of increase and
subsequent decrease in the imposed shear rate, as shown in Fig. 10. In the context of
blood rheology, thixotropy has been reported to occur (Dintenfass 1985) and has been
linked to the aggregation and disruption dynamics of the RBC structures, in particular
with the behavior and evolution of the rouleaux depending on the intensity and duration
of the applied stresses. An increase and subsequent decrease of shear rate results in
lower apparent viscosities than initially at the same shear rates, since RBC structures are
only formed at low shear rates and require some time to form, leading to hysteretic
behavior in the apparent shear viscosity. It is also important to notice that cell

34
sedimentation is faster with aggregates than with isolated RBC, and undue
consideration of their effect may lead to a misrepresentation of the thixotropic rheology
of blood.
Time-dependent changes of rheological properties of blood are of great importance to
describe the physiological conditions in the circulation, where blood experiences rapid
and cyclic changes from low to high shear flow conditions during the cardiac cycle. It is
important to note that larger vessels are those closer to the heart, where the time-
dependent effects are stronger on account of the proximity to the time-dependent
stimulus.
Figure 10 – near here
Some materials are characterized by a critical yield stress, which must be exceeded for
the material to flow. In a flow curve measured under steady shear flow, the yield stress
can be defined as the limiting shear stress when the shear rate approaches zero (cf. Fig.
10(b)). The measurement of the blood yield stress is useful for the diagnostic of
pathological conditions such as polycythemia (Merrill 1969), systemic sclerosis (Picart
et al. 1999) or diabetes (Radtke et al. 1984) since the values of the blood yield stress
when such diseases occur are higher than in healthy conditions. When blood is at rest,
attractive forces between cells arise, such as van der Waals forces, Coulombic forces
(Cheng and Evans 1965) and ion bridges or hydrogen bonds (Cho and Cho 2011).
Consequently, a critical pressure gradient is required to overcome the yield stress and
promote blood flow. Early studies established that the yield stress of blood is
independent of temperature in the range between 10 ºC and 37 ºC (Barbee 1973).
Subsequent investigations determined the blood yield stress indirectly by fitting the

35
Table 5. Summary of studies on whole blood yield stress 0( )τ : proposed correlations as
function of hematocrit level (Hct) and temperature of measurement (Tmeas) (note: 1 dyne cm-2 =
100 mPa).
Reference Correlations for yield stress Parameters
Merrill et al.
(1963)
-2 30 0[dyne cm ] ( )y cHct Hctτ τ= −
-2y0
30 / % 50
0.008 dyne cm
1.3 (critical hematocrit) / % 6.5c
Hct
Hct
τ
≤ ≤
≈
≤ ≤
-20[dyne cm ] bHctaeτ =
50%, - empirical constants
Hcta b
>
10 ≤ Tmeas / ºC ≤ 37
Chien et al.
(1966)
-2 30 0[dyne cm ] ( )y cHct Hctτ τ= −
1/3 -2/380%
0.007 dyne cm3.2 %
Hct
ab
<
==
-2 ( )0[dyne cm ] aHct beτ +=
80% = 0.058 = 6.36 %
Hctab
>
Tmeas = 37 ºC
Zydney et al.
(1991)
-2 30 0[dyne cm ] ( 0.05)y Hctτ τ= −
-20 0.71 dyne cmyτ =
Tmeas = 37 ºC
Picart et al.
(1998)
30 0[mPa] y Hctτ τ=
0
0.53 0.9526.87 mPay
Hctτ
≤ ≤=
Tmeas = 25 ºC

36
experimental shear stress-shear rate data to generalized Newtonian models (such as the
Casson model represented in Table 4) that incorporate a yield stress. Correlations
reported by different authors for fitting blood yield stress as a function of hematocrit
level are presented in Table 5. In spite of the efforts to determine the yield stress of
blood, the results show considerable scatter since it is highly influenced by the
hematocrit level, fibrinogen and RBC deformability. Moreover, the different
experimental methods used and the complexity of blood contribute to the inconsistency
between the values measured by different authors. In any case, it is clear that the blood
yield stress is very low, of the order of 10-3 Pa for Hct in the range of 40% - 50% (Picart
et al. 1998; Lee et al. 2011). Recently, it was found that yield stress is an onset
phenomenon, which only occurs when the hematocrit exceeds a critical value, which in
turn depends on the fibrinogen concentration (Apostolidis and Beris 2014).
3.3. Blood viscoelasticity
The viscoelasticity of blood is associated with its two-phase nature as well as with the
morphological and elastic properties of the discrete phases, namely the RBC. Complex
viscoelastic properties of RBC were reported by Puig-De-Morales-Marinkovic et al.
(2007) and Li et al. (2014) when membrane rheology was investigated experimental and
numerically using optical magnetic twisting torque cytometry or twisting torque
cytometry, respectively. The interactions between the lipid bilayer and the cytoskeleton
play an important role in the viscoelastic properties of RBC membrane and allow the
cells to flow through capillaries of small diameter (Li et al. 2014). As a consequence, it
comes as no surprise that the elastic behavior of blood generally increases with
hematocrit level due to increasing cell interactions. For shear rates ranging from 1 s-1 to
10 s-1 the viscous component of the complex viscosity increases exponentially with

37
hematocrit whereas its elastic component increases nearly proportionally to the cube of
the hematocrit. For shear rates above 10 s-1, both viscous and elastic components of the
complex viscosity increase exponentially with hematocrit (Thurston 1996).
Measurements of blood viscoelasticity have focused mostly on shear flow experiments
including SAOS (Thurston 1972; Thurston 1996; Thurston and Henderson 2007) and,
only more recently, LAOS (Sousa et al. 2013) and passive microrheology (Campo-
Deaño et al. 2013). Recent studies have also recognized the importance of the
rheological behavior of plasma and blood under extensional flow (Brust et al. 2013).
Small amplitude oscillatory shear (SAOS)
SAOS tests are commonly used to characterize the frequency dependence of the
rheological behavior of a material. Considering a fixed oscillatory maximum strain, the
viscous and elastic components of the blood complex viscosity decrease moderately
with an increase of the frequency of oscillation (Thurston 1996) as shown in the inset of
Fig. 11. Varying parameters such as hematocrit level or the RBC characteristics, namely
deformability and aggregation, lead to modifications of the viscoelastic properties of
blood as reviewed by Thurston and Henderson (2007).
Since blood viscoelasticity has a significant impact on blood flow, in particular on the
propagation of the pressure pulse generated by the heart in the arterial system (Thurston
and Henderson 2007), most of the works do not focus only on these fundamental
measurements alone, but combine them with other rheological tests to create more
realistic kinematic flow conditions as discussed in the following sections.
Figure 11 – near here

38
Most of the measurements, and in particular those discussed in relation to Fig. 11, were
carried out at flow conditions mimicking real pulsatile flow, with oscillatory flow
superimposed onto a steady flow (Thurston 1979; Thurston 1996; Thurston and
Henderson 2007). Thurston (1979) measured the viscous and elastic components of the
complex viscosity under oscillatory flow conditions by applying a constant frequency
(f = 2 Hz) and varying the deformation applied to the sample. Additionally, a frequency
sweep at constant strain amplitude was also performed. At low shear rates,
viscoelasticity is dominated by the aggregation characteristics of RBC, but when the
shear rate increases, RBC orient in the flow direction and aggregation is reduced.
Although accompanied by the disruption of the aggregates of RBC at high shear rates, it
is the deformability of RBC that becomes the main cause of the viscoelastic properties
of blood.
Vlastos et al. (1997) investigated the blood response in steady and in SAOS using a
strain amplitude sweep at a constant frequency of 0.5 Hz, as well as under a frequency
sweep at constant strain amplitude. Constant steady shear rates were superimposed
during oscillatory shear measurements in order to analyze their combined effect on the
viscoelastic characteristics. The authors observed that increasing the steady shear rate
component leads to a decrease of both viscous and elastic components due to the
reduction of RBC aggregation by a non-zero average shear rate with the elastic
component experiencing the highest decrease. Thurston and Henderson (2007)
determined the Maxwell relaxation times of blood samples (Hct = 44%) from
oscillatory measurements at 2 Hz and 22 ºC and showed how the blood characteristic
time scale is associated with the structure and breakup of RBC aggregates (Thurston
1979). As depicted in Fig. 12, the Maxwell relaxation time reaches a plateau at low
shear rates, which is explained by the formation of RBC aggregates. When the shear
39
rate is increased, the cell aggregates become progressively smaller and relax faster. For
high shear rates, the aggregates no longer exist and the RBC deform and align with the
flow leading to a further decrease of the relaxation time (Thurston and Henderson
2007).
Figure 12 – near here
Thurston and Henderson (2006) showed experimentally that the Maxwell relaxation
time increases when the cell deformability is decreased and the aggregation is increased,
as in pathologic blood. Moreover, the influence of the flow geometry on blood
viscoelasticity was also investigated by the same authors, who found that in small
vessels, represented by microtubes, the elastic component of the complex viscosity
increases for high shear rates, showing a shear-thickening behavior.
Recently, Campo-Deaño et al. (2013) used passive microrheology to measure the
storage and loss moduli of whole blood at 27 ºC and Hct = 44%, confirming the non-
negligible elastic behavior of whole blood (cf. Fig. 13).
Figure 13 – near here
Large amplitude oscillatory shear measurements (LAOS)
Sousa et al. (2013) recently investigated the response of whole human blood under
LAOS. Strain amplitudes of 10, 50 and 100 were imposed and the measurements were
performed at the physiological temperature, T = 37 ºC. Lissajous-Bowditch plots were
used to quantify the nonlinear viscoelastic properties and to determine the parameters
that relate the shear stress response of the blood sample with strain or shear rate. These
40
parameters, presented in Table 6, are the minimum elastic modulus ( )MG′ , the large
strain elastic shear modulus ( )LG′ , the minimum-rate dynamic ( )Mη′ and large-rate
dynamic viscosities ( )Lη′ , the strain-stiffening ratio (S) and the shear-thickening ratio
(T). The elastic shear moduli ( , )M LG G′ ′ represent the local elastic response of a sample
at small and large instantaneous strains and the minimum and large-rate dynamic
viscosities ( , )M Lη η′ ′ give information about the instantaneous viscosities at the smallest
and largest shear rates of an oscillatory test, respectively. Further details of the physical
meaning of these parameters can be found in Ewoldt et al. (2008) and Hyun et al.
(2011). For the rheological conditions investigated, whole blood revealed intra-cycle
strain-stiffening (S>0) and intra-cycle shear-thinning behavior (T>0). The Lissajous-
Bowditch plots of ( )τ γ and ( )τ γ presented in Fig. 14 for an angular frequency of 0.1
rad s-1 illustrate the viscoelastic character of blood, since the internal area of ( )τ γ and
( )τ γ represent the loss and storage energies, respectively. For the higher strain
amplitudes tested (50 and 100), the nearly circular shape of the ( )τ γ plots reveal a
dominant viscous behavior, which is confirmed by the small internal area of the
( )τ γ plot. For the lower strain amplitude tested, 10γ = , both Lissajous-Bowditch plots
demonstrate a viscous and elastic character, but the viscous effects are still dominant.
These rheological data were recently used by Apostolidis et al. (2015) for validation
purposes of a blood flow model in the transient shear regime. The viscoelastic model
captured the main features observed experimentally by Sousa et al. (2013) for both
elastic and viscous components of blood, when the amplitude or frequency of oscillation
was varied. However, due to its simplicity and the use of a number of fitting parameters,
which were not always obtained from experimental data, only a semi-quantitative
agreement between the results of both investigations is observed. Additionally, the

41
viscoelastic model was able to capture the thixotropic behavior of blood, but has a
limited region of applicability, working only at low to moderate shear rates ( 1~γ s-1)
due to the isotropic microstructure assumed for blood.
Table 6. Elastic moduli ( and )M LG G′ ′ , dynamic viscosities ( and )M Lη η′ ′ and dimensionless
indices of nonlinearity (S and T) obtained by Sousa et al. (2013) for two different strain
amplitudes and angular velocities.
γ
[−]
ω
[ rad s-1]
G'M
[Pa]
G'L
[Pa]
S
[−]
η'M
[Pa s]
η'L
[Pa s]
T
[−]
10 0.158 2.50×10⁻³ 5.84×10⁻³ 0.572 1.77×10⁻² 1.61×10⁻² -0.100
100 1.0 -6.50×10⁻⁴ -7.50×10⁻⁴ 0.133 4.04×10⁻³ 2.85×10⁻³ -0.417
Figure 14 – near here
Extensional flow measurements
It is well known that extensional properties should also be considered in the rheological
characterization of complex fluids, as for example in DNA or polymer solutions (Larson
2005). In particular, it is of utmost interest to determine the relaxation time of whole
blood in extensional flow to complement the existing rheological shear data. For
example, Sousa et al. (2011) investigated the flow of two well-established blood
analogue solutions through micro-contractions, and showed that despite their similar
steady shear viscosity curves, their behavior is significantly different when subjected to
extensional flow conditions comparable to those in the microcirculation. In this respect,
it is important to note the scarcity of works investigating the flow behavior of blood
under extensional flows. To the best of our knowledge, the only investigation of the

42
relaxation time of human whole blood in extensional flow is the recent work of Brust et
al. (2013), where a characteristic CaBER relaxation time λc = 7.8 ± 0.6 ms at 37ºC is
reported. However, no details of the measurements are provided and a more detailed
investigation of this property, involving different physiological parameters, is still
lacking. Interestingly, the authors found clear evidence of viscoelastic behavior when
the blood plasma was subjected to elongational flow in a capillary breakup extensional
rheometer. On the other hand, under steady shear flow, the human plasma showed a
constant shear viscosity suggesting a Boger-like behavior, but evidence of viscoelastic
behavior was also observed in microfluidic experiments using a contraction/expansion
geometry. Brust et al. (2013) confirmed that viscoelastic behavior is not due to a protein
surface layer but rather due to the elongational properties of the proteins, similarly to
the phenomenon that occurs when adding a small amount of polymer to a solvent
(Sousa et al. 2010) or even to a suspension (comparable to whole blood) (Barnes 2003)
conferring a slight viscoelastic behavior. Investigating the whole blood behavior under
strong elongational flow will certainly bring better insight about its elastic nature.
4. Concluding remarks and future directions
This review summarizes fundamental concepts and important investigations on
hemorheology. The main factors that can lead to an alteration of blood rheology, and
which have a significant impact on the normal physiological behavior of blood, are
discussed. Quantitative comparisons of different studies are also provided in tabular
form. A deviation of the whole blood viscosity from normal values can be linked with
specific diseases, thus making blood viscosity a material function that can be used to
identify various pathologies. Blood exhibits viscoelastic characteristics but these
43
properties are less investigated. The vast majority of viscoelastic measurements were
performed under steady and small amplitude oscillatory shear flow conditions. Blood
characterization under extensional flow and large amplitude oscillatory shear flow has
been investigated only recently despite the recognized relevance of these nonlinear
canonical flows in hemodynamics, e.g. LAOS measurements are relevant as pulsating
blood flow under normal flow conditions is subject to large amplitude deformations.
Due to the complexity of blood flow, some simplifications are frequently assumed in
hemodynamic studies. A significant number of investigations consider blood as a
Newtonian fluid in spite of its non-Newtonian properties being well documented in the
literature, while some works focus on cell behavior rather than on whole blood flow.
Nevertheless, there has been a growing interest and increased efforts devoted to the
investigation of whole blood rheological behavior under more realistic flow conditions.
Blood flow in small vessels shows complex flow features not observed at the macro-
scale with enhanced non-Newtonian fluid flow characteristics, such as viscoelasticity.
The increasing interest in microfluidics and the advances in the field in recent years,
motivated among others by the development of micro-devices in the medical field,
constitute an interesting framework for hemodynamic experiments. Furthermore, lab-
on-a-chip technology combines portability, integration and automation in a single chip,
and is thus a promising platform for point-of-care devices, which may be particularly
useful for detection and diagnosis of circulatory disorders.
Future directions
Despite notorious advances there are still many important research challenges and
opportunities to be explored in hemorheology, including better characterization and
deeper understanding of the behavior of individual components of blood such as the

44
rheology of plasma and whole blood under different flow conditions, and in particular
in diseased states to improve diagnostics, but also in terms of instrumentation and
methodologies, in order to translate the measurements and simulations performed in
research laboratories into a clinical context. In the near future, it will be possible to
move toward the development and implementation of novel clinical micro-devices to be
employed in medical diagnosis of hematological and cardiovascular diseases. However,
there are still several fundamental topics that require further investigation for these
applications to become routine:
i. Plasma rheology under extensional flow conditions. Recent investigations
showed a viscoelastic behavior in extensional flow, and constant viscosity in
shear flow measurements (Brust et al. 2013). Further insight into plasma
rheology in extensional flow and in combined shear and extensional flow is
required in order to better characterize its rheological behavior.
ii. Whole blood rheology in extensional flow or in combined shear and
extensional flows should also be investigated in order to better assess its
viscoelastic nature. It is known that blood only has a slight elastic character
(Brust et al. 2013; Sousa et al. 2013), but a thorough quantitative
characterization under extensional flow is still missing. So far, a characteristic
CaBER relaxation time λc = 7.8 ± 0.6 ms at 37ºC was reported (Brust et al.
2013) but a more detailed investigation of this property, involving different
physiological parameters, should be carried out. In addition, studying whole
blood under extensional flow will allow analyzing RBC deformability in more
detail.

45
iii. Blood yield stress values reported so far present some inconsistences due to the
different methods used for measuring this property in addition to the inherent
variability because of its dependency on physiological conditions. Further
investigations of this property under well controlled conditions, in particular
using direct measurements, are needed to obtain more accurate values and
unveil the reasons for these inconsistencies.
iv. Red blood cell aggregation, which is of the upmost important phenomena in
hemodynamics, is not yet fully understood. Unraveling the mechanism involved
in cell adhesion and consequently in rouleaux formation remains an important
challenge. A recent study shows that dextran-induced RBC aggregation is
explained based on depletion effects (Steffen et al. 2013) but consideration of
other macromolecules, in particular fibrinogen, an important plasma
constituent, is still lacking. The same study indicates that bridging effects can
describe the adhesion mechanisms for contact times longer than a few seconds,
which needs to be confirmed.
v. RBC deformability. Since it is now recognized that several pathologies lead to
alteration of the mechanical properties of RBC and to changes of blood
rheology, investigating RBC deformability and blood rheological properties of
unhealthy human blood in shear and extensional flows, with control of the
disease condition, is needed to develop diagnostic procedures. For example,
microfluidic devices composed of hyperbolic shaped contractions (Lee et al.
2009; Yaginuma et al. 2013) have been used to investigate normal and altered

46
RBC. Other fluidic devices with customized shapes can be used to generate
different (and relevant) flow conditions in which RBC are stretched. In
particular, microfluidics devices that offer easy and inexpensive fabrication
have great potential to be used in the assessment of RBC behavior.
vi. Micro-rheological studies. The small quantities of sample employed in these
techniques make them very interesting for blood characterization, but it should
be investigated how far these can be used for the measurement of rheological
properties, in spite of the occurrence of the Fåhræus effect. It is also important
to understand how to extrapolate the rheological properties obtained to
conditions in which the plasma layer is not formed. In addition, further work on
blood dynamics at the micro-scale should be considered in order to capture
possible flow phenomena not easily achieved at the macro-scale. Microfluidics
can be a valuable platform to develop micro-total analysis systems, which
combines portability and automation for a rapid and efficient analysis of a small
blood sample drawn from the patient. Examples representative of its effective
potential are the lab-on-a-CD systems for biochemical (Lee et al. 2011) or
electrochemical bioanalysis or blood separation (Li et al. 2013) using only
whole blood volume samples of the order of 10-100 µL or even a cytometry
platform developed using a cell-phone (Zhu et al. 2013), to mention only a few.
Acknowledgements
P. C. Sousa thanks Fundação para a Ciência e a Tecnologia (FCT) the financial support
through POPH/FSE and national funding from MEC (fellowship
SFRH/BPD/75258/2010). M. S. N. Oliveira acknowledges the support from the U. K.

47
Engineering and Physical sciences Research Council (EPSRC) under the auspices of
grant EP/L013118/1.
48
References
Akers, W. J., J. M. Cupps and M. A. Haidekker, 2005, Interaction of fluorescent molecular rotors with blood plasma proteins, Biorheology 42, 335-344.
Alexy, T., E. Pais, R. B. Wenby, W. Hogenauer, K. Toth, H. J. Meiselman and K. R. Kensey, 2005, Measurement of whole blood viscosity profiles via an automated viscometer: Technical details and clinical relevance, Clin Lab 51, 523-529.
Alexy, T., R. B. Wenby, E. Pais, L. J. Goldstein, W. Hogenauer and H. J. Meiselman, 2005, An automated tube-type blood viscometer: Validation studies, Biorheology 42, 237-247.
Apostolidis, A. J., M. J. Armstrong and A. N. Beris, 2015, Modeling of human blood rheology in transient shear flows, J Rheol 59, 275-298.
Apostolidis, A. J. and A. N. Beris, 2014, Modeling of the blood rheology in steady-state shear flows, J Rheol 58, 607-633.
Artmann, G. M., C. Kelemen, D. Porst, G. Buldt and S. Chien, 1998, Temperature transitions of protein properties in human red blood cells, Biophys J 75, 3179-3183.
Artmann, G. M., K. L. P. Sung, T. Horn, D. Whittemore, G. Norwich and C. Shu, 1997, Micropipette aspiration of human erythrocytes induces echinocytes via membrane phospholipid translocation, Biophys J 72, 1434-1441.
Barbee, J. H., 1973, The effect of temperature on the relative viscosity of human blood, Biorheology 10, 1-5.
Barnes, H. A., 2000, Handbook of Elementary Rheology, Institute of Non-Newtonian Fluid Mechanics, University of Wales Aberystwyth, U. K.
Barnes, H. A., 2003, A review of the rheology of filled viscoelastic systems. Rheology Reviews, D. M. Binding and K. Walters, The British Society of Rheology, 1 – 36, Aberystwyth,U.K.
Baskurt, O. K., M. Boynard, G. C. Cokelet, P. Connes, B. M. Cooke, S. Forconi, F. Liao, M. R. Hardeman, F. Jung, H. J. Meiselman, G. Nash, N. Nemeth, B. Neu, B. Sandhagen, S. Shin, G. Thurston and J. L. Wautier, 2009, New guidelines for hemorheological laboratory techniques, Clin Hemorheol Microcirc 42, 75-97.
Baskurt, O. K., M. R. Hardeman, M. Uyuklu, P. Ulker, M. Cengiz, N. Nemeth, S. Shin, T. Alexy and H. J. Meiselman, 2009, Comparison of three commercially available ektacytometers with different shearing geometries, Biorheology 46, 251-264.
Benis, A. M. and J. Lacoste, 1968, Study of Erythrocyte Aggregation by Blood Viscometry at Low Shear Rates Using a Balance Method, Circ Res 22, 29-42.
Bingham, E. C. and H. Green, 1919, Paint a plastic material and not a viscous liquid; the measurement of its mobility and yield value, American Society of Testing Materials.
Bishop, J. J., A. S. Popel, M. Intaglietta and P. C. Johnson, 2001, Rheological effects of red blood cell aggregation in the venous network: A review of recent studies, Biorheology 38, 263-274.
Breedveld, V. and D. J. Pine, 2003, Microrheology as a tool for high-throughput screening, J Mater Sci 38, 4461-4470.
Bremmell, K. E., A. Evans and C. A. Prestidge, 2006, Deformation and nano-rheology of red blood cells: An AFM investigation, Colloids Surf B 50, 43-48.
Brust, M., C. Schaefer, R. Doerr, L. Pan, M. Garcia, P. E. Arratia and C. Wagner, 2013, Rheology of Human Blood Plasma: Viscoelastic Versus Newtonian Behavior, Phys Rev Lett 110, 078305.

49
Campo-Deaño, L., R. P. A. Dullens, D. G. A. L. Aarts, F. T. Pinho and M. S. N. Oliveira, 2013, Viscoelasticity of blood and viscoelastic blood analogues for use in polydymethylsiloxane in vitro models of the circulatory system Biomicrofluidics 7, 034102.
Campo-Deaño, L., M. S. N. Oliveira and F. T. Pinho, 2015, A review of computational hemodynamics in middle cerebral aneurysms and rheological models for blood flow, Appl Mech Rev 67, 030801.
Caro, C. G., T. J. Pedley and W. A. Seed, 1974, Mechanics of the circulation. Cardiovascular Physiology, A. C. Guyton, Medical and Technical Publishers, 394-395, London.
Charm, S. E. and G. S. Kurland, 1967, Static Method for Determining Blood Yield Stress, Nature 216, 1121-1123.
Cheng, D. C. H. and F. Evans, 1965, Phenomenological Characterization of Rheological Behaviour of Inelastic Reversible Thixotropic and Antithixotropic Fluids, Brit J Appl Phys 16, 1599-1617.
Chien, S., 1970, Shear Dependence of Effective Cell Volume as a Determinant of Blood Viscosity, Science 168, 977-979.
Chien, S., S. Usami, H. M. Taylor, J. L. Lundberg and M. I. Gregerse, 1966, Effects of Hematocrit and Plasma Proteins on Human Blood Rheology at Low Shear Rates, J Appl Physiol 21, 81-87.
Cho, Y. I. and D. J. Cho, 2011, Hemorheology and microvascular disorders, Korean Circ J 41, 287-295.
Cokelet, G. R. and H. J. Meiselman, 2007, Macro- and Micro-Rheological Properties of Blood. Handbook of hemorheology and hemodynamics, O. K. Baskurt, M. R. Hardeman, M. W. Rampling and H. J. Meiselman, IOS Press, 45-71, Amsterdam.
Dao, M., C. T. Lim and S. Suresh, 2003, Mechanics of the human red blood cell deformed by optical tweezers, J Mech Phys Solids 51, 2259-2280.
Dintenfass, L., 1979, Clinical Applications of Blood-Viscosity Factors and Functions - Especially in the Cardiovascular Disorders, Biorheology 16, 69-84.
Dintenfass, L., 1985, Blood viscosity, hyperviscosity & hyperviscosaemia, MTP Press, Lancaster (Lancashire).
Dobbe, J. G. G., M. R. Hardeman, G. J. Streekstra and C. A. Grimbergen, 2004, Validation and application of an automated rheoscope for measuring red blood cell deformability distributions in different species, Biorheology 41, 65-77.
Drasler, W. J., C. M. Smith and K. H. Keller, 1989, Viscoelastic Properties of the Oxygenated Sickle Erythrocyte-Membrane, Biorheology 26, 935-949.
Eguchi, Y. and T. Karino, 2008, Measurement of rheologic property of blood by a falling-ball blood viscometer, Ann Biomed Eng 36, 545-553.
Eugster, M., K. Hausler and W. H. Reinhart, 2007, Viscosity measurements on very small capillary blood samples, Clin Hemorheol Microcirc 36, 195-202.
Ewoldt, R. H., A. E. Hosoi and G. H. McKinley, 2008, New measures for characterizing nonlinear viscoelasticity in large amplitude oscillatory shear, J Rheol 52, 1427-1458.
Fahraeus, R., 1929, The suspension stability of the blood, Physiol Rev 9, 241-274. Fahraeus, R. and T. Lindqvist, 1931, The viscosity of the blood in narrow capillary
tubes, Am J Physiol 96, 562-568. Faivre, M., M. Abkarian, K. Bickraj and H. A. Stone, 2006, Geometrical focusing of
cells in a microfluidic device: An approach to separate blood plasma, Biorheology 43, 147-159.
50
Fischer, T. M., M. Stohr-Lissen and H. Schmid-Schonbein, 1978, The red cell as a fluid droplet: tank tread-like motion of the human erythrocyte membrane in shear flow, Science 202, 894-896.
Fontes, A., M. L. B. Castro, M. M. Brandao, H. P. Fernandes, A. A. Thomaz, R. R. Huruta, L. Y. Pozzo, L. C. Barbosa, F. F. Costa, S. T. O. Saad and C. L. Cesar, 2011, Mechanical and electrical properties of red blood cells using optical tweezers, J Opt 13, 044012.
International Committee for Standardisation in Haematology, 1984, Recommendation for a selected method for the measurement of plasma viscosity, J Clin Pathol 37, 1147-1152.
Haidekker, M. A., A. G. Tsai, T. Brady, H. Y. Stevens, J. A. Frangos, E. Theodorakis and M. Intaglietta, 2002, A novel approach to blood plasma viscosity measurement using fluorescent molecular rotors, Am J Physiol-Heart C 282, H1609-H1614.
Harkness, J., 1971, The viscosity of human blood plasma; its measurement in health and disease, Biorheology 8, 171-193.
Hess, W. R., 1915, Does blood obey the general streaming-law of liquids?, Pflug Arch Ges Phys 162, 187-224.
Hyun, K., M. Wilhelm, C. O. Klein, K. S. Cho, J. G. Nam, K. H. Ahn, S. J. Lee, R. H. Ewoldt and G. H. McKinley, 2011, A review of nonlinear oscillatory shear tests: Analysis and application of large amplitude oscillatory shear (LAOS), Prog Polym Sci 36, 1697-1753.
Jan, K. M., S. Chien and J. T. J. Bigger, 1975, Observations on blood viscosity changes after acute myocardial infarction, Circulation 51, 1079-1084.
Johnn, H., C. Phipps, S. Gascoyne, C. Hawkey and M. W. Rampling, 1992, A Comparison of the Viscometric Properties of the Blood from a Wide-Range of Mammals, Clin Hemorheol 12, 639-647.
Kang, Y. J. and S. J. Lee, 2013, Blood viscoelasticity measurement using steady and transient flow controls of blood in a microfluidic analogue of Wheastone-bridge channel, Biomicrofluidics 7.
Kang, Y. J. and S. Yang, 2013, Integrated microfluidic viscometer equipped with fluid temperature controller for measurement of viscosity in complex fluids, Microfluid Nanofluid 14, 657-668.
Kim, S., Y. I. Cho, A. H. Jeon, B. Hogenauer and K. R. Kensey, 2000, A new method for blood viscosity measurement, J Non-Newtonian Fluid Mech 94, 47-56.
Koenig, W., M. Sund, B. Filipiak, A. Doring, H. Lowel and E. Ernst, 1998, Plasma viscosity and the risk of coronary heart disease - Results from the MONICA-Augsburg cohort study, 1984 to 1992, Arterioscl Throm Vas 18, 768-772.
Koutsouris, D., R. Guillet, J. C. Lelievre, M. T. Guillemin, P. Bertholom, Y. Beuzard and M. Boynard, 1988, Determination of Erythrocyte Transit Times through Micropores .1. Basic Operational Principles, Biorheology 25, 763-772.
Langstroth, L., 1919, Blood viscosity. I. Conditions affecting the viscosity of blood after withdrawal from the body., J Exp Med 30, 597-606.
Larson, R. G., 2005, The rheology of dilute solutions of flexible polymers: Progress and problems, J Rheol 49, 1-70.
Laurent, V. M., S. Henon, E. Planus, R. Fodil, M. Balland, D. Isabey and F. Gallet, 2002, Assessment of mechanical properties of adherent living cells by bead micromanipulation: Comparison of magnetic twisting cytometry vs optical tweezers, J Biomech Eng-T Asme 124, 408-421.

51
Le Devehat, C., M. Vimeux and T. Khodabandehlou, 2004, Blood rheology in patients with diabetes mellitus, Clin Hemorheol Micro 30, 297-300.
Lee, B. K., T. Alexy, R. B. Wenby and H. J. Meiselman, 2007, Red blood cell aggregation quantitated via Myrenne aggregometer and yield shear stress, Biorheology 44, 29-35.
Lee, B. K., S. Xue, J. Nam, H. Lim and S. Shin, 2011, Determination of the blood viscosity and yield stress with a pressure- scanning capillary hemorheometer using constitutive models, Korea-Aust Rheol J 23, 1-6.
Lee, B. S., Y. U. Lee, H. S. Kim, T. H. Kim, J. Park, J. G. Lee, J. Kim, H. Kim, W. G. Lee and Y. K. Cho, 2011, Fully integrated lab-on-a-disc for simultaneous analysis of biochemistry and immunoassay from whole blood, Lab Chip 11, 70-78.
Lee, S. S., Y. Yim, K. H. Ahn and S. J. Lee, 2009, Extensional flow-based assessment of red blood cell deformability using hyperbolic converging microchannel, Biomed Microdevices 11, 1021-1027.
Li, T., Y. Fan, Y. Cheng and J. Yang, 2013, An Electrochemical Lab-on-a-CD System for Parallel Whole Blood Analysis, Lab Chip 13, 2634-2640.
Li, X. J., Z. L. Peng, H. Lei, M. Dao and G. E. Karniadakis, 2014, Probing red blood cell mechanics, rheology and dynamics with a two-component multi-scale model, Philos Trans R Soc A 372.
Li, Y. J., C. Wen, H. M. Xie, A. P. Ye and Y. J. Yin, 2009, Mechanical property analysis of stored red blood cell using optical tweezers, Colloid Surface B 70, 169-173.
Lim, C. T., M. Dao, S. Suresh, C. H. Sow and K. T. Chew, 2004, Large deformation of living cells using laser traps, Acta Mater 52, 1837-1845.
Lim, H. J., Y. J. Lee, J. H. Nam, S. Chung and S. Shin, 2010, Temperature-dependent threshold shear stress of red blood cell aggregation, J Biomech 43, 546-550.
Lo Presti, R., E. Hopps and G. Caimi, 2014, Hemorheological abnormalities in human arterial hypertension, Korea-Aust Rheol J 26, 199-204.
Marcinkowska-Gapinska, A., J. Gapinski, W. Elikowski, F. Jaroszyk and L. Kubisz, 2007, Comparison of three rheological models of shear flow behavior studied on blood samples from post-infarction patients, Med Biol Eng Comput 45, 837-844.
Mark, M., K. Hausler, J. Dual and W. H. Reinhart, 2006, Oscillating viscometer - Evaluation of a new bedside test, Biorheology 43, 133-146.
Marton, Z., G. Kesmarky, J. Vekasi, A. Cser, R. Russai, B. Horvath and K. Toth, 2001, Red blood cell aggregation measurements in whole blood and in fibrinogen solutions by different methods, Clin Hemorheol Micro 24, 75-83.
Merrill, E. W., 1969, Rheology of blood, Physiol Rev 49, 863-888. Merrill, E. W., H. Shin, G. Cokelet, E. R. Gilliland, R. E. Wells and A. Britten, 1963,
Rheology of Human Blood, near and at Zero Flow - Effects of Temperature and Hematocrit Level, Biophys J 3, 199-213.
Mills, J. P., M. Diez-Silva, D. J. Quinn, M. Dao, M. J. Lang, K. S. W. Tan, C. T. Lim, G. Milon, P. H. David, O. Mercereau-Puijalon, S. Bonnefoy and S. Suresh, 2007, Effect of plasmodial RESA protein on deformability of human red blood cells harboring Plasmodium falciparum, P Natl Acad Sci USA 104, 9213-9217.
Moreno, L., F. Calderas, G. Sanchez-Olivares, L. Medina-Torres, A. Sanchez-Solis and O. Manero, 2015, Effect of cholesterol and triglycerides levels on the rheological behavior of human blood, Korea-Aust Rheol J 27, 1-10.
Morris, C. L., C. M. Smith and P. L. Blackshear, 1987, A New Method for Measuring the Yield Stress in Thin-Layers of Sedimenting Blood, Biophys J 52, 229-240.
52
Muramoto, Y. and Y. Nagasaka, 2011, High-speed sensing of microliter-order whole-blood viscosity using laser-induced capillary wave, J Biorheology 25, 43-51.
Neuman, K. C. and A. Nagy, 2008, Single-molecule force spectroscopy: optical tweezers, magnetic tweezers and atomic force microscopy, Nat Methods 5, 491-505.
Ong, P. K., D. Lim and S. Kim, 2010, Are microfluidics-based blood viscometers ready for point-of-care applications? A review, Crit Rev Biomed Eng 38, 189-200.
Owens, R. G., 2006, A new micro structure-based constitutive model for human blood, J Non-Newton Fluid 140, 57-70.
Picart, C., P. H. Carpentier, H. Galliard and J. M. Piau, 1999, Blood yield stress in systemic sclerosis, Am J Physiol-Heart C 276, H771-H777.
Picart, C., J. M. Piau, H. Galliard and P. Carpentier, 1998, Human blood shear yield stress and its hematocrit dependence, J Rheol 42, 1-12.
Pirofsky, B., 1953, The Determination of Blood Viscosity in Man by a Method Based on Poiseuille's Law, J Clin Invest 32, 292-298.
Popel, A. S. and P. C. Johnson, 2005, Microcirculation and hemorheology, Annu Rev Fluid Mech 37, 43-69.
Pozrikidis, C., 2003, Modeling and simulation of capsules and biological cells, CRC Press, Boca Raton, FL.
Puig-De-Morales-Marinkovic, M., K. T. Turner, J. P. Butler, J. J. Fredberg and S. Suresh, 2007, Viscoelasticity of the human red blood cell, Am J Physiol: Cell Physiol 293, C597-C605.
Radtke, H., R. Schneider, R. Witt, H. Kiesewetter and H. Schmid-Schonbein, 1984, A measuring device to determine a universal parameter for the flow characteristics of blood: measurement of the yield shear stress in a branched capillary, Adv Exp Med Biol 169, 851-857.
Rampling, M. W., 2007, Compositional Properties of Blood. Handbook of hemorheology and hemodynamics, O. K. Baskurt, M. R. Hardeman, M. W. Rampling and H. J. Meiselman, IOS Press, 34-44, Amsterdam.
Replogle, R. L., Meiselma.Hj and E. W. Merrill, 1967, Clinical Implications of Blood Rheology Studies, Circulation 36, 148-&.
Rosencranz, R. and S. A. Bogen, 2006, Clinical laboratory measurement of serum, plasma, and blood viscosity, Am J Clin Pathol 125, S78-86.
Schmid-Schonbein, H., P. Gaehtgens and H. Hirsch, 1968, On the shear rate dependence of red cell aggregation in vitro, J Clin Invest 47, 1447-1454.
Secomb, T. W., 1987, Flow-dependent rheological properties of blood in capillaries, Microvasc Res 34, 46-58.
Sharma, K. and S. V. Bhat, 1992, Non-Newtonian rheology of leukemic blood and plasma: are n and k parameters of power law model diagnostic?, Physiol Chem Phys Med NMR 24, 307-312.
Shin, S., J. X. Hou, J. S. Suh and M. Singh, 2007, Validation and application of a microfluidic ektacytometer (RheoScan-D) in measuring erythrocyte deformability, Clin Hemorheol Micro 37, 319-328.
Shin, S., S. W. Lee and Y. L. Ku, 2004, Measurements of blood viscosity using a pressure-scanning slit viscometer, Ksme Int J 18, 1036-1041.
Shung, K. K., 2006, Diagnostic ultrasound : imaging and blood flow measurements, CRC Press, Boca Raton, Florida.
Smith, P. D., R. C. D. Young and C. R. Chatwin, 2010, A MEMS viscometer for unadulterated human blood, Measurement 43, 144-151.
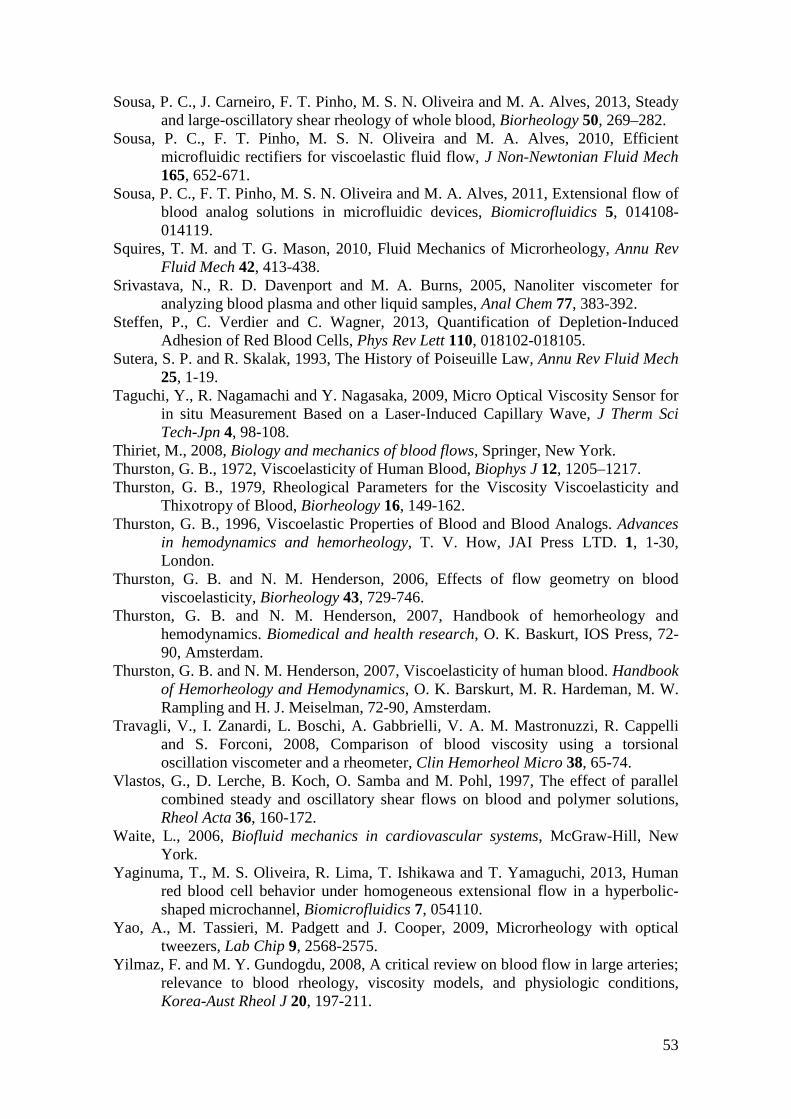
53
Sousa, P. C., J. Carneiro, F. T. Pinho, M. S. N. Oliveira and M. A. Alves, 2013, Steady and large-oscillatory shear rheology of whole blood, Biorheology 50, 269–282.
Sousa, P. C., F. T. Pinho, M. S. N. Oliveira and M. A. Alves, 2010, Efficient microfluidic rectifiers for viscoelastic fluid flow, J Non-Newtonian Fluid Mech 165, 652-671.
Sousa, P. C., F. T. Pinho, M. S. N. Oliveira and M. A. Alves, 2011, Extensional flow of blood analog solutions in microfluidic devices, Biomicrofluidics 5, 014108-014119.
Squires, T. M. and T. G. Mason, 2010, Fluid Mechanics of Microrheology, Annu Rev Fluid Mech 42, 413-438.
Srivastava, N., R. D. Davenport and M. A. Burns, 2005, Nanoliter viscometer for analyzing blood plasma and other liquid samples, Anal Chem 77, 383-392.
Steffen, P., C. Verdier and C. Wagner, 2013, Quantification of Depletion-Induced Adhesion of Red Blood Cells, Phys Rev Lett 110, 018102-018105.
Sutera, S. P. and R. Skalak, 1993, The History of Poiseuille Law, Annu Rev Fluid Mech 25, 1-19.
Taguchi, Y., R. Nagamachi and Y. Nagasaka, 2009, Micro Optical Viscosity Sensor for in situ Measurement Based on a Laser-Induced Capillary Wave, J Therm Sci Tech-Jpn 4, 98-108.
Thiriet, M., 2008, Biology and mechanics of blood flows, Springer, New York. Thurston, G. B., 1972, Viscoelasticity of Human Blood, Biophys J 12, 1205–1217. Thurston, G. B., 1979, Rheological Parameters for the Viscosity Viscoelasticity and
Thixotropy of Blood, Biorheology 16, 149-162. Thurston, G. B., 1996, Viscoelastic Properties of Blood and Blood Analogs. Advances
in hemodynamics and hemorheology, T. V. How, JAI Press LTD. 1, 1-30, London.
Thurston, G. B. and N. M. Henderson, 2006, Effects of flow geometry on blood viscoelasticity, Biorheology 43, 729-746.
Thurston, G. B. and N. M. Henderson, 2007, Handbook of hemorheology and hemodynamics. Biomedical and health research, O. K. Baskurt, IOS Press, 72-90, Amsterdam.
Thurston, G. B. and N. M. Henderson, 2007, Viscoelasticity of human blood. Handbook of Hemorheology and Hemodynamics, O. K. Barskurt, M. R. Hardeman, M. W. Rampling and H. J. Meiselman, 72-90, Amsterdam.
Travagli, V., I. Zanardi, L. Boschi, A. Gabbrielli, V. A. M. Mastronuzzi, R. Cappelli and S. Forconi, 2008, Comparison of blood viscosity using a torsional oscillation viscometer and a rheometer, Clin Hemorheol Micro 38, 65-74.
Vlastos, G., D. Lerche, B. Koch, O. Samba and M. Pohl, 1997, The effect of parallel combined steady and oscillatory shear flows on blood and polymer solutions, Rheol Acta 36, 160-172.
Waite, L., 2006, Biofluid mechanics in cardiovascular systems, McGraw-Hill, New York.
Yaginuma, T., M. S. Oliveira, R. Lima, T. Ishikawa and T. Yamaguchi, 2013, Human red blood cell behavior under homogeneous extensional flow in a hyperbolic-shaped microchannel, Biomicrofluidics 7, 054110.
Yao, A., M. Tassieri, M. Padgett and J. Cooper, 2009, Microrheology with optical tweezers, Lab Chip 9, 2568-2575.
Yilmaz, F. and M. Y. Gundogdu, 2008, A critical review on blood flow in large arteries; relevance to blood rheology, viscosity models, and physiologic conditions, Korea-Aust Rheol J 20, 197-211.

54
Zeng, H. and Y. Zhao, 2009, On-Chip Blood Viscometer Towards Point-of-Care Hematological Diagnosis, 22nd IEEE International Conference, Sorento.
Zhu, H. Y., I. Sencan, J. Wong, S. Dimitrov, D. Tseng, K. Nagashima and A. Ozcan, 2013, Cost-effective and rapid blood analysis on a cell-phone, Lab Chip 13, 1282-1288.
Zydney, A. L., J. D. Oliver and C. K. Colton, 1991, A Constitutive Equation for the Viscosity of Stored Red-Cell Suspensions - Effect of Hematocrit, Shear Rate, and Suspending Phase, J Rheol 35, 1639-1680.

55

Figure 1. Main components of whole human blood and their typical volume concentrations.
Whole Blood (≈ 7% body weight)
Plasma (≈ 55% whole blood)
Water (≈ 91% plasma)
Proteins (≈ 7% plasma)
Other solutes (≈ 2% plasma)
Cellular Elements (≈ 45% whole blood)
Red Blood Cells (≈ 97% cellular elements)
White Blood Cells (≈ 2% cellular elements)
Platelets (≈ 1% cellular elements)

Figure 2. Schematic representation of a healthy red blood cell at rest and its typical dimensions.
1 µm 2 µm
8 µm

Figure 3. Sketch of the formation of a plasma enriched layer near the vessel walls and
accumulation of RBC at the center of the vessel when blood is flowing (wall effect).
Plas
ma
laye
r
Flow

Figure 4. Examples of mechanical devices employed in rheological measurements of blood.
(a1) Rotational rheometer (Physica MCR301, Anton Paar). (b1) Capillary break-up extensional
rheometer HaakeTM CaBERTM 1 (Thermo Scientific). (b2) Zoomed view of the test section. The
sample is placed in the space between the upper and the bottom plates. (c) Schematics of the
falling-ball viscometer used by Eguchi and Karino (2008). Reprinted with permission from
Eguchi and Karino (2008).
(a)
Upper plate
Bottom plateSample
(b1) (b2)
(c)

(d)
(e)
Figure 5. Microfluidic devices employed in blood rheological measurements. (a) The
experimental set-up is typically composed of an inverted microscope on which the microfluidic
chip is placed, a digital camera for recording images, a syringe pump for imposing a flow rate
and a temperature controller for controlling the temperature of the fluid. Reprinted with
permission from Yaginuma et al. (2013) (b) Microfluidic analogue of Wheatstone-bridge
channel used by Kang and Lee (2013). Reprinted with permission from Kang and Lee (2013).
Blood is fed to inlet A and a PBS solution to inlet B by means of syringe pumps. To ensure
constant flow rates for both fluids, a flow stabilizer with 0.1 mL cavity volume was placed
between the syringe pump and the channel inlet of PBS solution. (c) Microfabricated viscometer
used by Srivastava et al. (2005). The channel, 340 µm wide and 36 µm in depth, is etched in
glass and bounded to silicon and open to the atmosphere on the inlet and outlet. Reprinted with
permission from Srivastava et al. (2005). Copyright (2015) American Chemical Society. (d)
Sketch of the microfluidic channel composed of an abrupt contraction followed by an abrupt
expansion used by Brust et al. (2013). The depth of the channel is 50 µm. (e) Optical
400
µm 25 µm
100 µm
(a)
Channel
Inlet
Channel
Outlet (c)
(b)
406 µm 17 µm
780 µm

micrograph of the hyperbolic-shaped contraction followed by an abrupt expansion channel
similar to that employed by Yaginuma et al. (2013). The depth of the channel is 60 µm. The
same type of contraction was also used in the work of Lee et al. (2009) for investigating RBC
deformability.
(a)
(c1)
(b)
(c2)
Figure 6. (a) Schematics of an optical tweezers set-up. Two microbeads are binded to the RBC
at opposite points, one bead is anchored to the surface of a glass slide and the other can be
trapped using the laser beam and the force is applied through the movement of the laser beam.
Reprinted with permission from Dao et al. (2003). (b) Schematics of the AFM technique. The
deflection of a pre-functionalized cantilever is measured by the displacement of a low power
laser reflected on a Position Sensitive Device (PSD). The piezo stage is retracted along the axial
direction and the stretching of the molecule is equal to the distance between the AFM tip and
the sample surface. Reprinted with permission from Neuman and Nagy (2008). (c) Comparison
between the RheoScan-D (c1) and LORCA (c2) systems. The RheoScan-D employs a channel
4 mm wide and 40 mm long with a depth of 200 µm and analyses RBC deformability whereas
the LORCA system can measure the aggregation and deformability of the RBC in a Couette
cell.
Before stretch
1.5 W diodepumpedNd:YAG
laser source
During stretch
Inverted microscope
CCD Camera
sample
Video Recorder
Binding of silica microbeads to cell Bead adhered
to surface of glass slide
Human red blood cell Laser beam trapping
bead
Pressure sensor
Processing computer
Frame grabber
Automatic vacuum
generator
Projection screen
Laser diode (λ = 635 nm; Power =1.5 mW)
CCDCamera
Sample chamber
Waste sample
chamber
Mirror
Laser diode
Rotatingcup
RBC suspension
Camera
Static cylinderHeater
Projection screen
Positition Sensitive Device
Cantilever
Detection laser
Piezoelectric scanner

Figure 7. Shear viscosity of blood as a function of shear rate for normal human blood, normal
red blood cells in 11% albumin-Ringer solution and red blood cells hardened by glutaraldehyde
in 11% albumin-Ringer solution. All suspensions contain 45% (v/v) of RBC. The plasma and
the suspension of rigid erythrocytes in plasma show a Newtonian rheological behavior in shear,
whereas RBC aggregation and deformation lead to a shear-thinning shear viscosity. The
differences in the curves highlight the effects of RBC aggregation and deformation. Adapted
from Chien (1970).
RBC aggregation
Hardened RBC in albumin
RBC in albumin RBC deformation
Whole blood
Plasma
10-2 10-1 100 101 102 10310-3
10-2
10-1
100
Visc
osity
, η /
Pa s
Shear rate, γ / s-1.

Sousa et al. (2013), Hct = 41.3%
Chien et al. (1966), Hct = 51.7%
Kim et al. (2000) , Hct = 41%
Alexy et al. (2005), Hct = 41.2%
T = 37ºC
(a)
Vlastos et al. (1997), Hct = 45%
T = 25ºC
Sousa et al. (2013), Hct = 41.3%
T = 37ºC
Thurston (1979), Hct = 43%
T = 22ºC
Valant et al. (2011) , Hct = 46%
T = 4ºC
Valant et al. (2011) , Hct = 46%
T = 37ºC
(b)
Figure 8. Viscosity of human blood as a function of shear rate obtained experimentally in
different works. (a) T = 37 ºC; (b) T = 4–37 ºC. Blood viscosity data obtained by Alexy et al.
(2005) was measured from 44 donors at a mean hematocrit of 41.2% using an automated
scanning capillary viscometer (RheologTM). Chien et al. (1966) employed a coaxial cylinder
viscometer; Kim et al. (2000) used a scanning capillary tube viscometer; Sousa et al. (2013) and
Valant et al. (2011) used a shear rheometer (Physica MCR301, Anton Paar) with a serrated
plate-plate geometry and a double gap cell, respectively; Thurston (1979) and Vlastos et al.
(1997) employed a Couette-type viscometer, Contraves LS 30 and Contraves LS 40,
respectively.
10-2 10-1 100 101 102 10310-3
10-2
10-1
100
Visc
osity
, η /
Pa s
Shear rate, γ / s-1.
10-2 10-1 100 101 102
10-2
10-1
Visc
osity
, η /
Pa s
Shear rate, γ / s-1.

Figure 9. Effect of hematocrit on the viscosity for normal human RBC suspended in autologous
plasma at two different values of shear rate. Adapted from Cokelet and Meiselman (2007).
0 20 40 60 800
20
40
60
80
100
120
. γ = 0.11 s-1
γ = 20 s-1
Visc
osity
, η /
mPa
s
Hematocrit, Hct / %
.

(a) (b)
Figure 10. Typical thixotropic hysteresis loop observed in the curve of the shear viscosity as a
function of shear rate (a) and in the curve of shear stress as a function of shear rate (b). The fluid
yield stress ( 0τ ) is also illustrated in (b).
Visc
osity
, η
Shear rate, γ .
Shea
r stre
ss, τ
Shear rate, γ.0
τ0

Figure 11. Steady shear viscosity and viscous and elastic components of the complex viscosity
as a function of shear rate at a frequency of oscillation, f = 2 Hz. In the inset, viscous and elastic
components of the complex viscosity are presented as a function of frequency of oscillation.
Adapted from Thurston (1979, 1996).
10-2 10-1 100 101 10210-7
10-5
10-3
10-1
10-1 100 10110-4
10-3
10-2
10-1
η''
η'
η', η
'' / P
a s
Frequency, f / Hz
η''
η'
Visc
osity
, η, η
', η'' /
Pa s
Shear rate, γ / s-1.
η

Figure 12. Maxwell relaxation times for Hct = 44 %, at f = 2 Hz and T = 22ºC. Adapted from
Thurston and Henderson (2007).
100 101 102 10310-4
10-3
10-2
10-1
0 001
Max
well
relax
ation
tim
e, λ
/ s
Shear rate, γ / s-1.
RBC aggregation
RBC deformation

Figure 13. Storage ( )G′ and loss ( )G′′ moduli as a function of the angular frequency measured
using passive microrheology for Hct = 44% and T = 27 ºC. Reproduced with permission from
Campo-Deaño et al. (2013).
100 101 102 10310-3
10-2
10-1
100
G'
G', G
'' / P
a
ω / rad s-1
G''

Figure 14. Lissajous-Bowditch plots of shear stress vs. strain and shear stress vs. shear rate at
strain amplitudes γ = 10, 50 and 100 and for a constant angular frequency, ω = 0.1 rad s-1.
Reproduced with permission from Sousa et al. (2013). The authors employed a Fourier
transform analysis to describe the results and normalized the data presented in the Lissajous-
Bowditch plots using the first harmonic of the Fourier series.
-1.0 -0.5 0.0 0.5 1.0
-1.0
-0.5
0.0
0.5
1.0
γ = 100 γ = 50 γ = 10
Normalised strain, γ ∗
Norm
alise
d str
ess,
τ ∗
-1.0 -0.5 0.0 0.5 1.0
-1.0
-0.5
0.0
0.5
1.0 γ = 100 γ = 50 γ = 10
Norm
alise
d str
ess,
τ ∗
Normalised shear rate, γ ∗.