Embed Size (px)
Citation preview
Spatial-temporal diffusion of dengue in the municipality of Rio de Janeiro, Brazil, 2000-2013
Difusão espaço-tempo do dengue no Município do Rio de Janeiro, Brasil, no período de 2000-2013
Difusión espacio-tiempo del dengue en el municipiode Río de Janeiro, Brasil, durante el período de 2000-2013
Diego Ricardo Xavier 1
Mônica de Avelar Figueiredo Mafra Magalhães 1
Renata Gracie 1
Izabel Cristina dos Reis 1,2
Vanderlei Pascoal de Matos 1
Christovam Barcellos 1
Abstract
The city of Rio de Janeiro, Brazil, shows high potential receptiveness to the introduction, dissemination, and persistence of dengue transmission. The pat-tern of territorial occupation in the municipality produced a heterogeneous and diverse mosaic, with differential vector distribution between and within neighborhoods, producing distinct epidemics on this scale of observation. The study seeks to identify these epidemics and the pattern of spatial and tempo-ral diffusion of dengue transmission. A model was used for the identification of epidemics, considering the epidemic peak years and months, spatial distri-bution, and permanence of epidemics from January 2000 to December 2013. A total of 495 epidemic peaks were counted, and the time scale showed the highest occurrence in the months of March, April, and February, respectively. Some neighborhoods appear to present persistent dengue incidence, and the pattern of diffusion allows identifying key trajectories and timely months for intervention.
Dengue; Spatio-Temporal Analysis; Epidemics
CorrespondenceD. R. XavierInstituto de Comunicação e Informação Científica e Tecnológica em Saúde, Fundação Oswaldo Cruz.Av. Brasil 4365, Rio de Janeiro, RJ 21040-900, [email protected]
1 Instituto de Comunicação e Informação Científica e Tecnológica em Saúde, Fundação Oswaldo Cruz, Rio de Janeiro, Brasil.2 Instituto Oswaldo Cruz, Fundação Oswaldo Cruz, Rio de Janeiro, Brasil.
ARTIGOARTICLE
doi: 10.1590/0102-311X00186615
Cad. Saúde Pública 2017; 33(2):e00186615
This article is published in Open Access under the Creative Commons Attribution license, which allows use, distribution, and reproduction in any medium, without restrictions, as long as the original work is correctly cited.

Xavier DR et al.2
Cad. Saúde Pública 2017; 33(2):e00186615
Introduction
Dengue is one of the world’s principal mosquito-borne arbovirus infections in humans, due to its morbidity and mortality 1. Dengue incidence has increased 30-fold in the last 50 years, with geo-graphic expansion to new countries, small cities, and rural areas 2,3. Recent estimates point to 390 million dengue infections per year, 96 million of which involve clinical manifestations 4.
In the Americas, the disease has spread with outbreaks occurring in 3-5-year periods, with 561,501 confirmed cases and 1,181 deaths in 2015 2,5. Brazil led the countries of the Americas with 487,763 confirmed dengue cases (87% of the region’s total) and 863 deaths caused by the disease 5.
In Brazil, since 1977 with re-infestation by the Aedes aegypti mosquito, the principal dengue vector, the country has experienced various epidemics, with approximately 10 million dengue cases reported through 2015 6. Rio de Janeiro is one of the principal states of Brazil in number of reported dengue cases, and the municipality of Rio de Janeiro is considered the portal of entry for the dissemination of new dengue serotypes (DENV) 6. Seven major epidemics have occurred in the state since 1986 when DENV-1 was isolated for the first time in the municipality of Nova Iguaçu and later expanded to other areas, including the city of Rio de Janeiro 7. In April 1990, the second epidemic began in the cities of Rio de Janeiro and Niterói with the arrival of the DENV-2 serotype, isolated for the first time and with confirmed autochthonous cases 8.
In 1995, the DENV-1 and DENV-2 serotypes accounted for more than 50,000 cases in the state of Rio de Janeiro, and in 1998 a new epidemic spread statewide 9. The DENV-3 serotype was introduced into the state of Rio de Janeiro in 2001 and was isolated both in Ae. aegypti and humans in the munici-pality of Nova Iguaçu 10,11. The introduction of this serotype in the state led to a severe epidemic in 2002 with 288,245 reported cases, including 1,831 cases of dengue hemorrhagic fever and 91 deaths 12.
From 2007 to 2008, the entire state of Rio de Janeiro experienced an intense dengue epidemic with more than 300,000 reported cases and 240 deaths 6. The number of dengue cases in the state increased from 2011 to 2013 6. Introduction of DENV-4 in March 2011 resulted in the joint circulation of all four serotypes, DENV-1, 2, 3 and 4, in the state of Rio de Janeiro 13,14,15.
The city of Rio de Janeiro is a prime tourist route in Brazil and the world, especially in the sum-mer months, which coincide with the highest number of dengue cases 16,17. Importantly, the local Ae. aegypti populations are highly susceptible to the dengue virus and show high densities in most of the state 12,15, which emphasizes the region’s potential as highly receptive to the introduction, dissemina-tion, and persistence of dengue virus transmission 14,18.
The distribution of dengue cases and the vector is not uniform across the territory and varies between and within neighborhoods in Rio de Janeiro 17,19,20. Rio de Janeiro’s urban environment is fragmented, forming a heterogeneous mosaic with neighborhoods presenting a diversity of micro-areas, varying from each other in land use and coverage, microclimate, sanitation, and urbanization. The city presents many additional aggravating factors such as limited access to basic sanitation ser-vices, lack of infrastructure, disordered occupation, environmental degradation, heavy population density, and intense human mobility, all contributing to the high number of dengue cases 9,19,21.
Several studies have analyzed the distribution of dengue risk in urban areas in Brazil 22,23,24,25 including in the city of Rio de Janeiro 26,27, focusing on its association with socioeconomic and environmental factors. However, there is little research on the underlying processes of diffusion in this spatial distribution. If dengue epidemics have a strong seasonal and multiannual dynamic, these processes are expected to manifest themselves in space by spreading waves, conditioned by the population’s mobility and susceptibility and the vector’s presence. This study aimed to identify the temporal-spatial diffusion of dengue transmission in neighborhoods in the municipality of Rio de Janeiro, considering the epidemic peak years and months, spatial distribution, and persistence of epidemics from January 2000 to December 2013.
SPATIAL-TEMPORAL DIFFUSION OF DENGUE IN THE MUNICIPALITY OF RIO DE JANEIRO 3
Cad. Saúde Pública 2017; 33(2):e00186615
Methodology
The study used time series of dengue cases for the identification of epidemics and the pattern of dif-fusion in the municipality as a whole and according to neighborhoods in Rio de Janeiro from 2000 to 2013.
The city of Rio de Janeiro, capital of the state by the same name, is located in the Southeast Region of Brazil at latitude 22º54’23” South and longitude 43º10’21” West. The city borders on the north with various municipalities in the Baixada Fluminense and is bathed to the south by the Atlantic Ocean, to the east by Guanabara Bay, and to the west by Sepetiba Bay. The city has a territory of 1,197,463km2 and an estimated 6,476,631 inhabitants (Instituto Brasileiro de Geografia e Estatística. Cidades@. http://www.ibge.gov.br, accessed on 06/Apr/2015). The municipality is divided administratively into 33 administrative regions, 160 neighborhoods, and 8,145 census tracts 28.
The climate is tropical (hot and humid), with local variations due to differences in altitude, vegeta-tion, and proximity to the ocean. Mean annual temperature is 22ºC, with high daily averages in the summer (30º to 32º). Annual rainfall varies from 1,200 to 1,800mm 28.
Rio de Janeiro is a city of sharp economic and social contrasts. Areas without basic infrastructure occupied by underprivileged low-income groups show the worst health conditions. Other areas occupied by high-income groups with better health standards also present subnormal clusters (fave-las), with social groups lacking basic infrastructure. The city also has a heterogeneous pattern of land use and plant cover in which densely populated areas alternate with forest remnants, coastal plains, creeks, and rivers 24.
Data on reported dengue cases according to residential neighborhood were obtained from the Rio de Janeiro Municipal Health Secretariat (SMS/RJ) for January 2000 to December 2013 (http://www.rio.rj.gov.br/web/sms/exibeconteudo?id=2815389, accessed on 03/May/2015). The cartographic bases were acquired from the Brazilian Institute of Geography and Statistics (Cidades@. http://www.ibge.gov.br, accessed on 06/Apr/2015). The initial analyses were conducted using incidence rates by neighborhoods, but random fluctuation in the indicator was observed 26, since some neighborhoods had very small populations. The use of an absolute number of cases attempted to avoid the problem of random fluctuation in the indicator and proved more appropriate for this study than the use of incidence rates with Bayesian smoothing, since the objective was not comparison of neighborhoods, but the evaluation of the evolution in the number of cases within a same spatial unit, the identification and magnitude of epidemics.
The series were decomposed in three sine waves according to an approach not very different from a periodic regression 29, but intended to furnish trigonometric parameters such as amplitude and phase in place of the sine and cosine functions’ regression coefficients 30. This seasonal signature could have been obtained simply by interpolation of the monthly means in the time series. However, the approach used here allows the use of parameters for individual harmonics to quantify epidemics 30,31,32. We thus extracted the tendency component and calculated the seasonal cycle adding the har-monics from 12, 6, and 3 months, wave cycles that compose a partial Fourier series 33. This allowed obtaining the annual periodic seasonality function and the amplitude of the epidemic peaks, described in the following formula:
, if Yt is the number of dengue cases in the neighborhood in time t, α0 the mean number of cases per neighborhood, α1t the linear trend, and α2t2 corresponds to the mathematical function to represent the trend’s parabola, this is only possible when we add the components of the Fourier series, defined as
, and , with the respec-tive harmonics, minimized by the model’s residual variance. This method considers the series’ time dependence, which was also evaluated by the autocorrelation function, pointing to short-term mem-ory behavior in the series no greater than a lag of 3 time units (months).
The series’ seasonal signature is presented with calculation of the 95% confidence interval – 95%CI (parameters adjusted in the model by the software), where the observations exceeding these limits were considered epidemic periods. Estimates of the amplitude of the primary annual peak in
Xavier DR et al.4
Cad. Saúde Pública 2017; 33(2):e00186615
dengue in the municipality allowed identifying the moment with the maximum epidemic intensity according to the monthly scale. This procedure was performed for the municipality of Rio de Janeiro as a whole and individually for the 160 neighborhoods. The software used for the time series analyses was EPIPOI 30, an application that uses MATLAB 2.0 (The MathWorks, Natick, USA).
This information was entered into ArcGis 10 (http://www.esri.com/software/arcgis/index.html) and the Vertical Mapper software (Pitney Bowes Software, Troy, USA), an application that uses MAP-INFO 10 (MapInfo Corp., New York, USA), in which the spatial data analyses and thematic maps were performed. Two types of thematic maps were made. The first set of maps allowed observing spatial dynamics in the occurrence of dengue epidemics and verifying the formation of clusters of neighborhoods in the various years. The second allowed observing the months in which the epidem-ics occurred according to different neighborhoods and verifying the temporal and spatial diffusion in the dissemination of the disease. The maps used the months in which the first epidemic peak was detected, and this value was considered the attribute of the neighborhood’s centroid. These attributes were interpolated for the entire surface of the municipality using approximation of the inverse dis-tance weighted (IDW) 34. Thus, the values of the created surface showed the approximate month in which the first epidemic wave hit the region.
Results
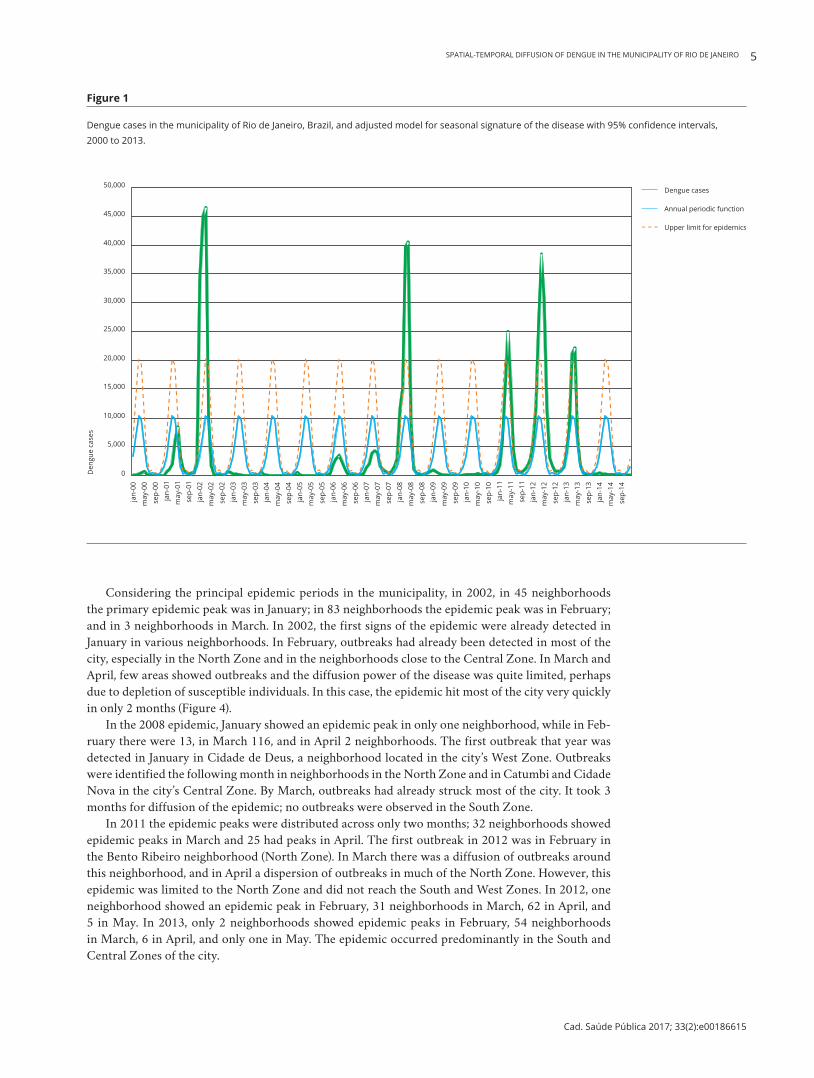
Dengue is a serious public health problem in the city of Rio de Janeiro. From 2000 to 2013 alone, 616,419 cases were reported by the SMS/RJ. The years 2002, 2008, 2011, 2012, and 2013 accounted for 87% of all dengue cases in the municipality during the total period. Figure 1 shows reported den-gue cases per 100,000 inhabitants in the municipality of Rio de Janeiro and the adjusted model for seasonal signature of the disease with 95%CI from 2000 to 2013. The years 2002, 2008, 2011, and 2012 were identified as epidemic period. An increase was observed in the number of cases in the years prior to the epidemic years 2002 and 2008. Another epidemic peak was seen in the year 2012, pre-ceded by a smaller epidemic in 2011 and followed by more cases in the subsequent year. Considering the seasonality detected by the proposed model, the 2002 epidemic began before the seasonal peak. In 2008, the epidemic peak occurred together with the peak in the series’ seasonal signature in the year. In 2011 and 2012, the epidemic peak was observed shortly after the peak in the seasonal signature.
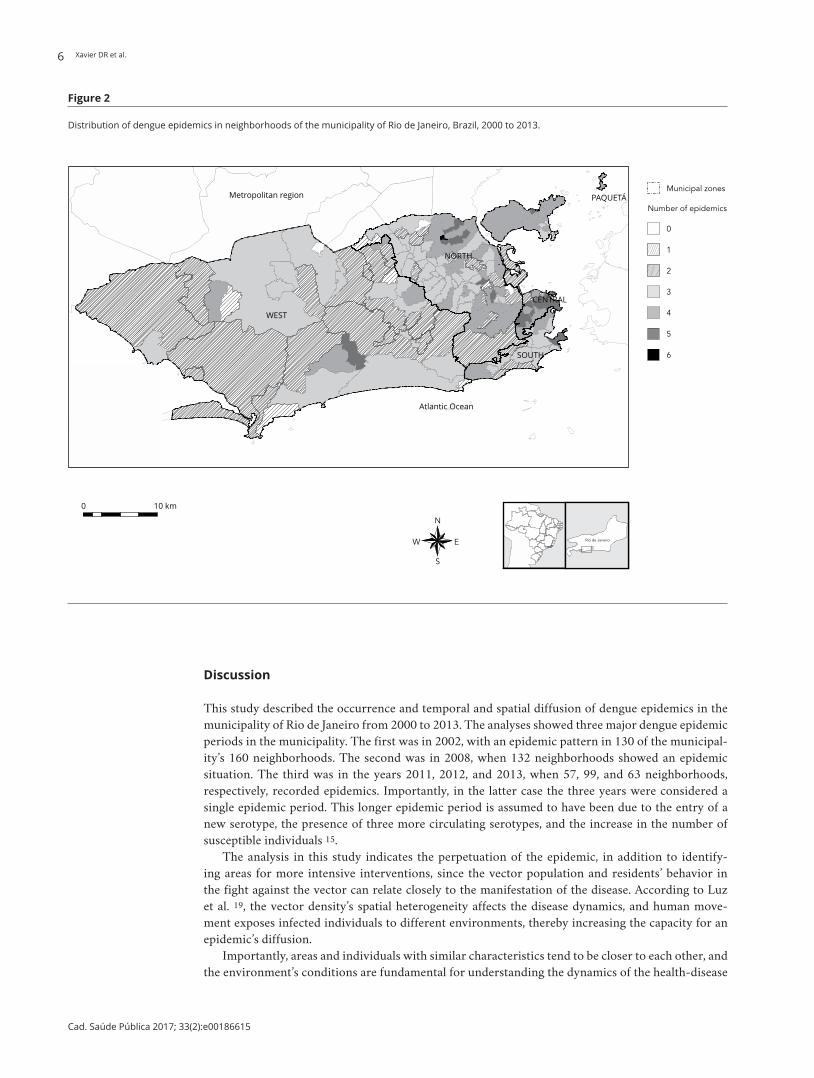
The adjusted model with the seasonal signature for the municipality of Rio de Janeiro highlights the main dengue epidemics during the study period. Figure 2 shows the epidemics’ spatial distribu-tion in the neighborhoods. In the 14 years of study, the neighborhood of Vista Alegre (North Zone) showed an epidemic pattern in 6 years. The neighborhoods of Brás de Pina, Maria da Graça, Moneró, Parada de Lucas, Rocha (North Zone); Centro, Cidade Nova, Catumbi, Rio Comprido (Central Zone); Camorim (West Zone); and Urca (South Zone) showed 5 years with epidemics. Fifty-seven neighbor-hoods in the municipality (36%) had 3 epidemics, 45 neighborhoods (28%) had 4, 38 neighborhoods (24%) had 2, and only the neighborhoods of Gericinó, Vasco da Gama, and Parque Colúmbia had no epidemics during the study period.
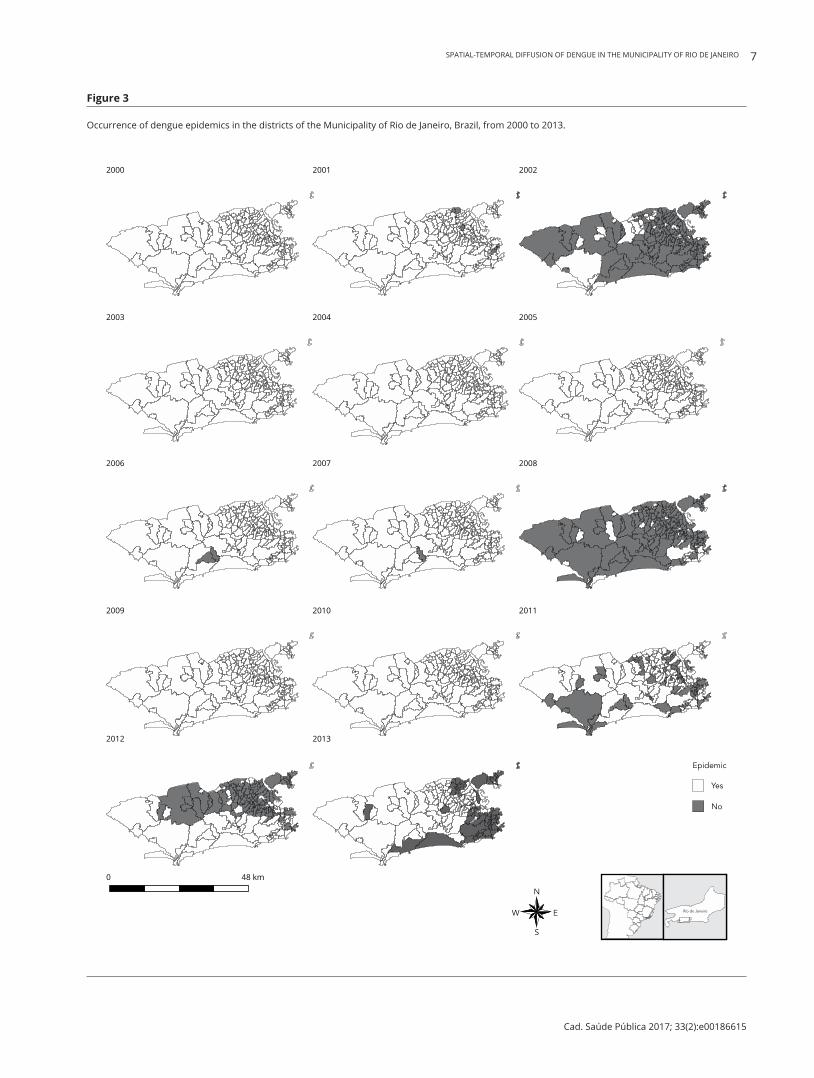
Figure 3 shows the annual distribution of dengue epidemics in the neighborhoods of the munici-pality of Rio de Janeiro during the study period. In the years 2002 and 2008, nearly all the neighbor-hoods in Rio de Janeiro had epidemics. The year 2011 showed an epidemic pattern in various neigh-borhoods in the city, with random spatial distribution, that is, without a concentration of bordering neighborhoods with epidemics. In 2012, the epidemic occurred predominantly in the neighborhoods of the city’s North and West Zones. The inverse occurred in 2013, with most of the epidemic neigh-borhoods in the Central and South Zones. In 2001, eight neighborhoods presented an epidemic pat-tern, in 2006 there were 3 neighborhoods, and in 2007 there were 2. No epidemics were observed in the years 2000, 2003, 2004, 2005, 2009, or 2010.
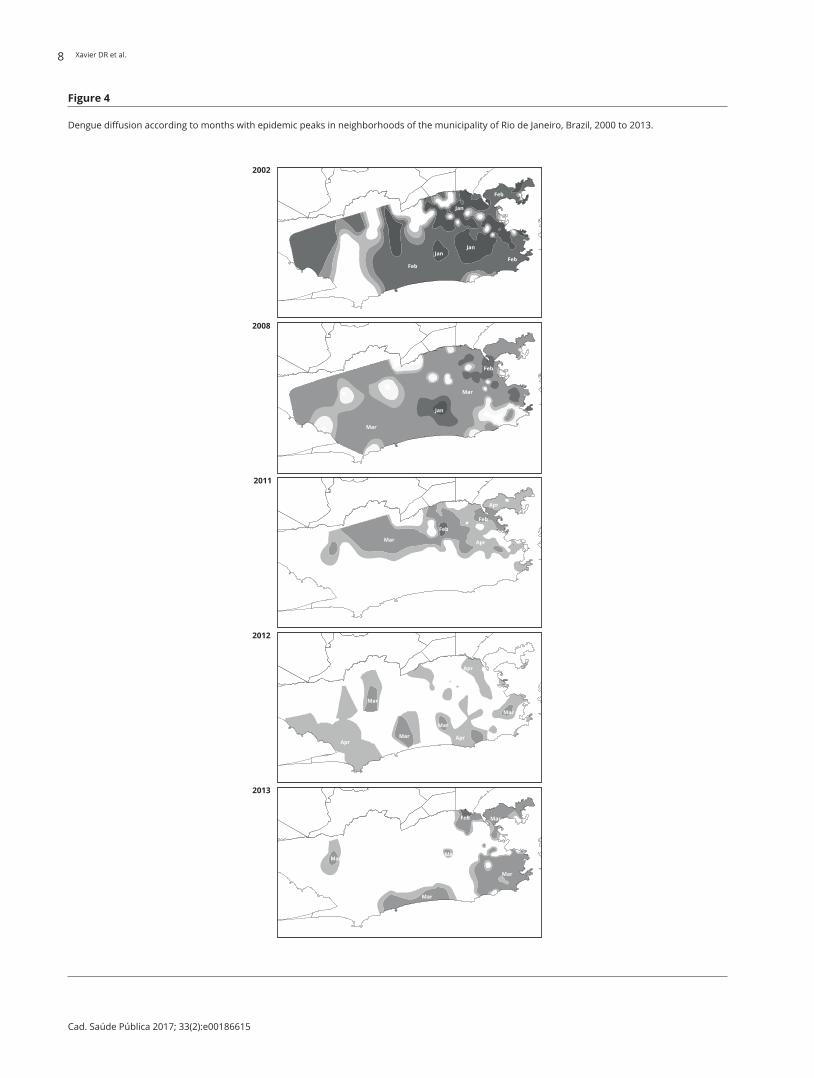
Dengue epidemics in the municipality of Rio de Janeiro occurred mainly in the months of March, April, and February (Figure 4). The analysis by neighborhoods throughout the period totaled 495 epidemic peaks, 48% of which in the month of March, 21% in April, 20% in February, 9% in January, and 1% in May.
SPATIAL-TEMPORAL DIFFUSION OF DENGUE IN THE MUNICIPALITY OF RIO DE JANEIRO 5
Cad. Saúde Pública 2017; 33(2):e00186615
Considering the principal epidemic periods in the municipality, in 2002, in 45 neighborhoods the primary epidemic peak was in January; in 83 neighborhoods the epidemic peak was in February; and in 3 neighborhoods in March. In 2002, the first signs of the epidemic were already detected in January in various neighborhoods. In February, outbreaks had already been detected in most of the city, especially in the North Zone and in the neighborhoods close to the Central Zone. In March and April, few areas showed outbreaks and the diffusion power of the disease was quite limited, perhaps due to depletion of susceptible individuals. In this case, the epidemic hit most of the city very quickly in only 2 months (Figure 4).
In the 2008 epidemic, January showed an epidemic peak in only one neighborhood, while in Feb-ruary there were 13, in March 116, and in April 2 neighborhoods. The first outbreak that year was detected in January in Cidade de Deus, a neighborhood located in the city’s West Zone. Outbreaks were identified the following month in neighborhoods in the North Zone and in Catumbi and Cidade Nova in the city’s Central Zone. By March, outbreaks had already struck most of the city. It took 3 months for diffusion of the epidemic; no outbreaks were observed in the South Zone.
In 2011 the epidemic peaks were distributed across only two months; 32 neighborhoods showed epidemic peaks in March and 25 had peaks in April. The first outbreak in 2012 was in February in the Bento Ribeiro neighborhood (North Zone). In March there was a diffusion of outbreaks around this neighborhood, and in April a dispersion of outbreaks in much of the North Zone. However, this epidemic was limited to the North Zone and did not reach the South and West Zones. In 2012, one neighborhood showed an epidemic peak in February, 31 neighborhoods in March, 62 in April, and 5 in May. In 2013, only 2 neighborhoods showed epidemic peaks in February, 54 neighborhoods in March, 6 in April, and only one in May. The epidemic occurred predominantly in the South and Central Zones of the city.
Figure 1
Dengue cases in the municipality of Rio de Janeiro, Brazil, and adjusted model for seasonal signature of the disease with 95% confidence intervals, 2000 to 2013.
Xavier DR et al.6
Cad. Saúde Pública 2017; 33(2):e00186615
Figure 2
Distribution of dengue epidemics in neighborhoods of the municipality of Rio de Janeiro, Brazil, 2000 to 2013.
Discussion
This study described the occurrence and temporal and spatial diffusion of dengue epidemics in the municipality of Rio de Janeiro from 2000 to 2013. The analyses showed three major dengue epidemic periods in the municipality. The first was in 2002, with an epidemic pattern in 130 of the municipal-ity’s 160 neighborhoods. The second was in 2008, when 132 neighborhoods showed an epidemic situation. The third was in the years 2011, 2012, and 2013, when 57, 99, and 63 neighborhoods, respectively, recorded epidemics. Importantly, in the latter case the three years were considered a single epidemic period. This longer epidemic period is assumed to have been due to the entry of a new serotype, the presence of three more circulating serotypes, and the increase in the number of susceptible individuals 15.
The analysis in this study indicates the perpetuation of the epidemic, in addition to identify-ing areas for more intensive interventions, since the vector population and residents’ behavior in the fight against the vector can relate closely to the manifestation of the disease. According to Luz et al. 19, the vector density’s spatial heterogeneity affects the disease dynamics, and human move-ment exposes infected individuals to different environments, thereby increasing the capacity for an epidemic’s diffusion.
Importantly, areas and individuals with similar characteristics tend to be closer to each other, and the environment’s conditions are fundamental for understanding the dynamics of the health-disease
SPATIAL-TEMPORAL DIFFUSION OF DENGUE IN THE MUNICIPALITY OF RIO DE JANEIRO 7
Cad. Saúde Pública 2017; 33(2):e00186615
Figure 3
Occurrence of dengue epidemics in the districts of the Municipality of Rio de Janeiro, Brazil, from 2000 to 2013.
Xavier DR et al.8
Cad. Saúde Pública 2017; 33(2):e00186615
Figure 4
Dengue diffusion according to months with epidemic peaks in neighborhoods of the municipality of Rio de Janeiro, Brazil, 2000 to 2013.

SPATIAL-TEMPORAL DIFFUSION OF DENGUE IN THE MUNICIPALITY OF RIO DE JANEIRO 9
Cad. Saúde Pública 2017; 33(2):e00186615
process 30. Despite the municipality’s heterogeneity and the city’s construction as a mosaic of high and low-income populations, the classification adopted informally in zones allows revealing some common characteristics in locations which help explain the diffusion of the disease.
The landscape in the Central Zone consists of numerous buildings, few green and recreational areas, few remnants of unconsolidated urban area, and heavy circulation of people. Even with the low number of residents when compared to the other Zones, four neighborhoods in the Central Zone had five dengue epidemics.
The North Zone of Rio de Janeiro has the largest favelas, high population density, a shortage of public infrastructure services, and adverse socioeconomic conditions. Historically it was the city’s main industrial area and is now changing its role. The neighborhood of Vista Alegre had six dengue epidemics during the study period. Five other neighborhoods had five epidemics each. The North Zone serves as the main corridor for people circulating both within the municipality and to sur-rounding municipalities, so that it can act as an area of dengue diffusion and a prime scenario for the occurrence and perpetuation of epidemics.
In the South Zone, despite the high population density, some areas have a concentration of middle- and upper-middle-class residents; this Zone enjoys efficient public services, parks and green areas, and few favelas. In the South Zone, only the Urca neighborhood experienced five epidemics, but the epidemic in 2013 was concentrated in this zone.
The West Zone of Rio de Janeiro is the area with the largest recent changes in its landscape. It is the region of the municipality with the most intense on-going occupation and still has large areas with plant cover. The Camorim neighborhood experienced five epidemics. Another heavily affected neighborhood was Vargem Pequena, with four epidemics. These two neighborhoods border on green areas in the Pedra Branca State Park. Due to recent settlement, the region still suffers problems such as intermittent water supply, which can lead to inadequate household water storage (facilitating vec-tor breeding sites) 35.
Some studies on dengue diffusion corroborate the current study’s findings. Sharma et al. 36 ana-lyzed the spatial and temporal behavior of dengue hemorrhagic fever and concluded that a decrease in distance between cases correlated with outbreaks. Temporal proximity between cases suggests an emerging epidemic. This behavior was observed in the two major epidemics in Rio de Janeiro: the disease spread citywide in just 2 months in 2002 and in 3 months in 2008. The city also showed the patterns of dengue diffusion found by Kan et al. 37, with contiguous distribution and reallocation. Contiguous distribution was evident in the 2011-2012-2013 epidemic. In 2011 there was contigu-ous distribution in the North Zone. The epidemic period was random in 2012, and in 2013 it was concentrated in the South Zone.
Another important finding in this study was the transmission window for the disease. When epi-demics started in the early months of the year, they were more intense and with greater capacity to spread. Epidemics that begin later in the year may not succeed in maintaining a high number of cases due to declining temperature and rainfall and thus a decrease in the vector population 38.
Epidemics on a neighborhood scale show a similar behavior to those on a municipal scale. How-ever, the analyses showed specificities in neighborhoods with greater repetition of epidemics and different times in which the epidemics were observed. In these neighborhoods, dengue appears to be shifting to an endemic profile, as shown by data analysis in spatial units with different aggregation. Multiscale analyses identified local particularities and the interaction of factors acting at diverse levels of determination 34.
Analysis of the epidemics’ spatial distribution in the neighborhoods showed that Gericinó, Vasco da Gama, and Parque Colúmbia did not have epidemics in any of the study years. Gericinó is a pecu-liar case: not only was it recently apportioned as a neighborhood, but its territory is almost entirely occupied by the Gericinó Penitentiary Complex, where dengue may be underreported. Sousa et al. 39 discussed the problem of underreporting in prison populations, in their case evaluating tuberculosis cases. The dengue results in Gericinó should thus be viewed with the appropriate caution.
The neighborhoods of Vasco da Gama and Parque Colúmbia were created in 1998 and 1999, respectively, but they appear not to have been assimilated into the population’s feeling of belonging, and were thus not reported by anyone at the time of notification. This limits the analysis when using information on the neighborhood declared in the Brazilian Information System for Notifiable Dis-
Xavier DR et al.10
Cad. Saúde Pública 2017; 33(2):e00186615
eases (SINAN). Rio de Janeiro has a peculiar characteristic: although the city is formally demarcated for administrative purposes, some neighborhoods are more “acknowledged” by residents. An example is the Bonsucesso neighborhood, which is reported as the place of residence by people living around it, as in the neighborhoods of Complexo do Alemão and Manguinhos (known as favelas). Another example is the Jacarepaguá neighborhood, which people confuse with the Administrative Region by the same name. The Jacarepaguá Administrative Region consists of 10 neighborhoods, only one of which is called Jacarepaguá. However, many residents of other neighborhoods in this Administra-tive Region, like Freguesia, Tanque, Pechincha, Curicica, and others say they live in Jacarepaguá, thus overestimating the latter neighborhood’s disease reporting rates 46. This is an important potential limitation to the study.
Another limitation was the statistical model. More robust statistical models could help solve prob-lems of data variability and thus reduce error in the identification of false-positives and false-nega-tives. Meanwhile, the strategy used here has advantages considering implementation and use of health services, without seriously compromising accuracy in the detection of epidemics at the local level.
Dengue diffusion occurs through a complex process which includes the vector’s propagation and adaptation to the urban environment, population mobility (which facilitates circulation of the virus), and climate change, favoring vector reproduction and accelerating the transmission cycle 41. Large cities combine these components and provide a favorable substrate for dengue transmission.
Various studies have attempted to identify risk areas in cities and their social and environmental determinants 22,23,24,25,26,27,42, producing controversial results, that is, some indicating poor neighbor-hoods as risk areas for dengue, and others the opposite, with wealthier areas as the riskiest 24,43. This disparity of results may be the consequence of the spatial-temporal dynamics of dengue epidemics themselves. After major outbreaks, citywide dengue seroprevalence can reach 80%, and herd immu-nity is a determinant factor in the risk of new infections 44. Spatial distribution of dengue cases may thus differ considerably according to the moment in which the study is done. However, the studies agree on some indicators: population density, human mobility, mosquito infestation rates, and sanita-tion conditions as important collective risk factors.
We can thus conclude that despite the vast literature on dengue’s occurrence and explanatory vari-ables, the epidemics manifest themselves differently both in time and in space, and living conditions, income, sanitation, and other variables help explain the manifestation of disease, but the dynamism of dengue diffusion does not appear to be directly associated with these explanatory variables. Another important conclusion is that changing the scale of analysis to neighborhoods or even smaller analyti-cal units can help detect epidemic processes in the cities in advance, and thus orient health services in the search for more focused interventions.
Finally, this study’s data set and results were organized in a sentinel site to monitor the evolu-tion and diffusion of dengue in the city of Rio de Janeiro. This instrument, available on the Internet (http://www.climasaude.icict.fiocruz.br/rio), allows summarizing dengue activity with regular and continuous monitoring of cases. The tool can assist both health system users and managers to apply more focused and adequate interventions, taking local specificities into account. The methodology depends solely on dengue case reporting disaggregated by neighborhoods, census tracts, or health post coverage areas. These data are available in a large share of Brazilian municipalities. Their routine use in health surveillance services would allow detection of localized outbreaks and their tendency to spread in cities.

SPATIAL-TEMPORAL DIFFUSION OF DENGUE IN THE MUNICIPALITY OF RIO DE JANEIRO 11
Cad. Saúde Pública 2017; 33(2):e00186615
Contributors
D. R. Xavier, M. A. F. M. Magalhães, R. Gracie, I. C. Reis, V. P. Matos, and C. Barcellos participated in the study conception and project, data analysis and interpretation, writing of the article, and approval of the final version for publication.
Acknowledgments
This article is a contribution by the Brazilian Research Network on Global Climate Change. The authors wish to thank the Brazilian National Research Council (CNPq) for grant 552746/2011-8. National Observatory on Climate and Health, Institute of Scientific and Technological Commu-nication and Information in Health, Oswaldo Cruz Foundation.
References
1. Gubler DJ, Kuno G. Dengue and dengue hem-orrhagic fever. Wallingford: CAB International; 1997.
2. Ministério da Saúde. Dengue. http://portalsau de.saude.gov.br/index.php/o-ministerio/prin cipal/secretarias/svs/dengue (accessed on 09/Oct/2015).
3. World Health Organization. Dengue and severe dengue. http://www.who.int/mediacentre/ factsheets/fs117/en/ (accessed on 02/Sep/ 2015).
4. Bhatt S, Gething PW, Brady OJ, Messina JP, Farlow AW, Moyes CL, et al. The global dis-tribution and burden of dengue. Nature 2013; 496:504-7.
5. Pan American Health Organization. Strategic plan of the Pan American Health Organization 2014-1019. 52nd Directing Council and 65th Session of the Regional Committee. Wash-ington D.C., USA, 30 September – 4 October 2013. http://www.paho.org/ (accessed on 02/Sep/2015).
6. Ministério da Saúde. Casos de dengue. Brasil, Grandes regiões e Unidades Federadas, 1990 a 2014. http://portalsaude.saude.gov.br/ima ges/pdf/2015/julho/29/Dengue-at---2014.pdf (accessed on 02/Sep/2015).
7. Schatzmayr HG, Nogueira RMR, Travassos da Rosa APA. An outbreak of dengue virus at Rio de Janeiro. Mem Inst Oswaldo Cruz 1986; 81:245-6.
8. Nogueira RMR, Miagostovich MP, Lampe E, Schatzmayr HG. Isolation of dengue virus type 2 in Rio de Janeiro. Mem Inst Oswaldo Cruz 1990; 85:253.
9. Nogueira RMR, Miagostovich MP, Schatzmayr HG, Santos FB, Araújo ESM, Filippis AMB, et al. Dengue in the state of Rio de Janeiro, Bra-zil, 1986-1998. Mem Inst Oswaldo Cruz 1999; 94:297-304.
10. Nogueira RMR, Miagostovich MP, de Filippis AMB, Pereira MAS, Schatzmayr HG. Dengue virus type 3 in Rio de Janeiro, Brazil. Mem Inst Oswaldo Cruz 2001; 96:925-6.
11. Lourenço-de-Oliveira R, Honório NA, Castro MG, Schatzmayr HG, Miagostovich MP, Alves JCR, et al. Dengue virus type 3 isolation from Aedes aegypti in the municipality of Nova Igua-çu, State of Rio de Janeiro. Mem Inst Oswaldo Cruz 2002; 97:799-800.
12. Nogueira RMR, Schatzmayr HG, Filippis AMB, Santos FB, Cunha RV, Coelho JO, et al. Den-gue virus type 3, Brazil, 2002. Emerg Infect Dis 2005; 11:1376-81.
13. De Simone TS, Nogueira RMR, Araújo ESM, Guimarães FR, Santos FB, Schatzmayr HG, et al. Dengue virus (DENV) surveillance: the co-circulation of DENV-1, 2 and 3 in the state of Rio de Janeiro, Brazil. Trans R Soc Trop Med Hyg 2004; 98:553-62.
Xavier DR et al.12
Cad. Saúde Pública 2017; 33(2):e00186615
14. Honório NA, Nogueira RMR, Codeço CT, Car-valho MS, Cruz OG, Magalhães MAFM, et al. Spatial evaluation and modeling of dengue se-roprevalence and vector density in Rio de Ja-neiro, Brazil. PLoS Negl Trop Dis 2009; 3:e545.
15. Nogueira RMR, Eppinghaus ALF. Dengue vi-rus type 4 arrives in the state of Rio de Janeiro: a challenge for epidemiological surveillance and control. Mem Inst Oswaldo Cruz 2011; 106:255-6.
16. Nogueira RMR, Miagostovish MP, Schatzmayr HC. Dengue virus in Brazil. Dengue Bull 2002; 26:1-10.
17. Honório NA, Codeço CT, Alves FC, Magalhães MAFM, Lourenço-de-Oliveira R. Temporal distribution of Aedes aegypti in different districts of Rio de Janeiro, Brazil, measured by two types of traps. J Med Entomol 2009; 46:1001-14.
18. Miagostovich MP, Nogueira RMR, Cavalcanti SMB, Marzochi KBF, Schatzmayr HG. Dengue epidemic in the state of Rio de Janeiro, Brazil: virological and epidemiological aspects. Rev Inst Med Trop São Paulo 1993; 35:149-54.
19. Luz PM, Codeço CT, Massad E, Struchiner CJ. Uncertainties regarding dengue modelling in Rio de Janeiro, Brazil. Mem Inst Oswaldo Cruz 2003; 98:871-8.
20. Getis A, Morrison AC, Gray K, Scott TW. Char-acteristics of the spatial patterns of the dengue vector, Aedes aegypti in Iquitos, Peru. Am J Trop Med Hyg 2003; 69:494-505.
21. Tauil PL. Urbanização e ecologia do dengue. Cad Saúde Pública 2001; 17 Suppl:99-102.
22. Mondini A, Chiaravalloti NF. Variáveis socioe-conômicas e a transmissão de dengue. Rev Saú-de Pública 2007; 41:923-30.
23. Cunha MCM, Caiaffa WT, Oliveira CL, Kroon EG, Pessanha JEM, Lima JA. Fatores associados à infecção pelo vírus do dengue no Município de Belo Horizonte, Estado de Minas Gerais, Brasil: características individuais e diferenças intra-urbanas. Epidemiol Serv Saúde 2008; 17:217-30.
24. Flauzino RF, Souza-Santos R, Oliveira RM. Dengue, geoprocessamento e indicadores so-cioeconômicos e ambientais: um estudo de revi-são. Rev Panam Salud Pública 2009; 25:456-61.
25. da Costa AIP, Natal D. Distribuição espacial da dengue e determinantes socioeconômicos em localidade urbana no Sudeste do Brasil. Rev Saúde Pública 1998; 32:232-6.
26. Teixeira TRA, Medronho RA. Indicadores só-cio-demográficos e a epidemia de dengue em 2002 no Estado do Rio de Janeiro, Brasil. Cad Saúde Pública 2008; 24:2160-70.
27. Machado JP, Oliveira RM, Souza-Santos R. Análise espacial da ocorrência de dengue e con-dições de vida na cidade de Nova Iguaçu, Esta-do do Rio de Janeiro, Brasil. Cad Saúde Pública 2009; 25:1025-34.
28. Prefeitura do Rio de Janeiro. Características geográficas. http://www.rio.rj.gov.br/web/riotur/caracteristicas-geograficas (accessed on 14/May/2015).
29. Pelat C, Boell PY, Cowling BJ, Carrat F, Flahault A, Ansart S, et al. Online detection and quanti-fication of epidemics. BMC Med Inform Decis Mak 2007, 7:29.
30. Alonso WJ, McCormick BJJ. EPIPOI: a user-friendly analytical tool for the extraction and visualization of temporal parameters from epi-demiological time series. BMC Public Health 2012; 12:982.
31. Serfling RE. Methods for current statistical analysis of excess pneumonia-influenza deaths. Public Health Rep 1963; 78:494-506.
32. Houswrth J, Langmuir AD. Excess mortality from epidemic influenza, 1957-1966. Am J Epi-demiol 1974; 100:40-8.
33. Rogers DJ, Randolph SE, Snow RW, Hay SI. Satellite imagery in the study and forecast of malaria. Nature 2000; 415:710-5.
34. Elliott JM. Some methods for the statisti-cal analysis of sample benthic invertebrates. Ambleside: Freshwater Biological Association; 1979.
35. Monteiro ESC, Coelho ME, Cunha ISD, Caval-cante MDAS, Carvalho FADA. Aspectos epide-miológicos e vetoriais da dengue na cidade de Teresina, Piauí – Brasil, 2002 a 2006. Epidemiol Serv Saúde 2009; 18:365-74.
36. Sharma KD, Mahabir RS, Curtin KM, Suther-land JM, Agard, JB, Chadee DD. Exploratory space-time analysis of dengue incidence in Trinidad: a retrospective study using travel hubs as dispersal points, 1998-2004. Parasit Vectors 2014; 7:1-11.
37. Kan CC, Lee PF, Wen TH, Chao DY, Wu MH, Lin NH, et al. Two clustering diffusion patterns identified from the 2001-2003 dengue epi-demic, Kaohsiung, Taiwan. Am J Trop Med Hyg 2008; 79:344-52.
38. Lowe R, Barcellos C, Coelho CA, Bailey TC, Coelho GE, Graham R, et al. Dengue outlook for the World Cup in Brazil: an early warning model framework driven by real-time sea-sonal climate forecasts. Lancet Infect Dis 2014; 14:619-26.
39. Sousa LMO, Pinheiro RS. Óbitos e internações por tuberculose não notificados no Município do Rio de Janeiro. Rev Saúde Pública 2011; 45:31-9.
40. Magalhães MAFM, de Matos VP, de Andrade Medronho R. Avaliação do dado sobre ende-reço no Sistema de Informação de Agravos de Notificação utilizando georreferenciamento em nível local de casos de tuberculose por dois métodos no Município do Rio de Janeiro. Cad Saúde Colet (Rio J.) 2014; 22:192-9.
41. Jetten TH, Focks DA. Potential changes in the distribution of dengue transmission under climate warming. Am J Trop Med Hyg 1997; 57:285-97.
42. Kikuti M, Cunha GM, Paploski IA, Kasper AM, Silva MM, Tavares AS, et al. Spatial distribution of dengue in a Brazilian urban slum setting: role of socioeconomic gradient in disease risk. PLoS Negl Trop Dis 2015; 9:e0003937.
SPATIAL-TEMPORAL DIFFUSION OF DENGUE IN THE MUNICIPALITY OF RIO DE JANEIRO 13
Cad. Saúde Pública 2017; 33(2):e00186615
43. Chiaravalloti-Neto F, Pereira M, Fávaro EA, Dibo MR, Mondini A, Rodrigues-Junior AL, et al. Assessment of the relationship between entomologic indicators of Aedes aegypti and the epidemic occurrence of dengue virus 3 in a sus-ceptible population, São José do Rio Preto, São Paulo, Brazil. Acta Trop 2015; 142:167-77.
44. Siqueira-Junior JB, Maciel IJ, Barcellos C, Sou-za WV, Carvalho MS, Nascimento NE, et al. Spatial point analysis based on dengue surveys at household level in central Brazil. BMC Pub-lic Health 2008; 8:361.
Resumo
A cidade do Rio de Janeiro, Brasil, apresenta ele-vado potencial de receptividade para a introdu-ção, disseminação e persistência da transmissão de dengue. A ocupação do município conformou um mosaico heterogêneo e diversificado, com dis-tribuição vetorial diferenciada entre e dentro dos bairros, proporcionando epidemias distintas nesta escala de observação. Este trabalho busca identifi-car essas epidemias e o padrão de difusão da trans-missão do dengue sob a dimensão de tempo e espa-ço. Foi utilizado um modelo para a identificação de epidemias considerando os anos e meses de pico epidêmico, a distribuição espacial e a permanência das epidemias levando-se em conta o período de janeiro de 2000 a dezembro de 2013. Foram conta-bilizados 495 picos epidêmicos, e na escala de tem-po evidenciou-se maior ocorrência nos meses de março, abril e fevereiro, respectivamente. Alguns bairros parecem apresentar um quadro persisten-te de incidência de dengue e o comportamento da difusão da doença permite identificar trajetórias e meses oportunos para a intervenção.
Dengue; Análise Espaço-Temporal; Epidemias
Resumen
La ciudad de Río de Janeiro, Brasil, presenta un elevado potencial de receptividad para la introduc-ción, diseminación y persistencia de la transmisión de dengue. La ocupación del municipio conformó un mosaico heterogéneo y diversificado, con dis-tribución vectorial diferenciada entre y dentro de los barrios, proporcionando epidemias distintas en esta escala de observación. Este trabajo busca identificar esas epidemias y el patrón de difusión de la transmisión del dengue, bajo la dimensión de tiempo y espacio. Se utilizó un modelo para la identificación de epidemias, considerando los años y meses de pico epidémico, la distribución espacial y la permanencia de las epidemias, teniéndose en cuenta el período de enero de 2000 a diciembre de 2013. Se contabilizaron 495 picos epidémicos, y en la escala de tiempo se evidenció una mayor ocurrencia durante los meses de marzo, abril y fe-brero, respectivamente. Algunos barrios parecen presentar un cuadro persistente de incidencia de dengue y el comportamiento de la difusión de la enfermedad permite identificar trayectorias y me-ses oportunos para la intervención.
Dengue; Análisis Espacio-Temporal; Epidemias
Submitted on 13/Nov/2015Final version resubmitted on 11/Apr/2015Approved on 02/May/2016