Embed Size (px)
Citation preview

Universidade de Aveiro
2015
Departamento de Engenharia de Materiais e Cerâmica
Ensieh Seyedhosseini
Piezoeletricidade e Ferroeletricidade em Aminoácido Glicina Piezoelectricity and Ferroelectricity in Amino Acid Glycine

Universidade de Aveiro
2015
Departamento de Engenharia de Materiais e Cerâmica
Ensieh Seyedhosseini
Piezoeletricidade e Ferroeletricidade em Aminoácido Glicina Piezoelectricity and Ferroelectricity in Amino Acid Glycine
Tese apresentada à Universidade de Aveiro para cumprimento dos requisitos necessários à obtenção do grau de Doutor em nanociências e nanotecnologia, realizada sob a orientação científica do Dr. Andrei Kholkin, Investigador Coordenador do Departamento de Fisica e do CICECO da Universidade de Aveiro, e do Dr. Igor Bdikin, Investigador do Departamento de Engenharia Mecânica da Universidade de Aveiro.
Dissertation submitted to the University of Aveiro, as the fulfilment of necessary requirements for obtaining the Ph.D. degree in Nanoscience and Nanotechnology was carried out under the supervision of Dr. Andrei Kholkin, Research Coordinator of the Department of Physics and CICECO of the University of Aveiro and co-supervision of Dr. Igor Bdikin, Investigator of the Department of Mechanical Engineering of the University of Aveiro.
Bolsa de Doutoramento concedida pela Comissão Europeia no âmbito da Rede de Formação Inicial FP7 Marie Curie "Nanomotion". (referência № 290158/2012)
Ph.D. scholarship granted by the European Commission within the FP7 Marie Curie Initial Training Network “Nanomotion”. (reference № 290158/2012)

o júri
presidente Professor Doutor Manuel João Senos Matias Professor catedrático da Universidade de Aveiro
Professor Doutor José Ramiro Afonso Fernandes Professor Auxiliar do Departamento de Física da Universidade de Trás-os-Montes e Alto Douro
Professor Doutor Joaquim Agostinho Gomes Moreira Professor Auxiliar do Departamento de Física e Astronomia da Universidade do Porto
Professor Doutor Maria do Carmo Henriques Lança Professora Auxiliar do Departamento de Ciência dos Materiais da Universidade Nova de Lisboa
Professor Doutor Vitor Brás de Sequeira Amaral Professor catedrático do Departamento de Física da Universidade de Aveiro
Doutor Andrei Kholkin Investigador Coordenador do Departamento de Física e do CICECO da Universidade de Aveiro

agradecimentos
First and foremost, I would like to express my sincere appreciation to my supervisor, Dr. Andrei Kholkin, for his advice, support and patience during the development of the work. His vast and deep knowledge as well as his consistent encouragement helped me overcome difficulties in my research. He provided innumerable guidance in every step of the way while gave me the freedom to develop my ideas. I consider it as a great opportunity to do my doctoral program under his supervision and to learn from his research expertise. I am very grateful to my co-supervisor, Dr. Igor Bdikin, for his continuous help and numerous guidance throughout the work. He has generously given his time, knowledge and expertise in the field of PFM and general materials characterization all along these years. A special thanks to Dr. Vladimir Bystrov for the valuable contributions and his kindness in sharing his knowledge. His expertise in Computational Modelling was of great help to a deeper understanding and better interpretation the experimental results. I would like to thank Dr. Brian Rodriguez for the support, fruitful discussions and the valuable ideas he gave me during my stay at the University College Dublin. The contribution of the members of the Prof. Vladimir Shur’s group in Ural Federal University (Ekaterinburg) is gratefully acknowledged. My Particular thanks goes to Dr. Pavel Zelenovskiy for all the Raman Spectroscopy measurements and interpretations. I would also like to thank the members of our research group, especially Dr. Maxim Ivanov, Dr. Svitlana Kopyl and Gonçalo Rodrigues for all their assistances. Thanks to Dr. Dmitry Isakov and Prof. Nikolay Pertsev for the discussions and comments on the work. I acknowledge the financial support from the European Commission within the FP7 Marie Curie Initial Training Network “Nanomotion” (grant agreement № 290158). My deep gratitude goes to my parents, their continued encouragement and unconditional support drove me to move forward in my study. Last but not least, thanks to my husband, Saeed who absolutely supported me every step of the way. Thank you for your understanding, patience and caring throughout the hard times of my work.

palavras-chave
piezoelectricidade, ferroelectricidade, biomateriais, aminoácidos, glicina, Microscopia de Piezo Força, domínios estruturais, ópticas não-lineares, modelação molecular
resumo
Piezo e ferroeléctricos biorgânicos são materiais que estão a atrair para si uma importância crescente por força da sua compatibilidade intrínseca com ambientes biológicos e uma biofuncionalidade aliada a um forte efeito piezoeléctrico e polarização controlada, a temperature ambiente. Aqui estudamos a piezo e ferroelectricidade no mais pequeno aminoácido, a glicina, representando uma ampla classe de aminoácidos nao-centrosimétricos. A glicina é um elemento básico e extremamente importante em biologia, uma vez que serve de unidade base de construção para proteínas. Três formas polifórmicas com diferentes propriedades são possíveis na glicina (α, β e γ). De especial interesse para várias aplicações são as estruturas não-centrosimétricas: β-glycina e γ-glycina. A mais interessante β-polimorfa está a ser alvo de uma atenção reduzida, comparativamente às outras, por motivos de uma maior instabilidade a temperatura ambiente. Neste trabalho, Podemos crescer microcristais estáveis de glicina-β pela evaporação da solução aquosa num substrato (111)Pt/Ti/SiO2/Si que funciona como "template". Os efeitos da concentração da solução e da nucleação Pt-assistida no crescimento do cristal e evolução da fase foram estudados com recurso à difracção Raio-X e espectroscopia Raman. Adicionalmente, a técnica de "spin-coating" foi utilizada para a fabricação de nano-ilhas de glicina-β altamente alinhadas, com a orientação dos eixos cristalográficos normalizada pelo substrato de Pt. Estudamos a indução de domínios estruturais por meio da ponta do AFM e a variação da polarização nos sistemas moleculares da β-glicina através da técnica PFM (Microscopia de Piezo Força), comparando os resultados obtidos com modelação molecular e simulações computacionais. Mostramos que a β-glycina é de facto um piezoeléctrico à temperatura ambiente e a polarização pode ser controlada por aplicação de uma tensão a cortes não polares. A dinâmica destes domínios complanares é estudada como função da tensão aplicada e duração do pulso. A forma do domínio é ditada pela polarização interna e externa, cujo rastreio é mediado por defeitos e características topográficas. A teoria termodinâmica é aplicada para explicar a propagação dos domínios induzidos pela ponta do AFM. As nossas descobertas sugerem que a β-glycina é um ferroeléctrico uniaxial com propriedades controladas pelas fronteiras dos domínios (electronicamente carregadas), que em seu turno podem ser manipuladas por tensão externa.
Adicionalmente, propriedades ópticas não-lineares da β-glycina foram investigadas por um método de segunda geração harmonica (SHG). Este método confirmou que a simetria axial é preservada em cristais crescidos sem pós-tratamento, reflectindo a esperada simetria P21 da fase β. A direcção da polarização espontânea mostrou ser paralela ao eixo monoclínico [010] e direccionada no comprimento do cristal. Estes dados foram confirmados por modelação computacional molecular. Medições ópticas revelaram também um valor relativamente elevado para a susceptabilidade óptica não-linear (50% maior que no quartzo com corte em z). O pontencial uso de cristais de β-glycina estáveis em diversas aplicações são também discutidos.

keywords
piezoelectricity, ferroelectricity, biomaterials, amino acids, glycine, Piezoresponse Force Microscopy, domain structure, nonlinear optic, molecular modeling
abstract
Bioorganic ferroelectrics and piezoelectrics are becoming increasingly important in view of their intrinsic compatibility with biological environment and biofunctionality combined with strong piezoelectric effect and switchable polarization at room temperature. Here we study piezoelectricity and ferroelectricity in the smallest amino acid glycine, representing a broad class of non-centrosymmetric amino acids. Glycine is one of the basic and important elements in biology, as it serves as a building block for proteins. Three polymorphic forms with different physical properties are possible in glycine (α, β and γ), Of special interest for various applications are non-centrosymmetric polymorphs: β-glycine and γ-glycine. The most useful β-polymorph being ferroelectric took much less attention than the other due to its instability under ambient conditions. In this work, we could grow stable microcrystals of β-glycine by the evaporation of aqueous solution on a (111)Pt/Ti/SiO2/Si substrate as a template. The effects of the solution concentration and Pt-assisted nucleation on the crystal growth and phase evolution were characterized by X-ray diffraction analysis and Raman spectroscopy. In addition, spin-coating technique was used for the fabrication of highly aligned nano-islands of β-glycine with regular orientation of the crystallographic axes relative the underlying substrate (Pt). Further we study both as-grown and tip-induced domain structures and polarization switching in the β-glycine molecular systems by Piezoresponse Force Microscopy (PFM) and compare the results with molecular modeling and computer simulations. We show that β-glycine is indeed a room-temperature ferroelectric and polarization can be switched by applying a bias to non-polar cuts via a conducting tip of atomic force microscope (AFM). Dynamics of these in-plane domains is studied as a function of applied voltage and pulse duration. The domain shape is dictated by both internal and external polarization screening mediated by defects and topographic features. Thermodynamic theory is applied to explain the domain propagation induced by the AFM tip. Our findings suggest that β-glycine is a uniaxial ferroelectric with the properties controlled by the charged domain walls which in turn can be manipulated by external bias.

Besides, nonlinear optical properties of β-glycine were investigated by a second harmonic generation (SHG) method. SHG method confirmed that the 2-fold symmetry is preserved in as-grown crystals, thus reflecting the expected P21 symmetry of the β-phase. Spontaneous polarization direction is found to be parallel to the monoclinic [010] axis and directed along the crystal length. These data are confirmed by computational molecular modeling. Optical measurements revealed also relatively high values of the nonlinear optical susceptibility (50% greater than in the z-cut quartz). The potential of using stable β-glycine crystals in various applications are discussed in this work.
I
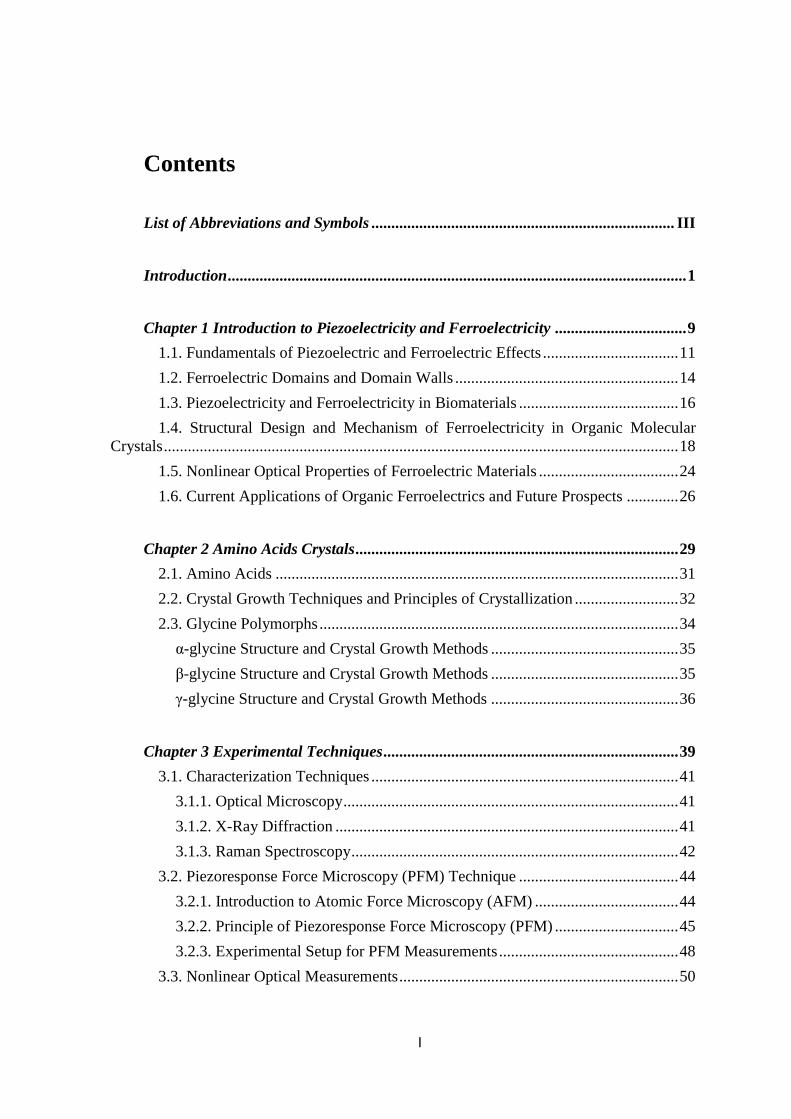
Contents
List of Abbreviations and Symbols ............................................................................ III
Introduction ................................................................................................................... 1
Chapter 1 Introduction to Piezoelectricity and Ferroelectricity ................................. 9
1.1. Fundamentals of Piezoelectric and Ferroelectric Effects .................................. 11
1.2. Ferroelectric Domains and Domain Walls ........................................................ 14
1.3. Piezoelectricity and Ferroelectricity in Biomaterials ........................................ 16
1.4. Structural Design and Mechanism of Ferroelectricity in Organic Molecular
Crystals ................................................................................................................................. 18
1.5. Nonlinear Optical Properties of Ferroelectric Materials ................................... 24
1.6. Current Applications of Organic Ferroelectrics and Future Prospects ............. 26
Chapter 2 Amino Acids Crystals ................................................................................. 29
2.1. Amino Acids ..................................................................................................... 31
2.2. Crystal Growth Techniques and Principles of Crystallization .......................... 32
2.3. Glycine Polymorphs .......................................................................................... 34
α-glycine Structure and Crystal Growth Methods ............................................... 35
β-glycine Structure and Crystal Growth Methods ............................................... 35
γ-glycine Structure and Crystal Growth Methods ............................................... 36
Chapter 3 Experimental Techniques .......................................................................... 39
3.1. Characterization Techniques ............................................................................. 41
3.1.1. Optical Microscopy .................................................................................... 41
3.1.2. X-Ray Diffraction ...................................................................................... 41
3.1.3. Raman Spectroscopy .................................................................................. 42
3.2. Piezoresponse Force Microscopy (PFM) Technique ........................................ 44
3.2.1. Introduction to Atomic Force Microscopy (AFM) .................................... 44
3.2.2. Principle of Piezoresponse Force Microscopy (PFM) ............................... 45
3.2.3. Experimental Setup for PFM Measurements ............................................. 48
3.3. Nonlinear Optical Measurements ...................................................................... 50

II
Chapter 4 Crystal Growth and Characterization ....................................................... 53
4.1. Crystallization from Solution ............................................................................ 55
α-glycine .............................................................................................................. 55
γ-glycine ............................................................................................................... 56
β-glycine .............................................................................................................. 58
4.2. Crystal Growth on the Substrate ....................................................................... 61
4.2.1. Sample Preparation .................................................................................... 61
4.2.2. Structural Characterization of Glycine Microcrystals ............................... 62
4.3. Glycine Thin Films............................................................................................ 71
4.3.1. Thin Film Preparation ................................................................................ 71
4.3.2. Structural Characterization of Thin Films ................................................. 72
4.4. Summary ........................................................................................................... 74
Chapter 5 Electromechanical and Non-linear Optical Properties of Glycine Crystals
.................................................................................................................................................. 75
5.1. PFM in γ-glycine ............................................................................................... 77
5.2. PFM in Needle-shaped β-glycine ...................................................................... 79
5.2.1. Domain Imaging ........................................................................................ 79
5.2.2. Switchability of β-glycine .......................................................................... 84
5.3. Theoretical Calculations .................................................................................... 90
5.4. Molecular Modelling ......................................................................................... 93
5.5. PFM in Dendrite-type β-crystals ....................................................................... 97
5.6. PFM in Thin Films of β-crystals ....................................................................... 98
5.7. Optical Characterization of β-glycine Single Crystal ..................................... 100
5.8. Summary ......................................................................................................... 104
Chapter 6 Conclusions and Future Work ................................................................ 105
6.1. Conclusions ..................................................................................................... 107
6.2. Future Work .................................................................................................... 109
References ................................................................................................................. 110
List of Publications 125

III
List of Abbreviations and Symbols
SPM Scanning probe microscopy
AFM Atomic force microscopy
PFM Piezoresponse force microscopy
VPFM Vertical piezoresponse force microscopy
LPFM Lateral piezoresponse force microscopy
MEMS Miniaturized electromechanical systems
EFM Electrostatic force microscopy
SHG Second harmonic generation
PXRD Powder X-ray diffraction
RH Relative humidity
SAW Surface acoustic wave
FRAM Ferroelectric random access memory
BTO Barium titanate
PZT Lead zirconate titanate
TGS Tri-glycine sulfate
PbTiO3 Lead titanate
LiNbO3 Lithium niobate
PVDF Polyvinylidene fluoride
TrFE Trifluoroethylene
CT Charge-transfer
D Donor
A Acceptor
TTF Tetrathiafulvalene
HS High symmetry
LS Low symmetry
Phz Phenazine
PMDI Pyromellitic diimide
DIPAC Diisopropylammonium chloride
DIPAB Diisopropylammonium bromide
KTP Potassium titanyl phosphate
BPI Betaine phosphite

IV
GPI Glycine phosphite
SAMs Self-assembled monolayers
QPM Quasi-phase-matching
HB Hydrogen bonding
NLO Nonlinear optical
DNA Deoxyribonucleic acid
PF Phase fingerprints
H2ca Chloranilic acid
H2ba Bromanilic acid
KH2PO4 (KDP) Potassium dihydrogen phosphate
TTF-CA Tetrathiafulvalene-chloranil
dabcoHReO4 1,4-diazabicyclo[2.2.2]octane perrhenate
[H-55dmbp][Hia] 5,5’-dimethyl-2,2’-bipyridine and iodanilic acid
ZnO Zinc oxide
SBN Strontium-barium niobate
IP In-plane
OOP Out-of-plane
P-E Polarization-electric field
x-E Strain-electric field
LDA Local density approximation
PM3 Parameterized model number 3
UHF Unrestricted Hartree-Fock
α, β, γ Glycine phases
Pi Total polarization
PR Remanent polarization
Ps Spontaneous polarization
σjk Stress tensor
dijk Piezoelectric coefficients
Sjk Strain tensor
Ei Electric field
Ec Coercive field
V+ Forward coercive voltage
V− Reverse coercive voltage
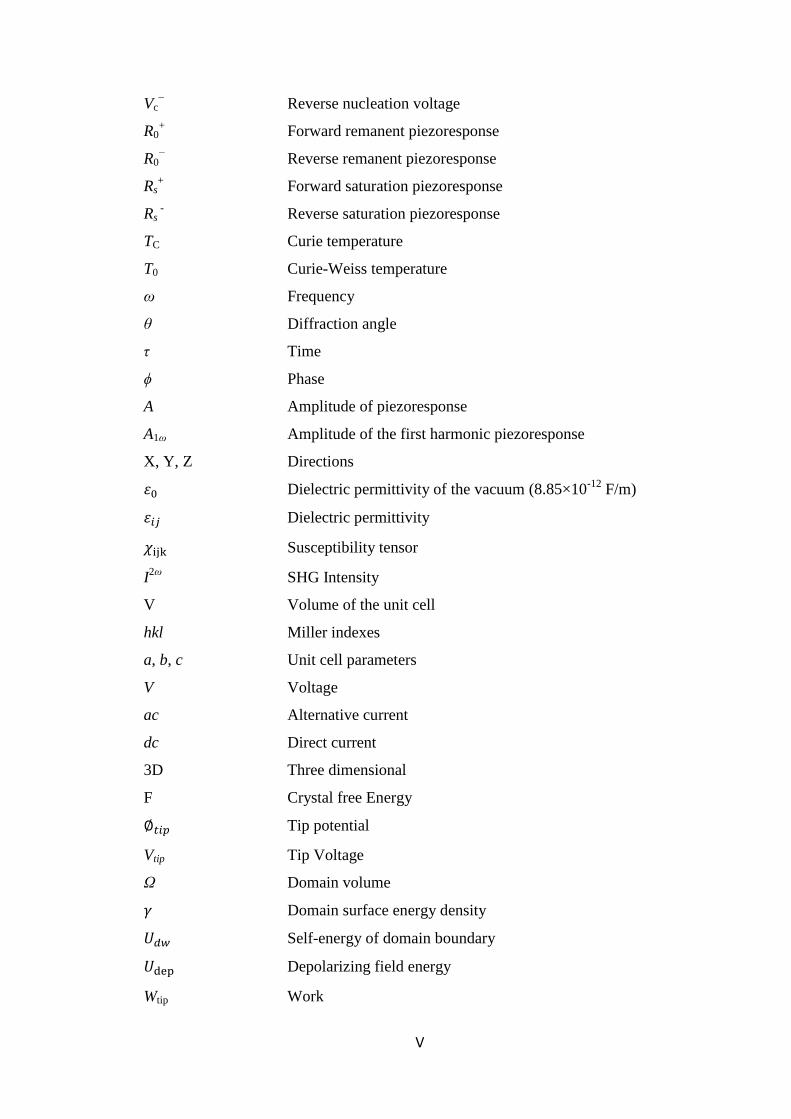
Vc+
Forward nucleation voltage
V
Vc−
Reverse nucleation voltage
R0+
Forward remanent piezoresponse
R0−
Reverse remanent piezoresponse
Rs+
Forward saturation piezoresponse
Rs -
Reverse saturation piezoresponse
TC Curie temperature
T0 Curie-Weiss temperature
ω Frequency
θ Diffraction angle
τ Time
ϕ Phase
A Amplitude of piezoresponse
A1ω Amplitude of the first harmonic piezoresponse
X, Y, Z Directions
𝜀0 Dielectric permittivity of the vacuum (8.85×10⁻¹²
F/m)
𝜀𝑖𝑗 Dielectric permittivity
𝜒ijk Susceptibility tensor
I2ω
SHG Intensity
V Volume of the unit cell
hkl Miller indexes
a, b, c Unit cell parameters
V Voltage
ac Alternative current
dc Direct current
3D Three dimensional
F Crystal free Energy
∅𝑡𝑖𝑝 Tip potential
Vtip Tip Voltage
Ω Domain volume
𝛾 Domain surface energy density
𝑈𝑑𝑤 Self-energy of domain boundary
𝑈dep Depolarizing field energy
Wtip Work

VI
rtip Tip radius
H Tip height
L Cantilever length
L Domain length
W Domain width
α Polarizability
Qy Electrostriction coefficient
Pt Platinum
Ti Titanium
SiO2 Silicon dioxide
Si Silicon
P Primitive
C Cubic phase
(…) Plane
[…] Direction

Introduction

Introduction
2

Introduction
3
Creating artificial biomimetic materials with multiple functions similar to those of
living bodies is an important frontier for advanced society in near future. Electromechanical
coupling is one of the important functional properties of several classes of organic and
bioorganic materials [1] and is one of the essential features of biological and living systems,
in particular, regarding their electrical and mechanical signalization [2,3]. It is based on the
complex dipolar properties and dipole-dipole interactions conjugated with hydrogen bonds
network in biomolecular systems with different levels of self-assembly and hierarchy.
Recently, electromechanical coupling in various biomolecular structures (both
crystalline and natural composites) based on important biological molecules has been
observed and several materials have demonstrated functional properties similar to their
inorganic counterparts, namely, sufficiently strong piezoelectricity and, furthermore, apparent
ferroelectric-like behavior [4]. Understanding the relationship between the generated electric
fields and applied mechanical stress is the main motivation for studying piezoelectricity in
biological systems and artificial biomaterials. Since the early stage of investigation of
biological piezoelectricity, researchers have proposed the undeniable role of
electromechanics in the biological tissue development, in the movement of muscles and in the
functioning of the nerve system of the body [5,6]. However, initial studies of biological
systems have been performed on the macroscopic level, such as conventional
electromechanical tests and dielectric measurements. Due to the complex hierarchical
structure of these biomaterials, they provide only an averaged signal and quantitative
piezoelectric measurements have not been unambiguously conducted.
Of further interest is that new bioorganic ferroelectric/piezoelectric materials have the
potential to replace some traditional inorganic ones in practical devices, for example they can
be used as natural biocompatible elements in medical implants, biosensors, bioelectronics,
harvesting systems, MEMS, etc. [7].
In addition, in the last two decades, there has been an increasing application of
ferroelectrics in miniaturized systems, pushing research towards size effects and nanoscale
studies. It is therefore important to understand and to investigate ferroelectric properties
down to the nanoscale. In this regard, the emergence of Piezoresponse Force Microscopy
(PFM) offers a powerful tool to probe local piezoelectricity and ferroelectricity at the
nanoscale [8]. PFM is a scanning probe technique based on the converse piezoelectric effect
that is present in all ferroelectric materials. This technique allows both the detection and the

Introduction
4
manipulation of the polarization state with a resolution down to 10 nm. It has been
extensively used to study a variety of biological tissues, biopolymers and molecular crystals
[7,9,10]. Using this technique, sophisticated domain structures have been imaged, domain
switching characteristics have been determined, and biological ferroelectricity has been
discovered [11,12].
In most studied examples of biomaterials, the presence of polar molecules and their
inherent chirality are possibly the intrinsic reasons of electromechanical effects in them.
Thus, a systematic way to understand the origin of this electromechanical coupling in a
biomaterial is to study first the elementary blocks constituting a tissue rather than a complex
biological system such as protein fibrils or even more deeply within the element structure of
proteins (i.e., amino acids).
It has been reported [13,14] that many amino acids have a non-centrosymmetric
crystal structure and can be even ferroelectric when probed at small dimensions.
Unfortunately, existing data on local electromechanical properties of amino acids is limited to
experimental results obtained before the development of nanotechnological methods such as
Atomic Force Microscopy (AFM) and its novel modes like PFM.
In order to understand the electromechanical properties of glycine molecules we need
to study their properties using both macroscopic techniques such as X-ray, Raman scattering,
non-linear optics, etc but also the local methods including Scanning Probe Microscopy such
as AFM/EFM/PFM. These studies require well-defined structure rather than a complicated
biological tissue. Furthermore for any application of them as a functional biomaterial in
practical devices we need to investigate the relation between the functional properties and
their three-dimensional polar structure. For these two reasons, the assembly of ordered
molecules as a single crystal is preferable for our study.
Recent studies on the simplest amino acid glycine have demonstrated that it is a
suitable material with apparent ferroelectric properties and square piezoresponse hysteresis
loops at room temperature [15]. Glycine is one of the basic and important elements in biology
as it serves as a building block for many biological macromolecules, such as peptides or
proteins [16]. The main structural and physical properties of glycine crystals are reviewed
and studied in this work, in particular in the context of their notable piezoelectric and
ferroelectric properties.

Introduction
5
Glycine can exists in three major polymorphic forms at ambient conditions: α, β and γ
phases. From symmetry considerations, piezoelectricity can exist only in non-symmetric
polar materials. It has been long time known that α-glycine crystals are centrosymmetric [17]
and, therefore, do not exhibit any property described by the 3rd
rank tensor such as
piezoelectricity or second harmonic generation (SHG). On the contrary, γ- [18] and β-glycine
[19] polymorphs are strongly non-centrosymmetric (with two differently formed and oriented
by individual dipoles of each glycine molecules) and, therefore, can be used as a
biocompatible nonlinear optical and piezoelectric/ferroelectric material [20,21].
The overall objective of this dissertation was first to develop a method of growing
useful β- and γ-glycine crystals with well-defined shape and morphology from the solution
and to investigate the conditions that affect the growth of crystals and polymorph selectivity.
To achieve this goal, several synthesis methods were tried. A full set of the structural
parameters of the crystal polymorphs was obtained in order to understand their
electromechanical properties. Due to that, all the grown crystals were first characterized by
the combination of structural characterization methods such as optical microscopy, X-ray
diffraction (XRD), Raman spectroscopy and non-linear optical response.
The second objective was to investigate their electromechanical properties on the
nano- and microscale level using PFM and characterize their domain structure and the
switching properties so that to understand the microscopic mechanisms of their
ferroelectricity.
Following this Introduction the present thesis is organized in six Chapters:
In Chapter 1, the fundamentals of piezoelectricity, ferroelectricity and domain
structures are first presented and then followed by a short overview of the history and
advances in studying these phenomena in biological materials and synthetic molecular
ferroelectrics. The latest developments in molecular ferroelectrics revealed by PFM and the
mechanism of ferroelectricity in molecular crystals are discussed. Then a brief overview of
nonlinear optical phenomena, particularly in organic crystals is presented. Finally, this
Chapter will end up with the description of the potential applications of organic ferroelectrics
and possible opportunities for using them in specific devices in the near future.
In Chapter 2, the introduction to amino acids in general and piezoelectricity in
crystalline amino acids is presented. Various crystal growth techniques useful for this work

Introduction
6
are briefly mentioned. In particular, glycine polymorphism, possible crystal structures and
crystallization processes to obtain α- , β- and γ-glycine are discussed.
In Chapter 3, the detailed description of the experimental techniques used for the
characterization and phase determination of glycine crystals (including optical microscopy,
X-ray diffraction and Raman spectroscopy) is given.
The basic principles and experimental setup of AFM are introduced, followed by a
more detailed description of the relevant PFM mode. Then the experimental procedures
employed for domain imaging and switching of polarization are described and quantitative
analysis of the PFM signal is briefly discussed. Besides, the technique used for the second-
order non-linear optical susceptibility measurement is presented.
The obtained experimental results are depicted, analyzed and discussed in the two
following experimental Chapters.
In Chapter 4, several synthesis methods were applied to grow single crystals of all
three phases of glycine (α-, β- and γ-polymorphs) from solution. The morphology and
polymorphic forms of the crystals produced in these experiments have been analyzed by
optical microscopy and X-ray diffraction. β-glycine was found to be unstable at normal
ambient conditions and phase transition was detected using XRD. Therefore, a simple method
of stabilization of the β-phase is introduced based on the evaporation of aqueous solution on
crystalline Pt(111) substrates. As a result, we could grow sufficiently stable β-glycine
microcrystals with well-defined habit and clear morphology on the commercial
(111)Pt/Ti/SiO2/Si substrates. X-ray diffraction analysis and Raman spectroscopy confirmed
the preferential growth and stability of β-phase. The ability to grow stable β-phase crystals
allowed studying their ferroelectric and nonlinear optical properties in detail in the following
Chapter.
In Chapter 5, PFM technique was applied to probe the piezoelectric response and
ferroelectric switching in both β- and γ-phases. The γ-glycine is found to be a purely
piezoelectric (not ferroelectric) with a unique polar axis along the crystallographic c
direction.
Further, PFM tip-induced domain structures and polarization switching in β-glycine
were studied. We show that β-glycine is indeed a room-temperature ferroelectric and
polarization can be switched by applying a dc bias to non-polar cuts via a conducting tip of
AFM. Dynamics of these in-plane ferroelectric domains is studied as a function of applied

Introduction
7
voltage and pulse duration. Non-linear thermodynamic theory is applied to explain the
domain shape upon switching by the voltage applied to the tip of AFM. Our findings suggest
that the ferroelectric properties of β-glycine are controlled by the charged domain walls
which are in turn can be manipulated by external bias. Additionally, the pronounced decay of
the switched domains was observed depending on the domain size.
Computational modelling of both β- and γ-phases was performed using a HyperChem
7/8 package and the importance of the network of the hydrogen bonds for the stability of
glycine crystal structure is discussed. The developed molecular model and calculated physical
parameters such as polarizability, saturated polarization, piezo- and electrostriction
coefficient were found to be close to the obtained experimental data.
In addition, we show that the non-linear optical coefficients of β-glycine are
comparable to those of reference z-cut (001) quartz. Highly anisotropic second harmonic
generation signal is found to be compatible with the crystallographic symmetry of β-glycine.
Biomolecular modelling is applied for understanding of the relationship between the crystal
structure and nonlinear properties.
Chapter 6 concludes the thesis with a summary of the entire work carried out towards
the objectives and outlines some potential directions for future developments.

Introduction
8

Chapter 1
Introduction to Piezoelectricity and
Ferroelectricity

Chapter 1
10

Introduction to Piezoelectricity and Ferroelectricity
11
This Chapter starts from the standard definitions of piezoelectricity, ferroelectricity,
Curie temperature, polarization hysteresis and domain structure in general. Then the general
property discussion is followed by the historical overview of the piezoelectric and
ferroelectric features observed in biological materials. After that, recent developments in
synthetic organic ferroelectrics including microscopic mechanisms governing ferroelectricity
in these materials are reviewed. In addition, a brief overview of relevant nonlinear optical
phenomena (mainly in organic crystals) is presented. Finally, current and future applications
of organic ferroelectrics and their potential for emergent in devices are discussed.
1.1. Fundamentals of Piezoelectric and Ferroelectric Effects
Electromechanical coupling is one of the general characteristics of a wide range of
inorganic and organic materials. The linear electromechanical coupling is called
piezoelectricity. This property can be observed in non-centrosymmetric materials (in 20 of
the 32 point groups) in which the application of mechanical stress results in electrical
polarization (direct piezoelectric effect), while the application of an electric field results in a
mechanical deformation (converse piezoelectric effect).
In both direct and converse piezoelectric effects there is a linear relation between the
mechanical stress (strain) and electric polarization (field). The mathematical relations in the
tensorial form can be expressed as:
Pi = dijk σjk direct effect, (1.1)
and
Sjk = dijk Ei inverse effect, (1.2)
where dij is the piezoelectric coefficient with the unit of m/V (or C/N), σjk is the stress tensor,
Pi is the induced polarization, Ei is the applied electric field, and Sjk is the field induced strain
tensor. Piezoelectric coefficients dijk are described by a 3rd
-rank tensor having maximum 18
components in triclinic crystals but with higher symmetry the number of independent
components is reduced. The magnitude of the piezoelectric coefficient dij is affected by many
factors including degree of crystallinity, degree of orientation (texture), existing domain
Chapter 1
12
structure and intrinsic piezoelectric coefficients of a properly oriented monodomain single
crystal [22,23].
Piezoelectric materials are used in a numerous number of devices, such as force and
displacement sensors, electrically driven actuators and ultrasonic transducers [24,25]. Sensors
make use of the direct piezoelectric effect that transforms mechanical signals into electrical
response, e.g. to measure acceleration (accelerometers), pressure and acoustic vibrations.
Actuators work vice versa, transforming electrical signals into mechanical responses and are
used in various electrically driven actuators and force generators. Finally, in transducers both
effects are used within the same device, e.g. in ultrasonic imaging systems.
Among the 20 piezoelectric crystal classes, there are ten pyroelectric groups with a
unique polar axis, in which spontaneous polarization exists and varies with temperature. The
spontaneous polarization is the average electric dipole moment per unit volume of the crystal.
If such spontaneous polarization can be reversed by the application of an external electric
field, then the pyroelectric material is called ferroelectric. Thus, all ferroelectrics are also
pyroelectric and piezoelectric, although the opposite is not true. The spontaneous polarization
of a ferroelectric material usually decreases upon heating and above a critical temperature
which is called the Curie temperature Tc, the crystal phase becomes paraelectric with a non-
polar structure. This property (temperature-dependent polarization) can be used in infrared
detectors and thermal imaging systems [26]. The relative dielectric constant has a distinct
maximum in the vicinity of the Curie temperature. Depending on whether the spontaneous
polarization changes continuously or discontinuously at the Curie point, the phase transition
can also be classified as second or first order [27,28].
As discussed above, main signature of ferroelectrics is the spontaneous polarization
(Ps) of a ferroelectric crystal which can be reversed under the influence of a high enough
external electric field. This process is called polarization switching. The critical electric field
required to reverse polarization in ferroelectrics is called coercive field Ec, which also varies
with the temperature, frequency and amplitude of the applied field. The switchability of the
spontaneous polarizations causes the hysteretic relationship between the instant polarization
Ps and the electric field E (Fig. 1.1a). This hysteretic dependence is called ferroelectric P-E
hysteresis loop. The value of polarization at zero field is called the remnant polarization PR.
When the positive and negative coercive fields and remnant polarizations in both remnant
states are equal to each other, the hysteresis loop is ideally symmetric relative to the P and E

Introduction to Piezoelectricity and Ferroelectricity
13
axes. In reality, the loops are often asymmetric due to several factors including dissimilar
electrodes, internal bias field due charged defects, inhomogeneous mechanical stresses,
composition gradients across the thickness etc that can all affect the shape of the loop. In
addition to the polarization-electric field hysteresis loop, polarization switching under electric
field in ferroelectric materials leads to a strain-electric field hysteresis, which has a butterfly
shape as shown in Fig. 1.1b [29].
Figure 1.1. (a) Typical polarization-electric field (P-E) hysteresis loop in ferroelectric
material and (b) Ideal strain-electric field (x-E) hysteresis (butterfly) loop in uniaxial
ferroelectrics in which polarization reverses by 180° [29].
Ferroelectrics as multifunctional electroactive materials are suitable for a large
number of applications [30] such as capacitors (especially for thin film capacitors due to large
dielectric permittivities and small thickness) [31], electro-optic devices [32,33], surface
acoustic wave (SAW) transducers [34], and non-volatile ferroelectric random access
memories (FRAM) [35,36] in which the direction of the spontaneous polarization can be used
to store information and the information bits are retained if the power is turned off.
Ferroelectricity was first observed in Rochelle salt crystal, containing organic tartrate
ions [37]. For a while, Rochelle salt was the only known ferroelectric material. However, the
rapid progress in ferroelectric field occurred only after the development of perovskite
ferroelectrics such as barium titanate (BTO) [38] and lead zirconate titanate (PZT) families
[39]. After some time, a few other molecular systems, such as well-known triglycine sulfate
were discovered [40]. Today, among ferroelectric materials, the perovskite-type compounds,
(a) (b)

Chapter 1
14
particularly PZT, are the most studied and technologically are the most widely used due to
their large piezoelectric coefficients and electromechanical coupling constants. However,
they contain lead and it is a major environmental concern. Now considerable efforts were
focused on searching lead-free alternatives of PZT. In addition, traditional piezoelectric
ceramics are rigid, heavy, and require high temperature processing, which limits their
application in certain areas.
In this context, in order to expand the range of applications of ferroelectric materials,
molecular and bio-molecular ferroelectrics have been recently drawing much attention and a
large number of organic ferroelectrics with properties comparable to perovskite oxides have
been synthesized. They have several advantages including light weight, mechanical
flexibility, non-toxicity, and low processing temperatures (e.g. by the solution growth). They
are also environmentally friendly as they are do not contain lead and can be easily
functionalized, e.g. for biosensor applications, which have motivated this perspective [7].
Intrinsic biocompatibility and the possibility of self-assembling are also fascinating properties
of some molecular ferroelectrics which are made of biological building blocks.
Despite of many advantages, organic ferroelectric typically suffer from low
spontaneous polarization, low transition temperature and weak piezoelectric properties even
at low temperatures. Recent results on croconic acid [41] and disopropylammonium chloride
(bromide) [42,43] have been indeed a breakthrough due to a combination of high enough
transition temperature and polarization combined with low coercive field and switchability.
These discoveries paved the way for using organic ferroelectrics in various applications.
In section 1-3 and 1-4, the progress and mechanism of ferroelectricity in biological
tissue and synthesized molecular ferroelectrics, are explained in detail. In section 1-6 more
details about the current and expected future applications of organic and biomolecular
ferroelectric are discussed.
1.2. Ferroelectric Domains and Domain Walls
In general, ferroelectric crystal does not exhibit the same polarization orientation
throughout the material. It can be divided into spatial regions with different directions of
polarization, called ferroelectric domains. Each domain has uniform polarization and is
separated by the domain walls. Domain walls are characterized by the angle between the
Introduction to Piezoelectricity and Ferroelectricity
15
polarization directions on both sides of the wall. A number of technological applications of
ferroelectrics such as nonlinear-optical and electro-optical devices are critically dependent on
the ability to create controlled domain configurations in ferroelectric materials. Hence the
understanding of domain formation, dynamics of domain wall motion, stabilization
mechanisms, and structure of domain walls are of fundamental interest for the field of
domain engineering and opens wide opportunities to optimize device performance.
In general, ferroelectric single crystals have a unique crystallographic orientation, but
they may contain areas with uniform polarization directions called ferroelectric domains.
They are oriented in a particular way to be compatible with crystallographic orientation and
to minimize both electrostatic and mechanical energies. For example in PbTiO3, six
equivalent polarizations can be formed in the crystal depending on the stress and electric field
conditions upon cooling. Ferroelectric polycrystals (ceramics) are composed of many
individual grains with random crystallographic orientations which are in turn split into
domains [44].
For platelet crystals domains with out-of-plane polarization are called c domains,
while the domains with in-plane polarization are called a domains. Domain walls which
separate two polar domains are called 180º domain walls if the angle between the polarization
orientations of the neighboring domains is 180°; if the domains’ polarization angle is not
180° – for example, they are 90º or 71º – they are called 90º or 71º domain walls, or
generally, non-180º domain walls. 180º ferroelectric domain walls can be classified into three
types according to the relative angle between the domain-wall plane and the polarization
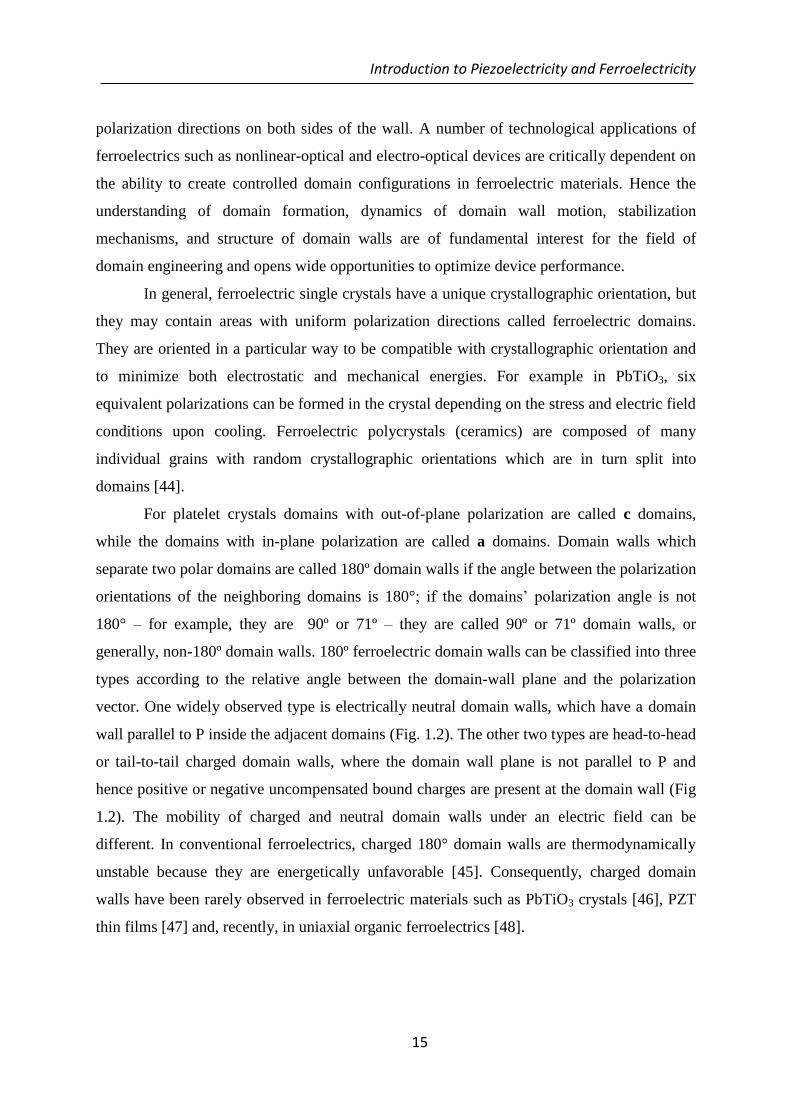
vector. One widely observed type is electrically neutral domain walls, which have a domain
wall parallel to P inside the adjacent domains (Fig. 1.2). The other two types are head-to-head
or tail-to-tail charged domain walls, where the domain wall plane is not parallel to P and
hence positive or negative uncompensated bound charges are present at the domain wall (Fig
1.2). The mobility of charged and neutral domain walls under an electric field can be
different. In conventional ferroelectrics, charged 180° domain walls are thermodynamically
unstable because they are energetically unfavorable [45]. Consequently, charged domain
walls have been rarely observed in ferroelectric materials such as PbTiO3 crystals [46], PZT
thin films [47] and, recently, in uniaxial organic ferroelectrics [48].

Chapter 1
16
Figure 1.2. Three possible configurations for 180° domains. Orientation of spontaneous
polarization with respect to the wall plane is shown by arrows [49].
1.3. Piezoelectricity and Ferroelectricity in Biomaterials
Piezoelectricity in biological materials was first observed and described by Fukada
and Yasuda in 1957 [50]. They discovered both direct and converse piezoelectric effects in
dry bone samples cut from the femur of man and ox. Piezoelectricity in bone was attributed
to the collagen fibrils as an organic crystalline matrix. Collagen is a kind of protein and the
polarization or the displacement of hydrogen bonds in the polypeptide chains of collagen
crystal was suggested to be an origin of the observed piezoelectric effect [51]. After
observation of piezoelectricity in collagen, piezoelectric effect has been also observed in a
number of biological materials which contain molecular arrays of proteins or polysaccharides
like tendons, muscles, teeth [52], exoskeletons [53], glands [54], nerve fibers [55], membrane
protein [56], and cornea [57].
Soon after the discovery of biological piezoelectricity, pyroelectricity was observed in
bone and tendon by Sidney Lang in 1966 [58] and, subsequently, in many other biological
systems [59,60]. Later on, many authors claimed the existence of ferroelectricity in several
biological materials. Fascinating theories were proposed regarding the functional role of
ferroelectricity in voltage-dependent ion channels and biological membranes by Leuchtag
[61,62]. He considered dielectric constant ε as a nonlinear function of electric field in the
classical electrodiffusion model to explain the membrane function. He could fit the existing
ion-channel data [63] with the Curie-Weiss law (apparent manifestation of ferroelectric phase
transition) in biomembranes. Ermolina et al.[56] observed a liquid-crystal-like ferroelectric
behavior in bacteriorhodopsin, an integral protein of the purple membrane of Halobacterium
salinarium, embedded into the lipid biomembrane. Similarly, the Curie-Weiss law was found
to be valid suggesting apparent ferroelectric-like behavior, the presence of a long-range order
Introduction to Piezoelectricity and Ferroelectricity
17
in the regular positions of molecules and the symmetry loss at some critical temperature
called Curie temperature [64]. All these phenomena are essential for various complex bio-
objects but cannot be strictly called ferroelectric in a classical sense because of the variety of
different mechanisms involved (due to, e.g., flexoelectricity in membranes or presence of
water in bone). This makes the assignment of biological phenomena under electric field to
ferroelectricity difficult, and sometimes speculative. The hindrance in ferroelectric hypothesis
was also due to the fact that biological samples being soft could not endure the mechanical
force required for electromechanical measurement and are subject to strong electrostatic
effect. Another obstacle was the inability to look at the nanoscale to assign the observed
complex electromechanical behavior to the particular structure unit and thus to understand the
mechanism of the polar behavior and polarization reversal. Therefore, biological
ferroelectricity remains elusive, and no direct experimental evidence has been presented until
very recently.
During the last decade, rapid development of Scanning Probe Microscopy including
Piezoresponse Force Microscopy (PFM) and Switching Spectroscopy PFM has led to the
possibility of probing electromechanical properties of biomaterials along with their
topography. The first study on biopiezoelectricity at the nanoscale was reported by Halperin
et al. in bone [65]. Later both lateral and vertical piezoelectricity in tooth dentin and enamel
were reported and it was revealed that dentin shows higher piezoelectricity with respect to
enamel [66,67]. This behavior was attributed to the high fraction of piezoelectrically active
protein components in dentin. Recently electromechanical properties of collagen fibrils
[68,69], human nails [70] and also artificial biomaterials such as peptide nanotubes [71,72]
have been studied with the nanoscale resolution via PFM.
The first indication of polarization switching under sufficiently high electric field in
biological tissue, generally called bioferroelectricity was reported by Li and Zeng in shells
[73,74,75] using PFM. After that bioferroelectricity was observed in the soft biological
tissue; elastin protein of the aortic wall in mammals [76,77]. Therefore, the constituents of
proteins such as amino acids, lipids and amyloid-like structures could be responsible for
ferroelectricity in complex tissues. As such, apparent piezo- and ferroelectricity in these
systems should be studied first to understand the global behavior of the complex biological
systems. In this context, new materials class based on element structure of mentioned
ferroelectric tissue such as crystalline amino acids (glycine), peptides (self-assembled

Chapter 1
18
nanotubes) [71] and lipid/ferroelectric bilayers [78] have been synthesized. In-depth
understanding of the electromechanical behavior in these structures under an applied electric
field will open a pathway for further insight into the piezoelectric and ferroelectric
phenomena in complex biological materials.
In addition to natural and synthetic biomaterials, organic molecular ferroelectrics with
properties comparable to inorganic perovskite oxides have been synthesized [79]. The
structure and microscopic mechanism of ferroelectricity in these materials are described in
detail in the next section.
1.4. Structural Design and Mechanism of Ferroelectricity in Organic
Molecular Crystals
The development of the organic ferroelectric had been quite slow since the discovery
of ferroelectric effect [37]. However, recently a large number of organic ferroelectrics,
mostly two-component and few single component molecular crystals have been synthesized.
The microscopic mechanisms governing ferroelectricity in these organic ferroelectrics are
usually attributed to order-disorder, displacive and proton-transfer types or mixed
characteristics of these which are dependent on the design strategies. Ionic displacements in
perovskite oxides have resulted in large spontaneous polarization and excellent piezoelectric
and ferroelectric properties (Fig. 1.3). Such a mechanism is apparently less probable in
molecular systems due to their large molecular volume and weaker bonds [80].
Figure 1.3. Polarization switching mechanism of a typical inorganic perovskite BaTiO3
[81].

Introduction to Piezoelectricity and Ferroelectricity
19
Most of the current literature on molecular ferroelectrics is divided into four
categories:
The first and most simple possible design is that the permanent dipoles of the polar
molecules such as thiourea [82], polyvinylidene fluoride (PVDF) polymer and co-polymers
[83] generate spontaneous polarization in the organic solids, and the ferroelectric transition
can arise from the reorientation of these polar components (Fig. 1.4).
Figure 1.4. Schematic molecular structure and polarization switching of P(VDF-TrFE)
polymer [81].
The second group developed from interaction between two nonpolar molecules such
as donor and acceptor in a charge-transfer (CT) complex. Electrons can transfer between the
donor (D) and acceptor (A) pairs through a neutral-to-ionic transition, which breaks the
symmetry in the lattice and leads to forming dipolar DA dimers and polarization. As shown
in Fig. 1.5 there can be two possible configurations with opposite polarity (DA DA… and
AD AD...). Therefore, ferroelectricity of this polar structure mainly comes from the
intermolecular charge transfer rather than from the displacement of point charge.
Ferroelectric polarization of CT complexes under external electric field can be switched by
the change of stacking style of A-D molecules, resulting in ionic displacement and charge
redistribution to finally produce different polarizations (Fig. 1.6) [84].
One successful example of charge-transfer ferroelectric complexes is the
tetrathiafulvalene-chloranil (TTF-CA), which demonstrates a distinct hysteresis loop with a
large remnant polarization of 6.3 μC/cm2
[85]. These co-crystals normally have higher
polarization, ferroelectricity at low temperature, first-order ferroelectric phase transition and

Chapter 1
20
large dielectric constant [79]. However, the charge-transfer complexes have some problems,
such as current leakage. Because most of these CT complexes are semiconductors, the neutral
to ionic transition requires a narrow charge gap which may lead to current leakage and
degradation of the spontaneous polarization [86].
Figure 1.5. Schematics of neutral-to-ionic transition in the charge transfer complex with
two possible polarities [86].
Figure 1.6. Schematic representation of electric field- or temperature- induced ferroelectric
switching of charge-transfer complexes between different phases (HS versus LS phases)
[84].
The third strategy to obtain organic ferroelectrics is to utilize proton dynamics in
hydrogen bonds to contribute to ferroelectric properties. There exist two types of hydrogen
bond ferroelectricity: displacive and proton-transfer. In the displacive type, the molecules do
not necessarily have permanent dipoles, but the crystal polarization comes from relative
displacement of protons in the crystal through intermolecular interaction. Horiuchi et al.
synthesized two-component molecular ferroelectrics connected by hydrogen bonds to form a

Introduction to Piezoelectricity and Ferroelectricity
21
co-crystal with large spontaneous polarizations at room temperature [87], such as nonpolar
co-crystals made of phenazine (Phz) with proton accepting nitrogen atoms and chloranilic
acid (H2ca) or bromanilic acid (H2ba) with proton donation O–H groups (Fig. 1.7a) [88].
Above the Curie temperature, all the hydrogen bonds have equal lengths and the net
dipole moment is therefore zero. Below the Curie temperature, the polarization of co-crystal
is determined by the displacement of hydrogen atoms on one side of the H2ca acid molecule
toward the nitrogen atom of phenazine while the other side remains almost unchanged (Fig.
1.7b,c). Therefore, ferroelectricity originates from an asymmetric O–H bond elongation of
the intermolecular O–H…N bonds and the relative molecular displacement as drawn
schematically in Fig. 1.7d. These co-crystals have a first-order ferroelectric phase transition,
high dielectric permittivity, and high resistivity [88].
Figure 1.7. a) Crystal structures of a-Phz–H2ca in the b-axis projections. b,c) Molecular
structures of H2ba in paraelectric and ferroelectric phase. d) Schematic of alternating acid–
base molecules with intermolecular hydrogen bonds in every chain. Blue and yellow arrows
indicate the displacement directions of proton and the molecules in the ferroelectric phase,
respectively [89].
In the second type observed in early ferroelectrics, proton transfer is important as was
proved in Rochelle salt [37] and inorganic potassium dihydrogen phosphate KH2PO4 (KDP).
In the KDP family, the collective site-to-site transfer of protons in the O–H…O bonds,
between PO43-
ions switches the spontaneous polarization (Fig. 1.8) [90].
(a) (b) (c)
(d)

Chapter 1
22
Figure 1.8. Protons transfer in the O–H…O bonds of KH2PO4.
Similar proton dynamics have been observed in co-crystals of [H-55dmbp][Hia] [91],
and the strong hydrogen bonding suggests possible tautomerism that transforms the O–H…N
bonds into the ionic with O-…H–N
+ form and simultaneously changes the p-electron
molecular geometry.
Recently this strategy was also demonstrated in a number of organic single-
component low molecular-mass crystals which all have proton donor and acceptor moieties to
bind molecules into a dipolar chain. For example a room temperature polarization of 20
μC/cm2
and ferroelectric stability up to 130°C was reported in croconic acid which is the
highest value among the low-molecular-weight organic ferroelectrics [41]. In the crystal
structure, molecules are arranged in two-dimensional sheets, and each one can transfer two
protons from hydroxyl groups to the carbonyl groups of adjacent molecule during the
polarization switching by an external electric field (Fig. 1.9a,b). Therefore, ferroelectric
switching is attributed to the collective proton ordering in intermolecular hydrogen bonds
through proton tautomerism on O_H…O bonds. In comparison with bulk molecule rotation,
moving protons only within the hydrogen bond would be generally advantageous in
minimizing steric hindrance for polarization reversal and decrease the coercive field.

Introduction to Piezoelectricity and Ferroelectricity
23
Figure 1.9. a) Schematic illustration of hydrogen-bonded sheets in croconic acid crystal.
The arrows show the electric polarity of each sheet. b) Change of chemical-structure
polarity through the p-bond switching and intermolecular proton-transfer processes [41].
In this category, room-temperature ferroelectricity and antiferroelectricity was
revealed in benzimidazole derivatives, a hydrogen-bonded ferroelectric made of imidazole
unit, which are biological building blocks [92] with polarization of 5 to 10 μC/cm2. Its proton
donor and acceptor moieties easily bind molecules into a dipolar chain, which is often
bistable in polarity due to the amphoteric nature of the molecules. Ferroelectric polarization
can be switched through proton dynamics on N_H…N bond as shown in Fig. 1.10.
Figure 1.10. Hydrogen bonding (broken lines) and polarization reversal mechanism
through the proton tautomerism of the imidazole moiety [92].
(a) (b)
a) b)
Chapter 1
24
In addition, Tayi and coworkers [93] recently synthesized the hydrogen-bonded CT
complexes between a pyromellitic diimide (PMDI)-based acceptor and three donors that are
derivatives of naphthalene, pyrene and TTF. These polar and switchable systems incorporate
both the advantageous features of proton dynamics mechanism and charge-transfer process of
organic ferroelectrics. They possess room-temperature ferroelectricity and clear hysteresis
loop was observed in all three complexes at 300 K with remnant polarization exceeding 1
μC/cm2. At low temperature, the polarization for PMDI-TTF was found to be as large as 55
μC/cm2
which is the highest among known molecular systems. This molecular structure
retains its properties up to 153 °C.
The fourth approach is to utilize the disorder-order of atomic position in each single
molecule, resulting in an asymmetric structure. This ferroelectric mechanism has been
discovered recently in two simple diisopropylammonium (DIPA) salts, DIPA chloride
(DIPAC) [42] and DIPA bromide (DIPAB) [43]. DIPAC shows a spontaneous polarization of
8.9 μC/cm2
and a Tc of 440 K, and DIPAB has a large polarization of 23 μC/cm2
and a Tc of
426 K, comparable to that of barium titanate. Their ferroelectricity is believed to arise from
the order-disorder behavior of N atoms. DIPAB demonstrates a large dielectric constant and a
low dielectric loss at room temperature, in addition to its excellent ferroelectric properties.
All these features open the pathway for practical applications for them to substitute the
traditional perovskite ferroelectrics.
Most of organic ferroelectrics have high optical transparency and large nonlinear
response with respect to the electromagnetic radiation in the optical range. Therefore, they
have potential application in various nonlinear-optical devices. In the following section a
brief discussion of these phenomena and their advantage in organic ferroelectrics is
presented.
1.5. Nonlinear Optical Properties of Ferroelectric Materials
Nonlinear optics is a phenomenon arising from the interactions of optical radiation
with materials to yield new optical wave in a nonlinear way. In recent years, domain
engineering was focused on the fabrication of periodic ferroelectric domain structures with
desirable parameters for the manufacturing of devices. Engineerable nonlinear optical
materials have permitted the development of a wide range of tunable coherent light sources
Introduction to Piezoelectricity and Ferroelectricity
25
based on quasi-phase-matching (QPM), causing a great deal of interest in view of their
potential applications in the areas of laser technology, photonic devices, high density data
storage technology and optical interconnects [94,95].
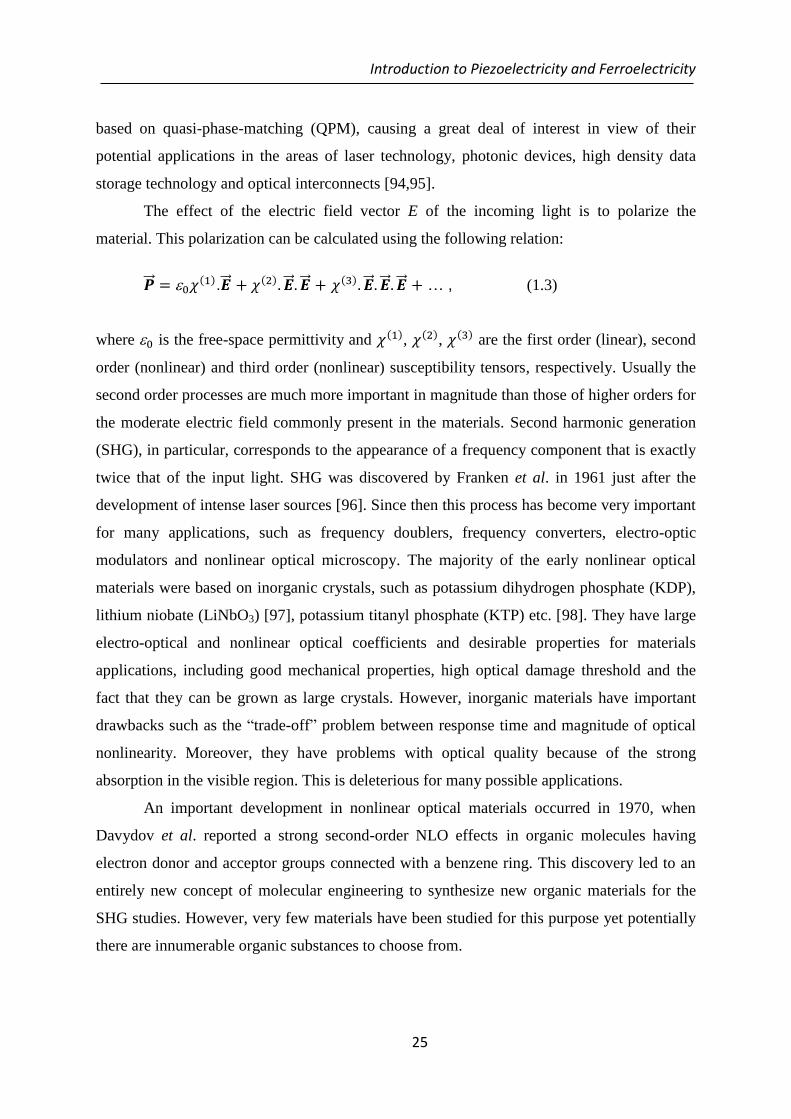
The effect of the electric field vector E of the incoming light is to polarize the
material. This polarization can be calculated using the following relation:
�⃗⃗� = 0𝜒(1).�⃗⃗� + 𝜒(2). �⃗⃗� . �⃗⃗� + 𝜒(3). �⃗⃗� . �⃗⃗� . �⃗⃗� + … , (1.3)
where 0 is the free-space permittivity and 𝜒(1), 𝜒(2), 𝜒(3) are the first order (linear), second
order (nonlinear) and third order (nonlinear) susceptibility tensors, respectively. Usually the
second order processes are much more important in magnitude than those of higher orders for
the moderate electric field commonly present in the materials. Second harmonic generation
(SHG), in particular, corresponds to the appearance of a frequency component that is exactly
twice that of the input light. SHG was discovered by Franken et al. in 1961 just after the
development of intense laser sources [96]. Since then this process has become very important
for many applications, such as frequency doublers, frequency converters, electro-optic
modulators and nonlinear optical microscopy. The majority of the early nonlinear optical
materials were based on inorganic crystals, such as potassium dihydrogen phosphate (KDP),
lithium niobate (LiNbO3) [97], potassium titanyl phosphate (KTP) etc. [98]. They have large
electro-optical and nonlinear optical coefficients and desirable properties for materials
applications, including good mechanical properties, high optical damage threshold and the
fact that they can be grown as large crystals. However, inorganic materials have important
drawbacks such as the “trade-off” problem between response time and magnitude of optical
nonlinearity. Moreover, they have problems with optical quality because of the strong
absorption in the visible region. This is deleterious for many possible applications.
An important development in nonlinear optical materials occurred in 1970, when
Davydov et al. reported a strong second-order NLO effects in organic molecules having
electron donor and acceptor groups connected with a benzene ring. This discovery led to an
entirely new concept of molecular engineering to synthesize new organic materials for the
SHG studies. However, very few materials have been studied for this purpose yet potentially
there are innumerable organic substances to choose from.

Chapter 1
26
Molecular compounds have received intense interest due to their larger NLO
efficiencies and large amount of design flexibility. Furthermore, they show extremely fast
response to external electric fields as compared to their inorganic counterparts [99]. The
drawback of organic materials is that they often have lower thermal and photochemical
stability.
1.6. Current Applications of Organic Ferroelectrics and Future Prospects
Despite the good progress made recently in the organic-ferroelectrics materials,
continuous research is needed to better understand molecular mechanism and to improve the
performance of molecular ferroelectrics in order to gradually replace them with inorganic
materials in devices.
Nowadays, the most widely used organic ferroelectrics are VDF based polymers and
their oligomers. PVDF has such unique properties as flexibility, ruggedness, low acoustic
impedance and availability as thin films, but a somewhat smaller electromechanical coupling
factor. They found numerous applications as non-volatile memory devices [100], opto-
electronic memories [101], biomedical sensors [102], capacitors [103] and nanogenerators
that convert natural vibrations to electricity by harvesting energy from the movement of the
human arm [104] or from respiration [105].
Another example, biologically compatible harvesting elements were created based on
1,4-diazabicyclo[2.2.2]octane perrhenate (dabcoHReO4) ferroelectric microcrystals
embedded in the polymer fibers by electrospinning [106].
However, these materials represent a relatively narrow class of synthetic organic
crystals with a limited variability of the physical properties and unknown biocompatibility.
Apparently, new materials classes based on natural tissue components such as aminoacids,
peptides or lipids should be explored in view of their natural biocompatibility and variability
[107].
We expect that newly developed molecular ferroelectrics will open novel perspectives
for the applications. They offer great opportunities for the development of a new generation
of natural piezoelectric materials and nano-devices that could be implanted in the human
body (in vivo), as a bio-memory for storing programs to deliver drugs or as a nanocatalyst for
controlling chemical reaction because ferroelectric domain orientation affects the chemical

Introduction to Piezoelectricity and Ferroelectricity
27
reactivity of the surface in adsorption, catalytic and photochemical processes. In addition, the
lower coercive field required for reverse polarization compared to organic polymers could
lead to a significant breakthrough in computer memory technology and to reduce its electrical
power demands.
Of even greater interest is the direct use of ferroelectric tissues instating implanted
molecular ferroelectric devices. For example, it may be possible to monitor the natural
polarization state of the biological system for early diagnosis and to manipulate with its
polarization states as new ways of fighting disease [7].

Chapter 1
28

Chapter 2
Amino Acids Crystals

Chapter 2
30

Experimental Techniques
31
This Chapter starts with the explanation of importance of amino acids in living
systems and introduction to their piezoelectric properties. The basic principles of
crystallization and various crystal growth techniques with emphasis on evaporation from
solution are introduced. The process of nucleation (including homogeneous and
heterogeneous nucleation) and growth of the crystals is discussed. After the overview of the
relevant literature on glycine polymorphs (α, β and γ), their relative stabilities and growth
methods for all polymorphs with the focus on the β-glycine will be presented.
2.1. Amino Acids
Amino acids are organic compound with the general formula HCCO2-NH3
+R, where
R is a lateral chain characteristic of each molecule. Amino acids are extremely important in
biochemistry, nutrition, neurology, psychiatry, pharmacology, nephrology, and
gastroenterology. One particularly important function is to serve as the building blocks of
proteins of all living beings, which are chains of amino acids. Each protein has its own
unique amino acid sequence that is specified by the nucleotide sequence of the gene encoding
in the deoxyribonucleic acid (DNA) molecule. As such, amino acids play a fundamental role
in physiology, origin and evolution of life. Among their properties as life-coordinating
molecules, the chemical and catalytic ones were the most studied up to now. There are twenty
different amino acids and most of them can also exist with a highly ordered crystal structure
in the solid phase, due to their inherent self-assembly and molecular-recognition capabilities.
Single crystals of all the primary amino acids can be grown from an aqueous (or other)
solution. Crystalline amino acids belong to the family of hydrogen-bonded crystals.
Hydrogen bonding (HB) interactions play an essential role in their crystal structure and
present complex networks of HB create different crystalline polymorphs [108].
Polymorphism is the ability of crystalline materials to exist in different molecular packing yet
with the same chemical compositions. Polymorphs can have different mechanical, thermal,
and physical properties [109].
In solution, most amino acids are in the zwitterionic form in which the amino group is
represented as -NH3+, and carboxyl as -COO
-. In such a bipolar form there is significant
molecular dipole moment, then continuing in the crystalline form. From a crystallographic
point of view, molecular crystals formed from amino acids are a class of polar materials and

Chapter 2
32
the majority of them have non-centrosymmetric crystal structures. This means that they are
potentially piezoelectric, pyroelectric with nonlinear optical properties and, possibly,
ferroelectric [14,110].
In some cases, inorganic derivatives of amino acids such as amino acid sulphate and
phosphate salts have shown ferroelectric behavior. For instance, triglycine sulphate (TGS) is
a salt of glycine with inorganic counterion ((CH2NH2COOH)3 H2SO4) and is known for room
temperature ferroelectricity (Ps = 3.8 μC/cm2, Tc ≈ 50 °C) [40]. Semiorganic TGS family has
excellent pyroelectric properties and second order phase transition of order-disorder type.
Other examples are betaine phosphite (BPI) and glycine phosphite (GPI). Typically amino
acids with inorganic compounds have better mechanical and thermal properties relative to the
purely organic amino acids.
Lemanov et al. investigated piezoelectricity in pure amino acids crystals in respect to
the temperature dependence of ultrasonic properties. He found that γ-glycine and DL-alanine
are the strongest amino acid piezoelectrics (comparable to, or even stronger than quartz
crystals). L-alanine, L-valine, L-glutamic and DL-tyrosine possess much weaker piezoelectric
activity [14,110,111].
2.2. Crystal Growth Techniques and Principles of Crystallization
Crystal growth techniques are classified into three main categories: growth from
solutions, from melts and from vapor phases. The choice of a particular crystal growth
method depends on the material to be crystallized, its quality, size, growth rate, its physical
and chemical properties in particular and the nature of the method.
In general, solution growth is simple and inexpensive. Amino acid crystals are
typically grown from the solution. Crystallization from the solution has two stages:
nucleation and growth. Nucleation is the formation of a new solid phase from a
supersaturated mother phase. In the nucleation step, three important concepts are critical
nucleus, homogeneous and heterogeneous nucleation. In supersaturated homogeneous
systems, nuclei can appear once sufficient supersaturation has been generated to overcome
the energy barrier for nucleation and when sufficient time has passed for critical sized
clusters to form, crystallization begins. Heterogeneous nucleation involves the nucleation on
the substrate, in the presence of impurity particles in the medium, on the wall of a

Experimental Techniques
33
crystallizer, etc. All of them serve as the catalytic agents for the process of nucleation of the
new phase. Therefore, activation energy for heterogeneous nucleation is lower than that for
homogeneous nucleation and, under the same temperature and pressure conditions,
heterogeneous nucleation occurs at lower supersaturation than homogeneous nucleation
[112].
Nucleation is followed by the crystal growth, which is the process of further addition
and integration of growth units to the existing nuclei/crystals. Both crystal nucleation and
growth occur in supersaturated solution but the supersaturation level requirements for
nucleation and crystal growth are different. There are many methods to achieve this
supersaturation on which the crystallization technique depends [113]. Amino acid crystals
can be produced by different methods from the solution. The slow evaporation of a solution is
the simplest method to grow crystals [114]. Other commonly used techniques include slow
cooling of the solution, solvent diffusion, vapor diffusion, sublimation and many variations of
these. The choice of the technique is dictated by the necessary size of the sample. From the
above mentioned methods, slow evaporation from solution and droplet evaporation on the
crystalline substrate was used for the crystallization of glycine in this work.
Droplet evaporation offers some advantages such as a reduction in production steps
when compared to traditional crystallizations; however, it is sometimes difficult to control
and to model the product properties because of flow patterns of the droplets and following
irreproducibility [115]. Droplet evaporation has been used in various self-assemblies. In this
method, evaporation increases the level of concentration gradually to produce supersaturation
and induce crystallization. The volume of the initial droplet, concentration of the solution,
interaction between molecules and substrate and environmental conditions such as
temperature, relative humidity, hydrophilicity-hydrophobicity of the substrate and external
pressure all influence the size and quality of the resulting crystals. As mentioned above,
crystallization on the substrate is an inhomogeneous nucleation and growth since the
evaporation rate at the droplet edge is higher than that inside. Fast evaporation at the edges of
a droplet results in a flow directed from within the droplet towards the edges. This flow
carries molecules with it, and these molecules are deposited at the boundary of the droplet.
After that, the molecules inside the droplet contribute to the crystal growth [116].

Chapter 2
34
2.3. Glycine Polymorphs
In our work, among the 20 natural amino acids, glycine has been selected because it
has significant piezoelectricity at room temperature and it has recently shown ferroelectric
properties [15] and thus presents significant interest for biomedical and electronic
applications. Glycine is the simplest amino acid and is widely used as an excipient for
proteins and pharmaceutical reagents production [117]. It has been also recognized as the
symbolic origin of life based on its presence in extraterrestrial objects [118]. In the gaseous
state glycine exists in non-ionic form, whereas in solution and in crystalline state it is in the
form of the zwitter ion [119]. Figure 2.1 shows the structure of glycine molecule in the
zwitterionic form.
Figure 2.1. Glycine structure
Glycine as a classical polymorphic material exists in three major polymorphic forms
at ambient conditions: α, β and γ phases [120] and under some extreme conditions other
metastable phases were also obtained [121]. The polymorphs of glycine differ in the packing
arrangement of the +NH3-CH2-COO- zwitterions via a hydrogen-bond network between
them. It has been found that the bulk glycine polymorphs display different thermodynamic
stability (in the order of γ > α > β) and different crystal symmetries based on different
zwitterion packing during growth. γ-polymorph is thermodynamically the most stable form of
glycine, α-glycine is the metastable form and β is the least stable phase under ambient
conditions. However, metastable α and β polymorphs can be preserved in a dry atmosphere
for a long time because they have large enough kinetic barriers for transformation. Under
humid NH3 vapor, α-phase typically converts into the γ-polymorph [122]. The β-polymorph
irreversibly transforms into α or γ forms in the presence of a humid air, under increasing
temperature, in the presence of NH3, or under grinding. This transformation appears by the
loss of transparency of the crystals [123,124].

Experimental Techniques
35
Structural peculiarities and physical properties of these glycine polymorphs have been
considered in a lot of publications, especially as pharmaceutical reagents since different
molecular self-assemblies in the solid state can affect drug performance, bioavailability and
safety. Thus a complete characterization of all possible polymorphs is considered as an
essential step in pharmaceutical industry to choose the best drug formulation with desirable
properties [125]. However, there have been only a few attempts carried out to study the
piezoelectric properties of these materials. The physical arrangement and hydrogen bonds of
the molecules within the unit cell are responsible for the ferroelectric and dielectric properties
of the materials. In the following, the molecular structure of glycine polymorphs (α, β and γ),
their relative stabilities and growth methods for each polymorph will be discussed.
α-glycine Structure and Crystal Growth Methods
The structure of α-glycine was first investigated by Albrecht and Corey and later by
Marsh [17,126]. The centrosymmetric α-glycine easily crystallizes from saturated pure
aqueous solution with evaporation [114]. In the α-polymorph, glycine dimers are linked by
hydrogen bonds in double antiparallel layers and the layers are connected together by Van der
Waals interaction. Formed crystals usually have bipyramid morphology with monoclinic
crystal structure and centrosymmetric space group (P21/n, Z = 4). From a thermodynamic
point of view α- phase is less stable than the γ-phase, but there are no phase transitions at
room temperature. Therefore, its transition to the γ-phase should be prohibited kinetically
[119,127].
β-glycine Structure and Crystal Growth Methods
β-glycine was first reported by Fisher in 1905, and the structure was investigated later
by Bernal and Iitaka [19,128]. To induce crystallization of the β- or γ-polymorphs,
zwitterionic glycine monomers are necessary as building units rather than cyclic dimers. In
the β-polymorph, single polar layers create a monoclinic structure similar to the α-phase but
with a non-centrosymmetric space group (P21, Z = 2) [129].
The β-polymorph of glycine was mostly crystallized by adding antisolvent (either an
alcohol or acetone) to a concentrated solution of glycine [19,130,131]. Other used techniques
were spray-drying [132] and freeze-drying [133,134]. However, the obtained crystals were
frequently unstable under ambient conditions, and rapid conversion into a more stable α-

Chapter 2
36
phase was observed in this material [19,132]. Moreover, some of these methods did not lead
to the pronounced habit with the well-defined shape, and the grown β-glycine was only
present as a mixture with α-crystals. Due to these limitations there are only a few reports on
the physical properties of β-glycine.
There were a few attempts to stabilize the useful β-phase under ambient conditions.
For instance, Hamilton et al. [135] obtained stable nanocrystals of β-glycine embedded in
nanometer-scale channels. They found that the nanocrystals grown within the channels of
pore diameters less than 24 nm persist for at least one year against transformation to other
forms and transform slowly to α-glycine over several days if grown within bigger pore
diameters. In another paper, Lee et al. [136,137] studied the effect of the substrate on the
polymorph selectivity of glycine. They obtained all three polymorphs of glycine on a
patterned substrate with self-assembled monolayers (SAMs) consisting of hydrophilic gold
islands surrounded by hydrophobic domains. According to their result, the main crystals
phase (in a natural aqueous solution) was the α-phase and the frequency of β-glycine
appearance increased for smaller metallic islands and under reducing concentrations. This
result was important to understand that the preferential growth of β-glycine can be mediated
by using an appropriate substrate that can accelerate the nucleation and further growth of the
desired phase.
γ-glycine Structure and Crystal Growth Methods
γ-glycine was first obtained by Iitaka [18]. The crystal structure of γ-glycine is
essentially different. The zwitterions are organized in triple helices around the 31 screw-axis
which are linked together by lateral hydrogen bonds and form a three dimensional network.
The crystal structure of γ-glycine belongs to the hexagonal non-centrosymmetric space group
P31 or P32 with three molecules in the unit cell.
If the formation of the dimers in solution, and the growth of the α-polymorph, is
inhibited, then the stable γ-polymorph grows under crystallization conditions closer to
equilibrium (slow crystallization), whereas very quick precipitation gives the β-polymorph
[120].
In prior studies it was reported that γ-glycine crystals can be obtained by changing the
solutions pH [137], by adding special salts (such as sodium chloride, potassium chloride,
ammonium chloride, lithium bromide) to glycine solution [138,139,140] or addition of a

Experimental Techniques
37
tailor-made additive [141]. The additive does not interfere with the crystal structure; it
influences nucleation and growth kinetics. γ-phase crystals also can be created by exposing
the supersaturated aqueous glycine to an electric field [142], or using irradiation with
polarized laser light [143,144]. These may promote crystallization of the γ form through the
arrangement of monomers in a head-to-tail orientation along the polar c-axis of crystal.
Recently, Guangwen He et al. grew γ-glycine crystals from neutral aqueous solutions
through slow evaporation of water using an evaporation-based crystallization platform [145],
because a slow evaporation process allows the molecules to be arranged in the lowest energy
state during the formation of nuclei. However, the resulting crystals did not have any
preferred orientation and shape and agglomerated together.

Chapter 2
38

Chapter 3
Experimental Techniques

Chapter 3
40
Experimental Techniques
41
A variety of techniques are available to characterize the polymorphic phases of
glycine. In this Chapter, the description of the experimental techniques used for the
characterization and phase determination of glycine crystals are introduced.
Also, after presenting a short introduction of AFM technique and experimental setup,
PFM operating principle will be explained along with the experimental procedures employed
for domain imaging and quantitative PFM characterization. Besides, the measurement
technique used for the second-order non-linear optical susceptibilities is described.
3.1. Characterization Techniques
3.1.1. Optical Microscopy
Optical microscopy is a simple technique, which magnifies the object by using visible
light and a system of lenses. We expected to produce different phases of glycine structures
during crystallization. Optical microscopy is used for polymorph determination via
observation of crystal morphology and for in situ monitoring the growth process during
crystallization. Different polymorphic forms of crystals have distinct shapes which can be
used with image analysis techniques for determining the polymorphic form. However, the
shape is not always conclusive in characterizing the polymorphic form. A polarized
microscope could be used to assess the level of misorientation in the crystals.
An optical microscope (Nikon Eclipse LV 150) with parallel and crossed polarizer
and analyzer wave plate modes was used to visualize all the grown samples in this
experiment.
3.1.2. X-Ray Diffraction
X-ray diffraction (XRD) is a powerful technique which can be used as the primary
step to identify the crystalline phases and to determine the structure of the obtained glycine
crystals. In X-ray diffraction a collimated beam of X rays is incident on a specimen and is
diffracted by the crystalline phases in the specimen according to Bragg's law (nλ = 2d sinθ,
where d is the spacing between crystallographic planes). A randomly orientated powder
sample of a polymorph has a unique powder X-ray diffraction (PXRD) pattern, which is now
the most common tool for polymorph identification.
Chapter 3
42
Each crystal form of a given molecule has a unique powder X-ray diffraction pattern,
made of diffraction peaks in certain positions and with differing intensities. When more than
one polymorph is present, PXRD can give information on the relative amounts of different
polymorphs in the mixture through the area under the peaks. PXRD can also give information
on the preferred orientation of crystals.
Single crystal X-ray diffraction can be used to confirm the grown crystal as a single
crystal and give detailed information of crystal structures, such as cell parameters values,
crystal symmetry, and space group.
In this experiment, XRD patterns of glycine samples were collected with a powder
diffractometer (Siemens D500) using Cu Kα radiation (λ = 1.54059 Å). The diffraction
patterns were recorded in a reflection geometry at room temperature in the range 5°−70° with
steps of 0.02°. The single crystal X-ray diffraction data were collected on a Bruker SMART
Apex (II) CCD-based diffractometer at 150 K using graphite-monochromatized Mo Kα
radiation (λ = 0.710 73 Å). The results are discussed in the Chapter 4.
3.1.3. Raman Spectroscopy
Raman spectroscopy is another structural characterization tool that detects the
vibrational motion of chemical bonds. The Raman spectrum arises from the inelastic
scattering of optical radiation (photons) by the electron clouds that make up the chemical
bonds in the crystals. The scattered photon is related to the incident photon by frequency, ω,
which is also called the Raman shift [146]. Thus the spectrum is sensitive to the lengths,
strengths, and arrangement of bonds in the crystal structure. Different crystal structures tend
to have distinct peak positions and intensities as a result of vibrational changes of molecules
in the crystal lattice.
In the linear approximation, polarization, P, induced in the molecule under the
influence of electric field of the incoming light, E = E0 cos(ω0t), can be written as :
P = α E, (3.1)
where α is the polarizability tensor of the molecules, which characterizes the mobility of the
electron cloud that makes up the chemical bonds, i.e. how easily it can be displaced or
deformed under the influence of an external electric field.

Experimental Techniques
43
Atomic vibrations near the equilibrium position periodically change the state of the
electron shells and, therefore, the polarizability tensor. Thus, the components of the
polarizability tensor αij equilibrium position can be expanded in a series in the normal
coordinates Q:
𝛼ij = (𝛼ij)0 + ∑ (∂𝛼ij
∂Qk)0 Qk + ⋯k (3.2)
Therefore the polarization can be written as:
𝑃 = 𝛼0𝐸0 cos(𝜔0𝑡) +1
2(
𝜕𝛼
𝜕𝑄𝑘)0 𝑄k0
𝐸0cos (𝜔0 − 𝜔𝑖)𝑡 +1
2(
𝜕𝛼
𝜕𝑄𝑘)0 𝑄k0
𝐸0cos (𝜔0 +
𝜔i)𝑡 (3.3)
And the light is scattered at three frequencies: 𝜔0, 𝜔0 − 𝜔i and 𝜔0 + 𝜔i. The first
term in this expression represents the elastic (Rayleigh) scattering of light without changing
the frequency. The second and third terms represent inelastic Raman scattering, with 𝜔0 − 𝜔i
and 𝜔0 + 𝜔i corresponding to Stokes and anti-Stokes Raman scattering, respectively.
Raman spectroscopy is a fast analysis method without any post-processing and widely
used, when the crystals are small and microfocus capabilities are important. Raman imaging
is also possible, which adds important information about the crystal orientation and domain
width.
In this work, Micro-Raman measurements were performed in a backscattering
geometry using a WiTec alpha 300 AR confocal Raman microscope which combines the
analytical capabilities of Raman spectroscopy (RS) and the high spatial resolution of a
confocal microscope. An objective (10×, NA = 0.55) focused the exciting light (solid state
laser, λ = 488 nm) onto the sample (spot diameter about 260 nm). A diffraction grating of 600
dashes/mm with a spectral resolution of 3.19 cm−1
at λ = 488 nm was used for light
decomposition. All measurements were done at room temperature.
In this work, Raman scattering has been used for the detection of the polymorphic
forms and to study polymorphic transformation [147].
Chapter 3
44
3.2. Piezoresponse Force Microscopy (PFM) Technique
3.2.1. Introduction to Atomic Force Microscopy (AFM)
Scanning probe microscopy (SPM) is a unique tool for studying topography and
physical parameters of materials. It offers several different possibilities to obtain information
on the domain configurations of ferroelectric thin films, single crystals and ceramics. AFM is
currently the most broadly employed tool in the SPM family, since it can measure a wide
range of surface properties on any kind of materials, ranging from topography to surface
potential, from electrical to magnetic properties. Moreover, AFM measurements can be
performed under normal (ambient) temperature and pressure, thus not requiring special
environmental conditions. In the standard experimental AFM systems, there are three main
components for imaging the surface of the sample: a cantilever with probing tip sharpened
down to several tens of nanometers, a piezo-electric scanner which controls the position of
the sensing probe relative to the surface, and the optical system to measure the deflection or
torsional twist of the cantilever. The two main imaging modes for all kinds of AFM systems
are non-contact mode and contact mode. When the tip is brought to the sample in contact
with or tapping the surface, it will be affected by a combination of the surface forces. Those
forces cause cantilever bending and torsion and these deformations of the cantilever are
detected by measuring the displacement of the laser spot, which is reflected from the back of
the cantilever, on the position sensitive photo detector. Its resolution in the Z direction is of
the order of subnanometer, while the lateral one is limited by the tip radius of curvature, i.e.,
in the order of a few tens of nanometers.
A difference in mechanical, structural, electrochemical, dielectric and piezoelectric
properties of opposite ferroelectric domains may provide distinct contrast in the AFM contact
mode. In the non-contact regime, domains can be visualized by detecting surface polarization
charge and surface potential. Currently, the most widely used AFM method for studying
domain polarization and nanoscale switching behavior in ferroelectric materials is the so-
called Piezoresponse Force Microscopy (PFM). PFM works in a contact regime based on the
detection of local bias-induced surface deformation [148]. In this research, focused on the
piezoelectric and ferroelectric properties of glycine crystals, we used PFM technique as the
main experimental method.

Experimental Techniques
45
3.2.2. Principle of Piezoresponse Force Microscopy (PFM)
PFM utilizes a basic experimental setup of Atomic Force Microscopy in which a
conductive tip is brought into contact with the sample surface under a constant force (Fig.
3.1). The sample is positioned on the macroscopic bottom electrode and the PFM tip acts as a
movable top nanoelectrode. The tip scans the sample and the bias voltage Vtip = Vdc + Vac .
cos(ωt) is applied via the tip to the sample. The applied voltage creates an alternating electric
field that causes the local deformation of the sample (expansion or contraction) due to reverse
piezoelectric effect. Surface displacement is translated into the deflection of a cantilever A =
A0 + A1ω cos (ωt + ϕ) and this response is mechanically passed on to the cantilever and can be
optically detected by the movement of the reflected laser on the four-quadrant photodiode as
shown in Fig. 3.1 [149].
Figure 3.1. Experimental setup of Piezoresponse Force Microscope.
The signal collected by the photodetector is analyzed by the lock-in amplifier and the
phase and amplitude of the response can be obtained in addition to the regular topography.
The phase of the electromechanical response, ϕ, gives information on the polarization
direction of the sample below the tip. The amplitude, A = A1ω/Vac, defines the strength of the
piezoelectric activity of the surface. The sign of the piezoelectric effect depends on the
relative orientation of polarization of the sample and applied electric field [150,151].
Chapter 3
46
Vertical vs. Lateral PFM
Deformation caused by the applied AC voltage can occur in any direction, and
therefore, it leads to deflection, bending (buckling) and torsion of the cantilever. PFM can be
operated in two modes, namely, vertical (VPFM) and lateral (LPFM) as schematically
presented in Fig. 3.3. VPFM enables distinguishing the domains with a different out-of-plane
component of the polarization. For domains whose polarization vector is oriented
perpendicular to the surface, applying an electric field parallel to it results in the expansion of
the sample. In this case, surface oscillations are in phase with the tip voltage, and ϕ = 0. For
domains with antiparallel orientation of the field and polarization the sign is reversed and the
phase difference will be in 180°(i.e. ϕ = 180°). (Fig. 3.3a,b).
In addition to the vertical displacement of the cantilever, there exists another type of
PFM measurement. When the polarization is parallel to the sample surface, the voltage
applied to the tip results in an in-plane surface displacement which is then translated into
cantilever torsion (Fig. 3.3c,d). The torsion of the cantilever is measured by the lock-in
technique in the same way as the modulated deflection signal in the photo-detector is
measured in VPFM. These types of measurements are called lateral PFM (LPFM) [152]. The
piezoelectric coefficient (relationship between the strain and the applied electric field)
measured in the direction of the applied field is usually called the longitudinal coefficient
(d33), and that measured in the direction perpendicular to the field is known as the shear
coefficient (d15). Combining vertical and lateral PFM signals can be used to create a 2D
vector PFM map of molecular orientation in piezoelectric biomaterials [153].

Experimental Techniques
47
Figure 3.3. Schematic illustration of (a,b) vertical PFM, and (c,d) lateral PFM.
Switching PFM
In addition to domain structure imaging and quantitative local electromechanical
measurement, PFM can be used for the investigation of nanoscale domain switching under an
external electric field. In switching measurements a probing tip is fixed at a certain location
on a sample surface. If voltage pulses higher than the characteristic coercive voltage are
applied to the tip, the spontaneous polarization under the tip can be switched. This allows the
creation of any desired pattern of ferroelectric domains. With PFM imaging after each pulse,
nascent domains can be visualized and it provides direct information about the local coercive
field strength for nucleation of new domains and velocity of domain wall motion. The second
approach of polarization switching behavior is to measure the hysteresis loops in the pulse
mode. In this case, a sequence of dc voltage pulses with the same duration and with the
amplitude cycled from -Vmin to Vmax is applied and the piezoresponse is measured between the
pulses at each step (Fig. 3.4). Because no bias voltage is applied during the measurements,
the contribution related to electrostatic interaction is minimized and actual remanent
piezoresponse is detected.

Chapter 3
48
The shape and/or shift of the hysteresis loop contain important information about the
switching mechanism, spontaneous polarization, saturated polarization, coercive field and
imprint Im in case of asymmetry hysteresis ( Im= (V++V
-)/2).
Figure 3.4. a) Probing dc bias wave form in switching PFM. τ1 is the writing period, τ3 is
the reading period and τ2 is the waiting interval. b) Illustration of piezoelectric hysteresis
loop, forward and reverse coercive voltages, V+
and V−, nucleation biases, Vc
+ and Vc
−, and
forward and reverse remanent and saturation piezoresponses, R0+, R0
−, Rs
+ and Rs
−, are
shown [154].
The high spatial resolution (down to several nanometers), investigation of local
piezoelectric properties, analysis of ferroelectric domain wall structures and its correlation
with microstructural features and local spectroscopy capabilities make PFM a well-suited tool
for nanoscale ferroelectric studies [155,156].
3.2.3. Experimental Setup for PFM Measurements
For this study the piezoresponse measurements were performed mainly with a
commercial AFM (Ntegra Prima, NT-MDT, Russia) equipped with an external function
generator (FG120, Yokogawa, Japan) and a lock-in amplifier (SR830, Stanford Research
System, USA). A conductive Si cantilevers (from Nanosensors) with resonance frequency
and spring constants of 75 kHz and 3 N/m, respectively were used throughout the experiment.
(a) (b)
Experimental Techniques
49
Domain Visualization and Switching Measurement of Glycine Crystals by PFM
PFM was used to investigate the local piezoelectricity and to image the apparent
ferroelectric domain structure in piezoelectric phases of glycine (both β and γ). During
imaging, a harmonic ac voltage (typically 10 V), was applied locally to the sample via the
PFM tip, leading to sample deformation due to converse piezoelectric effect. The specific
measurement frequency (~ 15 kHz) was chosen to be well below the resonance frequency of
the contact, identified in a frequency sweep in order to minimize any interference from
topography or elasticity variations in the sample surface to the PFM signal.
Only β-glycine microcrystals which were isolated and in full contact with the Pt
substrate were chosen for analysis. In order to find the polarization direction orientation of
the structural units inside the crystals, we use orientational PFM-imaging. In this method
comparing PFM contrast in the vertical and lateral images and considering the geometry
between tip and crystal axes reveals important information about the polarization direction of
crystals. For the lateral response mode PFM measurement, the orientation of glycine
microcrystals with respect to the cantilever axis can affect the magnitude of the piezoelectric
signal. Thus the substrate was rotated prior to the experiment to align the long axis
(polarization direction) of the studied crystal perpendicularly to the cantilever axis in order to
detect maximum shear piezoelectric deformation. This geometry also minimizes any
contribution of cantilever buckling with the measured lateral signal [157].
Switching spectroscopy PFM was performed to confirm polarization switchability of
domains [158]. In these measurements, the tip is fixed in a predefined position on the sample
surface and voltage bias pulses of variable strength and duration are applied. Domain
configurations are imaged immediately after each pulse. In some cases, we could observe an
instability of the switched domains (polarization backswitching). In these cases, several scans
were done until the stable domain configuration was reached. In order to obtain
piezoresponse hysteresis loop, a sequence of dc voltage pulses was applied to the PFM tip in
a cyclic manner and piezoresponse (typically Acosθ) was measured between the pulses [154].
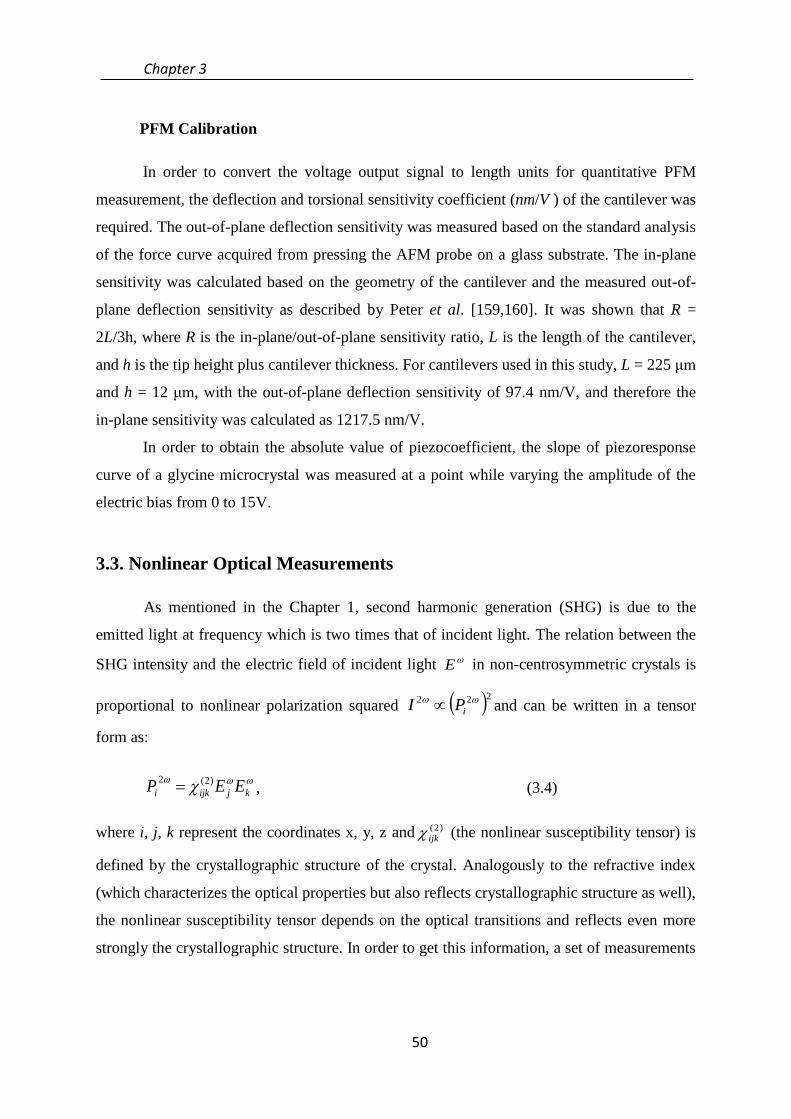
Chapter 3
50
PFM Calibration
In order to convert the voltage output signal to length units for quantitative PFM
measurement, the deflection and torsional sensitivity coefficient (nm/V ) of the cantilever was
required. The out-of-plane deflection sensitivity was measured based on the standard analysis
of the force curve acquired from pressing the AFM probe on a glass substrate. The in-plane
sensitivity was calculated based on the geometry of the cantilever and the measured out-of-
plane deflection sensitivity as described by Peter et al. [159,160]. It was shown that R =
2L/3h, where R is the in-plane/out-of-plane sensitivity ratio, L is the length of the cantilever,
and h is the tip height plus cantilever thickness. For cantilevers used in this study, L = 225 μm
and h = 12 μm, with the out-of-plane deflection sensitivity of 97.4 nm/V, and therefore the
in-plane sensitivity was calculated as 1217.5 nm/V.
In order to obtain the absolute value of piezocoefficient, the slope of piezoresponse
curve of a glycine microcrystal was measured at a point while varying the amplitude of the
electric bias from 0 to 15V.
3.3. Nonlinear Optical Measurements
As mentioned in the Chapter 1, second harmonic generation (SHG) is due to the
emitted light at frequency which is two times that of incident light. The relation between the
SHG intensity and the electric field of incident light E in non-centrosymmetric crystals is
proportional to nonlinear polarization squared 222 iPI and can be written in a tensor
form as:
kjijki EEP )2(2
, (3.4)
where i, j, k represent the coordinates x, y, z and )2(
ijk (the nonlinear susceptibility tensor) is
defined by the crystallographic structure of the crystal. Analogously to the refractive index
(which characterizes the optical properties but also reflects crystallographic structure as well),
the nonlinear susceptibility tensor depends on the optical transitions and reflects even more
strongly the crystallographic structure. In order to get this information, a set of measurements
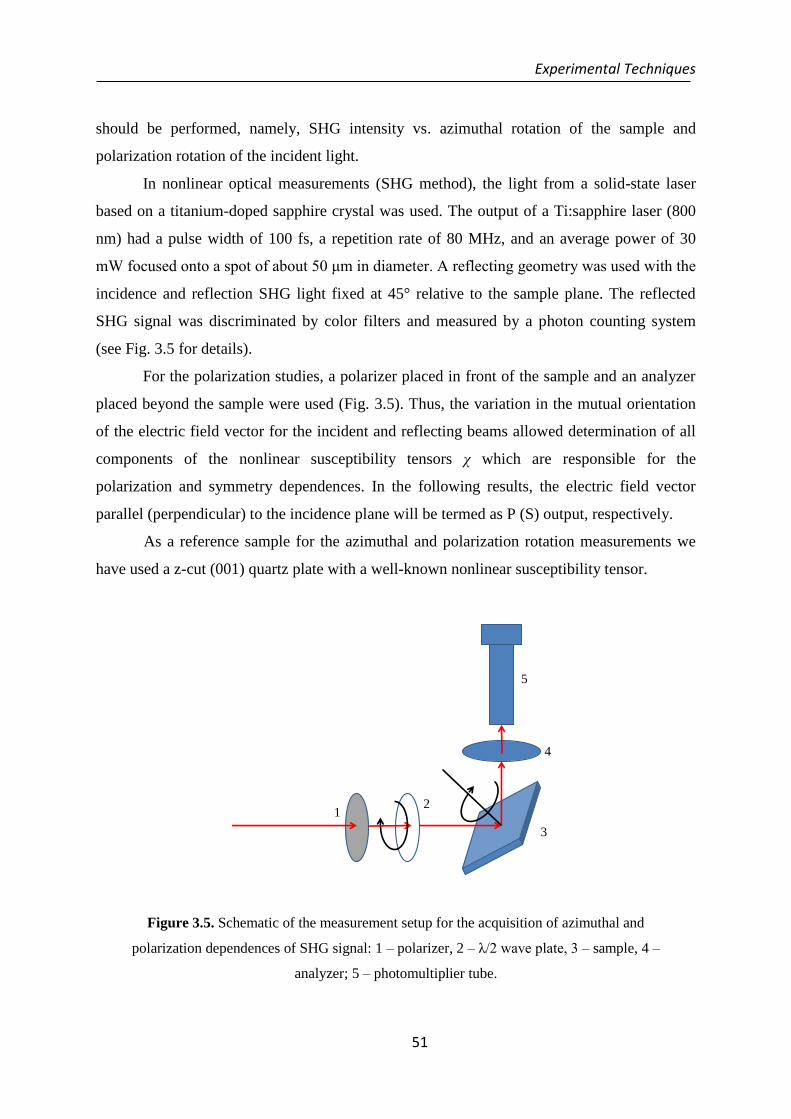
Experimental Techniques
51
should be performed, namely, SHG intensity vs. azimuthal rotation of the sample and
polarization rotation of the incident light.
In nonlinear optical measurements (SHG method), the light from a solid-state laser
based on a titanium-doped sapphire crystal was used. The output of a Ti:sapphire laser (800
nm) had a pulse width of 100 fs, a repetition rate of 80 MHz, and an average power of 30
mW focused onto a spot of about 50 μm in diameter. A reflecting geometry was used with the
incidence and reflection SHG light fixed at 45° relative to the sample plane. The reflected
SHG signal was discriminated by color filters and measured by a photon counting system
(see Fig. 3.5 for details).
For the polarization studies, a polarizer placed in front of the sample and an analyzer
placed beyond the sample were used (Fig. 3.5). Thus, the variation in the mutual orientation
of the electric field vector for the incident and reflecting beams allowed determination of all
components of the nonlinear susceptibility tensors χ which are responsible for the
polarization and symmetry dependences. In the following results, the electric field vector
parallel (perpendicular) to the incidence plane will be termed as P (S) output, respectively.
As a reference sample for the azimuthal and polarization rotation measurements we
have used a z-cut (001) quartz plate with a well-known nonlinear susceptibility tensor.
21
3
4
5
Figure 3.5. Schematic of the measurement setup for the acquisition of azimuthal and
polarization dependences of SHG signal: 1 – polarizer, 2 – λ/2 wave plate, 3 – sample, 4 –
analyzer; 5 – photomultiplier tube.

Chapter 3
52

Chapter 4
Crystal Growth and Characterization

Chapter 4
54

Crystal Growth and Characterization
55
In this Chapter, the preparation of single crystals of all three phases of glycine: α-, β-,
and γ-forms from solution and the conditions that affect the growth of crystals and polymorph
selectivity are discussed. All the obtained crystals were first characterized by the combination
of optical microscopy and X-ray diffraction.
In the following of this Chapter, some template-assisted methods are shown to be well
suited for the synthesis of stable β-glycine microcrystals. The crystallization process of
glycine driven by the evaporation of aqueous solution on crystalline (111)Pt/Ti/SiO2/Si
substrates is discussed in detail. The effects of the solution concentration and Pt-assisted
nucleation on the crystal growth and phase evolution are evaluated using X-ray diffraction
analysis and Raman spectroscopy.
Finally, we describe the growth of highly aligned micro- and nanoislands of β-glycine
on Pt substrates by spin-coating technique.
4.1. Crystallization from Solution
α-glycine
Glycine powder (99% pure) was purchased from Sigma Aldrich. Powder X-ray
diffraction (PXRD) analysis confirmed that as-received glycine was in the α-form. α-glycine
crystals were simply prepared by evaporation from pure, 3M aqueous solution of glycine at
neutral pH without the presence of any additive as described in section 2.3 of Chapter 2. The
α-phase usually crystallizes in bi-pyramids morphology as shown in Fig. 4.1. The type of
crystals polymorph was confirmed using PXRD and the positions of the peaks in the X-ray
spectrum were found to be in a good agreement with the data available in JCPDS database
(00-032-1702) for α-glycine (Fig. 4.2).
Figure 4.1. Optical microscopy image of single crystals of α-glycine.
5 mm

Chapter 4
56
Figure 4.2. The indexed powder XRD pattern of α-glycine crystal.
In the α-polymorph, glycine dimers are linked to each other by hydrogen bonds in
double antiparallel layers and the layers are connected together by van der Waals interaction.
The individual molecular dipole of each glycine molecule is compensated by that in opposite
direction and formed crystals have centrosymmetric space group (P21/n, Z = 4) and,
consequently, cannot have piezoelectric properties [161].
γ-glycine
Although the γ polymorph is thermodynamically the most stable form of glycine
known at ambient conditions, crystallization of γ-glycine in neutral aqueous solutions is
typically hindered by the formation of the kinetically favored α form. In this work, single
crystals of γ-glycine were grown from aqueous solution by slow evaporation method in the
presence of lithium nitrate that suppressed the formation of α-glycine. As the formation of
pure γ-glycine crystals starts below a certain rate of evaporation, the crystallizing solution
stays close to equilibrium throughout the evaporating process allowing the system to sample
the lowest free energy state during the formation of nuclei. Aqueous solution of glycine
(Sigma-Aldrich, 99%) and lithium nitrate (Sigma–Aldrich, 99.5%) in 2:1 mole ratio was
prepared in deionized water (resistivity 18.2 MΩ.cm) at room temperature. The prepared
solution was stirred for four hours in order to dissolve fully and then filtered with a Whatman
filter paper. The solution was taken in a beaker, closed with a perforated cover and allowed to

Crystal Growth and Characterization
57
evaporate slowly at ambient temperature. A few days after solvent evaporation, the solution
becomes supersaturated and tiny crystals were seen. They were allowed to grow for bigger
dimension and 5 weeks later, crystals with hexagonal prismatic morphology were obtained
(Fig. 4.3). Lithium cations do not enter the crystal structure, but remain in the solution as free
ions; they just influence nucleation and growth kinetics. Glycine crystals grew along the c
direction, possessing (010) and (100) lateral faces (Fig. 4.3).
Figure 4.3. Optical microscopy image of single crystals of γ-glycine.
The powder XRD confirmed the formation of a pure single γ-phase structure. The
positions of the peaks in the x-ray spectrum were found to be in a good agreement with the
data available in JCPDS database (00-006-0230) for γ-glycine. The various planes of
reflections were indexed in PXRD as shown in Figure 4.4. The calculated cell parameters of
the γ-glycine crystal from single crystal XRD data are a = b = 7.038 Å, c = 5.48 Å, α = 90o, β
= 90o, γ = 120
o and V = 233.9 Å
3, which agree well with the literature data [162].
10 mm

Chapter 4
58
Figure 4.4. An example of the indexed powder XRD pattern of γ-glycine crystal.
β-glycine
As mentioned in Chapter 2, the unstable β-glycine was typically crystallized at high
supersaturation, such as that which occurs during anti-solvent crystallization. In this work, a
slightly undersaturated aqueous solution of glycine was prepared (5ml), and then ethanol was
added quickly to this solution (10ml). A lot of thin needles of β-glycine appeared within
minutes as presented in Fig. 4.5 a,b. If crystals stayed in the solution for a longer time, β-
glycine was found to recrystallize to an α-form within 20 min of contact with solution.
Transformation from the β to α glycine was monitored using optical microscopy, as seen in
Fig. 4.5 c-f. Needle-like β-glycine crystals first begin to break into many small crystals and
then dissolve. With the dissolution of needle-like crystals, the supersaturation of the solution
increases and stable bipyramidal crystals corresponding to α-form start to appear. This
transformation can occur because of the interplay of thermodynamics and nucleation kinetics
of the two polymorphic forms. In the similar experiment we have found that the speed of the
transformation is even faster if the initial portion of water to ethanol increases.

Crystal Growth and Characterization
59
Figure 4.5. Microscopic images taken during solution-mediated transformation from the β-
to the α-form of glycine in the aqueous ethanol solution.
However, if the crystals were isolated rapidly after growth by filtration, washed with
ethanol, and dried in an oven at 60 °C, we could have almost pure β-glycine. The crystal
structure of β-glycine is shown in Fig. 4.6. The X-ray diffraction pattern of β-glycine has
characteristic peaks at 18o, 24
o, and 28
o as shown in Fig. 4.7 (black spectrum). The positions
of the peaks in the powder X-ray data were found to be in a good agreement with the data
available in JCPDS database (00-002-0171) for β-glycine. However, the problem was the
instability of the crystal under ambient conditions. Crystals were kept at room temperature
and humidity for three weeks and then x-ray diffraction was performed from the same batch
300 µm

Chapter 4
60
of the sample (red line in Fig. 4.7). A spontaneous transformation of β to α-phase was
observed by the comparison of two diffraction patterns (Fig. 4.7).
Figure 4.6. Optical microscopy image of single crystals of β-glycine grown from
water/ethanol solution.
Figure 4.7. Comparison of XRD pattern of the initial β-glycine crystals and its
transformation after 3 weeks of shelf time.
In order to synthesize stable single crystals of the glycine β-polymorph, we chose the
crystal growth on Pt substrates as detailed in the following section.
100 µm

Crystal Growth and Characterization
61
4.2. Crystal Growth on the Substrate
Besides inherent capability of amino acids to molecular recognition and self-assembly
through their functional group (-COO-
and -NH3+), the adsorption of amino acids
(specifically, glycine) on the metal and oxide surfaces has made them attractive for the
synthesis of functional nanostructures. The nature of these interfacial bindings on a solid
surface has been reported for glycine in many papers. For example, glycine was found to
adsorb in the zwitterionic form on Pt(111) [163] and Au [164] substrates and in ionic form on
Cu surface (110) [165]. Therefore, we conclude that the crystal growth of glycine on the solid
surface can be controlled by the intermolecular and molecule-substrate interactions.
In this section, a simple method of the stabilization of β-phase is been demonstrated
based on the evaporation of glycine solution on commercial (111)Pt/Ti/SiO2/Si substrates.
4.2.1. Sample Preparation
The droplet evaporation technique was used for the molecular self-assembly and
crystal growth on (111)Pt/Ti/SiO2/Si substrates. In this process, the supersaturation and
crystallization conditions are controlled by the evaporation rate. Different concentrations of
glycine solutions (1.77, 0.66, 0.133, and 0.0133 M) were prepared by dissolving various
amounts of glycine powder in an ultrapure water. All solutions were rigorously stirred and
filtered before crystallization. Commercial (111)Pt/Ti/SiO2/Si substrates (Inostek, 30–200 nm
Pt deposited on the 10nm Ti adhesion layer and the substrate were thermally oxidized Si
(100) wafer) were cleaned with alcohol and pure water in an ultrasonic bath. Glycine
solutions were dropped (50 μL) onto clean surfaces using a micropipette. The surface was left
for crystallization under ambient conditions (21 °C, humidity 30%) until the droplet dried out
completely (Fig. 4.8).
Figure 4.8. Schematic of the crystal growth on the surface.
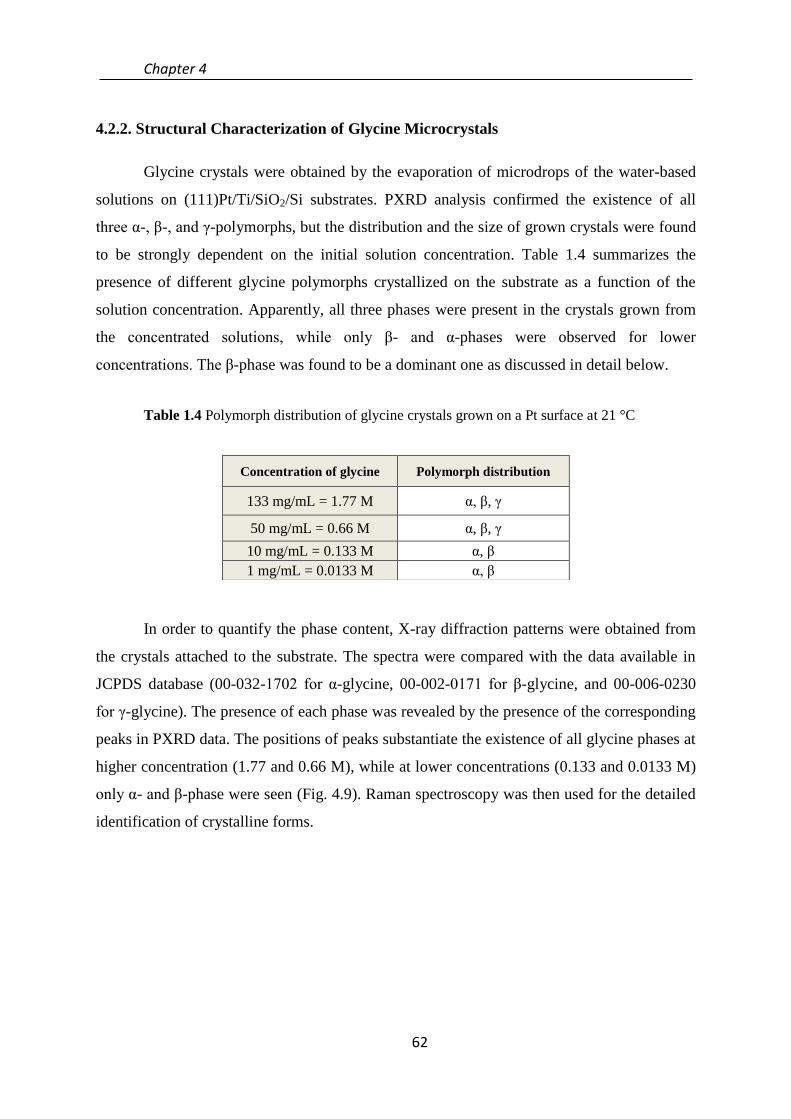
Chapter 4
62
4.2.2. Structural Characterization of Glycine Microcrystals
Glycine crystals were obtained by the evaporation of microdrops of the water-based
solutions on (111)Pt/Ti/SiO2/Si substrates. PXRD analysis confirmed the existence of all
three α-, β-, and γ-polymorphs, but the distribution and the size of grown crystals were found
to be strongly dependent on the initial solution concentration. Table 1.4 summarizes the
presence of different glycine polymorphs crystallized on the substrate as a function of the
solution concentration. Apparently, all three phases were present in the crystals grown from
the concentrated solutions, while only β- and α-phases were observed for lower
concentrations. The β-phase was found to be a dominant one as discussed in detail below.
Table 1.4 Polymorph distribution of glycine crystals grown on a Pt surface at 21 °C
In order to quantify the phase content, X-ray diffraction patterns were obtained from
the crystals attached to the substrate. The spectra were compared with the data available in
JCPDS database (00-032-1702 for α-glycine, 00-002-0171 for β-glycine, and 00-006-0230
for γ-glycine). The presence of each phase was revealed by the presence of the corresponding
peaks in PXRD data. The positions of peaks substantiate the existence of all glycine phases at
higher concentration (1.77 and 0.66 M), while at lower concentrations (0.133 and 0.0133 M)
only α- and β-phase were seen (Fig. 4.9). Raman spectroscopy was then used for the detailed
identification of crystalline forms.
Concentration of glycine Polymorph distribution
133 mg/mL = 1.77 M α, β, γ
50 mg/mL = 0.66 M α, β, γ
10 mg/mL = 0.133 M α, β
1 mg/mL = 0.0133 M α, β
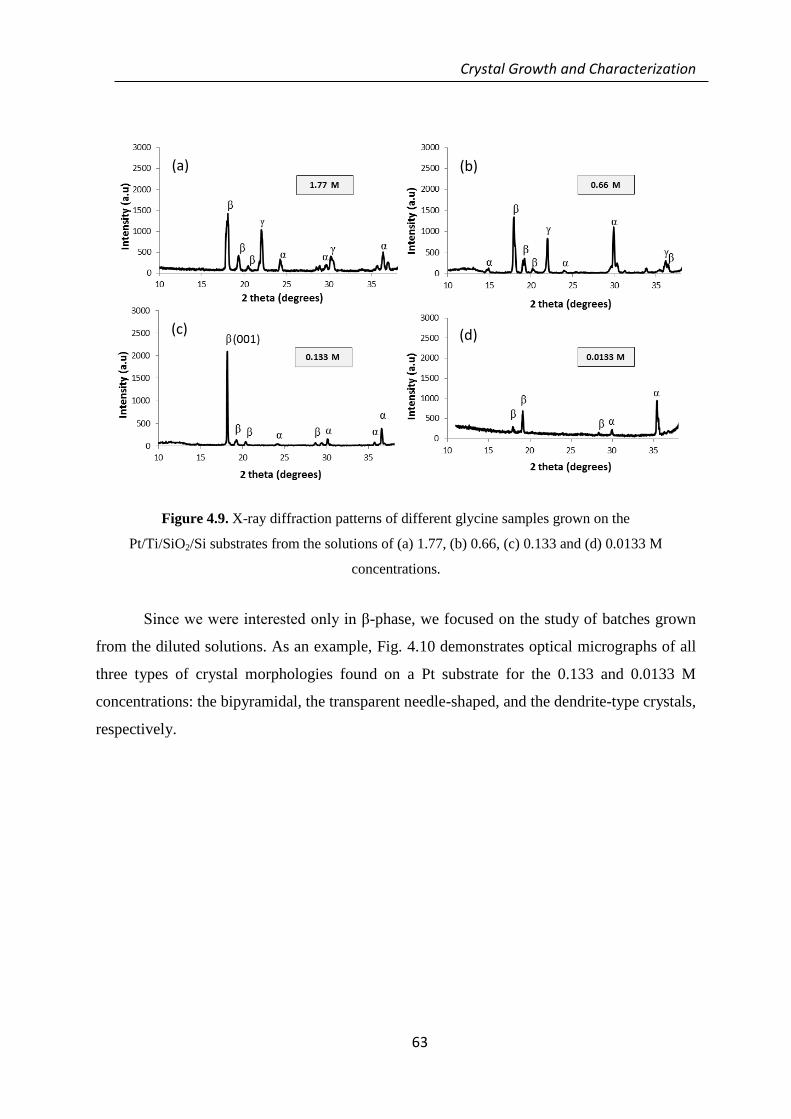
Crystal Growth and Characterization
63
Figure 4.9. X-ray diffraction patterns of different glycine samples grown on the
Pt/Ti/SiO2/Si substrates from the solutions of (a) 1.77, (b) 0.66, (c) 0.133 and (d) 0.0133 M
concentrations.
Since we were interested only in β-phase, we focused on the study of batches grown
from the diluted solutions. As an example, Fig. 4.10 demonstrates optical micrographs of all
three types of crystal morphologies found on a Pt substrate for the 0.133 and 0.0133 M
concentrations: the bipyramidal, the transparent needle-shaped, and the dendrite-type crystals,
respectively.
(a) (b)
(c) (d)

Chapter 4
64
Figure 4.10. Optical images of (a) bipyramidal α-glycine and needle-shaped β-glycine and
(b) dendrite β-glycine.
Following deposition, we used the micro-Raman spectroscopy to identify the
polymorphic form of each crystal type in the 0.0133, 0.133, and 0.66 M concentration
samples. In this technique, a phase analysis is typically performed by the determination of
each phase fingerprints (PF) in Raman spectra and by the comparison of the peak positions
with literature data [166,167]. Raman spectra for three studied crystal morphologies are
considerably different (Fig. 4.11). In particular, three separate spectral regions, 100−260,
1200−1600, and 2800−3200 cm−1
, were compared to distinguish all three polymorphic forms.
The first region includes mainly glycine lattice vibrations. Since glycine phases differ in the
individual molecule’s packing, this region represents the most important PFs. The second
spectral region contains bands corresponding to torsional vibrations of the CH2 group
(spectral line at about 1327 cm−1
) and symmetrical stretching of the CO2 group (spectral line
at about 1414 cm−1
). As such, these lines can be used as PFs for phase identification.
β
α
100 µm
β
50 µm
(b)
(a)
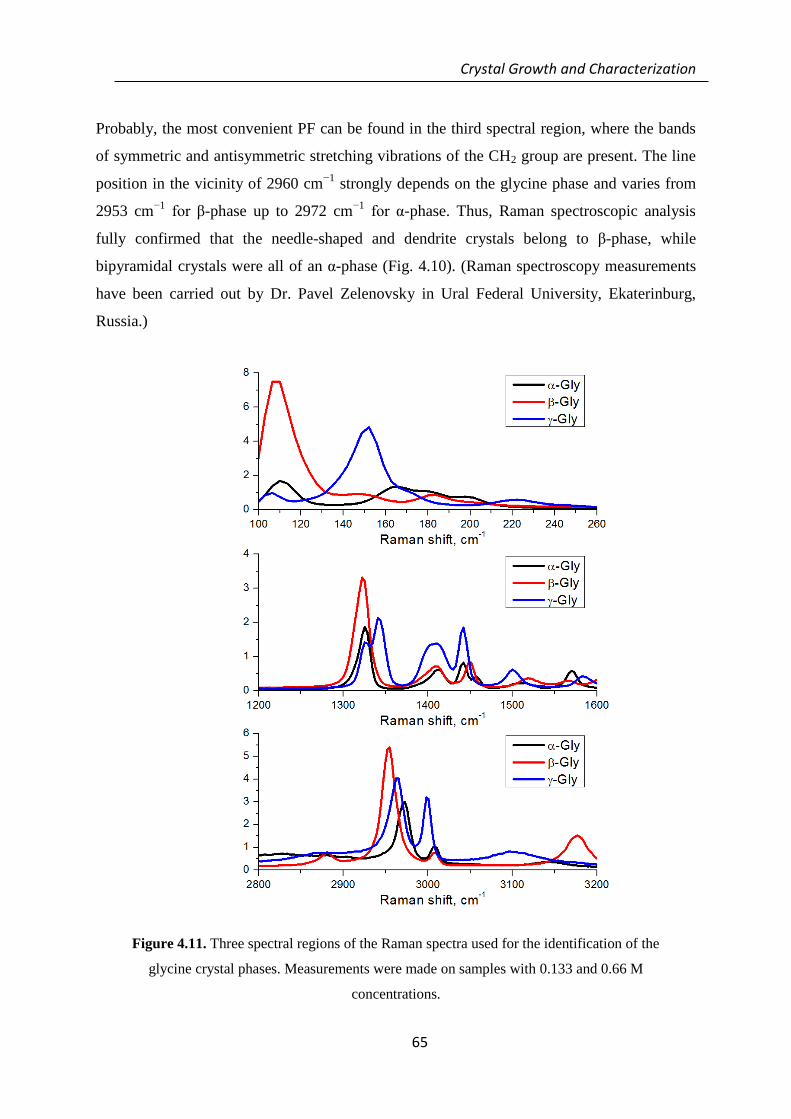
Crystal Growth and Characterization
65
Probably, the most convenient PF can be found in the third spectral region, where the bands
of symmetric and antisymmetric stretching vibrations of the CH2 group are present. The line
position in the vicinity of 2960 cm−1
strongly depends on the glycine phase and varies from
2953 cm−1
for β-phase up to 2972 cm−1
for α-phase. Thus, Raman spectroscopic analysis
fully confirmed that the needle-shaped and dendrite crystals belong to β-phase, while
bipyramidal crystals were all of an α-phase (Fig. 4.10). (Raman spectroscopy measurements
have been carried out by Dr. Pavel Zelenovsky in Ural Federal University, Ekaterinburg,
Russia.)
Figure 4.11. Three spectral regions of the Raman spectra used for the identification of the
glycine crystal phases. Measurements were made on samples with 0.133 and 0.66 M
concentrations.

Chapter 4
66
At high solution concentrations, the γ- and β-phases were observed in addition to
bipyramidal crystals of α-phase. However, at low solution concentrations, γ-phase is absent,
as confirmed by Raman measurements. This observation establishes that the rate of
supersaturating generation and drying conditions can control the polymorph selectivity
through changing the crystal growth kinetics and thermodynamics as discussed below.
Crystallization of the needle-shaped β-glycine for all concentrations is in agreement
with the basics of Ostwald law [168], which states that the crystallization from a solution
should start from the nucleation of the least stable polymorph and then it should transform to
a more stable phase. It is true also for the glycine-based solutions: we have shown that the
less stable β-phase is formed first (Figs. 4.12 and 4.13). At high concentration (0.66 M) (Fig.
4.12), since the time between the appearance of first β-crystals (Fig. 4.12b) and complete
drying (Fig. 4.12f) was sufficiently long (almost 20 min), the β-crystals nucleated at the
periphery of the drop could eventually grow to a large size, but part of them was readily
transformed to α- or γ-phases through the contact with the solution. In the central part of the
drop, α-crystals of a bipyramidal shape had also enough time to nucleate and grow.

Crystal Growth and Characterization
67
Figure 4.12. Optical images of the glycine crystals growth during evaporation of a 0.66 M
solution drop on a Pt/Ti/SiO2/Si substrate. All images are the same scale.
In contrast, at lower concentrations (0.133 M, Fig. 4.13) β-crystals were the
predominant species on the surface, because the solution reached the saturation before
completely drying, thus nucleation and growth occurred in a few seconds (Fig. 4.13c−e). In
other words, β-crystals appear some minutes before drying and do not have time to transform
to the undesirable α-phase. As such, nonequilibrium precipitation and fast drying yield the
kinetically limited polymorph, β-phase, at the expense of the undesirable γ- and α-phases. All
these studies suggest that kinetic restrictions on crystal nucleation and growth have a
β
84 min
70 min 80 min
β α
86 min
α α
β
α
95 min 100 min
200 μm

Chapter 4
68
dominant effect on polymorph selectivity, despite the thermodynamic driving force caused by
the relative stability of different polymorphs.
In addition, the dendrite β-glycine structure grows very fast on the Pt substrate
between microcrystals for low solution concentration (Fig. 4.13e). Thin liquid between the
crystals raptures by dewetting, and dendrite crystals are created due to 2D nucleation on the
surface. This phenomenon, usually referred as spinodal dewetting [169], and the specific
formed dendrite patterns are highly dependent to the type of chosen substrate [170]. Little
difference in the grown structures was observed upon repeating the growth experiments with
slightly different relative humidity and temperatures. After complete drying, β-crystals were
stabilized through their contact with the Pt substrate and we did not see any further
transformation to other phases within 1 month of the shelf time under ambient conditions.
The grown β-crystals possessed the identical Raman spectra and looked uniform and
transparent under a polarized light (Fig. 4.14). The average sizes of β-glycine needle-shaped
crystals grown from the diluted solution (about 30 × 200 μm2) were comparable to those
reported in the literature [171]. At 0.133 M concentration, the (001) peak of β-glycine (2θ =
18°) was considerably increased (Fig. 4.9). This confirms that the (001) crystal planes are
parallel to the substrate and that the growth direction of the needle crystals is along the (100)
plane (b direction).

Crystal Growth and Characterization
69
Figure 4.13. Optical images of the glycine crystals grown by the evaporation of 0.133 M
solution drop on Pt/Ti/SiO2/Si substrate. All images are the same scale.
70 min 80 min
85 min
β
β
86 min 100 min
200 μm
β
85.5 min
α

Chapter 4
70
Figure 4.14. Optical image of two β-glycine crystals obtained after 1 month of shelf
storage.
The observed stability and preferred growth of β-glycine can be attributed to the
interaction between the glycine molecules and highly crystalline Pt/Ti/SiO2/Si substrate. In
general, the nucleation and growth of organic molecular crystals on the crystalline substrates
are controlled by chemical interactions rather than by the epitaxial relationship [172]. The
adsorption and surface interaction mechanism of glycine molecule on Pt surface have been
studied a long time ago [163,173]. It was reported that the glycine zwitterions could adsorb
on the Pt surface through the interactions of both deprotonated carboxyl (−COO−) and
protonated amino (−NH3+) groups. In this bonding, the lone-pair orbital of the oxygen atom
overlap with orbitals of the three adjacent Pt atoms forming the hollow site, and the lone-pair
orbitals of the nitrogen atom could well couple to the Pt dz2 orbital in the on-top position
[174]. We believe that, due to this interaction, Pt surface acts as a nucleation site for glycine
crystals through bonding and stabilization of the initial β-phase nuclei. Therefore, it
facilitates the growth and prevents further rearrangement of molecules and phase
transformation into other phases. Since the observed solid–solid phase transformation starts
from the crystal–substrate interface, chemical interaction of glycine with Pt may prevent this
transformation in an adlayer and thus consequently slow down the transformation of the
entire crystal. These observations reveal the potential of Pt-coated substrates to control the
polymorphic selectivity, stability, and preferred orientation of β-glycine.
Dendrite β-glycine structures were even more stable as compared to needle-shaped
ones under ambient conditions over a period of several months due to their nanoscale
thickness and better interaction between the glycine functional groups with Pt substrate.
50 µm

Crystal Growth and Characterization
71
In addition to micro-Raman data, single crystal X-ray diffraction measurements have
been done for the crystals of needle-like and bipyramidal shapes. The results revealed that the
needle-shaped crystals (assigned to β-phase by Raman spectroscopy) belong to the
monoclinic system (group P21) with the following unit cell parameters: a = 5.08 Å, b = 6.25
Å, c = 5.36 Å, β = 113.43°, and α = γ = 90°. These values are very close to those reported
previously in the literature [175]. As expected, bipyramidal crystals (α-phase) exhibited
reflections characteristic for the monoclinic structure (symmetry P21/n), and the following
cell parameters were extracted: a = 5.08 Å, b = 11.90 Å, c = 5.46 Å, β = 111.29°, and α = γ =
90°. These values are also in a good agreement with the literature data [176]. Therefore, we
can conclude that the preferential growth of high-quality glycine β-polymorph was achieved
by the careful control of the growth conditions and choice of the suitable substrate (Pt).
4.3. Glycine Thin Films
The difficulties in the growth of large bulk single crystals of β-glycine have motivated
us to try to prepare thin films of glycine for easier miniaturization and integration. Several
methods exist for the formation of ordered layers of organic materials on surfaces. Among
them spin coating offers a simple inexpensive method which was extensively applied for the
deposition of thin layers of polymers thin films [177] and nanostructures of functional
molecules [178]. For the spin-coating process the arrangement and adsorption of molecules
with special functional groups on the surface can be achieved almost instantaneously
depending on the rotation speed. Here, we show that this simple and widely used method can
be used for the fabrication of regular arrays of β-glycine micro- and nanoislands with regular
in-plane orientation of crystallographic axes of β-glycine on Pt substrates.
4.3.1. Thin Film Preparation
Glycine films were prepared by the spin-coating of glycine solutions. A drop of the
glycine solution (50 ml and 0.13 M) was placed on the Pt-coated Ti/SiO2/Si substrate by a
micropipette and then the substrate was rotated at a speed of 2000 rpm for 3 min to spread out
and to simultaneously dry the solution. The centrifugal force pushes the solution to flow
radially outward the center of rotation while decreasing its thickness, as the solvent
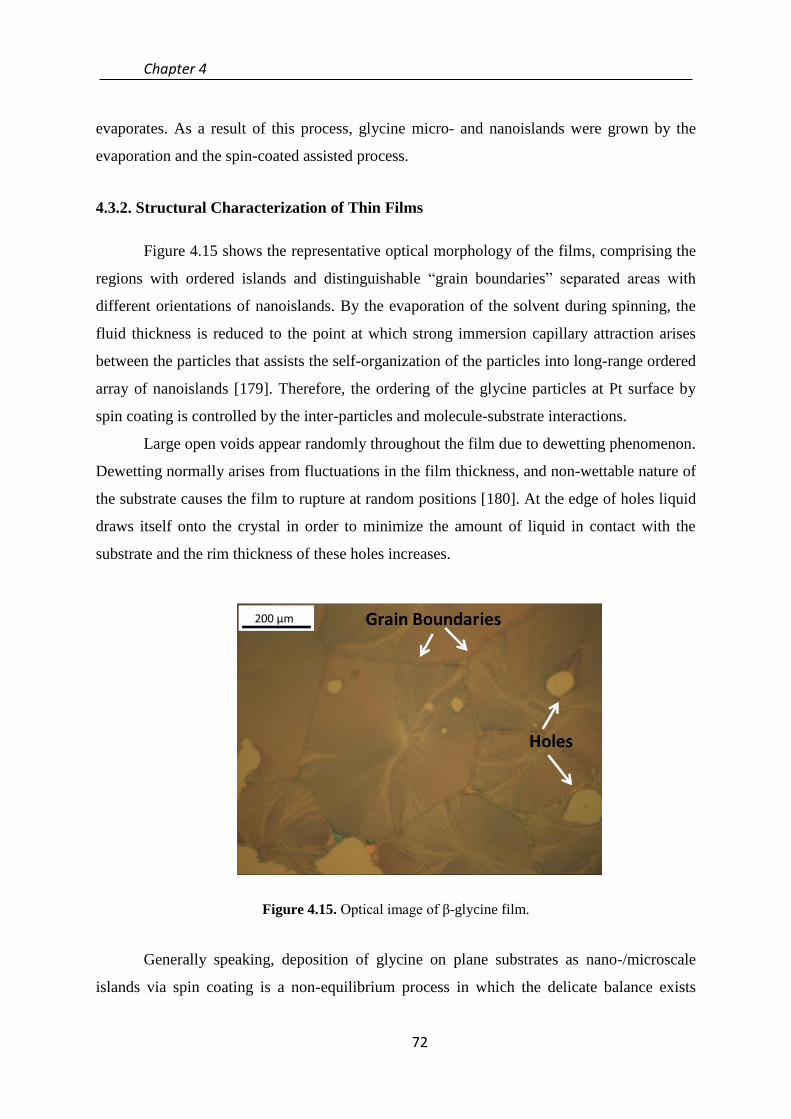
Chapter 4
72
evaporates. As a result of this process, glycine micro- and nanoislands were grown by the
evaporation and the spin-coated assisted process.
4.3.2. Structural Characterization of Thin Films
Figure 4.15 shows the representative optical morphology of the films, comprising the
regions with ordered islands and distinguishable “grain boundaries” separated areas with
different orientations of nanoislands. By the evaporation of the solvent during spinning, the
fluid thickness is reduced to the point at which strong immersion capillary attraction arises
between the particles that assists the self-organization of the particles into long-range ordered
array of nanoislands [179]. Therefore, the ordering of the glycine particles at Pt surface by
spin coating is controlled by the inter-particles and molecule-substrate interactions.
Large open voids appear randomly throughout the film due to dewetting phenomenon.
Dewetting normally arises from fluctuations in the film thickness, and non-wettable nature of
the substrate causes the film to rupture at random positions [180]. At the edge of holes liquid
draws itself onto the crystal in order to minimize the amount of liquid in contact with the
substrate and the rim thickness of these holes increases.
Figure 4.15. Optical image of β-glycine film.
Generally speaking, deposition of glycine on plane substrates as nano-/microscale
islands via spin coating is a non-equilibrium process in which the delicate balance exists

Crystal Growth and Characterization
73
between the centrifugal force, rate of evaporation and crystal growth rate. Such has the
following advantages: fast fabrication time, preferential growth of useful β-phase, and easy
control of nanoislands size and orientation relative to the center of the drop.
Raman spectroscopy was used to identify the structure of individual islands and
direction of the crystallographic axes relative to the center of each grain. Analysis of the
position of spectral peaks confirmed that all islands belong to ferroelectric beta phase. Inside
each grain there is a spherulite-like structure [181]; these spherulites, growing from central
parts, outward along the radial directions governed by four-fold symmetry arrangements of
islands (Fig. 4.16a). By using the polarized Raman spectra we could prove that b- (polar) and
c-axes of the film laid in plane of the substrate, and the c-axis laid preferably along the
longest axis of each island (i.e. in the radial direction), while the b-axis was perpendicular.
(Fig. 4.16b,c).
Figure 4.16. (a) Radial arrangement of the glycine islands and development of spherulitic
structure. (b) and (c) Identification of the axes orientation of each glycine island by
polarized Raman spectroscopy.
(a)

Chapter 4
74
Important parameters that affect the structural formation of spin-coated crystals are the
concentration of solution and spinning speed. With increasing concentration and decreasing
rotational speed, the films become thicker and denser but less homogeneous [182]. However,
we did not do any quantitative measurements the film thickness as function of the spinning
speed and solution concentration.
Thus obtained glycine particles were stable under ambient conditions over a period of
one year, perhaps due to its nanoscale dimension and good contact with the Pt substrate.
4.4. Summary
Single crystals of all three phases of glycine were grown from the solution at room
temperature. Their polymorphic phase, crystalline structure, and stability were examined by
combined methods of optical microscopy, X-ray diffraction, and Raman spectroscopy.
Due to inherent instability of β-glycine at ambient conditions, a simple method of
stabilization of the β-phase is demonstrated based on the evaporation of aqueous solution on
crystalline Pt(111) substrates. We have found that the interplay between the concentration of
the glycine solution and crystallization effect of the surface results in the preferential growth
of glycine β-phase with well-defined shape and morphology. These two parameters are
suggested to be the major factors controlling the evaporation rate and growth kinetics. As a
result, β-glycine needle-shaped crystals with the average size of 30 × 200 μm2 were grown on
Pt/Ti/SiO2/Si under ambient conditions. No encapsulation in polymers or nanopores was
indeed needed to maintain the stability of β-phase.
Glycine thin films were grown on Pt-coated Si substrates by spin coating method. The
self-organization process during spin-coating creates the ordered particle arrays due to
capillary and other forces. Film morphology is dominated by the “grains”, each composed of
one spherulite-like structure. The orientation of crystal axes inside each grain area was
determined by the precise analysis of the position of the Raman spectrum lines.
Chapter 5
Electromechanical and Non-linear
Optical Properties of Glycine Crystals

Chapter 5
76

Electromechanical and Non-linear Optical Properties of Glycine Crystals
77
Non-centrosymmetric crystals such as β-glycine (space group P21) and γ-glycine
(space group P32) are of special interest for bioelectronics, biomechanics and bioMEMS
applications. In this Chapter we attempt to analyze the electromechanical properties of both
γ- and β-glycine forms to establish their piezoelectric activity and possible switching
behavior.
The switching process and creation of elongated ferroelectric domains as well as
dynamics of domains propagation under different voltage pulses with variable height and
durations are studied in the ferroelectric phase of β-glycine. Thermodynamic theory is
applied to explain the variation of domain length and aspect ratio under the voltage applied to
the PFM tip. The process of domain backswitching is also investigated. In addition,
piezoelectric activity and switching behavior are being theoretically approached by molecular
modeling.
In the following of this Chapter, the non-linear optical properties of β-glycine are
studied. Second harmonic generation (SHG) signal was compared with the crystallographic
symmetry of β-glycine and with biomolecular modelling. Finally, possible applications of
glycine crystals with controlled domain structure in various applications are discussed.
5.1. PFM in γ-glycine
The non-centrosymmetric structure of γ-glycine crystal was characterized for local
piezoelectricity and possible ferroelectric properties. A detailed study of the piezoelectricity
was carried out by in-plane (lateral) and out-of-plane (vertical) PFM. The out-of-plane PFM
is measured by the piezoelectric response directed along the normal to the crystal surface,
while the in-plane mode as shear response of the cantilever.
The crystals were cut parallel to the (100) and (001) planes (Fig. 5.1a).
Piezoelectricity was studied on both polished planes of glycine by means of vectorial PFM.
In general, PFM contrast confirms the polarization homogeneity on each surface and high
enough crystallinity of the samples. The values piezoresponse amplitude and phase allows
determining the orientation of the polarization P in each plane. In Fig. 5.1b,c the (100)
surfaces show a significant in-plane (IP) signal with uniform contrast of phase which is
reversed upon rotation of the crystal by 180 degrees. The plane cut normally to c axis (001)
displays significant out-of-plane (OOP) contrast providing information about vertical
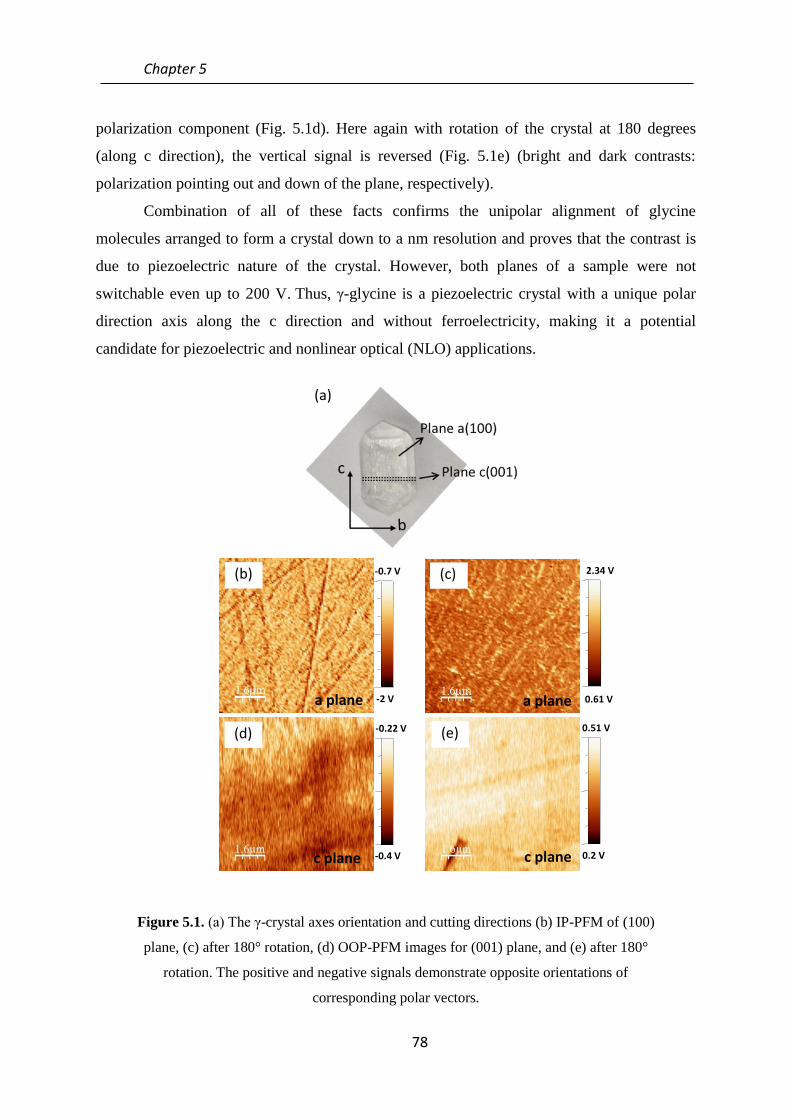
Chapter 5
78
polarization component (Fig. 5.1d). Here again with rotation of the crystal at 180 degrees
(along c direction), the vertical signal is reversed (Fig. 5.1e) (bright and dark contrasts:
polarization pointing out and down of the plane, respectively).
Combination of all of these facts confirms the unipolar alignment of glycine
molecules arranged to form a crystal down to a nm resolution and proves that the contrast is
due to piezoelectric nature of the crystal. However, both planes of a sample were not
switchable even up to 200 V. Thus, γ-glycine is a piezoelectric crystal with a unique polar
direction axis along the c direction and without ferroelectricity, making it a potential
candidate for piezoelectric and nonlinear optical (NLO) applications.
Figure 5.1. (a) The γ-crystal axes orientation and cutting directions (b) IP-PFM of (100)
plane, (c) after 180° rotation, (d) OOP-PFM images for (001) plane, and (e) after 180°
rotation. The positive and negative signals demonstrate opposite orientations of
corresponding polar vectors.
0.61 V
2.34 V -221.19 mV
-389.33 mV
-0.7 V
-2 V
(b) -221.19 mV
-389.33 mV
-0.22 V
-0.4 V
-221.19 mV
-389.33 mV
-221.19 mV
-389.33 mV
0.51 V
0.2 V
(e)
(c)
(d)
pl n pl n
pl n pl n
(a)
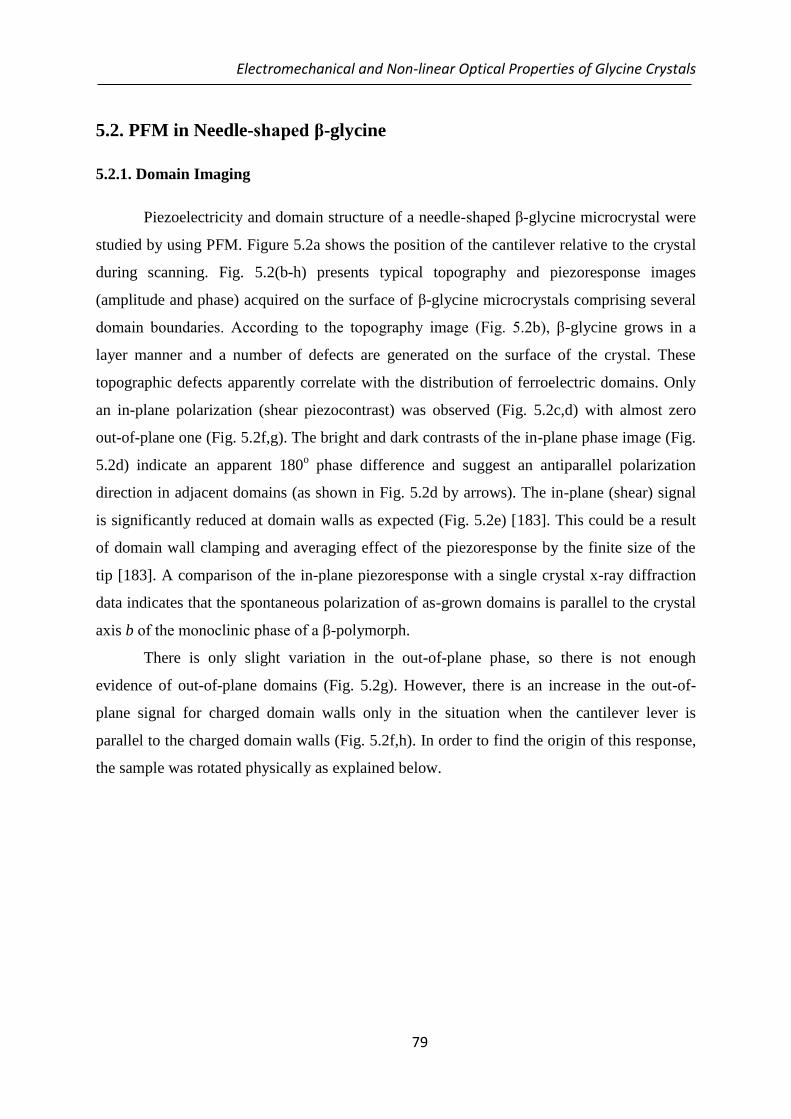
Electromechanical and Non-linear Optical Properties of Glycine Crystals
79
5.2. PFM in Needle-shaped β-glycine
5.2.1. Domain Imaging
Piezoelectricity and domain structure of a needle-shaped β-glycine microcrystal were
studied by using PFM. Figure 5.2a shows the position of the cantilever relative to the crystal
during scanning. Fig. 5.2(b-h) presents typical topography and piezoresponse images
(amplitude and phase) acquired on the surface of β-glycine microcrystals comprising several
domain boundaries. According to the topography image (Fig. 5.2b), β-glycine grows in a
layer manner and a number of defects are generated on the surface of the crystal. These
topographic defects apparently correlate with the distribution of ferroelectric domains. Only
an in-plane polarization (shear piezocontrast) was observed (Fig. 5.2c,d) with almost zero
out-of-plane one (Fig. 5.2f,g). The bright and dark contrasts of the in-plane phase image (Fig.
5.2d) indicate an apparent 180o phase difference and suggest an antiparallel polarization
direction in adjacent domains (as shown in Fig. 5.2d by arrows). The in-plane (shear) signal
is significantly reduced at domain walls as expected (Fig. 5.2e) [183]. This could be a result
of domain wall clamping and averaging effect of the piezoresponse by the finite size of the
tip [183]. A comparison of the in-plane piezoresponse with a single crystal x-ray diffraction
data indicates that the spontaneous polarization of as-grown domains is parallel to the crystal
axis b of the monoclinic phase of a β-polymorph.
There is only slight variation in the out-of-plane phase, so there is not enough
evidence of out-of-plane domains (Fig. 5.2g). However, there is an increase in the out-of-
plane signal for charged domain walls only in the situation when the cantilever lever is
parallel to the charged domain walls (Fig. 5.2f,h). In order to find the origin of this response,
the sample was rotated physically as explained below.

Chapter 5
80
Figure 5.2. (a) Schematic of cantilever position on a needle-shaped β-crystal, (b)
Topography, (c) LPFM amplitude, (d) LPFM phase, (e) Cross-sections across the domain
wall on the topography and LPFM amplitude images (marked by green line), (f) VPFM
amplitude, (g) VPFM phase, and (h) Cross section across the domain wall on the
topography and VPM amplitude.
Comparing piezocontrast in the vertical and lateral images and considering the
geometry of the PFM tip and crystal axes allowed revealing information about the
spontaneous polarization direction of the crystal and boundaries [184]. When the cantilever is
perpendicular to the long axis of the crystal, the in-plane contrast is maximal (Fig. 5.2a).
After rotating the crystal (180°), the signal will be reversed. Upon rotation the sample at 90
degrees (Fig. 5.3a), in-plane contrast disappears inside domains and the charged domain
walls, which are now perpendicular to the lever, give enhanced in-plane response (out-of-
plane signal is absent), which is coincident with topography (Fig. 5.3b-d). It confirms that
inside the domains spontaneous polarization lies in the b direction of the β-phase crystal (Fig.
5.2a). The arrows show the orientation of the polarization with respect to the domain wall
(c) (e) (d)
(f) (g) (h)
(a) (b)

Electromechanical and Non-linear Optical Properties of Glycine Crystals
81
(Fig. 5.3c). This means that the response from the boundaries in Fig. 5.2f is not due to the
true out-of-plane polarization vector or topography effect, but rather to some buckling of the
cantilever. For the case of IP polarization vectors parallel to the cantilever axis, the shear
strain from the sample induces buckling oscillations, which are detected as OP signal [185].
This explanation was confirmed by domain switching experiments as described below.
These observations suggest the presence of a complex structure of charged domain
walls, which includes a thin layer with polarization directed parallel to defect (Fig. 5.3.e).
This is the reason why domain wall becomes seemingly wider. In the in-plane phase image
(Fig. 5.3.d), one can notice the areas with the opposite contrast, which is obviously connected
with opposite signs of the related "head-to-head" and "tail-to-tail" charged walls.
Figure 5.3. (a) Schematic of the cantilever position on a needle-shaped β-crystal, (b)
Topography, (c) LPFM amplitude, (c) LPFM phase and (d) A cartoon sketch of
ferroelectric domain walls according to PFM (overlaid) and its derivative images.
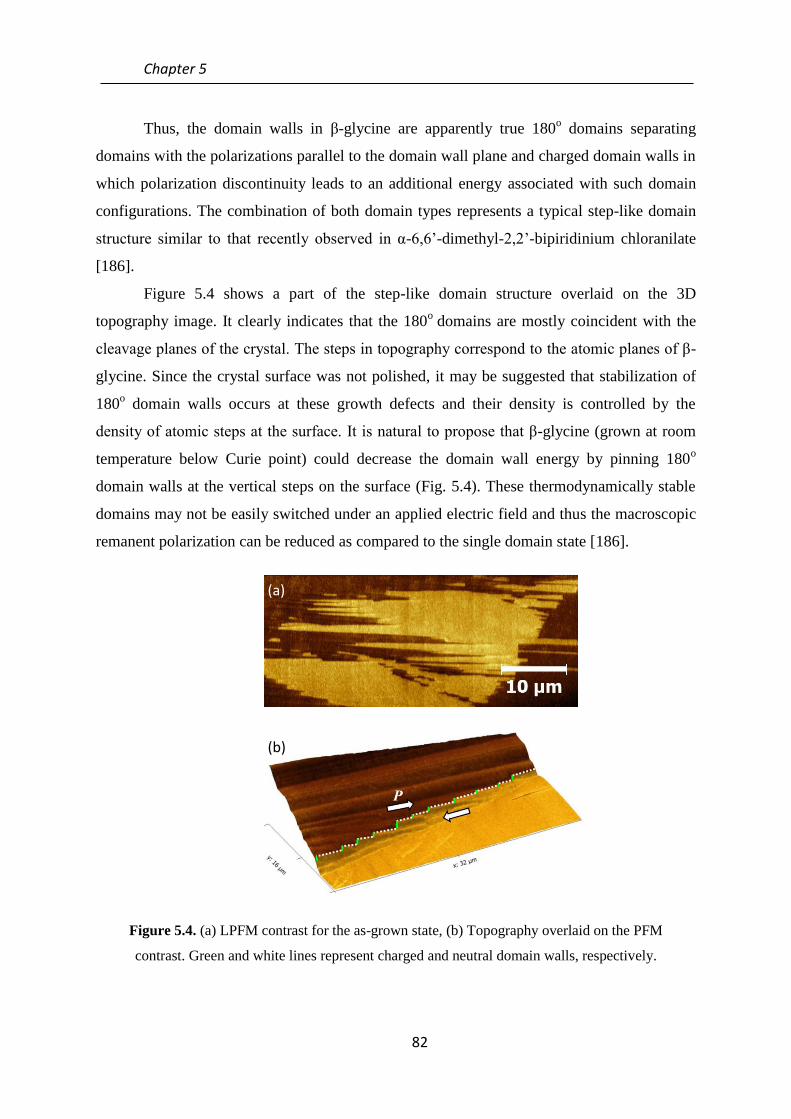
Chapter 5
82
Thus, the domain walls in β-glycine are apparently true 180o domains separating
domains with the polarizations parallel to the domain wall plane and charged domain walls in
which polarization discontinuity leads to an additional energy associated with such domain
configurations. The combination of both domain types represents a typical step-like domain
structure similar to that recently observed in α-6,6’-dimethyl-2,2’-bipiridinium chloranilate
[186].
Figure 5.4 shows a part of the step-like domain structure overlaid on the 3D
topography image. It clearly indicates that the 180o
domains are mostly coincident with the
cleavage planes of the crystal. The steps in topography correspond to the atomic planes of β-
glycine. Since the crystal surface was not polished, it may be suggested that stabilization of
180o domain walls occurs at these growth defects and their density is controlled by the
density of atomic steps at the surface. It is natural to propose that β-glycine (grown at room
temperature below Curie point) could decrease the domain wall energy by pinning 180o
domain walls at the vertical steps on the surface (Fig. 5.4). These thermodynamically stable
domains may not be easily switched under an applied electric field and thus the macroscopic
remanent polarization can be reduced as compared to the single domain state [186].
Figure 5.4. (a) LPFM contrast for the as-grown state, (b) Topography overlaid on the PFM
contrast. Green and white lines represent charged and neutral domain walls, respectively.
(b)
(a)
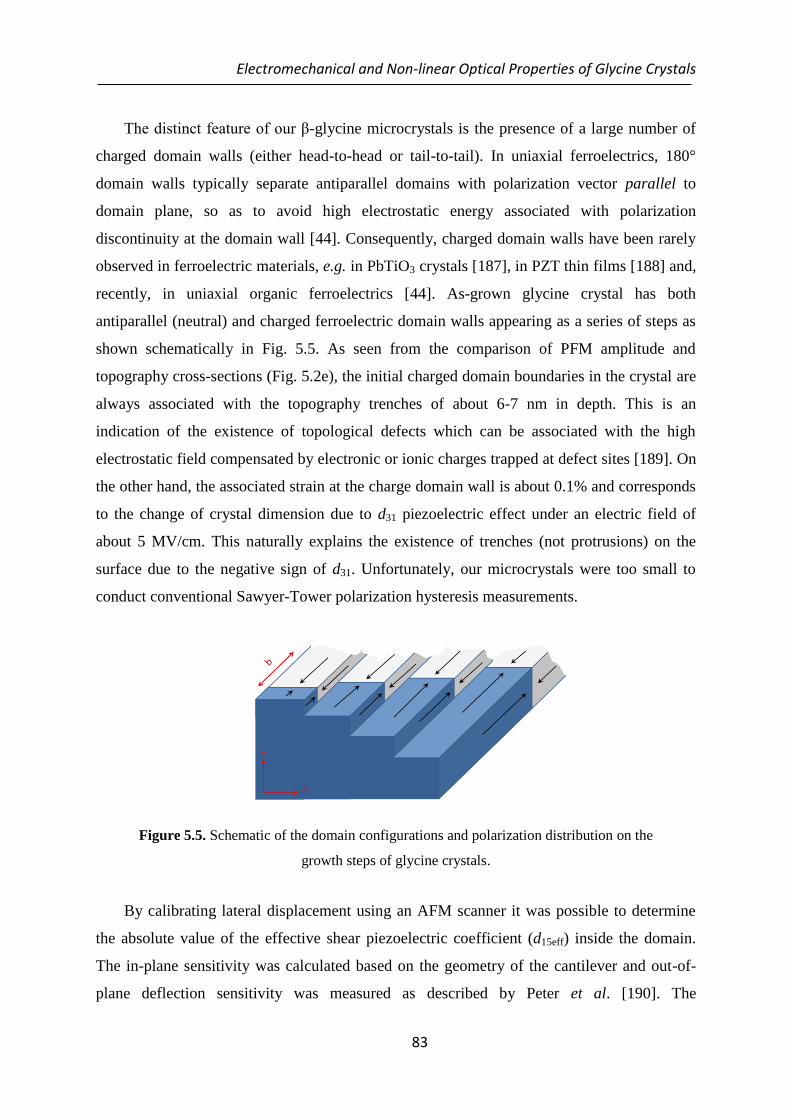
Electromechanical and Non-linear Optical Properties of Glycine Crystals
83
The distinct feature of our β-glycine microcrystals is the presence of a large number of
charged domain walls (either head-to-head or tail-to-tail). In uniaxial ferroelectrics, 180°
domain walls typically separate antiparallel domains with polarization vector parallel to
domain plane, so as to avoid high electrostatic energy associated with polarization
discontinuity at the domain wall [44]. Consequently, charged domain walls have been rarely
observed in ferroelectric materials, e.g. in PbTiO3 crystals [187], in PZT thin films [188] and,
recently, in uniaxial organic ferroelectrics [44]. As-grown glycine crystal has both
antiparallel (neutral) and charged ferroelectric domain walls appearing as a series of steps as
shown schematically in Fig. 5.5. As seen from the comparison of PFM amplitude and
topography cross-sections (Fig. 5.2e), the initial charged domain boundaries in the crystal are
always associated with the topography trenches of about 6-7 nm in depth. This is an
indication of the existence of topological defects which can be associated with the high
electrostatic field compensated by electronic or ionic charges trapped at defect sites [189]. On
the other hand, the associated strain at the charge domain wall is about 0.1% and corresponds
to the change of crystal dimension due to d31 piezoelectric effect under an electric field of
about 5 MV/cm. This naturally explains the existence of trenches (not protrusions) on the
surface due to the negative sign of d31. Unfortunately, our microcrystals were too small to
conduct conventional Sawyer-Tower polarization hysteresis measurements.
Figure 5.5. Schematic of the domain configurations and polarization distribution on the
growth steps of glycine crystals.
By calibrating lateral displacement using an AFM scanner it was possible to determine
the absolute value of the effective shear piezoelectric coefficient (d15eff) inside the domain.
The in-plane sensitivity was calculated based on the geometry of the cantilever and out-of-
plane deflection sensitivity was measured as described by Peter et al. [190]. The

Chapter 5
84
piezoresponse signal of β-glycine was measured at a point inside the domain while varying
the amplitude of the ac bias from 0 to 15 V. The effective shear piezoelectric coefficient was
calculated directly from the slope of the acquired curve and in-plane torsional sensitivity of
the cantilever [190]. The value varied from point to point with an average effective
coefficient of about 6 pm/V. It should be noted that this value cannot represent the true bulk
coefficient and should be used with caution to evaluate piezoelectric activity of the amino
acid crystals. Still this value is significantly greater than that of the corresponding coefficient
of quartz (d14 = 0.76 pm/V) [191] and similar to that of ZnO [192].
5.2.2. Switchability of β-glycine
In order to confirm polarization switchability in β-glycine, an external electric field
was applied locally via a PFM tip to the crystal with in-plane polarization and domain
switching was controlled by varying the amplitude and duration of dc bias pulses [193]. It is
well known that the electric field created via PFM tip is inhomogeneous and has a maximum
intensity in a direction perpendicular to the sample surface. Due to this effect, it is possible to
create artificial domains with the polarization perpendicular to the ferroelectric surface and
monitor their switching kinetics by measuring the domain diameter versus applied voltage
[194,195]. Since switching in uniaxial ferroelectrics is limited to 180° reversal of the
polarization, the field can create only a 180° domain with polarization parallel to the surface
in in-plane domains. Recently, Pertsev and Kholkin [196] have theoretically shown that the
180° in-plane polarization switching can be observed in uniaxial ferroelectrics when the
initial polarization is parallel to the sample surface. In this approach, the PFM tip is
represented as a line of charges [195] extending from Z = ℎ to Z = H (h is the distance
between the tip apex charge and the crystal surface and H is the total tip height) and potential
distribution created by the tip inside the ferroelectric crystal can be written in the form:
ø𝑡𝑖𝑝 =𝑉
ln[2𝐻√ε𝑥ε𝑧
(𝑟𝑡𝑖𝑝 ε𝑒𝑥𝑡)]
ln [𝐻− √ε𝑥 ε𝑧⁄ 𝑧 +√𝑥2 + (ε𝑥 ε𝑦⁄ )𝑦2+(𝐻 − √ε𝑥 ε𝑧⁄ 𝑧)
2
ℎ− √ε𝑥 ε𝑧⁄ 𝑧 +√𝑥2 + (ε𝑥 ε𝑦⁄ )𝑦2+(ℎ − √ε𝑥 ε𝑧⁄ 𝑧)2
] (5.1)
where x is a coordinate parallel to the polar axis (in our case b direction), z is the coordinate
perpendicular to the surface, rtip is the effective radius of the tip, εext is the dielectric
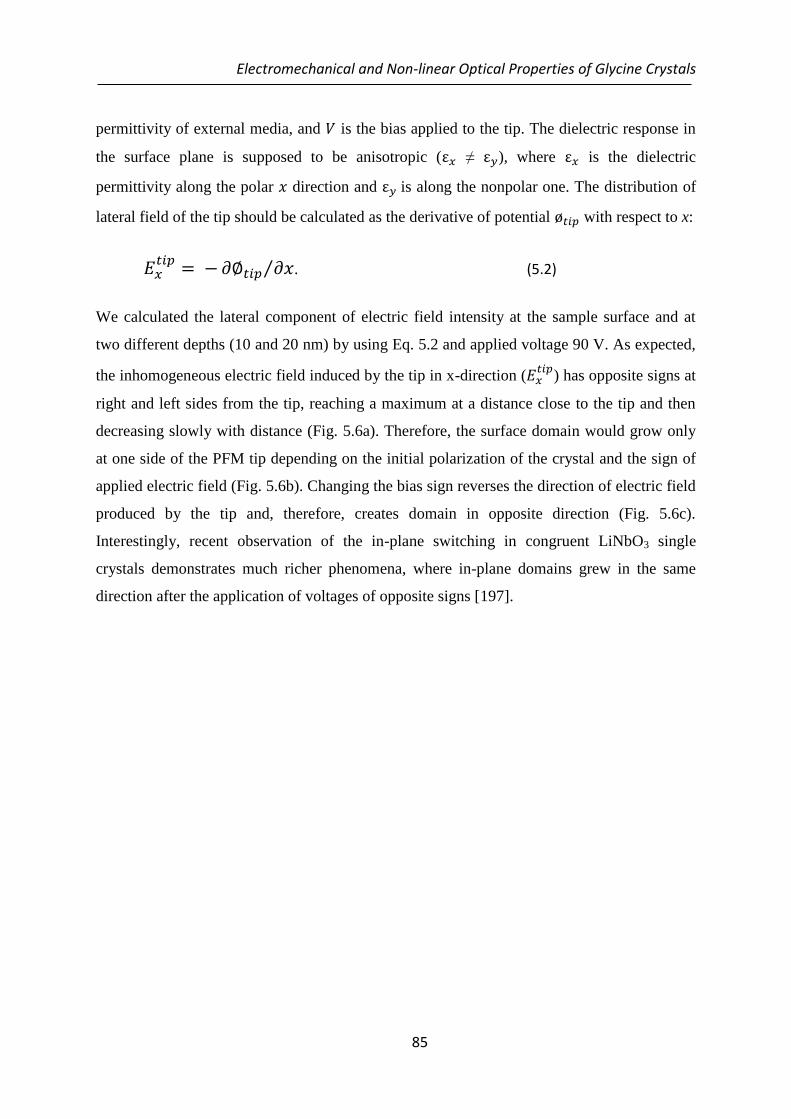
Electromechanical and Non-linear Optical Properties of Glycine Crystals
85
permittivity of external media, and 𝑉 is the bias applied to the tip. The dielectric response in
the surface plane is supposed to be anisotropic (ε𝑥 ≠ ε𝑦), where ε𝑥 is the dielectric
permittivity along the polar 𝑥 direction and ε𝑦 is along the nonpolar one. The distribution of
lateral field of the tip should be calculated as the derivative of potential ø𝑡𝑖𝑝 with respect to x:
𝐸𝑥𝑡𝑖𝑝
= −𝜕∅𝑡𝑖𝑝 𝜕𝑥⁄ . (5.2)
We calculated the lateral component of electric field intensity at the sample surface and at
two different depths (10 and 20 nm) by using Eq. 5.2 and applied voltage 90 V. As expected,
the inhomogeneous electric field induced by the tip in x-direction (𝐸𝑥𝑡𝑖𝑝
) has opposite signs at
right and left sides from the tip, reaching a maximum at a distance close to the tip and then
decreasing slowly with distance (Fig. 5.6a). Therefore, the surface domain would grow only
at one side of the PFM tip depending on the initial polarization of the crystal and the sign of
applied electric field (Fig. 5.6b). Changing the bias sign reverses the direction of electric field
produced by the tip and, therefore, creates domain in opposite direction (Fig. 5.6c).
Interestingly, recent observation of the in-plane switching in congruent LiNbO3 single
crystals demonstrates much richer phenomena, where in-plane domains grew in the same
direction after the application of voltages of opposite signs [197].
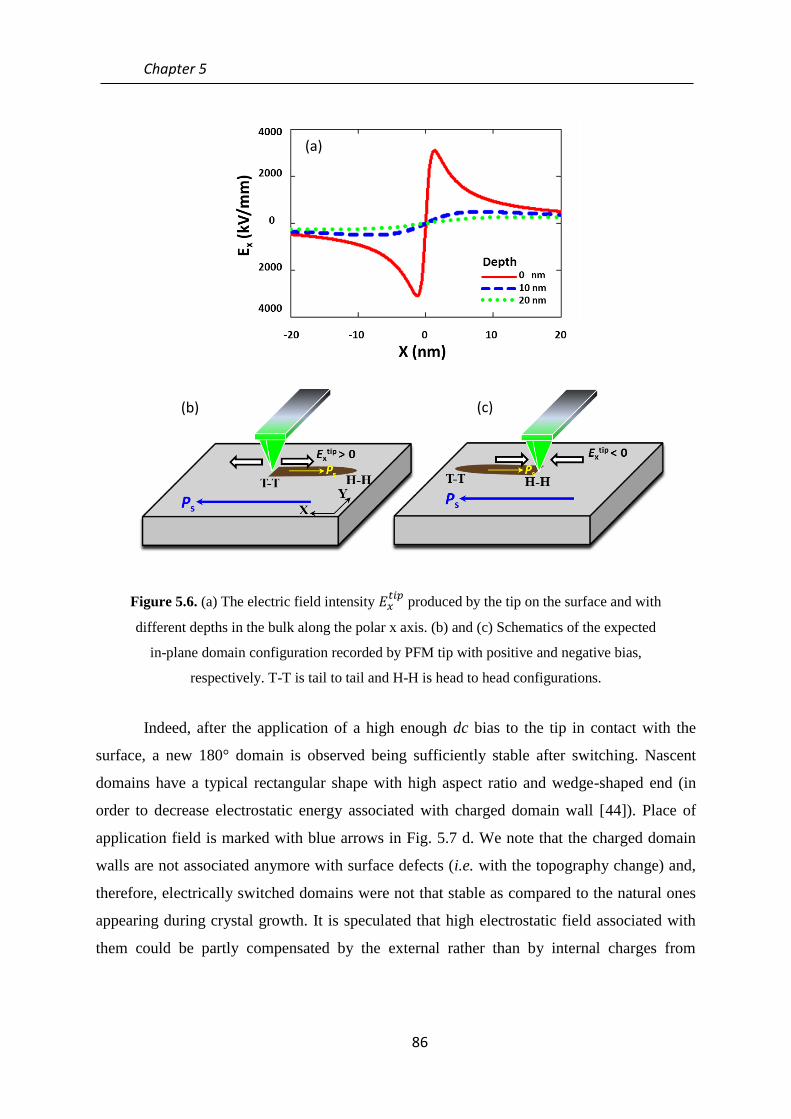
Chapter 5
86
Figure 5.6. (a) The electric field intensity 𝐸𝑥𝑡𝑖𝑝
produced by the tip on the surface and with
different depths in the bulk along the polar x axis. (b) and (c) Schematics of the expected
in-plane domain configuration recorded by PFM tip with positive and negative bias,
respectively. T-T is tail to tail and H-H is head to head configurations.
Indeed, after the application of a high enough dc bias to the tip in contact with the
surface, a new 180° domain is observed being sufficiently stable after switching. Nascent
domains have a typical rectangular shape with high aspect ratio and wedge-shaped end (in
order to decrease electrostatic energy associated with charged domain wall [44]). Place of
application field is marked with blue arrows in Fig. 5.7 d. We note that the charged domain
walls are not associated anymore with surface defects (i.e. with the topography change) and,
therefore, electrically switched domains were not that stable as compared to the natural ones
appearing during crystal growth. It is speculated that high electrostatic field associated with
them could be partly compensated by the external rather than by internal charges from
(b) (c)
(a)

Electromechanical and Non-linear Optical Properties of Glycine Crystals
87
defects. It has been found that as-grown charged domain walls cannot be moved even under
very high electric bias applied to the tip.
Although there are no features on the topography, while there is enhanced OOP signal
in charged wall as shown in VPFM amplitude and cross section across the domain wall (Fig.
5.7e,g). Therefore, it confirms again that OOP signal in a charged wall is not due to a surface
but rather to a bulk effect.
Figure 5.7. PFM image of the domain structure of the crystal after the application of an
external field, (a) Surface deflection, (b) topography, (c) LPFM amplitude, (d) LPFM
phase, (e) VPFM amplitude and (f) VPFM phase, (g) Cross-section along the domain wall
(green line) on the amplitude profile. The arrow indicates the probe contact regions in the
process of writing.
Figures 5.8a and b represent domains appearing after the application of -90 V to the
tip for two opposite polarization states and different pulse durations. The direction of the
nascent domain is sensitive to the initial polarization direction and changes to the opposite
one upon crystal rotation at 180o.

Chapter 5
88
Figure 5.8. LPFM image of domains after writing in bright (a) and dark areas (b) by tip
voltages of -90 V with different pulse durations (the arrows show the contact points of the
AFM tip).
Domains lengths were found to be dependent on the amplitude and duration of the
applied voltage pulse. Figure 5.9 illustrates the voltage dependence of the domain length for
fixed bias pulse duration (10 s). Independently of the voltage pulse duration, the critical
voltage was about 65 V for both orientations of the initial polarization. Small variation of
critical voltages (±5 V) probably originates from different defect structure (density, defect
type) under the tip.
Figure 5.9. Domain length as a function of applied voltage for fixed pulse duration (10 s).
The value of threshold voltage needed for the appearance of domains on non-polar
surface is more than three times greater than that necessary for the switching on the polar
surface in glycine (𝑉𝑐𝑟 ≈ 20 𝑉 according to Ref. [15] ). There are two reasons for that. First,
due to dielectric anisotropy of the surface (ε𝑧 ε𝑥⁄ > 2) , the maximum value of 𝐸𝑧 is about
two times higher than that of 𝐸𝑥, similar to the case of the non-polar surface of uniaxial
LiNbO3. Second, back switching effect could be more pronounced for in-plane domains
-90 V, 5 s
-90 V, 10 s
Ps
5 µm
V
0.9
-0.9
-90 V, 10 s
-90 V, 3 s
5 µm
(a) (b)

Electromechanical and Non-linear Optical Properties of Glycine Crystals
89
which are not sufficiently stable due to incomplete polarization screening [197]. Apparently,
domains switched under lower voltages are unstable and the initial polarization state is
recovered after the external field is switched off. This happens due to fundamental instability
of the charged domain which cannot be completely screened with absence of the slow bulk
screening processes [198].
The domain lengths were also found to depend on the duration of the applied voltage as
seen in Fig. 5.10a. The threshold time was about 2 s. At shorter times the domains were not in
the equilibrium and switched back after the field was removed. Domain wall velocity was
calculated based on the dependence of the domain length on switching time (ν = dL/dt) and is
plotted as a function of the domain length in Fig. 5.10b. Domain wall velocity significantly
decreases with increasing domain length since the lateral electric field decreases with
asymptotic behaviour (𝐸 𝑥𝑡𝑖𝑝~ 1/𝑥) with distance from the tip [196].
Figure 5.10. (a) Domain length as a function of writing time for the applied voltage -90 V.
(b) Domain wall velocity of as a function of domain length for the applied voltage -90 V.
Ferroelectricity in organic crystals arises from the collective transfer of electrons in
charge-transfer (CT) complexes [199] or protons transfer in hydrogen bonded crystals [200], which
are different from ionic displacements in perovskite structure. The spontaneous polarization
of glycine crystal comes from the interaction of permanent dipole moments of glycine
molecules in the volume, but polarization of each chain can be inverted by dynamics of the
intermolecular N-H…O bonds, similar to proton tautomerism of O-H…O bonds in croconic
acid [1] or N-H…N bonds in benzimidazole derivatives [201]. This property is attributed to
the amphoteric nature of glycine molecule which can donate or accept proton to each other.
(a) (b)

Chapter 5
90
With increasing voltage, the domain length reached high values, e.g., ~17 μm for 90
V, or even more as shown in Fig. 5.9. At such distances the associated driving field from the
tip is very weak or practically zero (according to 𝐸𝑥𝑡𝑖𝑝
equation, electric field under the tip of
the probe is about 3000 kV/mm at the voltage of 90 V, the field at a distance of r ≈ 2 μm
from the probe decreases to 5.2 kV/mm). Thus, the domain wall is not driven anymore by the
electric field from the tip. This observation can be explained by the domain breakdown
phenomenon, a domain growth process which was proposed by Molotskii et al. [202]. It
states that the main driving force for domain propagation is a decrease in the depolarizing
field energy of the system, rather than direct effect of the electric field induced by the tip.
Probably in the case of glycine, the domain length increases with consecutive rearrangement
of H atoms position in the intermolecular N-H…O bonds to satisfy the minimum free energy
condition.
The stability of the written domain structures is important for the application of
ferroelectrics for memories. In glycine, the domains are stable for a short time only and then
their length slowly decreases to reach stable configuration or sometimes they fully disappear
similar to the case of single-domain strontium-barium niobate SBN crystals [203]. However,
the time taken for the nucleated domain to switch back after removal of the field is a few
hundred times shorter than the intrinsic switching time.
5.3. Theoretical Calculations
The equilibrium domain size under the voltages above the critical one was determined
using a theoretical approach developed in Ref. 196 and the results were compared with the
experimental results in Fig 5.9. To calculate the dimension of such in-plane domains, a
coordinate system with the z axis perpendicular to the surface and the x axis parallel to the
polar crystallographic direction is considered. The model is based on the minimization of the
total free energy after the polarization switching inside the domain in the form
∆𝐹 = 𝑈𝑑𝑤 + 𝑈𝑑𝑒𝑝 − 2𝑃𝑠 ∫ 𝐸𝑥𝑡𝑖𝑝
(𝑥, 𝑦, 𝑧) 𝑑𝛺
𝛺, (5.3)
where 𝑈𝑑𝑤 is the self-energy of the domain boundary separating the new domain from the
surrounding crystal, 𝑈dep is the energy of a depolarizing field created by the polarization
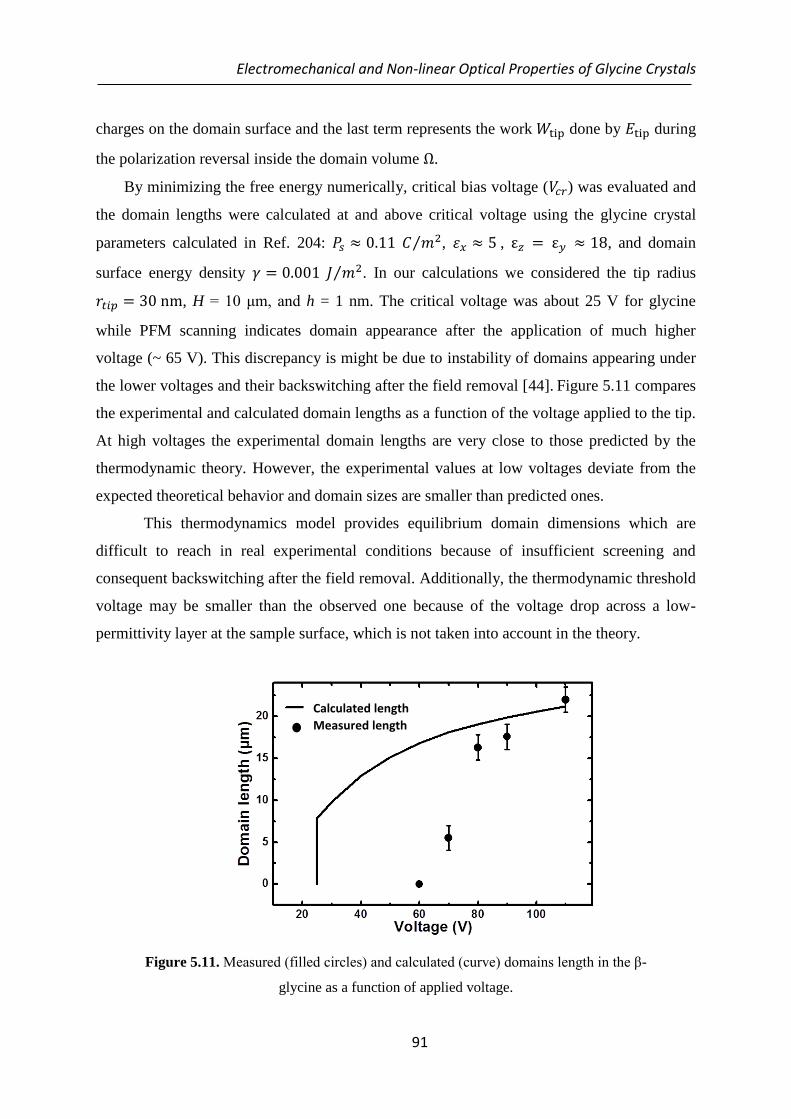
Electromechanical and Non-linear Optical Properties of Glycine Crystals
91
charges on the domain surface and the last term represents the work 𝑊tip done by 𝐸tip during
the polarization reversal inside the domain volume Ω.
By minimizing the free energy numerically, critical bias voltage (𝑉𝑐𝑟) was evaluated and
the domain lengths were calculated at and above critical voltage using the glycine crystal
parameters calculated in Ref. 204: 𝑃𝑠 ≈ 0.11 𝐶 𝑚2⁄ , 𝜀𝑥 ≈ 5 , ε𝑧 = ε𝑦 ≈ 18, and domain
surface energy density 𝛾 = 0.001 𝐽 𝑚2⁄ . In our calculations we considered the tip radius
𝑟𝑡𝑖𝑝 = 30 nm, H = 10 μm, and h = 1 nm. The critical voltage was about 25 V for glycine
while PFM scanning indicates domain appearance after the application of much higher
voltage (~ 65 V). This discrepancy is might be due to instability of domains appearing under
the lower voltages and their backswitching after the field removal [44]. Figure 5.11 compares
the experimental and calculated domain lengths as a function of the voltage applied to the tip.
At high voltages the experimental domain lengths are very close to those predicted by the
thermodynamic theory. However, the experimental values at low voltages deviate from the
expected theoretical behavior and domain sizes are smaller than predicted ones.
This thermodynamics model provides equilibrium domain dimensions which are
difficult to reach in real experimental conditions because of insufficient screening and
consequent backswitching after the field removal. Additionally, the thermodynamic threshold
voltage may be smaller than the observed one because of the voltage drop across a low-
permittivity layer at the sample surface, which is not taken into account in the theory.
Figure 5.11. Measured (filled circles) and calculated (curve) domains length in the β-
glycine as a function of applied voltage.
Calculated length
Measured length

Chapter 5
92
As mentioned in Fig. 5.7 the artificial domains are not associated with topography pits
and therefore they are not very stable and decay under the driving force originated from the
surface energy of the domain wall and the depolarization field energy after removing the
switching voltage [205]. The decay of domains is a nonequilibrium thermodynamical process
proceeding so as to lower the free energy of the system. It is affected by initial domain size,
temperature, crystal defects, which can pin the domain walls, etc [206].
The decay process of domains with different length was measured after poling. Decay
processes depended on the domain size. For longer domain as shown in Fig. 5.12a, firstly, the
domain width becomes uniform through the entire domain, while the length remains almost
unchanged. Then it shrinks relatively slowly in both directions. 80 minutes later, when it
reaches to a critical size, rapidly drops to the as original state. For domain with smaller size
(Fig. 5.12b), it is very unstable and totally switches back to the original state in less than 20
minutes which reveals a fast decay process. Therefore, the larger domains survive more due
to decrease in the domain decay driving forces. The discrepancies between theoretical and
experimental values in the lower voltage (Fig. 5.11) might be due to higher speed of domain
size decay in the first few minutes after switching off the field in smaller domains relative to
larger size. It should be mentioned that the domain stability can also be influenced by the
distance of neighboring domains which is important in the fabrication of periodically poled
crystals by SPM poling method for applicability in electro-optical devices.
Figure 5.12. The decay process of domain with length of (a) 14.7 μm and (b) 9.6 μm as a
function of time. L and W are the length (µm) and width (µm) of domain in each time.

Electromechanical and Non-linear Optical Properties of Glycine Crystals
93
In our experiment, the domain width is not constant (wedge-like). Thus, we used the
average domain width by dividing the measured reversed domain area by the domain length.
5.4. Molecular Modelling
Computational modelling of both glycine polymorphic phases (β and γ) were
performed using a combined method with local density approximation (LDA) first principle
calculations of crystal structures on Linux cluster and with molecular semi-empirical PM3
calculations by HyperChem 8.0 [207]. The structural models obtained and the physical data
(dipole moment, polarizations, dielectric permittivity, electrostriction and piezoelectric
coefficients, etc.) were computed and compared with experimental data obtained by PFM.
Figure 5.13 shows schematics of the individual glycine molecules dipole moment.
Each glycine zwitterion contains a dipole moment directed from oxygen to nitrogen atom.
Figure 5.13. The dipole moment orientation of an individual glycine molecule.
The network of hydrogen bonds plays an essential role in organization of the crystal
structure of glycine. Figure 5.14 displays both molecular crystallographic structures for β-
and γ-glycine in two projections with marked hydrogen bonds network and resulting dipole
moment. According to the modeling results, γ-glycine crystals consist of molecules in the
form of zwitterions linked through NH…O hydrogen bonds. Molecules form triple helices
around the 31 screw-axis passing through the c axis; these helices are linked together by the
lateral hydrogen bonds, forming a three-dimensional noncentrosymmetric network of
hydrogen bonds. Therefore, for γ-glycine, crystal structure does not consist of layers, but is a
three-dimensional hydrogen-bonded network with total dipole moment and polarization
strongly oriented along c (OZ) axis. Each nitrogen atom is surrounded by oxygen atoms, and
N
O
O
C

Chapter 5
94
each oxygen atom by nitrogen atoms, so the effect of such bonding will be enhanced by
electrostatic forces between oppositely charged groups. The calculated value of polarization
by unrestricted Hartree-Fock (UHF) PM3 method for modelled molecular cluster from 27
individual glycine molecules shows that polarization P ≈ Pz = 0.17 C/m2 for this γ-glycine
polymorphic crystal structure. The calculated volume of γ-glycine lattice unit cell is V =
219.8 A3.
The molecular arrangement in the crystal lattice of β-glycine is quite different with γ-
form. In the β-polymorph, we have layered structure. Zwitterionic glycine monomers are
linked in single polar layers in XOZ plane and hydrogen bonds link the single polar layers
along the monoclinic b-axis with alternating chain orientations and create a non-
centrosymmetric structure (P21 space group, Z = 2) [208]. A schematic diagram of the β-
glycine crystal structure is shown in Fig. 5.14. In this case, the dipole moment has several
components, which are oriented at various angles to the main axis at each layer with
oppositely directed and compensated components in ac (XOZ) plane. But the components
along OY axis are summed up and the total polarization is directed along OY axis. The
calculated values of the polarization components are smaller than for γ-glycine and have on
average P ≈ Py ≈ 0.1...0.12 C/m2.
The specific features of all glycine phases are related to their hydrogen-bonded
network system. There are two main types of H-bonds in β-glycine: within layer: H-bond
with length L ≈ 1.179 Å and inter-layer: H-bond with length L ≈ 2.75 Å. As derived from IR-
experiments [209], hydrogen bonds within the layer are stronger than the inter-layer ones in
β-glycine. In addition, the strongest hydrogen bond in the β-form being weaker than the
weakest hydrogen bond in the γ-form. Such structural features lead to an easier mobility of
the glycine molecule in β-glycine crystal under external electric field as compared to γ-
glycine where each individual molecule is fixed in a more stable position. The calculated
volume of the β-glycine lattice unit cell is V = 158.9 A3 which is smaller as compared to γ-
glycine.
The estimation of the coercive electric field for γ-glycine yields a higher value Ec ≈
30...80 MV/cm along c (OZ) axis, and it is hard (almost impossible) to switch polarization in
this case. For β-glycine, we obtain smaller value of the coercive electric field Ec ≈ 10…15
MV/cm for the Py polarization component (Fig. 5.15), which is much smaller and switching
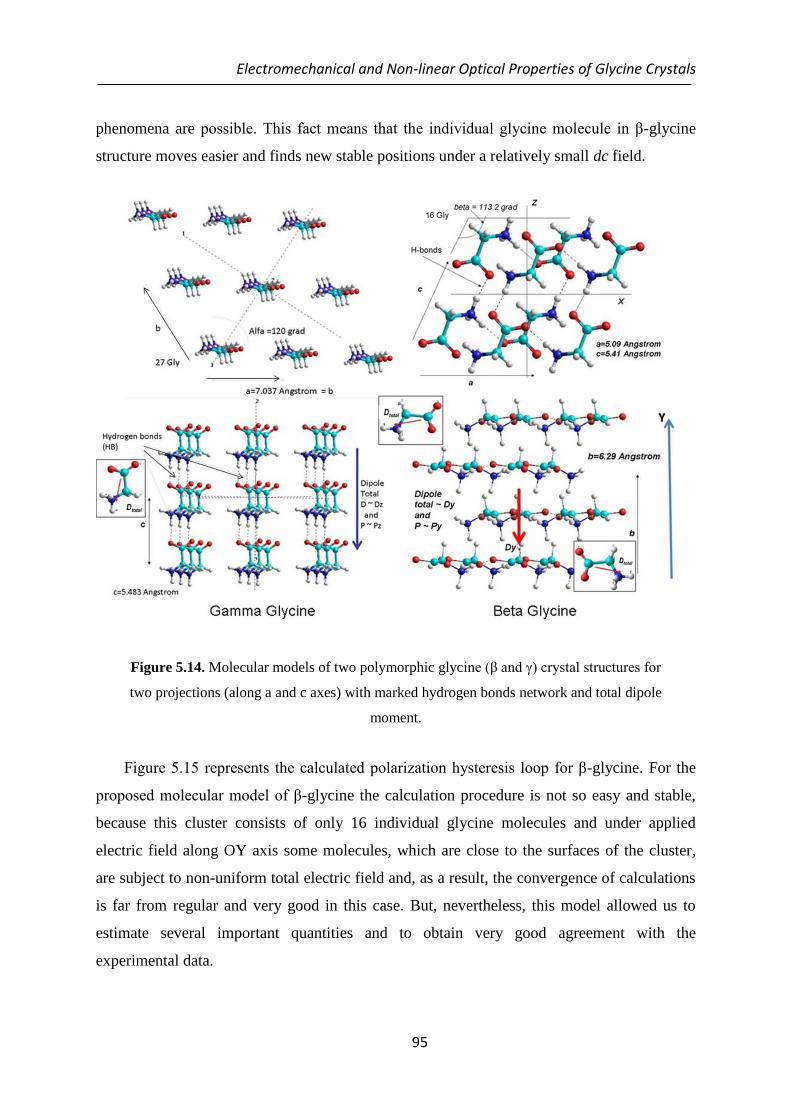
Electromechanical and Non-linear Optical Properties of Glycine Crystals
95
phenomena are possible. This fact means that the individual glycine molecule in β-glycine
structure moves easier and finds new stable positions under a relatively small dc field.
Figure 5.14. Molecular models of two polymorphic glycine (β and γ) crystal structures for
two projections (along a and c axes) with marked hydrogen bonds network and total dipole
moment.
Figure 5.15 represents the calculated polarization hysteresis loop for β-glycine. For the
proposed molecular model of β-glycine the calculation procedure is not so easy and stable,
because this cluster consists of only 16 individual glycine molecules and under applied
electric field along OY axis some molecules, which are close to the surfaces of the cluster,
are subject to non-uniform total electric field and, as a result, the convergence of calculations
is far from regular and very good in this case. But, nevertheless, this model allowed us to
estimate several important quantities and to obtain very good agreement with the
experimental data.

Chapter 5
96
Figure 5.15. Calculated hysteresis loop for molecular model of β-glycine crystal structure
with average coercive field Ec ~ 0.003 a.u. ~ 1.5 GV/m. SP and Opt are single point
calculations (at the fixed position of each atom of the modelled molecules) and
optimization of molecular geometry under a varying electric field, respectively.
First, the polarizability (α = ∆D ∆E ⁄ ) was found to be in the range α ~ 44…56 Å3 ~
(4.8…6.1)*10-39 Cm2V
-1 for our molecular cluster from 16 individual glycine molecules.
These data are close to the reported ones [210]. Second, we determined the electrostriction
coefficient in the OY direction Qy (Q = s (∆P)2⁄ , where s = ∆V V⁄ ), which equals (in
absolute value) to Qy ~ 3.87 m4C
-2 and in perpendicular direction Qyx ~ 1.0 m
4C
-2. These
values are close to those of other organic crystals with similar structure [211]. Using
Clausius-Mosotti relation ( = (1 + 2k) (1 − k)⁄ , where k = V⁄ ) [212] we estimated the
permittivity = 5, which is also close to experimental data ( = 6 [213]).
Then, using a well-known linearized electrostriction relation d = 20QP [211] we
roughly estimated apparent piezoelectric coefficient in OY direction, which could correspond
to the longitudinal piezocoefficient d33 in this case. The obtained values of piezoelectric
coefficients are: d33 ~ -8.2 pmV-1
and d31 ~ -8.5 pmV-1
for β-glycine. The measured shear
piezocoefficient for β-glycine is d15 ~ 10 pmV-1
which is close to our calculations in absolute
magnitude.
Using these data we also estimated the same quantities for γ-glycine. Assuming for
simplicity that along Z axis Qz = ~ (0.5 – 1.0) m4C
-2 we obtain d33 ~ (5.8 – 11.6) pmV
-1
(pCN-1
). This result is in line with the experimental value d ~ 7.4 pCN-1
from Ref. [213]. As a
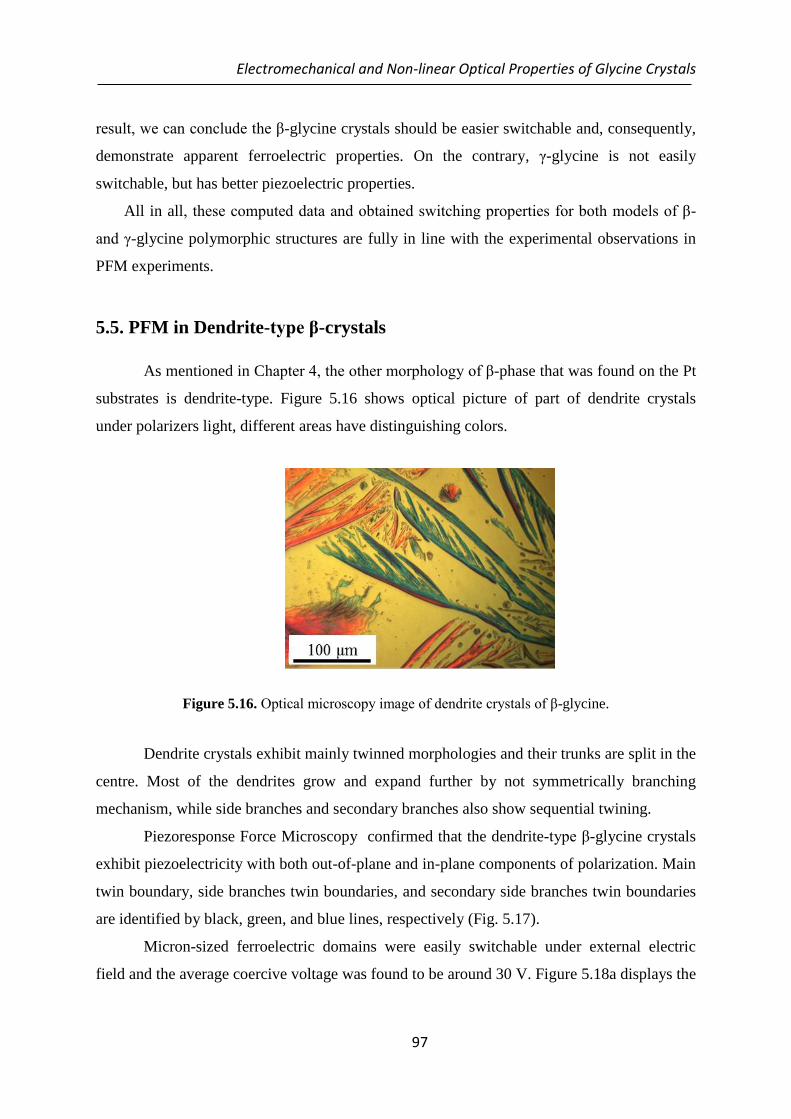
Electromechanical and Non-linear Optical Properties of Glycine Crystals
97
result, we can conclude the β-glycine crystals should be easier switchable and, consequently,
demonstrate apparent ferroelectric properties. On the contrary, γ-glycine is not easily
switchable, but has better piezoelectric properties.
All in all, these computed data and obtained switching properties for both models of β-
and γ-glycine polymorphic structures are fully in line with the experimental observations in
PFM experiments.
5.5. PFM in Dendrite-type β-crystals
As mentioned in Chapter 4, the other morphology of β-phase that was found on the Pt
substrates is dendrite-type. Figure 5.16 shows optical picture of part of dendrite crystals
under polarizers light, different areas have distinguishing colors.
Figure 5.16. Optical microscopy image of dendrite crystals of β-glycine.
Dendrite crystals exhibit mainly twinned morphologies and their trunks are split in the
centre. Most of the dendrites grow and expand further by not symmetrically branching
mechanism, while side branches and secondary branches also show sequential twining.
Piezoresponse Force Microscopy confirmed that the dendrite-type β-glycine crystals
exhibit piezoelectricity with both out-of-plane and in-plane components of polarization. Main
twin boundary, side branches twin boundaries, and secondary side branches twin boundaries
are identified by black, green, and blue lines, respectively (Fig. 5.17).
Micron-sized ferroelectric domains were easily switchable under external electric
field and the average coercive voltage was found to be around 30 V. Figure 5.18a displays the

Chapter 5
98
in-plane piezoresponse image after poling in bright and dark areas. Piezoresponse hysteresis
loops also were obtained for the maximum dc voltage of 50V (Fig. 5.18). Hysteresis loop is a
clear signature of polarization switching on the local scale.
Figure 5.17. (a)-(c) show topography, the vertical and lateral PFM images of as grown
dendritic shape β-glycine.
Figure 5.18. (a) Switching of ferroelectric domains with the application of dc voltage. (b)
Hysteresis loop of the amplitude piezoresponse.
5.6. PFM in Thin Films of β-crystals
The significant ferroelectricity of the β-glycine crystal motivated us to process a thin
film of glycine for easier miniaturization and integration, which we succeeded using the
simple and inexpensive spin-coating approach. It is known that ferroelectric thin films may
exhibit different properties from those of their bulk crystals [214] because surface/interface
effect and dimensional effect commonly play an important role in polarization in thin
ferroelectric films.
(b) (c) (a)
-30V
-30V (a) (b)

Electromechanical and Non-linear Optical Properties of Glycine Crystals
99
Figure 5.19 represents topography (a), PFM-lateral and vertical (b,c) measurements of
the self-assembled glycine structures in the area between partially connected grains.
According to the topography, glycine nanocrystals array in some parts of the film were
uniform and closely packed and some parts were dispersed monolayer (Fig. 5.19a). Capillary
forces between the particles of the similar size are more attractive relative to non-identical
particles. Therefore, the areas of particles with uniform size are more closely packed
arrangement relative to area with non-homogeneous particles.
PFM lateral image (Fig. 5.19b) shows a contrast only for a grain which polarization
direction is perpendicular to the longest axis of the cantilever. In two other grains the contrast
is weak because their polarization direction is parallel the cantilever axis and the contrast may
arise only through the buckling effect. White arrows indicate the polarization orientation of
each crystalline area (Fig. 5.19b). Vertical image (Fig. 5.19c) shows negligible contrast, in
agreement with Raman measurements (ferroelectric axis b is oriented parallel to the
substrate). The shear piezoelectric coefficient of the glycine film was derived between 12 and
17 pm/V which is twice as that for a β-glycine single crystal.
Figure 5.19. Representative images of topography (a), lateral (b) and vertical-PFM (c)
measurements of the nanocrystalline glycine arrays on Pt substrate.
Higher magnification PFM of the particles in a non-closed packed area shows that
these nanoislands have near spherical shape. While analyzing the domain structure of each
microcrystal, it appears that they can be in the monodomain state or can be divided into two
domains (Fig. 5.20a). The nanocrystals were easily switchable and the average coercive
voltage was found to be around 20 V (Fig. 5.20b).
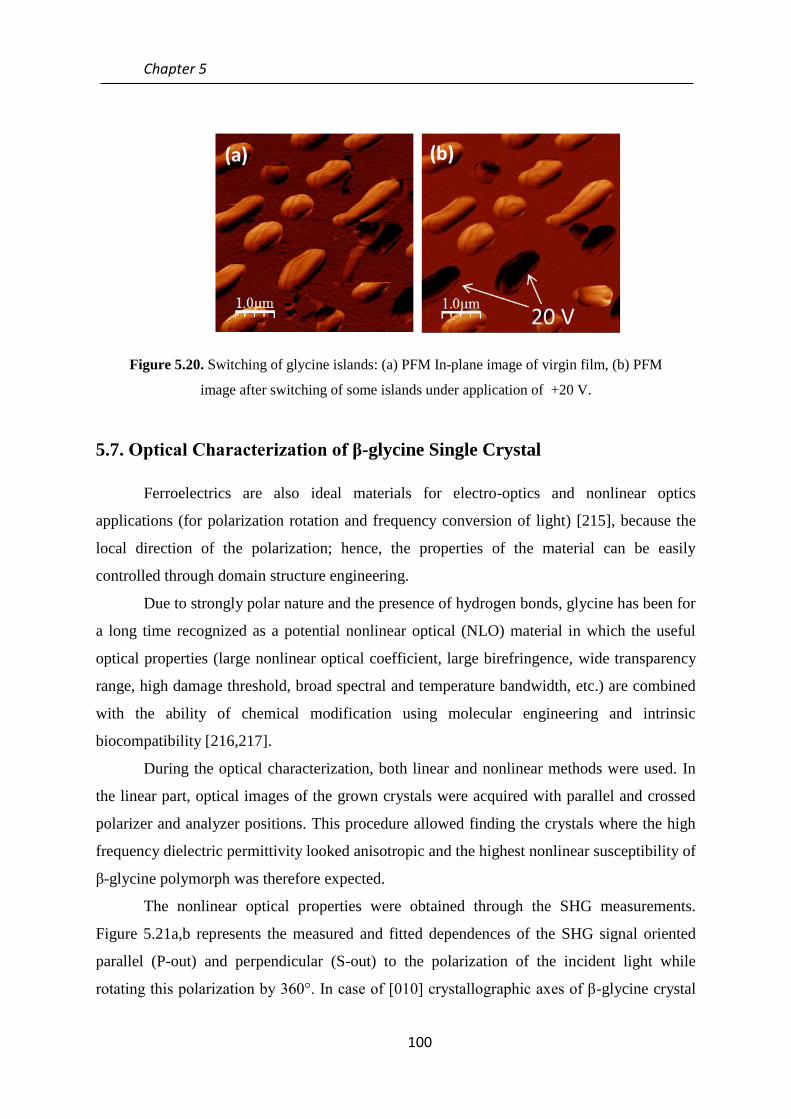
Chapter 5
100
Figure 5.20. Switching of glycine islands: (a) PFM In-plane image of virgin film, (b) PFM
image after switching of some islands under application of +20 V.
5.7. Optical Characterization of β-glycine Single Crystal
Ferroelectrics are also ideal materials for electro-optics and nonlinear optics
applications (for polarization rotation and frequency conversion of light) [215], because the
local direction of the polarization; hence, the properties of the material can be easily
controlled through domain structure engineering.
Due to strongly polar nature and the presence of hydrogen bonds, glycine has been for
a long time recognized as a potential nonlinear optical (NLO) material in which the useful
optical properties (large nonlinear optical coefficient, large birefringence, wide transparency
range, high damage threshold, broad spectral and temperature bandwidth, etc.) are combined
with the ability of chemical modification using molecular engineering and intrinsic
biocompatibility [216,217].
During the optical characterization, both linear and nonlinear methods were used. In
the linear part, optical images of the grown crystals were acquired with parallel and crossed
polarizer and analyzer positions. This procedure allowed finding the crystals where the high
frequency dielectric permittivity looked anisotropic and the highest nonlinear susceptibility of
β-glycine polymorph was therefore expected.
The nonlinear optical properties were obtained through the SHG measurements.
Figure 5.21a,b represents the measured and fitted dependences of the SHG signal oriented
parallel (P-out) and perpendicular (S-out) to the polarization of the incident light while
rotating this polarization by 360°. In case of [010] crystallographic axes of β-glycine crystal

Electromechanical and Non-linear Optical Properties of Glycine Crystals
101
parallel to the incident light polarization direction, two different behaviors for P- and S-
output polarization dependences were observed.
For P-output polarization, we observed two strong 180° peaks (Fig. 5.21a). We
assume that these peaks are consistent with the strong dipole contribution of the −COO−,
−NH3+ molecule groups aligned along the [010] crystallographic axes (Fig. 5.12c). Therefore,
we deduce that the inherent polarization of β-glycine lies along [010] crystallographic axes.
For the S-output polarization, we found four strong 180° peaks (Fig. 5.21b). We
assume that these peaks contribute to the SHG signal owing to the zwitterions dipole
precessions along the [100] crystallographic axes (Fig. 5.21d).
These results are in agreement with the Hyperchem 8 [207] simulations of the β-
glycine molecules in the monoclinic crystal structure. The dipole moment of each molecule
as well as the dipole moment of total crystal clusters was calculated using the unrestricted
Hartree-Fock (UHF) PM3 method similarly to refs [218,219]. The polarization direction is
determined from the −COO− group to the −NH3
+ group in the zwitterionic form of each
individual glycine molecule in polar layers which is nearly normal to the Pt substrate surface
(Fig. 5.21c). The layers are linked together via hydrogen bonds in the [010] direction while
forming a monoclinic structure. The total dipole moment is found to be parallel to the native
fast-growth crystallographic direction (b-axis).

Chapter 5
102
Figure 5.21. Measured and fitted light polarization dependences of the SHG signal from β-
glycine for (a) P and (b) S output polarizations for crystallographic face (001). Molecular
simulation of the (c) dipole moment of each glycine molecule as well as molecular cluster
cut off from β-glycine crystal consisting of 4 layers and 16 molecules (160 atoms) with
corresponding hydrogen bonds and (d) dipole moment of the −NH3+, −COO
− groups of
individual (marked by green color) glycine molecule in each layer.
In order to describe the obtained polarization dependences of )(2 I , equation 5.3 is
rewritten for the point group C2 and crystal face (001). This gives six independent tensor
components: 𝜒1 = 𝜒123 = 𝜒132; 𝜒2 = 𝜒113 = 𝜒131 = 𝜒311; 𝜒3 = 𝜒322 = 𝜒223 = 𝜒232;
𝜒4 = 𝜒333; 𝜒5 = 𝜒312 = 𝜒321; 𝜒6 = 𝜒213 = 𝜒231 and SHG intensity as a function of
polarization angle can be expressed as
4sin2sin4cos2cos)( 42420
2 SSCCCI , (5.3)
(c) (
d
(a) (b)

Electromechanical and Non-linear Optical Properties of Glycine Crystals
103
where iC and iS denote the corresponding fitting parameters in the SHG polar dependences,
which are the linear combinations of nonlinear susceptibility)2(
ijk and Fresnel factors.
The results of the simultaneous fitting of two curves (P-out and S-out SHG
polarization) are in a good agreement with the nonlinear experimental data (Fig. 5.21a,b,
solid lines), showing the amplitude of neighbor molecule oscillation, the same number of
petals and their orientation. These facts confirm our conclusion about the dipole contribution
of the −COO−, −NH3
+ molecule groups aligned along the [010] crystallographic axes and the
zwitterions dipole precessions along the [100] crystallographic axes. This gives the following
values of nonlinear susceptibility tensor components: 𝜒1 = 0.36 pm/V; 𝜒2 = 0.73 pm/V;
𝜒3 = 0.16 pm/V; 𝜒4 = 0.28 pm/V; 𝜒5 = 0.89 pm/V; 𝜒6 = 7.5 ∗ 10−4 pm/V. The absolute
values were obtained using a z-cut (001) quartz with its nonlinear susceptibility tensor
components equal to 𝜒1 = 0.8 pm/V, 𝜒2 = 0.017 pm/V [220]. However, the experimental
dependences possessed a noticeable background at their minimum (theoretical curves should
vanish to zero at the same points). Such deviation may arise due to several reasons, for
example, it can be a result of the presence of 90o domains [221,222] or originate from the
light scattering on optical inhomogeneities.
Thus, β-glycine crystals can be used to transform infrared and visible light into UV
and near-UV radiation. Not only frequency conversion [223], but also amplitude and phase
modulation can be used for optical communications and interconnections, optical switching
data storage, and electro-optic applications [224]. The intrinsic biocompatibility expected in
glycine could be helpful for bioimaging and photothermal therapy [225], where a light
conversion to the UV is required for the generation of short lived toxic oxygen radicals. The
possibility of obtaining ferroelectric patterns with any given configuration at moderate tip
voltages (well below 100 V) in glycine crystal can be used to create regular microdomain
patterns (by the vector lithography method) for providing tunable radiation [226,227]. Further
work is needed to explore the potential of glycine for these applications.
(The SHG measurements have been performed in collaboration with Prof. Elena
Mishina group from Moscow State Institute of Radioengineering, Electronics, and
Automation, Moscow, Russia.)

Chapter 5
104
5.8. Summary
Our findings suggest that γ-glycine is a piezoelectric crystal with a unique polar axis
which cannot be switched by electric field (non ferroelectric). Contrarily, the presence of
domain structure and switchability with the local application of an external electric field
indicates the ferroelectric nature of β-glycine.
Our experiments have shown that micro-crystals of β-glycine are uniaxial
ferroelectrics with polarization vector parallel to monoclinic axis b. The orientation of the
polar axis of the crystal has been confirmed by X-ray diffraction analysis and Raman
microscopy. The domain structure of β-glycine consists of charged and neutral 180o domain
walls. The domain shape is dictated by the polarization screening and mediated by growth
defects such as atomic steps and pits. Dynamics of these in-plane domains is studied as a
function of applied voltage and pulse duration. Thermodynamic theory is applied to explain
the domain propagation induced by the PFM tip. Our findings suggest that the properties of
β-glycine are controlled by the charged domain walls which in turn can be manipulated by
the tip-enhanced electric field.
The conducted nonlinear optical measurements were consistent with the P21
symmetry of β-glycine with spontaneous polarization parallel to the monoclinic b-axis and
zwitterions dipole precessions along the a-axis. The nonlinear optical susceptibility of β-
glycine is found to about 50% greater than that of well-known nonlinear material z-cut (001)
quartz. All results show that the glycine ferroelectric crystals have potential applications in
ferroelectric and nonlinear optical devices. The reported results are explained by the idealized
molecular models.
Piezoresponse Force Microscopy measurements confirmed that the films of
nanocrystalline β-glycine exhibit superior piezoelectricity relative to bulk β-glycine crystals
and lower coercive field required reversing the polarization.

Chapter 6
Conclusions and Future Work

Chapter 6
106
Conclusions and Future work
107
6.1. Conclusions
The ability to grow stable glycine crystals has allowed us to study in detail the
electromechanical and nonlinear optical properties in this technologically important material.
We show that the smallest amino acid glycine possesses notable piezoelectric and
ferroelectric properties. This underlines the significance of biopiezoelectric and
bioferroelectric phenomena in living organisms (e.g., protein formation). Furthermore, this
study could bring a variety of novel applications to glycine crystals as a biocompatible
ferroelectric, which could be very useful for many new biomedical and nanoelectronic
applications.
On the basis of the results the following main conclusions were made:
Crystalline glycine can exist in three polymorphic forms (α, β, and γ) with different
physical properties and it is possible to create selectively one of the polymorphs by
controlling the solution type and crystallization conditions. α-glycine has a
centrosymmetric structure (space group P21/n) and consequently cannot have
piezoelectric property while the γ- and β-glycine possess non-centrosymmetric
structure. Therefore, they were studied in more details in this thesis.
β-glycine was found as a unstable crystal against ambient conditions, therefore, a new
method of stabilization of the β-phase is demonstrated based on evaporation of
aqueous solution on crystalline Pt(111) substrates. We found that the interplay
between the concentration of the glycine solution and crystallization effect of the
surface results in the preferential growth of glycine β-phase with well-defined shape
and morphology. These two parameters are supposed to be the major factors dictating
the evaporation rate and growth kinetics. As a result, β-glycine needle-shaped crystals
could be grown under ambient conditions. X-ray diffraction analysis and Raman
spectroscopy confirmed the preferential growth and stability of β-phase.
The growth of stable β-glycine crystals has allowed us to study in details its domain
structure geometry, switchability, and dynamics of the ferroelectric domain
propagation by Piezoresponse Force Microscopy (PFM). The obtained PFM images
on the non-polar crystal surface have shown as-grown structure consisted of domains
Chapter 6
108
separated by neutral and charged domain walls (either head-to-head or tail-to-tail).
Detailed study revealed topographic features at the as-grown charged domain
boundaries; in contrast, the switched domains were not associated with surface
defects. Domain polarization could be switched by applying a bias to non-polar cuts
via a conducting tip of atomic force microscope (AFM). Thermodynamic theory is
applied to explain the domain propagation under switching. Our findings suggest that
the properties of -glycine are controlled by the charged domain walls which in turn
can be manipulated by an external bias.
Based on the molecular modelling, we found that the network of hydrogen bonds
plays an essential role in arrangement of glycine molecules in the crystal structures of
glycine and dictates the difference in the properties of polymorphs. Computed data
and obtained switching properties for both models of γ- and β-glycine polymorphic
structures were compatible with the experimental observations in PFM experiments.
The second harmonic generation (SHG) measurements confirmed that the 2-fold
symmetry is preserved in as-grown β-crystals, thus reflecting the expected P21
symmetry of the β-phase. Spontaneous polarization direction is found to be parallel to
the monoclinic [010] axis and directed along the crystal length. These data are
confirmed by computational molecular modeling. Optical measurements revealed also
relatively high values of the nonlinear optical susceptibility (50% greater than in the
z-cut quartz).
The thin films of glycine nanoscale crystals were produced by using the simple spin-
coating approach. Ensemble of glycine nanocrystals was formed on the Pt substrate as
a result of self-organized growth during spin-coating. The directions of nanocrystal
axes on the substrate, piezoelectric and ferroelectric properties were studied.
All the results show that the β-glycine is a promising functional molecular crystal as a
candidate for piezoelectric, ferroelectric, and nonlinear optical applications.

Conclusions and Future work
109
6.2. Future Work
Obviously, further experiments and simulations are necessary for the full understanding of
the role of glycine bioferroelectricity and biopiezoelectricity in the human body which is
needed for future interdisciplinary research. Additionally, the development of bioorganic
artificial materials with enhanced piezoelectric and ferroelectric properties is of high
importance for future biologically compatible sensors, actuators, transducers, ferroelectric-
based memories, frequency conversion devices and other electronic components. However,
there are still important issues that need to be addressed to move towards device applications.
Accordingly, the future work should be focused on the following issues:
High resolution PFM study of the crystals in the liquid environment should be
undertaken to reveal the nature of the structural defects and domain states.
The glycine film properties and homogeneity can be improved using different
techniques for the preparation and deposition such as spin coating at a high
temperature or annealing the films after preparation. Higher process temperatures can
give more uniform films owing to higher solvent evaporation rate. The effect of
spinning speed and concentration of glycine solution on the film properties should be
investigated as well.
Furthermore, crystals of different amino acids (e.g. DL-alanine) should be grown and
the entire set of the measurements should be done. This would expand the class of
bioorganic ferroelectrics and reveal their role in the functioning of complex biological
systems.
110
References
1. S. Horiuchi, R. Kumai and Y. Tokura, “Hydrogen-bonding molecular chains for high-temperature
ferroelectricity”, Adv. Mater. 23, 2098 (2011).
2. B. Coste, B. Xiao, J. S. Santos, R. Syeda, J. Grandl, K. S. Spencer, S. E. Kim, M. Schmidt, J.
Mathur, A. E. Dubin, M. Montal, and A. Patapoutian, “Piezo proteins are pore-forming subunits of
mechanically activated channels”, Nature 483(7388), 176 (2012).
3. S. E. Kim, B. Coste, A. Chadha, B. Cook, and A. Patapoutian, “The role of Drosophila Piezo in
mechanical nociception”, Nature 483, 209 (2012).
4. V. S. Bystrov, I. Bdikin, A. Heredia, R. C. Pullar, E. Mishina, A. Sigov and A. L. Kholkin,
“Piezoelectric nanomaterials for biomedical applications: piezoelectricity and ferroelectricity in
biomaterials: from proteins to self-assembled peptide nanotubes”, In “piezoelectric nanomaterials for
biomedical applications”, Eds. G. Ciofani and A. Menciassi, Berlin Heidelberg, Springer-Verlag. pp.
187-212 (2012).
5. A. A. Marino and R. O. Becker, “Piezoelectric effect and growth control in bone”, Nature 228, 473
(1970).
6. I. Tasaki, “Evidence for phase transition in nerve fibres, cells and synapses”, Ferroelectrics 220,
305 (1999).
7. J. Y. Li, Y. M. Liu, Y. H. Zhang, H. L. Cai and R. G. Xiong, “Molecular ferroelectrics: where
electronics meet biology”, Phys. Chem. Chem. Phys. 15, 20786 (2013).
8. T. Hidaka, T. Maruyama, M. Saitoh, N. Mikoshiba, M. Shimizu, T. Shiosaki, L. A. Wills,
R. Hiskes, S.A. DiCarolis and J. Amano, “Formation and observation of 50 nm polarized domains in
PbZr1−x Tix O3 thin film using scanning probe microscope”, Appl. Phys. Lett. 68, 2358 (1996).
9. A. Gruverman, D. Wu, B. J. Rodriguez, S. V. Kalinin and S. Habelitz, “High-resolution imaging of
proteins in human teeth by scanning probe microscopy”, Biochem. Biophys. Res. Commun. 352, 142
(2007).
10. S. V. Kalinin, S. Jesse, B. J. Rodriguez, K. Seal, A. P. Baddorf, T. Zhao, Y. H. Chu, R. Ramesh,
E. A. Eliseev, A. N. Morozovska, B. Mirman, and E. Karapetian, “Recent advances in
electromechanical imaging on the nanometer scale: polarization dynamics in ferroelectrics
biopolymers, and liquid imaging”, Jpn. J. Appl. Phys. 46, 5674 (2007).
11. S. V. Kalinin, B. J. Rodriguez, J. Shin, S. Jesse, V. Grichko, T. Thundat, A. P. Baddorf, and A.
Gruverman, “Bioelectromechanical imaging by scanning probe microscopy: Galvani's experiment at
the nanoscale”, Ultramicroscopy 106, 334 (2006).
12. S. V. Kalinin, B. J. Rodriguez, S. Jesse, E. Karapetian, B. Mirman, E. A. Eliseev and A. N.
Morozovska, “Nanoscale Electromechanics of Ferroelectric and Biological Systems: A New
Dimension in Scanning Probe Microscopy”, Annu. Rev. Mater. Res. 37, 189 (2007).
111
13 V. V. Lemanov, “Piezoelectric and pyroelectric properties of protein amino acids as basic
materials of Soft State Physics”, Ferroelectrics 238, 211 (2000).
14. V.V. Lemanov, S. N. Popov and G. A. Pankova, “Protein Amino Acid Crystals: Structure,
symmetry, physical properties”, Ferroelectrics 285, 207 (2003).
15. A. Heredia, V, Meunier, I. K. Bdikin, J, Gracio, N, balke, S, Jesse, A, Tselev, P. K. Agarwal, B.
G. Sumpter, S. V. Kalinin and A. L. Kholkin, “Nanoscale ferroelectricity in crystalline γ-glycine”,
Adv. Funct. Mater. 22, 2996 (2012).
16. A. L. Lehninger, “Biochemistry: The molecular basis of cell structure and function”, Worth
Publishers, Inc., New York (1972).
17. G. Albrecht and R. B. Corey, “The crystal structure of glycine”, J. Am. Chem. Soc. 61(5), 1087
(1939).
18. Y. Iitaka, “The crystal structure of γ-glycine”, Acta Cryst. 14, 1 (1961).
19. Y. Iitaka, “The crystal structure of β-glycine”, Acta Cryst. 13, 35 (1960).
20. S. A. Azhagan and S. Ganesan, “Structural, mechanical, optical and second harmonic generation
(SHG) studies of gamma glycine single crystal”, S. Int. J. Phys. Sci. 8, 6 (2013).
21. D. Isakov, E. M. Gomes, I. Bdikin, B. Almeida, M. Belsley, M. Costa, V. Rodrigues and A.
Heredia, “Production of Polar β-Glycine Nanofibers with Enhanced Nonlinear Optical and
Piezoelectric Properties”, Cryst. Growth Des. 11, 4288 (2011).
22. A. L. Kholkin, N. A. Pertsev and A. V. Goltsev, “Piezoelectricity and crystal symmetry”, In
“piezoelectric and acoustic materials for transducer applications”, Eds. A. Safari, K. Akdogan,
Springer, pp. 17-38 (2008).
23. J. F. Nye, “Physical properties of crystals: their representation by tensors and matrices”, Oxford
University Press, New York, (1957).
24. L. L. Hench and J. K. West, “Principles of electronic ceramics”, Wiley, New York (1990).
25. N. Setter and E. L. Colla, “Ferroelectric ceramics”, Birkhauser Verlag, Basel (1993).
26. R. W. Whatmore, S. B. Stringfellow and N. M. Shorrocks, “Ferroelectric materials for uncooled
thermal imaging”, Proc. SPIE, 2020, 39 (1993).
27. M. E. Lines and A. M. Glass, “Principles and Applications of Ferroelectrics and Related
Materials”, Clarendon press, Oxford (1977).
28. K. M. Rabe, C. H. Ahn and J. M. Triscone, “Physics of Ferroelectrics: A Modern Perspective”,
Springer-Verlag, Berlin Heidelberg (2007).
29. D. Damjanovic, “Hysteresis in piezoelectric and ferroelectric materials”, In “the science of
hysteresis”, Eds. I. Mayergoyz and G. Bertotti, Elsevier, pp. 337-465 (2005).
30. J. F. Scott, “Applications of modern ferroelectrics”, Science 315, 954 (2007).

112
31. V. R. Palkar, S. C. Purandare and R. Pinto, “Ferroelectric thin films of PbTiO3 on silicon”, J.
Phys. D, 32, 1 (1999).
32. M. Veithen, X. Gonze and P. Ghosez, “First-principles study of the electro-optic effect in
ferroelectric oxides”, Phys. Rev. Lett. 93, 187401 (2004).
33. V. Gopalan, M. J. Kawas, T. E. Schlesinger, M. C. Gupta, and D. D. Stancil, “Integrated quasi-
phase-matched second-harmonic generator and electrooptic scanner on LiTaO3 single crystals”, IEEE
Photonics Technol. Lett. 8, 1704 (1996).
34. V. V. Lemanov and Yu. V. Llisavsky, “Piezoelectricity and acoustoelectronics”, Ferroelectrics
42, 77 (1982).
35. J. F. Scott, “Ferroelectric memories”, Springer-Verlag, Berlin (2000).
36. R. E. Jones, Jr., P. D. Maniar, R. Moazzami, P. Zurcher, J. Z. Witowski, Y. T. Lii, P. Chu, and S.
J. Gillespie, “Ferroelectric non-volatile memories for low-voltage, low-power applications”, Thin
Solid Films 270, 584 (1995).
37. J. Valasek, “Piezo-electric and allied phenomena in Rochelle salt”, Phys. Rev. 17, 475 (1921).
38. H. D. Megaw, “Crystal structure of barium titanate”, Nature 155, 484 (1945).
39. B. Jaffe, R. S. Roth and S. Marzullo, “Piezoelectric properties of lead zirconate‐lead titanate solid‐solution ceramics”, J. Appl. Phys. 25, 809 (1954).
40. S. Hoshino, T. Mitsui, F. Jona and R. Pepinsky, “Dielectric and thermal study of tri-glycine
sulfate and tri-glycine fluoberyllate”, Phys. Rev. 107, 1255 (1957)
41. S. Horiuchi, Y. Tokunaga, G. Giovannetti, S. Picozzi, H. Itoh, R. Shimano, R. Kumai and Y.
Tokura, “Above-room-temperature ferroelectricity in a single-component molecular crystal”, Nature
463, 789 (2010).
42. D. W. Fu, W. Zhang, H. L.Cai, J. Z. Ge, Y. Zhang and R. G. Xiong, “Diisopropylammonium
chloride: a ferroelectric organic salt with a high phase transition temperature and practical utilization
level of spontaneous polarization”, Adv. Mater. 23, 5658 (2011).
43. D. W. Fu, H. L. Cai, Y. Liu, Q. Ye, W. Zhang, Y. Zhang, X. Y. Chen, G. Giovannetti, M. Capone,
J. Li and R. G. Xiong, “Diisopropylammonium bromide is a high-temperature molecular ferroelectric
crystal”, Science, 339, 425 (2013).
44. A. K. Tagantsev, L. E. Cross and J. Fousek, “Domains in ferroic crystals and thin films”, Springer,
New York (2010).
45. X. Wu and D. Vanderbilt, “Theory of hypothetical ferroelectric superlattices incorporating head-
to-head and tail-to-tail 180° domain walls”, Phys. Rev. B 73, 020103 (2006).
46. E. G. Fesenko, V. G. Gavrilyachenko, M. A. Martinenko, A. F. Semenchov and I. P. Lapin,
“Domain structure peculiarities of lead-titanate crystals”, Ferroelectrics 6, 61 (1973).
47. C. L. Jea, S. B. Mi, K. Urban, I. Vrejoiu, M. Alexe, and D. Hesse, “Atomic-scale study of electric
dipoles near charged and uncharged domain walls in ferroelectric films”, Nature Materials 7, 57
(2008).
113
48. F. Kagawa, S. Horiuchi, N. Minami, S. Ishibashi, K. Kobayashi, R. Kumai, Y. Murakami and Y.
Tokura, “Polarization switching ability dependent on multidomain topology in a uniaxial organic
ferroelectric”, Nano Letters 14 (1), 239 (2014).
49. M. Y. Gureev, A. K. Tagantsev and N. Setter, “Head-to-head and tail-to-tail 180∘ domain walls in
an isolated ferroelectric”, Phys. Rev. B 83, 184104 (2011).
50. E. Fukada and I. Yasuda, “On the piezoelectric effect of bone”, J. Phys. Soc. Jpn. 12, 1158 (1957).
51. E. Fukada and I. Yasuda, “Piezoelectric effects in collagen”, J. Appl. Phys. 3, 117 (1964).
52. H. Athenstaedt, “Pyroelectric and piezoelectric behaviour of human dental hard tissues”, Arch.
Oral Biol. 16, 495 (1971).
53. R. M. Zilberstein, “Piezoelectric activity in invertebrate exoskeletons”, Nature, 235, 174. (1972).
54. S. B. Lang, A. A. Marino, G. Berkovic, M. Fowler and K. D. Abreo, “Piezoelectricity in the
human pineal gland”, Bioelectrochem. Bioenerg. 41, 191 (1996).
55. S. B. Lang, “Piezoelectricity, pyroelectricity and ferroelectricity in biomaterials: Speculation on
their biological significance”, IEEE Trans. Dielectr. Electr. Insul. 7, 466 (2000).
56. I. Ermolina, A. Strinkovski, A. Lewis and Y. Feldman, “Observation of liquid-crystal-like
ferroelectric behavior in a biological membrane”, J. Phys. Chem. B, 105, 2673 (2001).
57. A. C. Jayasuriya, J. I. Scheinbeim, V. Lubkin, G. Bennett and P. Kramer, “Piezoelectric and
mechanical properties in bovine cornea”, J. Biomed Mater. Res. A 66, 260 (2003).
58. S. B. Lang, “Pyroelectric effect in bone and tendon”, Nature 212, 704 (1966).
59. S. B. Lang, “Pyroelectricity: Occurrence in biological materials and possible physiological
implications”, Ferroelectrics 34, 3 (1981).
60. H. Athenstaedt, H. Claussen and D. Schaper, “Epidermis of human skin: Pyroelectric and
piezoelectric sensor layer”, Science. 216, 1018 (1982).
61. H. R. Leuchtag, “Fit of the dielectric anomaly of squid axon membrane near heatblock
temperature to the ferroelectric Curie-Weiss law”, Biophys. Chem. 53, 197 (1995).
62. H. R. Leuchtag and V. S. Bystrov, “Ferroelectric and related models in biological systems”,
Ferroelectrics 220, 157 (1999).
63. Y. Palti and W. J. Adelman Jr, “Measurement of axonal membrane conductances and capacity by
means of a varying potential control voltage clamp”, J. Memb. Biol. 1, 431 (1969).
64. V. S. Bystrov and N. K. Bystrova, “Bioferroelectricity and optical properties of biological
systems”, Proc. SPIE 5122, 135 (2003).
65. C. Halperin, S. Mutchnik, A. Agronin, M. Molotskii, P. Urenski, M. Salai and G. Rosenman,
“Piezoelectric effect in human bones studied in nanometer scale”, Nano Lett. 4, 1253 (2004).
66. S. V. Kalinin, B. J. Rodriguez, S. Jesse, T. Thundat and A. Gruverman, “Electromechanical
imaging of biological systems with sub-10 nm resolution”, Appl. Phys. Lett., 87, 053901 (2005).
114
67. B. J. Rodriguez, S. V. Kalinin, J. Shin, S. Jesse, V. Grichko, T. Thundat, A. P. Baddorf and A.
Gruverman, “Electromechanical imaging of biomaterials by scanning probe microscopy”, J. Struct.
Biol. 153, 151 (2006).
68. M. Minary-Jolandan and M. F. Yu, “Nanoscale characterization of isolated individual type I
collagen fibrils: polarization and piezoelectricity”, Nanotechnology, 20, 085706 (2009).
69. C. Harnagea, M. Vallieres, C. P. Pfeffer, D. Wu, B. R. Olsen, A. Pignolet, F. Legare and A.
Gruverman, “Two-dimensional nanoscale structural and functional imaging in individual collagen
type I fibrils”, Biophys. J. 98, 3070 (2010).
70. M. Pal, R. Guo and A. Bhalla, “Biological ferroelectricity in human nail samples using
piezoresponse force microscopy”, Materials Research Innovations 17, 442 (2013).
71. A. L. Kholkin, N. Amdursky, I. Bdikin, E. Gazit and G. Rosenman, “Strong piezoelectricity in
bioinspired peptide nanotubes”, ACS Nano 4, 610 (2010).
72. N. Amdursky, P. Beker, J. Schklovsky, E. Gazit and G. Rosenman, “Ferroelectric and related
phenomena in biological and bioinspired nanostructures”, Ferroelectrics 399 (1), 16, 107 (2010).
73. T. Li and K. Zeng, “Piezoelectric properties and surface potential of green abalone shell studied
by scanning probe microscopy techniques”, Acta Mater. 59, 3667 (2011).
74. T. Li, L. Chen and K. Y. Zeng, “In situ studies of nanoscale electromechanical behavior of nacre
under flexural stresses using band excitation PFM”, Acta Biomaterialia, 9, 5903 (2013).
75. T. Li and K. Zeng, “Nanoscale piezoelectric and ferroelectric behaviors of seashell by
piezoresponse force microscopy,” J. Appl. Phys. 113, 187202 (2013).
76. Y. Liu, Y. Zhang, M. J. Chow, Q. N. Chen and J. Li, “Biological ferroelectricity uncovered in
aortic walls by piezoresponse force microscopy”, Phys. Rev. Lett., 108, 078103 (2012).
77. Y. Liu, Y. Wang, M. Chow, N. Q. Chen, F. Ma, Y. Zhang and J. Li, “Glucose suppresses
biological ferroelectricity in aortic elastin”, Phys. Rev. Lett., 110, 168101 (2013).
78. A. Heredia, M. Machado, I. K. Bdikin, J. Gracio, S. Yudin, V. M. Fridkin, I. Delgadillo, and A. L.
Kholkin, “Preferred deposition of phospholipids onto ferroelectric P(VDF-TrFE) films via
polarization patterning”, J. Phys. D 43, 335301 (2010).
79. S. Horiuchi and Y. Tokura, “Organic ferroelectrics,” Nat. Mater. 7, 357, (2008).
80. H. L. Cai, W. Zhang, J. Z. Ge, Y. Zhang, K. Awaga, T. Nakamura and R. G. Xiong, “4-
(cyanomethyl) anilinium perchlorate: a new displacive-type molecular ferroelectric”, Phys. Rev. Lett.
107, 147601 (2011).
81. W. J. Hu, D-M. Juo, L. You, J. Wang, Y.-C. Chen, Y.-H. Chu and T. Wu, “Universal ferroelectric
switching dynamics of vinylidene fluoride-trifluoroethylene copolymer films”, Scientific Reports, 4,
4772 (2014).
82. G. J. Goldsmith and J. G. J. White, “Ferroelectric behavior of thiourea”. Chem. Phys. 31, 1175,
(1959).
115
83. K. Noda, K. Ishida, A. Kubono, T. Horiuchi, H. Yamada and K. Matsushige, “Remanent
polarization of evaporated films of vinylidene fluoride oligomers”, J. Appl. Phys. 93, 2866 (2003).
84. S. Chen and X. Cheng Zeng, “Design of ferroelectric organic molecular crystals with ultrahigh
polarization”, J. Am. Chem. Soc. 136, 6428 (2014).
85. K. Kobayashi, S. Horiuchi, R. Kumai, F. Kagawa, Y. Murakami and Y. Tokura, “Electronic
ferroelectricity in a molecular crystal with large polarization directing antiparallel to ionic
displacement”, Phys. Rev. Lett, 108, 237601 (2012).
86. T. Hasegawa and Y. Tokura, “Molecular donor-acceptor compounds as prospective organic
electronics materials”, J. Phys. Soc. Jpn. 75, 051016 (2006).
87. S. Horiuchi, R. Kumai and Y. Tokura, “Room-temperature ferroelectricity and gigantic dielectric
susceptibility on a supramolecular architecture of phenazine and deuterated chloranilic acid”, J. Am.
Chem. Soc. 127, 5010 (2005).
88. S. Horiuchi, F. Ishii, R. Kumai, Y. Okimoto, H. Tachibana, N. Nagaosa and Y. Tokura,
“Ferroelectricity near room temperature in co-crystals of nonpolar organic molecules”, Nat. Mater. 4,
163 (2005).
89. S. Horiuchi, R. Kumai and Y, Tokura, “Proton-displacive ferroelectricity in neutral cocrystals of
anilic acids with phenazine”, J. Mater. Chem. 19, 4421 (2009).
90. S. Koval, J. Kohanoff, J. Lasave, G. Colizzi and R. L. Migoni, “First-principles study of
ferroelectricity and isotope effects in H-bonded KH2PO4 crystals”, Phys. Rev. B 71, 184102 (2005).
91. S. Horiuchi, R. Kumai and Y. Tokura, “A supramolecular ferroelectric realized by collective
proton transfer”, Angew. Chem. Int. Ed. 46, 3497 (2007).
92. S. Horiuchi, F. Kagawa, K. Hatahara, K. Kobayashi, R. Kumai, Y. Murakami and Y. Tokura,
“Above-room-temperature ferroelectricity and antiferroelectricity in benzimidazoles”, Nature
Commun. 3, 1308 (2012).
93. A. S. Tayi, A. K. Shveyd, A. C. Sue, J. M. Szarko, B. S. Rolczynski, D. Cao, T. J. Kennedy, A. A.
Sarjeant, C. L. Stern, W. F. Paxton, W. Wu, S. K. Dey, A. C. Fahrenbach, J. R Guest, H. Mohseni, L.
X. Chen, K. L. Wang, J. F. Stoddart and S. I. Stupp, “Room-temperature ferroelectricity in
supramolecular networks of charge-transfer complexes”, Nature 488, 485 (2012).
94. M. Yamada, M. Saitoh, and H. Ooki, “Electric-field induced cylindrical lens, switching and
deflection devices composed of the inverted domains in LiNbO3 crystals”, Appl. Phys. Lett. 69, 3659
(1996).
95. A. Feisst and P. Koidl, “Current induced periodic ferroelectric domain structures in LiNbO3
applied for efficient nonlinear optical frequency mixing”, Appl. Phys. Lett. 47, 1125 (1985).
96. P. A. Franken, A. E. Hill, C. W. Peters and G. Weinreich, “Generation of optical harmonics”,
Phys. Rev. Lett. 7, 118 (1961).
97. A. M. Prokhorov and Y. S. Kuzminov, “Physics and Chemistry of Crystalline Lithium Niobate”,
Adam Hilger, Bristol (1990).

116
98. R. C. Miller, D. A. Kleinman and A. Savage “Quantitative studies of optical harmonic generation
in CdS, BaTiO3, and KH2PO4 type crystals”, Phys. Rev. Lett. 11, 146 (1963).
99. J. Zyss, “Molecular Nonlinear Optics: Materials, Physics, Devices”, Academic Press, New York
(1994).
100. M. A. Khan, U. S. Bhansali and H. N. Alshareef, “High-performance non-volatile organic
ferroelectric memory on banknotes”, Adv. Mater. 24, 2165 (2012).
101. K. Asadi, M. Y. Li, P. W. M. Blom, M. Kemerink and D. M. de Leeuw, “Organic ferroelectric
opto-electronic memories”, Mater. Today, 14, 592 (2011).
102. K. Takashima, S. Horie, T. Mukai, K. Ishida and K.Matsushige, “Piezoelectric properties of
vinylidene fluoride oligomer for use in medical tactile sensor applications”, Sens. Actuators, A 144,
90 (2008).
103. S. Horie, K. Noda, H. Yamada, K. Matsushige, K. Ishida and S. Kuwajima, “Flexible
programmable logic gate using organic ferroelectric multilayer”, Appl. Phys. Lett. 91, 193506 (2007).
104. M. Lee, C. Y. Chen, S. Wang, S. N. Cha, Y. J. Park, J. M. Kim, L. J. Chou and Z. L. Wang, “A
hybrid piezoelectric structure for wearable nanogenerators”, Adv. Mater. 24, 1759 (2012).
105. C. L. Sun, J. Shi, D. J. Bayerl and X. D. Wang, “PVDF microbelts for harvesting energy from
respiration”, Energy Environ. Sci. 4, 4508 (2011).
106. D.V. Isakov, E. de Matos Gomes, B. Almeida, A. L. Kholkin, P. Zelenovskiy, M. Neradovskiy
and V. Ya. Shur, “Energy harvesting from nanofibers of hybrid organic ferroelectric dabcoHReO4”
Appl. Phys. Lett. 104, 032907 (2014).
107. V. S. Bystrov, E. Seyedhosseini, S. Kopyl, I. K. Bdikin and A. L. Kholkin, “Piezoelectricity and
ferroelectricity in biomaterials: molecular modeling and piezoresponse force microscopy
measurements”, J. Appl. Phys. 116, 066803 (2014)
108. E. Boldyreva, “Crystalline Amino Acids - A Link between Chemistry, Materials Science and
Biology”, In “Models, Mysteries and Magic of Molecules”, Eds. J. C. A. Boeyens, J. F. Ogilvie,
Springer, New York (2008).
109. J. Bernstein, “Polymorphism in molecular crystals”, Oxford University Press, New York (2002).
110. V. V. Lemanov, S. N. Popov and G. A. Pankova, “Piezoelectric properties of crystals of some
protein aminoacids and their related compounds”, Phys. Solid State. 44, 1929 (2002).
111. V. V. Lemanov, S. N. Popov and G. A. Pankova, “Piezoelectricity in protein amino acids,
Physics of the Solid State 53, 1191 (2011).
112. J. W. Mullin, “Crystallization”, Butterworth-Heinemann, 4th edn., Oxford (2001).
113. J. D. Yoreo and P. G. Vekilov, “Principles of crystal nucleation and growth”, Rev. Mineral.
Geochem. 54, 57 (2003).
114. I. Weissbuch, M. Lahav and L. Leiserowitz, “Toward stereochemical control, monitoring, and
understanding of crystal nucleation”, Cryst. Growth Des. 3, 125 (2003).

117
115. A. Holden and P. Singer, “Crystals and Crystal Growing”, Anchor Books-Doubleday, New York
(1960).
116. H. M. Gorr, J. M. Zueger, D. R. McAdams and J. A. Barnard, “Salt-induced pattern formation in
evaporating droplets of lysozyme solutions”, Colloids Surf. B 103, 59 (2013).
117. C. Suresh and M. Vijayan, “Head-to-tail sequences and other patterns of peptide aggregation in
the solid state”, Int. J. Pept. Protein Res. 26, 311 (1985).
118. J. E. Elsila, J. P. Dworkin, M. P. Bernstein and S. A. Sandford, “Mechanism of amino acid
formation in interstellar ice analogs”, Astrophys. J. 660, 911 (2007).
119. J. A. Chisholm, S. Motherwell, P. R. Tulip, S. Parsons and S. J. Clark, “An ab initio study of
observed and hypothetical polymorphs of glycine”, Cryst. Growth. Des. 5, 1437 (2005).
120. E. V. Boldyreva, V. A, Drebushchak, T. N. Drebushchak, I. E. Paukov, Y. A. Kovalevskaya and
E. S. Shutova, “Polymorphism of glycine: thermodynamic aspects. Part I. relative stability of the
polymorphs”, J. Therm. Anal. Calorim. 73 (2), 409 (2003).
121. S. V. Goryainov, E. V. Boldyreva and E. N. Kolesnik, “Raman observation of a new (ζ)
polymorph of glycine?”, Chem. Phys. Lett. 419, 496 (2006).
122. V. A. Drebushshak, E. V. Boldyreva, T. N. Drebushchak and E. S. Shutova, “Synthesis and
calorimetric investigation of unstable β-glycine”, J. Cryst. Growth, 241, 266 (2002).
123. G. L. Pervolich, L. K. Hansen and A. Bauer-Brandl, “The polymorphism of glycine.
thermochemical and structural aspects”, J. Therm. Anal. Calorim. 66, 699 (2001).
124. E. S. Ferrari, R. J. Davey, W. I. Cross, A. L. Gillon and C. S. Towler, “Crystallization in
polymorphic systems: the solution-mediated transformation of β to α glycine”, Cryst. Growth Des. 3,
53 (2003).
125. A. L. Markel, A. F. Achkasov, T. A. Alekhina, O. I. Prokudina, M. A. Ryazanova, T. N.
Ukolova, V. M. Efimov, E. V. Boldyreva and V. V. Boldyrev, “Effects of the alpha- and gamma-
polymorphs of glycine on the behavior of catalepsy prone rats”, Pharmacology, Biochemistry and
Behavior, 98, 234 (2011).
126. R. E. Marsh, “A refinement of the crystal structure of glycine”, Acta. Cryst., 11, 654 (1958).
127. D. Gidalevitz, R. Feidenhans’l, S. Matlis, D. M. Smilgies, M. J. Christensen, L. Leiserowitz,
“Monitoring in situ growth and dissolution of molecular crystals: towards determination of the growth
units”, Angew. Chem. Int. Ed. Engl. 36, 955 (1997).
128. J. D. Bernal, “The crystal structure of the natural amino acids and related compounds”, Z.
Kristallogr, 78, 363 (1931).
129. K. Srinivasan, “Crystal growth of α and γ glycine polymorphs and their polymorphic phase
transformations”, J. Cryst. Growth, 311, 156 (2008).
130. C. J. Ksanda and G. Tunell, “The unit cell and space-group of β-glycine”, Am. J. Sci. A 35, 173
(1938).

118
131. V. A. Drebushchak, E. V. Boldyreva, T. N. Drebushchak and E. S. Shutova, “Synthesis and
calorimetric investigation of unstable β-glycine”, J. Cryst. Growth, 241, 266 (2002).
132. A. Sander, T. Penović and J. Šipušić, “Crystallization of β‐glycine by spray drying”, Cryst. Res.
Technol. 46, 145 (2011).
133. N. V. Surovtsev, S. V. Adichtchev, V. K. Malinovsky, A. G. Ogienko, V. A. Drebushchak, A.
Yu. Manakov, A. I. Ancharov, A. S. Yunoshev and E. V. Boldyreva, “Glycine phases formed from
frozen aqueous solutions: revisited”, J. Chem. Phys. 137, 65103 (2012).
134. A. Pyne and R. Suryanarayanan, “Phase transitions of glycine in frozen aqueous solutions and
during freeze-drying”, Pharm. Res. 18, 1448, (2001).
135. B. D. Hamilton, M. A, Hillmyer and M. D. Ward, “Glycine polymorphism in nanoscale
crystallization chambers”, Cryst. Growth Des. 8, 3368 (2008).
136. A. Y. Lee, I. S. Lee and A. S. Myerson, “Factors affecting the polymorphic outcome of glycine
crystals constrained on patterned substrate” Chem. Eng. Technol. 29, 281 (2006).
137. I. S. Lee, K. T. Kim, R. A. Y. Lee and A. S. Myerson, “Concomitant Crystallization of Glycine
on Patterned Substrates: The Effect of pH on the Polymorphic Outcome”, Cryst. Growth Des. 8, 108
(2008).
138. M. N. Bhatt and S. M. Dharmaprakash, “Growth of nonlinear optical γ-glycine crystals”, J.
Cryst. Growth, 236, 376 (2002).
139. M. N. Bhatt and S. M. Dharmaprakash, “Effect of solvents on the growth morphology and
physical characteristics of nonlinear optical γ-glycine crystals”, J. Cryst. Growth, 242, 245 (2002).
140. K. Srinivasan and J. Arumugam, “Growth of non-linear optical γ-glycine single crystals and their
characterization”, J. Opt. Mater. 30, 40 (2007).
141. I. Weissbuch, L. Leiserowitz and M. Lahav, “Tailor-made and charge-transfer auxiliaries for the
control of the crystal polymorphism of glycine”, Adv. Mater. 6, 952 (1994).
142. J. E. Aber, S. Arnold, B. A. Garetz and A. S. Myerson, “Strong dc electric field applied to
supersaturated aqueous glycine solution induces nucleation of γ-polymorph” Phys. Rev. Lett. 94,
145503 (2005).
143. J. Zaccaro, J. Matic, A. S. Myerson and B. A. Garetz, “Nonphotochemical, laser-induced
nucleation of supersaturated aqueous glycine produces unexpected γ-polymorph”, Cryst. Growth Des.
1, 5 (2001).
144. B. A. Garetz, J. Matic and A. S. Myerson, “Polarization switching of crystal structure in the
nonphotochemical light-induced nucleation of supersaturated aqueous glycine solutions”, Phys. Rev.
Lett. 89, 175501 (2002).
145. G. He, V. Bhamidi, S. R. Wilson, R. B. H. Tan, P. J. A. Kenis and C. F. Zukoski, “Direct Growth
of γ-Glycine from Neutral Aqueous Solutions by Slow, Evaporation-Driven Crystallization”, Cryst.
Growth Des. 6, 1746 (2006).
146. I. Gregora, Raman scattering. In “International Tables for Crystallography, Vol. D: Physical
properties of crystals”, Ed. A. Authier, Kluwer Academic Publishers, Norwell (2003).

119
147. L. E. O’Brien, P. Tammins, A. C. Williams and P. York, “Use of in situ Ft-raman spectroscopy
to study the kinetics of the transformation of carbamazepine polymorphs”, J. Pharm. Biomed. Anal.
36, 335 (2004).
148. A. Gruverman, O. Auciello and H. Tokumoto, “Imaging and control of domain structures in
ferroelectric thin films via scanning force microscopy”, Annu. Rev. Mater. Sci. 28, 101 (1998).
149. S. V. Kalinin, A. N. Morozovska, L. Q. Chen and B. J. Rodriguez, “Local polarization dynamics
in ferroelectric materials, Rep. Prog. Phys. 73, 056502 (2010).
150. A. Kholkin, “Introduction, principles and instrumental aspects of piezoresponse force
microscopy by NT-MDT”, Sept 13 (2010).
151. R. Proksch and S. V. Kalinin, “Piezoresponse Force Microscopy with Asylum Research AFMs”
In: Asylum Research Application Note 10.
152. E. Soergel, “Piezoresponse Force Microscopy (PFM)”, J. Phys. D: Appl. Phys. 44, 464003
(2011).
153. S. V. Kalinin, B. J. Rodriguez, S. Jesse, J. Shin, A. P. Baddorf, P. Gupta, H. Jain, D. B. Williams
and A. Gruverman, “Vector piezoresponse force microscopy”, Microsc. Microanal. 12, 206 (2006).
154. S. Jesse, A. P. Baddorf, and S. V. Kalinin, “Switching spectroscopy piezoresponse force
microscopy of ferroelectric materials”, Appl. Phys. Lett. 88, 062908 (2006).
155. A. L. Kholkin, S. V. Kalinin, A. Roelofs, and A. Gruverman, “Review of ferroelectric domain
imaging by piezoresponse force microscopy, in scanning probe microscopy: electrical and
electromechanical phenomena at the nanoscale”, Springer, NY, 173 (2007).
156. A. Gruverman and A. L. Kholkin, “Nanoscale ferroelectrics: processing, characterization and
future trends”, Rep. Prog. Phys. 69, 2443 (2006).
157. P. Sharma, D. Wu, S. Poddar, T. J. Reece, S. Ducharme and A. Gruverman, “Orientational
imaging in polar polymers by piezoresponse force microscopy”, J. Appl. Phys. 110, 52010 (2011).
158. N. Balke, I. Bdikin, S. V. Kalinin, and A. L. Kholkin, “Electromechanical imaging and
spectroscopy of ferroelectric and piezoelectric materials: state of the art and prospects for the future”,
J. Am. Ceram. Soc. 92 1629 (2009).
159. F. Peter, B. Reichenberg, A. Rüdiger, R. Waser and K. Szot, “Sample-tip interaction of
piezoresponse force microscopy in ferroelectric nanostructures”, IEEE Trans. Ultrason. Ferroelectr.
Freq. Control 53, 2253 (2006).
160. F. Peter, A. Rüdiger, R. Waser, K. Szot and B. Reichenberg, “Contributions to in-plane
piezoresponse on axially symmetrical samples”, Rev. Sci. Instrum. 76, 106108 (2005).
161. H. N. Bordallo, E. V. Boldyreva, A. Buchsteiner, M. M. Koza and S. Landsgesell, “Structure-
property relationships in the crystals of the smallest amino acid: an incoherent inelastic neutron
scattering study of the glycine polymorphs”, J. Phys. Chem. B, 112, 8748 (2008).
162. Y. Iitaka, “The crystal structure of γ-glycine”, Acta Cryst. 225, 11(1958).
120
163. P. Lofgren, A. Krozer, J. Lausmaa and B. Kasemo, “Glycine on Pt(111): a TDS and XPS study”,
Surf. Sci. 370, 277 (1997).
164. X. Y. Zhao and J. Rodriguez, “Photoemission study of glycine adsorption on Cu/Au(1 1 1)
interfaces”, Surf. Sci. 600, 2113 (2006).
165. S. M. Barlow, K. J. Kitching, S. Haq and N. V. Richardson, “A study of glycine adsorption on a
Cu{110} surface using reflection absorption infrared spectroscopy”, Surf. Sci. 401, 322 (1998).
166. N. V. Surovtsev, S. V. Adichtchev, V. K. Malinovsky, A. G.Ogienko, V. A. Drebushchak, A.
Yu. Manakov, A. I. Ancharov, A. S.Yunoshev and E. V. Boldyreva, “Glycine phases formed from
frozen aqueous solutions: revisited”, J. Chem. Phys. 137, 65103 (2012).
167. I. S. Lee, K. T. Kim, R. A. Y. Lee and A. S. Myerson, “Concomitant crystallization of Glycine
on patterned substrates: the effect of pH on the polymorphic outcome”, Cryst. Growth Des. 8, 108
(2008).
168. R. A. Van Santen, “The Ostwald step rule”, J. Phys. Chem. 88, 5768 (1984).
169. S. Herminghaus, K. Jacobs, K. Mecke, J. Bischof, A. Fery, M. Ibn-Elhaj and S. Schlagowski,
“Spinodal dewetting in liquid crystal and liquid metal films”, Science 282, 916 (1998).
170. G. F. Harrington, J. M. Campbell and H. K. Christenson, “Crystal patterns created by rupture of
a thin film”, Cryst. Growth Des. 13, 5062 (2013).
171. E. S. Ferrari, R. J. Davey, W. I. Cross, A. L. Gillon and C. S. Towler, “Crystallization in
polymorphic systems: the solution-mediated transformation of β to α Glycine”, Cryst. Growth Des. 3,
53 (2003).
172. B. K. Olmsted and M. D. Ward, “The role of chemical interactions and epitaxy during nucleation
of organic crystals on crystalline substrates”, CrystEngComm, 13, 1070 (2011).
173. K. H. Ernst and K. Christmann, “The interaction of glycine with a platinum (111) surface”, Surf.
Sci. 224, 277 (1989).
174. F. Huerta, E. Morallon, F. Cases, A. Rodes, J. L. Vazquez and A. Aldaz, “Electrochemical
behaviour of amino acids on Pt( h,k,l): a voltammetric and in situ FTIR Study. Part 1. Glycine on
Pt(111)”, J. Electroanal. Chem. 421, 179 (1997).
175. Y. Iitaka, “The crystal structure of β-glycine”, Acta Cryst. 13, 35 (1960).
176. R. E. Marsh, “A refinement of the crystal structure of glycine”, Acta Cryst. 11, 654 (1958).
177. G. Koeckelberghs, C. Samyn, A. Miura, S. De Feyter, F. C. De Schryver, S. Sioncke, T. Verbiest,
G. de Schaetzen and A. Persoons, “Polar order in spin-coated films of a regioregular chiral poly[(S)-3-
(3,7-dimethyloctyl)thiophene]”, Adv. Mater. 17(6), 708 (2005).
178. E. Gomar-Nadal, J. Puigmartı´-Luis and D. B. Amabilino, “Assembly of functional molecular
nanostructures on surfaces”, Chem. Soc. Rev. 37, 490 (2008).
179. P. A. Kralchevsky and N. D. Denkov, “Capillary forces and structuring in layers of colloid
particles” Curr. Opin. Colloid Interface Sci. 6, 383 (2001).

121
180. R. Xie, A. Karim, J. F. Douglas, C. C. Han and R. A. Weiss, “Spinodal dewetting of thin
polymer films”, Phys. Rev. Lett. 81, 1251 (1998).
181. B. C. Okerberg, B. C. Berry, T. R. Garvey, J. F. Douglas, A. Karim and C. L. Soles,
“Competition between crystallization and dewetting fronts in thin polymer films”, Soft Matter 5, 562
(2009).
182. X. Zhang and B. L. Weeks, “Effects on the surface structure of organic energetic materials using
spin coating”, Thin Solid Films 550, 135 (2014).
183. S. Lei, E. A. Eliseev, A. N. Morozovska, R. C. Haislmaier, T. T. A. Lummen, W. Cao, S. V.
Kalinin and V. Gopalan, “Origin of piezoelectric response under a biased scanning probe microscopy
tip across a 180o ferroelectric domain wall”, Phys. Rev. B 86, 134115 (2012).
184. P. Sharma, D. Wu, S. Poddar, T. J. Reece, S. Ducharme and A. Gruverman, “Orientational
imaging in polar polymers by piezoresponse force microscopy”, J. Appl. Phys. 110, 052010 (2011).
185. R. Nath, S. Hong, J. A. Klug, A. Imre, M. J. Bedzyk, R. S. Katiyar and O. Auciello, “Effects of
cantilever buckling on vector piezoresponse force microscopy imaging of ferroelectric domains
in BiFeO3 nanostructures”, Appl. Phys. Lett. 96, 163101 (2010).
186. F. Kagawa, S. Horiuchi, N. Minami, S. Ishibashi, K. Kobayashi, R. Kumai, Y. Murakami and Y.
Tokura, “Polarization switching ability dependent on multidomain topology in a uniaxial organic
ferroelectric”, Nano Lett. 14, 239 (2014).
187. E. G. Fesenko, V. G. Gavrilyachenko, M. A. Martinenko, A. F. Semenchov and I. P. Lapin,
“Domain structure peculiarities of lead-titanate crystals”, Ferroelectrics 6, 61 (1973).
188. C. L. Jia, S. B. Mi, K. Urban, I. Vrejoiu, M. Alexe and D. Hesse, “Atomic-scale study of electric
dipoles near charged and uncharged domain walls in ferroelectric films”, Nat. Mater. 7, 57 (2008).
189. E. A. Eliseev, A. N. Morozovska, G. S. Svechnikov, V. Gopalan and V. Ya. Shur, “Static
conductivity of charged domain walls in uniaxial ferroelectric semiconductors”, Phys. Rev. B 83,
235313 (2011).
190. F. Peter, A. Rüdiger, K. Szot, R. Waser and B. Reichenberg, “Sample-tip interaction of
piezoresponse force microscopy in ferroelectric nanostructures”, IEEE Trans. Ultrason. Ferroelectr.
Freq. Control 53, 2253 (2006).
191. R. E. Newnham, “Properties of Materials: Anisotropy, Symmetry, Structure”, Oxford University
Press, Oxford (2005).
192. Ü. Özgür, Ya. I. Alivov, C. Liu, A. Teke, M. A. Reshchikov, S. Doğan, V. Avrutin, S.-J. Cho
and H. Morkoç, “A comprehensive review of ZnO materials and devices”, J. Appl. Phys. 98, 041301
(2005).
193. N. A. Pertsev, R. V. Gainutdinov, Ya. V. Bodnarchuk and T. R. Volk, “Blockage of domain
growth by nanoscale heterogeneities in a relaxor ferroelectric Sr0.61Ba0.39Nb2O6”, J. Appl. Phys. 117,
034101 (2015).
194. P. Paruch, T. Tybell and J. M. Triscone, “Nanoscale control of ferroelectric polarization and
domain size in epitaxial Pb(Zr0.2Ti0.8)O3 thin films”, Appl. Phys. Lett. 79, 530 (2001).

122
195. N. A. Pertsev, A. Petraru, H. Kohlstedt, R. Waser, I. K. Bdikin, D. Kiselev and A. L. Kholkin,
“Dynamics of ferroelectric nanodomains in BaTiO3 epitaxial thin films via piezoresponse force
microscopy”, Nanotechnology 19, 375703 (2008).
196. N. A. Pertsev and A. L. Kholkin, “Subsurface nanodomains with in-plane polarization in uniaxial
ferroelectrics via scanning force microscopy”, Phys. Rev. B 88, 174109 (2013).
197. A. V. Ievlev, D. O. Alikin, A. N. Morozovska, O. V. Varenyuk, E. A. Eliseev, A. L. Kholkin, V.
Ya. Shur and S. V. Kalinin, “Symmetry breaking and electrical frustration during tip-induced
polarization switching in the nonpolar cut of lithium niobate single crystals”, ACS Nano 9, 769
(2015).
198. V. Ya. Shur, A. R. Akhmathanov, M. A. Chuvakova and I. S. Baturin, “Polarization reversal and
domain kinetics in magnesium doped stoichiometric lithium tantalate”, Appl. Phys. Lett., 105, 152905
(2014).
199. K. Kobayashi, S. Horiuchi, R. Kumai, F. Kagawa, Y. Murakami and Y. Tokura, “Electronic
ferroelectricity in a molecular crystal with large polarization directing antiparallel to ionic
displacement”, Phys. Rev. Lett. 108, 237601 (2012).
200. S. Horiuchi and Y. Tokura, “Organic ferroelectrics”, Nat. Mater. 7, 357 (2008).
201. S. Horiuchi, F. Kagawa, K. Hatahara, K. Kobayashi, R. Kumai, Y. Murakami and Y. Tokura,
“Above-room-temperature ferroelectricity and antiferroelectricity in benzimidazoles”, Nat. Commun.
3, 1308 (2012).
202. M. Molotskii, A. Agronin, P. Urenski, M. Shvebelman, G. Rosenman and Y. Rosenwaks,
“Ferroelectric domain breakdown”, Phys. Rev. Lett. 90, 107601 (2003).
203. T. R. Volk, R. V. Gainutdinov, Ya. V. Bodnarchuk and L. I. Ivlev, “Creation of domains and
domain patterns on the nonpolar surface of SrxBa1 − xNb2O6 crystals by atomic force microscopy”,
JETP Lett. 97, 483 (2013).
204. V. S. Bystrov, E. Seyedhosseini, I. Bdikin, S. Kopyl, S. M. Neumayer, J. Coutinho and A. L.
Kholkin, “BioFerroelectricity: Glycine and Thymine nanostructures computational modeling and
ferroelectric properties at the nanoscale”, Ferroelectrics 475, 107 (2015).
205. M. I. Molotskii and M. M. Shvebelman, “Decay of ferroelectric domains formed in the field of
an atomic force microscope”, J. Appl. Phys. 97, 084111 (2005).
206. T. K. Song, J. G. Yoon and S. Kwun, “Microscopic Polarization Retention Properties of
Ferroelectric Pb(Zr,Ti)O3 Thin Films”, Ferroelectrics 335, 61 (2006).
207. HyperChem, Tools for molecular modeling (release 7, 8). Professional edition (2002),
Hypercube Inc. Gainesville, FL; http://www.hyper.com/?tabid=360.
208. K. Srinivasan, “Crystal growth of α and γ glycine polymorphs and their polymorphic phase
transformations”, J. Cryst. Growth 311, 156 (2008).
209. E. V. Boldyreva, V. A. Drebushchak, T. N. Drebushchak, I. E. Paukov, Y. A. Kovalevskava and
E. S. Shutova, “Polymorphism of glycine, Part I”, J. Therm. Anal. Calorim. 73, 409 (2003).

123
210. K. R. Wilson, D. S. Peterka, M. Jimenez-Cruz, S. R. Leone and M. Ahmed, “VUV photoelectron
imaging of biological nanoparticles: ionization energy determination of nanophase glycine and
phenylalanine-glycine-glycine”, Phys. Chem. Chem. Phys. 8, 1884 (2006).
211. R. E. Newnham, V. Sundar, R. Yimnirun, J. Su and Q. M. Zhang, “Electrostriction: nonlinear
electromechanical coupling in solid dielectrics”, J. Phys. Chem. B. 101(48), 10141 (1997).
212. G. A. Smolenskii, V. A. Bokov, V. A. Isupov, N. N. Krainik, R. E. Pasynkov, A. I. Sokolov, N.
K. Yushin, “Physics of Ferroelectric Phenomena: Ferroelectrics and related materials.”, Gordon and
Breach, New York (1985). (Leningrad, Nauka, in Russian).
213. R. A. Kumar, R. E. Vizhi, N. Vijayan and D. R. Babu, “Structural, dielectric and piezoelectric
properties of nonlinear optical γ-glycine single crystals”, Physica B. 406, 2594 (2011).
214. J. Zhu, K. Gao, S. Xiao, X. Qiu, H. L. Cai and X. S. Wu, “Relaxation of ferroelectric thin films
of diisopropylammonium perchlorate”, Phys Chem Chem Phys. 17(6), 2015.
215. L. Arizmendi, “Photonic applications of lithium niobate crystals”, Phys. Status Solidi A 201, 253
(2004).
216. G. Hofmann, N. Neumann and H. Budzier, “Pyroelectric single-element detectors and arrays
based on modified TGS”, Ferroelectrics 133, 41 (1992).
217. R. Pepinsky, K. Vedam, S. Hoshino and Y. Okaya, “Ferroelectricity in Di-Glycine Nitrate
(NH2CH2COOH)2.HNO3”, Phys. Rev. 111, 430 (1958).
218. V. S. Bystrov, E. V. Paramonova, I. K. Bdikin, A. V. Bystrova, R. C. Pullar and A. L. Kholkin,
“Molecular modelling of the piezoelectric effect in the ferroelectric polymer poly (vinylidene
fluoride) (PVDF)”, J. Mol. Mod. 19, 3591 (2013).
219. I. Bdikin, V. Bystrov, I. Delgadillo, J. Gracio, S. Kopyl, M. Wojtas, E. Mishina, A. Sigov and A.
L. Kholkin, “Polarization switching and patterning in self-assembled peptide tubular structures”, J.
Appl. Phys. 111, 074104 (2012).
220. R. W. Boyd, “Nonlinear Optics”, Academic Press, San Diego, CA. (2003).
221. V. Gopalan and R. Raj, “Domain structure and phase transitions in epitaxial KNbO3 thin films
studied by in situ second harmonic generation measurements”, Appl. Phys. Lett. 68, no10, 1323
(1996).
222. E. D. Mishina, N. E. Sherstyuk, D. R. Barskiy, A. S. Sigov, Yu. I. Golovko, V. M. Mukhorotov,
M. De. Santo and Th. Rasing, “Domain orientation in ultrathin (Ba,Sr)TiO3 films measured by optical
second harmonic generation”, J. Appl. Phys. 93, 6216 (2003).
223. V. Gopalan, M. J. Kawas, M. C. Gupta, T. E. Schlesinger and D. D. Stancil, “Integrated quasi-
phase-matched second-harmonic generator and electrooptic scanner on LiTaO3 single crystals”, IEEE
Photonics Technol. Lett. 8, 1704 (1996).
224. R. Salem, M. A. Foster, A. C. Turner, G. F. Geraghty, M. Lipson and A. L. Gaeta, “Signal
regeneration using low-power four-wave mixing on silicon chip”, Nat. Photonics 2, 35 (2008).
225. J. Han, J. Li, W. Jia, L. Yao, X. Li, L. Jiang and Y. Tian, “Photothermal therapy of cancer cells
using novel hollow gold nanoflowers”, Int. J. Nanomedicine 9, 517 (2014).
124
226. D. S. Hum and M. M. Fejer, “Quasi-phasematching”, C. R. Phys. 8, 180 (2007).
227. G. Rosenman, P. Urenski, A. Agronin, Y. Rosenwaks and M. Molotskii, “Submicron
ferroelectric domain structures tailored by high-voltage scanning probe microscopy”, Appl. Phys. Lett.
82, 103 (2003).
125
List of publications
1. E. Seyedhosseini, M. Ivanov, V. Bystrov, I. Bdikin, P. Zelenovskiy, V. Ya. Shur, A.
Kudryavtsev, E. D. Mishina, A. S. Sigov, and A. L. Kholkin; “Growth and nonlinear
optical properties of β-glycine crystals grown on Pt substrates”; Crystal Growth &
Design. 14, 2831 (2014).
2. V. Bystrov, E. Seyedhosseini, S. Kopyl, I. K. Bdikin and A. L. Kholkin; “Piezoelectricity
and ferroelectricity in biomaterials: Molecular modeling and piezoresponse force
microscopy measurements”; Journal of Applied Physics. 116, 066803-1 (2014).
3. D. Isakov, D. Petukhova, S. Vasilev, A. Nuraeva, T. Khazamov, E. Seyedhosseini, P.
Zelenovskiy, V. Y. Shur and A .L. Kholkin; “In Situ Observation of the Humidity
Controlled Polymorphic Phase Transformation in Glycine Microcrystals”; Crystal
Growth & Design. 14, 4138 (2014).
4. V. Bystrov, E. Seyedhosseini, I. Bdikin, S. Kopyl, S. M. Neumayer, J. Coutinho and
A.L.Kholkin; “Bioferroelectricity in Nanostructured Glycine and Thymine: Molecular
Modeling and Ferroelectric Properties at the Nanoscale”; Ferroelectrics 475, 107
(2015).
5. E. Seyedhosseini, I. Bdikin, M. Ivanov, D. Vasileva, A. Kudryavtsev, B. J. Rodriguez, A. L.
Kholkin, “Tip-induced domain structures and polarization switching in ferroelectric
amino acid glycine”; Journal of Applied Physics. 118, 072008-1 (2015).
6. E. Seyedhosseini, D. Vasileva, S. Vasilev, A. Nuraeva, P. Zelenovskiy, V. Ya. Shur, and A.
L. Kholkin; “Patterning and Nanoscale Characterization of Ferroelectric Amino
Acid Beta-glycine”; IEEE Conference proceedings, ISAF-ISIF-PFM 207, (2015).