Embed Size (px)
Citation preview
UNIVERSIDADE DE BRASÍLIA
INSTITUTO DE CIÊNCIAS BIOLÓGICAS
PROGRAMA DE PÓS-GRADUAÇÃO EM ECOLOGIA
Estrutura de comunidades em transições ambientais: lagartos no ecótono Cerrado-
Amazônia
Pedro Tourinho Dantas
Brasília – DF
2014
Dissertação apresentada ao
Programa de Pós-Graduação em
Ecologia da Universidade de
Brasília, como requisito para
obtenção do título de Mestre em
Ecologia.
Universidade de Brasília
Instituto de Ciências Biológicas
Programa de Pós-Graduação em Ecologia
Estrutura de comunidades em transições ambientais: lagartos no ecótono Cerrado-
Amazônia
Orientador: Dr. Guarino Rinaldi Colli
Brasília – DF
2014


Dantas, Pedro Tourinho
Estrutura de comunidades em transições ambientais: lagartos no ecótono
Cerrado-Amazônia
78 páginas.
Dissertação (Mestrado) - Programa de Pós-graduação em Ecologia.
Instituto de Ciências Biológicas - Universidade de Brasília.
1. Comunidades biológicas 2. Lagartos 3. Ecótono
I. Universidade de Brasília. Instituto de Ciências Biológicas.
Departamento de Zoologia.
Como citar este trabalho:
Dantas, P. T. (2014) Estrutura de comunidades em transições ambientais:
lagartos no ecótono Cerrado-Amazônia. Dissertação (Mestrado em
Ecologia) – Programa de Pós-graduação em Ecologia. Instituto de
Ciências Biológicas, Universidade de Brasília. Brasília-DF. 78 pp.

Agradecimentos
Meu obrigado,
À toda a minha família, a qual deu apoio à minha vinda pra Brasília e esteve sempre
presente ao longo destes dois anos cheios de saudade.
Ao meu orientador, Guarino Rinaldi Colli, por todos os ensinamentos teóricos e
práticos. Aprendi muitas coisas e conheci lugares incríveis durante o período do mestrado.
Agradeço muito pela oportunidade.
Aos membros da banca examinadora, Emerson Monteiro Vieira, Regina Helena
Ferraz Macedo, Ricardo Bomfim Machado e Teresa Cristina Sauer de Ávila Pires, pelo
interesse e disponibilidade, bem como pelas contribuições feitas à essa dissertação.
À Coleção Herpetológica da Universidade de Brasília (CHUNB) e todos os seus
membros (passados e presentes), os quais se esforçaram em expedições de coleta em diversos
locais e tornaram este trabalho possível. Agradeço ainda pelos momentos de discussão e
descontração que me tornaram um profissional e uma pessoa melhor.
Aos pesquisadores que coletaram, analisaram e publicaram informações sobre
herpetofauna utilizadas neste trabalho. Compilei e estudei trabalhos de levantamento, história
natural e filogenia para responder às minhas perguntas. Sem um grupo de herpetólogos
brasileiros (que vem crescendo e se solidificando) esta dissertação seria inviável.
Ao Núcleo Regional de Ofiologia e Animais Peçonhentos da Universidade Federal da
Bahia (NOAP/UFBA), onde tive meu primeiro contato e despertei meu interesse pela
herpetologia. Agradeço especialmente à Rejâne Lira-da-Silva pelas orientações e apoio à
minha vinda para Brasília.
Aos novos e velhos amigos. Gostei muito de vir pra Brasília e tenho saudade de
Salvador, e esses bons sentimentos se devem a vocês. Sem os momentos de alegria que vocês

me proporcionaram (pessoalmente ou à distância), estes dois anos teriam sido bem mais
difíceis.
À família Britto por todo o suporte à minha mudança para Brasília. Vir morar em uma
cidade nova onde inicialmente não se conhece ninguém é uma tarefa difícil, mas com a ajuda
de vocês essa transição foi imperceptível. Agradeço muito pela força.
À Bárbara Zimbres pela tradução do manuscrito para o inglês, por todo o apoio na
reta final e por todo o amor que recebi.
Por fim, agradeço aos financiamentos fornecidos pelo CNPq, MMA-PROBIO,
CAPES, FAPDF e FINATEC, os quais tornaram possível as expedições realizadas pela
CHUNB e contribuíram para o aumento do conhecimento sobre a herpetofauna do Cerrado.
Agradeço ao CNPq também pela bolsa de estudos concedida e ao Programa de Pós-
Graduação em Ecologia por toda a estrutura, suporte e ensinamento.

Sumário
Resumo ...................................................................................................................................... 1
Introdução Geral ........................................................................................................................ 1
Métodos...................................................................................................................................... 3
Resultados e Discussão .............................................................................................................. 5
Referências ................................................................................................................................. 7
Manuscrito ............................................................................................................................... 13
Abstract .................................................................................................................................... 14
Introduction .............................................................................................................................. 14
Methodology ............................................................................................................................ 18
Study area ......................................................................................................................... 18
Data gathering and processing .......................................................................................... 18
Analyses............................................................................................................................ 19
Results ...................................................................................................................................... 22
Discussion ................................................................................................................................ 23
References ................................................................................................................................ 28
Tables ....................................................................................................................................... 44
Figure Legends......................................................................................................................... 48
Figures...................................................................................................................................... 50
Appendix 1 ............................................................................................................................... 55
Appendix 2 ............................................................................................................................... 71
1
Resumo 1
Os limites ecológicos desempenham um papel crucial no fluxo de espécies, de genes e 2
nutrientes entre áreas adjacentes. Os limites não apenas separam, mas também conectam 3
estas áreas, agindo como filtros de permeabilidade variável. A estrutura das comunidades 4
varia com a proximidade do ecótono e a riqueza de espécies no ecótono pode ser maior que, 5
menor que, ou intermediária entre as áreas adjacentes. Aqui, eu investigo como o ecótono 6
isola a Amazônia e o Cerrado, atuando como um filtro sobre as trocas faunísticas entre 7
comunidades de lagartos dos dois biomas neotropicais. Com base em dados de campo e da 8
literatura, foram realizadas análises de correlação entre índices de diversidade e a distância de 9
cada ponto amostral ao ecótono e ao centróide dos biomas. Para investigar os processos 10
responsáveis pelos padrões observados, foi realizada uma análise de correspondência 11
canônica (CCA) relacionando a ocorrência das espécies nas comunidades amostras à 12
variáveis ambientais. Os resultados demonstram que a proximidade ao ecótono Cerrado-13
Amazônia afeta negativamente a diversidade das comunidades de lagartos, o que é 14
determinado por um processo de filtragem ambiental e possivelmente influenciado por 15
fatores históricos. A ordenação da CCA foi capaz de distinguir claramente dois grupos de 16
espécies (de habitats abertos e habitats florestais), e associá-los à variação na vegetação, 17
umidade do solo e variação diária da temperatura. 18
19
Introdução Geral 20
Os limites ecológicos e seus gradientes estão entre os assuntos mais abordados na 21
ecologia (Erdós et al., 2011). Em despeito à pequena área que costumam ocupar, quando 22
comparados com o resto da paisagem, estes limites parecem desempenhar um papel crucial 23
no fluxo de espécies (Urbina-Cardona et al., 2006), de genes (Smith et al., 1997) e de matéria 24
(Kolasa & Zalewski, 1995) entre áreas adjacentes. A estrutura das comunidades varia com a 25

2
proximidade do ecótono (e.g., Hofer et al., 2000; Menke, 2003b; Lloyd et al., 2012) e a 26
riqueza de espécies no ecótono pode ser maior que, menor que,ou intermediária entre as áreas 27
adjacentes (van der Maarel, 1990). A compreensão dos padrões de riqueza nos ecótonos 28
requer ainda o entendimento de fatores ligados à história e biogeografia das áreas, já que, em 29
uma escala regional, os ecótonos resultam do contato de diferentes regiões biogeográficas 30
(Nogués-Bravo & Martinez-Rica, 2004). 31
Uma noção amplamente difundida sobre ecótonos é a de que possuem maior 32
diversidade biológica do que áreas adjacentes e, portanto, maior valor para a conservação 33
(Risser, 1995; Kirkman et al., 1998; Kernaghan & Harper, 2001). Para tanto, os ecótonos 34
deveriam mostrar uma propriedade aditiva, sendo capazes de suportar espécies das áreas 35
adjacentes (Senft, 2009). De forma oposta, a diversidade em ecótonos pode ser menor 36
(Backeus, 1993a; Dangerfield et al., 2003) caso suas condições ambientais sejam sub-ótimas 37
em relação ao centro das áreas adjacentes, prejudicando o estabelecimento e a permanência 38
das espécies (Temple, 1998). 39
A transição entre a Amazônia e o Cerrado é uma extensa zona de tensão ecológica na 40
América do Sul, formada por um mosaico de savanas e florestas (Ratter et al., 1973; Ackerly 41
et al., 1989a; Ratter, 1992). Este mosaico é irregular, apresentando características singulares 42
e recortes de diferentes tamanhos ao longo de sua extensão (Marimon et al., 2006). A zona de 43
transição coincide espacialmente com o “arco do desmatamento”, que se inicia no Maranhão 44
e margeia os limites sudeste, sul e sudoeste da Bacia Amazônica (Ferreira et al., 2005; 45
Fearnside & Graça, 2006; Aldrich et al., 2012). Existe pouca informação sobre como as 46
espécies de vertebrados se distribuem através desta paisagem (Lacher & Alho, 2001) e a falta 47
de conservação desta área pouco estudada parece limitar a detecção de processos ecológicos 48
que estariam ocorrendo no ecótono (Marimon et al., 2006). 49

3
Lagartos são considerados “organismos modelo” para estudos ecológicos, 50
apresentando características desejáveis como fácil captura, alta abundância e baixa dispersão 51
(Huey et al., 1983; Carothers et al., 1996; Pianka & Vitt, 2003; Camargo et al., 2010), sendo 52
empregados com sucesso em estudos de áreas ecotonais (e.g., Hofer et al., 1999, 2000; 53
Menke, 2003b; Nogués-Bravo & Martinez-Rica, 2004; Urbina-Cardona et al., 2006). Aqui, 54
eu investigo como o ecótono isola a Amazônia e o Cerrado, atuando como um filtro sobre as 55
trocas faunísticas entre dois biomas neotropicais. Eu caracterizo os padrões e investigo os 56
processos responsáveis pelas mudanças na estrutura das comunidades de lagartos, em um 57
gradiente do centro para a periferia dos dois biomas. Caso o ecótono Amazônia-Cerrado 58
funcione como um filtro ambiental, isolando os dois biomas, é esperada uma redução nos 59
índices de diversidade (riqueza, endemismo, diversidade funcional e diversidade filogenética) 60
à medida que avançamos do centro para a periferia dos dois biomas, rumo ao ecótono, uma 61
vez que a maior instabilidade e heterogeneidade ambiental da transição devem dificultar o 62
estabelecimento e a permanência de espécies. 63
64
Métodos 65
Os dados relativos às comunidades de lagartos utilizados neste trabalho são 66
provenientes da literatura e de coletas sistemáticas realizadas pelo grupo de pesquisa 67
"Herpetologia do Cerrado". Eu considerei pontos amostrais localizados no Cerrado e na 68
Amazônia, onde coletas foram realizadas utilizando-se de métodos e esforços semelhantes 69
(busca ativa e armadilhas de interceptação-e-queda com cercas-guia por no mínimo três 70
semanas em cada local). As variáveis ambientais que utilizei são aquelas disponibilizadas 71
pelos projetos Worldclim (Hijmans et al., 2005) e Atlas of the Biosphere (utilizado com 72
permissão do Center for Sustainability and the Global Environment, Nelson Institute for 73
Environmental Studies, Universidade de Wisconsin-Madison), correspondendo a dados de 74

4
temperatura, precipitação, altitude, evapotranspiração, produtividade primária líquida, 75
umidade do solo e vegetação potencial (variável categórica que discrimina o tipo de 76
cobertura que existiria em um grid caso não houvesse interferência humana). Eu obtive as 77
distâncias das comunidades amostradas ao ecótono e ao centróide dos biomas através do 78
programa ArcGIS 9.3 (ESRI, 2009). 79
Como índices de diversidade, além da riqueza e do endemismo, também utilizei a 80
diversidade filogenética e a diversidade funcional. Neste trabalho, empreguei o índice de 81
phylogenetic diversity (PD), calculado pela soma dos comprimentos dos ramos da árvore 82
filogenética das espécies de uma comunidade (Faith, 1992). Com o programa Mesquite 2.75 83
(Maddison & Maddison, 2011) e baseado em hipóteses filogenéticas recentes (D'Angiolella 84
et al., 2011; Harvey et al., 2012; Giugliano et al., 2013b; Pyron et al., 2013), construí uma 85
árvore filogenética que engloba todas as espécies registradas no presente trabalho.Calculei os 86
valores de PD para cada comunidade com o pacote picante (Kembel et al., 2010) no 87
programa R (RCoreTeam, 2013). Para a medida da diversidade funcional, caracterizei as 88
espécies com relação à morfologia e utilização de recursos, obtidos através de consulta à 89
literatura especializada. Calculei a diversidade funcional de cada comunidade com base no 90
índice de riqueza funcional (functional richness- FRic) (Villéger et al., 2008), obtido através 91
do volume ocupado por determinada comunidade em um espaço T-dimensional, relativo aos 92
traços funcionais utilizados na análise (Cornwell et al., 2006; Villéger et al., 2008). Para esta 93
análise, utilizei o pacote FD (Laliberté & Shipley, 2011b) do programa R (RCoreTeam, 94
2013). 95
Investiguei a relação entre os índices de diversidade e o ecótono Amazônia-Cerrado 96
através de análises de correlação entre cada índice e a distância da comunidade em questão 97
ao limite entre os dois biomas e ao centróide de cada bioma. Finalmente, eu investiguei os 98
processos responsáveis pelos padrões observados ao longo do gradiente através de uma 99
5
Análise de Correspondência Canônica (CCA) (Ter Braak, 1986) entre a composição das 100
comunidades e as variáveis ambientais dos respectivos locais. 101
102
Resultados e Discussão 103
O levantamento de dados proporcionou a obtenção de 46 comunidades, distribuídas 104
entre a Amazônia e o Cerrado. Nessas comunidades foram encontrados 11.519 espécimes de 105
lagartos, divididos em 123 espécies e 13 famílias. 106
Das 16 análises de correlação realizadas, nove apresentaram um resultado 107
estatisticamente significativo (P< 0.05). Para a Amazônia, as correlações significativas foram 108
aquelas que relacionaram a distância ao ecótono com a riqueza (= 0.436 e P= 0.013), 109
endemismos do bioma (= 0.677 e P< 0.001), diversidade filogenética (= 0.596 e P< 0.001) 110
e diversidade funcional (= 0.403 e P= 0.023), além daquelas que envolveram a distância ao 111
centróide com os endemismos do bioma (= -0.563 e P< 0.001) e com a diversidade 112
filogenética (= -0.375 e P= 0.034). 113
Para o Cerrado, as correlações significativas foram aquelas que relacionaram a 114
distância ao ecótono com os endemismos do bioma (= 0.468 e P= 0.018), diversidade 115
filogenética (= 0.407 e P= 0.045) e diversidade funcional (= 0.535 e P= 0.007). Nenhuma 116
correlação que envolveu a distância ao centróide deste bioma com os índices de diversidade 117
foi estatisticamente significativa, porém podemos observar o mesmo padrão amazônico onde 118
os índices de diversidade tendem a ser mais altos conforme nos afastamos do ecótono. 119
A seleção de modelos mostrou que as variáveis ambientais que mais influenciam a 120
variação na composição das comunidades de lagartos são a vegetação potencial, a umidade 121
no solo e a variação média na temperatura diária, além de valores extremos como as 122
temperatura médias dos trimestres mais seco e mais frio, e a precipitação do trimestre mais 123
quente.Os resultados da CCA mostram que as espécies endêmicas da Amazônia tendem a se 124
6
agrupar com valores mais altos de umidade no solo, bem como de temperatura nos trimestres 125
mais secos e frios. As espécies endêmicas do Cerrado se associaram a solos mais secos, 126
maior variação na temperatura diária e a temperaturas e umidade no solo mais baixas. As 127
espécies com ampla distribuição estão espalhadas por toda a área do gráfico, demonstrando a 128
sua capacidade de ocupar os dois ambientes. Em escalas continentais, variáveis relacionadas 129
ao fluxo de energia são preponderantes para explicar os padrões de diversidade (Wright, 130
1983; Currie, 1991). Apesar de estarem presentes no pool de variáveis ambientais, estas 131
variáveis (produtividade primária líquida, evapotranspiração, evapotranspiração potencial) 132
não foram incluídas no modelo final como aquelas que mais contribuíram para a variação na 133
estrutura das comunidades estudadas. As variáveis que melhor explicam essa variação estão 134
intimamente ligadas com diferenças ambientais entre os biomas e com a história natural dos 135
lagartos. 136
Os resultados apresentados demonstram que o ecótono entre a Amazônia e o Cerrado 137
exerce uma influência negativa sobre os índices de diversidade de comunidades de lagartos. 138
A zona de transição estudada atua como um filtro ambiental, limitando a presença de 139
espécies endêmicas ou características de ambientes abertos/fechados. Em escalas amplas de 140
tempo e espaço, o ecótono Amazônia/Cerrado é uma zona altamente instável (Haffer, 1969; 141
Werneck et al., 2012), o que a torna menos favorável para a colonização e permanência das 142
espécies (van der Maarel, 1990). No entanto, o ecótono Amazônia/Cerrado ainda é um 143
ambiente pouco estudado e a sua localização no arco do desmatamento torna ainda mais 144
difícil a compreensão de seus padrões e processos. Estudos com dinâmica e genética de 145
populações ao longo do gradiente seriam interessantes de ser conduzidos para um melhor 146
entendimento da dinâmica do ecótono. 147
148
149
7
Referências 150
Ackerly, D.D., Thomas, W.W., Ferreira, C.A.C. & Pirani, J.R. (1989) The Forest-Cerrado 151
Transition Zone in Southern Amazonia - Results of the 1985 Projeto Flora Amazonica 152
Expedition to Mato-Grosso. Brittonia, 41, 113-128. 153
Aldrich, S., Walker, R., Simmons, C., Caldas, M. & Perz, S. (2012) Contentious land change 154
in the Amazon's Arc of Deforestation. Annals of the Association of American 155
Geographers, 102, 103-128. 156
Backeus, I. (1993) Ecotone Versus Ecocline - Vegetation Zonation and Dynamics around a 157
Small Reservoir in Tanzania. Journal of Biogeography, 20, 209-218. 158
Blevins, E., Wisely, S.M. & With, K.A. (2011) Historical processes and landscape context 159
influence genetic structure in peripheral populations of the collared lizard 160
(Crotaphytus collaris). Landscape Ecology, 26, 1125-1136. 161
Camargo, A., Sinervo, B. & Sites, J.W., Jr. (2010) Lizards as model organisms for linking 162
phylogeographic and speciation studies. Molecular Ecology, 19, 3250-70. 163
Carothers, J.H., Jaksic, F.M. & Marquet, P.A. (1996) A model for species distributions along 164
a gradient: Lizards as study systems. Revista Chilena de Historia Natural, 69, 301-165
307. 166
Cornwell, W.K., Schwilk, L.D. & Ackerly, D.D. (2006) A trait-based test for habitat 167
filtering: convex hull volume. Ecology, 87, 1465-71. 168
Currie, D.J. (1991) Energy and Large-Scale Patterns of Animal- and Plant-Species Richness. 169
The American Naturalist, 137, 27-49. 170
D'Angiolella, A.B., Gamble, T., Avila-Pires, T.C.S., Colli, G.R., Noonan, B.P. & Vitt, L.J. 171
(2011) Anolis chrysolepis Duméril and Bibron, 1837 (Squamata: Iguanidae), 172
Revisited: Molecular Phylogeny and Taxonomy of the Anolis chrysolepis Species 173
Group. Bulletin of the Museum of Comparative Zoology, 160, 35-63. 174
8
Dangerfield, J.M., Pik, A.J., Britton, D., Holmes, A., Gillings, M., Oliver, I., Briscoe, D. & 175
Beattie, A.J. (2003) Patterns of invertebrate biodiversity across a natural edge. Austral 176
Ecology, 28, 227-236. 177
Erdós, L., Zalatnai, M., Morschhauser, T., Bátori, Z. & Körmöczi, L. (2011) On the terms 178
related to spatial ecological gradients and boundaries. Acta Biologica Szegediensis, 179
55, 279-287. 180
ESRI (2009) ArcGIS 9.3. ESRI (Environmental Systems Resource Institute), Redlands, 181
California. 182
Faith, D.P. (1992) Conservation evaluation and phylogenetic diversity. Biological 183
Conservation, 61, 1-10. 184
Fearnside, P.M. & Graça, P.M.L.A. (2006) BR-319: Brazil's manaus-porto velho highway 185
and the potential impact of linking the arc of deforestation to central Amazonia. 186
Environmental Management, 38, 705-716. 187
Ferreira, L.V., Venticinque, E. & Almeida, S. (2005) O desmatamento na Amazônia e a 188
importância das áreas protegidas. Estudos Avançados, 19, 157-166. 189
Garner, T.W., Pearman, P.B. & Angelone, S. (2004) Genetic diversity across a vertebrate 190
species' range: a test of the central-peripheral hypothesis. Molecular ecology, 13, 191
1047-53. 192
Giugliano, L.G., de Campos Nogueira, C., Valdujo, P.H., Collevatti, R.G. & Colli, G.R. 193
(2013) Cryptic diversity in South American Teiinae (Squamata, Teiidae) lizards. 194
Zoologica Scripta, n/a-n/a. 195
Haffer, J. (1969) Speciation in Amazonian forest birds. Science, 165, 131-137. 196
Harvey, M.B., Ugueto, G.N. & Gutberlet, R.L. (2012) Review of teiid morphology with a 197
revised taxonomy and phylogeny of the Teiidae (Lepidosauria: Squamata). Zootaxa, 198
1-156. 199
9
Hijmans, R.J., Cameron, S.E., Parra, J.L., Jones, P.G. & Jarvis, A. (2005) Very high 200
resolution interpolated climate surfaces for global land areas. International Journal of 201
Climatology, 25, 1965-1978. 202
Hofer, U., Bersier, L.F. & Borcard, D. (1999) Spatial organization of a herpetofauna on an 203
elevational gradient revealed by null model tests. Ecology, 80, 976-988. 204
Hofer, U., Bersier, L.F. & Borcard, D. (2000) Ecotones and gradient as determinants of 205
herpetofaunal community structure in the primary forest of Mount Kupe, Cameroon. 206
Journal of Tropical Ecology, 16, 517-533. 207
Huey, R.B., Pianka, E.R. & Schoener, T.W. (1983) Lizard Ecology: Studies of a Model 208
Organism. Harvard University Press, Cambridge. 209
Kembel, S.W., Cowan, P.D., Helmus, M.R., Cornwell, W.K., Morlon, H., Ackerly, D.D., 210
Blomberg, S.P. & Webb, C.O. (2010) Picante: R tools for integrating phylogenies and 211
ecology. Bioinformatics, 26, 1463-4. 212
Kernaghan, G. & Harper, K.A. (2001) Community structure of ectomycorrhizal fungi across 213
an alpine/subalpine ecotone. Ecography, 24, 181-188. 214
Killeen, T.J. & Solórzano, L.A. (2008) Conservation strategies to mitigate impacts from 215
climate change in Amazonia. Philosophical Transactions of the Royal Society B: 216
Biological Sciences, 363, 1881-1888. 217
Kirkman, L.K., Drew, M.B., West, L.T. & Blood, E.R. (1998) Ecotone characterization 218
between upland longleaf pine/wiregrass stands and seasonally-ponded isolated 219
wetlands. Wetlands, 18, 346-364. 220
Kolasa, J. & Zalewski, M. (1995) Notes on ecotone attributes and functions. Hydrobiologia, 221
303, 1-7. 222
Lacher, T.E. & Alho, C.J.R. (2001) Terrestrial small mammal richness and habitat 223
associations in an Amazon Forest-Cerrado contact zone. Biotropica, 33, 171-181. 224
10
Laliberté, E. & Shipley, B. (2011) FD: measuring functional diversity from multiple traits, 225
and other tools for functional ecology. 226
Lloyd, H., Rios, S.S., Marsden, S.J. & Valdes-Velasquez, A. (2012) Bird community 227
composition across an Andean tree-line ecotone. Austral Ecology, 37, 470-478. 228
Maddison, W.P. & Maddison, D.R. (2011) Mesquite: a modular system for evolutionary 229
analysis. http://mesquiteproject.org. 230
Marimon, B.S., De S. Lima, E., Duarte, T.G., Chieregatto, L.C. & Ratter, J.A. (2006) 231
Observations on the Vegetation of Northeastern Mato Grosso, Brazil. Iv. An Analysis 232
of the Cerrado–Amazonian Forest Ecotone. Edinburgh Journal of Botany, 63, 323. 233
Menke, S.B. (2003) Lizard community structure across a grassland - creosote bush ecotone in 234
the Chihuahuan Desert. Canadian Journal of Zoology-Revue Canadienne De 235
Zoologie, 81, 1829-1838. 236
Nogués-Bravo, D. & Martinez-Rica, J.P. (2004) Factors controlling the spatial species 237
richness pattern of four groups of terrestrial vertebrates in an area between two 238
different biogeographic regions in northern Spain. Journal of Biogeography, 31, 629-239
640. 240
Pandey, M. & Rajora, O.P. (2012) Higher fine-scale genetic structure in peripheral than in 241
core populations of a long-lived and mixed-mating conifer--eastern white cedar 242
(Thuja occidentalis L.). BMC Evolutionary Biology, 12, 48. 243
Parsons, P.A. (1990) The metabolic cost of multiple environmental stresses: implications for 244
climatic change and conservation. Trends in Ecology & Evolution, 5, 315-317. 245
Pianka, E.R. & Vitt, L.J. (2003) Lizards: Windows to the Evolution of Diversity. University 246
of California Press, Berkeley. 247

11
Pyron, R., Burbrink, F. & Wiens, J. (2013) A phylogeny and revised classification of 248
Squamata, including 4161 species of lizards and snakes. BMC Evolutionary Biology, 249
13, 93. 250
Ratter, J.A. (1992) Transitions between cerrado and forest vegetation in Brazil. Nature and 251
Dyanmics of Forest-Savanna Boundaries (ed. by P.A. Furley, J. Proctor and J.A. 252
Ratter), pp. c417-429. Chapman & Hall, London. 253
Ratter, J.A., Richards, P.W., Argent, G. & Gifford, D.R. (1973) Observations on the 254
Vegetation of Northeastern Mato Grosso: I. The Woody Vegetation Types of the 255
Xavantina-Cachimbo Expedition Area. Philosophical Transactions of the Royal 256
Society B: Biological Sciences, 266, 449-492. 257
RCoreTeam (2013) R: A language and environment for statistical computing. R Foundation 258
for Statistical Computing. 259
Risser, P.G. (1995) The status of the science examining ecotones - A dynamic aspect of 260
landscape is the area of steep gradients between more homogeneous vegetation 261
associations. Bioscience, 45, 318-325. 262
Senft, A.R. (2009) Species diversity patterns at ecotones. University of North Carolina, 263
Chapel Hill. 264
Smith, T.B., Wayne, R.K., Girman, D.J. & Bruford, M.W. (1997) A role for ecotones in 265
generating rainforest biodiversity. Science, 276, 1855-1857. 266
Temple, S.A. (1998) Surviving where ecosystems meet: ecotonal animal communities of 267
midwestern oak savannas and woodlands. Transactions of the Wisconsin Academy of 268
Sciences, Arts and Letters, 86, 207-222. 269
Ter Braak, C.J.F. (1986) Canonical correspondence analysis: a new eigenvector technique for 270
multivariate direct gradient analysis. Ecology, 67, 1167-1179. 271
12
Urbina-Cardona, J.N., Olivares-Perez, M. & Reynoso, V.H. (2006) Herpetofauna diversity 272
and microenvironment correlates across a pasture-edge-interior ecotone in tropical 273
rainforest fragments in the Los Tuxtlas Biosphere Reserve of Veracruz, Mexico. 274
Biological Conservation, 132, 61-75. 275
van der Maarel, E. (1990) Ecotones and ecoclines are different. Journal of Vegetation 276
Science, 1, 135-138. 277
Villéger, S., Mason, N.W.H. & Mouillot, D. (2008) New multidimensional functional 278
diversity indices for a multifaceted framework in functional ecology. Ecology, 89, 279
2290-2301. 280
Werneck, F.P., Nogueira, C., Colli, G.R., Sites, J.W. & Costa, G.C. (2012) Climatic stability 281
in the Brazilian Cerrado: implications for biogeographical connections of South 282
American savannas, species richness and conservation in a biodiversity hotspot. 283
Journal of Biogeography, 39, 1695-1706. 284
Wright, D.H. (1983) Species-energy theory: an extension of species-area theory. Oikos, 41, 285
496-506.286
287

13
Community structure in biome transitions: lizards in the Cerrado-Amazon ecotone
Pedro Tourinho Dantas ¹ & Guarino Rinaldi Colli ²*
¹ Programa de Pós-Graduação em Ecologia, Universidade de Brasília, 70910-900 Brasília,
Distrito Federal, Brazil.
² Departamento de Zoologia, Universidade de Brasília, 70910-900 Brasília, Distrito Federal,
Brazil.
Keywords: arc of deforestation, Cerrado, Amazon, lizards, richness, phylogenetic diversity,
functional diversity
* Corresponding author: Guarino Rinaldi Colli, Departamento de Zoologia, Universidade de
Brasília, 70910-900 Brasília, Distrito Federal, Brazil. Email: [email protected]

14
Abstract 1
Ecological gradients have a crucial role in the flow of species, genes and nutrients between 2
adjacent areas. Limits do not simply separate, but also connect areas, acting as filters of 3
varying permeability. Community structure varies with proximity to the ecotone, and species 4
richness in the ecotone can be higher than, lower than, or similar to adjacent areas. Here, we 5
investigate how the ecotone isolates two Neotropical biomes, the Amazon and the Cerrado, 6
acting as a filter on the lizard fauna exchange between them. Based on field and literature 7
data, we performed correlation analyses between diversity indices and the distance of each 8
sampling point to the ecotone and to the biomes centroids. To investigate the processes 9
responsible for the observed patterns along the gradient, we conducted a canonical 10
correspondence analysis (CCA) relating species incidences in sampled communities and 11
environmental variables. Our results demonstrate that proximity to the Amazon-Cerrado 12
ecotone negatively affects the diversity of lizard communities, which is determined by a 13
process of environmental filtering and possibly influenced by historical factors. The 14
ordination by the CCA was able to clearly distinguish two groups of species (from open and 15
from forest habitats), and associate them to potential vegetation, soil moisture and mean 16
diurnal range of temperature. 17
18
Introduction 19
Ecological limits and gradients are among the most studied subjects in ecology (Erdós 20
et al., 2011). In spite of their small geographical ranges, when compared to the rest of the 21
regional landscape, these limits seem to have a crucial role in the flow of species (Urbina-22
Cardona et al., 2006), genes (Smith et al., 1997) and nutrients (Kolasa & Zalewski, 1995) 23
between adjacent areas. Limits do not simply separate, but also connect areas, acting as filters 24
of varying permeability (Wiens et al., 1985). The concept of ecotones originated with the 25

15
recognition of “tension zones” between plant communities (Livingston, 1903) and the term 26
"ecotone" was first used in the beginning of the 20th century, referring to the “stress line that 27
connects the points of accumulated or abrupt change” (Clements, 1904). In this study, we 28
refer to ecotone as a “zone of transition between adjacent ecological systems having a set of 29
characteristics uniquely defined by space and time scales, and by the strength of the 30
interactions between adjacent ecological systems” (di Castri et al., 1988). 31
The structure of biological communities varies with the proximity to the ecotone (e.g., 32
Hofer et al., 2000; Menke, 2003a; Lloyd et al., 2012), and species richness in the ecotone can 33
be higher than, lower than, or similar to the adjacent areas (van der Maarel, 1990). 34
Understanding richness patterns in the ecotones also requires knowledge about the 35
biogeographic history of the areas, since on a regional scale the ecotones result from the 36
contact of regions with different histories (Nogués-Bravo & Martinez-Rica, 2004). One 37
widespread idea is that ecotones present higher diversity levels than adjacent areas, and are 38
thus of great value to conservation (Risser, 1995; Kirkman et al., 1998; Kernaghan & Harper, 39
2001). This would happen due to an additive process, in which the ecotone would be able to 40
support species from both areas (Senft, 2009). Contrary to this notion, some argue that the 41
diversity in ecotones can be lower, if local environmental conditions are suboptimal when 42
compared to the adjacent areas (Backeus, 1993b; Dangerfield et al., 2003). In this case, the 43
establishment and survival of species would be jeopardized (Temple, 1998). Besides species 44
richness, other diversity measures should vary spatially with proximity to an ecotone. For 45
instance, functional diversity (Tilman, 2001) and phylogenetic diversity (Faith, 1992) should 46
also be affected by this gradient. 47
The core-periphery hypothesis postulates that selective pressures will vary from the 48
core to the periphery of a biome (Safriel et al., 1994). This way, populations and 49
communities in the central regions would be structurally different from those in peripheral 50
16
regions (Garner et al., 2004; Blevins et al., 2011; Pandey & Rajora, 2012). In contrast to 51
ecotones, where the main pattern seems to be heterogeneity and instability (Kark & van 52
Rensburg, 2006), the central areas of a biome are stable (Safriel et al., 1994; Carnaval et al., 53
2009; Werneck et al., 2012). Stable areas allow for a more constant flow of resources, which 54
may result in higher niche specialization (Pianka, 1966; Futuyma & Moreno, 1988), while 55
unstable areas require the evolution of a wider tolerance to environmental variability 56
(Becking, 1968; Oindo, 2002). Besides being related to local diversity, stability can also 57
explain higher rates of endemism (Fjeldså et al., 1999) and lower rates of extinction 58
(Ricklefs, 2004). 59
The transition area between the Amazon and the Cerrado biomes is an extensive zone 60
of ecological tension in South America, formed by a mosaic of tropical savannas and forests 61
(Ratter et al., 1973; Ackerly et al., 1989b; Ratter, 1992). This mosaic is irregular in shape, 62
and presents unique features and different sizes along its length (Marimon et al., 2006). Also, 63
the transition zone coincides with a region known in Brazil as the „arc of deforestation‟, 64
which originates in the state of Maranhão and runs down along the south-eastern and 65
southern limits of the Amazon (Ferreira et al., 2005; Fearnside & Graça, 2006; Aldrich et al., 66
2012). This region is under great pressure due to the expansion of the agricultural frontier for 67
the establishment of soy plantations and cattle farms, specially in the states of Pará, Mato 68
Grosso and Rondônia (Fearnside, 2001; Laurance et al., 2004; Fearnside, 2006). The 69
conversion of native vegetation in the region has caused large scale environmental changes, 70
such as alterations in the flow of carbon and biomass (Nogueira et al., 2007), higher 71
emissions of greenhouse gases (Fearnside et al., 2009), and the extension of the dry season 72
(Costa & Pires, 2010). There is still little information about how vertebrate species are 73
distributed throughout the landscape in the region (Lacher & Alho, 2001), and the loss of 74
these areas will prevent us from detecting natural ecological processes that take place in the 75

17
ecotone (Marimon et al., 2006). Studies with plant communities in the Amazon-Cerrado 76
ecotone corroborate the hypotheses that (1) the ecotone presents higher diversity, through an 77
additive process (Ackerly et al., 1989b), and that (2) central and peripheral communities are 78
structurally different (Marimon et al., 2006). 79
Lizards are considered “model organisms” for ecological studies, since they present 80
desirable attributes such as high capturability, high abundance levels and low dispersal 81
capacity (Huey et al., 1983; Carothers et al., 1996; Pianka & Vitt, 2003; Camargo et al., 82
2010). They have been successfully studied in ecotonal areas (e.g., Hofer et al., 1999, 2000; 83
Menke, 2003a; Nogués-Bravo & Martinez-Rica, 2004; Urbina-Cardona et al., 2006) but 84
without a definite pattern: lizard diversity in transition zones can be higher than (Urbina-85
Cardona et al., 2006), lower than (Menke, 2003a) or similar to (Conroy, 1999; Nogués-Bravo 86
& Martinez-Rica, 2004) that in adjacent areas. Here, we assess how the ecotone isolates the 87
Amazon and the Cerrado, acting as a filter on the faunal exchange between these two 88
Neotropical biomes. We describe the observed patterns and investigate the processes 89
responsible for changes in lizard communities along a gradient from the core towards the 90
periphery of the two biomes. If the Amazon-Cerrado ecotone functions as an environmental 91
filter, isolating the biomes, we expect a reduction in diversity indices (richness, endemism, 92
functional diversity and phylogenetic diversity) as we get closer to the ecotone, from the core 93
to the periphery of both biomes. We hypothesize that the higher instability and environmental 94
heterogeneity of the ecotone should limit the establishment and survival of species typical of 95
each biome. 96
97
98
99
100

18
Methods 101
Study area 102
The Amazon and the Cerrado are, respectively, the two largest Brazilian biomes 103
(IBGE, 2004). Both are extremely heterogeneous, presenting different geological, 104
pedological and vegetational features within their geographic ranges (Eiten, 1972; Prance & 105
Lovejoy, 1985). The Cerrado originally covered 2 million km² or approximately 25% of the 106
Brazilian territory (IBGE, 2004). The climate is markedly seasonal, with a rainy season 107
between October and March, and a dry season between April and September. The mean 108
temperature varies between 22°C and 27°C, and the mean annual precipitation is 1500 mm. 109
The climate in Cerrado allows the establishment of forest vegetation in a large part of its 110
range (Oliveira-Filho & Ratter, 2002), but latosols poor in nutrients, with high aluminum 111
levels (Haridasan, 1982) and frequent fires (Miranda et al., 2002) determine the formation of 112
a savanic vegetation, characterized by abundant grasslands and fire-tolerant species 113
(Pennington et al., 2000). The Amazon covers 8 million km², with about 4.2 million km² in 114
the Brazilian territory (IBGE, 2004). With a wet tropical climate, the mean temperature 115
ranges between 24°C and 26°C, and the mean annual precipitation is 2300 mm (Fisch et al., 116
1998). Overall, the Amazon presents an acidic and poor soil, which is a limiting factor to 117
forest productivity (Cunha et al., 2007). However, the lack of nutrients in the soil is 118
counterbalanced by a rich leaf litter, which, together with high temperatures and pluviosity, is 119
able to maintain a productive and diverse system (Schuur, 2003; Moreira & Costa, 2004). 120
121
Data gathering and processing 122
The data relative to the characterization of lizard communities used in this study 123
derived from field work and the literature (Appendix 1, Table A1). We selected sampling 124
points located in the Amazon and in the Cerrado, where sampling was performed using 125

19
similar methods and efforts (active search and pitfall traps with drift fences, for at least three 126
weeks in each location). The expressions used in the boolean search of the literature were 127
"lizard AND Amazon", "lizard AND Cerrado", "reptile AND Amazon", "reptile AND 128
Cerrado", herpetofauna AND Amazon" and "herpetofauna AND Cerrado, both in english and 129
in portuguese. To evaluate variations in richness, endemism rates, and functional and 130
phylogenetic diversities, we considered differences in community composition. The list of 131
endemic species in both biomes followed recent syntheses (Nogueira et al., 2011; Ribeiro 132
Júnior, 2013). The environmental variables we used are available from the WorldClim 133
(Hijmans et al., 2005) and the Atlas of the Biosphere (used by permission of The Center for 134
Sustainability and the Global Environment, Nelson Institute for Environmental Studies, 135
University of Wisconsin-Madison) projects, and correspond to temperature, precipitation, 136
altitude, evapotranspiration, primary productivity, soil moisture and potential vegetation (a 137
categorical variable which corresponds to the land cover type that would exist in a gridcell 138
had humans not interfered). The limits of the Cerrado and brazilian Amazon are those 139
proposed by IBGE, 2004. The limits of the Amazon outside Brazil follows (Olson et al., 140
2001). The distance of each sampling point to the ecotone line and to biome centroids were 141
calculated with ArcGIS version 9.3 (ESRI, 2009). The centroid corresponds to the 142
geographical centre of each biome. 143
144
Analyses 145
The relationship between the diversity indices and Amazon-Cerrado ecotone were 146
determined by correlation analyses conducted between each index and the distance of each 147
sampling point to the ecotone and to the centroid of each biome. Since most variable pairs 148
did not present a normal distribution (verified by a Shapiro-Wilk test), we used the non-149
20
parametric Spearman‟s correlation index (). For those pairs which did present a normal 150
distribution, we used the Pearson correlation index (r). 151
To generate measures of functional diversity, we characterized each species according 152
to its morphology and resource use, using on the following traits: size (maximum snout-vent 153
length), presence of sexual dimorphism, habitat (open or closed vegetation), microhabitat 154
(arboreal, leaf litter, fossorial, terrestrial, saxicolous, semi-arboreal and semi-aquatic), diet 155
(carnivore or herbivore), foraging behavior (active search, sit-and-wait, or both), activity 156
pattern (diurnal or nocturnal), reproduction strategy (oviparous or viviparous), maximum 157
clutch size, temperature regulation strategy (thermoconformer or thermoregulator) and mean 158
activity temperature. These traits represent the species‟ functional aspects in relation to the 159
ecosystem. This information was obtained from the literature (Supplementary material 160
Appendix 2, Table A2). We calculated the functional diversity of each community based on 161
the index of functional richness (FRic) (Villéger et al., 2008), because it is more sensible to 162
the structuring of communities than richness itself (Mouchet et al., 2010). It is obtained by 163
calculating the volume occupied by a specific community in a n-dimensional space, relative 164
to the functional traits used in the analysis (Cornwell et al., 2006; Villéger et al., 2008). For 165
this step in the analysis, we used the package FD (Laliberté & Legendre, 2010; Laliberté & 166
Shipley, 2011a) in program R (R Core Team, 2014). 167
The phylogenetic diversity index of a community represents the relationship between 168
the number of species and the phylogenetic distance between them (Faith, 1992). This index 169
can be obtained by estimating the topological distance separating species in a phylogenetic 170
tree (Webb, 2000), and can be used to analyze the ecological processes that structure a 171
community (Webb et al., 2002). In this study, we used a measure of phylogenetic diversity 172
(PD) calculated by the sum of the branch lengths of the phylogenetic tree separating species 173
in a given community (Faith, 1992). Long branch lengths correspond to longer evolutionary 174

21
time, and consequently, more distinct taxonomic groups (Cianciaruso et al., 2009). Using 175
program Mesquite 2.75 (Maddison & Maddison, 2011), and based on recent phylogenies 176
(D'Angiolella et al., 2011; Harvey et al., 2012; Giugliano et al., 2013a; Pyron et al., 2013), 177
we built a phylogenetic tree that encompasses all species included in this study. We obtained 178
branch lengths from Pyron et al. (2013), which covers 96 of the 123 species used here. The 179
branch lengths uniting the remaining taxa to the tree were estimated by ultrametric distances. 180
We used package picante (Kembel et al., 2010) in program R (R Core Team, 2014) to 181
calculate PD values for each community. 182
To investigate the processes responsible for the observed patterns along the gradient, 183
we conducted a canonical correspondence analysis (CCA) (Ter Braak, 1986) relating the 184
species composition in the sampled communities and the environmental variables for each 185
location. The CCA is an ordination exploratory analysis that is being successfully used for 186
investigating species variation across environmental gradients (Hofer et al., 2000; Kernaghan 187
& Harper, 2001; Vitt et al., 2007). The CCA associates the variation in the lizard community 188
composition matrix (dependent variable) to the environmental variables matrix (independent 189
variable). Beforehand, we performed a selection of environmental variables that most 190
influenced community composition, by comparing CCA models based on the Akaike 191
Information Criterion (AIC). The matrix for the dependent variables was structured with each 192
lizard species as columns and each sampling location as lines, and the presence/absence of a 193
species in a location was coded as 1/0, respectively. The matrix for the independent variables 194
was structured with the environmental variables as columns and locations as lines, and filled 195
out by the values of each variable in the sampling locations. To test the significance of the 196
CCA results, we performed a Monte Carlo permutation test, with 1,000 iterations, using 197
package vegan (Oksanen et al., 2013) in program R (R Core Team, 2014). 198
199
22
Results 200
We had access to data from 118 communities, but to work with only high quality data 201
(larger sampling efforts and reliability in species identification), the total number was 202
reduced to 46 communities, from both the Amazon and the Cerrado (Fig. 1, Table 1). Overall 203
in these communities, 11,519 lizard specimens were collected, from 123 species and 13 204
families (Fig. 2). The obtained values of richness, endemism, functional diversity and 205
phylogenetic diversity are presented in Table 1. It is noteworthy that endemic species from 206
both biomes were found in those communities close to the ecotone. 207
For the Amazon, significant correlations were obtained which related distance to the 208
ecotone with richness ( = 0.436 and P = 0.013), with biome endemism ( = 0.677 and P < 209
0.001), with phylogenetic diversity ( = 0.596 and P < 0.001), with functional diversity ( = 210
0.403 and P = 0.023), and also those which related distance to the centroid with biome 211
endemism ( = -0.563 and P < 0.001) and with phylogenetic diversity (r = -0.375 and P = 212
0.034) (Fig. 3). Overall, the diversity indices presented a positive relationship with distance 213
to the ecotone and a negative relationship with distance to the biome centroid, which means 214
that as the distance from the ecotone increases, lizard diversity increases. 215
For the Cerrado, the significant correlations observed related distance to the ecotone 216
with biome endemism ( = 0.468 and P = 0.018), phylogenetic diversity ( = 0.407 and P = 217
0.045) and functional diversity ( = 0.535 and P = 0.007) (Fig. 4). No statistically significant 218
correlation between distance to the centroid and the measures of diversity was obtained. 219
However, in those significant relationships, we observed the same general pattern as for the 220
Amazon, in which diversity indices tended to be higher with increased distance to the 221
ecotone. 222
Model selection indicated that the most influential variables on lizard distributions are 223
potential vegetation, soil moisture, mean daily temperature range, as well as extreme 224
23
temperature values, such as mean temperature from the hottest and coldest quarters, and 225
mean precipitation of the hottest quarter. The Monte Carlo permutations revealed a 226
significant relationship between the environmental variables selected and the structure of 227
lizard communities (F = 2.440 and P < 0.001). The CCA (Fig. 5) indicated that Amazonian 228
endemic species, typically from forest habitats, tended to group together towards the right 229
end of the first CCA axis, characterized by higher values of soil moisture and temperatures 230
from the hottest and coldest quarters. Cerrado endemic species grouped together towards the 231
left end of the first CCA axis, being associated with drier soils, higher daily temperature 232
range, and lower values of temperature and precipitation. Widespread species were scattered 233
across the graphic area, demonstrating their ability to occupy both biomes. 234
235
Discussion 236
Our results demonstrate that the Amazon-Cerrado ecotone influences negatively the 237
diversity of lizard communities. Even though the idea of a greater diversity in ecotones is 238
more broadly accepted and corroborated in the literature (Risser, 1995; Kirkman et al., 1998; 239
Kernaghan & Harper, 2001), this work, along with a few other studies, refutes this hypothesis 240
(Backeus, 1993b; Dangerfield et al., 2003). Despite the low diversity indices for lizards, 241
ecotonal areas can harbor genetically diverse populations (Garner et al., 2004; Blevins et al., 242
2011; Pandey & Rajora, 2012), resistant to environmental changes (Parsons, 1990) and are 243
able to survive in unstable environments. In the face of the predicted global climate changes, 244
transition zones could prove to be an important genetic repository (Killeen & Solórzano, 245
2008). 246
The transition zone seems to act as an environmental filter, and does not allow species 247
that are endemic or typical from closed/open habitats to advance into the other biome. 248
However, the presence of endemic species of both biomes in ecotonal communities is 249

24
evidence that this zone can support species from either closed or open environments, 250
although it does not sustain comparably high lizard diversity levels. This lower diversity can 251
be explained by the fact that, in large scales of space and time, the ecotone seems to be an 252
unstable zone (Haffer, 1969; Werneck et al., 2012). This instability can turn the ecotone into 253
an unfavorable area to species colonization and permanence (van der Maarel, 1990). In large 254
biogeographic scales, ecotones can act as population sinks (Woodroffe & Ginsberg, 1998), 255
where some species are at the edge of their distributions. The fitness of marginal populations 256
is expected to be lower than that of central populations (Haak et al., 2010; Zhigalskii, 2011), 257
and this would affect the establishment and survival rates of the species, and the community 258
structure as a whole (Temple, 1998). One way in which ecotones would present higher 259
diversity levels is by harboring ecotonal species (Jose et al., 1996), which would be adapted 260
to the intermediate conditions found in the transition zone and would present an abundance 261
peak or even be endemic to the ecotone (Walker et al., 2003). However, in this study, no 262
species with these characteristics were identified in the Amazon-Cerrado transition zone. 263
The results obtained for the Amazon indicate that all diversity indices analyzed were 264
positively correlated with distance to the ecotone, and two indices (biome endemism and 265
phylogenetic diversity) were negatively correlated with distance to the biome's centroid. 266
Correlation indices varied between 0.37 and 0.67, suggesting that there must be factors other 267
than distance that may also be influencing lizard community structure. This is perfectly 268
intuitive, since distances to the ecotone and to the centroid simply summarize a shift in 269
environmental conditions along the gradient. What remains clear is that the diversity indices 270
tend to decrease with proximity to the ecotone. These results corroborate our predictions, 271
despite some works that suggest higher diversity at disturbed areas due to a higher 272
environmental heterogeneity, which would promote the establishment and occupation of 273
more ecological niches (Biswas & Mallik, 2010; Carreño-Rocabado et al., 2012). By 274

25
observing the opposite, we can suppose that this heterogeneity hinders the establishment of 275
species typical from either biomes, and only those species that are generalists or resistant to 276
environmental variations would be able to occupy the transition zone (Devictor et al., 2008). 277
Another explanation, which would contribute to the understanding of the distribution of 278
species along the ecotonal gradient, is the Pleistocene Refugia hypothesis. Firstly proposed 279
by Haffer (1969) and Vanzolini & Williams (1970), this hypothesis suggests that climatic 280
oscillations in the Quaternary would have led to expansions and contractions of forest areas. 281
These events would isolate and concentrate species in forest islands with stable climatic 282
conditions (refugia), in times when conditions outside them were unsuitable for the survival 283
of the species (Simpson & Haffer, 1978). Refugia would have been concentrated in the core 284
of the biome, while peripheral areas would have been subject to a greater instability in 285
geological time scales. Despite being strongly discussed and criticized (Colinvaux et al., 286
2000; Bush & Oliveira, 2006; Haffer, 2008), this hypothesis has gained support in recent 287
studies involving biogeography and phylogeography (Peterson & Nyari, 2008; Carnaval et 288
al., 2009). Also, palynological and isotopic studies show that the peripheral areas have 289
undergone vegetation changes(Servant et al., 1993; Desjardins et al., 1996), suggesting that 290
the extent of forest and savanna have varied during the geological time and supporting the 291
notion of instability in the ecotone. 292
For the Cerrado, results obtained were similar, although less significant. Only three 293
correlations were statistically significant, and in all of them a positive relationship between 294
the diversity indices and distance to the ecotone were observed. The same way as for the 295
Amazon, correlation indices were not very high, varying between 0.40 and 0.53, indicating 296
that other factors apart from the distance should also be responsible for variations in diversity 297
levels. There were no significant correlations between the diversity indices and distance to 298
the centroid. This can be due to the central position of the biome in South America, which 299

26
brings the Cerrado in contact with other Brazilian biomes (Amazon, Caatinga, Atlantic Forest 300
and Pantanal) and create other ecotonal zones not considered in this study. Stable zones can 301
also explain a higher diversity in central areas of the Cerrado. Recently, stable climatic areas 302
have been proposed for the Cerrado and for other open habitat areas in South America 303
(Werneck et al., 2011; Werneck et al., 2012). These areas correspond to regions in the 304
Cerrado that have maintained stable environmental conditions for at least 120,000 years. The 305
area where the Amazon-Cerrado ecotone is located today seems to be an unstable area 306
(Werneck et al., 2012), and must have undergone expansion and contraction events in both 307
savanna and forest areas. Studies on the biogeography of Cerrado squamates corroborate our 308
results, indicating that the area of contact with the Amazon tends to be less species–rich than 309
the core of the biome (Costa et al., 2007), and that endemic species are more associated with 310
open habitats, while forest areas (in the ecotone and in gallery forests) play a role in faunal 311
exchange with other biomes (Nogueira et al., 2011). 312
In this study, the ordination by the CCA was able to clearly distinguish two groups of 313
species (from open and from forest habitats), and associate them to variables that influenced 314
this clustering the most. In continental scales, energy–related variables are usually thought of 315
as predominant factors in explaining diversity patterns (Wright, 1983; Currie, 1991). Despite 316
being present in our initial pool of environmental variables, these energy–related variables 317
(net primary productivity, evapotranspiration, and potential evapotranspiration) were not 318
selected to compose the final model. The variables which better explained the variation in 319
community structure are intimately linked to the environmental differences between the two 320
biomes and to the lizards‟ natural history. Potential vegetation is the most apparent difference 321
between forest and savanna physiognomies, exerting a direct influence on the faunal 322
composition of these regions (Cavalcanti, 1992; Conroy, 1999). The mean daily temperature 323
range also differs clearly between both biomes. While in the Amazon the mean daily 324

27
temperature variation is 5 ºC, ranging between 25 °C at night and 30 °C during the day 325
(Jacob & Wofsy, 1988), the Cerrado presents a far greater daily temperature range, with a 326
mean of 12 °C (Hijmans et al., 2005). Soil moisture directly influences the microhabitat 327
occupied by many lizard species and is important in the selection of sites for oviposition and 328
egg incubation (Christian et al., 1991; Warner & Andrews, 2002; Marco et al., 2004). 329
Besides, soil moisture is an important limiting factor for vegetation growth (Li et al., 2013) 330
and will vary greatly in an ecotonal gradient (Pockman & Small, 2010). The selection of 331
temperature in the driest and coldest quarters and precipitation in the hottest quarter by the 332
analysis highlights the lizard species‟ need to adapt to seasonality in these environments. 333
While the Cerrado presents a highly seasonal climate, the seasonality in the Amazon is 334
lessened, and this distinction can be perceived along the ecotonal gradient (da Rocha et al., 335
2009). These differences put a selective pressure on the communities, which will 336
consequently influence species composition. 337
Overall, this study demonstrates that lizard communities in the Amazon and in the 338
Cerrado follow a pattern of diversity loss with proximity to the ecotone, which is determined 339
by a process of environmental filtering and possibly influenced by historical factors. 340
However, the Amazon-Cerrado ecotone is still poorly studied and its location in the Brazilian 341
„arc of deforestation‟ renders our knowledge of its natural patterns and processes even more 342
difficult. We thus highlight that future studies concerning the dynamics and genetics of the 343
populations along the gradient would be interesting for further understanding the ecotonal 344
dynamics. 345
346
Acknowledgements – PTD was supported by a graduate fellowship from Conselho Nacional 347
de Desenvolvimento Científico e Tecnológico – CNPq. GRC thanks Coordenação de 348

28
Aperfeiçoamento de Pessoal de Nível Superior – CAPES, CNPq, and Fundação de Apoio à 349
Pesquisa do Distrito Federal – FAPDF for financial support. 350
351
352
References 353
Ackerly, D.D., Thomas, W.W., Ferreira, C.A.C. & Pirani, J.R. (1989a) The Forest-Cerrado 354
Transition Zone in Southern Amazonia - Results of the 1985 Projeto Flora Amazonica 355
Expedition to Mato-Grosso. Brittonia, 41, 113-128. 356
Ackerly, D.D., Thomas, W.W., Ferreira, C.A.C. & Pirani, J.R. (1989b) The forest-cerrado 357
transition zone in southern Amazonia: Results of the 1985 Projeto Flora Amazônica 358
expedition to Mato Grosso. Brittonia, 41, 113-128. 359
Aldrich, S., Walker, R., Simmons, C., Caldas, M. & Perz, S. (2012) Contentious land change 360
in the Amazon's arc of deforestation. Annals of the Association of American 361
Geographers, 102, 103-128. 362
Ávila, R.W. & Kawashita-Ribeiro, R.A. (2011) Herpetofauna of São João da Barra 363
Hydroelectric Plant, state of Mato Grosso, Brazil. Check List, 7, 750-755. 364
Backeus, I. (1993a) Ecotone Versus Ecocline - Vegetation Zonation and Dynamics around a 365
Small Reservoir in Tanzania. Journal of Biogeography, 20, 209-218. 366
Backeus, I. (1993b) Ecotone versus ecocline: vegetation zonation and dynamics around a 367
small reservoir in Tanzania. Journal of Biogeography, 20, 209-218. 368
Becking, R. (1968) Vegetational response to change in environment and change in species 369
tolerance with time. Vegetatio, 16, 135-158. 370
Bernarde, P.S., Machado, R.A. & Turci, L.C.B. (2011) Herpetofauna da área do Igarapé 371
Esperança na Reserva Extrativista Riozinho da Liberdade, Acre – Brasil. Biota 372
Neotropica, 11, 117-144. 373

29
Bernardo, P.H., Guerra-Fuentes, R.A., Matiazzi, W. & Zaher, H. (2012) Checklist of 374
amphibians and reptiles of Reserva Biológica do Tapirapé, Pará, Brazil. Check List, 8, 375
839-846. 376
Biswas, S.R. & Mallik, A.U. (2010) Disturbance effects on species diversity and functional 377
diversity in riparian and upland plant communities. Ecology, 91, 28-35. 378
Blevins, E., Wisely, S.M. & With, K.A. (2011) Historical processes and landscape context 379
influence genetic structure in peripheral populations of the Collared Lizard 380
(Crotaphytus collaris). Landscape Ecology, 26, 1125-1136. 381
Bush, M.B. & Oliveira, P.E.d. (2006) The rise and fall of the Refugial Hypothesis of 382
Amazonian speciation: a paleoecological perspective. Biota Neotropica, 6, 0-0. 383
Camargo, A., Sinervo, B. & Sites, J.W., Jr. (2010) Lizards as model organisms for linking 384
phylogeographic and speciation studies. Molecular Ecology, 19, 3250-70. 385
Carnaval, A.C., Hickerson, M.J., Haddad, C.F., Rodrigues, M.T. & Moritz, C. (2009) 386
Stability predicts genetic diversity in the Brazilian Atlantic forest hotspot. Science, 387
323, 785-9. 388
Carothers, J.H., Jaksic, F.M. & Marquet, P.A. (1996) A model for species distributions along 389
a gradient: Lizards as study systems. Revista Chilena de Historia Natural, 69, 301-390
307. 391
Carreño-Rocabado, G., Peña-Claros, M., Bongers, F., Alarcón, A., Licona, J.-C. & Poorter, 392
L. (2012) Effects of disturbance intensity on species and functional diversity in a 393
tropical forest. Journal of Ecology, 100, 1453-1463. 394
Cavalcanti, R.B. (1992) The importance of forest edges in the ecology of open country 395
Cerrado birds. The Nature and Dynamics of Forest-Savanna Boundaries (ed. by P.A. 396
Furley, J. Proctor and J.A. Ratter), pp. 513-518. Chapman and Hall, Cambridge. 397

30
Christian, K.A., Lawrence, W.T. & Snell, H.L. (1991) Effect of soil moisture on yolk and fat 398
distribution in hatchling lizards from natural nests. Comparative Biochemistry and 399
Physiology Part A: Physiology, 99, 13-19. 400
Cianciaruso, M.V., Silva, I.A. & Batalha, M.A. (2009) Diversidades filogenética e funcional: 401
novas abordagens para a ecologia de comunidades. Biota Neotropica, 9, 93-103. 402
Clements, F.E. (1904) The Development and Structure of Vegetation. The Botanical Seminar, 403
Lincoln, Nebraska. 404
Cole, C.J., Townsend, C.R., Reynolds, R.P., MacCulloch, R.D. & Lathrop, A. (2013) 405
Amphibians and reptiles of Guyana, South America: Illustrated keys, annotated 406
species accounts, and a biogeographic synopsis. Proceedings of the Biological Society 407
of Washington, 125, 317-578. 408
Colinvaux, P.A., De Oliveira, P.E. & Bush, M.B. (2000) Amazonian and Neotropical plant 409
communities on glacial time-scales: The failure of the aridity and refuge hypotheses. 410
Quaternary Science Reviews, 19, 141-169. 411
Conroy, S. (1999) Lizard assemblage response to a forest ecotone in northeastern Australia: 412
A synecological approach. Journal of Herpetology, 33, 409-419. 413
Cornwell, W.K., Schwilk, L.D. & Ackerly, D.D. (2006) A trait-based test for habitat 414
filtering: convex hull volume. Ecology, 87, 1465-71. 415
Costa, G.C., Nogueira, C., Machado, R.B. & Colli, G.R. (2007) Squamate richness in the 416
Brazilian Cerrado and its environmental-climatic associations. Diversity and 417
Distributions, 13, 714-724. 418
Costa, M.H. & Pires, G.F. (2010) Effects of Amazon and Central Brazil deforestation 419
scenarios on the duration of the dry season in the arc of deforestation. International 420
Journal of Climatology, 30, 1970-1979. 421

31
Cunha, T.J.F., Madari, B.E., Benites, V.d.M., Canellas, L.P., Novotny, E.H., Moutta, R.d.O., 422
Trompowsky, P.M. & Santos, G.d.A. (2007) Fracionamento químico da matéria 423
orgânica e características de ácidos húmicos de solos com horizonte a antrópico da 424
amazônia (Terra Preta). Acta Amazonica, 37, 91-98. 425
Currie, D.J. (1991) Energy and large-scale patterns of animal- and plant-species richness. The 426
American Naturalist, 137, 27-49. 427
D'Angiolella, A.B., Gamble, T., Avila-Pires, T.C.S., Colli, G.R., Noonan, B.P. & Vitt, L.J. 428
(2011) Anolis chrysolepis Duméril and Bibron, 1837 (Squamata: Iguanidae), 429
revisited: molecular phylogeny and taxonomy of the Anolis chrysolepis species group. 430
Bulletin of the Museum of Comparative Zoology, 160, 35-63. 431
da Rocha, H.R., Manzi, A.O., Cabral, O.M., Miller, S.D., Goulden, M.L., Saleska, S.R., R.-432
Coupe, N., Wofsy, S.C., Borma, L.S., Artaxo, P., Vourlitis, G., Nogueira, J.S., 433
Cardoso, F.L., Nobre, A.D., Kruijt, B., Freitas, H.C., von Randow, C., Aguiar, R.G. & 434
Maia, J.F. (2009) Patterns of water and heat flux across a biome gradient from 435
tropical forest to savanna in Brazil. Journal of Geophysical Research: 436
Biogeosciences, 114, G00B12. 437
Dangerfield, J.M., Pik, A.J., Britton, D., Holmes, A., Gillings, M., Oliver, I., Briscoe, D. & 438
Beattie, A.J. (2003) Patterns of invertebrate biodiversity across a natural edge. Austral 439
Ecology, 28, 227-236. 440
Desjardins, T., Filho, A.C., Mariotti, A., Girardin, C. & Chauvel, A. (1996) Changes of the 441
forest-savanna boundary in Brazilian Amazonia during the Holocene revealed by 442
stable isotope ratios of soil organic carbon. Oecologia, 108, 749-756. 443
Devictor, V., Julliard, R. & Jiguet, F. (2008) Distribution of specialist and generalist species 444
along spatial gradients of habitat disturbance and fragmentation. Oikos, 117, 507-514. 445

32
di Castri, F., Hansen, A.J. & Holland, M.M. (1988) A new look at ecotones: emerging 446
international projects on landscape boundaries. Biology International, Special Issue 447
17, 1-163. 448
Eiten, G. (1972) The cerrado vegetation of Brazil. The Botanical Review, 38, 201-341. 449
Erdós, L., Zalatnai, M., Morschhauser, T., Bátori, Z. & Körmöczi, L. (2011) On the terms 450
related to spatial ecological gradients and boundaries. Acta Biologica Szegediensis, 451
55, 279-287. 452
ESRI (2009) ArcGIS 9.3. ESRI (Environmental Systems Resource Institute), Redlands, 453
California. 454
Faith, D.P. (1992) Conservation evaluation and phylogenetic diversity. Biological 455
Conservation, 61, 1-10. 456
Fearnside, P.M. (2001) Soybean cultivation as a threat to the environment in Brazil. 457
Environmental Conservation, 28, 23-38. 458
Fearnside, P.M. (2006) Desmatamento na Amazônia: dinâmica, impactos e controle. Acta 459
Amazonica, 36, 395-400. 460
Fearnside, P.M. & Graça, P.M.L.A. (2006) BR-319: Brazil's Manaus-Porto Velho highway 461
and the potential impact of linking the arc of deforestation to central Amazonia. 462
Environmental Management, 38, 705-716. 463
Fearnside, P.M., Righi, C.A., Graca, P.M.L.D., Keizer, E.W.H., Cerri, C.C., Nogueira, E.M. 464
& Barbosa, R.I. (2009) Biomass and greenhouse-gas emissions from land-use change 465
in Brazil's Amazonian "arc of deforestation": The states of Mato Grosso and 466
Rondônia. Forest Ecology and Management, 258, 1968-1978. 467
Ferreira, L.V., Venticinque, E. & Almeida, S. (2005) O desmatamento na Amazônia e a 468
importância das áreas protegidas. Estudos Avançados, 19, 157-166. 469
33
Fisch, G., Marengo, J.A. & Nobre, C.A. (1998) Uma revisão geral sobre o clima da 470
Amazônia. Acta Amazônica, 28, 101-126. 471
Fjeldså, J., Lambin, E. & Mertens, B. (1999) Correlation between endemism and local 472
ecoclimatic stability documented by comparing Andean bird distributions and 473
remotely sensed land surface data. Ecography, 22, 63-78. 474
Futuyma, D.J. & Moreno, G. (1988) The evolution of ecological specialization. Annual 475
Review of Ecology and Systematics, 19, 207-233. 476
Gainsbury, A.M. & Colli, G.R. (2003) Lizard assemblages from natural cerrado enclaves in 477
southwestern Amazonia: The role of stochastic extinctions and isolation. Biotropica, 478
35, 503-519. 479
Gardner, T.A., Ribeiro-Júnior, M.A., Barlow, J., Ávila-Pires, T.C.S., Hoogmoed, M.S. & 480
Peres, C.A. (2007) The value of primary, secondary, and plantation forests for a 481
Neotropical herpetofauna. Conservation Biology, 21, 775-787. 482
Garner, T.W., Pearman, P.B. & Angelone, S. (2004) Genetic diversity across a vertebrate 483
species' range: a test of the central-peripheral hypothesis. Molecular ecology, 13, 484
1047-53. 485
Giugliano, L.G., de Campos Nogueira, C., Valdujo, P.H., Collevatti, R.G. & Colli, G.R. 486
(2013a) Cryptic diversity in South American Teiinae (Squamata, Teiidae) lizards. 487
Zoologica Scripta, 42, 473-487. 488
Giugliano, L.G., de Campos Nogueira, C., Valdujo, P.H., Collevatti, R.G. & Colli, G.R. 489
(2013b) Cryptic diversity in South American Teiinae (Squamata, Teiidae) lizards. 490
Zoologica Scripta, n/a-n/a. 491
Haak, A.L., Williams, J.E., Neville, H.M., Dauwalter, D.C. & Colyer, W.T. (2010) 492
Conserving Peripheral Trout Populations: the Values and Risks of Life on the Edge. 493
Fisheries, 35, 530-549. 494

34
Haffer, J. (1969) Speciation in Amazonian forest birds. Science, 165, 131-137. 495
Haffer, J. (2008) Hypotheses to explain the origin of species in Amazonia. Brazilian Journal 496
of Biology, 68, 917-947. 497
Haridasan, M. (1982) Aluminium accumulation by some cerrado native species of central 498
Brazil. Plant and Soil, 65, 265-273. 499
Harvey, M.B., Ugueto, G.N. & Gutberlet, R.L. (2012) Review of teiid morphology with a 500
revised taxonomy and phylogeny of the Teiidae (Lepidosauria: Squamata). Zootaxa, 501
1-156. 502
Hijmans, R.J., Cameron, S.E., Parra, J.L., Jones, P.G. & Jarvis, A. (2005) Very high 503
resolution interpolated climate surfaces for global land areas. International Journal of 504
Climatology, 25, 1965-1978. 505
Hofer, U., Bersier, L.F. & Borcard, D. (1999) Spatial organization of a herpetofauna on an 506
elevational gradient revealed by null model tests. Ecology, 80, 976-988. 507
Hofer, U., Bersier, L.F. & Borcard, D. (2000) Ecotones and gradient as determinants of 508
herpetofaunal community structure in the primary forest of Mount Kupe, Cameroon. 509
Journal of Tropical Ecology, 16, 517-533. 510
Huey, R.B., Pianka, E.R. & Schoener, T.W. (1983) Lizard Ecology: Studies of a Model 511
Organism. Harvard University Press, Cambridge. 512
IBGE (2004) Mapa de Biomas do Brasil. In. Instituto Brasileiro de Geografia e Estatística, 513
Rio de Janeiro. 514
Ilha, P. & Dixo, M. (2010) Anurans and lizards, Rio Preto da Eva, Amazonas, Brazil. Check 515
List, 6, 17-21. 516
Jacob, D.J. & Wofsy, S.C. (1988) Photochemistry of biogenic emissions over the Amazon 517
forest. Journal of Geophysical Research: Atmospheres, 93, 1477-1486. 518

35
Jose, S., Gillespie, A.R., George, S.J. & Kumar, B.M. (1996) Vegetation responses along 519
edge-to-interior gradients in a high altitude tropical forest in peninsular India. Forest 520
Ecology and Management, 87, 51-62. 521
Kark, S. & van Rensburg, B.J. (2006) Ecotones: marginal or central areas of transition? 522
Israel Journal of Ecology & Evolution, 52, 29-53. 523
Kembel, S.W., Cowan, P.D., Helmus, M.R., Cornwell, W.K., Morlon, H., Ackerly, D.D., 524
Blomberg, S.P. & Webb, C.O. (2010) Picante: R tools for integrating phylogenies and 525
ecology. Bioinformatics, 26, 1463-4. 526
Kernaghan, G. & Harper, K.A. (2001) Community structure of ectomycorrhizal fungi across 527
an alpine/subalpine ecotone. Ecography, 24, 181-188. 528
Killeen, T.J. & Solórzano, L.A. (2008) Conservation strategies to mitigate impacts from 529
climate change in Amazonia. Philosophical Transactions of the Royal Society B: 530
Biological Sciences, 363, 1881-1888. 531
Kirkman, L.K., Drew, M.B., West, L.T. & Blood, E.R. (1998) Ecotone characterization 532
between upland longleaf pine/wiregrass stands and seasonally-ponded isolated 533
wetlands. Wetlands, 18, 346-364. 534
Kolasa, J. & Zalewski, M. (1995) Notes on ecotone attributes and functions. Hydrobiologia, 535
303, 1-7. 536
Lacher, T.E. & Alho, C.J.R. (2001) Terrestrial small mammal richness and habitat 537
associations in an Amazon Forest-Cerrado contact zone. Biotropica, 33, 171-181. 538
Laliberté, E. & Legendre, P. (2010) A distance-based framework for measuring functional 539
diversity from multiple traits. Ecology, 91, 299-305. 540
Laliberté, E. & Shipley, B. (2011a) FD: measuring functional diversity from multiple traits, 541
and other tools for functional ecology. R package version 1.0-11. 542
36
Laliberté, E. & Shipley, B. (2011b) FD: measuring functional diversity from multiple traits, 543
and other tools for functional ecology. 544
Laurance, W.F., Albernaz, A.K.M., Fearnside, P.M., Vasconcelos, H.L. & Ferreira, L.V. 545
(2004) Deforestation in Amazonia. Science, 304, 1109-1109. 546
Li, H., Shen, W., Zou, C., Jiang, J., Fu, L. & She, G. (2013) Spatio-temporal variability of 547
soil moisture and its effect on vegetation in a desertified aeolian riparian ecotone on 548
the Tibetan Plateau, China. Journal of Hydrology, 479, 215-225. 549
Livingston, B.E. (1903) The Distribution of the Upland Plant Societies of Kent County, 550
Michigan. Botanical Gazette, 35, 36-55. 551
Lloyd, H., Rios, S.S., Marsden, S.J. & Valdes-Velasquez, A. (2012) Bird community 552
composition across an Andean tree-line ecotone. Austral Ecology, 37, 470-478. 553
Macedo, L.C., Bernarde, P.S. & Abe, A.S. (2008) Lagartos (Squamata: Lacertilia) em áreas 554
de floresta e de pastagem em Espigão do Oeste, Rondônia, sudoeste da Amazônia, 555
Brasil. Biota Neotropica, 8, 133-139. 556
Maddison, W.P. & Maddison, D.R. (2011) Mesquite: a modular system for evolutionary 557
analysis. http://mesquiteproject.org. 558
Marco, A., Díaz-Paniagua, C. & Hidalgo-Vila, J. (2004) Influence of egg aggregation and 559
soil moisture on incubation of flexible-shelled lacertid lizard eggs. Canadian Journal 560
of Zoology, 82, 60-65. 561
Marimon, B.S., De S. Lima, E., Duarte, T.G., Chieregatto, L.C. & Ratter, J.A. (2006) 562
Observations on the Vegetation of Northeastern Mato Grosso, Brazil. Iv. An Analysis 563
of the Cerrado–Amazonian Forest Ecotone. Edinburgh Journal of Botany, 63, 323. 564
Mendes-Pinto, T.J. & Tello, J.C.R. (2010) Répteis Squamata de uma área de savana no oeste 565
do estado do Pará, Brasil. Revista de Ciências Ambientais, 4, 19-35. 566

37
Mendes-Pinto, T.J. & Souza, S.M. (2011) Preliminary assessment of amphibians and reptiles 567
from Floresta Nacional do Trairão, with a new snake record for the Pará state, 568
Brazilian Amazon. Salamandra, 47, 199-206. 569
Menke, S.B. (2003a) Lizard community structure across a grassland - creosote bush ecotone 570
in the Chihuahuan Desert. Canadian Journal of Zoology, 81, 1829-1838. 571
Menke, S.B. (2003b) Lizard community structure across a grassland - creosote bush ecotone 572
in the Chihuahuan Desert. Canadian Journal of Zoology-Revue Canadienne De 573
Zoologie, 81, 1829-1838. 574
Miranda, H.S., Bustamante, M.M.C. & Miranda, A.C. (2002) The fire factor. The Cerrados 575
of Brazil. Ecology and Natural History of a Neotropical Savanna (ed. by P.S. Oliveira 576
and R.J. Marquis), pp. 51-68. Columbia University Press, New York. 577
Morais, A.R., Bastos, R.P., Vieira, R. & Signorelli, L. (2012) Herpetofauna of the Floresta 578
Nacional de Silvânia, a Cerrado remnant in central Brazil. Neotropical Biology and 579
Conservation, 7, 114-121. 580
Moreira, A. & Costa, D.G. (2004) Dinâmica da matéria orgânica na recuperação de clareiras 581
da floresta amazônica. Pesquisa Agropecuária Brasileira, 39, 1013-1019. 582
Mouchet, M.A., Villéger, S., Mason, N.W.H. & Mouillot, D. (2010) Functional diversity 583
measures: an overview of their redundancy and their ability to discriminate 584
community assembly rules. Functional Ecology, 24, 867-876. 585
Nogueira, C., Valdujo, P.H. & Franca, F.G.R. (2005) Habitat variation and lizard diversity in 586
a Cerrado area of central Brazil. Studies on Neotropical Fauna and Environment, 40, 587
105-112. 588
Nogueira, C., Ribeiro, S., Costa, G.C. & Colli, G.R. (2011) Vicariance and endemism in a 589
Neotropical savanna hotspot: distribution patterns of Cerrado squamate reptiles. 590
Journal of Biogeography, 38, 1907-1922. 591

38
Nogueira, E.M., Fearnside, P.M., Nelson, B.W. & Franca, M.B. (2007) Wood density in 592
forests of Brazil's 'arc of deforestation': Implications for biomass and flux of carbon 593
from land-use change in Amazonia. Forest Ecology and Management, 248, 119-135. 594
Nogués-Bravo, D. & Martinez-Rica, J.P. (2004) Factors controlling the spatial species 595
richness pattern of four groups of terrestrial vertebrates in an area between two 596
different biogeographic regions in northern Spain. Journal of Biogeography, 31, 629-597
640. 598
Oindo, B.O. (2002) Patterns of herbivore species richness in Kenya and current ecoclimatic 599
stability. Biodiversity and Conservation, 11, 1205-1221. 600
Oksanen, J., Blanchet, F.G., Kindt, R., Legendre, P., Minchin, P.R., O'Hara, R.B., Simpson, 601
G.L., Solymos, P., Henry, M., Stevens, H. & Wagner, H. (2013) vegan: Community 602
Ecology Package. R package version 2.0-10. http://CRAN.R-603
project.org/package=vegan. 604
Oliveira-Filho, A.T. & Ratter, J.A. (2002) Vegetation physiognomies and woody flora of the 605
cerrado biome. The Cerrados of Brazil. Ecology and Natural History of a Neotropical 606
Savanna (ed. by P.S. Oliveira and R.J. Marquis), pp. 91-120. Columbia University 607
Press, New York. 608
Olson, D.M., Dinerstein, E., Wikramanayake, E.D., Burgess, N.D., Powell, G.V.N., 609
Underwood, E.C., D'Amico, J.A., Itoua, I., Strand, H.E., Morrison, J.C., Loucks, C.J., 610
Allnutt, T.F., Ricketts, T.H., Kura, Y., Lamoreux, J.F., Wettengel, W.W., Hedao, P. 611
& Kassem, K.R. (2001) Terrestrial ecoregions of the world: a new map of life on 612
Earth. BioScience, 51, 933-938. 613
Pandey, M. & Rajora, O.P. (2012) Higher fine-scale genetic structure in peripheral than in 614
core populations of a long-lived and mixed-mating conifer – eastern white cedar 615
(Thuja occidentalis L.). BMC Evolutionary Biology, 12, 48. 616

39
Parsons, P.A. (1990) The metabolic cost of multiple environmental stresses: implications for 617
climatic change and conservation. Trends in Ecology & Evolution, 5, 315-317. 618
Pennington, R.T., Prado, D.E. & Pendry, C.A. (2000) Neotropical Seasonally Dry Forests 619
and Quaternary vegetation changes. Journal of Biogeography, 27, 261-273. 620
Peterson, A.T. & Nyari, A.S. (2008) Ecological niche conservatism and Pleistocene refugia 621
in the Thrush-like Mourner, Schiffornis sp., in the neotropics. Evolution, 62, 173-83. 622
Pianka, E.R. (1966) Latitudinal gradients in species diversity: a review of concepts. American 623
Naturalist, 100, 33-46. 624
Pianka, E.R. & Vitt, L.J. (2003) Lizards: Windows to the Evolution of Diversity. University 625
of California Press, Berkeley. 626
Pockman, W. & Small, E. (2010) The influence of spatial patterns of soil moisture on the 627
grass and shrub responses to a summer rainstorm in a Chihuahuan desert ecotone. 628
Ecosystems, 13, 511-525. 629
Prance, G. & Lovejoy, T. (1985) Amazonia. Pergamon Press, Oxford. 630
Prudente, A.L.C., Magalhães, F., Menks, A. & de Melo, J.F. (2013) Checklist of lizards of 631
the Juruti, state of Pará, Brazil. Check List, 9, 042-050. 632
Pyron, R., Burbrink, F. & Wiens, J. (2013) A phylogeny and revised classification of 633
Squamata, including 4161 species of lizards and snakes. BMC Evolutionary Biology, 634
13, 93. 635
R Core Team (2014) R: A language and environment for statistical computing. R Foundation 636
for Statistical Computing. 637
Ratter, J.A. (1992) Transitions between cerrado and forest vegetation in Brazil. Nature and 638
Dyanmics of Forest-Savanna Boundaries (ed. by P.A. Furley, J. Proctor and J.A. 639
Ratter), pp. c417-429. Chapman & Hall, London. 640
40
Ratter, J.A., Richards, P.W., Argent, G. & Gifford, D.R. (1973) Observations on the 641
vegetation of northeastern Mato Grosso: I. The woody vegetation types of the 642
Xavantina-Cachimbo Expedition area. Philosophical Transactions of the Royal 643
Society B: Biological Sciences, 266, 449-492. 644
RCoreTeam (2013) R: A language and environment for statistical computing. R Foundation 645
for Statistical Computing. 646
Recoder, R.S., Teixeira, M., Jr., Camacho, A., Nunes, P.M.S., Mott, T., Valdujo, P.H., 647
Ghellere, J.M., Nogueira, C. & Rodrigues, M.T. (2011) Répteis da Estação Ecológica 648
Serra Geral do Tocantins, Brasil central. Biota Neotropica, 11, 263-281. 649
Ribeiro-Júnior, M.A., Rossi, R.V., Miranda, C.L. & Ávila-Pires, T.C.S. (2011) Influence of 650
pitfall trap size and design on herpetofauna and small mammal studies in a 651
Neotropical forest. Zoologia (Curitiba), 28, 80-91. 652
Ribeiro Júnior, M.A. (2013) Fauna de Lagartos da Amazônia brasileira: Diversidade, 653
Biogeografia e Conservação. Universidade Federal do Pará, Belém. 654
Ricklefs, R.E. (2004) A comprehensive framework for global patterns in biodiversity. 655
Ecology Letters, 7, 1-15. 656
Risser, P.G. (1995) The status of the science examining ecotones - A dynamic aspect of 657
landscape is the area of steep gradients between more homogeneous vegetation 658
associations. Bioscience, 45, 318-325. 659
Safriel, U.N., Volis, S. & Kark, S. (1994) Core and peripheral populations and global climate 660
change. Israel Journal of Plant Sciences, 42, 331-345. 661
Schuur, E.A.G. (2003) Productivity and global climate revisited: The sensitivity of tropical 662
forest growth to precipitation. Ecology, 84, 1165-1170. 663
Senft, A.R. (2009) Species diversity patterns at ecotones. University of North Carolina, 664
Chapel Hill. 665

41
Servant, M., Maley, J., Turcq, B., Absy, M.-L., Brenac, P., Fournier, M. & Ledru, M.-P. 666
(1993) Tropical forest changes during the late quaternary in African and South 667
American lowlands. Global and Planetary Change, 7, 25-40. 668
Silva, F.M., Menks, A.C., Prudente, A.L.C., Costa, J.C.L., Travassos, A.E.M. & Galatti, U. 669
(2011) Squamate reptiles from municipality of Barcarena and surroundings, state of 670
Pará, north of Brazil. Check List, 7 671
Simpson, B.B. & Haffer, J. (1978) Speciation patterns in the Amazonian forest biota. Annual 672
Review of Ecology and Systematics, 9, 497-518. 673
Smith, T.B., Wayne, R.K., Girman, D.J. & Bruford, M.W. (1997) A role for ecotones in 674
generating rainforest biodiversity. Science, 276, 1855-1857. 675
Temple, S.A. (1998) Surviving where ecosystems meet: ecotonal animal communities of 676
midwestern oak savannas and woodlands. Transactions of the Wisconsin Academy of 677
Sciences, Arts and Letters, 86, 207-222. 678
Ter Braak, C.J.F. (1986) Canonical correspondence analysis: a new eigenvector technique for 679
multivariate direct gradient analysis. Ecology, 67, 1167-1179. 680
Tilman, D. (2001) Functional diversity. Encyclopedia of Biodiversity (ed. by S.A. Levin), pp. 681
109-120. Academic Press. 682
Turci, L.C.B. & Bernarde, P.S. (2008) Levantamento herpetofaunístico em uma localidade no 683
município de Cacoal, Rondônia, Brasil. Bioikos, 22, 101-108. 684
Urbina-Cardona, J.N., Olivares-Perez, M. & Reynoso, V.H. (2006) Herpetofauna diversity 685
and microenvironment correlates across a pasture-edge-interior ecotone in tropical 686
rainforest fragments in the Los Tuxtlas Biosphere Reserve of Veracruz, Mexico. 687
Biological Conservation, 132, 61-75. 688
Valdujo, P.H., Nogueira, C.d.C., Baumgarten, L., Rodrigues, F.H.G., Brandão, R.A., 689
Eterovic, A., Ramos-Neto, M.B. & Marques, O.A.V. (2009) Squamate reptiles from 690
42
Parque Nacional das Emas and surroundings, Cerrado of central Brazil. Check List, 5, 691
405-417. 692
van der Maarel, E. (1990) Ecotones and ecoclines are different. Journal of Vegetation 693
Science, 1, 135-138. 694
Vanzolini, P.E. & Williams, E.E. (1970) South American anoles: the geographic 695
differentiation and evolution of the Anolis chrysolepis species group (Sauria, 696
Iguanidae). Arquivos de Zoologia, São Paulo, 19, 1-298. 697
Vaz-Silva, W., Guedes, A.G., de Azevedo-Silva, P.L., Gontijo, F.F., Barbosa, R.S., Aloísio, 698
G.R. & de Oliveira, F.C.G. (2007) Herpetofauna, Espora hydroelectric power plant, 699
state of Goiás, Brazil. Check List, 3, 338-345. 700
Villéger, S., Mason, N.W.H. & Mouillot, D. (2008) New multidimensional functional 701
diversity indices for a multifaceted framework in functional ecology. Ecology, 89, 702
2290-2301. 703
Vitt, L.J., Colli, G.R., Caldwell, J.P., Mesquita, D.O., Garda, A.A. & Franca, F.G.R. (2007) 704
Detecting variation in microhabitat use in low-diversity lizard assemblages across 705
small-scale habitat gradients. Journal of Herpetology, 41, 654-663. 706
Waldez, F., Menin, M. & Vogt, R.C. (2013) Diversidade de anfíbios e répteis Squamata na 707
região do baixo rio Purus, Amazônia Central, Brasil. Biota Neotropica, 13, 300-316. 708
Walker, S., Wilson, J.B., Steel, J.B., Rapson, G.L., Smith, B., King, W.M. & Cottam, Y.H. 709
(2003) Properties of ecotones: Evidence from five ecotones objectively determined 710
from a coastal vegetation gradient. Journal of Vegetation Science, 14, 579-590. 711
Warner, D.A. & Andrews, R.M. (2002) Nest-site selection in relation to temperature and 712
moisture by the lizard Sceloporus undulatus. Herpetologica, 58, 399-407. 713
Webb, C.O. (2000) Exploring the phylogenetic structure of ecological communities: an 714
example for rain forest trees. The American Naturalist, 156, 145-155. 715
43
Webb, C.O., Ackerly, D.D., McPeek, M.A. & Donoghue, M.J. (2002) Phylogenies and 716
community ecology. Annual Review of Ecology and Systematics, 33, 475-505. 717
Werneck, F.D., Colli, G.R. & Vitt, L.J. (2009) Determinants of assemblage structure in 718
Neotropical dry forest lizards. Austral Ecology, 34, 97-115. 719
Werneck, F.P., Costa, G.C., Colli, G.R., Prado, D.E. & Sites, J.W. (2011) Revisiting the 720
historical distribution of Seasonally Dry Tropical Forests: new insights based on 721
palaeodistribution modelling and palynological evidence. Global Ecology and 722
Biogeography, 20, 272-288. 723
Werneck, F.P., Nogueira, C., Colli, G.R., Sites, J.W. & Costa, G.C. (2012) Climatic stability 724
in the Brazilian Cerrado: implications for biogeographical connections of South 725
American savannas, species richness and conservation in a biodiversity hotspot. 726
Journal of Biogeography, 39, 1695-1706. 727
Wiens, J.A., Crawford, C.S. & Gosz, J.R. (1985) Boundary dynamics: a conceptual 728
framework for studying landscape ecosystems. Oikos, 45, 421-427. 729
Woodroffe, R. & Ginsberg, J.R. (1998) Edge effects and the extinction of populations inside 730
protected areas. Science, 280, 2126-2128. 731
Wright, D.H. (1983) Species-energy theory: an extension of species-area theory. Oikos, 41, 732
496-506. 733
Zhigalskii, O.A. (2011) Structure of the bank vole (Myodes glareolus) population cycles in 734
the core and periphery of its species area. Biology Bulletin, 38, 629-641. 735
736
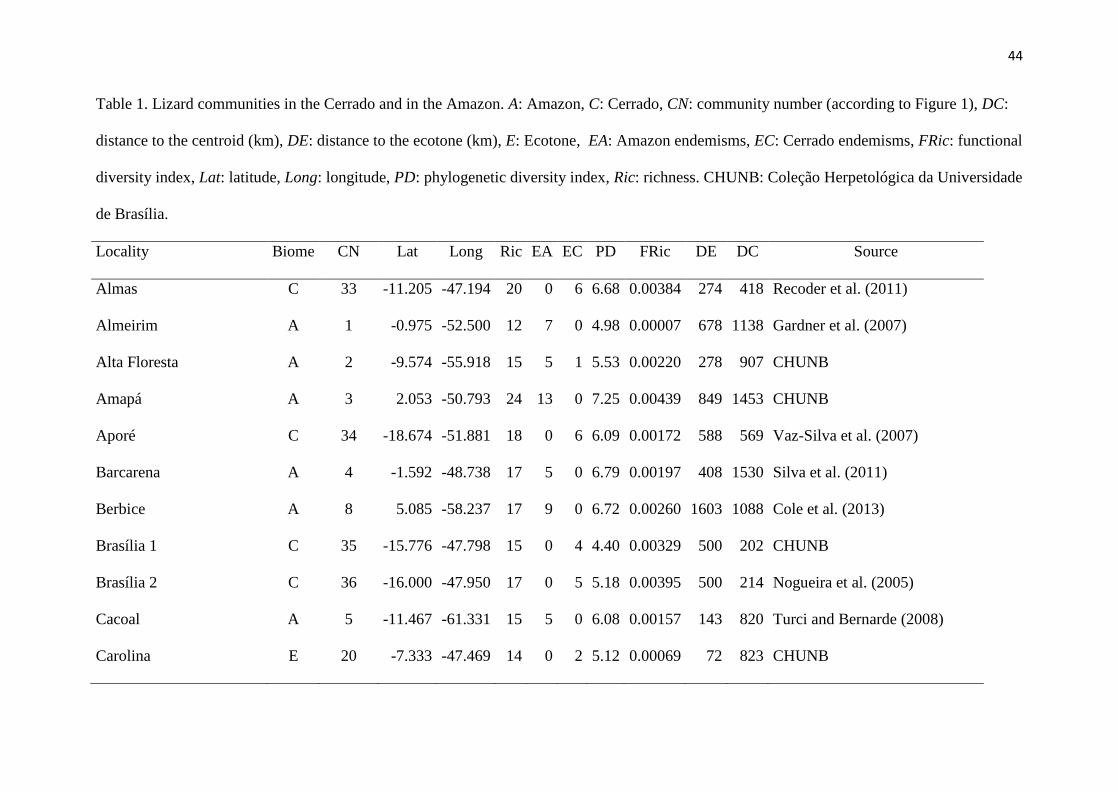
44
Table 1. Lizard communities in the Cerrado and in the Amazon. A: Amazon, C: Cerrado, CN: community number (according to Figure 1), DC:
distance to the centroid (km), DE: distance to the ecotone (km), E: Ecotone, EA: Amazon endemisms, EC: Cerrado endemisms, FRic: functional
diversity index, Lat: latitude, Long: longitude, PD: phylogenetic diversity index, Ric: richness. CHUNB: Coleção Herpetológica da Universidade
de Brasília.
Locality Biome CN Lat Long Ric EA EC PD FRic DE DC Source
Almas C 33 -11.205 -47.194 20 0 6 6.68 0.00384 274 418 Recoder et al. (2011)
Almeirim A 1 -0.975 -52.500 12 7 0 4.98 0.00007 678 1138 Gardner et al. (2007)
Alta Floresta A 2 -9.574 -55.918 15 5 1 5.53 0.00220 278 907 CHUNB
Amapá A 3 2.053 -50.793 24 13 0 7.25 0.00439 849 1453 CHUNB
Aporé C 34 -18.674 -51.881 18 0 6 6.09 0.00172 588 569 Vaz-Silva et al. (2007)
Barcarena A 4 -1.592 -48.738 17 5 0 6.79 0.00197 408 1530 Silva et al. (2011)
Berbice A 8 5.085 -58.237 17 9 0 6.72 0.00260 1603 1088 Cole et al. (2013)
Brasília 1 C 35 -15.776 -47.798 15 0 4 4.40 0.00329 500 202 CHUNB
Brasília 2 C 36 -16.000 -47.950 17 0 5 5.18 0.00395 500 214 Nogueira et al. (2005)
Cacoal A 5 -11.467 -61.331 15 5 0 6.08 0.00157 143 820 Turci and Bernarde (2008)
Carolina E 20 -7.333 -47.469 14 0 2 5.12 0.00069 72 823 CHUNB

45
Locality Biome CN Lat Long Ric EA EC PD FRic DE DC Source
Caseara E 21 -9.372 -49.843 17 0 1 5.83 0.00163 23 582 CHUNB
Caxiuanã A 6 -1.960 -51.615 17 8 0 6.28 0.00161 532 1204 Ribeiro Jr. et al. (2011)
Cerejeiras E 22 -13.189 -60.812 13 4 1 4.63 0.00029 86 1022 CHUNB
Cocos C 37 -14.545 -45.242 12 0 4 5.41 0.00129 698 396 CHUNB
Cruzeiro do Sul A 7 -7.956 -72.077 29 17 0 8.51 0.00427 1362 1174 Bernarde et al. (2011)
Dubulay A 9 5.682 -57.859 21 6 0 7.42 0.00192 1618 1163 Cole et al. (2013)
Emas C 38 -18.333 -53.000 26 0 12 7.28 0.00536 532 605 Valdujo et al. (2009)
Espigão do Oeste E 23 -11.608 -60.717 29 14 1 9.21 0.00382 77 846 Macedo et al. (2008)
Guajará-Mirim E 24 -10.800 -65.367 25 14 0 7.65 0.00399 579 820 CHUNB
Humaitá A 11 -7.200 -62.900 17 11 0 6.17 0.00131 590 345 CHUNB
Juara E 25 -10.428 -57.634 12 5 2 5.09 0.00069 154 852 Ávila and Ribeiro (2011)
Juruti A 12 -2.520 -56.158 24 14 0 8.26 0.00324 944 693 Prudente et al. (2013)
Konawaruk A 9 5.219 -59.045 16 6 0 6.07 0.00204 1680 1067 Cole et al. (2013)
Marabá A 13 -5.504 -50.279 14 6 0 5.71 0.00234 233 1322 Bernardo et al. (2012)
Mateiros 1 C 39 -10.263 -46.566 14 0 3 5.27 0.00138 251 543 CHUNB
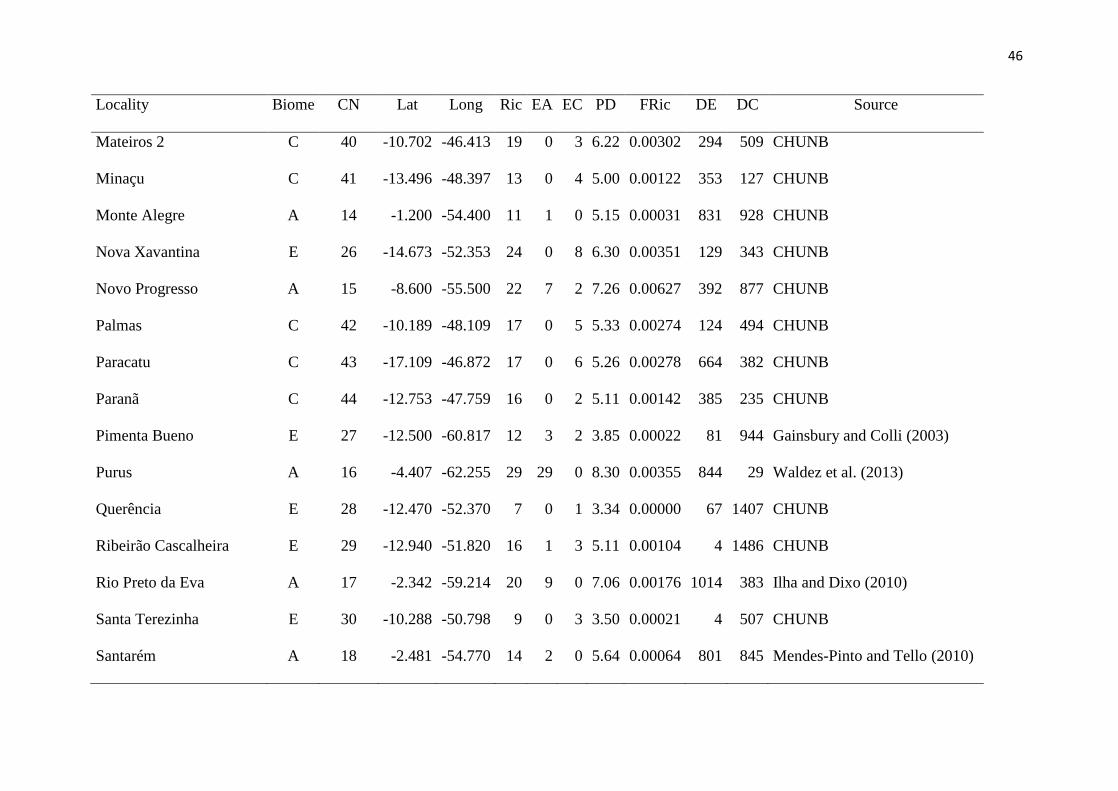
46
Locality Biome CN Lat Long Ric EA EC PD FRic DE DC Source
Mateiros 2 C 40 -10.702 -46.413 19 0 3 6.22 0.00302 294 509 CHUNB
Minaçu C 41 -13.496 -48.397 13 0 4 5.00 0.00122 353 127 CHUNB
Monte Alegre A 14 -1.200 -54.400 11 1 0 5.15 0.00031 831 928 CHUNB
Nova Xavantina E 26 -14.673 -52.353 24 0 8 6.30 0.00351 129 343 CHUNB
Novo Progresso A 15 -8.600 -55.500 22 7 2 7.26 0.00627 392 877 CHUNB
Palmas C 42 -10.189 -48.109 17 0 5 5.33 0.00274 124 494 CHUNB
Paracatu C 43 -17.109 -46.872 17 0 6 5.26 0.00278 664 382 CHUNB
Paranã C 44 -12.753 -47.759 16 0 2 5.11 0.00142 385 235 CHUNB
Pimenta Bueno E 27 -12.500 -60.817 12 3 2 3.85 0.00022 81 944 Gainsbury and Colli (2003)
Purus A 16 -4.407 -62.255 29 29 0 8.30 0.00355 844 29 Waldez et al. (2013)
Querência E 28 -12.470 -52.370 7 0 1 3.34 0.00000 67 1407 CHUNB
Ribeirão Cascalheira E 29 -12.940 -51.820 16 1 3 5.11 0.00104 4 1486 CHUNB
Rio Preto da Eva A 17 -2.342 -59.214 20 9 0 7.06 0.00176 1014 383 Ilha and Dixo (2010)
Santa Terezinha E 30 -10.288 -50.798 9 0 3 3.50 0.00021 4 507 CHUNB
Santarém A 18 -2.481 -54.770 14 2 0 5.64 0.00064 801 845 Mendes-Pinto and Tello (2010)

47
Locality Biome CN Lat Long Ric EA EC PD FRic DE DC Source
São Domingos C 45 -13.398 -46.268 18 0 2 5.83 0.00242 538 314 Werneck et al. (2009)
Silvânia C 46 -16.659 -48.608 14 0 4 4.93 0.00084 495 261 Morais et al. (2012)
Trairão A 19 -4.576 -55.404 23 13 0 7.37 0.00164 768 749 Mendes-Pinto and Souza (2011)
Vila Bela da SS. Trindade E 31 -14.944 -60.013 17 2 4 5.82 0.00245 76 1234 CHUNB
Vilhena E 32 -12.717 -60.117 15 3 5 4.60 0.00120 11 982 Gainsbury and Colli (2003)

48
Figure Legends
Figure 1. Map presenting the sampled communities. 1: Almeirim; 2: Alta Floresta; 3: Amapá;
4: Barcarena; 5: Cacoal; 6: Caxiuanã; 7: Cruzeiro do Sul; 8: Berbice; 9: Dubulay; 10:
Konawaruk; 11: Humaitá; 12: Juruti; 13: Marabá; 14: Monte Alegre; 15: Novo Progresso; 16:
Purus; 17: Rio Preto da Eva; 18: Santarém; 19: Trairão; 20: Carolina; 21: Caseara; 22:
Cerejeiras; 23: Espigão do Oeste; 24: Guajará-Mirim; 25: Juara; 26: Nova Xavantina; 27:
Pimenta Bueno; 28: Querência; 29: Ribeirão Cascalheira; 30: Santa Terezinha; 31: Vila Bela
da Santíssima Trindade; 32: Vilhena; 33: Almas; 34: Aporé; 35: Brasília 1; 36: Brasília 2; 37:
Cocos; 38: Emas; 39: Mateiros 1; 40: Mateiros 2; 41: Minaçu; 42: Palmas; 43: Paracatu; 44:
Paranã; 45: São Domingos; 46: Silvânia.
Figure 2. Phylogenetic tree representing the relationships among all the species used in this
study. Branch lengths follow Pyron et al. (2013).
Figure 3. Correlations between species richness, endemisms, phylogenetic diversity (PD) and
functional diversity (FRic) of communities located in the Amazon with distance to the
ecotone and distance to the biome centroid. The correlation coefficients and significance
values are: A: = 0.436 and P = 0.013; B: r = -0.314 and P = 0.08; C: = 0.677 and P <
0.001); D: = -0.563 and P < 0.001; E: = 0.596 and P < 0.001; F: r = -0.375 and P =
0.034; G: = 0.403 and P = 0.023; H: r = -0.118 and P = 0.520.
Figure 4. Correlations between species richness, endemisms, phylogenetic diversity (PD) and
functional diversity (FRic) of communities located in the Cerrado with distance to the
ecotone and distance to the biome centroid. The correlation coefficients and significance
values are: A: = 0.369 and P = 0.070; B: = -0.119 and P = 0.595; C: = 0.468 and P =

49
0.018; D: = -0.210 and P = 0.314; E: = 0.407 and P = 0.045; F: = 0.013 and P = 0.952;
G: = 0.535 and P = 0.007; H: = -0.311 and P = 0.131.
Figure 5. Ordination diagram resulting from a canonical correspondence analysis (CCA),
presenting relationships among lizard species and environmental variables. Species scores
represented by circles and crosses, and environmental variables represented by arrows, jointly
reflect species distributions along each environmental vector. White circles = Cerrado
endemic species; black circles = Amazon endemic species; crosses = widespread species; Bio
2 = mean diurnal temperature range; Bio 9 = mean temperature of driest quarter; Bio 11 =
mean temperature of coldest quarter; Bio 18 = precipitation of warmest quarter.

50

51
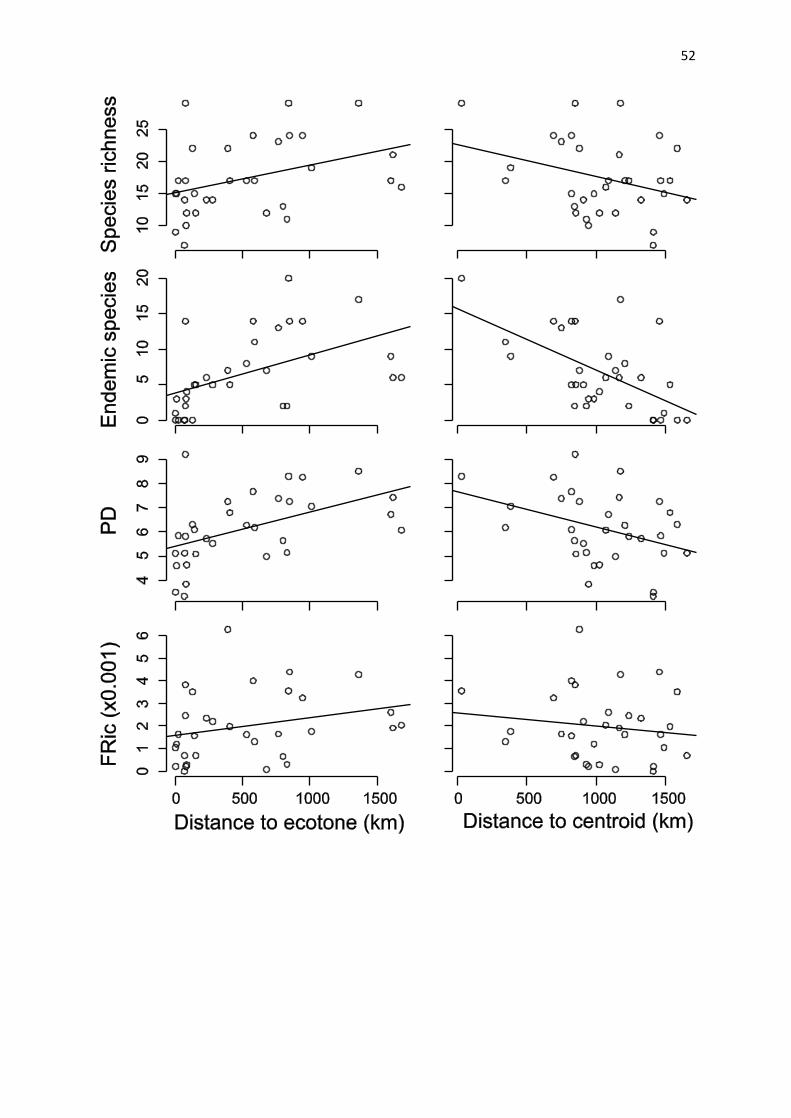
52

53

54

55
Appendix 1
Table A1. Incidence matrix of lizard species recorded in 46 sites from the Amazon and Cerrado biomes. 1: Alopoglossus angulatus; 2: Al.
atriventris; 3: Al. buckleyi; 4: Ameiva ameiva; 5: Am. parecis; 6: Anolis auratus; 7: An. brasiliensis; 8: An. chrysolepis; 9: An. fuscoauratus; 10:
An. meridionalis; 11: An. ortonii; 12: An. philopunctatus; 13: An. planiceps; 14: An. punctatus; 15: An. tandai; 16: An. trachyderma; 17: An.
transversalis; 18: Arthrosaura kockii; 19: Ar. reticulata; 20: Bachia bresslaui; 21: B. cacerensis; 22: B. dorbignyi; 23: B. flavescens; 24: B.
oxyrhina; 25: B. peruana; 26: B. psamophila; 27: B. scolecoides; 28: Cercosaura argulus; 29: Cercosaura eigenmanni; 30: Ce. ocellata; 31: Ce.
schreibersii; 32: Cercosaura sp.; 33: Chatogekko amazonicus; 34: Cnemidophorus cryptus; 35: Cn. gramivagus; 36: Cn. jalapensis; 37: Cn.
lemniscatus; 38: Cn. mumbuca; 39: Cn. ocellifer; 40: Coleodactylus brachystoma; 41: Coleodactylus meridionalis; 42: Colobosaura modesta;
43: Crocodilurus amazonicus; 44: Dracaena guianensis; 45: Enyalioides laticeps; 46: E. palpebralis; 47: Enyalius leechii; 48: Enyalius sp.; 49:
Gonatodes alexandermendesi; 50: Go. annularis; 51: Go. eladioi; 52: Go. hasemani; 53: Go. humeralis; 54: Gymnodactylus amarali; 55: Gd.
geckoides; 56: Gymnophthalmus speciosus; 57: Gp. underwoodi; 58: Hemidactylus brasilianus; 59: He. mabouia; 60: He. palaichthus; 61:
Hoplocercus spinosus; 62: Iguana iguana; 63: Iphisa elegans; 64: Kentropyx altamazonica; 65: K. calcarata; 66: K. paulensis; 67: K. pelviceps;
68: Kentropyx sp n; 69: K. striata; 70: K. vanzoi; 71: Lepidoblepharis heyerorum; 72: Leposoma guianense; 73: Lo. osvaldoi; 74: Lo.
percarinatum; 75: Leposoma sp n; 76: Lygodactylus klugei; 77: Mabuya agilis; 78: Ma. bistriata; 79: Ma. dorsivittata; 80: Ma. frenata; 81: Ma.
guaporicola; 82: Ma. heathi; 83: Ma. nigropunctata; 84: Mabuya sp.; 85: Micrablepharus atticolus; 86: Mi. maximiliani; 87: Neusticurus
bicarinatus; 88: N. rudis; 89: Ophiodes striatus; 90: Phyllopezus pollicaris; 91: Plica plica; 92: Pl. umbra; 93: Polychrus acutirostris; 94: Py.

56
marmoratus; 95: Potamites ecpleopus; 96: Pseudogonatodes guianensis; 97: Ptychoglossus brevifrontalis; 98: Stenocercus caducus; 99: S.
fimbriatus; 100: S. quinarius; 101: S. roseiventris; 102: S. sinesaccus; 103: Thecadactylus rapicauda; 104: Th. solimoensis; 105: Tretioscincus
agilis; 106: Te. oriximinensis; 107: Tropidurus callathelys; 108: Tr. chromatops; 109: Tr. guarani; 110: Tr. hispidus; 111: Tr. insulanus; 112:
Tr. itambere; 113: Tr. oreadicus; 114: Tropidurus sp.; 115: Tr. torquatus; 116: Tupinambis duseni; 117: Tu merianae; 118: Tu quadrilineatus;
119: Tu teguixin; 120: Uracentron azureum; 121: Uc. flaviceps; 122: Uranoscodon superciliosus; 123: Vanzosaura rubricauda.
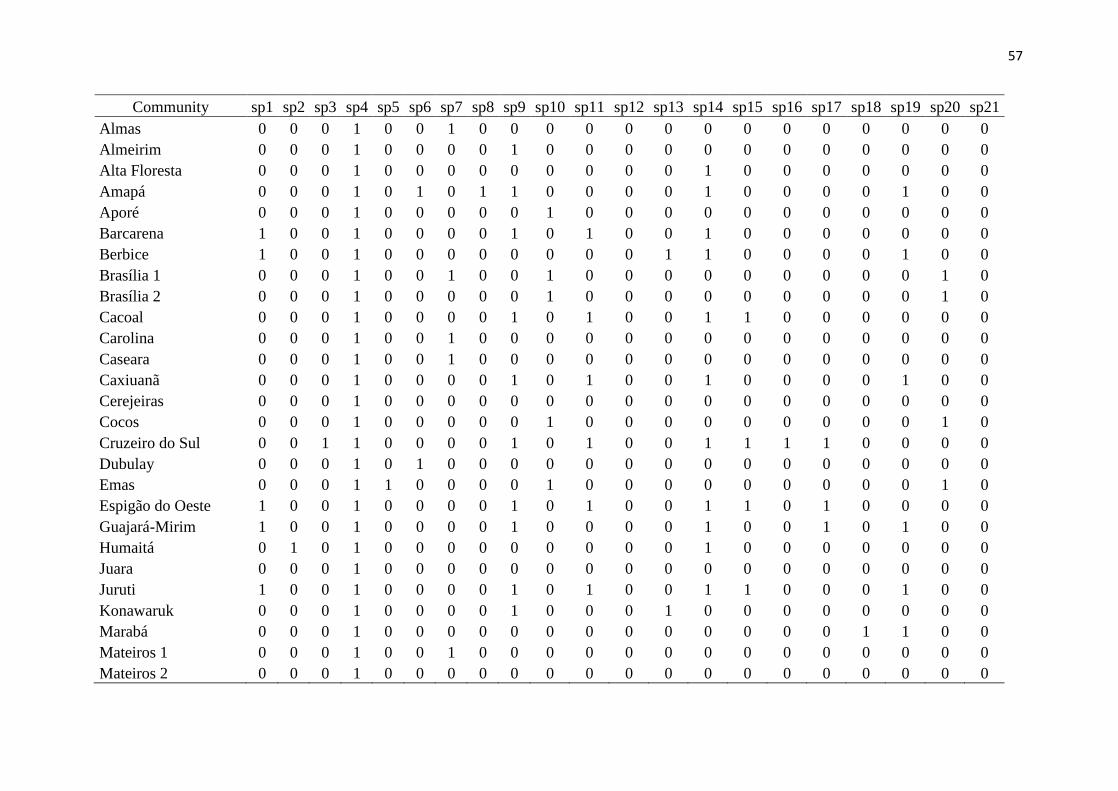
57
Community sp1 sp2 sp3 sp4 sp5 sp6 sp7 sp8 sp9 sp10 sp11 sp12 sp13 sp14 sp15 sp16 sp17 sp18 sp19 sp20 sp21
Almas 0 0 0 1 0 0 1 0 0 0 0 0 0 0 0 0 0 0 0 0 0
Almeirim 0 0 0 1 0 0 0 0 1 0 0 0 0 0 0 0 0 0 0 0 0
Alta Floresta 0 0 0 1 0 0 0 0 0 0 0 0 0 1 0 0 0 0 0 0 0
Amapá 0 0 0 1 0 1 0 1 1 0 0 0 0 1 0 0 0 0 1 0 0
Aporé 0 0 0 1 0 0 0 0 0 1 0 0 0 0 0 0 0 0 0 0 0
Barcarena 1 0 0 1 0 0 0 0 1 0 1 0 0 1 0 0 0 0 0 0 0
Berbice 1 0 0 1 0 0 0 0 0 0 0 0 1 1 0 0 0 0 1 0 0
Brasília 1 0 0 0 1 0 0 1 0 0 1 0 0 0 0 0 0 0 0 0 1 0
Brasília 2 0 0 0 1 0 0 0 0 0 1 0 0 0 0 0 0 0 0 0 1 0
Cacoal 0 0 0 1 0 0 0 0 1 0 1 0 0 1 1 0 0 0 0 0 0
Carolina 0 0 0 1 0 0 1 0 0 0 0 0 0 0 0 0 0 0 0 0 0
Caseara 0 0 0 1 0 0 1 0 0 0 0 0 0 0 0 0 0 0 0 0 0
Caxiuanã 0 0 0 1 0 0 0 0 1 0 1 0 0 1 0 0 0 0 1 0 0
Cerejeiras 0 0 0 1 0 0 0 0 0 0 0 0 0 0 0 0 0 0 0 0 0
Cocos 0 0 0 1 0 0 0 0 0 1 0 0 0 0 0 0 0 0 0 1 0
Cruzeiro do Sul 0 0 1 1 0 0 0 0 1 0 1 0 0 1 1 1 1 0 0 0 0
Dubulay 0 0 0 1 0 1 0 0 0 0 0 0 0 0 0 0 0 0 0 0 0
Emas 0 0 0 1 1 0 0 0 0 1 0 0 0 0 0 0 0 0 0 1 0
Espigão do Oeste 1 0 0 1 0 0 0 0 1 0 1 0 0 1 1 0 1 0 0 0 0
Guajará-Mirim 1 0 0 1 0 0 0 0 1 0 0 0 0 1 0 0 1 0 1 0 0
Humaitá 0 1 0 1 0 0 0 0 0 0 0 0 0 1 0 0 0 0 0 0 0
Juara 0 0 0 1 0 0 0 0 0 0 0 0 0 0 0 0 0 0 0 0 0
Juruti 1 0 0 1 0 0 0 0 1 0 1 0 0 1 1 0 0 0 1 0 0
Konawaruk 0 0 0 1 0 0 0 0 1 0 0 0 1 0 0 0 0 0 0 0 0
Marabá 0 0 0 1 0 0 0 0 0 0 0 0 0 0 0 0 0 1 1 0 0
Mateiros 1 0 0 0 1 0 0 1 0 0 0 0 0 0 0 0 0 0 0 0 0 0
Mateiros 2 0 0 0 1 0 0 0 0 0 0 0 0 0 0 0 0 0 0 0 0 0
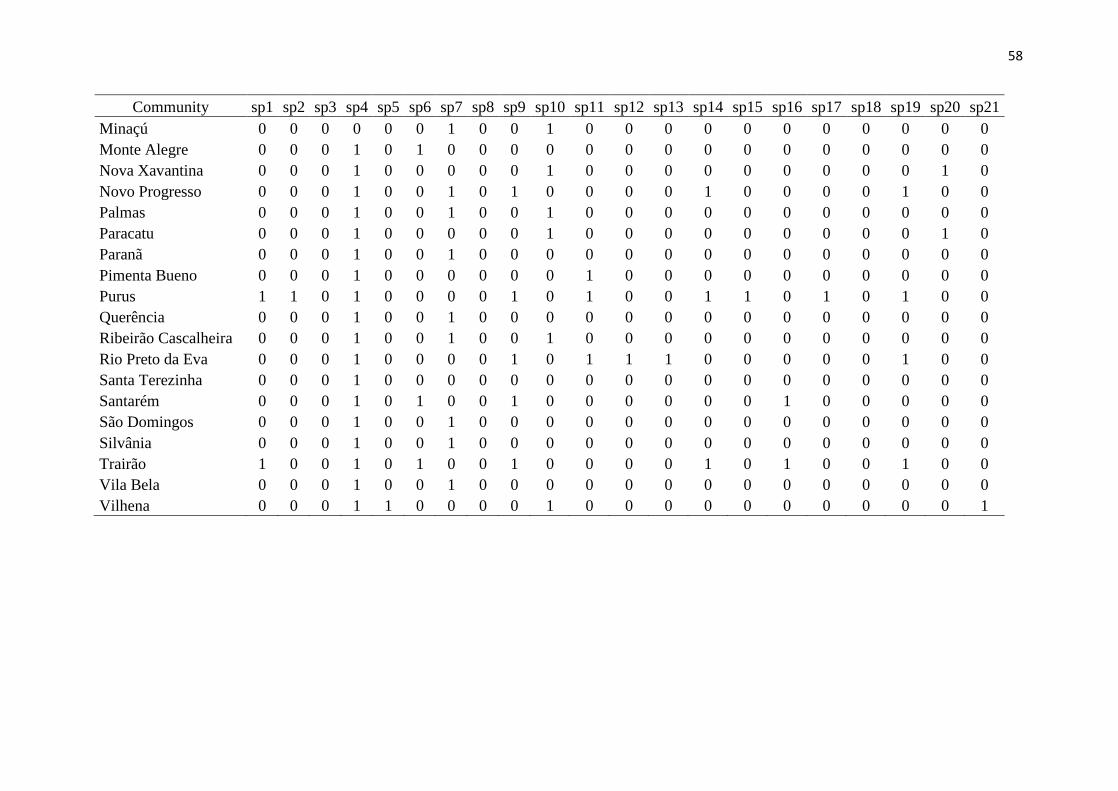
58
Community sp1 sp2 sp3 sp4 sp5 sp6 sp7 sp8 sp9 sp10 sp11 sp12 sp13 sp14 sp15 sp16 sp17 sp18 sp19 sp20 sp21
Minaçú 0 0 0 0 0 0 1 0 0 1 0 0 0 0 0 0 0 0 0 0 0
Monte Alegre 0 0 0 1 0 1 0 0 0 0 0 0 0 0 0 0 0 0 0 0 0
Nova Xavantina 0 0 0 1 0 0 0 0 0 1 0 0 0 0 0 0 0 0 0 1 0
Novo Progresso 0 0 0 1 0 0 1 0 1 0 0 0 0 1 0 0 0 0 1 0 0
Palmas 0 0 0 1 0 0 1 0 0 1 0 0 0 0 0 0 0 0 0 0 0
Paracatu 0 0 0 1 0 0 0 0 0 1 0 0 0 0 0 0 0 0 0 1 0
Paranã 0 0 0 1 0 0 1 0 0 0 0 0 0 0 0 0 0 0 0 0 0
Pimenta Bueno 0 0 0 1 0 0 0 0 0 0 1 0 0 0 0 0 0 0 0 0 0
Purus 1 1 0 1 0 0 0 0 1 0 1 0 0 1 1 0 1 0 1 0 0
Querência 0 0 0 1 0 0 1 0 0 0 0 0 0 0 0 0 0 0 0 0 0
Ribeirão Cascalheira 0 0 0 1 0 0 1 0 0 1 0 0 0 0 0 0 0 0 0 0 0
Rio Preto da Eva 0 0 0 1 0 0 0 0 1 0 1 1 1 0 0 0 0 0 1 0 0
Santa Terezinha 0 0 0 1 0 0 0 0 0 0 0 0 0 0 0 0 0 0 0 0 0
Santarém 0 0 0 1 0 1 0 0 1 0 0 0 0 0 0 1 0 0 0 0 0
São Domingos 0 0 0 1 0 0 1 0 0 0 0 0 0 0 0 0 0 0 0 0 0
Silvânia 0 0 0 1 0 0 1 0 0 0 0 0 0 0 0 0 0 0 0 0 0
Trairão 1 0 0 1 0 1 0 0 1 0 0 0 0 1 0 1 0 0 1 0 0
Vila Bela 0 0 0 1 0 0 1 0 0 0 0 0 0 0 0 0 0 0 0 0 0
Vilhena 0 0 0 1 1 0 0 0 0 1 0 0 0 0 0 0 0 0 0 0 1

59
Community sp22 sp23 sp24 sp25 sp26 sp27 sp28 sp29 sp30 sp31 sp32 sp33 sp34 sp35 sp36 sp37 sp38 sp39 sp40 sp41
Almas 0 0 1 0 0 0 0 0 1 0 0 0 0 0 1 0 1 0 1 0
Almeirim 0 0 0 0 0 0 0 0 1 0 0 1 1 0 0 0 0 0 0 0
Alta Floresta 0 1 0 0 0 1 0 0 1 0 0 0 0 0 0 0 0 0 0 0
Amapá 0 1 0 0 0 0 0 0 0 0 0 1 0 0 0 0 0 0 0 0
Aporé 0 0 0 0 0 0 0 0 1 1 0 0 0 0 0 0 0 1 0 0
Barcarena 0 0 0 0 0 0 0 0 0 0 0 1 0 0 0 1 0 0 0 0
Berbice 0 1 0 0 0 0 0 0 0 0 0 0 0 0 0 0 0 0 0 0
Brasília 1 0 0 0 0 0 0 0 0 1 1 0 0 0 0 0 0 0 1 0 0
Brasília 2 0 0 0 0 0 0 0 0 1 1 0 0 0 0 0 0 0 0 0 0
Cacoal 1 0 0 0 0 0 0 1 0 0 0 1 0 0 0 0 0 0 0 0
Carolina 0 0 0 0 0 0 0 0 0 0 0 0 0 0 0 0 1 0 0 0
Caseara 0 0 0 0 0 0 0 0 0 0 0 0 0 0 0 0 0 1 0 0
Caxiuanã 0 1 0 0 0 0 0 0 1 0 0 1 0 0 0 0 0 0 0 0
Cerejeiras 0 0 0 0 0 0 0 0 1 1 0 0 0 0 0 0 0 0 0 0
Cocos 0 0 0 0 0 0 0 0 1 0 0 0 0 0 0 0 0 1 0 0
Cruzeiro do Sul 0 0 0 1 0 0 1 0 1 0 0 0 0 0 0 0 0 0 0 0
Dubulay 0 1 0 0 0 0 0 0 1 0 0 0 0 0 0 1 0 0 0 0
Emas 0 0 0 0 0 0 0 0 1 1 0 0 0 0 0 0 0 0 1 0
Espigão do Oeste 0 0 0 0 0 0 1 1 1 0 0 1 0 0 0 0 0 0 0 0
Guajará-Mirim 1 0 0 0 0 0 1 1 0 0 0 1 0 0 0 0 0 0 0 0
Humaitá 0 0 0 0 0 0 0 0 1 0 0 1 0 1 0 0 0 0 0 0
Juara 0 0 0 0 0 0 0 1 0 0 0 1 0 0 0 0 0 0 0 0
Juruti 0 1 0 0 0 0 0 0 0 0 1 1 0 0 0 0 0 0 0 0
Konawaruk 0 1 0 0 0 0 0 0 0 0 0 0 0 0 0 0 0 0 0 0
Marabá 0 0 0 0 0 0 0 0 1 0 0 1 0 0 0 0 0 0 0 0
Mateiros 1 0 0 0 0 0 0 0 0 0 0 0 0 0 0 0 0 1 0 0 0
Mateiros 2 0 0 0 0 0 0 0 0 1 0 0 0 0 0 1 0 1 0 1 0

60
Community sp22 sp23 sp24 sp25 sp26 sp27 sp28 sp29 sp30 sp31 sp32 sp33 sp34 sp35 sp36 sp37 sp38 sp39 sp40 sp41
Minaçú 0 0 0 0 0 0 0 0 1 0 0 0 0 0 0 0 0 1 1 0
Monte Alegre 0 0 0 0 0 0 0 0 0 0 0 0 1 0 0 0 0 0 0 0
Nova Xavantina 0 0 0 0 0 0 0 0 1 1 0 0 0 0 0 0 0 1 0 0
Novo Progresso 0 1 0 0 0 1 0 0 1 0 0 0 0 0 0 0 0 0 0 0
Palmas 0 0 0 0 1 0 0 0 1 0 0 0 0 0 0 0 0 1 0 0
Paracatu 0 0 0 0 0 0 0 0 1 1 0 0 0 0 0 0 0 1 0 0
Paranã 0 0 0 0 0 0 0 0 0 0 0 0 0 0 0 0 0 1 1 1
Pimenta Bueno 0 0 0 0 0 0 0 1 1 0 0 0 0 0 0 0 0 0 0 0
Purus 0 0 0 0 0 0 1 0 0 0 0 1 0 0 0 0 0 0 0 0
Querência 0 0 0 0 0 0 0 0 0 0 0 0 0 0 0 0 0 1 0 0
Ribeirão Cascalheira 0 0 0 0 0 0 0 1 1 0 0 0 0 0 0 0 0 1 0 0
Rio Preto da Eva 0 0 0 0 0 0 0 0 0 0 0 1 0 0 0 0 0 0 0 0
Santa Terezinha 0 0 0 0 0 0 0 0 1 0 0 0 0 0 0 0 0 0 0 0
Santarém 0 0 0 0 0 0 0 0 1 0 0 1 0 0 0 1 0 0 0 0
São Domingos 0 0 0 0 0 0 0 0 0 0 0 0 0 0 0 0 0 1 1 0
Silvânia 0 0 0 0 0 0 0 0 0 1 0 0 0 0 0 0 0 0 0 0
Trairão 0 1 0 0 0 0 1 0 1 0 0 1 0 0 0 0 0 0 0 0
Vila Bela 0 0 0 0 0 0 0 1 1 0 1 0 0 0 0 0 0 0 0 0
Vilhena 0 0 0 0 0 0 0 1 1 0 0 0 0 0 0 0 0 0 0 0
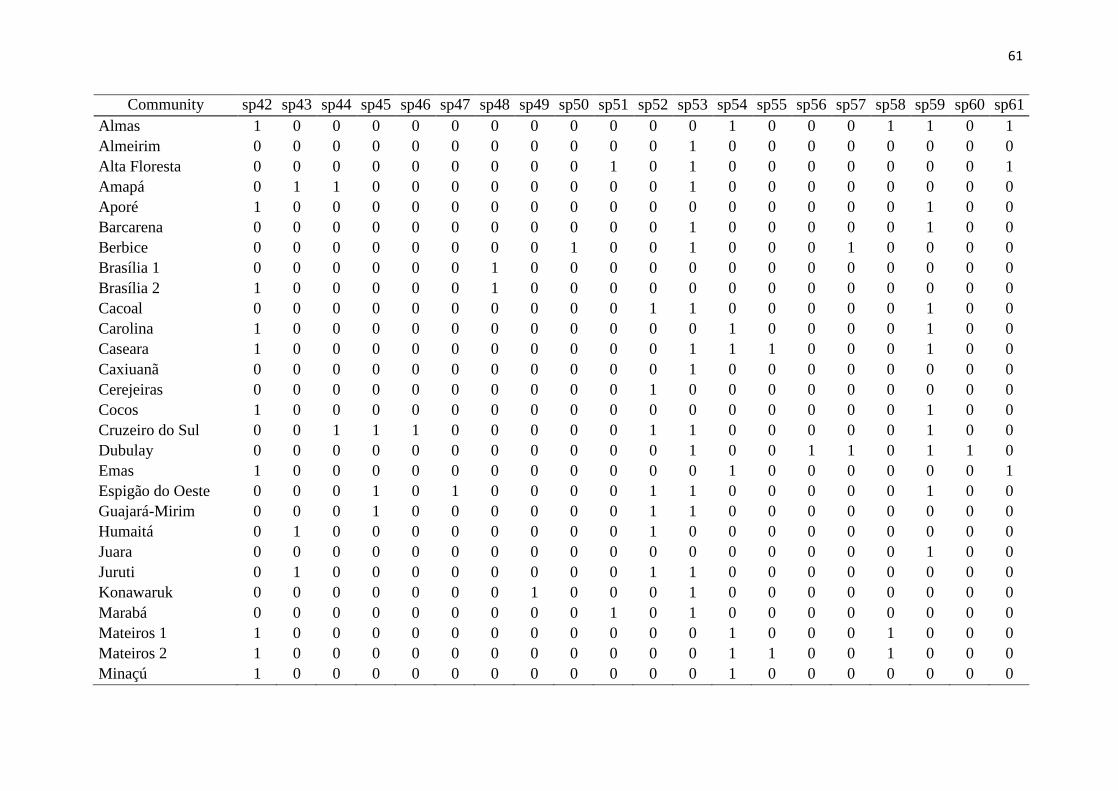
61
Community sp42 sp43 sp44 sp45 sp46 sp47 sp48 sp49 sp50 sp51 sp52 sp53 sp54 sp55 sp56 sp57 sp58 sp59 sp60 sp61
Almas 1 0 0 0 0 0 0 0 0 0 0 0 1 0 0 0 1 1 0 1
Almeirim 0 0 0 0 0 0 0 0 0 0 0 1 0 0 0 0 0 0 0 0
Alta Floresta 0 0 0 0 0 0 0 0 0 1 0 1 0 0 0 0 0 0 0 1
Amapá 0 1 1 0 0 0 0 0 0 0 0 1 0 0 0 0 0 0 0 0
Aporé 1 0 0 0 0 0 0 0 0 0 0 0 0 0 0 0 0 1 0 0
Barcarena 0 0 0 0 0 0 0 0 0 0 0 1 0 0 0 0 0 1 0 0
Berbice 0 0 0 0 0 0 0 0 1 0 0 1 0 0 0 1 0 0 0 0
Brasília 1 0 0 0 0 0 0 1 0 0 0 0 0 0 0 0 0 0 0 0 0
Brasília 2 1 0 0 0 0 0 1 0 0 0 0 0 0 0 0 0 0 0 0 0
Cacoal 0 0 0 0 0 0 0 0 0 0 1 1 0 0 0 0 0 1 0 0
Carolina 1 0 0 0 0 0 0 0 0 0 0 0 1 0 0 0 0 1 0 0
Caseara 1 0 0 0 0 0 0 0 0 0 0 1 1 1 0 0 0 1 0 0
Caxiuanã 0 0 0 0 0 0 0 0 0 0 0 1 0 0 0 0 0 0 0 0
Cerejeiras 0 0 0 0 0 0 0 0 0 0 1 0 0 0 0 0 0 0 0 0
Cocos 1 0 0 0 0 0 0 0 0 0 0 0 0 0 0 0 0 1 0 0
Cruzeiro do Sul 0 0 1 1 1 0 0 0 0 0 1 1 0 0 0 0 0 1 0 0
Dubulay 0 0 0 0 0 0 0 0 0 0 0 1 0 0 1 1 0 1 1 0
Emas 1 0 0 0 0 0 0 0 0 0 0 0 1 0 0 0 0 0 0 1
Espigão do Oeste 0 0 0 1 0 1 0 0 0 0 1 1 0 0 0 0 0 1 0 0
Guajará-Mirim 0 0 0 1 0 0 0 0 0 0 1 1 0 0 0 0 0 0 0 0
Humaitá 0 1 0 0 0 0 0 0 0 0 1 0 0 0 0 0 0 0 0 0
Juara 0 0 0 0 0 0 0 0 0 0 0 0 0 0 0 0 0 1 0 0
Juruti 0 1 0 0 0 0 0 0 0 0 1 1 0 0 0 0 0 0 0 0
Konawaruk 0 0 0 0 0 0 0 1 0 0 0 1 0 0 0 0 0 0 0 0
Marabá 0 0 0 0 0 0 0 0 0 1 0 1 0 0 0 0 0 0 0 0
Mateiros 1 1 0 0 0 0 0 0 0 0 0 0 0 1 0 0 0 1 0 0 0
Mateiros 2 1 0 0 0 0 0 0 0 0 0 0 0 1 1 0 0 1 0 0 0
Minaçú 1 0 0 0 0 0 0 0 0 0 0 0 1 0 0 0 0 0 0 0

62
Community sp42 sp43 sp44 sp45 sp46 sp47 sp48 sp49 sp50 sp51 sp52 sp53 sp54 sp55 sp56 sp57 sp58 sp59 sp60 sp61
Monte Alegre 0 0 0 0 0 0 0 0 0 0 0 1 0 0 0 1 0 1 0 0
Nova Xavantina 1 0 0 0 0 0 0 0 0 0 0 0 1 0 0 0 0 1 0 0
Novo Progresso 0 0 0 0 0 0 0 0 0 1 0 1 0 0 0 0 0 1 0 0
Palmas 1 0 0 0 0 0 0 0 0 0 0 0 1 0 0 0 0 0 0 0
Paracatu 1 0 0 0 0 0 1 0 0 0 0 0 0 0 0 0 0 0 0 0
Paranã 0 0 0 0 0 0 0 0 0 0 0 0 1 0 0 0 0 0 0 0
Pimenta Bueno 0 0 0 0 0 0 0 0 0 0 0 0 0 0 0 0 0 0 0 0
Purus 0 1 0 0 0 0 0 0 0 0 1 1 0 0 0 0 0 0 0 0
Querência 0 0 0 0 0 0 0 0 0 0 0 0 0 0 0 0 0 1 0 0
Ribeirão Cascalheira 0 0 0 0 0 0 0 0 0 0 0 0 0 0 0 0 0 1 0 0
Rio Preto da Eva 0 0 0 0 0 0 0 0 0 0 0 1 0 0 0 0 0 1 0 0
Santa Terezinha 0 0 0 0 0 0 0 0 0 0 0 0 0 0 0 0 0 0 0 1
Santarém 0 0 0 0 0 0 0 0 0 0 0 1 0 0 0 0 0 1 0 0
São Domingos 1 0 0 0 0 0 0 0 0 0 0 0 1 0 0 0 0 0 0 0
Silvânia 1 0 0 0 0 0 0 0 0 0 0 0 0 0 0 0 0 0 0 0
Trairão 0 0 0 0 0 0 0 0 0 0 0 1 0 0 0 0 0 0 0 0
Vila Bela 0 0 0 0 0 0 0 0 0 0 0 1 0 0 0 0 0 1 0 1
Vilhena 0 0 0 0 0 0 0 0 0 0 0 0 0 0 0 0 0 0 0 0
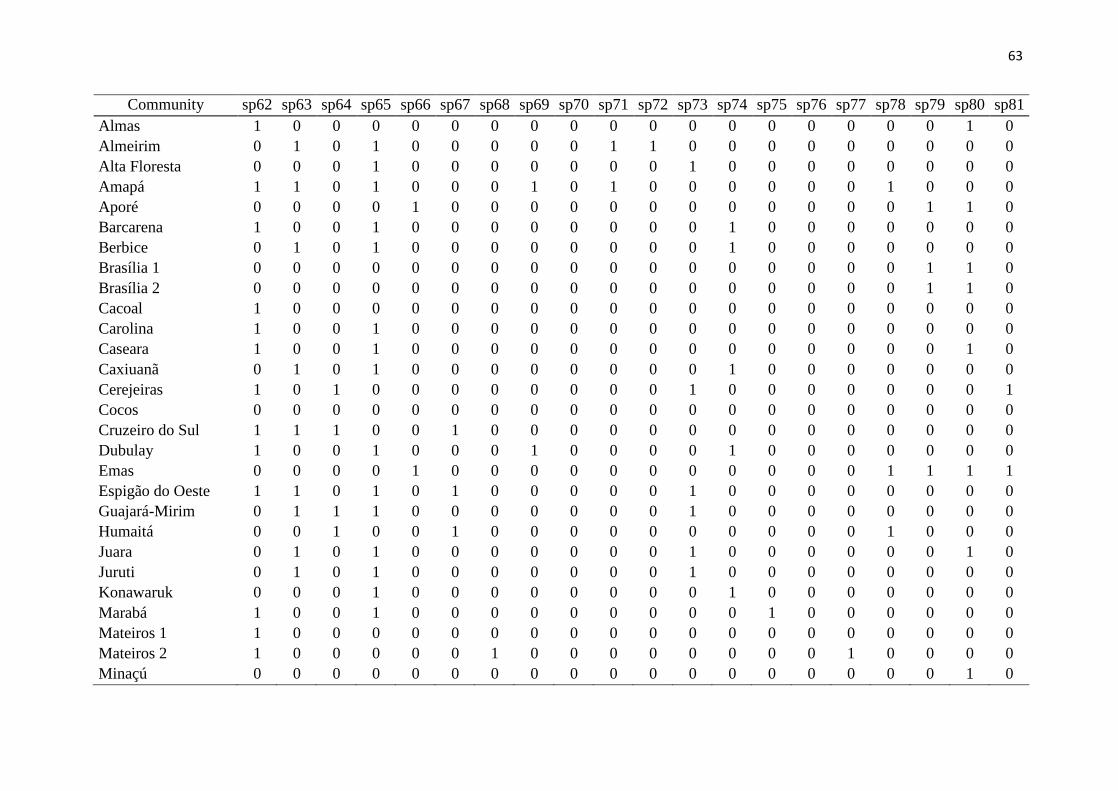
63
Community sp62 sp63 sp64 sp65 sp66 sp67 sp68 sp69 sp70 sp71 sp72 sp73 sp74 sp75 sp76 sp77 sp78 sp79 sp80 sp81
Almas 1 0 0 0 0 0 0 0 0 0 0 0 0 0 0 0 0 0 1 0
Almeirim 0 1 0 1 0 0 0 0 0 1 1 0 0 0 0 0 0 0 0 0
Alta Floresta 0 0 0 1 0 0 0 0 0 0 0 1 0 0 0 0 0 0 0 0
Amapá 1 1 0 1 0 0 0 1 0 1 0 0 0 0 0 0 1 0 0 0
Aporé 0 0 0 0 1 0 0 0 0 0 0 0 0 0 0 0 0 1 1 0
Barcarena 1 0 0 1 0 0 0 0 0 0 0 0 1 0 0 0 0 0 0 0
Berbice 0 1 0 1 0 0 0 0 0 0 0 0 1 0 0 0 0 0 0 0
Brasília 1 0 0 0 0 0 0 0 0 0 0 0 0 0 0 0 0 0 1 1 0
Brasília 2 0 0 0 0 0 0 0 0 0 0 0 0 0 0 0 0 0 1 1 0
Cacoal 1 0 0 0 0 0 0 0 0 0 0 0 0 0 0 0 0 0 0 0
Carolina 1 0 0 1 0 0 0 0 0 0 0 0 0 0 0 0 0 0 0 0
Caseara 1 0 0 1 0 0 0 0 0 0 0 0 0 0 0 0 0 0 1 0
Caxiuanã 0 1 0 1 0 0 0 0 0 0 0 0 1 0 0 0 0 0 0 0
Cerejeiras 1 0 1 0 0 0 0 0 0 0 0 1 0 0 0 0 0 0 0 1
Cocos 0 0 0 0 0 0 0 0 0 0 0 0 0 0 0 0 0 0 0 0
Cruzeiro do Sul 1 1 1 0 0 1 0 0 0 0 0 0 0 0 0 0 0 0 0 0
Dubulay 1 0 0 1 0 0 0 1 0 0 0 0 1 0 0 0 0 0 0 0
Emas 0 0 0 0 1 0 0 0 0 0 0 0 0 0 0 0 1 1 1 1
Espigão do Oeste 1 1 0 1 0 1 0 0 0 0 0 1 0 0 0 0 0 0 0 0
Guajará-Mirim 0 1 1 1 0 0 0 0 0 0 0 1 0 0 0 0 0 0 0 0
Humaitá 0 0 1 0 0 1 0 0 0 0 0 0 0 0 0 0 1 0 0 0
Juara 0 1 0 1 0 0 0 0 0 0 0 1 0 0 0 0 0 0 1 0
Juruti 0 1 0 1 0 0 0 0 0 0 0 1 0 0 0 0 0 0 0 0
Konawaruk 0 0 0 1 0 0 0 0 0 0 0 0 1 0 0 0 0 0 0 0
Marabá 1 0 0 1 0 0 0 0 0 0 0 0 0 1 0 0 0 0 0 0
Mateiros 1 1 0 0 0 0 0 0 0 0 0 0 0 0 0 0 0 0 0 0 0
Mateiros 2 1 0 0 0 0 0 1 0 0 0 0 0 0 0 0 1 0 0 0 0
Minaçú 0 0 0 0 0 0 0 0 0 0 0 0 0 0 0 0 0 0 1 0

64
Community sp62 sp63 sp64 sp65 sp66 sp67 sp68 sp69 sp70 sp71 sp72 sp73 sp74 sp75 sp76 sp77 sp78 sp79 sp80 sp81
Monte Alegre 1 0 0 0 0 0 0 1 0 0 0 0 0 0 0 0 0 0 0 0
Nova Xavantina 1 0 0 0 0 0 0 0 1 0 0 0 0 0 0 0 0 0 1 1
Novo Progresso 1 1 0 1 0 0 0 0 0 0 0 1 0 0 0 0 0 0 0 1
Palmas 1 0 0 1 0 0 0 0 0 0 0 0 0 0 0 0 0 0 1 1
Paracatu 0 0 0 0 1 0 0 0 0 0 0 0 0 0 0 0 0 1 1 1
Paranã 1 0 0 0 0 0 0 0 0 0 0 0 0 0 0 0 0 0 0 0
Pimenta Bueno 0 1 1 0 0 0 0 0 0 0 0 0 0 0 0 0 0 0 0 0
Purus 1 1 1 0 0 1 0 0 0 0 0 1 1 0 0 0 1 0 0 0
Querência 0 0 0 0 0 0 0 0 0 0 0 0 0 0 0 0 0 0 1 0
Ribeirão Cascalheira 0 0 0 1 0 0 0 0 0 0 0 0 0 0 0 0 0 0 1 0
Rio Preto da Eva 0 1 0 1 0 0 0 0 0 0 0 0 1 0 0 0 0 0 0 0
Santa Terezinha 1 0 0 0 0 0 0 0 0 0 0 0 0 0 0 0 0 0 1 1
Santarém 1 0 0 0 0 0 0 0 0 0 0 0 0 0 0 0 0 0 0 0
São Domingos 1 0 0 0 0 0 0 0 0 0 0 0 0 0 1 0 0 0 0 0
Silvânia 0 0 0 0 0 0 0 0 0 0 0 0 0 0 0 0 0 0 1 0
Trairão 0 1 0 1 0 0 0 0 0 0 0 1 1 0 0 0 0 0 0 0
Vila Bela 0 0 1 0 0 0 0 0 0 0 0 0 0 0 0 0 0 0 1 1
Vilhena 0 1 1 0 0 0 0 0 1 0 0 0 0 0 0 0 0 0 1 0

65
Community sp82 sp83 sp84 sp85 sp86 sp87 sp88 sp89 sp90 sp91 sp92 sp93 sp94 sp95 sp96 sp97 sp98 sp99 sp100
Almas 1 1 0 0 1 0 0 0 1 0 0 1 0 0 0 0 0 0 0
Almeirim 0 0 0 0 0 0 0 0 0 0 1 0 0 0 0 0 0 0 0
Alta Floresta 0 1 0 0 0 0 0 0 0 0 0 0 1 0 0 0 0 0 0
Amapá 0 1 0 0 0 0 0 0 0 1 1 0 0 0 1 0 0 0 0
Aporé 0 1 0 1 0 0 0 1 0 0 0 1 0 0 0 0 0 0 0
Barcarena 0 1 0 0 0 0 0 0 0 0 1 0 1 0 0 0 0 0 0
Berbice 0 1 0 0 0 1 0 0 0 0 1 0 0 0 0 0 0 0 0
Brasília 1 0 1 0 1 0 0 0 0 0 0 0 1 0 0 0 0 0 0 0
Brasília 2 0 1 0 1 0 0 0 1 0 0 0 1 0 0 0 0 0 0 0
Cacoal 0 0 0 0 0 0 0 1 0 0 0 0 1 0 0 0 0 0 0
Carolina 1 1 0 0 1 0 0 0 0 0 0 0 0 0 0 0 0 0 0
Caseara 0 1 0 0 1 0 0 0 0 0 0 1 0 0 0 0 0 0 0
Caxiuanã 0 1 0 0 0 0 0 0 0 1 1 0 0 0 0 1 0 0 0
Cerejeiras 0 1 0 0 0 0 0 0 0 0 1 0 0 0 0 0 0 0 0
Cocos 1 0 0 0 0 0 0 0 0 0 0 1 0 0 0 0 0 0 1
Cruzeiro do Sul 0 1 0 0 0 0 0 0 0 1 1 0 0 0 1 1 0 1 0
Dubulay 0 0 0 0 0 0 0 0 0 0 1 0 1 0 1 0 0 0 0
Emas 0 0 0 1 1 0 0 1 0 0 0 1 0 0 0 0 0 0 0
Espigão do Oeste 0 1 0 0 0 0 0 0 0 1 1 0 0 0 0 0 0 0 0
Guajará-Mirim 0 1 0 0 1 0 0 0 0 1 1 0 1 0 0 0 0 0 0
Humaitá 0 1 0 0 0 0 0 0 0 0 1 0 0 0 0 1 0 0 0
Juara 0 1 0 1 0 0 0 0 0 0 0 0 0 0 0 0 0 0 0
Juruti 0 1 0 0 0 0 0 0 0 1 1 0 0 0 1 1 0 0 0
Konawaruk 0 1 0 0 0 0 1 0 0 1 1 0 0 0 1 0 0 0 0
Marabá 0 1 0 0 0 0 0 0 0 0 1 0 0 0 0 0 0 0 0
Mateiros 1 1 1 0 0 1 0 0 0 0 0 0 1 0 0 0 0 0 0 0
Mateiros 2 0 1 0 0 1 0 0 0 0 0 0 1 0 0 0 0 0 0 0
Minaçú 0 1 0 0 1 0 0 0 0 0 0 1 0 0 0 0 0 0 0

66
Community sp82 sp83 sp84 sp85 sp86 sp87 sp88 sp89 sp90 sp91 sp92 sp93 sp94 sp95 sp96 sp97 sp98 sp99 sp100
Monte Alegre 0 1 0 0 0 0 0 0 0 0 0 0 0 0 0 0 0 0 0
Nova Xavantina 0 1 0 1 1 0 0 0 0 0 0 1 0 0 0 0 0 0 0
Novo Progresso 0 1 0 0 1 0 0 0 0 1 0 0 0 1 0 0 0 0 0
Palmas 0 0 0 0 1 0 0 0 0 0 0 0 0 0 0 0 0 0 0
Paracatu 0 1 0 1 0 0 0 1 0 0 0 1 0 0 0 0 0 0 0
Paranã 1 1 0 0 1 0 0 0 1 0 0 0 0 0 0 0 0 0 0
Pimenta Bueno 0 1 0 1 0 0 0 0 0 0 0 0 0 0 0 0 0 0 0
Purus 0 1 0 0 0 0 0 0 0 1 1 0 0 0 0 1 0 0 0
Querência 0 0 0 0 0 0 0 0 0 0 0 0 0 0 0 0 0 0 0
Ribeirão Cascalheira 0 1 0 1 0 0 0 0 0 0 0 1 0 0 0 0 0 0 0
Rio Preto da Eva 0 1 0 0 0 1 0 0 0 1 1 0 0 0 1 0 0 0 0
Santa Terezinha 0 0 0 1 0 0 0 0 0 0 0 0 0 0 0 0 0 0 0
Santarém 0 1 0 0 0 0 0 0 0 1 0 0 0 0 0 0 0 0 0
São Domingos 0 1 1 0 1 0 0 0 1 0 0 1 0 0 0 0 0 0 0
Silvânia 0 1 0 1 0 0 0 1 0 0 0 1 0 0 0 0 0 0 0
Trairão 0 1 0 0 0 0 0 0 0 1 1 0 0 1 0 1 0 0 0
Vila Bela 0 1 0 0 0 0 0 0 0 0 0 0 0 0 0 0 1 0 0
Vilhena 0 1 0 1 0 0 0 0 0 0 0 1 0 0 0 0 0 0 0

67
Community sp101 sp102 sp103 sp104 sp105 sp106 sp107 sp108 sp109 sp110 sp111 sp112 sp113 sp114 sp115 sp116
Almas 0 0 0 0 0 0 0 0 0 0 0 0 1 0 0 0
Almeirim 0 0 0 0 1 0 0 0 0 0 0 0 0 0 0 0
Alta Floresta 0 0 0 0 0 0 0 0 0 0 0 0 0 0 0 0
Amapá 0 0 0 0 1 0 0 0 0 0 0 0 0 0 0 0
Aporé 0 1 0 0 0 0 0 0 0 0 0 1 0 0 0 1
Barcarena 0 0 1 0 0 0 0 0 0 0 0 0 0 0 0 0
Berbice 0 0 1 0 0 0 0 0 0 0 0 0 0 0 0 0
Brasília 1 0 0 0 0 0 0 0 0 0 0 0 1 0 0 1 0
Brasília 2 0 0 0 0 0 0 0 0 0 0 0 1 0 0 1 1
Cacoal 0 0 1 0 0 0 0 0 0 0 0 0 0 0 0 0
Carolina 0 0 0 0 0 0 0 0 0 0 0 0 1 0 0 0
Caseara 0 0 0 0 0 0 0 0 0 0 0 0 1 0 1 0
Caxiuanã 0 0 0 0 1 0 0 0 0 0 0 0 0 0 0 0
Cerejeiras 0 0 0 0 0 0 0 0 0 0 0 0 0 0 0 0
Cocos 0 0 0 0 0 0 0 0 0 0 0 0 1 1 0 1
Cruzeiro do Sul 0 0 0 1 0 0 0 0 0 0 0 0 0 0 0 0
Dubulay 0 0 1 0 0 0 0 0 0 1 0 0 0 0 0 0
Emas 0 1 0 0 0 0 0 0 1 0 0 0 0 0 0 1
Espigão do Oeste 1 1 1 0 0 0 0 0 0 0 0 0 0 0 0 0
Guajará-Mirim 0 0 0 0 0 0 0 0 0 0 0 0 0 1 0 0
Humaitá 0 0 0 0 0 1 0 0 0 0 0 0 0 0 0 0
Juara 0 0 0 0 0 0 0 0 0 0 0 1 0 0 0 0
Juruti 0 0 1 0 0 0 0 0 0 0 0 0 0 0 0 0
Konawaruk 0 0 1 0 0 0 0 0 0 0 0 0 0 0 0 0
Marabá 0 0 1 0 0 0 0 0 0 0 0 0 0 0 0 0
Mateiros 1 0 0 0 0 0 0 0 0 0 0 0 0 1 0 0 0
Mateiros 2 0 0 0 0 0 0 0 0 0 0 0 0 1 0 0 0
Minaçú 0 0 0 0 0 0 0 0 0 0 0 1 1 0 0 0

68
Community sp101 sp102 sp103 sp104 sp105 sp106 sp107 sp108 sp109 sp110 sp111 sp112 sp113 sp114 sp115 sp116
Monte Alegre 0 0 0 0 0 0 0 0 0 1 0 0 0 0 0 0
Nova Xavantina 0 0 0 0 0 0 0 0 0 0 0 1 1 0 1 0
Novo Progresso 0 0 0 0 0 0 0 0 0 0 1 0 0 0 0 0
Palmas 0 0 0 0 0 0 0 0 0 0 0 0 1 0 1 0
Paracatu 0 0 0 0 0 0 0 0 0 0 0 1 0 0 0 0
Paranã 0 0 0 0 0 0 0 0 0 0 0 0 1 0 1 0
Pimenta Bueno 0 1 0 0 0 0 0 0 0 0 0 0 0 0 0 0
Purus 0 0 0 1 0 0 0 0 0 0 0 0 0 0 0 0
Querência 0 0 0 0 0 0 0 0 0 0 0 1 0 0 1 0
Ribeirão Cascalheira 0 0 0 0 0 0 0 0 0 0 0 1 0 0 0 0
Rio Preto da Eva 0 0 0 0 1 0 0 0 0 0 0 0 0 0 0 0
Santa Terezinha 0 0 0 0 0 0 0 0 0 0 0 0 0 0 1 0
Santarém 0 0 1 0 0 0 0 0 0 0 0 0 0 0 0 0
São Domingos 0 0 0 0 0 0 0 0 0 0 0 0 1 1 1 0
Silvânia 0 1 0 0 0 0 0 0 0 0 0 1 0 0 1 1
Trairão 0 0 0 0 0 0 0 0 0 0 0 0 0 0 0 0
Vila Bela 0 0 0 0 0 0 1 1 0 0 0 0 0 0 0 0
Vilhena 0 1 0 0 0 0 0 0 0 0 0 0 0 0 0 0

69
Community sp117 sp118 sp119 sp120 sp121 sp122 sp123
Almas 0 0 0 0 0 0 0
Almeirim 0 0 0 0 0 0 0
Alta Floresta 0 0 1 0 0 1 0
Amapá 0 0 1 0 0 1 0
Aporé 1 0 0 0 0 0 0
Barcarena 0 0 0 0 0 1 0
Berbice 0 0 0 0 0 1 0
Brasília 1 0 0 0 0 0 0 0
Brasília 2 0 0 0 0 0 0 0
Cacoal 0 0 0 0 0 0 0
Carolina 1 0 1 0 0 0 0
Caseara 0 0 1 0 0 0 0
Caxiuanã 0 0 0 0 0 0 0
Cerejeiras 1 0 1 0 0 0 0
Cocos 0 0 0 0 0 0 1
Cruzeiro do Sul 0 0 1 0 0 0 0
Dubulay 0 0 1 0 0 1 0
Emas 1 0 0 0 0 0 1
Espigão do Oeste 0 0 1 0 0 1 0
Guajará-Mirim 0 0 0 0 1 0 0
Humaitá 1 0 0 0 0 1 0
Juara 0 0 0 0 0 1 0
Juruti 0 0 0 1 0 1 0
Konawaruk 0 0 1 0 0 1 0
Marabá 0 0 0 0 0 1 0
Mateiros 1 0 1 0 0 0 0 1
Mateiros 2 1 1 0 0 0 0 1
Minaçú 0 0 0 0 0 0 0

70
Community sp117 sp118 sp119 sp120 sp121 sp122 sp123
Monte Alegre 0 0 1 0 0 0 0
Nova Xavantina 1 1 0 0 0 0 0
Novo Progresso 0 0 1 0 0 0 0
Palmas 1 1 0 0 0 0 0
Paracatu 0 0 0 0 0 0 0
Paranã 0 1 1 0 0 0 0
Pimenta Bueno 1 0 0 0 0 0 0
Purus 0 0 1 1 0 1 0
Querência 0 0 0 0 0 0 0
Ribeirão Cascalheira 1 0 1 0 0 0 0
Rio Preto da Eva 0 0 1 0 0 0 0
Santa Terezinha 0 0 1 0 0 0 0
Santarém 0 0 0 0 0 0 0
São Domingos 1 1 0 0 0 0 0
Silvânia 1 0 0 0 0 0 0
Trairão 0 0 1 0 0 1 0
Vila Bela 1 0 1 0 0 0 0
Vilhena 1 0 0 0 0 0 0

71
Appendix 2
Table A2. Functional attributes matrix for each species. The species numbers follow the coding in Table A1. Max_size: maximum size reached;
Dimorp_fem: females larger than males (1 and 0); Dimorp_mal: males larger than females (1 and 0); Dimorp_no: no dimorphism (1 and 0);
Habitat_for: forest habitat; Habita_open: open habitat; Microhab_arb: arboreal microhabitat use; Microhab_semiarb: semi-arboreal microhabitat
use; Microhab_semiaqu: semi-aquatic microhabitat use; Microhab_fos: fossorial microhabitat use; Microhab_lit: leaf litter microhabitat use;
Microhab_terr: terrestrial microhabitat use; Microhab_saxi: saxicolus microhabitat use; Diet_carn: carnicore diet; Diet_herb: herbivore diet;
Forag_act: active foraging; Forag_sw: sit-and-wait foraging; Forag_mix: mixed foraging; Activ_diur: diurnal activity; Activ_noc: nocturnal
activity; Repr_ovi: oviparous reproduction; Repr_vivi: viviparous reproduction; Max_clutch: maximum clutch size; Temp: mean activity
temperature; Regtemp_helio: thermoregulator; Regtemp_conf: thermoconformer. NA: no data.
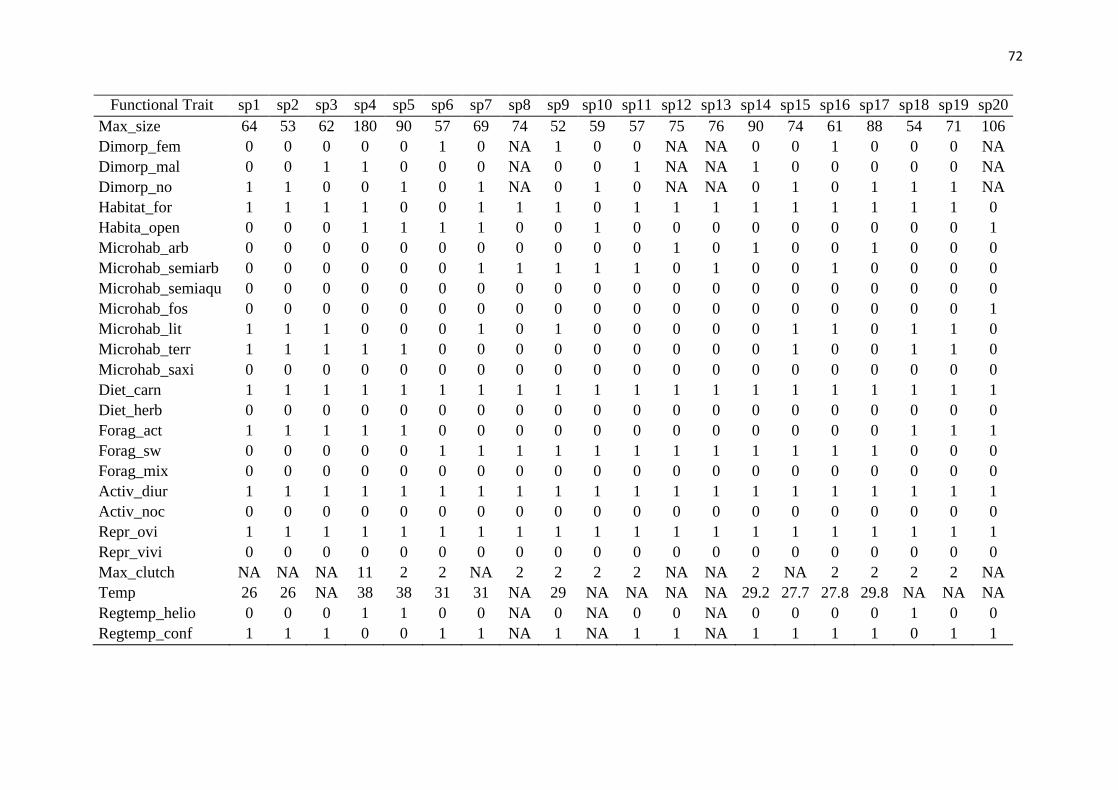
72
Functional Trait sp1 sp2 sp3 sp4 sp5 sp6 sp7 sp8 sp9 sp10 sp11 sp12 sp13 sp14 sp15 sp16 sp17 sp18 sp19 sp20
Max_size 64 53 62 180 90 57 69 74 52 59 57 75 76 90 74 61 88 54 71 106
Dimorp_fem 0 0 0 0 0 1 0 NA 1 0 0 NA NA 0 0 1 0 0 0 NA
Dimorp_mal 0 0 1 1 0 0 0 NA 0 0 1 NA NA 1 0 0 0 0 0 NA
Dimorp_no 1 1 0 0 1 0 1 NA 0 1 0 NA NA 0 1 0 1 1 1 NA
Habitat_for 1 1 1 1 0 0 1 1 1 0 1 1 1 1 1 1 1 1 1 0
Habita_open 0 0 0 1 1 1 1 0 0 1 0 0 0 0 0 0 0 0 0 1
Microhab_arb 0 0 0 0 0 0 0 0 0 0 0 1 0 1 0 0 1 0 0 0
Microhab_semiarb 0 0 0 0 0 0 1 1 1 1 1 0 1 0 0 1 0 0 0 0
Microhab_semiaqu 0 0 0 0 0 0 0 0 0 0 0 0 0 0 0 0 0 0 0 0
Microhab_fos 0 0 0 0 0 0 0 0 0 0 0 0 0 0 0 0 0 0 0 1
Microhab_lit 1 1 1 0 0 0 1 0 1 0 0 0 0 0 1 1 0 1 1 0
Microhab_terr 1 1 1 1 1 0 0 0 0 0 0 0 0 0 1 0 0 1 1 0
Microhab_saxi 0 0 0 0 0 0 0 0 0 0 0 0 0 0 0 0 0 0 0 0
Diet_carn 1 1 1 1 1 1 1 1 1 1 1 1 1 1 1 1 1 1 1 1
Diet_herb 0 0 0 0 0 0 0 0 0 0 0 0 0 0 0 0 0 0 0 0
Forag_act 1 1 1 1 1 0 0 0 0 0 0 0 0 0 0 0 0 1 1 1
Forag_sw 0 0 0 0 0 1 1 1 1 1 1 1 1 1 1 1 1 0 0 0
Forag_mix 0 0 0 0 0 0 0 0 0 0 0 0 0 0 0 0 0 0 0 0
Activ_diur 1 1 1 1 1 1 1 1 1 1 1 1 1 1 1 1 1 1 1 1
Activ_noc 0 0 0 0 0 0 0 0 0 0 0 0 0 0 0 0 0 0 0 0
Repr_ovi 1 1 1 1 1 1 1 1 1 1 1 1 1 1 1 1 1 1 1 1
Repr_vivi 0 0 0 0 0 0 0 0 0 0 0 0 0 0 0 0 0 0 0 0
Max_clutch NA NA NA 11 2 2 NA 2 2 2 2 NA NA 2 NA 2 2 2 2 NA
Temp 26 26 NA 38 38 31 31 NA 29 NA NA NA NA 29.2 27.7 27.8 29.8 NA NA NA
Regtemp_helio 0 0 0 1 1 0 0 NA 0 NA 0 0 NA 0 0 0 0 1 0 0
Regtemp_conf 1 1 1 0 0 1 1 NA 1 NA 1 1 NA 1 1 1 1 0 1 1

73
Functional Trait sp21 sp22 sp23 sp24 sp25 sp26 sp27 sp28 sp29 sp30 sp31 sp32 sp33 sp34 sp35 sp36 sp37 sp38 sp39 sp40
Max_size 82 80 80 80 107 74 78 47 47 65 43 NA 25 72 76 56 78 59 117 25
Dimorp_fem NA NA 1 NA NA NA NA 1 1 0 1 NA NA 0 1 0 0 0 0 NA
Dimorp_mal NA NA 0 NA NA NA NA 0 0 0 0 NA NA 0 0 0 1 0 1 NA
Dimorp_no NA NA 0 NA NA NA NA 0 0 1 0 NA NA 1 0 1 0 1 0 NA
Habitat_for 1 1 1 0 1 0 1 1 1 1 0 NA 1 1 0 0 0 0 1 1
Habita_open 0 0 0 1 0 1 0 0 0 1 1 NA 0 1 1 1 1 1 1 1
Microhab_arb 0 0 0 0 0 0 0 0 0 0 0 0 0 0 0 0 0 0 0 0
Microhab_semiarb 0 0 0 0 0 0 0 0 0 0 0 0 0 0 0 0 0 0 0 0
Microhab_semiaqu 0 0 0 0 0 0 0 0 0 0 0 0 0 0 0 0 0 0 0 0
Microhab_fos 1 1 1 1 1 1 1 0 0 0 0 0 0 0 0 0 0 0 0 0
Microhab_lit 0 0 0 0 0 0 0 1 0 1 1 1 1 0 0 0 0 0 0 1
Microhab_terr 0 0 0 0 0 0 0 1 1 0 0 0 1 1 1 1 1 1 1 1
Microhab_saxi 0 0 0 0 0 0 0 0 0 0 0 0 0 0 0 0 0 0 0 0
Diet_carn 1 1 1 1 1 1 1 1 1 1 1 1 1 1 1 1 1 1 1 1
Diet_herb 0 0 0 0 0 0 0 0 0 0 0 0 0 0 0 0 0 0 0 0
Forag_act 1 1 1 1 1 1 1 1 1 1 1 1 0 1 1 1 1 1 1 0
Forag_sw 0 0 0 0 0 0 0 0 0 0 0 0 1 0 0 0 0 0 0 1
Forag_mix 0 0 0 0 0 0 0 0 0 0 0 0 0 0 0 0 0 0 0 0
Activ_diur NA NA 0 NA NA NA NA 1 1 1 1 1 1 1 1 1 1 1 1 1
Activ_noc NA NA 1 NA NA NA NA 0 0 0 0 0 0 0 0 0 0 0 0 1
Repr_ovi 1 1 1 1 1 1 1 1 1 1 1 1 1 1 1 1 1 1 1 1
Repr_vivi 0 0 0 0 0 0 0 0 0 0 0 0 0 0 0 0 0 0 0 0
Max_clutch NA NA 1 NA NA NA NA 2 NA NA 2 NA 1 3 3 1 4 1 4 1
Temp NA NA NA NA NA NA NA NA 27.2 NA NA NA NA 39.4 37.7 37 38 36.9 37.5 NA
Regtemp_helio 0 0 0 0 0 0 0 1 1 1 1 1 0 1 1 1 1 1 1 0
Regtemp_conf 1 1 1 1 1 1 1 0 0 0 0 0 1 0 0 0 0 0 0 1

74
Functional Trait sp41 sp42 sp43 sp44 sp45 sp46 sp47 sp48 sp49 sp50 sp51 sp52 sp53 sp54 sp55 sp56 sp57 sp58 sp59 sp60
Max_size 25 55 250 360 157 117 115 NA 50 55 34 46 42 54 48 39 40 64 68 71
Dimorp_fem NA 0 0 NA 0 0 1 NA NA NA NA 1 0 1 1 NA NA NA 0 NA
Dimorp_mal NA 1 0 NA 1 0 0 NA NA NA NA 0 1 0 0 NA NA NA 0 NA
Dimorp_no NA 0 1 NA 0 1 0 NA NA NA NA 0 0 0 0 NA NA NA 1 NA
Habitat_for 1 1 1 1 1 1 1 NA 1 1 1 1 1 0 0 NA 0 0 1 1
Habita_open 0 1 0 0 0 0 0 NA 0 0 0 0 0 1 1 NA 1 1 1 1
Microhab_arb 0 0 0 0 0 0 0 0 0 0 0 0 1 0 0 0 0 0 0 0
Microhab_semiarb 0 0 0 0 1 1 1 1 0 1 1 1 0 0 0 0 0 1 1 1
Microhab_semiaqu 0 0 1 1 0 0 0 0 0 0 0 0 0 0 0 0 0 0 0 0
Microhab_fos 0 0 0 0 0 0 0 0 0 0 0 0 0 0 0 0 0 0 0 0
Microhab_lit 1 1 0 0 0 0 0 0 0 0 0 0 0 0 0 1 1 0 0 0
Microhab_terr 1 1 0 0 0 0 0 0 1 0 0 0 0 1 1 1 1 0 0 0
Microhab_saxi 0 0 0 0 0 0 0 0 0 0 0 0 0 1 0 0 0 0 0 1
Diet_carn 1 1 1 1 1 1 1 1 1 1 1 1 1 1 1 1 1 1 1 1
Diet_herb 0 0 0 0 0 0 0 0 0 0 0 0 0 0 0 0 0 0 0 0
Forag_act 0 1 1 1 0 0 0 0 0 0 0 0 0 0 0 1 1 0 0 0
Forag_sw 1 0 0 0 1 1 1 1 1 1 1 1 1 1 1 0 0 1 1 1
Forag_mix 0 0 0 0 0 0 0 0 0 0 0 0 0 0 0 0 0 0 0 0
Activ_diur 1 1 1 1 1 1 1 1 1 1 1 1 1 0 0 NA NA 0 0 0
Activ_noc 0 0 0 0 0 0 0 0 0 0 0 0 0 1 1 NA NA 1 1 1
Repr_ovi 1 1 1 1 1 1 1 1 1 1 1 1 1 1 1 1 1 1 1 1
Repr_vivi 0 0 0 0 0 0 0 0 0 0 0 0 0 0 0 0 0 0 0 0
Max_clutch 1 NA 6 6 7 4 14 NA 2 NA NA 1 1 2 2 NA NA NA 2 NA
Temp NA NA 31.2 32.2 NA NA NA NA NA NA NA 30.6 30.3 30.2 NA NA NA NA 27.2 NA
Regtemp_helio 0 NA 1 1 NA NA NA NA NA NA 0 0 0 0 NA NA NA NA 0 0
Regtemp_conf 1 NA 0 0 NA NA NA NA NA NA 1 1 1 1 NA NA NA NA 1 1

75
Functional Trait sp61 sp62 sp63 sp64 sp65 sp66 sp67 sp68 sp69 sp70 sp71 sp72 sp73 sp74 sp75 sp76 sp77 sp78 sp79 sp80
Max_size 105 445 62 114 119 73 130 NA 127 65 35 39 37 37 NA 34 96 109 84 91
Dimorp_fem NA 0 NA 0 0 NA 0 NA 0 0 0 NA NA NA NA 1 1 1 1 1
Dimorp_mal NA 1 NA 1 1 NA 1 NA 1 1 0 NA NA NA NA 0 0 0 0 0
Dimorp_no NA 0 NA 0 0 NA 0 NA 0 0 1 NA NA NA NA 0 0 0 0 0
Habitat_for 0 1 1 1 1 1 1 NA 0 0 1 1 1 1 NA 0 0 1 1 0
Habita_open 1 1 0 0 0 1 0 NA 1 1 0 0 0 0 NA 1 1 0 1 1
Microhab_arb 0 0 0 0 0 0 0 0 0 0 0 0 0 0 0 1 0 0 0 0
Microhab_semiarb 0 1 0 0 0 0 0 0 0 0 0 0 0 0 0 0 0 1 0 1
Microhab_semiaqu 0 0 0 0 0 0 0 0 0 0 0 0 0 0 0 0 0 0 0 0
Microhab_fos 1 0 0 0 0 0 0 0 0 0 0 0 0 0 0 0 0 0 0 0
Microhab_lit 0 0 1 1 1 1 1 0 0 0 1 1 1 1 1 0 1 1 1 1
Microhab_terr 1 0 1 1 1 1 1 1 1 1 1 1 1 1 1 0 1 0 1 0
Microhab_saxi 0 0 0 0 0 0 0 0 0 0 0 0 0 0 0 0 0 0 0 1
Diet_carn 1 0 1 1 1 1 1 1 1 1 1 1 1 1 1 1 1 1 1 1
Diet_herb 0 1 0 0 0 0 0 0 0 0 0 0 0 0 0 0 0 0 0 0
Forag_act 0 0 1 1 1 1 1 1 1 1 0 1 1 1 1 0 0 0 0 0
Forag_sw 1 1 0 0 0 0 0 0 0 0 1 0 0 0 0 1 0 0 0 0
Forag_mix 0 0 0 0 0 0 0 0 0 0 0 0 0 0 0 0 1 1 1 1
Activ_diur 0 1 1 1 1 1 1 1 1 1 1 1 1 1 1 1 1 1 1 1
Activ_noc 1 0 0 0 0 0 0 0 0 0 1 0 0 1 0 0 0 0 0 0
Repr_ovi 1 1 1 1 1 1 1 1 1 1 1 1 1 1 1 1 0 0 0 0
Repr_vivi 0 0 0 0 0 0 0 0 0 0 0 0 0 0 0 0 1 1 1 1
Max_clutch NA 71 2 9 10 6 7 NA 12 6 1 2 NA 2 NA 2 9 9 9 8
Temp NA 38 28.2 35.9 36.5 NA 34.1 NA 37 NA NA NA NA NA NA NA 33.1 32.9 29.1 33.4
Regtemp_helio 0 1 NA 1 1 1 1 1 1 1 NA 0 0 0 NA NA 1 1 1 1
Regtemp_conf 1 0 NA 0 0 0 0 0 0 0 NA 1 1 1 NA NA 0 0 0 0
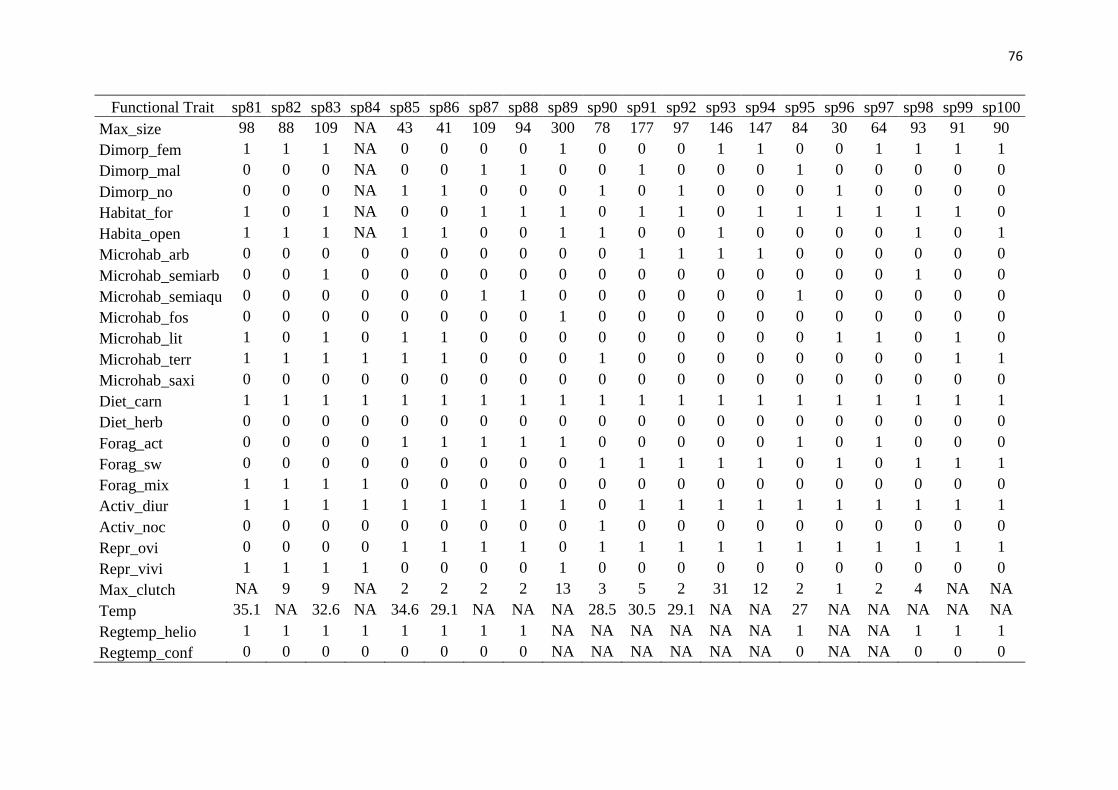
76
Functional Trait sp81 sp82 sp83 sp84 sp85 sp86 sp87 sp88 sp89 sp90 sp91 sp92 sp93 sp94 sp95 sp96 sp97 sp98 sp99 sp100
Max_size 98 88 109 NA 43 41 109 94 300 78 177 97 146 147 84 30 64 93 91 90
Dimorp_fem 1 1 1 NA 0 0 0 0 1 0 0 0 1 1 0 0 1 1 1 1
Dimorp_mal 0 0 0 NA 0 0 1 1 0 0 1 0 0 0 1 0 0 0 0 0
Dimorp_no 0 0 0 NA 1 1 0 0 0 1 0 1 0 0 0 1 0 0 0 0
Habitat_for 1 0 1 NA 0 0 1 1 1 0 1 1 0 1 1 1 1 1 1 0
Habita_open 1 1 1 NA 1 1 0 0 1 1 0 0 1 0 0 0 0 1 0 1
Microhab_arb 0 0 0 0 0 0 0 0 0 0 1 1 1 1 0 0 0 0 0 0
Microhab_semiarb 0 0 1 0 0 0 0 0 0 0 0 0 0 0 0 0 0 1 0 0
Microhab_semiaqu 0 0 0 0 0 0 1 1 0 0 0 0 0 0 1 0 0 0 0 0
Microhab_fos 0 0 0 0 0 0 0 0 1 0 0 0 0 0 0 0 0 0 0 0
Microhab_lit 1 0 1 0 1 1 0 0 0 0 0 0 0 0 0 1 1 0 1 0
Microhab_terr 1 1 1 1 1 1 0 0 0 1 0 0 0 0 0 0 0 0 1 1
Microhab_saxi 0 0 0 0 0 0 0 0 0 0 0 0 0 0 0 0 0 0 0 0
Diet_carn 1 1 1 1 1 1 1 1 1 1 1 1 1 1 1 1 1 1 1 1
Diet_herb 0 0 0 0 0 0 0 0 0 0 0 0 0 0 0 0 0 0 0 0
Forag_act 0 0 0 0 1 1 1 1 1 0 0 0 0 0 1 0 1 0 0 0
Forag_sw 0 0 0 0 0 0 0 0 0 1 1 1 1 1 0 1 0 1 1 1
Forag_mix 1 1 1 1 0 0 0 0 0 0 0 0 0 0 0 0 0 0 0 0
Activ_diur 1 1 1 1 1 1 1 1 1 0 1 1 1 1 1 1 1 1 1 1
Activ_noc 0 0 0 0 0 0 0 0 0 1 0 0 0 0 0 0 0 0 0 0
Repr_ovi 0 0 0 0 1 1 1 1 0 1 1 1 1 1 1 1 1 1 1 1
Repr_vivi 1 1 1 1 0 0 0 0 1 0 0 0 0 0 0 0 0 0 0 0
Max_clutch NA 9 9 NA 2 2 2 2 13 3 5 2 31 12 2 1 2 4 NA NA
Temp 35.1 NA 32.6 NA 34.6 29.1 NA NA NA 28.5 30.5 29.1 NA NA 27 NA NA NA NA NA
Regtemp_helio 1 1 1 1 1 1 1 1 NA NA NA NA NA NA 1 NA NA 1 1 1
Regtemp_conf 0 0 0 0 0 0 0 0 NA NA NA NA NA NA 0 NA NA 0 0 0

77
Functional Trait sp101 sp102 sp103 sp104 sp105 sp106 sp107 sp108 sp109 sp110 sp111 sp112 sp113 sp114 sp115 sp116
Max_size 99 81 115 126 62 52 90 109 125 130 86 90 97 NA 129 410
Dimorp_fem 0 1 0 0 0 0 0 0 0 0 0 0 0 NA 0 NA
Dimorp_mal 0 0 0 0 0 0 1 1 1 1 1 1 1 NA 1 NA
Dimorp_no 1 0 1 1 1 1 0 0 0 0 0 0 0 NA 0 NA
Habitat_for 1 0 1 1 1 1 0 0 0 0 0 0 0 NA 1 0
Habita_open 1 1 1 1 1 1 1 1 1 1 1 1 1 NA 1 1
Microhab_arb 0 0 1 1 0 0 0 0 0 0 0 0 0 0 0 0
Microhab_semiarb 0 0 0 0 0 0 0 0 1 1 0 0 0 0 1 0
Microhab_semiaqu 0 0 0 0 0 0 0 0 0 0 0 0 0 0 0 0
Microhab_fos 0 0 0 0 0 0 0 0 0 0 0 0 0 0 0 0
Microhab_lit 0 0 0 0 0 0 0 0 0 0 0 0 0 0 0 0
Microhab_terr 1 1 0 0 1 1 1 1 1 1 1 1 1 1 1 1
Microhab_saxi 0 0 0 0 0 0 1 1 1 1 0 1 1 0 1 0
Diet_carn 1 1 1 1 1 1 1 1 1 1 1 1 1 1 1 1
Diet_herb 0 0 0 0 0 0 0 0 0 0 0 0 0 0 0 0
Forag_act 0 0 0 0 1 1 0 0 0 0 0 0 0 0 0 1
Forag_sw 1 1 1 1 0 0 1 1 1 1 1 1 1 1 1 0
Forag_mix 0 0 0 0 0 0 0 0 0 0 0 0 0 0 0 0
Activ_diur 1 1 0 0 1 1 1 1 1 1 1 1 1 1 1 1
Activ_noc 0 0 1 1 0 0 0 0 0 0 0 0 0 0 0 0
Repr_ovi 1 1 1 1 1 1 1 1 1 1 1 1 1 1 1 1
Repr_vivi 0 0 0 0 0 0 0 0 0 0 0 0 0 0 0 0
Max_clutch NA NA 1 1 NA NA NA 5 NA 8 NA 8 5 NA 14 NA
Temp NA NA 27.1 26.4 NA NA NA NA 29.4 34.1 NA 33.07 35.8 NA 31.2 NA
Regtemp_helio 1 1 0 0 1 1 1 1 1 1 1 1 1 1 1 1
Regtemp_conf 0 0 1 1 0 0 0 0 0 0 0 0 0 0 0 0

78
Functional Trait sp117 sp118 sp119 sp120 sp121 sp122 sp123
Max_size 488 254 345 87 130 166 38
Dimorp_fem 0 NA 0 0 0 0 1
Dimorp_mal 1 NA 1 0 1 0 0
Dimorp_no 0 NA 0 1 0 1 0
Habitat_for 1 1 1 1 1 1 0
Habita_open 1 0 1 0 0 0 1
Microhab_arb 0 0 0 1 1 1 0
Microhab_semiarb 0 0 0 0 0 0 0
Microhab_semiaqu 0 0 0 0 0 0 0
Microhab_fos 0 0 0 0 0 0 0
Microhab_lit 0 0 0 0 0 0 1
Microhab_terr 1 1 1 0 0 0 1
Microhab_saxi 0 0 0 0 0 0 0
Diet_carn 1 1 1 1 1 1 1
Diet_herb 0 0 0 0 0 0 0
Forag_act 1 1 1 0 0 0 1
Forag_sw 0 0 0 1 1 1 0
Forag_mix 0 0 0 0 0 0 0
Activ_diur 1 1 1 1 1 1 1
Activ_noc 0 0 0 0 0 0 0
Repr_ovi 1 1 1 1 1 1 1
Repr_vivi 0 0 0 0 0 0 0
Max_clutch NA NA 49 2 2 8 2
Temp NA 37.2 35 NA 31.2 NA NA
Regtemp_helio 1 1 1 NA NA NA 1
Regtemp_conf 0 0 0 NA NA NA 0