Embed Size (px)
Citation preview
14/7/2016 Coordenadoria de Estatística e Pesquisa do TST http://www.tst.jus.br/estatistica [email protected] 1
INDICADORES ESTATÍSTICOS DA JUSTIÇA DO TRABALHO
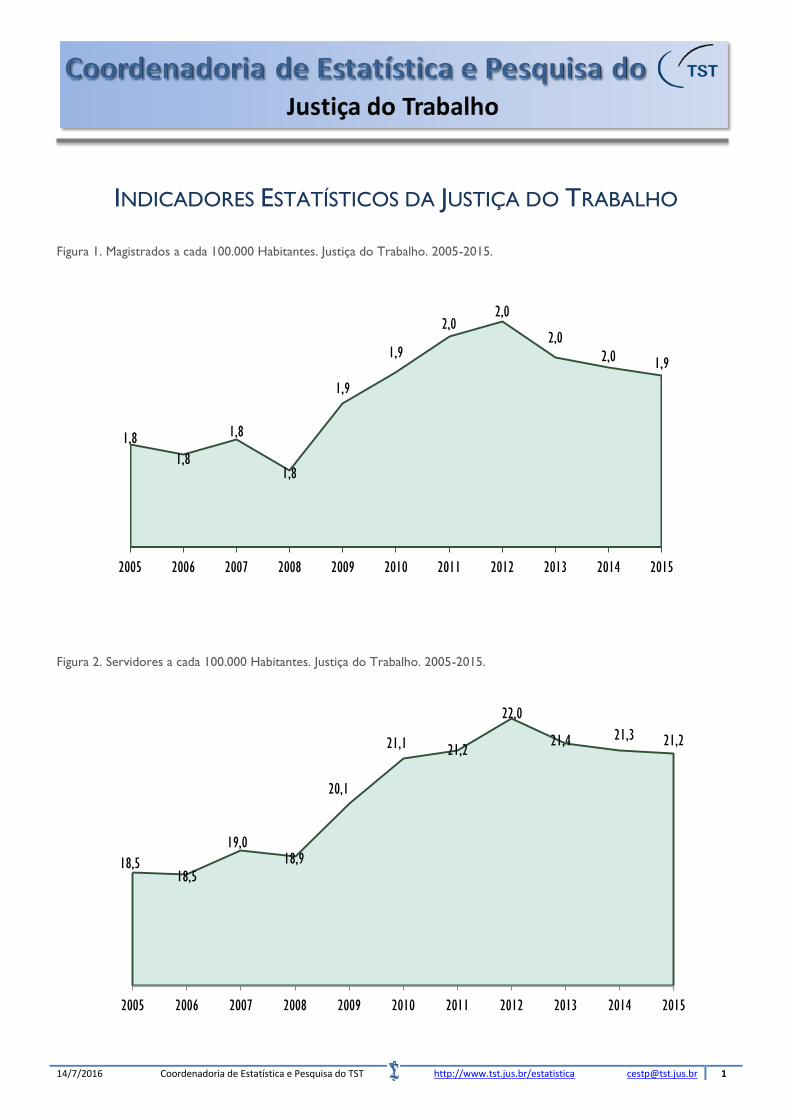
Figura 1. Magistrados a cada 100.000 Habitantes. Justiça do Trabalho. 2005-2015.
Figura 2. Servidores a cada 100.000 Habitantes. Justiça do Trabalho. 2005-2015.
1,8
1,8
1,8
1,8
1,9
1,9
2,0 2,0
2,0 2,0 1,9
2005 2006 2007 2008 2009 2010 2011 2012 2013 2014 2015
18,5 18,5
19,0 18,9
20,1
21,1 21,2
22,0
21,4 21,3 21,2
2005 2006 2007 2008 2009 2010 2011 2012 2013 2014 2015

14/7/2016 Coordenadoria de Estatística e Pesquisa do TST http://www.tst.jus.br/estatistica [email protected] 2
Figura 3. Servidores do Quadro Permanente por Magistrado. Justiça do Trabalho. 2005-2015.
Figura 4. Servidores em Atividade na Área Judiciária por Magistrado. Justiça do Trabalho. 2005-2015.
10,8
10,6
10,6
10,2 10,2
10,4
10,1
10,3
10,9 10,9 10,9
2005 2006 2007 2008 2009 2010 2011 2012 2013 2014 2015
9,5
9,0 8,8
8,4
8,7
8,9 9,1
9,4
9,3
9,1 9,2
2005 2006 2007 2008 2009 2010 2011 2012 2013 2014 2015

14/7/2016 Coordenadoria de Estatística e Pesquisa do TST http://www.tst.jus.br/estatistica [email protected] 3
Figura 5. Despesa da Justiça do Trabalho por Habitante (em Reais). 2005-2015.
Figura 6. Despesa da Justiça do Trabalho por Caso Novo (em Reais). 2011-2015.
37,06
42,55 45,08
50,99
56,37
59,67 60,16 62,44
66,37
75,58
83,96
2005 2006 2007 2008 2009 2010 2011 2012 2013 2014 2015
4.061,34
3.951,18
4.049,91
4.485,67
4.907,80
2011 2012 2013 2014 2015
14/7/2016 Coordenadoria de Estatística e Pesquisa do TST http://www.tst.jus.br/estatistica [email protected] 4
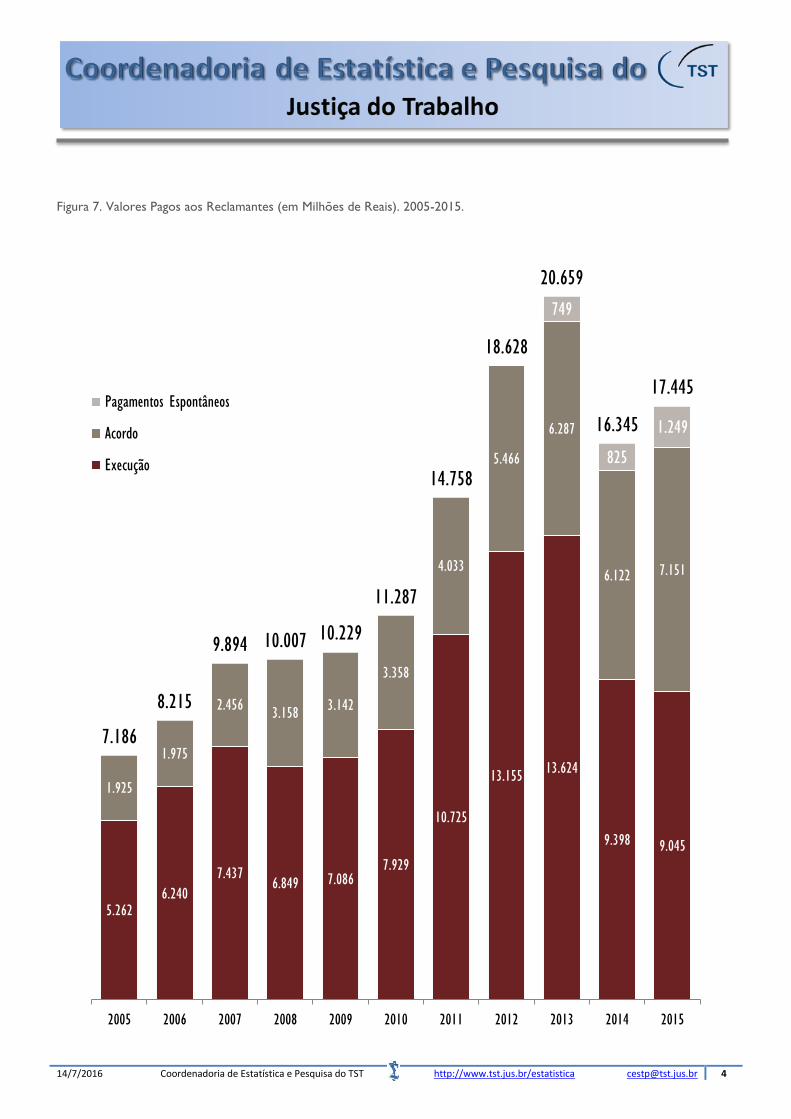
Figura 7. Valores Pagos aos Reclamantes (em Milhões de Reais). 2005-2015.
5.262 6.240
7.437 6.849 7.086
7.929
10.725
13.155 13.624
9.398 9.045
1.925
1.975
2.456 3.158
3.142
3.358
4.033
5.466
6.287
6.122 7.151
749
825
1.249
7.186
8.215
9.894 10.007 10.229
11.287
14.758
18.628
20.659
16.345
17.445
2005 2006 2007 2008 2009 2010 2011 2012 2013 2014 2015
Pagamentos Espontâneos
Acordo
Execução

14/7/2016 Coordenadoria de Estatística e Pesquisa do TST http://www.tst.jus.br/estatistica [email protected] 5
Figura 8. Casos Novos por 100.000 Habitantes no TST. 2006-2015.
Figura 8.2. Casos Novos por 100.000 Habitantes na 2ª Instância. 2006-2015.
84
90
78
82 85
88
95
119 121
102
2006 2007 2008 2009 2010 2011 2012 2013 2014 2015
235
289
281
259
299 296
329 326 327 327
2006 2007 2008 2009 2010 2011 2012 2013 2014 2015

14/7/2016 Coordenadoria de Estatística e Pesquisa do TST http://www.tst.jus.br/estatistica [email protected] 6
Figura 8.3. Casos Novos por 100.000 Habitantes na 1ª Instância. 2006-2015.
Figura 9.1. Casos Novos por Magistrado no TST. 2006-2015.
946
992 1.005
1.101 1.070
1.091
1.149
1.194
1.228
1.279
2006 2007 2008 2009 2010 2011 2012 2013 2014 2015
4.745
6.364
5.479
5.827 5.817
6.290
6.789
8.876 9.058
7.713
2006 2007 2008 2009 2010 2011 2012 2013 2014 2015
14/7/2016 Coordenadoria de Estatística e Pesquisa do TST http://www.tst.jus.br/estatistica [email protected] 7
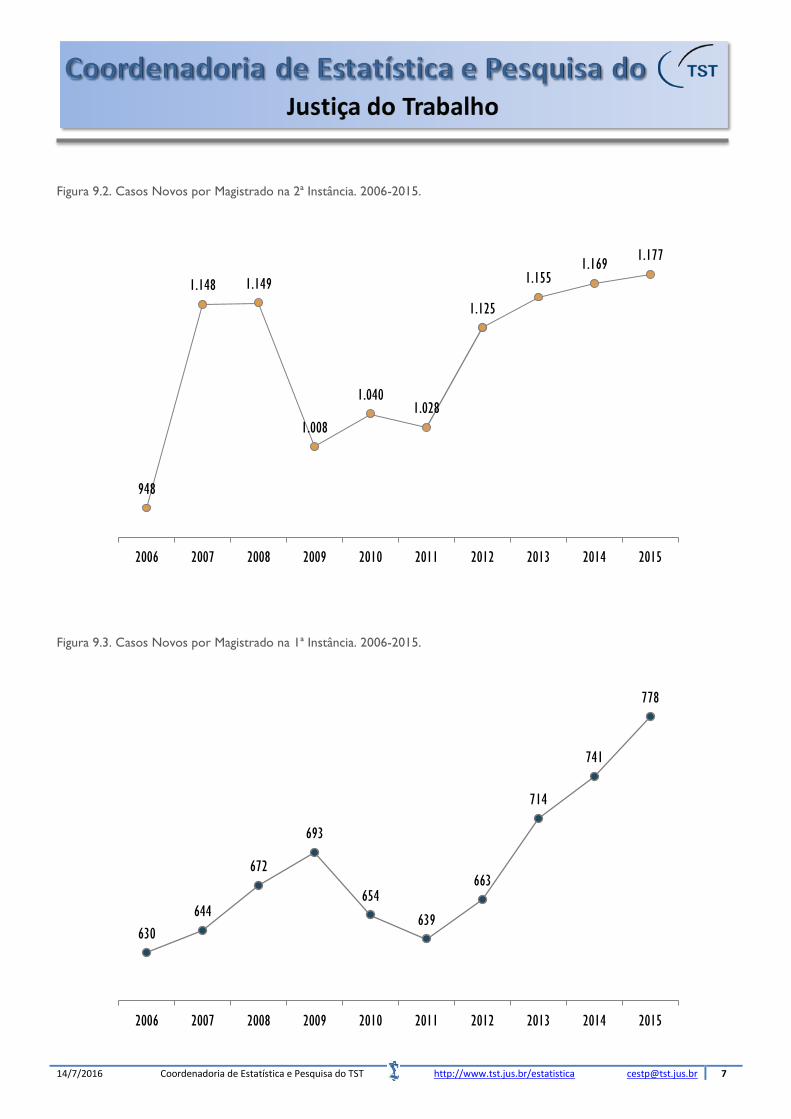
Figura 9.2. Casos Novos por Magistrado na 2ª Instância. 2006-2015.
Figura 9.3. Casos Novos por Magistrado na 1ª Instância. 2006-2015.
948
1.148 1.149
1.008
1.040 1.028
1.125
1.155 1.169
1.177
2006 2007 2008 2009 2010 2011 2012 2013 2014 2015
630
644
672
693
654
639
663
714
741
778
2006 2007 2008 2009 2010 2011 2012 2013 2014 2015

14/7/2016 Coordenadoria de Estatística e Pesquisa do TST http://www.tst.jus.br/estatistica [email protected] 8
Figura 10.1. Casos Novos por Servidor no TST. 2006-2015.
Figura 10.2 Casos Novos por Servidor na 1ª e 2ª Instâncias. 2006-2015.
109
88
70
75 75
81
87
113 115
98
2006 2007 2008 2009 2010 2011 2012 2013 2014 2015
67
72 72
73
69 69
71
75
77
80
2006 2007 2008 2009 2010 2011 2012 2013 2014 2015

14/7/2016 Coordenadoria de Estatística e Pesquisa do TST http://www.tst.jus.br/estatistica [email protected] 9
Figura 11.1. Casos Novos por Servidor em Atividade no TST. 2006-2015.
Figura 11.2 Casos Novos por Servidor em Atividade na 2ª Instância. 2006-2015.
109
104
72
68 67
74
82
104 106
91
2006 2007 2008 2009 2010 2011 2012 2013 2014 2015
28,4
34,3
35,3
34,4 33,7
33,3
36,2
38,5 38,0
36,3
2006 2007 2008 2009 2010 2011 2012 2013 2014 2015
14/7/2016 Coordenadoria de Estatística e Pesquisa do TST http://www.tst.jus.br/estatistica [email protected] 10
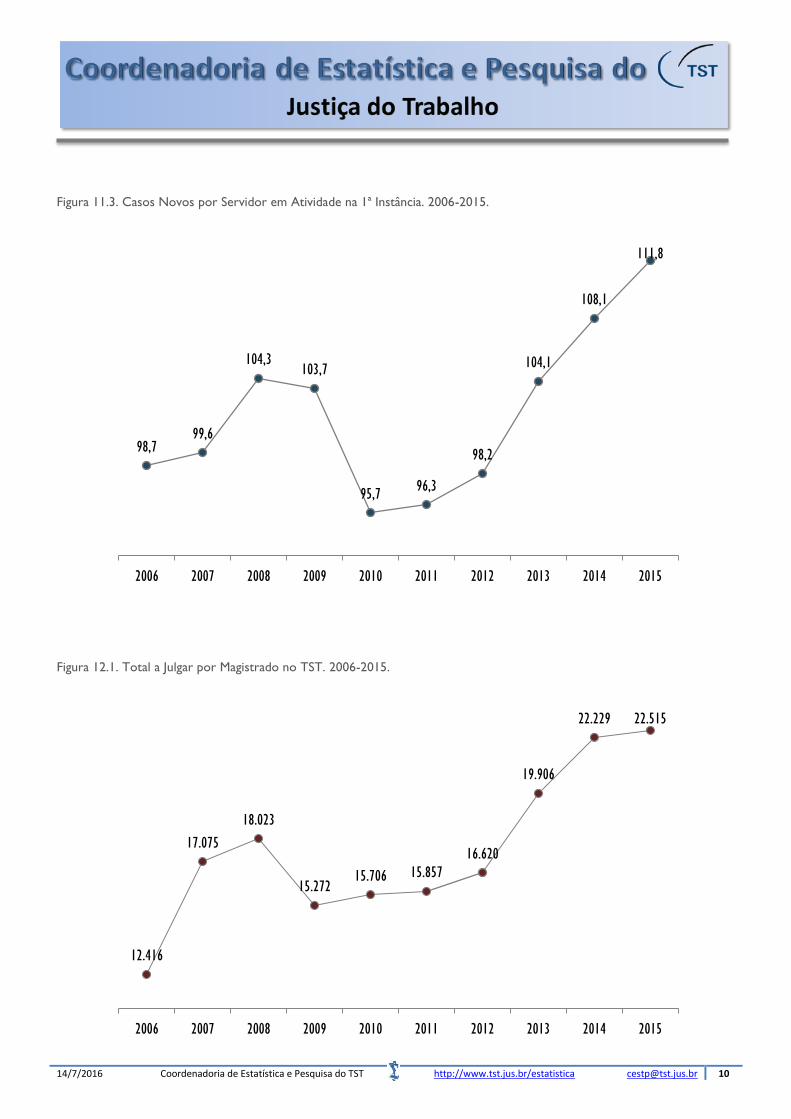
Figura 11.3. Casos Novos por Servidor em Atividade na 1ª Instância. 2006-2015.
Figura 12.1. Total a Julgar por Magistrado no TST. 2006-2015.
98,7 99,6
104,3 103,7
95,7 96,3
98,2
104,1
108,1
111,8
2006 2007 2008 2009 2010 2011 2012 2013 2014 2015
12.416
17.075
18.023
15.272 15.706 15.857
16.620
19.906
22.229 22.515
2006 2007 2008 2009 2010 2011 2012 2013 2014 2015
14/7/2016 Coordenadoria de Estatística e Pesquisa do TST http://www.tst.jus.br/estatistica [email protected] 11
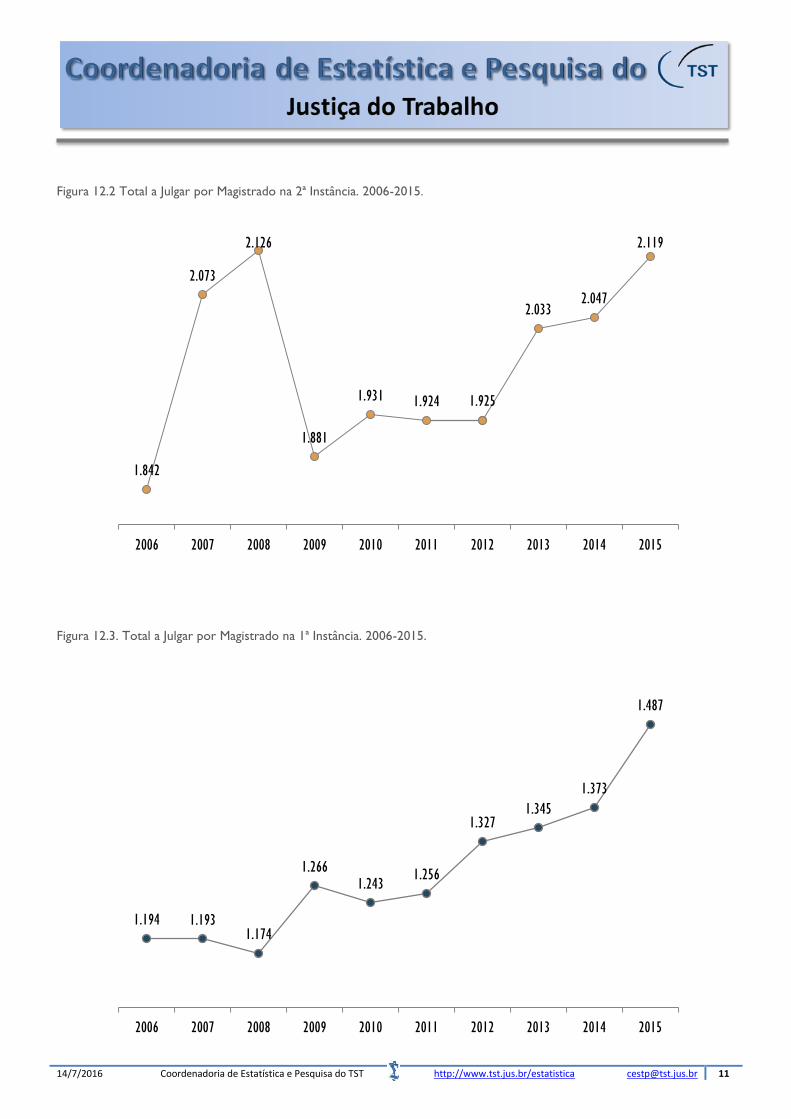
Figura 12.2 Total a Julgar por Magistrado na 2ª Instância. 2006-2015.
Figura 12.3. Total a Julgar por Magistrado na 1ª Instância. 2006-2015.
1.842
2.073
2.126
1.881
1.931 1.924 1.925
2.033 2.047
2.119
2006 2007 2008 2009 2010 2011 2012 2013 2014 2015
1.194 1.193 1.174
1.266 1.243
1.256
1.327 1.345
1.373
1.487
2006 2007 2008 2009 2010 2011 2012 2013 2014 2015

14/7/2016 Coordenadoria de Estatística e Pesquisa do TST http://www.tst.jus.br/estatistica [email protected] 12
Figura 13.1. Total a Julgar por Servidor da Área Judiciária no TST. 2006-2015.
Figura 13.2. Total a Julgar por Servidor da Área Judiciária na 2ª Instância. 2006-2015.
289 299
433
263
239 256
279
322
362 367
2006 2007 2008 2009 2010 2011 2012 2013 2014 2015
93
104
108
111
108
110
107
117 118
122
2006 2007 2008 2009 2010 2011 2012 2013 2014 2015

14/7/2016 Coordenadoria de Estatística e Pesquisa do TST http://www.tst.jus.br/estatistica [email protected] 13
Figura 13.3. Total a Julgar por Servidor da Área Judiciária na 1ª Instância. 2006-2015.
Figura 14. Percentual de Conciliações na 1ª Instância. 2006-2015.
161
166
172 169
163 160
164
173
181
194
2006 2007 2008 2009 2010 2011 2012 2013 2014 2015
43,8 43,9 44,1
42,8
43,4 43,3 43,4
40,7
39,6
38,9
2006 2007 2008 2009 2010 2011 2012 2013 2014 2015
14/7/2016 Coordenadoria de Estatística e Pesquisa do TST http://www.tst.jus.br/estatistica [email protected] 14
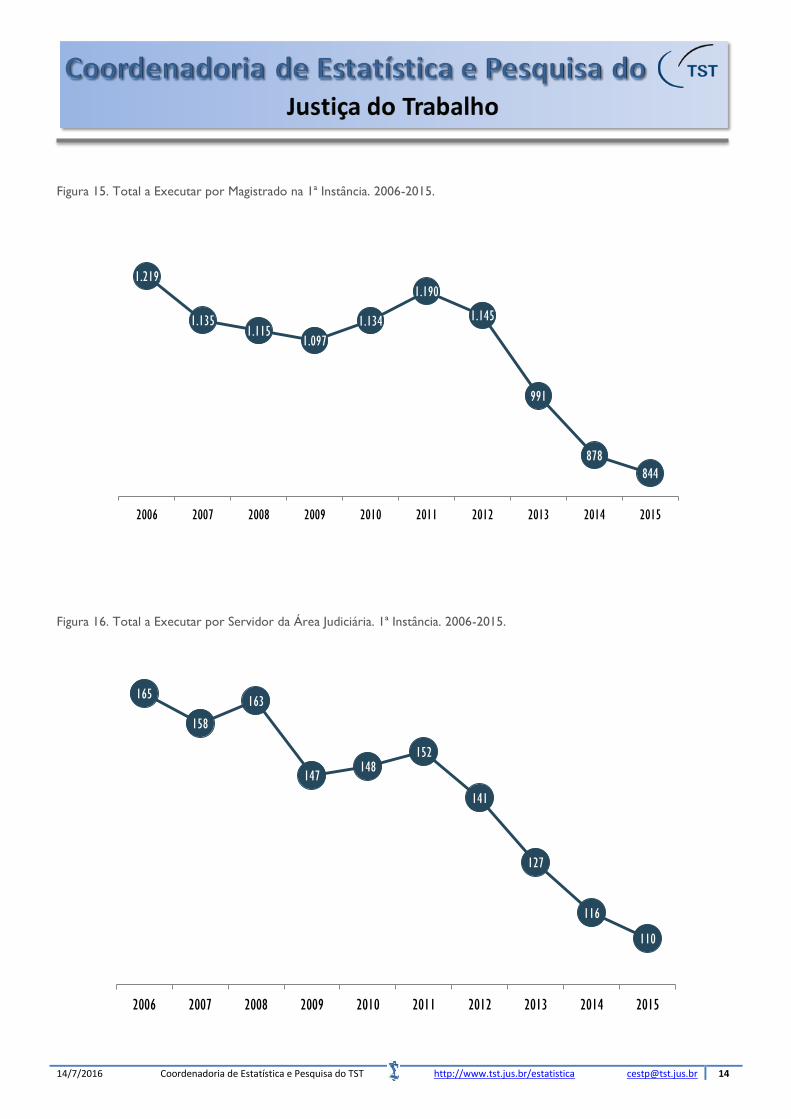
Figura 15. Total a Executar por Magistrado na 1ª Instância. 2006-2015.
Figura 16. Total a Executar por Servidor da Área Judiciária. 1ª Instância. 2006-2015.
1.219
1.135 1.115
1.097
1.134
1.190
1.145
991
878
844
2006 2007 2008 2009 2010 2011 2012 2013 2014 2015
165
158
163
147 148
152
141
127
116
110
2006 2007 2008 2009 2010 2011 2012 2013 2014 2015
14/7/2016 Coordenadoria de Estatística e Pesquisa do TST http://www.tst.jus.br/estatistica [email protected] 15
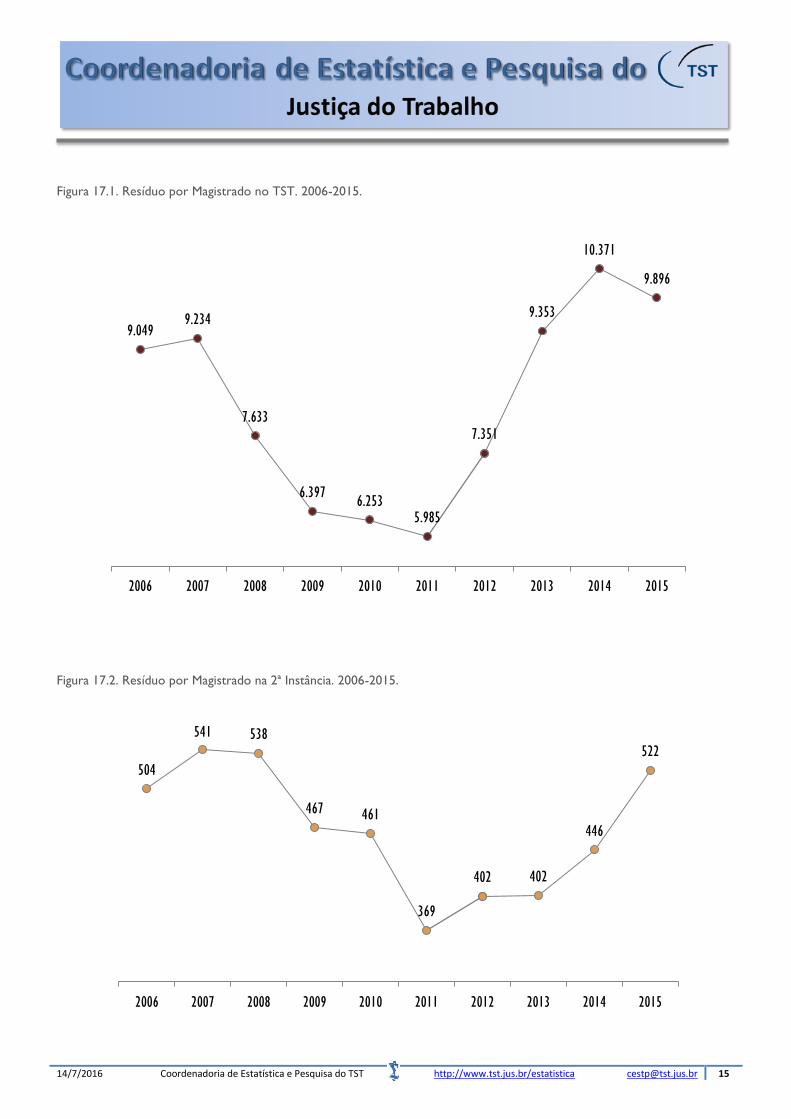
Figura 17.1. Resíduo por Magistrado no TST. 2006-2015.
Figura 17.2. Resíduo por Magistrado na 2ª Instância. 2006-2015.
9.049 9.234
7.633
6.397 6.253
5.985
7.351
9.353
10.371
9.896
2006 2007 2008 2009 2010 2011 2012 2013 2014 2015
504
541 538
467 461
369
402 402
446
522
2006 2007 2008 2009 2010 2011 2012 2013 2014 2015

14/7/2016 Coordenadoria de Estatística e Pesquisa do TST http://www.tst.jus.br/estatistica [email protected] 16
Figura 17.3.1. Resíduo por Magistrado na 1ª Instância (Fase de Conhecimento). 2006-2015.
Figura 17.3.2. Resíduo por Magistrado na 1ª Instância (Fase de Execução). 2006-2015.
348 349
377 367 364 358
371
398
472
507
2006 2007 2008 2009 2010 2011 2012 2013 2014 2015
930
958 973
957 941
875
818 801
721 715
2006 2007 2008 2009 2010 2011 2012 2013 2014 2015