Embed Size (px)
Citation preview
Universidade Estadual de Campinas
Faculdade de Engenharia de Alimentos
Departamento de Alimentos e Nutrição
Influência da adição de torta de castanha do Brasil à dieta
AIN-93G sobre o crescimento e composição corpórea d e ratos
Wistar
Dissertação de Mestrado em Alimentos e Nutrição
Paula Telles Poeta
Orientador: Prof. Dr. Mário Roberto Maróstica Junior
Campinas
2009
Dissertação apresentada à Faculdade de Engenharia
de Alimentos da Universidade Estadual de Campinas
para obtenção do Título de Mestre em Alimentos e
Nutrição – Área de Nutrição Básica Experimental
Aplicada à Tecnologia de Alimentos.
ii
Ficha catalográfica
Titulo em inglês:
Palavras-chave em inglês (Keywords):
Titulação: Mestre em Alimentos e Nutrição Banca examinadora: Mário Roberto Maróstica Junior Valdemiro Carlos Sgarbieri Lilia Zago Ferreira dos Santos Luciano Bruno de Carvalho Silva Geórgia Álvares de Castro Área de Concentração: Nutrição Experimental Aplicada à Tecnologia de Alimentos. Data de Defesa: 21/08/2009 Programa de Pós Graduação: Programa em Alimentos e Nutrição
Poeta, Paula Telles P752i Influência da adição de torta de castanha do Brasil à dieta AIN-
93G sobre o crescimento e composição corpórea de ratos Wistar: características nutricionais da torta desengordurada de castanha do Brasil / Paula Telles Poeta. -- Campinas, SP: [s.n.], 2009.
Orientador: Mário Roberto Maróstica Junior.
Dissertação (mestrado) – Universidade Estadual de Campinas. Faculdade de Engenharia de Alimentos
1. Castanha - Brasil. 2. Qualidade protéica. 3. Ácidos
graxos. 4. Métodos biológicos. 5. Métodos químicos. I. Maróstica Junior, Mário Roberto. II. Universidade Estadual de Campinas. Faculdade de Engenharia de Alimentos. III. Título.
Brazil nut, Protein quality, Fatty acids, Biological methods, Chemical methods
Influence of the addition of Brazil nut cake to the AIN-93G diet on growth and body composition of rats: Brazil nut deffated cake nutritional characteristics
iii
BANCA EXAMINADORA
__________________________________________________________________ Prof. Dr. Mário Roberto Maróstica Junior (DEPAN/FEA/Unicamp) – Orientador __________________________________________________________________ Prof. Dr. Valdemiro Carlos Sgarbieri (DEPAN/FEA/Unicamp) - Membro __________________________________________________________________ Prof. Dra. Lilia Zago Ferreira dos Santos (PUC-Campinas) –Membro _________________________________________________________________________ Prof. Dr. Luciano Bruno de Carvalho Silva (Unifal) - Suplente __________________________________________________________________ Dra. Geórgia Álvares de Castro – Suplente
iv
Agradecimentos
Aos meus pais, irmãos e parentes, que mesmo de longe nunca deixaram de
me apoiar e confiar em mim.
Ao Daniel que sempre esteve ao meu lado com sua frase “se fosse fácil
todo mundo faria”, me ajudando e apoiando para que concluísse da melhor
maneira possível.
Ao professor Mário Maróstica, meu orientador, que sempre está disposto a
ajudar e ensinar.
A todos os amigos, de perto e de longe que sempre tiveram uma palavra
amiga e muitas vezes fizeram brilhar uma grande idéia sem nem perceberem.
Aos membros da banca, pelas correções indispensáveis e sugestões
valiosas.
À Susana, companheira e amiga, sempre com uma palavra de ânimo e
boas risadas pra descontrair.
À Soely, que sempre se fez presente, me aturou e ensinou coisas muito
valiosas.
À Luciane, que desde o início enfrentou essa batalha comigo.
Ao Henrique, estagiário, que foi pessoa essencial no decorrer da pesquisa.
Ao seu Ary, que com muita boa vontade nos doou a castanha do Brasil.
Ao Renato Grimaldi, que com muita boa vontade realizou muitas análises
para o trabalho.
A todos os funcionários do Depan, pessoas indispensáveis para a
realização deste trabalho.
v
“"Não é amostra de saúde estar bem ajustado a uma
sociedade profundamente doente"
Jiddu Krishnamurti
vi
SUMÁRIO Apresentação ...................................................................................................... 1
Resumo Geral .......................................................................................................2
Abstract ................................................................................................................ 5
Introdução e Justificativa ....................................................................................7
Capítulo 1 – Revisão de Literatura........................................................................10
1. Características da castanha do Brasil......................................................... 10
2. Aspectos relacionados à composição centesimal da castanha do Brasil....11
2.1 Aspectos relacionados ao aminograma da castanha do Brasil................. 14
2.2 Aspectos relacionados ao teor de ácidos graxos da castanha do Brasil...20
2.3 Aspectos relacionados à riqueza mineral da castanha do Brasil...............23
Referências ………………………..……………...............……………………………26
Capítulo 2 – Brazil nut protein quality evaluate by the use of HPLC and “in vivo”
methods………………………………………………………………………………….. 33
Abstract………………………………………………………………………………….. 33
1. Introduction ………..………………………...…………………………………. 34
2. Materials and Methods ………………………………….……………………. 36
2.1 Protein Sources……………………….……………………………………….. 36
2.2 Amino acids analysis of protein sources……………………….…………… 36
2.2.1 Reagents and Standards………………………………………………….. 36
2.2.2 Apparatus…………………………………………………………………….. 37
2.2.3 Sample preparation and derivatization…………………………………….. 37
2.3 Chemical Score of protein sources…………………………………….…….. 38
2.4 Biological Evaluation of Brazil nut protein quality ………………...……….. 39
vii
2.4.1 “In vivo” assays ………………………………..…………………………….. 39
2.4.2 Diet formulation…………………………………………………..….………. 39
2.4.3 Determination of PER………………………………………………………. 41
2.4.4 Determination of NB………………………………………………………… 41
2.4.5 Determination of AD………………………………………………………… 41
2.4.6 Determination of ABV.………………………………………………………. 42
2.5 Statistical analysis…………………………………..…………………………. 42
3. Results and discussion ………………………………………………………. 42
4. Concluding remarks …………………………………………………………... 52
Acknowledgements ……………………………………………….……………… 53
References ……………………………………………….………………………… 54
Capítulo 3 – Effects of different concentrations of Brazil nut in feed on the body
composition of Wistar rats …………………………………………………………….. 58
Resumo …………………………….………………………………………………. 58
Abstract ……………………………………………………….……………………. 58
1. Introduction …………………………………………………………………….. 59
2. Materials and Methods ………………..………………………………………..60
2.1 Protein sources………………………………………………………………… 60
2.2 Determination of fatty acids composition of Brazil nut oil ………………… 61
2.3 Biological assay…………………………………………………….………….. 61
2.3.1 Diet formulation……………………………………………………………… 62
2.3.2 Determination of FER……………………………………………………….. 64
2.4 Body composition analysis…………………………………….……………... 64
2.5 Statistical analysis…………………………………….……………………….. 64
viii
3. Results and discussion ………………………………………………………. 64
3.1 Proximate composition of DC and CAS……………………………………...64
3.2 Biological assay……………………………………………………………….. 69
4. Conclusions …………………………………………………………………….. 74
Acknowledgements ……………………………………………….……………… 74
References ......................................................................................................75
Conclusão Geral ............................................................................................ 81
ANEXO 1 – Certificado de Aprovação do Comitê de Ética em Experimentação
Animal...............................................................................................................82
1
Apresentação
Este estudo faz parte da dissertação da candidata Paula Telles Poeta para
obtenção de título de Mestre em Alimentos e Nutrição. Os experimentos aqui
apresentados foram efetuados no laboratório de Nutrição e Metabolismo do
Departamento de Alimentos e Nutrição da Faculdade de Engenharia de Alimentos
da Universidade Estadual de Campinas (Unicamp) entre os meses de agosto de
2008 e fevereiro de 2009, sob orientação do Prof. Dr. Mário Roberto Maróstica
Junior e com financiamento do Conselho Nacional de Desenvolvimento Científico
e Tecnológico – CNPq (bolsa de estudos). Parte do trabalho foi desenvolvido no
Laboratório de Ensaios Biológicos da Faculdade de Engenharia de Alimentos da
Unicamp, entre os meses de agosto e outubro de 2008.
O texto foi estruturado em três capítulos, sendo o primeiro uma Revisão de
Literatura e os outros dois, na forma de artigos, nos quais serão abordados (I) uma
revisão sobre produção, mercado e utilização da castanha do Brasil; (II) a
qualidade protéica da torta desengordurada da castanha do Brasil; (III) as
alterações causadas na composição corpórea de ratos Wistar decorrentes da
ingestão da torta desengordurada de castanha do Brasil. Os capítulos II e III foram
mantidos conforme o original, em inglês, o que facilitará a submissão das
manuscritos para publicação em revistas internacionais.
2
RESUMO GERAL
O objetivo do presente trabalho foi avaliar a qualidade nutricional da
castanha do Brasil, enfatizando sua qualidade protéica e aminoacídica, sua
composição em ácidos graxos e as alterações na composição corpórea de ratos
Wistar decorrentes de sua ingestão em diferentes proporções na forma de torta
desengordurada. Assim o estudo se iniciou com o recebimento das amêndoas da
castanha do Brasil, provenientes da indústria Juta e Castanha, localizada na
cidade de São Paulo. Em seguida procedeu-se à sua prensagem, utilizando a
prensa ERT -60-II da Scott Tech, empresa localizada no município de Vinhedo –
SP.
A composição centesimal das fontes protéicas utilizadas no estudo, torta
desengordurada de castanha do Brasil e caseína, (utilizada como proteína padrão)
foi determinada. A partir desses dados, foram confeccionadas as dietas dos
animais, com 12% de proteína, com base na dieta AIN-93G para roedores. As
dietas continham diferentes teores de torta e caseína como fontes de proteína,
resultando em quatro dietas diferentes, sendo elas: G1: 100% caseína; G2: 35%
torta/ 65%caseína; G3: 25%torta/ 75%caseína; G4: 12.5%torta/ 87.5% caseína.
O ensaio biológico contou com 32 animais, divididos em quatro grupos de
oito animais cada, mantidos em gaiolas separadas, sob ciclo claro/escuro de 12
horas, com temperatura e umidade controladas, durante o período de 28 dias. O
consumo de dieta e o ganho de peso foram monitorados.
3
Nos últimos sete dias do período experimental, os animais foram mantidos
em gaiolas metabólicas coletando-se urina e fezes para a determinação dos
índices de digestibilidade e valor biológico das dietas em estudo.
Ao final do experimento, os animais foram sacrificados por decapitação, seu
intestino limpo com soro fisiológico e devolvido à carcaça. As carcaças foram
congeladas, fatiadas, liofilizadas e trituradas para posterior análise da composição
corpórea.
O índice químico utilizado para a avaliação da qualidade protéica foi o
escore químico de aminoácidos indispensáveis. Para tal, foi realizada a
determinação de aminoácidos nas amostras, através de High Performance Liquid
Chromatography (HPLC) e derivatização com fenilisotiocianato (PITC). O escore
químico revelou que a castanha do Brasil utilizada neste estudo é deficiente em
lisina e treonina; entretanto esta amêndoa é muito rica em metionina+cisteína.
Os índices nutricionais determinados foram o PER (quociente de eficência
protéica), BN (balanço de nitrogênio), Da (digestibilidade aparente) e VBa (valor
biológico aparente). Os resultados encontrados foram valores de PER variando
entre 2.1 ± 0.03 e 2.7 ± 0.02; os valores de BN variaram de 1.2 ± 0.13 a 3.61 ±
0.04; a Da apresentou percentuais que variaram de 90.0 ± 0.78 a 95.1 ± 0.12 ; e
os percentuais de VB encontrados variaram de 85.7 ± 3.42 a 92.2 ± 1.13.
A análise da composição de ácidos graxos presentes no óleo extraído da
castanha do Brasil foi realizado por meio de cromatografia gasosa e derivatização
com trifluoreto de boro. O resultado revelou 45.3% de ácido graxo oléico e 27.4%
de linoléico.
4
A avaliação da composição corpórea variou entre os grupos alimentados
com diferentes proporções das fontes de proteína. Redução de até 36.0% na
composição de lipídios da carcaça foi observada no grupo G3 comparado com o
grupo padrão; aumento dos conteúdos de proteína, cinza e umidade foram
também detectados em todos os grupos alimentados com torta desengordurada
de castanha do Brasil.
Para a análise estatística foi utilizado o software The SAS System, BC,
2001. A análise de variância (ANOVA) foi realizada e as médias foram
comparadas por meio do teste de Tukey, a 5% de significância.
5
ABSTRACT
The objective of this work was the evaluation of the nutritional quality of the
Brazil nut defatted cake. Emphases were done on the protein quality, fatty acid
composition and the impact of different proportions of defatted cake on fed to
Wistar rats. Nuts were received from “Juta e Castanha company”, placed in São
Paulo city, and were pressed using ERT-60-II press, to obtain the cake.
The proximate percent composition of the protein sources used in this study
(defatted cake and casein) were done. The feeds were formulated with 12% of
protein. The casein of AIN rodent diet was partially replaced by defatted cake as
follows: G1(100% casein); G2 (35% defatted cake/65% casein); G3 (25% defatted
cake/75% casein); G4 (12.5 defatted cake/87.5% casein).
For the biological assay, 32 animals were used. They were divided into 4
groups of 8 animals each housed separately with a regime of 12 h dark/light cicle,
under controlled temperature and humidity during 28 days. Diet consumption and
weight gain were registered.
During last 7 days of experiment, the animals were housed in metabolic
cages for urine and feces collection in order to determine digestibility and biological
value of the studied protein diet.
At the end of the experiment, the animals were sacrificed (decapitation), the
intestines were removed for cleaning with physiological solution and returned to the
respective carcass, which were frozen, sliced, freeze dried and triturated for further
analysis.
6
Chemical Score of indispensable amino acids was used in evaluating
protein quality. Amino acids were determined using HPLC and derivatization with
phenylisothiocyanante (PITC). The amino acid chemical score revealed that Brazil
nut is deficient in lysine and threonine; however, the nut is very rich in
methionine+cysteine.
The nutritional indices used in this work were PER (Protein Efficiency ratio),
NB (Nitrogen Balance), AD (Apparent digestibility) and ABV (Apparent Biological
Value). The results were: PER>2.0; NB positive to all groups; AD > 90.0%; all ABV
> 85.0%.
The fatty acids composition of Brazil Nut was determined using gas
chromatography and derivatization with boron trifluoride. The extracted oil had
45.3% oleic and 27.4% linoleic acids.
The body composition varied among the groups fed different protein
sources. Reduction of 36.0% of carcass lipid composition was achieved in G3
group compared to control group; increasing of protein, ash and moisture contents
were also detected in all groups fed with defatted cake.
For statistical analysis, SAS System, BC, 2001 software was used. ANOVA
was applied and averages values were compared using Tukey test (p<5%).

7
Introdução e Justificativa
A castanha do Brasil (Bertholletia excelsa) é um produto nativo da
Amazônia, de grande importância social, econômica e ambiental. Sua amêndoa
também é conhecida como castanha do Pará, e vem ocupando, desde 1911, um
lugar de destaque na pauta das exportações de produtos da floresta amazônica
(EMBRAPA, 2006).
O Brasil produz quase 30 mil toneladas de castanha por ano, porém, pela
ausência do devido apoio e esclarecimento para difundir seu consumo no país,
vive na dependência do importador estrangeiro, sendo boa parte exportada,
principalmente para os países da Europa (Alemanha e Inglaterra) e da América do
Norte (Estados Unidos) e apenas 5% do total produzido anualmente são para
consumo interno, principalmente na forma “in natura” (EMBRAPA, 2004; IBGE,
2006).
Dentre as opções de aplicação desta amêndoa, uma muito comum é sua
utilização como matéria-prima para extração de óleo por prensagem para a
indústria químico-farmacêutica, e o resíduo gerado, denominado torta
desengordurada, possui elevado valor nutricional, principalmente por conter
elevados teores de proteína (GLÓRIA; REGITANO-d'ARCE, 2000). Desta forma,
enquanto a amêndoa contém, em média, 67.3% de lipídios, 14.2% de proteínas e
3.4% de carboidratos (RIBEIRO, 1992; SOUZA; MENEZES, 2004) a torta contém,
em média, 25.1% de lipídios, 40.2% de proteínas e 3.4% de carboidratos (SOUZA;
MENEZES, 2004).
8
O aminograma das proteínas da castanha do Brasil e de sua torta
desengordurada revela teores apreciáveis de arginina, leucina, fenilalanina,
metionina (ROTENBERG, 1975; ANTUNES; MARKAKIS, 1977) e triptofano
(CAMARGO, 1968), sendo conhecida como a “carne vegetal” (TEIXEIRA, 1954).
Por esse motivo, a castanha pode vir a se tornar uma excelente fonte alternativa
de proteína.
O óleo extraído da castanha do Brasil apresenta 13.8% de ácido palmítico,
8.7% de ácido esteárico, 31.4% de ácido oléico e 45.2% de ácido linoléico, além
de pequenas quantidades dos ácidos mirístico e palmitoléico. É muito instável
devido ao alto conteúdo de ácidos graxos poliinsaturados e, durante seu refino,
perde seus compostos fenólicos, que são antioxidantes naturais (ELIAS;
BRESSANI, 1961; GUTIERREZ et al., 1997).
Alguns autores estudaram a complementação de dietas comuns, como
arroz e feijão, com farinha de castanha do Brasil, e analisaram seu efeito,
observando um aumento no crescimento de animais. Outros estudaram a
suplementação de produtos de mandioca com a castanha e farinha de castanha, e
revelaram aumento na qualidade nutricional dos produtos, além de ótima
aceitação quanto a seus parâmetros sensoriais.
Trabalhos com o óleo da castanha do Brasil também são muito encontrados
na literatura, comprovando seu elevado teor em ácidos graxos oléico e linoléico.
Vários benefícios à saúde são observados em decorrência da ingestão destes
ácidos graxos, como aumento da saciedade, redução da desidratação, redução do
teor de massa gorda do organismo, redução dos níveis de VLDL e LDL, entre
outros.
9
Considerando que a torta desengordurada de castanha do Brasil é um
subproduto muito produzido e utilizado na região amazônica em decorrência da
extração de óleo desta amêndoa, justifica-se o estudo de sua qualidade protéica e
perfil de ácidos graxos, bem como seu efeito na composição corpórea em ratos
Wistar.
10
Capítulo 1
Revisão da Literatura 1. Características da Castanha do Brasil
A castanheira Bertholletia excelsa H.B.K. foi descrita em 1808 por Humbold
e Bompland. É uma árvore de grande porte, com cerca de 40-50 metros de altura
e dois metros de diâmetro, possui caule cilíndrico, liso e desprovido de ramos até
a fronde, casca escura e fendida, ramos encurvados nas extremidades, folhas
esparsas, flores de seis pétalas brancas, o fruto é uma cápsula quase esférica de
8 a 16 centímetros de diâmetro, a casca é espessa, lenhosa, dura, de cor
castanha, repleta de células resinosas, contendo 12 a 25 sementes. Encontra-se
em agrupamentos tradicionalmente conhecidos como castanhais, sempre
associadas a outras espécies florestais. Floresce de outubro a dezembro, sendo
que a safra é de janeiro a março. A coleta pode se estender por até seis meses
(MINISTÉRIO DA AGRICULTURA, 1976; CAVALCANTI, 1991).
O território natural das castanheiras abrange a Venezuela, a Colômbia, o
Peru, a Bolívia, as Guianas e o Brasil (CAVALCANTI, 1991; LORENZI, 2000),
cobrindo uma superfície de aproximadamente 325 milhões de hectares (STOIAN,
2004).
Existem dados sobre o consumo da castanha do Brasil desde 1755, época
em que era utilizada para alimentação de animais domésticos. Os primeiros dados
sobre o início de sua exploração comercial datam aproximadamente de 1800,
passando em 1818 a ser importante produto de exportação do Pará
(MINISTÉRIOA DA AGRICULTURA, 1976). Desde 1911, ela vem ocupando um
11
lugar de destaque na pauta das exportações de produtos da floresta amazônica
(EMBRAPA, 2006).
Sua amêndoa tem sabor e aroma agradáveis, comestível crua, salgada ou
torrada. Possui uma variedade de aplicações, podendo se incorporar no cotidiano
alimentar do brasileiro, elevando seu consumo a níveis consideráveis. Uma
alternativa viável é seu aproveitamento industrial, mediante divulgação dos seus
reconhecidos méritos, tanto nutricional quanto culinários. (DUKE, 1929;
MINISTÉRIO DA AGRICULTURA, 1976; SOUZA et al., 1986).
Quando as amêndoas se encontram fora do padrão ou quebradas, são
usadas para a extração de óleo para a indústria químico-farmacêutica, e o resíduo
gerado, chamado de torta desengordurada, é utilizado como alimento para
animais (DUKE, 1929; GLÓRIA; REGITANO d’ÁRCE, 2000). Esta torta
desengordurada possui inúmeras possibilidades de aplicação, visando o
enriquecimento de uma variedade de grupos de alimentos, tais como: produtos
para panificação, bebidas, embutidos, farinhas, leites, cereais, snacks, salgados,
doces, sorvetes, chocolates, biscoitos, bombons, além de muitos outros (SOUZA,
1984; COHEN et al., 2006).
2. Aspectos relacionados à composição centesimal da castanha do Brasil
Há várias décadas a amêndoa de castanha do Brasil vem sendo estudada
quanto a seus parâmetros de composição centesimal, por ser um alimento rico
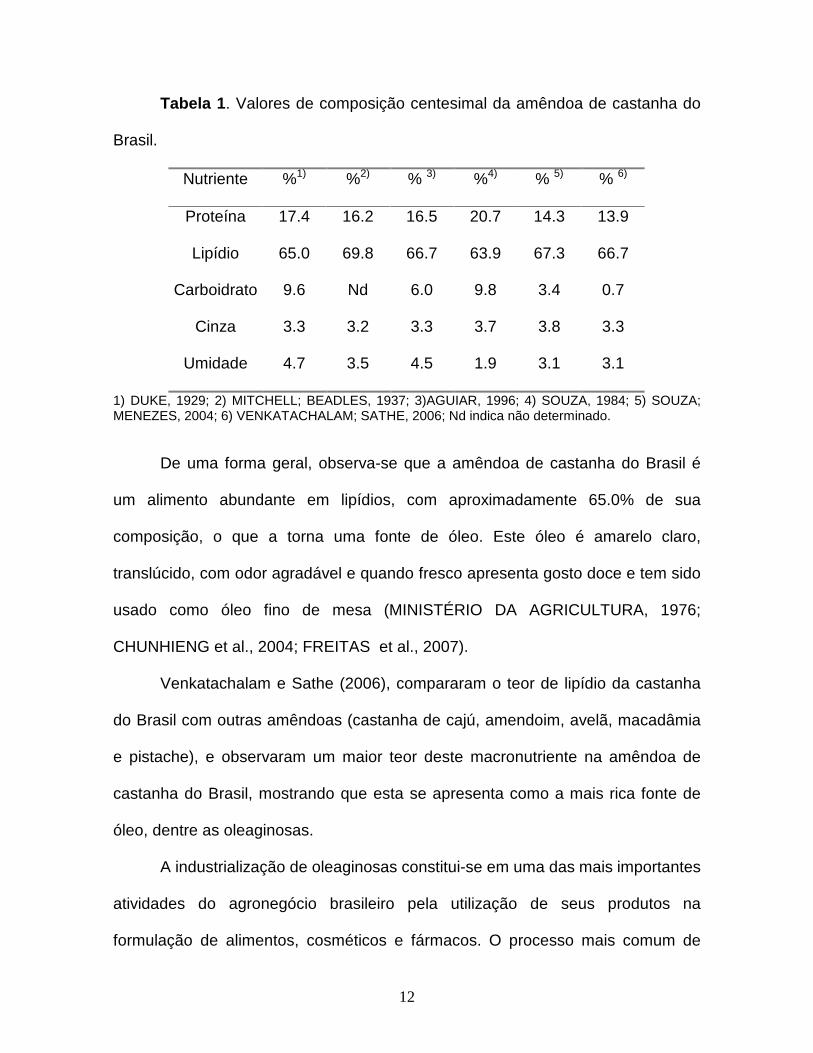
tanto em lipídios quanto em proteínas. Na tabela 1 estão dispostos os resultados
de composição centesimal desta amêndoa encontrados em estudos anteriores.
12
Tabela 1 . Valores de composição centesimal da amêndoa de castanha do
Brasil.
Nutriente %1) %2) % 3) %4) % 5) % 6)
Proteína 17.4 16.2 16.5 20.7 14.3 13.9
Lipídio 65.0 69.8 66.7 63.9 67.3 66.7
Carboidrato 9.6 Nd 6.0 9.8 3.4 0.7
Cinza 3.3 3.2 3.3 3.7 3.8 3.3
Umidade 4.7 3.5 4.5 1.9 3.1 3.1
1) DUKE, 1929; 2) MITCHELL; BEADLES, 1937; 3)AGUIAR, 1996; 4) SOUZA, 1984; 5) SOUZA; MENEZES, 2004; 6) VENKATACHALAM; SATHE, 2006; Nd indica não determinado.
De uma forma geral, observa-se que a amêndoa de castanha do Brasil é
um alimento abundante em lipídios, com aproximadamente 65.0% de sua
composição, o que a torna uma fonte de óleo. Este óleo é amarelo claro,
translúcido, com odor agradável e quando fresco apresenta gosto doce e tem sido
usado como óleo fino de mesa (MINISTÉRIO DA AGRICULTURA, 1976;
CHUNHIENG et al., 2004; FREITAS et al., 2007).
Venkatachalam e Sathe (2006), compararam o teor de lipídio da castanha
do Brasil com outras amêndoas (castanha de cajú, amendoim, avelã, macadâmia
e pistache), e observaram um maior teor deste macronutriente na amêndoa de
castanha do Brasil, mostrando que esta se apresenta como a mais rica fonte de
óleo, dentre as oleaginosas.
A industrialização de oleaginosas constitui-se em uma das mais importantes
atividades do agronegócio brasileiro pela utilização de seus produtos na
formulação de alimentos, cosméticos e fármacos. O processo mais comum de
13
extração deste óleo é por meio de prensagem, seguida por extração com hexano
(LAGO; FREITAS, 2006; FREITAS et al., 2007).
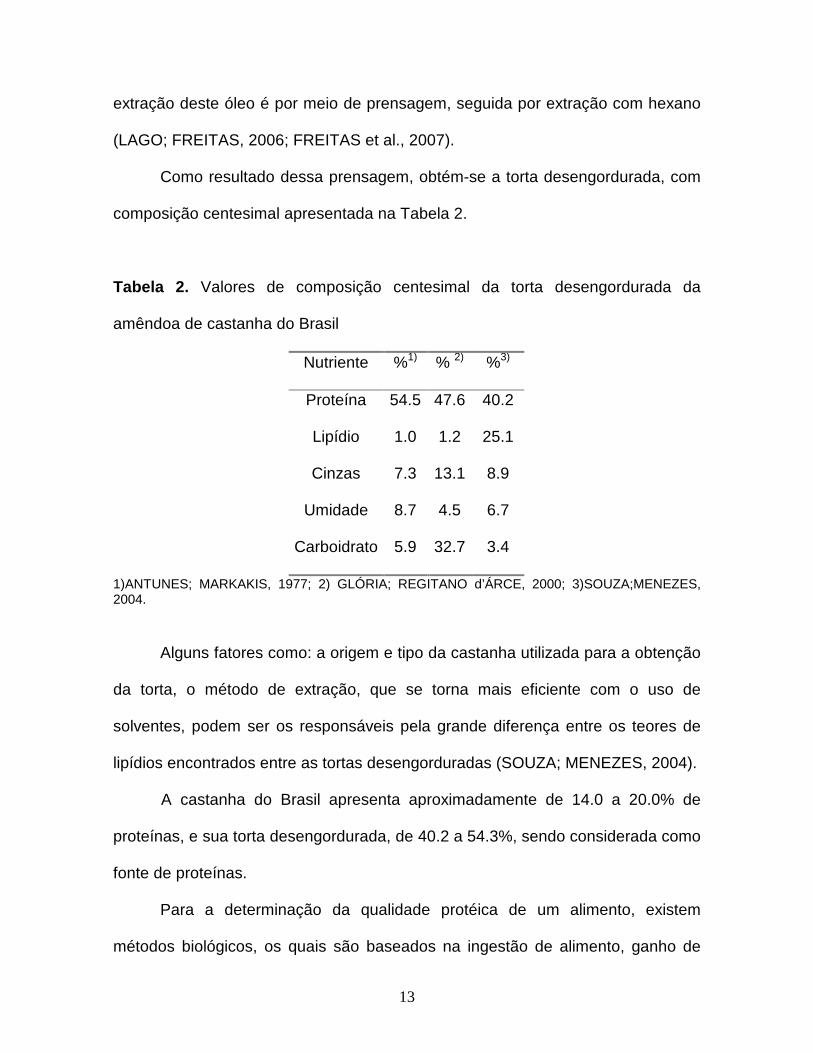
Como resultado dessa prensagem, obtém-se a torta desengordurada, com
composição centesimal apresentada na Tabela 2.
Tabela 2. Valores de composição centesimal da torta desengordurada da
amêndoa de castanha do Brasil
Nutriente %1) % 2) %3)
Proteína 54.5 47.6 40.2
Lipídio 1.0 1.2 25.1
Cinzas 7.3 13.1 8.9
Umidade 8.7 4.5 6.7
Carboidrato 5.9 32.7 3.4
1)ANTUNES; MARKAKIS, 1977; 2) GLÓRIA; REGITANO d’ÁRCE, 2000; 3)SOUZA;MENEZES, 2004.
Alguns fatores como: a origem e tipo da castanha utilizada para a obtenção
da torta, o método de extração, que se torna mais eficiente com o uso de
solventes, podem ser os responsáveis pela grande diferença entre os teores de
lipídios encontrados entre as tortas desengorduradas (SOUZA; MENEZES, 2004).
A castanha do Brasil apresenta aproximadamente de 14.0 a 20.0% de
proteínas, e sua torta desengordurada, de 40.2 a 54.3%, sendo considerada como
fonte de proteínas.
Para a determinação da qualidade protéica de um alimento, existem
métodos biológicos, os quais são baseados na ingestão de alimento, ganho de
14
peso, total de nitrogênio nas fezes e na urina. São alguns dos índices utilizados o
PER (quociente de eficiência protéica), que mede o ganho de peso dividido pela
proteína ingerida, ambos em gramas; o BN (balanço de nitrogênio), que mede a
diferença entre o nitrogênio ingerido e o excretado nas fezes; a D (digestibilidade),
percentual de proteínas ingeridas que são hidrolisadas pelas enzimas digestivas e
absorvidas como aminoácidos ou qualquer outro composto nitrogenado; e o VB
(valor biológico), que mede o percentual de nitrogênio ingerido que foi retido pelo
organismo para a síntese de tecidos. (SGARBIERI, 1987; FRIEDMAN,1996).
Alguns estudos foram realizados a fim de analisar a qualidade protéica da
castanha do Brasil. Em 1937, Mitchell e Beadles realizaram ensaio de qualidade
protéica com a castanha do Brasil, e revelaram que esta proteína possui
digestibilidade de 95.7%. Antunes e Markakis (1977) realizaram estudo de
suplementação de uma dieta de feijão com castanha do Brasil em ratos e revelou
que essa mistura promoveu o crescimento dos animais. Mais tarde, em 2006,
Spini et al., em um estudo com suplementação da dieta de arroz e feijão com
castanha do Brasil, demonstraram que a qualidade da proteína da castanha, rica
em aminoácidos sulfurados, contribuiu para o crescimento dos animais.
2.1 Aspectos relacionados ao aminograma da castanha do Brasil
Os aminoácidos presentes nos alimentos são divididos em 3 categorias,
baseadas na síntese protéica in vivo. A primeira é representada pelos
aminoácidos indispensáveis, que são aminoácidos não sintetizados no organismo
ou sintetizados em quantidade insuficiente, devendo ser obtido por meio da
alimentação, são eles: lisina, triptofano, histidina, fenilalanina, leucina, isoleucina,
15
treonina, metionina e valina. A arginina, cisteína e tirosina fazem parte da segunda
categoria, a dos aminoácidos condicionalmente indispensáveis. Os aminoácidos
dispensáveis, ou seja, aqueles que podem ser sintetizados a partir de produtos
comuns do metabolismo intermediário, asparagina, ácido aspártico, glutamina,
ácido glutâmico, glicina, prolina e serina, constituem a última categoria (ROSE,
1949; FRIEDMAN, 1996; LAYMAN, 2003; GARLICK, 2005).
O aminograma da castanha do Brasil pode ser encontrado em vários
estudos e uma forma de estimar sua qualidade é por meio de métodos químicos,
como o escore químico de aminoácidos indispensáveis, o qual determina se a
proteína em estudo é deficiente em algum destes aminoácidos (SGARBIERI,
1987; FRIEDMAN, 1996; FAO/WHO/UNU, 2002).
Para a realização do escore químico, é necessária a determinação do
conteúdo de aminoácidos da proteína em questão, por meio de um método
analítico que seja rápido, confiável e preciso. Muitos métodos têm sido propostos,
incluindo cromatografia gasosa, HPLC e eletroforese capilar (JANSEN et al.,1986).
Para que a fonte protéica estudada não seja deficiente em aminoácidos
indispensáveis, seu teor deve ser igual ou maior que o preconizado pelo padrão
de referência (SGARBIERI, 1987; FRIEDMAN, 1996).
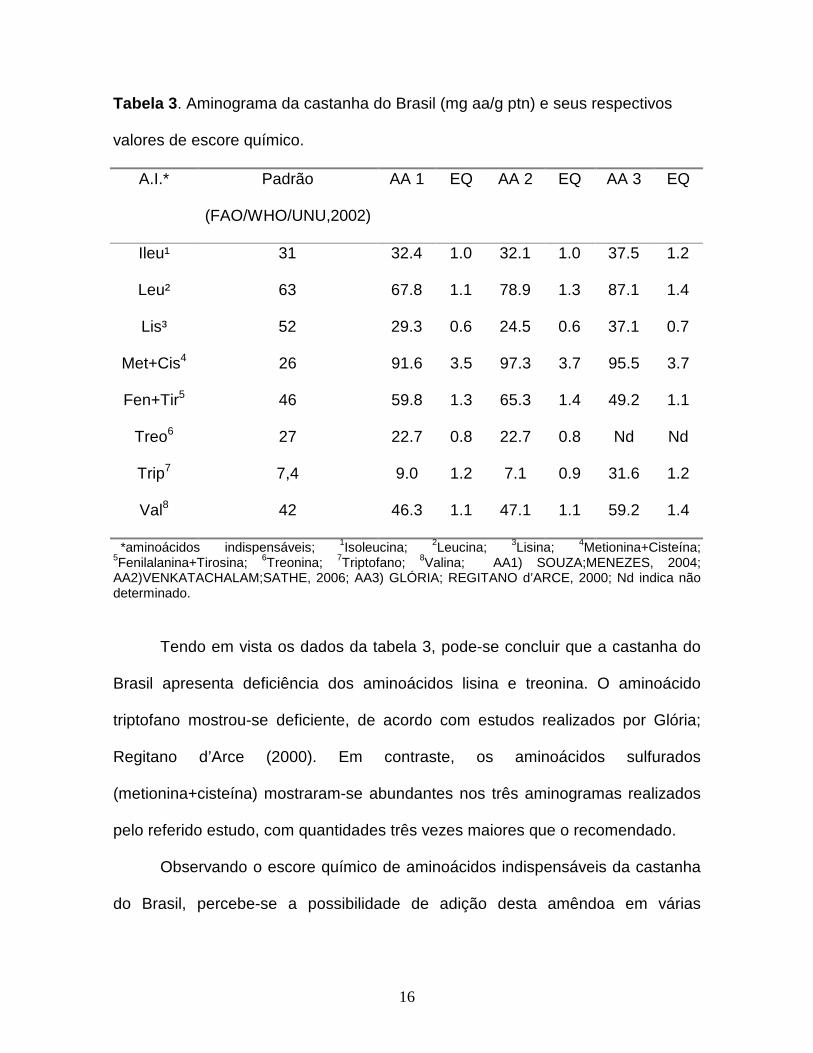
Na tabela 3 estão dispostos os resultados encontrados na literatura para o
aminograma da castanha do Brasil e seus respectivos escores químicos, sendo
utilizado como proteína padrão a FAO/WHO/UNU (2002).
16
Tabela 3 . Aminograma da castanha do Brasil (mg aa/g ptn) e seus respectivos
valores de escore químico.
A.I.* Padrão
(FAO/WHO/UNU,2002)
AA 1 EQ AA 2 EQ AA 3 EQ
Ileu¹ 31 32.4 1.0 32.1 1.0 37.5 1.2
Leu² 63 67.8 1.1 78.9 1.3 87.1 1.4
Lis³ 52 29.3 0.6 24.5 0.6 37.1 0.7
Met+Cis4 26 91.6 3.5 97.3 3.7 95.5 3.7
Fen+Tir5 46 59.8 1.3 65.3 1.4 49.2 1.1
Treo6 27 22.7 0.8 22.7 0.8 Nd Nd
Trip7 7,4 9.0 1.2 7.1 0.9 31.6 1.2
Val8 42 46.3 1.1 47.1 1.1 59.2 1.4
*aminoácidos indispensáveis; 1Isoleucina; 2Leucina; 3Lisina; 4Metionina+Cisteína; 5Fenilalanina+Tirosina; 6Treonina; 7Triptofano; 8Valina; AA1) SOUZA;MENEZES, 2004; AA2)VENKATACHALAM;SATHE, 2006; AA3) GLÓRIA; REGITANO d’ARCE, 2000; Nd indica não determinado.
Tendo em vista os dados da tabela 3, pode-se concluir que a castanha do
Brasil apresenta deficiência dos aminoácidos lisina e treonina. O aminoácido
triptofano mostrou-se deficiente, de acordo com estudos realizados por Glória;
Regitano d’Arce (2000). Em contraste, os aminoácidos sulfurados
(metionina+cisteína) mostraram-se abundantes nos três aminogramas realizados
pelo referido estudo, com quantidades três vezes maiores que o recomendado.
Observando o escore químico de aminoácidos indispensáveis da castanha
do Brasil, percebe-se a possibilidade de adição desta amêndoa em várias
17
preparações com o objetivo de adequar a demanda de aminoácidos às
necessidades de acordo com a FAO/WHO/UNU (2002).
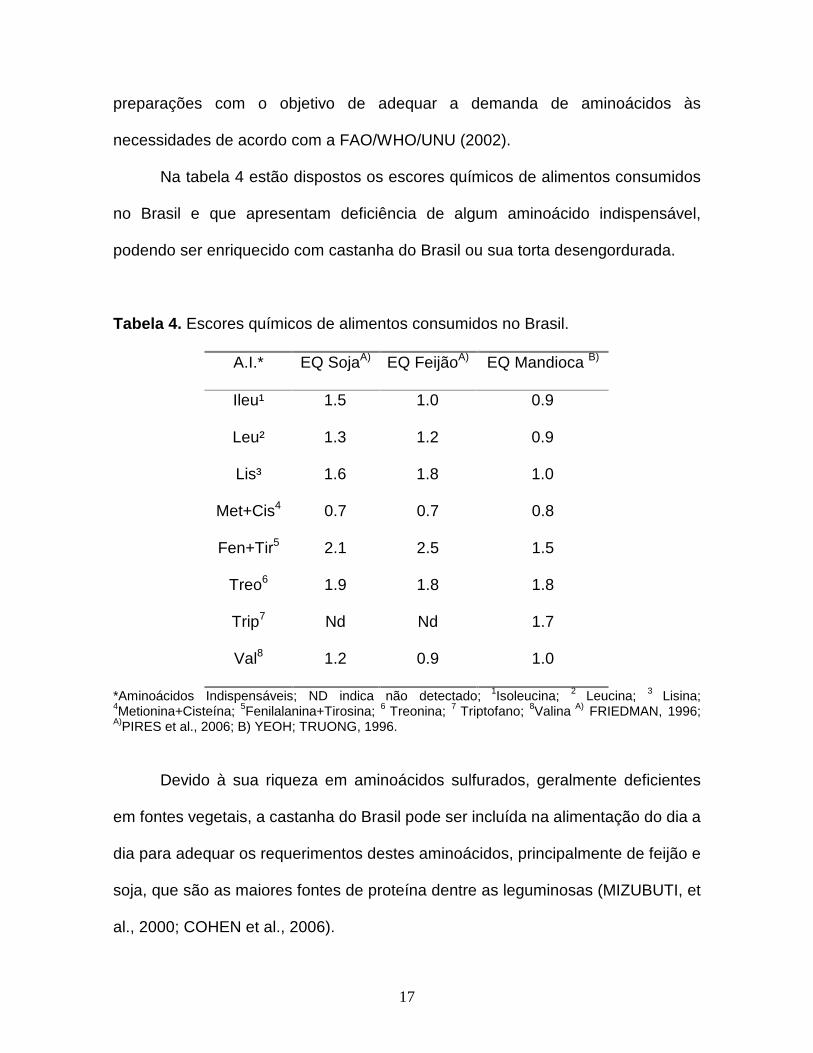
Na tabela 4 estão dispostos os escores químicos de alimentos consumidos
no Brasil e que apresentam deficiência de algum aminoácido indispensável,
podendo ser enriquecido com castanha do Brasil ou sua torta desengordurada.
Tabela 4. Escores químicos de alimentos consumidos no Brasil.
A.I.* EQ SojaA) EQ FeijãoA) EQ Mandioca B)
Ileu¹ 1.5 1.0 0.9
Leu² 1.3 1.2 0.9
Lis³ 1.6 1.8 1.0
Met+Cis4 0.7 0.7 0.8
Fen+Tir5 2.1 2.5 1.5
Treo6 1.9 1.8 1.8
Trip7 Nd Nd 1.7
Val8 1.2 0.9 1.0
*Aminoácidos Indispensáveis; ND indica não detectado; 1Isoleucina; 2 Leucina; 3 Lisina; 4Metionina+Cisteína; 5Fenilalanina+Tirosina; 6 Treonina; 7 Triptofano; 8Valina A) FRIEDMAN, 1996; A)PIRES et al., 2006; B) YEOH; TRUONG, 1996.
Devido à sua riqueza em aminoácidos sulfurados, geralmente deficientes
em fontes vegetais, a castanha do Brasil pode ser incluída na alimentação do dia a
dia para adequar os requerimentos destes aminoácidos, principalmente de feijão e
soja, que são as maiores fontes de proteína dentre as leguminosas (MIZUBUTI, et
al., 2000; COHEN et al., 2006).
18
A metionina possui grande importância metabólica devido sua função na
transmetilação e transulfuração em cisteína, a partir da transferência de 1 enxofre
da metionina para a serina. A cisteína possui função na síntese de proteínas, na
estrutura protéica, além de ser precursora da glutationa (GSH), taurina e coenzima
A, sendo essencial para o crescimento e desenvolvimento de mamíferos
(FINKELSTEIN; MARTIN, 1986; BAKER, 2006).
A mandioca é um dos alimentos preferenciais na mesa do brasileiro,
principalmente nas regiões sudeste, centro-oeste e norte (BORGES et al., 2002).
É cultivada em mais de 90 países tropicais e subtropicais e, apesar de seu baixo
valor nutricional, é uma das poucas fontes de proteína em muitas regiões do país,
chegando seu consumo médio anual perto de 50.6Kg por habitante (CONCEIÇÃO,
1987; LORENZI, 2003). Sendo assim, contribui com a erradicação da fome na
América do Sul (SIVIEIRO, 2006).
Analisando a tabela 4, observa-se que a mandioca possui deficiência de 3
aminoácidos indispensáveis - isoleucina, leucina e metionina+cisteína - presentes
na castanha do Brasil, podendo, portanto, viabilizar uma mistura desses dois
alimentos.
Alguns estudos têm sido desenvolvidos para enriquecimento de produtos de
mandioca com farinha de castanha do Brasil. Souza e Menezes (2004)
processaram amêndoa e torta de amêndoa de castanha do Brasil com farinha de
mandioca visando identificar os parâmetros de qualidade que justificassem e
incentivassem o aproveitamento destes produtos pela indústria de alimentos, e
concluíram que o produto final apresentou elevado teor energético e qualidade
protéica, devendo ser aproveitado no enriquecimento de alimentos.
19
Mais tarde, em 2008, os autores supracitados avaliaram a adição de farinha
de castanha do Brasil em produtos extrusados de mandioca e observaram
aumento nos percentuais de proteínas, cinzas fibras e lipídios no produto final,
contribuindo para o enriquecimento, utilização da castanha e diversificação de
produtos.
Estudos foram realizados por Cohen et al. (2005), e verificaram efeitos
positivos na produção de farinha mista de mandioca e castanha do Brasil,
apresentando menor teor de amido e maiores teores de cinza, lipídios e proteínas,
quando comparada a farinha de mandioca tradicional, sendo por isso de melhor
qualidade nutricional.
Em estudo realizado por Souza; Menezes (2006), os autores avaliaram a
aceitabilidade de cereais matinais de torta de amêndoa de castanha do Brasil com
mandioca de sabores doce, natural e salgado e concluíram que não foram
detectadas alterações nos atributos sensoriais que comprometessem a
aceitabilidade dos produtos, sendo satisfatória a sua aceitação.
Diante destes resultados, conclui-se a possibilidade de desenvolvimento de
produtos de mandioca e castanha do Brasil para o enriquecimento da alimentação,
não só do brasileiro, mas de todos os países que necessitam de um
enriquecimento em sua alimentação. A mandioca é apenas um exemplo do que
pode ser feito para fortalecer a alimentação da população. Estudos devem ser
desenvolvidos com outros alimentos que são consumidos em larga escala e que
podem ser enriquecidos com castanha do Brasil e sua torta desengordurada.

20
2.2 Aspectos relacionados ao teor de ácidos graxos da castanha do Brasil
Os ácidos graxos são conhecidos como fonte de energia para células
musculares, sinalizadores de vários processos celulares, reguladores da
expressão de genes, resistência à insulina e estresse oxidativo (SILVEIRA et. al,
2008).
A castanha do Brasil é muito rica em óleo, chegando a apresentar até
70.0% de lipídios em sua amêndoa. Desta forma, torna-se interessante avaliar sua
composição em ácidos graxos.
Em estudos realizados com este óleo, observou-se a prevalência de ácidos
graxos insaturados, variando de 72.0 a 75.0%, estando presentes em maiores
quantidades os ácidos graxos oléico e linoléico. Os ácidos saturados somam um
total de 24.0 a 28.0%, representados prioritariamente pelos ácidos palmítico e
esteárico (Tabela 5).
Tabela 5 . Composição em ácidos graxos da castanha do Brasil.
Ácidos Graxos % 1) %2) %3)
C 16:0 Palmítico 16.4 13.0 15.1
C 18:0 Esteárico 10.8 11.0 9.5
C18:1 Oléico 27.0 39.3 28.8
C18:2 Linoléico (ω-6) 45.0 36.1 45.4
1) FREITAS et al., 2007; 2) CHUNHIENG et al., 2008; 3) VENKATACHALAM; SATHE, 2006.
21
Quando comparada com outras amêndoas como castanha de caju, avelã,
pistache e amendoim, a castanha do Brasil apresenta o maior teor de ácidos
graxos poliinsaturados (PUFAs) (VENKATACHALAM ;SATHE, 2006).
Um fator positivo na qualidade nutricional da castanha do Brasil é o maior
percentual de monoinsaturados (MUFAs) e poliinsaturados (PUFAs), quando
comparado com o percentual de saturados. MUFAs e PUFAs oferecem benefícios
à saúde, especialmente com relação ao perfil lipídico, havendo visível redução de
VLDL (lipoproteína de muito baixa densidade) e LDL (lipoproteína de baixa
densidade). Além disso, conferem sabor agradável à semente e contribuem com
sua textura (VENKATACHALAM ;SATHE, 2006).
O ácido graxo encontrado em maior percentual no óleo da castanha do
Brasil é o linoléico, um ácidos graxos da família ω-6 (BEARE-ROGERS et al.,
2001). Possui 18 carbonos e 2 ligações duplas, a primeira encontra-se a 6
carbonos do grupo metil terminal (MAHAN; SCOTT-STUMP, 2005). Este ácido
graxo é convertido em ácido araquidônico, eicosanóides, tromboxanos,
prostaglandinas, prostaciclinas, leucotrienos e lipoxinas (YAMAMOTO; SMITH,
2002). As prostaglandinas e leucotrienos são substâncias envolvidas no sistema
imune e redução dos danos trombo-embólicos pela diminuição de agregação
plaquetária (CHUNHIENG et al., 2008).
Além disso, o ácido graxo ω-6 é importante para o crescimento e
reprodução, além de atenuar as ações da insulina na síntese de ácidos graxos e
na síntese de lipídios, assim como a expressão e atividade da FAS (fatty acid
synthase), o mecanismo biossintético dos ácidos graxos (HOLMAN, 1968; JONES
et al., 1996; WANG et al., 2004).

22
O ácido graxo oléico, segundo ácido graxo mais abundante no óleo da
castanha do Brasil, é metabolizado em oleoletanolamina (OEA), um composto
endógeno encontrado no intestino delgado, sua produção é aumentada com a
alimentação e diminuída no jejum. OEA é conhecido por induzir a saciedade e foi
demonstrado possuir propriedades anorexigênicas e de perda de peso. Pode
modular o estoque de lipídios no fígado e lipídios plasmáticos (triglicerídeos e
colesterol) (GAETANI et al., 2003; THABUIS et al., 2007; THABUIS et al., 2008).
Além da sua composição em ácidos graxos, a castanha do Brasil é rica
também em β-tocoferóis. Segundo estudo realizado por Chunhieng et al., 2008, o
óleo da castanha do Brasil apresentou 88.3% de β-tocoferol, e apresentou níveis
superiores que os óleos de oliva e noz.
Existem quatro tipos de tocoferóis, segundo a localização dos grupos metila
no anel: α, β, γ, δ e sua atividade antioxidante é devida principalmente à
capacidade de doar seus hidrogênios fenólicos aos radicais livres lipídicos
interrompendo a propagação em cadeia (RAMALHO; JORGE, 2006).
Os tocoferóis, classe de substâncias bioativas da vitamina E são
reconhecidos como antioxidante mais importante na célula. Protegem os
fosfolipídios insaturados da membrana celular da degeneração oxidativa pelas
espécies reativas de oxigênio e de outros radicais livres. São importantes para o
sistema de defesa antioxidante celular, que envolve outras enzimas como a
superóxido dismutase, a glutationa peroxidase e redutase, a catalase, a
tioredoxina redutase. Além dessas funções na célula, os tocoferóis costumam ser
adicionados nos óleos e gorduras comestíveis, prevenindo a oxidação dos ácidos
23
graxos insaturados (HENDLER, 1994; MAHAN; ESCOTT-STUMP, 2005;
RAMALHO; JORGE, 2006).
2.3 Aspectos relacionados à riqueza mineral da cast anha do Brasil
Como os vegetais são as principais fontes de minerais para os seres
humanos, o conhecimento de sua constituição é de fundamental importância para
a avaliação de sua qualidade. Normalmente, esses minerais estão ligados a
proteínas ou enzimas específicas, na forma de metaloproteínas e exercem seus
efeitos como centros ativos ou estruturais, comandam processos como catálise,
ligação, ativação, transporte e estoque de substratos (KENNEDY; GIBNEY, 2001;
TSHUVA; LIPPARD, 2004).
O teor de minerais presentes nos vegetais é dependente das características
do solo, da fisiologia da planta, da composição da água utilizada na irrigação, dos
fertilizantes, pesticidas, inseticidas e fungicidas utilizados nas plantações
(NAOZUKA; OLIVEIRA, 2007).
A castanha do Brasil possui em média 3.2 a 3.8% (Tabela 1) de cinza; e
sua torta desengordurada, de 7.0 a 13.0% (Tabela 2), o que reflete sua riqueza
mineral e também é um apelo ao seu consumo.
Em estudo realizado por Mitchell e Beadles (1937), encontraram maior
percentual de cinza na castanha do Brasil quando a compararam com outras
amêndoas como castanha de cajú e amendoim. O mesmo ocorreu em estudo
realizado por Venkatachalam e Sathe (2006), quando comparou a castanha do
24
Brasil com outras amêndoas, como castanha de cajú, amendoim, avelã,
macadâmia e pistache.
Já em 1929, Duke publicou os valores para minerais encontrados na
amêndoa de castanha do Brasil, como alumínio, boro, bário, bromo, cálcio,
cádmio, cério, cloro, cobalto, cromo, césio, cobre, eustênio, flúor, ferro, mercúrio,
iodo, potássio, lantânio, lutênio, magnésio, manganês, sódio, chumbo, antimônio,
escândio, selênio, silício, estanho, estrôncio, tálio, titânio, vanádio, tungstênio,
zinco.
Em estudo realizado por Naozuka e Olievira (2007), onde compararam a
composição mineral de castanha do Brasil, cupuaçú e côco, descobriram que a
castanha possui maior teor de cobre, ferro e manganês e menor teor de zinco
dentre as 3 amostras. O maior percentual de zinco foi encontrado no côco,
seguido pelo cupuaçu.
A castanha do Brasil é conhecida como a maior fonte natural de selênio;
foram encontrados valores que variaram de 0.003 a 51.2 mg/100g em sua
amêndoa (PALMER; HERR, 1982; SECOR; LISK, 1989; CHANG et al., 1995) e
0.7 mg/100g na torta desengordurada(SOUZA; MENEZES, 2004). A castanha do
Brasil contém a maior quantidade de selênio por grama de parte comestível
(BEHR, 2004).
A maior parte do selênio encontrado nos vegetais está sob a forma de
selenometionina, a qual é idêntica a metionina, exceto pela substituição do enxofre
pelo selênio. É incorporada no lugar da metionina em uma variedade de proteínas
(COMBS; COMBS, 1986; BRODY, 1993;).
25
Quando o fornecimento de selênio dietético é interrompido, a reserva de
selenometionina é mobilizada para disponibilizar selênio para o organismo, que
pode ser incorporado em macromoléculas, transportado para outros órgãos ou
excretado (UNRINE et al., 2007).
Diversas funções essenciais ao bom funcionamento do organismo são
atribuídas ao selênio, sendo a mais importante, caracterizada em 1973, a função
antioxidante, devido sua associação com a enzima glutationa peroxidase (GSH-
Px) (HALLIWELL;GUTTERIDGE, 1999; JUNIOR et al., 2001; FERREIRA et al.,
2002; SOUZA; MENEZES, 2004). Nesta enzima o selênio se encontra no centro
ativo, ligado covalentemente na forma de selenocisteína, característica
fundamental para sua ação na eliminação de peróxidos (ARTEEL; SIES, 2001;
YOSHIZAWA et al., 2003).
A riqueza mineral encontrada na castanha do Brasil também é um apelo
para o seu consumo, principalmente quanto ao teor de selênio, devido a seu
potencial antioxidante, prevenindo danos celulares.
26
Referências
AGUIAR, J. P. L. Tabela de Composição de Alimentos da Amazônia. Acta Amazônica , v.26,n. 1/2, p. 121-126, 1996. ANTUNES, A. J.; MARKAKIS, P. Protein suplementation of navy beans with Brazil nuts. Journal Agricultural Food Chemistry, v. 25, n. 5, p. 1096-1098, 1977. ARTEEL, G.E.; SIES, H. The biochemistry of selenium and glutathione system. Environmental Toxicology and Pharmacology. v. 10, n. 4, p. 153-158, 2001. BAKER, D.H. Comparative Species Utilization and Toxicity of Sulfur Amino Acids. Presented at the conference “The Fifth Workshop on The Assessment of Adequate Intake of Dietary Amino Acids” held October 24-25, 2005 in Los Angeles. The Journal of Nutrition , v. 136, n.6, (supl) p.1670S-1675S, 2006. BEARE-ROGERS, J.; DIEFFENBACHER, A.; HOLM, J. V. Lexicon of Lipid Nutrition (IUPAC Technical Report). Pure and Applied Chemistry , v. 73, n. 4, p. 685-744, 2001. BEHR, C. S. Efeito de uma dieta enriquecida com castanha-do-Bra sil (Bertholletia excelsa, L.) no estado nutricional re lativo ao selênio de idosos não institucionalizados . 2004. 99 p. Tese (Mestrado) – Faculdade de Ciências Farmacêuticas, Universidade de São Paulo, São Paulo, 2004. BORGES, M. F.; FUKUDA, W. M. G.; ROSSETTI, A.G.Avaliação de variedades de mandioca para consumo humano. Pesquisa Agropecuária Brasileira .v. 37, n. 11, p. 1559-1565, 2002. BRODY, T. Nutritional Biochemistry . San Diego: Academic Press, 1993. 658 p. CAMARGO, L. A. A. Estudo químico-bromatológico das castanhas da Bertholletia excelsa, H. B. K., 1968. 43 p. Tese (Doutorado). Universidade Estadual de São Paulo, Araraquara, 1968. CAVALCANTI, P. B. Frutas comestíveis da Amazônia . 5 ed. Belém: Edições CEJUP, 1991. 279p. CHANG, C. C.; GUTENMANN, W. H.; REID, C. M.; LISK, D. J. Selenium content of Brazil nuts from two geographic locations in Brazil. Chemosphere . v. 30, n. 4, p. 801-802, 1995.
27
CHUNHIENG, T.; GOLI, T.; PIOMBO, G.; PIOCH, D.; BROCHIER, J.; MONTET, D. Recent analysis of the composition of Brazil nut Bertholletia excelsa. Bois et Forêts des Tropiques , v. 280, n. 2, p. 91-98, 2004. CHUNHIENG, T., HAFIDI, A.; PIOCH, D.; BROCHIER, J.; MONTET, D. Detailed Study of Brazil Nut (Bertholletia excelsa) Oil Micro-Compounds: Phospholipids, Tocopherols and Sterols. Journal of Brazilian Chemical Society , v. 17, n. 7, p.1374-1380, 2008. COHEN, K.O.; CHISTÉ, R.C.; MATHIAS, E.A. Produção de farinha mista de mandioca e castanha-do-brasil . Belém: Embrapa Amazônia Oriental, 2005, 20p. COHEN, K. O; CHISTE, R. C.; MATHIAS, E. A. Produção de farinha parcialemnte desengordurada de castanha-do-Brasil. Circular Técnica, 42. EMBRAPA , 2006. COMBS, G.F.; COMBS, S.B. The role of selenium in nutrition . New York: Academic Press, 1986. 532 p. CONCEIÇÃO, A. J. A Mandioca . São Paulo: Livraria Nobel S.A., 1987. 382 p. DUKE, J. A. Handbook of Nuts . Florida: CRC Press, Inc. p.44-46. 1929. ELIAS, L. G.; BRESSANI, R. The Nutritive Value of the Brazil Nut Oil. Journal of the American Oil Chemists’ Society. v.38, n.8, p. 450-452, 1961. EMBRAPA, Empresa Brasileira de Pesquisa Agropecuária. Pesquisas com castanha terão apoio do Ministério. Sessão: Banco de notícias. jul. 2004. Disponível em : http://www.embrapa.br/noticias/banco_de_noticias/2004/julho/bn.2004-11-25.1907245320/mostra_noticia Acesso em: 18.07.2007. EMBRAPA, Empresa Brasileira de Pesquisa Agropecuária. Workshop discute temas relevantes sobre a castanha do Brasil. Belém: 2006. Seção: Notícias mar.2006. Disponível em: <http://www.embrapa.br/noticias/banco_de_noticias/folder.2006/marco/noticia.2006-03-30.5441113411/mostra_noticia> Acesso em 16.07.2007. FAO/WHO/UNU. Protein and amino acid requirements in human nutrit ion. Report of a Joint Expert Consultant. Geneva, Switzerland, 2002, 265p. FERREIRA, K. S.; GOMES, J. C.; BELLATO, C. R.; JORDÃO, C. P. Concentrações de selênio em alimentos consumidos no Brasil. Revista Panamericana de Salud Pública / Pan American Journal of Public Health. v. 11, n.3, p. 172-177, 2002.
28
FINKELSTEIN, J. D.; MARTIN, J. J. Methionine Metabolism in Mammals- Adaptation to methionine excess. The Journal of Biological Chemistry. v. 261, n. 4. p. 1582-1587,1986. FREITAS, S. P.; SILVA, O. F.; MIRANDA, I. C.; COELHO, M. A. Z. Extração e fracionamento simultâneo do óleo da castanha-do-Brasil com etanol. Ciência e Tecnologia de Alimentos , v.27, n.1 (suppl), pp. 14-17, 2007. FRIEDMAN, M. Nutritional Value of Proteins from Different Food Sources. A Review. Journal of Agricultural and Food Chemistry . v. 44, n.11, p. 6-24, 1996. GAETANI, S.; OVEISI, F.; PIOMELLI, D. Modulation of meal pattern in the rat by the anorexic lipid mediator oleoylethanolamide. Neuropsychopharmacology. v.28, n. 7, p. 1311-1316, 2003. GARLICK, P.J. The role of leucine in the regulation of protein metabolism. Journal of Nutrition. v.135, suppl. p.1553– 1556, 2005. GLÓRIA, M. M.; REGITANO-d'ARCE, M. A. B. Concentrado e isolado protéico de torta de castanha do pará: obtenção e caracterização química e funcional. Ciência e Tecnologia de Alimentos , v. 20, n. 2, p.240-245, 2000. GUTIERREZ, E. M. R.; REGITANO-D ARCE, M. A. B.; RAUEN-MIGUEL, A. M. O. Estabilidade oxidativa do óleo bruto da castanha do Pará (Berthollethia excelsa). Ciência e Tecnologia de Alimentos. v. 17, n. 1, p. 22-27, 1997. HALLIWELL, B. GUTTERIDGE, J. M. C. Free radicals in biology and medicine. 3. ed. New York: OXFORD University Press, 1999. 936 p. HENDLER, S. S. A Enciclopédia de vitaminas e minerais . 9.ed. Rio de Janeiro: Campus, 1994. 576p. HOLMAN, R. T. Biological Activities of and Requirements for Polyunsaturated Fatty Acids. Progress in the Chemistry of Fats and Other Lipids , v. 9, p. 611–680, 1968. IBGE. Produção da Extração Vegetal e da Silvicultura . Sessão: Comentário, 2006. Disponível em: http://www.ibge.gov.br/home/estatistica/economia/pevs/2006/comentario.pdf. Acesso em 01.04.2009. JANSEN, P.S.L.; NISPEN, J. W. V.;MELGERS, P. A. T. A; VAN DEN BOGAART, H.W. M; VAN AALST, G.W. M.; GOVERDE B. C. HPLC Analysis of Phenylthiocarbamyl (PTC) Amino AcidsII. Application in the Analysis of (Poly)peptides. Chromatographia . v. 22, n.7-12, p.351-357,1986.
29
JONES, B. H., MAHER, M. A., BANZ, W. J., ZEMEL, M. B., WHELAN, J., SMITH, P. J.; MOUSTAID, N. Adipose tissue stearoyl-CoA desaturase mRNA is increased by obesity and decreased by polyunsaturated fatty acids. American Journal of Physiology , v. 271, n.1, p.E44–E49, 1996. JUNIOR L. R.; HÖEHR, N. F.; VELLASCO, A. P; KUBOTA, L. T. Sistema antioxidante envolvendo o ciclo metabólico da glutationa associado a métodos eletroanalíticos na avaliação do estresse oxidativo Química Nova . v. 24, n. 1, p. 112-119, 2001. KENNEDY, M. L.; GIBNEY, B. R. Metalloprotein and redox protein design. Current Opinion in Structural Biology. v.11, n.1, p.485–490, 2001. LAGO, R. C. A.; FREITAS, S. P. Extração dos óleos de café verde e da borra de café com etanol comercial. Comunicado Técnico nº. 92, Embrapa , 2006. LAYMAN, D.K. The role of leucine in weight loss diets and glucose homeostasis. Journal of Nutrition. v. 133, n.1, suppl.S261–267, 2003 LORENZI, J. O. Mandioca . Campinas: CATI. 2003. 116 p. LORENZI, H. Árvores brasileiras , 4 ed. v.1. São Paulo: Instituto Plantarum, 2000. MAHAN, L.K., ESCOTT-STUMP, S. Alimentos, nutrição & dietoterapia. São Paulo: Rocca, 2005. 1242p. MINISTÉRIO DA AGRICULTURA, Castanha do Brasil Levantamento Preliminar . Belém. 1976. 69 p. MITCHELL, H.H.;BEADLES, J.R. The nutritive value of the proteins of nuts in comparison with the nutritive value of beef proteins. Journal of Nutrition , v.14, n.6, p.597-608, 1937. MIZUBUTI, I. Y.; SOUZA, L. W. O.; JÚNIOR, O. B.; IDA, E. I.; Propriedades químicas e cômputo químico dos aminoácidos da farinha e concentrado protéico de feijão guandu (cajanus cajan (l.) millsp). Boletim CEPPA , Curitiba, v. 18, n. 2, p. 237-248, 2000. NAOZUKA, J.; OLIVEIRA, P. V. Cu, Fe, Mn and Zn Distribuition in Protein Fractions of Brazil-Nut, Cupuassu Seed and Coconut Pulp by Solid-Liquid Extraction and Electrothermal Atomic Absorption Spectrometry. Journal of Brazilian Chemistry Society. v. 18, n. 8, p. 1547-1553, 2007. PALMER, I. S.; HERR, A. N. Journal Food Science. Institute of Food Techonologists . v. 47, p.1595-1597, 1982.
30
PIRES,C. V.;OLIVEIRA,M. G. A.;ROSA, J. C.; COSTA, N. M. B.Qualidade nutricional e Escore Químico de aminoácidos de diferentes fontes protéicas. Ciência e Tecnologia de Alimentos , v.26, n.1, p.179-187, 2006. RAMALHO, V. C.; JORGE, N. Antioxidantes utilizados em óleos, gorduras e alimentos gordurosos. Quimica Nova. v. 29, n. 4, 755-760, 2006. RIBEIRO, M.A. de A. Aproveitamento tecnológico de castanhas-do-brasil (Bertholletia excelsa): estudo da qualidade de conservação . Piracicaba, 1992. 117p. Dissertação (Mestrado) - Escola Superior de Agricultura “Luiz de Queiroz”, Universidade de São Paulo. ROSE W.C., Amino acid requirements of man. Federation Proceedings . v.8, n.1, p.546-52, 1949. ROTENBERG, B.; IACHAN, A. Estudo da proteína da castanha-do-pará. Informativo do Instituto Nacional de Tecnologia (IN T), v. 8, n. 7, p. 22-24, 1975. SECOR, C. L.; LISK, D. J. Variation in the selenium content in individual Brazil nuts. Journal of Food Safety . v. 9, n. 4, p. 279-281, 1989. SGARBIERI, V.C., Alimentação e nutrição: fator de saúde e desenvolvi mento. Campinas: Editora da UNICAMP; São Paulo: Almed, 1987. 387 p. SILVEIRA, L. R.; FIAMONCINI, J.; HIRABARA, S. M.; PIO J. P.; CAMBIAGHI, T. D.; PINHEIRO, C. H. J.; LOPES, L. R.; CURI, R. Updating the Effects of Fatty Acids on Skeletal Muscle. Journal of Cellular Physiology , v. 217, n. 1, p. 1-12, 2008. SIVIEIRO, A.; RAIMUNDO, C. F. E.; LESSA, L. S.; DELUNARDO, T. A.; PARDINAS, O. B. Farinha mista de mandioca com castanha-do-brasil: uma alternativa agroecológica para a reserva extrativista cazumbá-iracema. IBAMA , 2006. SOUZA, M. L.; HOLANDA, L. F. F.; MAlA, G. A.; JUNIOR, J. C. G.; FIGUEIREDO, R. W. Estudo do Processamento e estabilidade da farinha de amêndoa da castanha-do-Brasil (Bertholletia Excelsa H.B.K.). Revista Ciência Agronômica. v. 7, n. 1, p. 35-42, 1986. SOUZA, M. L. Estudos de processos tecnológicos para a obtenção d e produtos derivados de castanha-do- Brasil ( Bertholletia excelsa, H.B.K .). Fortaleza. 1984, 139p. Dissertação (Mestrado em Tecnologia de Alimentos), Universidade Federal do Ceará.
31
SOUZA, M. L.; MENEZES, H. C. Processamentos de amêndoa e torta de castanha-do-brasil e farinha de mandioca: parâmetros de qualidade. Ciência e Tecnologia de Alimentos. v. 24, n. 1, p.120-128, 2004. SOUZA, M. L.; MENEZES, H. C. Avaliação sensorial de cereais matinais de castanha-do-brasil com mandioca extrusados. Ciência e Tecnologia de Alimentos. v. 26, n.4, p. 950-955, 2006. SOUZA. M. L., MENEZES, H. C.; Extrusão de misturas de castanha do Brasil com mandioca. Ciência e Tecnologia de Alimentos . v. 28, n.2, p. 451-462, 2008. SPINI, V. B. M. G.; FERREIRA, F. R.; PADUANI, G. F.; SOUZA, C. S.; KERR, W. E. Efeito da adição de Castanha-do-Pará à dieta de arroz e feijão sobre o ganho de peso em camundongos. Bioscience Journal. v. 22, n. 3, p. 89-93, 2006. STOIAN, D. Cosechando lo que cae:la economia de la castaña (Bertholletia excelsa H.B.K) em la Amazônia Boliviana. In: ALEXIADES, M.N.; SHANLEY, P. (Eds.) Productos forestales, medios de subsistencia y conservación de productos forestales no maderables. Center for International Forest Research . v.3, p.89-116, 2004. TEIXEIRA, E. Frutas do Brasil . Rio de Janeiro: MEC/INL, 1954. 281p. THABUIS, C.; DESTAILLATS, F.; TISSOT-FAVRE, D.; MARTIN, J-C. Oleoyl-ethanolamide (OEA): A bioactive lipid derived from oleic acid and phosphatidylethanolamine. Lipid Technology , v. 19, n. 10, p. 225-227, 2007. THABUIS, C.; TISSOT-FAVRE, D.; BEZELGUES, J-B.; MARTIN, J-C.; CRUZ-HERNANDEZ, C.; DIONISI, F.; DESTAILLATS, F. Biological Functions and Metabolism of Oleoylethanolamide. Lipids , v. 43, n.10, p. 887-894, 2008. TSHUVA, E. Y.; LIPPARD, S. J. Synthetic Models for Non-Heme Carboxylate-Bridged Diiron Metalloproteins: Strategies and Tactics. Chemical Reviews . v.104, n.2, p.987-1012, 2004. U N R I N E ,J. M.; J A C K S O N , B. P.; H O P K I N S. W. A. Selenomethionine Biotransformation and Incorporation into Proteins along a Simulated Terrestrial Food. Chain Environmental Science and Technology . v. 41, n.10, p. 3601-3606, 2007. VENKATACHALAM, M.; SATHE, S. K. Chemical Composition of Selected Edible Nuts Seeds. Journal of Agricultural and Food Chemistry , v.54, n.13 p. 4705-47014, 2006.
32
WANG, Y.; VOY, B. J.; URS, S.; KIM, S.; SOLTANI-BEJNOOD, M.; QUIGLEY, N.; HEO, Y. R.; STANDRIDGE, M.; ANDERSEN, B.; DHAR, M.; JOSHI, R.; WORTMAN, P.; TAYLOR, J.W.; CHUN, J.; LEUZE, M.; CLAYCOMBE, K.; SAXTON, A. M.; MOUSTAID-MOUSSA, N. The Human Fatty Acid Synthase Gene and De Novo Lipogenesis Are Coordinately Regulated in Human Adipose Tissue. Journal of Nutrition , v. 134, n.5, p. 1032-1038, 2004. YAMAMOTO, S.; SMITH, W. L. Molecular Biology of the Arachidonate Cascade (second edition). Prostaglandins & Other Lipid Mediators .v.68–69, n.2, p.1, 2002. YEOH, H. H.; TRUONG, V-D .Protein contents, Amino Acid compositions and Nitrogen-to-protein conversion factors for cassava roots. Journal of Science Food Agricultural . v. 70, n.1, p. 51-54, 1996. YOSHIZAWA, K.; ASCHIERO, A.; MORRIS, J. S.; SATMPFER, M. J.; GIOVANNUCCI, E.; BASKETT, C. K.; WILLET, W. C., RIMM, E. B. Prospective study of selenium levels in toenails and risk of coronary heart disease in men. American Journal of Epidemiology . v. 158, n. 9, p. 852-860, 2003.
33
Capítulo 2
Brazil nut protein quality evaluation by the use of HPLC and “in vivo”
methods
(Artigo submetido para a revista Journal of Separation Science, em edição
especial para análise de alimentos)
Abstract
The objective of this investigation was to evaluate the protein quality of the
defatted cake of Brazil nut (DC) using chemical and biological methods. An HPLC
method was used to analyze the amino acids in DC and casein (CAS) after
derivatization with phenylisothiocyanante (PITC). The amino acid analyses were
carried on an HPLC equipped with LUNA C8 column with UV detection at 254nm.
The amino acids found at deficient concentrations were lysine and threonine;
methionine+cysteine was found at the higher concentrations than biologically
required. The Biological indices in the diets containing DC showed a PER (Protein
Efficiency Ratio) greater than 2.0, a positive NB (Nitrogen Balance), an Apparent
Digestiblity (AD) higher than 90.0% and Apparent Biological Value (ABV) near
90.0%. HPLC and the biological indices determined revealed to be suitable
methods for evaluating DC protein value.
Abbreviations : DC, Deffated Cake of Brazil nut; CAS, Casein; PITC,
Phenylisothiocyanante; AABA , Alpha Amino Butyric Acid; CS, Chemical Score;
PER, Protein Efficiency Ratio; NB, Nitrogen Balance; AD, Apparent Digestibility;
ABV , Apparent Biological Value; NC, Nitrogen Consumed; NF, Nitrogen in Feces;
NU, Nitrogen in Urine.

34
Keywords: HPLC; protein quality; chemical methods; biological methods; Brazil
nut; Wistar rats.
1. Introduction
Brazil nut (Bertholletia excelsa) is a native Amazon product with social,
environmental and economical importance. The nut is referred to as “vegetable
meat” and contains 67.3% of lipid, 14.2% of protein and 3.4% of carbohydrates
[1,2]. Brazil produces around 30.000 tons of Brazil nut per year and only 5% are
used in internal consumption. The nuts are generally consumed “in natura”[3,4].
The pharmaceutical industry have been used the Brazil nut as raw material
to produce pressed oil. The residue of the process, the defatted cake, have a high
nutritional value [5]: 25.1% lipids, 40.2% protein and 3.4% carbohydrates [2].
The quality of the protein source can be measured by chemical and
biological methods. A chemical method is the Chemical Score (CS), that indicates
which indispensable amino acid is the most limiting [6,7] and the protein quality is
predicted by the adequate concentration of indispensable amino acids [6,7,8].
In order to determine the amino acids profile, a rapid, reliable and precise
analytical method is necessary. Many analytical methods have been proposed,
including gas chromatography, HPLC and capillary electrophoresis [9].
HPLC is a powerful method to estimate the protein quality as the
indispensable amino acids are analyzed and the limiting amino acids can be easily
detected. In this way, the most common method to analyze amino acids in food is
the reverse-phase HPLC using precolumn derivatization. Typical reagents used for
derivatization are phenylisothiocyanate (PITC) [9-14]; orthophthalaldehyde
35
(OPA)[15]; 9-fluorenylmethyl-chloroformate (FMOC-Cl) [16-18], 1-fluoro-2.4
dinitrobenzene, 1-fluoro-2.4-dinitrophenyl-5-L-alanine amide and dansyl-chloride
[9,18].
Derivatization with PITC in protein hydrolysates of different foods results in
phenylthiocarbamil amino acids (PTC-amino acids). This method is generally
regarded as less sensitive than the ones based on the fluorimetric detection [9].
However the PITC method quantifies secondary amino acids, such as proline and
hidroxyproline, and it is not necessary a second detector[11].
Methods based in food intake, weight gain, total nitrogen in feces and urine
are used for biological evaluation of protein quality. Some of the well-known
biological indices are PER (Protein Efficiency Ratio), that measures the weight gain
divided by protein intake mass; NB (Nitrogen Balance) that measures the
difference between intake and excreted nitrogen; D (Digestibility), percentage of
hydrolyzed protein by digestive enzymes absorbed as amino acids or other
nitrogen compounds, and BV (Biological Value), that measures the percentage of
nitrogen absorbed that is used at tissue level [6,7].
Many studies are being developed as an attempt to replace animal protein
sources for others of lower costs, to supply the increasing population needs and
institutional demands [19].
Due to the large production of Brazil nut defatted cake, which has high
nutritional quality, the objective of this study was evaluate the Brazil nut´s defatted
quality by using chemical and rat “in vivo” methods.
36
2. Materials and Methods
2.1 Protein sources
The protein sources used in this work were casein (Naarde- Agro Product
BV- Holland) as standard protein [20] and defatted cake of Brazil nut (DC). The
proximate composition (ash, moisture, protein) of samples was analyzed by the
methods described in Association of Official Analytical Chemists [21], using the
conversion factor 6.25 for total nitrogen to CAS and 5.46 for DC[5], and the lipid
analysis (ether extract) was performe by the Soxhlet method [22]. The analyses
were performed in the Nutrition and Metabolism Laboratory (Lanum), Departament
of Food and Nutrition (Depan), Faculty of Food Engineering (FEA), State University
of Campinas (Unicamp).
The Brazil nuts were donated by “Juta and Castanha Company” (São Paulo
– SP). The nuts were defatted by pressing using Scott Tech’s SMR 600-E press.
The raw material was heated to approximately 60°C f or 30 min, and then the oil
was extracted after griding by the use of Extractor Scott Tech’s ERT-60-II.
2.2 Amino acid analysis of protein sources (chemica l indice of protein
quality)
2.2.1 Reagents and standards
Hydrochloric acid (Merck), phenol (Merck), sodium acetate (Merck),
methanol (Merck), triethylamine (Merck), phenylisothiocyanate (PITC - SIGMA),
monoacid sodium phosphate, phosphoric acid, acetonitrile (ACN), dissodic EDTA,
glacial acetic acid, ultrapure water, Pierce Standard (obtained from Pierce), with all
37
components in the concentration 2.5 µmol/mL, except the cystine that have 1.25
µmol/mL, in HCl 0.1 M and Alpha Amino Butiric Acid (AABA - Aldrich).
2.2.2. Apparatus
The analytical system was the SPECTRA SYSTEM (Thermo Separation
Products). The analytical column, LUNA C8 100 Å 5µ, 250x4.6mm 00G-4252-EQ
(PHENOMENEX - USA Torrance, CA.); quaternary pump SPECTRA SYSTEM
P4000 (Thermo Separation Products); injection valve RheodyneForno
THERMASPHERE TS-130 HPLC (PHENOMENEX - USA Torrance, CA.);
detection module UV SPECTRA SYSTEM UV 2000 (Thermo Separation
Products); Degasser SPECTRA SYSTEM (Thermo Separation Products); all
thermo modules Thermo Fisher Scientific Inc.
2.2.3 Sample preparation and derivatization
The samples were weighted (0.10 g CAS and 0.15g DC) and placed into
hydrolysis tubes with addition of 9 mL of hydrochloric acid 6M containing 1%
phenol. The tubes were closed under nitrogen gas and mixed for 30 s in a vortex,
heated at 110 ºC for 24 h, let them cool to room temperature, added of AABA and
mixed for 30 s; transferred to a volumetric flask and diluted with ultrapure water;
then filtered with a plastic syringe attached to 0.45 µm Millipore filter Millex; 40µL of
filtered were mixture transferred to a glass tube with 6 X 50 mm, for the
derivatization procedures.
38
The samples were dried under vacuum and added of 20µL of 2:2:1 (sodium
acetate 0.2N: methanol: trietilamine [v/v/v]). The solution was transferred to a
100mL recipient, with cover, homogenized and stocked at a temperature lower
than 10ºC.
The sample was dried again and added approximately 20µL of derivatization
solution 7:1:1 (methanol:ultra pure water:trietilamine with PITC [v/v/v]) then
homogenized in vortex during 15 s. After 20 min, the sample was dried again,
added of about 500µL of monoacid sodium phosfate with ACN, the tube was
covered with 3 teflon layers, mixed under ultrasound during 30 s, transferred to
HPLC injector and quantified by UV absorption in 254 nm[10,23].
2.3 Chemical Score of protein sources (chemical ind ice of protein quality)
The CS is one of the methods used to express amino acid adequacy value
of proteins. The limiting amino acid is determined by the amount of the
indispensable amino acid compared with the amount of the same amino acid
recommended by the Food and Agriculture Organization’s reference protein [24]
for children 2-5 years old, applying the Expression (1) [6,7].
proteinreferenceofginaaofmg
proteintestaofginaaofmgSC
1
1= (1)
39
2.4 Biological evaluation of Brazil nut protein qua lity
2.4.1 “In vivo” assay
The “in vivo” assay was done in the Biological Evaluation Laboratory (LEB),
Depan-FEA-Unicamp. Twenty-four male Wistar rats, 21 days old (newly weaned)
with initial weight about 52.7 ± 6.2g were used (the animals were supplied by the
Multidisciplinar Center of Biological Investigation – CEMIB, Unicamp). The rats
were housed in individual cages, with temperature (20-22°C) and controlled
humidity (40-50%), including light/dark cicle of 12 h and access to water and food
ad libitum. The ingestion of feed was monitored daily and weight gain was
measured 3 times per week.
The animals were divided into 4 experimental groups of 6 animals each and
submitted to mixed diets, except for G1 group, wich received the AIN 93-G diet [20]
as a control. The protein source and its proportions were varied among the feeds in
order to evaluate DC quality (see Table 1). The animals were sacrificed by
decapitation. This study was approved by the Ethics Committee on Animal
Experimentation of Unicamp, under Protocol nº 1680-1.
2.4.2 Diet formulation
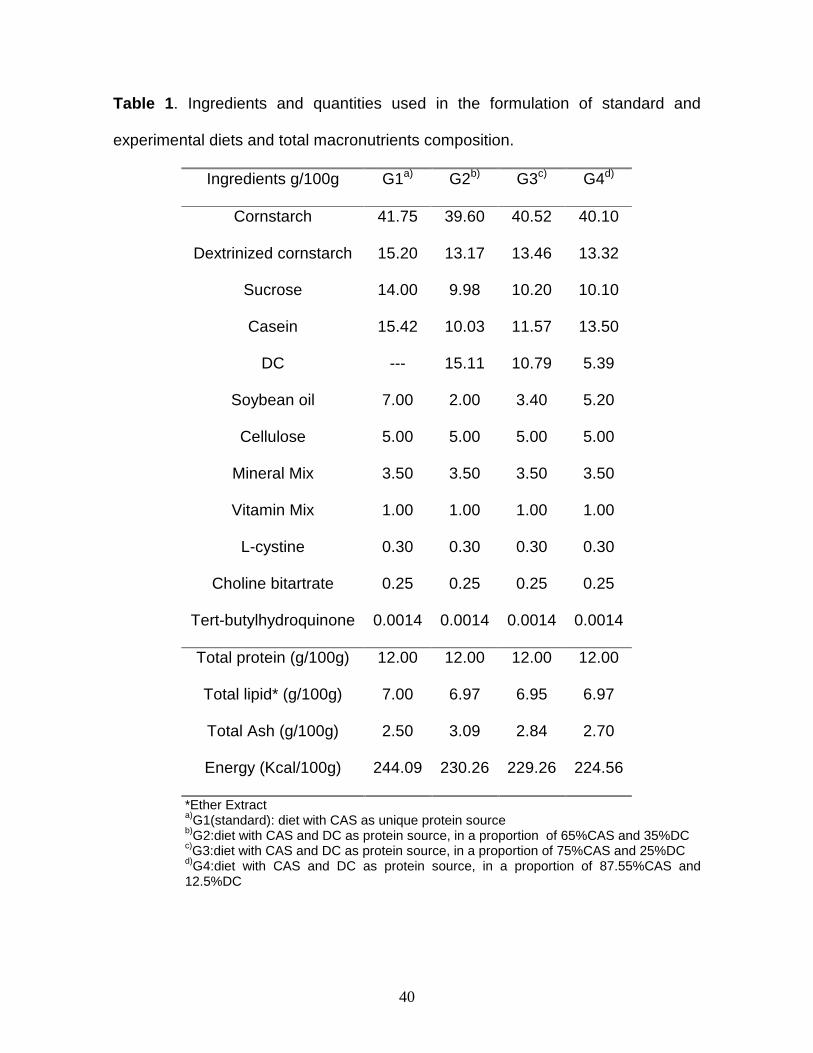
Four diets were prepared, as showed in Table 1. All diets showed protein
content of 12% [25] and the proximate composition analysis was done according to
methods mentioned in section 2.1.
The contents of carbohydrates, lipids and proteins of DC were considered
for the diets formulation. However, the ash content was not considered; thus, the
diets with DC showed higher ash contents compared to standard diet.
40
Table 1 . Ingredients and quantities used in the formulation of standard and
experimental diets and total macronutrients composition.
Ingredients g/100g G1a) G2b) G3c) G4d)
Cornstarch 41.75 39.60 40.52 40.10
Dextrinized cornstarch 15.20 13.17 13.46 13.32
Sucrose 14.00 9.98 10.20 10.10
Casein 15.42 10.03 11.57 13.50
DC --- 15.11 10.79 5.39
Soybean oil 7.00 2.00 3.40 5.20
Cellulose 5.00 5.00 5.00 5.00
Mineral Mix 3.50 3.50 3.50 3.50
Vitamin Mix 1.00 1.00 1.00 1.00
L-cystine 0.30 0.30 0.30 0.30
Choline bitartrate 0.25 0.25 0.25 0.25
Tert-butylhydroquinone 0.0014 0.0014 0.0014 0.0014
Total protein (g/100g) 12.00 12.00 12.00 12.00
Total lipid* (g/100g) 7.00 6.97 6.95 6.97
Total Ash (g/100g) 2.50 3.09 2.84 2.70
Energy (Kcal/100g) 244.09 230.26 229.26 224.56
*Ether Extract a)G1(standard): diet with CAS as unique protein source b)G2:diet with CAS and DC as protein source, in a proportion of 65%CAS and 35%DC c)G3:diet with CAS and DC as protein source, in a proportion of 75%CAS and 25%DC d)G4:diet with CAS and DC as protein source, in a proportion of 87.55%CAS and 12.5%DC
41
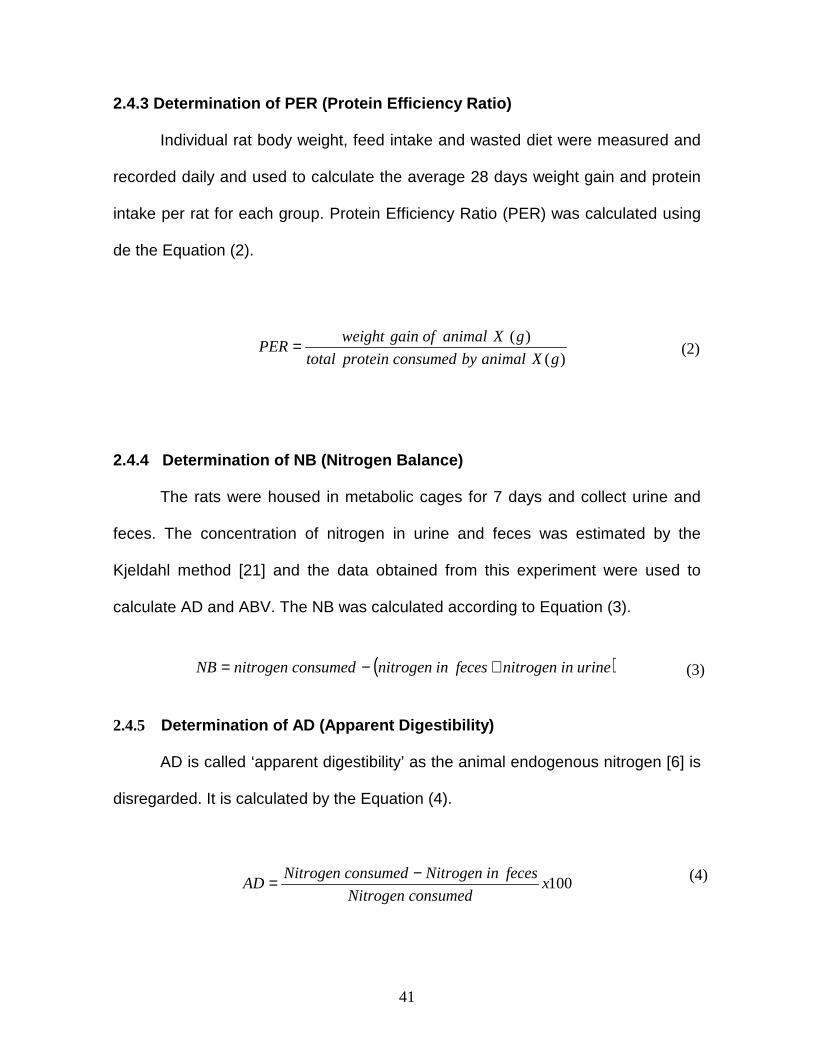
2.4.3 Determination of PER (Protein Efficiency Rati o)
Individual rat body weight, feed intake and wasted diet were measured and
recorded daily and used to calculate the average 28 days weight gain and protein
intake per rat for each group. Protein Efficiency Ratio (PER) was calculated using
de the Equation (2).
)(
)(
gXanimalbyconsumedproteintotal
gXanimalofgainweightPER =
2.4.4 Determination of NB (Nitrogen Balance)
The rats were housed in metabolic cages for 7 days and collect urine and
feces. The concentration of nitrogen in urine and feces was estimated by the
Kjeldahl method [21] and the data obtained from this experiment were used to
calculate AD and ABV. The NB was calculated according to Equation (3).
2.4.5 Determination of AD (Apparent Digestibility)
AD is called ‘apparent digestibility’ as the animal endogenous nitrogen [6] is
disregarded. It is calculated by the Equation (4).
100xconsumedNitrogen
fecesinNitrogenconsumedNitrogenAD
−=
( )urineinnitrogenfecesinnitrogenconsumednitrogenNB +−=
(2)
(3)
(4)
42
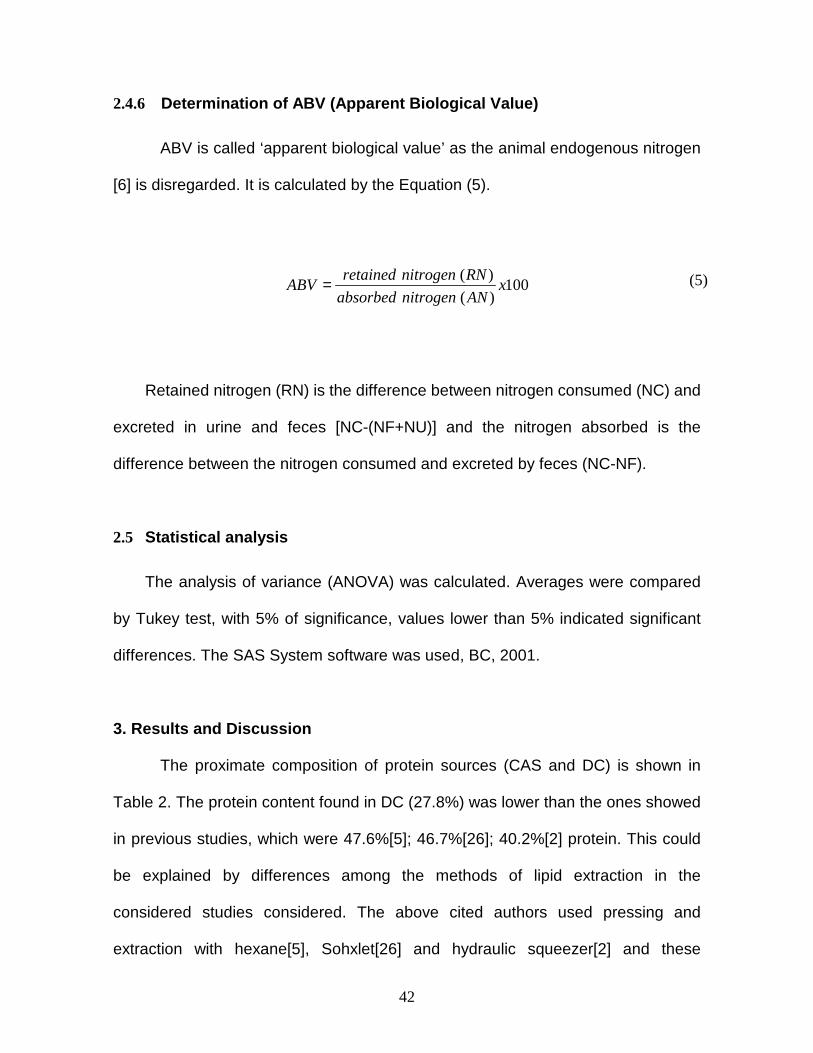
2.4.6 Determination of ABV (Apparent Biological Value)
ABV is called ‘apparent biological value’ as the animal endogenous nitrogen
[6] is disregarded. It is calculated by the Equation (5).
100)(
)(x
ANnitrogenabsorbed
RNnitrogenretainedABV =
Retained nitrogen (RN) is the difference between nitrogen consumed (NC) and
excreted in urine and feces [NC-(NF+NU)] and the nitrogen absorbed is the
difference between the nitrogen consumed and excreted by feces (NC-NF).
2.5 Statistical analysis
The analysis of variance (ANOVA) was calculated. Averages were compared
by Tukey test, with 5% of significance, values lower than 5% indicated significant
differences. The SAS System software was used, BC, 2001.
3. Results and Discussion
The proximate composition of protein sources (CAS and DC) is shown in
Table 2. The protein content found in DC (27.8%) was lower than the ones showed
in previous studies, which were 47.6%[5]; 46.7%[26]; 40.2%[2] protein. This could
be explained by differences among the methods of lipid extraction in the
considered studies considered. The above cited authors used pressing and
extraction with hexane[5], Sohxlet[26] and hydraulic squeezer[2] and these
(5)

43
methods showed to be more effective to remove the oil from Brazil nuts. In the
present work we have done only pressing, because the use of solvent to maximize
the extraction would leave chemical traces, thus turning the defatted cake improper
for consumption for the animals used in the biological assay [27].
As consequence of the lower efficiency in the lipid extraction of Brazil nut in
this study, we found a high content of ether extract (32.9%) in our DC; while other
investigators report lower contents of oil in DC (1.2% [5] and 25.13% [2]).
Table 2 . Proximate composition of protein sources (casein and defatted cake of
Brazil nut) used.
Protein source % Moisture % Ash % Protein % Ether Extract % Carbohydrate
CAS 10.0 3.1 77.8 0.3 8.8
DC 3.8 14.3 27.8 32.9 21.2
The aminograms of DC and CAS samples were compared with some others
available in literature. Tables 3 and 4 compare our results with data from the literature.
44
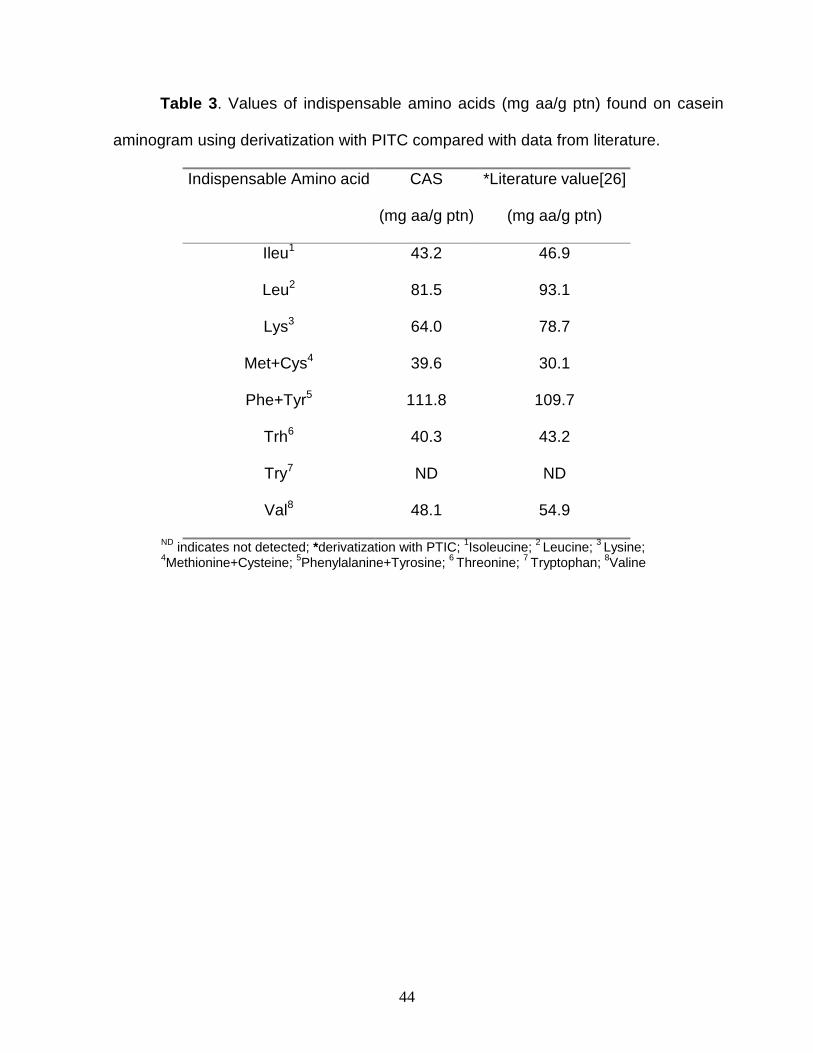
Table 3 . Values of indispensable amino acids (mg aa/g ptn) found on casein
aminogram using derivatization with PITC compared with data from literature.
Indispensable Amino acid CAS
(mg aa/g ptn)
*Literature value[26]
(mg aa/g ptn)
Ileu1 43.2 46.9
Leu2 81.5 93.1
Lys3 64.0 78.7
Met+Cys4 39.6 30.1
Phe+Tyr5 111.8 109.7
Trh6 40.3 43.2
Try7 ND ND
Val8 48.1 54.9
ND indicates not detected; *derivatization with PTIC; 1Isoleucine; 2 Leucine; 3 Lysine; 4Methionine+Cysteine; 5Phenylalanine+Tyrosine; 6 Threonine; 7 Tryptophan; 8Valine
45
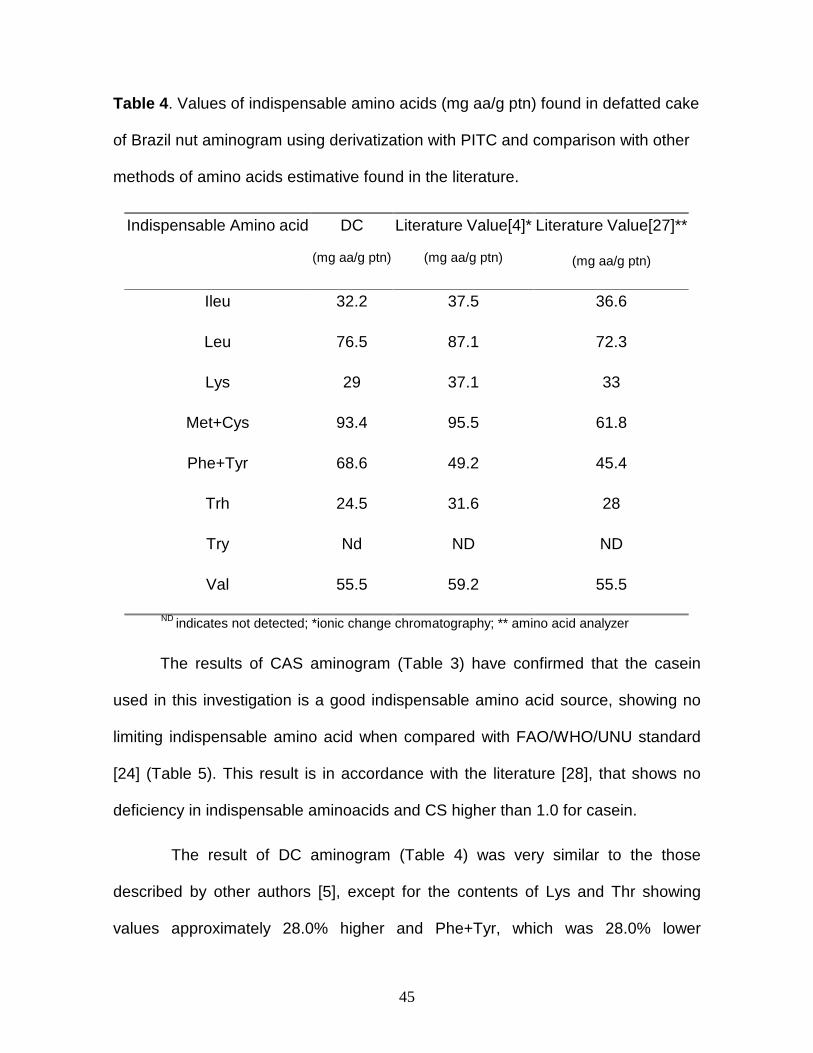
Table 4 . Values of indispensable amino acids (mg aa/g ptn) found in defatted cake
of Brazil nut aminogram using derivatization with PITC and comparison with other
methods of amino acids estimative found in the literature.
Indispensable Amino acid DC
(mg aa/g ptn)
Literature Value[4]*
(mg aa/g ptn)
Literature Value[27]**
(mg aa/g ptn)
Ileu 32.2 37.5 36.6
Leu 76.5 87.1 72.3
Lys 29 37.1 33
Met+Cys 93.4 95.5 61.8
Phe+Tyr 68.6 49.2 45.4
Trh 24.5 31.6 28
Try Nd ND ND
Val 55.5 59.2 55.5
ND indicates not detected; *ionic change chromatography; ** amino acid analyzer
The results of CAS aminogram (Table 3) have confirmed that the casein
used in this investigation is a good indispensable amino acid source, showing no
limiting indispensable amino acid when compared with FAO/WHO/UNU standard
[24] (Table 5). This result is in accordance with the literature [28], that shows no
deficiency in indispensable aminoacids and CS higher than 1.0 for casein.
The result of DC aminogram (Table 4) was very similar to the those
described by other authors [5], except for the contents of Lys and Thr showing
values approximately 28.0% higher and Phe+Tyr, which was 28.0% lower
46
compared to values reported by other investigations. Comparing our results with
the ones from other reports [29], which analyzed DC by amino acid analyzer, the
greatest differences were in Phe+Tyr and Met+Cys contents. These variations
could be attributed to the Brazil nuts differences in composition along the year and
differences in analytical methods.
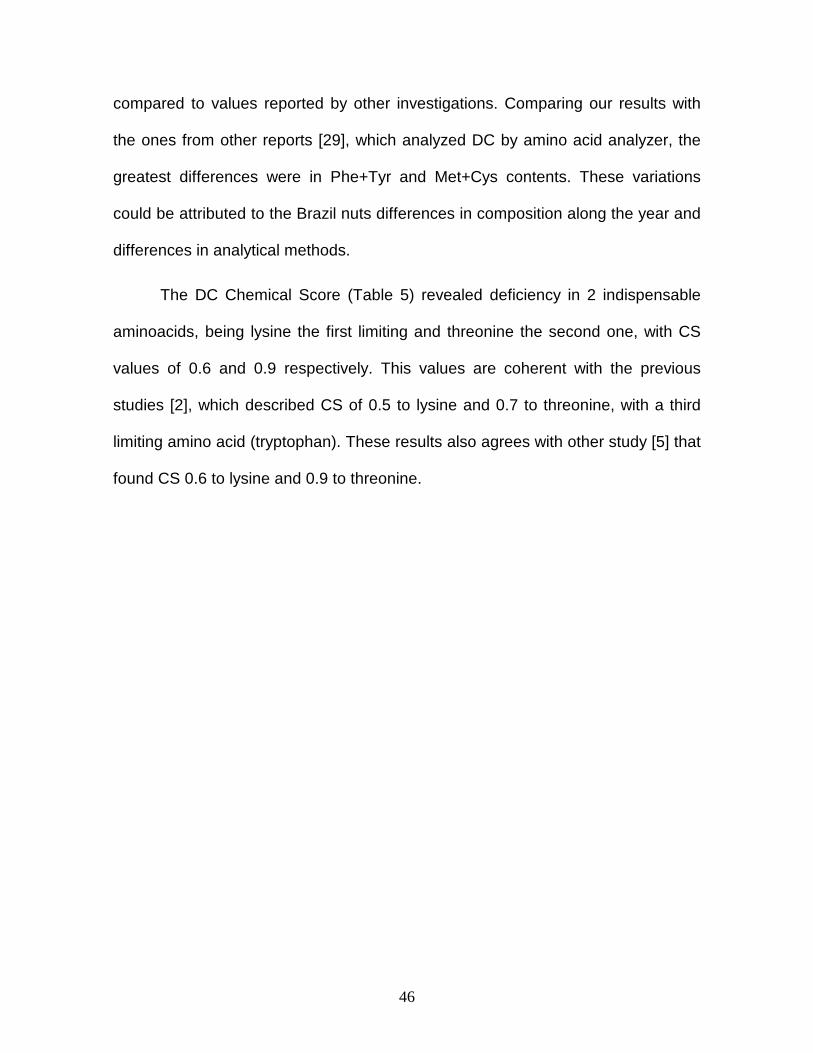
The DC Chemical Score (Table 5) revealed deficiency in 2 indispensable
aminoacids, being lysine the first limiting and threonine the second one, with CS
values of 0.6 and 0.9 respectively. This values are coherent with the previous
studies [2], which described CS of 0.5 to lysine and 0.7 to threonine, with a third
limiting amino acid (tryptophan). These results also agrees with other study [5] that
found CS 0.6 to lysine and 0.9 to threonine.
47
Table 5 . Chemical Score of the protein sources used in this investigation (CAS
and DC) in according with FAO/WHO/UNU [24] references of indispensable amino
acids to 2-5 years old child.
Indispensable aminoacid CS CAS CS DC
Ileu 1.5 1.2
Leu 1.2 1.2
Lys 1.1 0.6*
Met+Cys 1.6 3.7
Phe+Tyr 1.8 1.1
Trh 1.2 0.9**
Try nd nd
Val 1.4 1.6
* 1st limiting aminoacid;**2nd limiting aminoacid
Despite of deficiency of some indispensable amino acids, the Brazil nut
showed a high methionine+cysteine concentration, and can be regarded as an
excellent source of these amino acids, showing a total of 7.5% methionine and
1.9% cysteine, result that is also in accordance to literature [30]. When compared
with other vegetable sources, as bean [31] and soybean [28], it can be observed
that the DC is poor in Lys, amino acids largely found in bean (CS 1.3) and soybean
(CS 1.4). The same occurs with Thr, that shows for DC CS=0,9; CS=1.3 for bean
and CS=1.5 for soybean. On the other hand, DC is rich in Met+Cys, while the CS
of these amino acids is 0.9 and 0.8 to bean and soybean, respectively. Therefore,
48
DC can easily be added in everyday meals as an additional protein source,
considering that its limiting amino acids can be easily balanced by other food
protein sources.
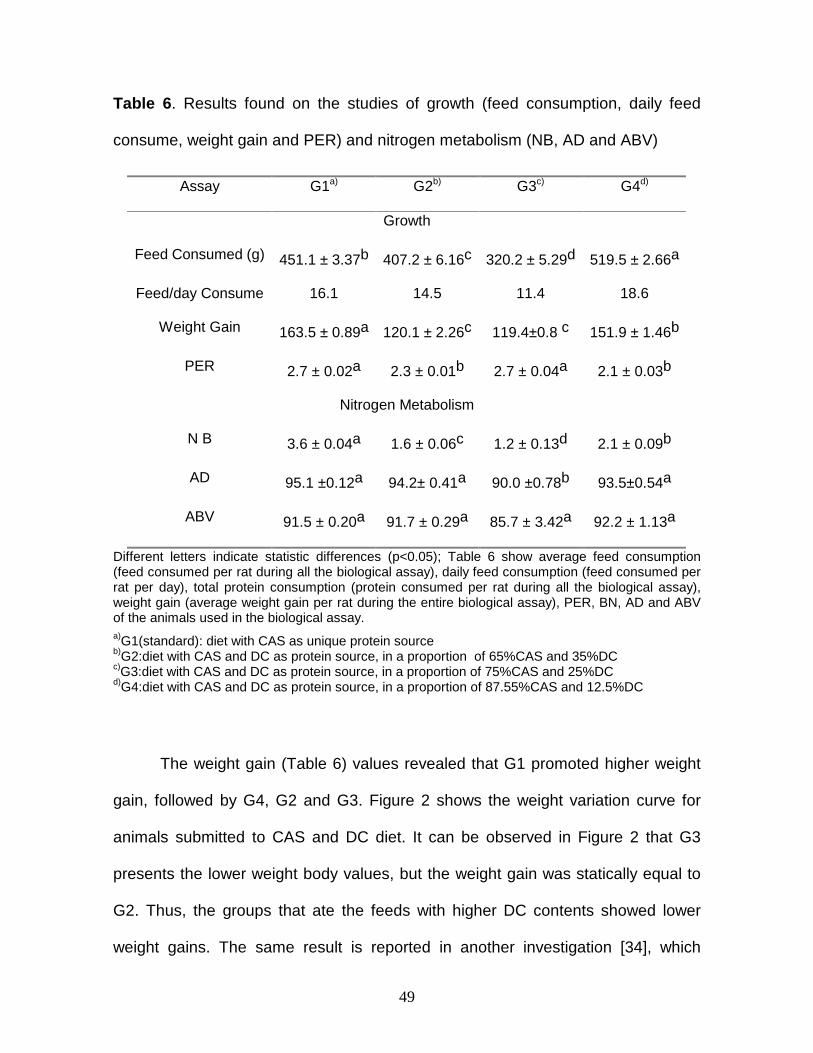
A higher feed consumption was observed in G4 group (Table 6), followed by
G1, G2 and G3, all statistically different among them. The average daily feed
consumption was also different among the groups, ranging from 11.4 to 18.6g /day.
This range is in accordance with the literature, with reports to average consumption
ranging from 12.0 to 15.0 g/day/animal [32]; in this way, only G2 showed
consumption values in accordance with the literature. G1 and G4 showed superior
feed consumption compared to reference, while G3 showed a slight lower feed
consumption. In summary, the groups that ate more DC showed less feed
consumption. These differences could be due to the feed palatability and nutrient
composition of the diets with high DC concentration. The animal feed intake is
controlled by many factors, as for example glucose, lipids and amino acid sensitive
effects, anorexigenic peptides and hormonal effects that can play a role on the
regulation of ingestion of the two principle components of food: nutrients and
energy [33].
49
Table 6 . Results found on the studies of growth (feed consumption, daily feed
consume, weight gain and PER) and nitrogen metabolism (NB, AD and ABV)
Assay G1a) G2b) G3c) G4d)
Growth
Feed Consumed (g) 451.1 ± 3.37b 407.2 ± 6.16c 320.2 ± 5.29d 519.5 ± 2.66a
Feed/day Consume 16.1 14.5 11.4 18.6
Weight Gain 163.5 ± 0.89a 120.1 ± 2.26c 119.4±0.8 c 151.9 ± 1.46b
PER 2.7 ± 0.02a 2.3 ± 0.01b 2.7 ± 0.04a 2.1 ± 0.03b
Nitrogen Metabolism
N B 3.6 ± 0.04a 1.6 ± 0.06c 1.2 ± 0.13d 2.1 ± 0.09b
AD 95.1 ±0.12a 94.2± 0.41a 90.0 ±0.78b 93.5±0.54a
ABV 91.5 ± 0.20a 91.7 ± 0.29a 85.7 ± 3.42a 92.2 ± 1.13a
Different letters indicate statistic differences (p<0.05); Table 6 show average feed consumption (feed consumed per rat during all the biological assay), daily feed consumption (feed consumed per rat per day), total protein consumption (protein consumed per rat during all the biological assay), weight gain (average weight gain per rat during the entire biological assay), PER, BN, AD and ABV of the animals used in the biological assay. a)G1(standard): diet with CAS as unique protein source b)G2:diet with CAS and DC as protein source, in a proportion of 65%CAS and 35%DC c)G3:diet with CAS and DC as protein source, in a proportion of 75%CAS and 25%DC d)G4:diet with CAS and DC as protein source, in a proportion of 87.55%CAS and 12.5%DC
The weight gain (Table 6) values revealed that G1 promoted higher weight
gain, followed by G4, G2 and G3. Figure 2 shows the weight variation curve for
animals submitted to CAS and DC diet. It can be observed in Figure 2 that G3
presents the lower weight body values, but the weight gain was statically equal to
G2. Thus, the groups that ate the feeds with higher DC contents showed lower
weight gains. The same result is reported in another investigation [34], which
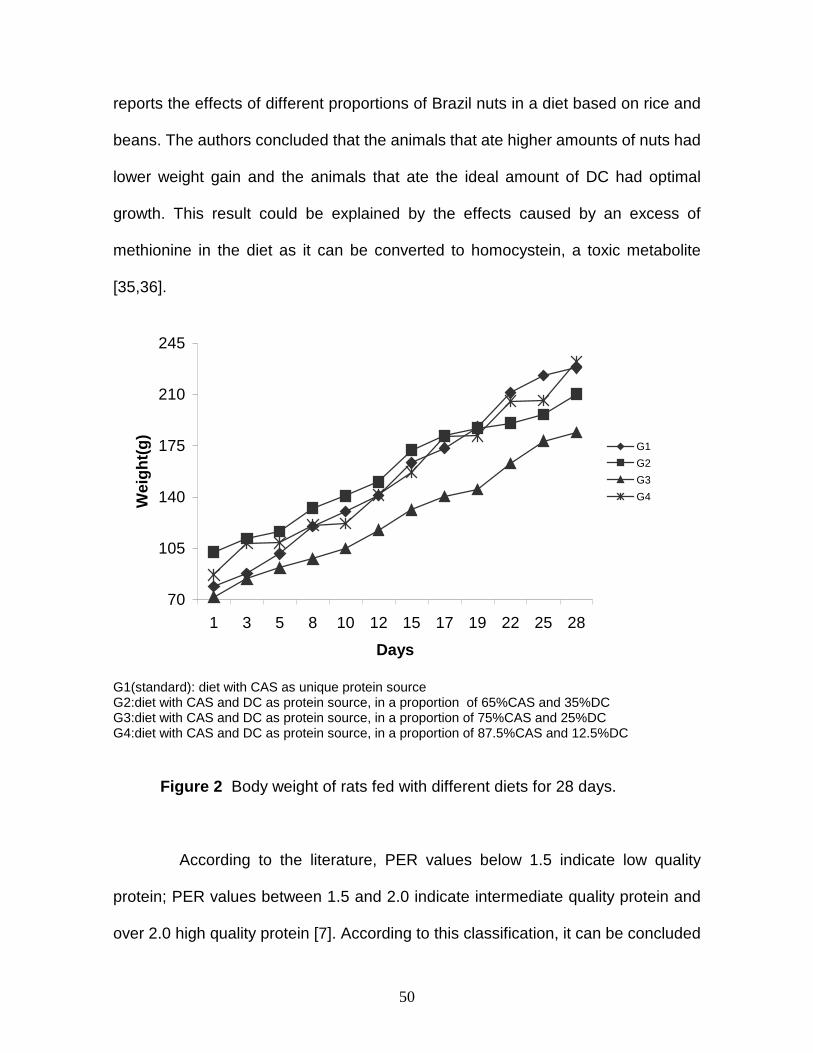
50
reports the effects of different proportions of Brazil nuts in a diet based on rice and
beans. The authors concluded that the animals that ate higher amounts of nuts had
lower weight gain and the animals that ate the ideal amount of DC had optimal
growth. This result could be explained by the effects caused by an excess of
methionine in the diet as it can be converted to homocystein, a toxic metabolite
[35,36].
70
105
140
175
210
245
1 3 5 8 10 12 15 17 19 22 25 28
Days
Wei
ght(
g) G1
G2
G3
G4
G1(standard): diet with CAS as unique protein source G2:diet with CAS and DC as protein source, in a proportion of 65%CAS and 35%DC G3:diet with CAS and DC as protein source, in a proportion of 75%CAS and 25%DC G4:diet with CAS and DC as protein source, in a proportion of 87.5%CAS and 12.5%DC
Figure 2 Body weight of rats fed with different diets for 28 days.
According to the literature, PER values below 1.5 indicate low quality
protein; PER values between 1.5 and 2.0 indicate intermediate quality protein and
over 2.0 high quality protein [7]. According to this classification, it can be concluded
51
that the DC is a high quality protein food (Table 6). The higher PER value was
found in G1 (PER=2.7), which is in accordance to literature [37], which describes
PER value of CAS of 2.4 ± 0.09. There was no statistic difference between G1 and
G3 (PER=2.7), that ingested diet 25% DC. The groups G2 and G4 presented
PERs, 2.3 and 2.1, respectively, which were statistically equal (p=0.05) among
themselves. In an study done with defatted flour of Bocaiúva nuts [38], PER=2.3 ±
0,25. In this way, Bocaiúva nuts can be regarded as good protein sources.
Despites the lower feed consumption and weight gain, the groups G2 and G3
showed that DC have a protein efficiency as good as CAS, which is generally
regarded as a high quality protein.
All experimental groups showed positive Nitrogen Balance (NB) (Table 6),
which is generally recognized as a prerequisite for the animals in there growing
phase [6]. G1 and G4 showed higher values of NB, 3.6 and 2.1 respectively. The
groups G2 and G3 showed lower values of NB compared to the others (1.6 and
1.2, respectively). This result is in accordance to the one found [38] on bocaiúva
nut defatted flour (2.0± 0.36).
The results found for Apparent Digestibility (Table 6) revealed that CAS (G1)
showed higher digestibility (95.1± 0.12%) when compared to the other samples.
This is because it is an animal protein, being easily digested and absorbed. This
result was higher than the one found in a previous investigation [39], when the
authors found AD = 86.6 ± 0.63% and higher than digestibility for CAS, that
generally ranges from 90.8% to 95.4% [40,37,28].
52
According to apparent digestibility results, the groups G2 and G4 did not
differ statistically from G1, which confirms that the Brazil nuts addition to feed did
not reduce the digestibility of standard protein. The group G3, despites showing a
lower AD value (90.0%) and statistically different from the others, also is close to
the values of AD found in casein sample. In a study in Brazil nut as unique protein
source [41], the value of AD was 95.7 ± 0.22% using rats as assay animal.
The measure of nitrogen retention in animals organism were evaluated
through Apparent Biological Value (ABV), showing values from 85.7% to 92.2%
(Table 6), with highest ABV result of group G4 and lowest G3. The results
indicated that ABV did not show statistic differences among the 4 groups, revealing
that all groups of this experiment showed equal nitrogen retention, even with
consumption and weight gain differences. In this way it is confirmed that Brazil nuts
is an excellent protein source.
The ABV values were higher than the ones found [37,38] in casein and
Bocaiúva nuts (from 81.7 ± 1.27 to 88.9 ± 0.33 and 81.1 ± 3.25, respectively).
4. Concluding Remarks
The HPLC method showed to be an efficient tool for protein quality
evaluation of Brazil nut, which was confirmed by “in vivo” assays.
The Biological indices proved that Brazil Nut can be used as an alternative
protein source, once consumed in adequate quantities, showing values of chemical
53
and “in vivo” parameters near to the ones found in casein, which is regarded as an
high quality protein.
Acknowledgements
PT Poeta acknowledges CNPq for the scholarship (process number
134457/2007-2).
We acknowledge Ms. Maria Susana Corrêa Alves da Cunha and Ms. Soely
Maria Pissini Machado Reis for the assistance during the biological assays. We
acknowledge Mr. Ary Dias for the nuts supply.
54
References
[1]RIBEIRO, M.A.A. Aproveitamento tecnológico de castanhas-do-brasil (Bertholletia excelsa): estudo da qualidade de conservação. Piracicaba, 1992. 117p. Dissertação (Mestrado) - Escola Superior de Agricultura “Luiz de Queiroz”, Universidade de São Paulo.
[2]SOUZA, M.L.; MENEZES, H.C. Ciênc. Tecnol. Aliment. 2004, 24,120-128.
[3]EMBRAPA. Boas práticas da castanha-do-brasil é tema de curso. Sessão: Banco de notícias. jul. 2008. Disponível em : http://www.embrapa.br/imprensa/noticias/2008/julho/3a-semana/boas-praticas-da-castanha-do-brasil-e-tema-de-curso/?searchterm=castanha do pará. Acesso em: 23.03.2009.
[4] IBGE. Produção da Extração Vegetal e da Silvicultura. Sessão: Comentário, 2006. Disponível em: http://www.ibge.gov.br/home/estatistica/economia/pevs/2006/comentario.pdf . Acesso em 01.04.2009.
[5]GLÓRIA, M..M.;REGITANO-d'ARCE, M.A.B.Obtenção and caracterização de concentrado and isolado protéico de torta de castanha do Pará. 1997, 72f. Dissertação (Mestrado em Ciência and Tecnologia de Alimentos), Universidade Estadual de Campinas, Campinas, 2002.
[6]SGARBIERI, V.C. Alimentação and Nutrição. Editora UNICAMP, São Paulo1987.
[7]FRIEDMAN, M. J. Agric. Food Chem. 1996,44, 6-24.
[8]MAHAN, L.K., ESCOTT-STUMP, S. Krause Alimentos, nutrição & dietoterapia. Rocca, São Paulo 2005.
[9]SÁNCHEZ-MACHADO, D.I.;LÓPEZ-CERVANTES, J.; LÓPEZ-HERNANDEZ, J.; PASEIRO-LOSADA, P.; SIMAL-LOZANO, J.Chromatographia,2003, 58, 159-163.
[10]JANSSEN, P.S.L.; NISPEN, J. W. V.; MELGERS, P. A. T. A; VAN DEN BOGAART, H.W. M; VAN AALST, G.W. M.; GOVERDE B. C. Chromatographia, 1986, 22, 7-12.
55
[11]WHITE, J.A.; HART, R.J.; FRY, C. J. Autom. Chem., 1986, 8,170-177.
[12]MORA, R.; BERNDT, K. D. B.;TSAI, H.; MEREDITH, S.C. Anal. Biochem., 1988, 172, 368-376.
[13]VENTA, R., Clin. Chem., 2001, 47, 575–583.
[14]VILASSOA-MARTÍNEZ, M., LÓPEZ-HERNANDEZ, J., LAGE-YUSTY, M.A., Food Chem., 2007, 103,1330-1336.
[15]HERBERT, P.;BARROS, P.;RATOLA N.;ALVES, A., J. Food Sci. , 2000, 65, 1130-1133.
[16]BETNÉR I.; FÖLDI, I.P., Chromatographia, 1986, 22, 381-387.
[17]FABIANI, A.;VERSARI, A.;PARPINELLO, G.P.;CASTELLARI, M.;GALASSI, S., J. Chromatogr. Sci. , 2002, 40, 14-18.
[18]LÓPEZ-CERVANTES, J.;SÁNCHEZ-MACHADO, D.I.;ROSAS-RODRIGUES, J.A,. J. Chromat. A, 2006, 1105, 106-110.
[19]CASTRO, I.A. Modelagem and otimização de propriedades nutricionais and sensoriais de misturas protéicas através da metodologia estatística de superfície de resposta. 1999. 123p. Tese (Doutorado) – Faculdade de ciências Farmacêuticas/ Faculdade de Engenharia de Alimentos/ Faculdade de saúde pública, Universidade de São Paulo, São Paulo, 2001.
[20]REEVES, P.G.;NIELSEN, F.H.; FAHEY, G.C. J.R., J. Nutr., 1993, 123, 1939-51.
[21]AOAC. Official methods of analysis of AOAC. AOAC International,Virginia 1995.
[22] LESS, R. Manual de análisis de alimentos. Laboratory handbook of methods of food analysis. Zaragoza, Acribia 1979.
56
[23]HAGEN SR, FROST B, AUGUSTIN J., J. Assoc. Off. Analyt. Chem., 1989, 72, 912-916.
[24]FAO/WHO/UNU. Protein and amino acid requirements in human nutrition. Report of a Joint Expert Consultant. Geneva, Switzerland, 2002, 265p.
[25]GOENA, M.; MARZO, F.; FAERNÀNDEZ-GONZÀLEZ, L.; TOSAR, A.; FRÜHBECK, G.; SANTIDRIÁN, S. Rev. Esp. Fisiol., 1989, 45, 55-60.
[26] RAMOS, C.M.P.;BORA,P.S., Food Sci. Technol. Int. , 2003, 9, 265-269.
[27] EMBRAPA, Extração de óleo de girassol utilizando miniprensa. Sessão: Página Inicial. Mar. 2009. Disponível em : http://www.cnpso.embrapa.br/index.php?op_page=73&cod_pai=159. Acesso em: 25.03.2009.
[28]PIRES,C.V.;OLIVEIRA,M.G.A.;ROSA, J. C.;COSTA, N. M. B., Rev. Ciênc. Tecnol. Aliment., 2006, 26,179-187.
[29] ANTUNES,A.J.;MARKAKIS, P., J. Agric. Food Chem., 1977, 25, 1096-1098.
[30]CHUENHIENG, T.; PTRITIS, K.; ELFAKIR, C.; BROCHIER, J.; GOLI T.; MONTET, D., J. Agric. Food Chem., 1994, 52, 4318 – 4322.
[31]ANTUNES, P.;BILHALVA, A.;ELIAS, M.C.;SOARES, G.J.D., Rev. Bras. de Agroc., 1995, 1, 12-18.
[32]DE LUCA, R.R., ALEXANDRE, S.R., MARQUES, T. Manual para Técnico em bioterismo. Winner Graph, São Paulo 1996.
[33]DEWYS, W. D., Cancer Res. 1977, 37, 2354-2358.
[34]SPINI, V.B.M.G.; FERREIRA, F.R.; PADUANI, G.F.; SOUZA, C.S.; KERR, W.E. Biosci. J., 2006, 22,89-93.
[35] HARPER, A.E.; BENEVENGA, N. J.; WOHLHUETER, R.M., Physiol. Rev. 1970, 50, 428-558.
57
[36] TOUE, S.; KODAMA, R.; AMAO, M.; KAWAMATA, Y.; KIMURA, T.; SAKAI, R. Screening of Toxicity Biomarkers for Methionine Excess in Rats. Presented at the conference “The Fifth Workshop on The Assessment of Adequate Intake of Dietary Amino Acids” held October 24-25, 2005 in Los Angeles. Published as a supplement to J. Nutr., 2006.
[37]SEENA, S.; SRIDHAR, K.R.; RAMESH S.R., Nutr. Res., 2005, 25, 587-596.
[38]HIANE, P.A.; MACEDO, M.L.R.; SILVA, G.M.; NETO, J.A.B., B. CEPPA, 2006, 24, 191-206.
[39]GIAMI, S.Y., Food Chem., 2004, 88,397-404.
[40] RANGEL, A.;SARAIVA, K.;SCHWENGBER, P.;NARCISO, M.S.;DOMONT, G.B.; FERREIRA, S.T.; PEDROSA, C., Food Chem., 2004, 87, 491-499.
[41]MITCHELL, H.H.;BEADLES, J.R., J. Nutr. , 1953,14, 597-608.
58
Capítulo 3
Effect of different concentrations of Brazil nuts i n feed on the body
composition of Wistar rat
(Artigo em fase de preparação para envio à revista Ciência e Tecnologia de
Alimentos)
Resumo:
O objetivo do presente trabalho foi avaliar o efeito da adição de diferentes
concentrações de torta desengordurada de castanha do Brasil (DC) na dieta de
ratos Wistar sobre sua composição corpórea. O óleo da castanha foi analisado
segundo seu teor de ácidos graxos, apresentando maior teor de ácidos graxos
insaturados. As dietas foram preparadas tendo como referência a AIN 93G, e os
animais divididos em 4 grupos: G1 (caseína), G2 (35% DC/ 65% caseína), G3
(25% DC/ 75% caseína) e G4 (12.5% DC/ 87.5% caseína). Observou-se redução
no teor de gordura e aumento de proteína, cinza e umidade na carcaça dos
animais que ingeriram dieta contendo DC.
ABSTRACT:
This work aimed at evaluation of the effects of addition of different proportions of
Brazil nut defatted cake to Wistar rats standard diet (AIN) on body composition
proportions. The Brazil nut oil was extracted and fatty acids were analyzed. The
diets were prepared according to AIN 93G and the animals were divided in 4
groups: G1 (casein); G2 (35% DC/ 65% casein), G3 (25% DC/ 75% casein) and
59
G4 (12.5% DC/ 87.5% casein). Body composition analysis revealed that the
animals treated with Brazil nut showed reduction in total fats, increase in total
protein, ash and moisture.
1. Introduction Brazil nut (Berholletia excelsa) presents pleasant flavor, is edible “in natura”,
it has many applications and its proximate composition has been studied for many
decades, being composed of about 13.9 to 20.7% protein, 65.0 to 69.7% lipids,
9.6% carbohydrate, 3.3% ash. It is known as one of the richest sources of lipids
(MITCHELL; BEADLES, 1937; AGUIAR, 1996; VENKATACHALAM; SATHE,
2006).
Normally defective and undersized nut kernel, which do not satisfy export
standards are sold at very cheap prices to oil expelling industries. The defatted
cake (DC), in spite of containing about 46.0% protein (RAMOS; BORA, 2003), rich
in sulfur containing amino acids and high content of ash, ranging from 7.0% to
13.0%, is used to a limited extent as an ingredient in animal rations (ANTUNES;
MARKAKIS, 1977; ZUO; SUN, 1996; SOUZA; MENEZES, 2004).
Many studies showed the abundance of minerals in Brazil nut, which
revealed, for example, a fairly high content of Mg, Fe, Co, Zn, P, Ca, K, Na, and
high amounts of Se. In this way, Brazil nut is regarded as the richest known food
sources of selenium (HOLBEN, 1999; VONDERHEIDE et al., 2002; GONÇALVES
et al., 2002; KANNAKUMARATH et al., 2002; CHUNHIENG et al., 2004b;
KANNAMKUMARATH, 2004; DUMONT et. al., 2006; PACHECO; SCUSSEL, 2007
60
NAOZUKA; OLIVEIRA, 2007; PAREKH et al., 2008; THOMSON et. al., 2008;
CHUNHIENG et al., 2008).
The oil of Brazil nut contains 76.0% of unsatured fatty acids. The most
representative is the linoleic acid (C18:2), a compound of ω-6 family, raging from
37.0% to 45.0% and oleic acid (C18:1), ranging from 26.0% to 39.0%. Saturated
fatty acid are also present in Brazil nut oil, mainly palmitic acid (concentrations
from 13.0% to 16.0%) (GONÇALVES et al., 2002; RODRIGUES et al., 2005;
VENKATACHALAM; SATHE, 2006; FREITAS et al., 2007; CHUNHIENG et al.,
2008).
Due to a large production of defatted cake of Brazil nut, which has high
nutritional quality, the objective of this study was to evaluate the consequences of
adding of defatted cake of Brazil nut in Wistar rats diet on body composition.
2. Materials and Methods
2.1 Protein sources
The protein sources used in this work were casein (CAS) (Naarde- Agro
Product BV- Holland) as standard protein (REEVES et al., 1993) and Brazil nut
defatted cake (DC). The proximate composition (ash, moisture, protein) was
determined by the method described in the Association of Official Analytical
Chemists (AOAC, 1995), using the conversion factor 6.25 for total nitrogen to
protein for CAS and 5.46 for DC protein (GLÓRIA; REGITANO-d'ARCE, 2000),
and the lipid quantification (ether extract) were made by the method of Soxhlet
(LESS, 1979). The analyses were performed in the Nutrition and Metabolism
61
Laboratory, (Lanum), Departament of Food and Nutrition (Depan), Faculty of Food
Engineering (FEA), State University of Campinas (Unicamp).
The Brazil nuts have been donated by “Juta and Castanha Company” (São
Paulo – SP). The nuts were defatted by pressing using Scott Tech’s SMR 600-E
(Vinhedo – SP). The raw material was heated to approximately 60°C during 30
min, and then the oil was extracted by the Scott Tech’s ERT-60-II Extractor
(Vinhedo – SP) after grinding of the raw material.
2.2 Determination of fatty acids composition of Bra zil nut oil
The determination of fatty acids composition of Brazil nut oil was done
according to AOCS (2001) at the Oil and Fat Laboratory of FEA-UNICAMP. This
method consists of use of gas-liquid chromatography (GLC) to identify and quantify
fatty acids in vegetable oils and fats after fatty acids derivatization with boron
trifluoride. A CGC AGILENT 6850 SERIES GC SYSTEM chromatograph equipped
with capillary column, DB-23 AGILENT (50% cyanopropyl) – methylpolysiloxane,
60 m, Ø int 0.25 mm, 0.25 µm film thickness was used. Gas flow rate was 1.00
mL/min.; linear velocity = 24 cm/seg; detector temperature: 280ºC; injector
temperature: 250ºC; oven temperature: 110°C for 5 m in, from 110Cº to 215°C
(5°C/min), 215°C during 24 min; carrier gas: Helium ; volume injection: 1,0 µL.
2.3 Biological assay
The biological assay was done in the Biological Evaluation Laboratory
(LEB), Depan-FEA-Unicamp. Thirty-two male Wistar rats, 21 days old (newly
62
weaned) with initial weight about 52.7 ± 6.2g were used (the animals were
obtained from Multidisciplinar Center of Biological Investigation – CEMIB,
Unicamp). The rats were housed in individual cages, with temperature (20-22°C)
and humidity (40-50%) controlled, including light/dark cycle of 12 h and access to
water and food ad libitum. The ingested ammount of feed was monitored daily and
weight gain was measured 3 times per week.
The animals were divided into 4 experimental groups of 8 animals each and
received AIN-93G (REEVES, et al., 1993) diet as reference (control). The protein
source and its proportions were varied among the feeds in order to evaluate DC
quality (see Table 1). The animals were sacrificed by decapitation. This study was
approved by the Ethics Committee on Animal Experimentation at Unicamp, under
Protocol nº 1680-1.
2.3.1 Diet formulation
Four diets were prepared, as showed in Table 1. All diets showed protein
content of 12% (GOENA et al., 1989) and the proximate composition analysis was
done according to methods mentioned in section 2.1.
The contents of carbohydrates, lipids and proteins of DC were considered
for the diets formulation. However, the ash content was not considered; thus, the
diets with DC showed higher ash contents compared to standard diet.

63
Table 1 . Ingredients and quantities used in the formulation of standard and
experimental diets and total macronutrients composition.
Ingredients g/100g G1a) G2b) G3c) G4d)
Cornstarch 41.75 39.60 40.52 40.10
Dextrinized cornstarch 15.20 13.17 13.46 13.32
Sucrose 14.00 9.98 10.20 10.10
Casein 15.42 10.03 11.57 13.50
DC --- 15.11 10.79 5.39
Soybean oil 7.00 2.00 3.40 5.20
Cellulose 5.00 5.00 5.00 5.00
Mineral Mix 3.50 3.50 3.50 3.50
Vitamin Mix 1.00 1.00 1.00 1.00
L-cystine 0.30 0.30 0.30 0.30
Choline bitartrate 0.25 0.25 0.25 0.25
Tert-butylhydroquinone 0.0014 0.0014 0.0014 0.0014
Total protein (g/100g) 12.00 12.00 12.00 12.00
Total lipid* (g/100g) 7.00 6.97 6.95 6.97
Total Ash (g/100g) 2.50 3.09 2.84 2.70
Energy (Kcal/100g) 244.09 230.26 229.26 224.56
*ether extract a)G1(standard): diet with CAS as unique protein source b)G2:diet with CAS and DC as protein source, in a proportion of 65%CAS and 35%DC c)G3:diet with CAS and DC as protein source, in a proportion of 75%CAS and 25%DC d)G4:diet with CAS and DC as protein source, in a proportion of 87.5%CAS and 12.5%DC
64
2.3.2 Determination of FER (Food Efficiency Ratio)
The food efficiency ratio was determined after 28 days of experiment
according to equation (1).
(1)
2.4 Body composition analysis
The gastrointestinal tract of the animals was cleaned and returned to the
carcasses, which were frozen at -20ºC. Thus the carcasses were sliced,
lyophilized, ground and stored at -20 º C until the determinations, according to item
2.1 above, except the body fat, that was determined by the method described by
Bligh and Dyer (1989), which uses chloroform-methanol-water extraction.
2.5 Statistical analysis
The analysis of variance (ANOVA) was applied. Mean values were compared
by Tukey test, at 5% of significance, values lower than 5% indicated significant
differences. The SAS System software was used, BC, 2001.
3. Results and Discussion
3.1 Proximate composition of DC and CAS
The ash content found in DC (14.3%) was more than 4-times higher than
the CAS (3.1%) (Table 2). DC ash content was higher in comparison to the results
described by other authors (ANTUNES; MARKAKIS 1977; GLÓRIA; REGITANO
)(int
)(
gakefood
ggainweightbodyFER =

65
D´ARCE, 2000; SOUZA; MENEZES, 2004; CHUNHIENG et al, 2004a;
CHUNHIENG et al., 2008), which reported ash content in DC between 7.3% and
13.1%.
Table 2 . Proximate composition of protein sources
Protein source % Moisture % Ash % Protein % Ether Extract % Carbohydrate
CAS 10.0 3.1 77.8 0.3 8.8
DC 3.8 14.3 27.8 32.9 21.2
The metal ions have high affinity for sulfur amino acids such as methionine
and cysteine which are present in large amounts in the Brazil nut (NAOZUKA;
OLIVEIRA, 2007). Brazil nut is very rich in several minerals. In studies with Brazil
nut, Mg, Fe, Co, Mo, Ag, Hg, Pb, Cu, Mn, Zn , P, Ca, K, Na, Se, Ba and Ra were
already detected. (GONÇALVES et al.,2002; KANNAMKUMARATH, 2004;
CHUNHIENG et al., 2004b; NAOZUKA;OLIVEIRA, 2007; PAREKH et al., 2008;
THOMSON et al., 2008; CHUENIENG et al., 2008). Brazil nut is the richest known
food source of selenium (Se). However, Se concentration in Brazil nut shows large
variability and is likely to reflect the amounts of the mineral composition of regional
soils (HOLBEN, 1999; VONDERHEIDE et al.,2002; KANNAKUMARATH et al.,
2002; DUMONT et. al.,2006; PACHECO; SCUSSEL, 2007; PAREKH et al., 2008).
The concentrations of Se in Brazil nuts range from 1.6µg/g to 126.0µg/g
(CHUNHIENG et al, 2004 b) and the recommended daily intake of selenium, in
according with Standing Committee on the Evaluation of Dietary Reference Intakes
66
(2000) for adults is 55µg/day and the maximum tolerable limit of intake of 400
µg/day. Selenium plays an important role in glutathione peroxidase (GSH-Px) cicle,
which is responsible for the reduction of a variety of hydroxiperoxides and is
related to antioxidant processes in human metabolism (CHOW; TAPPEL, 1974;
LANE et. al, 1991; VADHANAVIKIT; GANTHER, 1993; ALLAN et al., 1999;
FERREIRA et al., 2002; SOUZA; MENEZES, 2004 ).
Lipids found in the ether extract content of DC (32.9%) (Table 2) was higher
than CAS (0.3%). However the extracted oil is composed of 73.96% of unsatured
fatty acids (Table 3) and 26.04% of saturated fatty acids (Table 3). This result is in
agreement with Chunhieng et al. (2008) which found 75.6% of unsaturated fatty
acids in Brazil nut oil. Oleic (C18:1) and linoleic (C18:2) were the most representative
unsaturated fatty acids, whereas palmitic acid (C16:0) was the main saturated fatty
acid identified (15,27%) and this result of palmitic acid agrees with previous studies
(GONÇALVES et al., 2002; VANKATACHALAM ; SATHE, 2006).
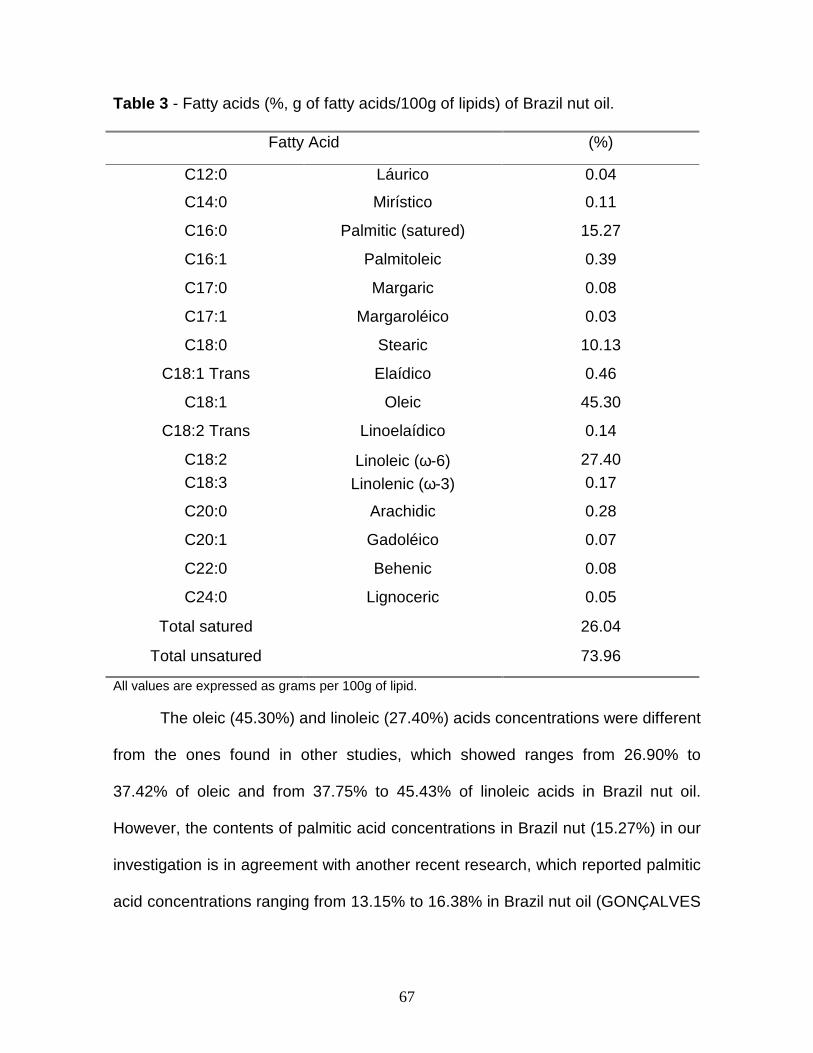
67
Table 3 - Fatty acids (%, g of fatty acids/100g of lipids) of Brazil nut oil.
Fatty Acid (%)
C12:0 Láurico 0.04
C14:0 Mirístico 0.11
C16:0 Palmitic (satured) 15.27
C16:1 Palmitoleic 0.39
C17:0 Margaric 0.08
C17:1 Margaroléico 0.03
C18:0 Stearic 10.13
C18:1 Trans Elaídico 0.46
C18:1 Oleic 45.30
C18:2 Trans Linoelaídico 0.14
C18:2 Linoleic (ϖ-6) 27.40
C18:3 Linolenic (ϖ-3) 0.17
C20:0 Arachidic 0.28
C20:1 Gadoléico 0.07
C22:0 Behenic 0.08
C24:0 Lignoceric 0.05
Total satured 26.04
Total unsatured 73.96
All values are expressed as grams per 100g of lipid.
The oleic (45.30%) and linoleic (27.40%) acids concentrations were different
from the ones found in other studies, which showed ranges from 26.90% to
37.42% of oleic and from 37.75% to 45.43% of linoleic acids in Brazil nut oil.
However, the contents of palmitic acid concentrations in Brazil nut (15.27%) in our
investigation is in agreement with another recent research, which reported palmitic
acid concentrations ranging from 13.15% to 16.38% in Brazil nut oil (GONÇALVES

68
et al., 2002; RODRIGUES et al., 2005; VENKATACHALAM; SATHE, 2006;
FREITAS et al., 2007).
The predominant polyunsaturated fatty acid (PUFA) found in Brazil nut oil (Table
3) was linoleic acid, a compound of the ω-6 family, that includes linolenic and
arachidonic acids. It is widely found in seed oils such as safflower, sunflower, and
cottonseed oils. (BEARE-ROGERS et al., 2001; HOLMAN, 1968).
Linoleic acid is described to be important for growth, reproduction, skin
function; (HOLMAN, 1968), showed to attenuate the actions of insulin on fatty acid
and lipid synthesis as well as fatty acid synthase activity and expression (JONES
et al., 1996; WANG et al., 2004), and produce eicosanoids, such as thromboxane,
prostaglandins, prostacyclins, leukotrienes and lipoxins (YAMAMOTO; SMITH,
2002), which have physiological effects as stimulate or inhibit smooth-muscle
contraction, they affect also blood pressure, respiration, and intestinal and uterine
activity. Prostaglandins promote mucus secretion, which protects the chloridric
gastric mucosa against the acid and attract leukocytes to the site of infection.
Eicosanoids are also involved in the development of pain and fever. The
thromboxanes promote thrombocyte aggregation and other processes involved in
hemeostasis (KOOLMAN; KLAUS-HENRICH, 2005).
The DC showed very low concentrations of linolenic acid (ω-3). It is known
that the balance between linoleic and linolenic fatty acids is very important for
human homeostasis and normal development. The optimal dose or ratio of
ω-6/ ω-3 varies from 1/1 to 4/1. The DC oil presents ratio of ω-6/ ω-3 equal 161/1
(other ω-3 food sources like fish oil and linseed should be ingested together with
DC). The unbalanced diet shifts the physiological state to one that is prothrombotic
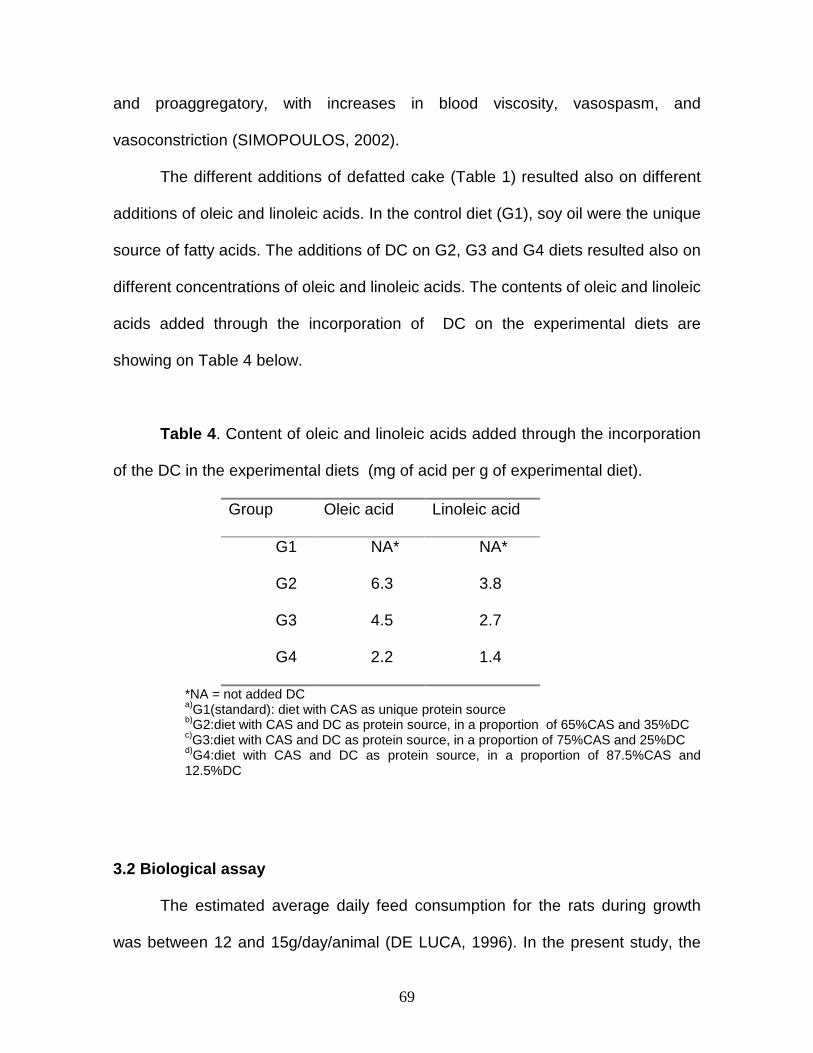
69
and proaggregatory, with increases in blood viscosity, vasospasm, and
vasoconstriction (SIMOPOULOS, 2002).
The different additions of defatted cake (Table 1) resulted also on different
additions of oleic and linoleic acids. In the control diet (G1), soy oil were the unique
source of fatty acids. The additions of DC on G2, G3 and G4 diets resulted also on
different concentrations of oleic and linoleic acids. The contents of oleic and linoleic
acids added through the incorporation of DC on the experimental diets are
showing on Table 4 below.
Table 4 . Content of oleic and linoleic acids added through the incorporation
of the DC in the experimental diets (mg of acid per g of experimental diet).
Group Oleic acid Linoleic acid
G1 NA* NA*
G2 6.3 3.8
G3 4.5 2.7
G4 2.2 1.4
*NA = not added DC a)G1(standard): diet with CAS as unique protein source b)G2:diet with CAS and DC as protein source, in a proportion of 65%CAS and 35%DC c)G3:diet with CAS and DC as protein source, in a proportion of 75%CAS and 25%DC d)G4:diet with CAS and DC as protein source, in a proportion of 87.5%CAS and 12.5%DC
3.2 Biological assay
The estimated average daily feed consumption for the rats during growth
was between 12 and 15g/day/animal (DE LUCA, 1996). In the present study, the
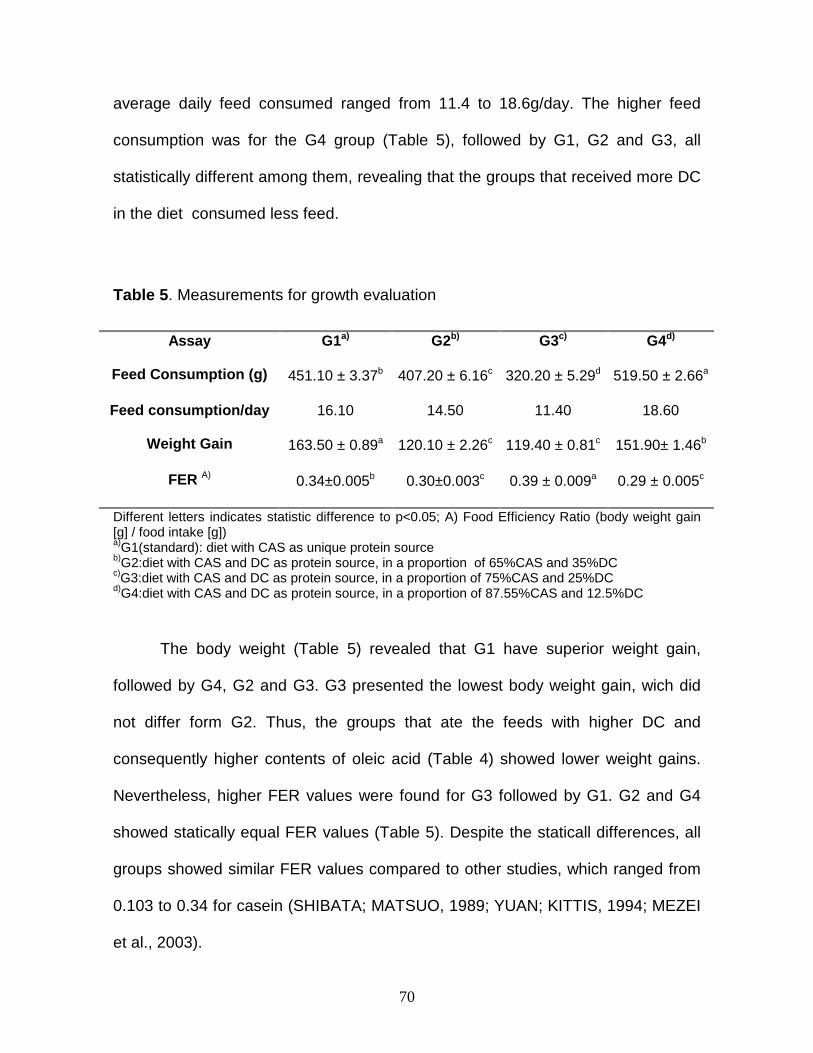
70
average daily feed consumed ranged from 11.4 to 18.6g/day. The higher feed
consumption was for the G4 group (Table 5), followed by G1, G2 and G3, all
statistically different among them, revealing that the groups that received more DC
in the diet consumed less feed.
Table 5 . Measurements for growth evaluation
Assay G1 a) G2b) G3c) G4d)
Feed Consumption (g) 451.10 ± 3.37b 407.20 ± 6.16c 320.20 ± 5.29d 519.50 ± 2.66a
Feed consumption/day 16.10 14.50 11.40 18.60
Weight Gain 163.50 ± 0.89a 120.10 ± 2.26c 119.40 ± 0.81c 151.90± 1.46b
FER A) 0.34±0.005b 0.30±0.003c 0.39 ± 0.009a 0.29 ± 0.005c
Different letters indicates statistic difference to p<0.05; A) Food Efficiency Ratio (body weight gain [g] / food intake [g]) a)G1(standard): diet with CAS as unique protein source b)G2:diet with CAS and DC as protein source, in a proportion of 65%CAS and 35%DC c)G3:diet with CAS and DC as protein source, in a proportion of 75%CAS and 25%DC d)G4:diet with CAS and DC as protein source, in a proportion of 87.55%CAS and 12.5%DC
The body weight (Table 5) revealed that G1 have superior weight gain,
followed by G4, G2 and G3. G3 presented the lowest body weight gain, wich did
not differ form G2. Thus, the groups that ate the feeds with higher DC and
consequently higher contents of oleic acid (Table 4) showed lower weight gains.
Nevertheless, higher FER values were found for G3 followed by G1. G2 and G4
showed statically equal FER values (Table 5). Despite the staticall differences, all
groups showed similar FER values compared to other studies, which ranged from
0.103 to 0.34 for casein (SHIBATA; MATSUO, 1989; YUAN; KITTIS, 1994; MEZEI
et al., 2003).
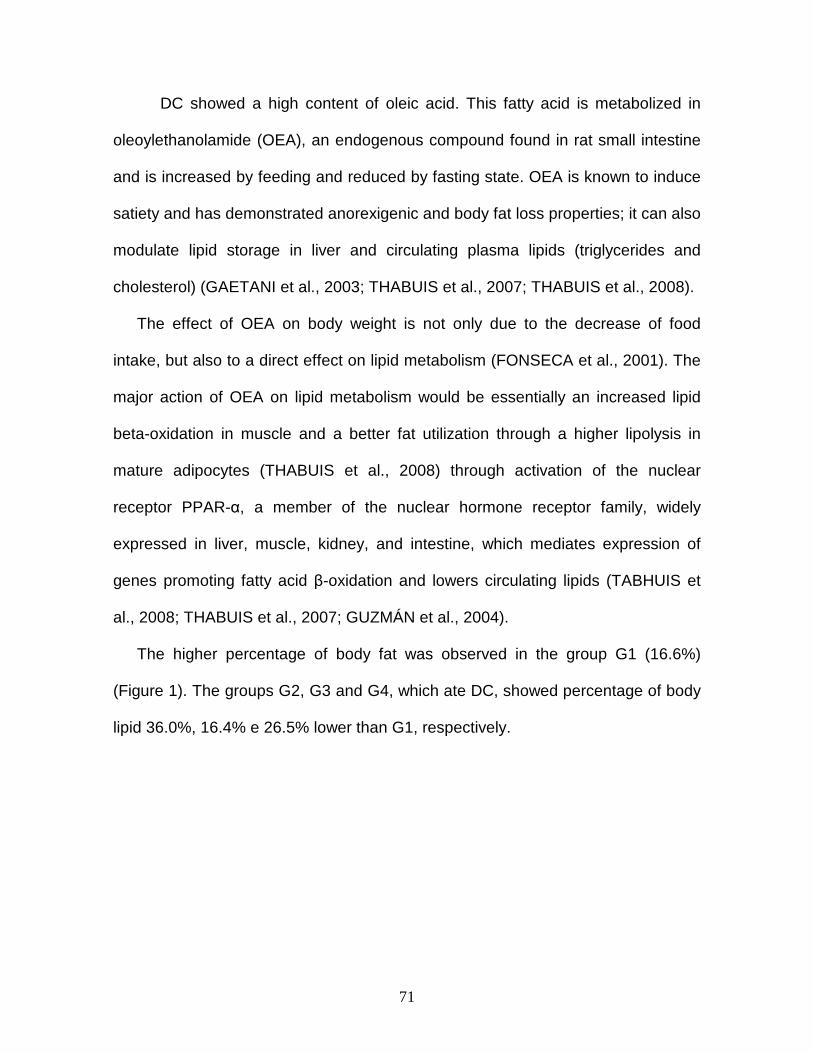
71
DC showed a high content of oleic acid. This fatty acid is metabolized in
oleoylethanolamide (OEA), an endogenous compound found in rat small intestine
and is increased by feeding and reduced by fasting state. OEA is known to induce
satiety and has demonstrated anorexigenic and body fat loss properties; it can also
modulate lipid storage in liver and circulating plasma lipids (triglycerides and
cholesterol) (GAETANI et al., 2003; THABUIS et al., 2007; THABUIS et al., 2008).
The effect of OEA on body weight is not only due to the decrease of food
intake, but also to a direct effect on lipid metabolism (FONSECA et al., 2001). The
major action of OEA on lipid metabolism would be essentially an increased lipid
beta-oxidation in muscle and a better fat utilization through a higher lipolysis in
mature adipocytes (THABUIS et al., 2008) through activation of the nuclear
receptor PPAR-α, a member of the nuclear hormone receptor family, widely
expressed in liver, muscle, kidney, and intestine, which mediates expression of
genes promoting fatty acid β-oxidation and lowers circulating lipids (TABHUIS et
al., 2008; THABUIS et al., 2007; GUZMÁN et al., 2004).
The higher percentage of body fat was observed in the group G1 (16.6%)
(Figure 1). The groups G2, G3 and G4, which ate DC, showed percentage of body
lipid 36.0%, 16.4% e 26.5% lower than G1, respectively.
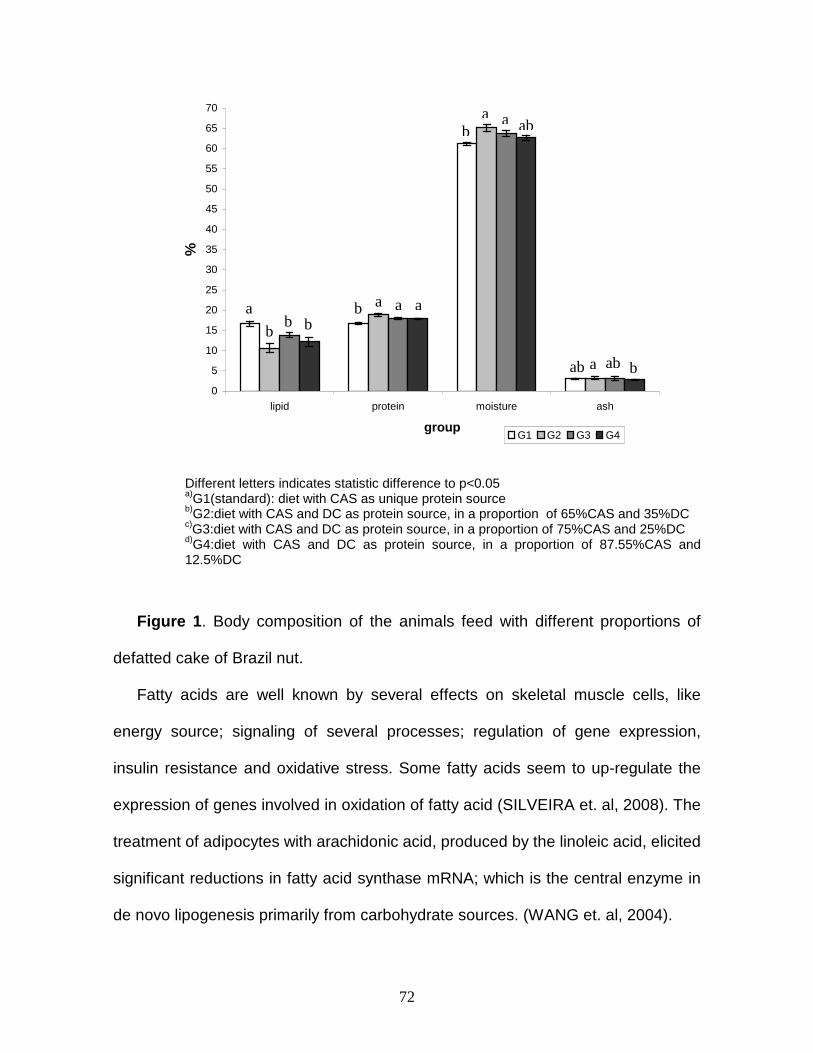
72
0
5
10
15
20
25
30
35
40
45
50
55
60
65
70
lipid protein moisture ash
group
%
G1 G2 G3 G4
Different letters indicates statistic difference to p<0.05
a)G1(standard): diet with CAS as unique protein source b)G2:diet with CAS and DC as protein source, in a proportion of 65%CAS and 35%DC c)G3:diet with CAS and DC as protein source, in a proportion of 75%CAS and 25%DC d)G4:diet with CAS and DC as protein source, in a proportion of 87.55%CAS and 12.5%DC
Figure 1 . Body composition of the animals feed with different proportions of
defatted cake of Brazil nut.
Fatty acids are well known by several effects on skeletal muscle cells, like
energy source; signaling of several processes; regulation of gene expression,
insulin resistance and oxidative stress. Some fatty acids seem to up-regulate the
expression of genes involved in oxidation of fatty acid (SILVEIRA et. al, 2008). The
treatment of adipocytes with arachidonic acid, produced by the linoleic acid, elicited
significant reductions in fatty acid synthase mRNA; which is the central enzyme in
de novo lipogenesis primarily from carbohydrate sources. (WANG et. al, 2004).
a a a a
a a
a
b b b
b
b
b
ab
ab ab
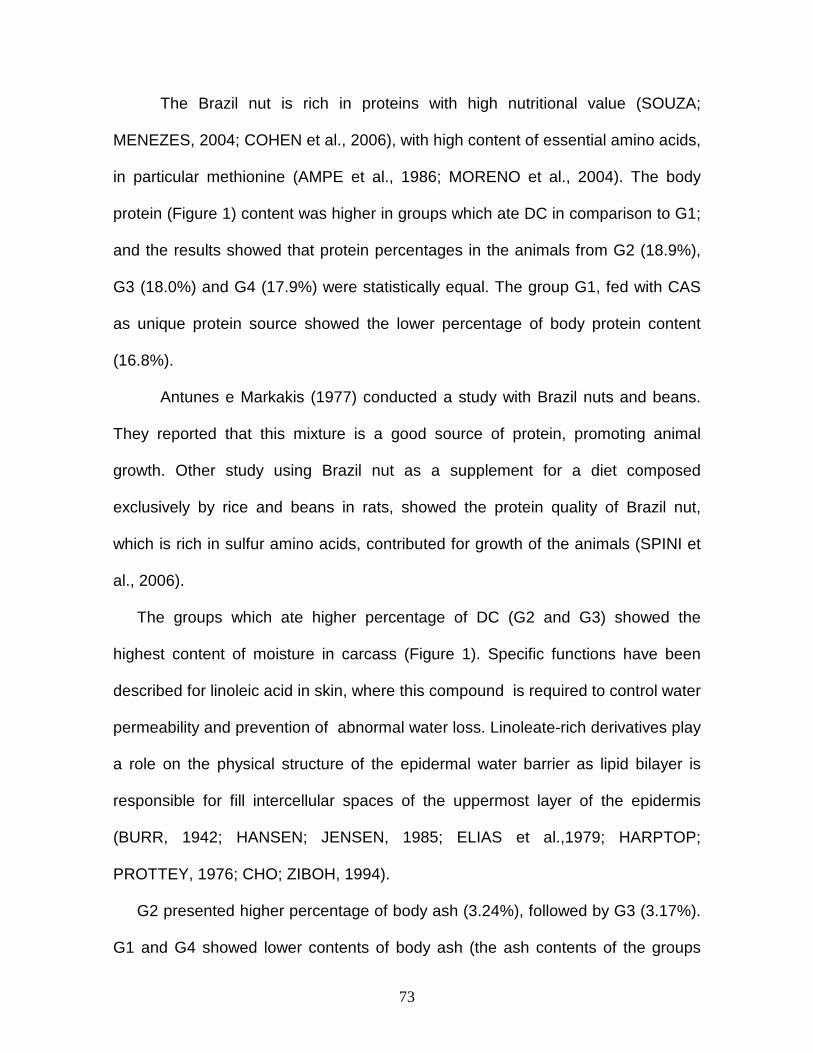
73
The Brazil nut is rich in proteins with high nutritional value (SOUZA;
MENEZES, 2004; COHEN et al., 2006), with high content of essential amino acids,
in particular methionine (AMPE et al., 1986; MORENO et al., 2004). The body
protein (Figure 1) content was higher in groups which ate DC in comparison to G1;
and the results showed that protein percentages in the animals from G2 (18.9%),
G3 (18.0%) and G4 (17.9%) were statistically equal. The group G1, fed with CAS
as unique protein source showed the lower percentage of body protein content
(16.8%).
Antunes e Markakis (1977) conducted a study with Brazil nuts and beans.
They reported that this mixture is a good source of protein, promoting animal
growth. Other study using Brazil nut as a supplement for a diet composed
exclusively by rice and beans in rats, showed the protein quality of Brazil nut,
which is rich in sulfur amino acids, contributed for growth of the animals (SPINI et
al., 2006).
The groups which ate higher percentage of DC (G2 and G3) showed the
highest content of moisture in carcass (Figure 1). Specific functions have been
described for linoleic acid in skin, where this compound is required to control water
permeability and prevention of abnormal water loss. Linoleate-rich derivatives play
a role on the physical structure of the epidermal water barrier as lipid bilayer is
responsible for fill intercellular spaces of the uppermost layer of the epidermis
(BURR, 1942; HANSEN; JENSEN, 1985; ELIAS et al.,1979; HARPTOP;
PROTTEY, 1976; CHO; ZIBOH, 1994).
G2 presented higher percentage of body ash (3.24%), followed by G3 (3.17%).
G1 and G4 showed lower contents of body ash (the ash contents of the groups
74
were not statistically different, p=0.05). It is showed that the ash content of the DC
did not affect the ash content of the carcass of animals. The results of body
composition of animal are shown in Figure 1.
4. Conclusions
The defatted cake of the Brazil nut (DC) of this study, with 32.9% lipids and
27.8% protein was shown to be an important source for both, proteins and lipids for
animal growth.
The animals that consuming DC showed higher content of proteins in the
carcass and lower lipids content, with reduction of up to 36% of body lipids
compared with the group that ate CAS as unique protein source. Moreover, these
animals showed higher content of ash and moisture in the carcasses.
These results suggest that the use of DC should be encouraged, as it has
high nutritional quality, is easy to handle and can be added to consummed foods
daily.
Acknowledgements
PT Poeta acknowledges CNPq for the scholarship (process number
134457/2007-2).
We acknowledge Ms. Maria Susana Corrêa Alves da Cunha and Ms. Soely
Maria Pissini Machado Reis for the assistance during the biological assays. We
acknowledge Mr. Ary Dias for the nuts supply.
75
References
AGUIAR, J. P. L. Tabela de Composição de Alimentos da Amazônia. Acta Amazônica , v.26,n. 1/2, p. 121-126, 1996. ALLAN, B. C.; LACOUCIERE, G. M.; STADTMAN, T. C. Responsiveness of selenoproteins to dietary selenium. Annual Review of Nutrition , v. 19, p. 1-16, 1999. AMPE, C.; VAN DAMME, J.; CASTRO, L. A. B.; SAMPAIO, M. J. A. M.; VAN MONTAGU, M.; VANDEKERCKHOVE, J. The amino-acid sequence of the 2S sulphur-rich proteins from seeds of Brazil nus (Bertholletia excelsa H.B.K.). European Journal of Biochemistry , v. 159, p. 597-604, 1986. ANTUNES, A. J.; MARKAKIS, P. Protein suplementation of navy beans with Brazil nuts. Journal Agricultural Food Chemistry, v. 25, n. 5, p. 1096-1098, 1977. AOAC. Official methods of analysis of AOAC. 16 ed. International CUNNIF, P. ed., Virginia: AOAC International, v.1, 1995.1018p. AOCS, Official Method. Ce 1f-96 Determination of cis- and trans- Fatty Acids in Hydrogenated and Refined Oils and Fats by Capillary GLC. SAMPLING AND ANALYSIS OF COMMERCIAL FATS AND OILS , Reapproved 1997, Revised 2001. p. 1-6. BEARE-ROGERS, J.; DIEFFENBACHER, A.; HOLM, J. V. Lexicon of Lipid Nutrition (IUPAC Technical Report). Pure and Applied Chemistry , v. 73, n. 4, p. 685-744, 2001. BLIGH, E. G.; DYER, W. J. A rapid method of total lipide extraction and purification. Canadian Journal of Biochemistry and Physiology , v. 37, n. 8, p. 911-17, 1959. BURR, G. O. Significance of the Essential Fatty Acids. Federation Proceedings, v.1, p. 224–233, 1942. CHO, Y.; ZIBOH, V. A. Incorporation of 13-hydroxyoctadecadienoic acid (13-HODE) into epidermal ceramides and phospholipids: phospholipase C-catalyzed release of novel 13-H0DE-containing diacylglycerol. Journal of Lipid Research, v. 35, n.201, p. 255-26, 1994. CHOW, C. K.; TAPPEL, A. L. Response of Glutathione Peroxidase to Dietary Selenium in Rats. Journal of. Nutrition , v. 104, p. 444-451, 1974. CHUNHIENG, T.; GOLI, T.; PIOMBO, G.; PIOCH, D.; BROCHIER, J.; MONTET, D. Recent analysis of the composition of Brazil nut Bertholletia excelsa. BOIS ET FORÊTS DES TROPIQUES, v. 280, n. 2, p. 91-98, 2004(a).
76
CHUENHIENG, T.; PTRITIS, K.; ELFAKIR, C.; BROCHIER, J.; GOLI T.; MONTET, D. Study of Selenium Distribution in the Protein Fractions of the Brazil Nut, Bertholletia excelsa. Journal of Agricultural and Food Chemistry , v. 52,n.26, p. 4318 – 4322, 2004(b). CHUNHIENG, T., HAFIDI, A.; PIOCH, D.; BROCHIER, J.; MONTET, D. Detailed Study of Brazil Nut (Bertholletia excelsa) Oil Micro-Compounds: Phospholipids, Tocopherols and Sterols. Journal of Brazilian Chemical Society , v. 17, n. 7, p.1374-1380, 2008. COHEN, K.O. Produção de farinha parcialmente desengordurada de castanha do Brasil. Circular Técnica 42 – EMBRAPA , 2006 DE LUCA, R.R., ALEXANDRE, S.R., MARQUES, T. Manual para Técnico em bioterismo . São Paulo: Winner Graph, 1996. 259p. DUMONT, E.; PAUW L. D.; VANHAECKE, F.; CORNELIS, R. Speciation of Se in Bertholletia excelsa (Brazil nut): A hard nut to crack? Food Chemistry , v. 95, p. 684–692, 2006. ELIAS, P. M.; BROWN, B. E.; FRITSCH, P.; GOERKE, J.; GRAY, G. M.; WHITE, R. J. Localization and composition of lipids in neonatal mouse stratum granulosum and stratum corneum. Journal of Investigative Dermatology ,v. 73, p. 339-348, 1979. FERREIRA, K. S.; GOMES, J. C.; BELLATO, C. R.; JORDÃO, C. P. Concentrações de selênio em alimentos consumidos no Brasil. Revista Panamericana de Salud Publica/Pan Anamerican Journa l of Public Health. v. 11, n.3, p. 172-177, 2002. FONSECA F. R.; NAVARRO, M.; GOMEZ, R.; ESCUREDO L.; NAVA, F.; FU, J.; MURILLO-RODRIGUEZ, E.; GIUFFRIDA, A.; LOVERME, J.; GAETANI, S.; KATHURIA, S.; GALL, C.; PIOMELLI, D.; An anorexic lipid mediator regulated by feeding. Nature , v. 414, p. 209–212, 2001. FREITAS, S. P.; SILVA, O. F.; MIRANDA, I. C.; COELHO, M. A. Z. Extração e fracionamento simultâneo do óleo da castanha-do-Brasil com etanol. Ciência e Tecnologia de Alimentos , v.27, (supl) p. 14-17, 2007. GAETANI, S.; OVEISI, F.; PIOMELLI, D. Modulation of meal pattern in the rat by the anorexic lipid mediator oleoylethanolamide. Neuropsychopharmacology, v.28, n. 7, p. 1311-1316, 2003.
GLÓRIA, M. M.; REGITANO-d'ARCE, M. A. B. Concentrado e isolado protéico de torta de castanha do pará: obtenção e caracterização química e funcional. Ciência e Tecnologia de Alimentos , v. 20, n. 2, p.240-245, 2000.

77
GOENA, M.; MARZO, F.; FAERNÀNDEZ-GONZÀLEZ, L.; TOSAR, A.; FRÜHBECK, G.; SANTIDRIÁN, S. Effect of the raw legume Vicia Ervilha on muscle and liver protein metabolism in growing rats. Revista Espanola de Fisiologia, v.45, n.1, p.55-60,1989.
GONÇALVES, J. F. C.; FERNANDES, A.V.; OLIVEIRA, A. F. M.; RODRIGUES, L. F.; MARENCO, R. A. Primary metabolism components of seeds from Brazilian Amazon tree species. Brazilian Journal of Plant Physiology , v. 2, n. 2, p.139-142, 2002. GUZMÁN, M.; VERME, J. L.; FU, J.; OVEISI, F.; BLÁZQUEZ, C.; PIOMELLI, D. Oleoylethanolamide Stimulates Lipolysis by Activating the Nuclear Receptor Peroxossome Proliferator-activated Receptor α (PPAR- α). The Journal of Biological Chemistry , v. 279, n. 27, p. 27849-27854, 2004. HANSEN, H. S.; JENSEN, B. Essential Function of Linoleic Acid Esterified in Acylglucosylceramide and Acylceramide in Maintaining the Epidermal Water Permeability Barrier. Evidence from Feeding Studies with Oleate, Linoleate, Arachidonate, Columbinate and alpha-linolenate, Biochimica et Biophysica Acta, v. 834,n.3, p. 357–363, 1985. HARTOP, P. J.; PROTTEY, C. Changes in Transepidermal Water Loss and the Composition of Epidermal Lecithin After Applications of Pure Fatty Acid Triglycerides to the Skin of Essential Fatty Acid Deficient Rats. Journal of. Dermatology .v. 95, n.3, p. 255–264, 1976. HOLBEN, D. H.; SMITH, A. M. The diverse role of selenium within seleproteins: A review. Journal of the American Dietetic Association , v. 99, n.7, p. 836-843, 1999. HOLMAN, R. T. Biological Activities of and Requirements for Polyunsaturated Fatty Acids. Progress in the Chemistry of Fats and Other Lipids , v. 9, p. 611–680, 1968. JONES, B. H., MAHER, M. A., BANZ, W. J., ZEMEL, M. B., WHELAN, J., SMITH, P. J.; MOUSTAID, N. Adipose tissue stearoyl-CoA desaturase mRNA is increased by obesity and decreased by polyunsaturated fatty acids. American Journal of Physiology , v. 271, n.1, p.E44–E49, 1996. KANNAMKUMARATH, S. S.; WROBEL, K.; VONDERHEIDE, A.; CARUSO, J. A. HPLC–ICP–MS determination of selenium distribution and speciation in different types of nut. Analytical and Bioanalytical Chemistry, v. 373, p. 454–460, 2002.
78
KANNAMKUMARATH, S. S; WUILLOUD, R. G.; CARUSE, J. A. Studies of Various Elements of Nutritional and Toxicological Interest Associated with Different Molecular Weight Fractions in Brazil Nuts. Journal of Agricultural and Food Chemistry ,v.19, n.52, p. 5773-5780, 2004. KOOLMAN; KLAUS-HENRICH. Color Atlas of Biochemistry. New York: Thieme, 2005. 467p. LANE, H. W.; STRENGTH, R.; JOHNSON, J.; WHITE, M. Effect of Chemical Form of Selenium on Tissue Glutathione Peroxidase Activity in Developing Rats. Journal of Nutrition , n. 121, p.81-86, 1991. LESS, R. Manual de análisis de alimentos. Laboratory handboo k of methods of food analysis. Zaragoza, Acribia 1979. MEZEI, O.; BANZ, W. J.; STEGER, R.W; PELUSO, M. R.; WINTERS, T. A.; SHAY, N. Soy Isoflavones Exert Antidiabetic and Hypolipidemic Effects through the PPAR Pathways in Obese Zucker Rats and Murine RAW 264.7 Cells1. Journal of Nutrution , v. 133, n.5, p.1238–1243, 2003. MITCHELL, H. H.; BEADLES, J. R. The nutritive value of the proteins of nuts in comparison with the nutritive value of beef proteins. Journal of Nutrition , v.14, n.6, p. 597-608,1937. MORENO, F. J.; JENKINS, J. A.; MELLON, F. A.; RIGBY, N. M.; ROBERTSON, J. A.; WELLNER, N.; CLARE, M. E. N. Mass spectrometry and structural characterization of 2S albumin isoforms from Brazil nut (Bertholletia excelsa). Biochimica et Biophysica Acta , v. 1698, p. 175 – 186, 2004. NAOZUKA, J.; OLIVEIRA, P. V. Cu, Fe, Mn and Zn Distribuition in Protein Fractions of Brazil-Nut, Cupuassu Seed and Coconut Pulp by Solid-Liquid Extraction and Electrothermal Atomic Absorption Spectrometry. Journal of Brazilian Chemistry Society , v. 18, n. 8, p. 1547-1553, 2007. PACHECO, A. M.; SCUSSEL, V. M. Selenium and Aflatoxin Levels in Raw Brazil Nuts from Amazon Basis. Journal of Agricultural and Food Chemistry , v.55, n.26, p. 11087-11092, 2007. PAREKH P. P.; KHAN, A. R.; TORRES, M. A.; KITTO, M. E. Concentrations of selenium, barium, and radium in Brazil nuts. Journal of Food Composition and Analysis , v. 21, n.4, p.332-335, 2008. RAMOS, C. M. P.;BORA, P. S. Extraction and Functional Characteristics of Brazil Nut (Bertholletia excelsa, HBK) Globulin. Food Science and Technology International , v. 9, n .4, p. 265-269, 2003.
79
REEVES, P. G.; NIELSEN, F. H.; FAHEY, G. C. J. R. AIN-93 Purified diets for laboratory rodents: final report of the American Institute of Nutrition Ad Hoc Committee on the reformulation of the AIN-76A rodent diet. The Journal of Nutrition . v. 123, n. 11, p. 1939-1951, 1993. RODRIGUES, C. E. C.; SILVA, F. A.; MARSAIOLI J. R. A.; MEIRELLES, A. J. A. Deacidification of Brazil Nut and Macadamia Nut Oils by Solvent Extraction: Liquid-Liquid Equilibrium Data at 298.2 K. Journal of Chemical and Engineering Data, v. 50, p. 517-523, 2005. SHIBATA, M.; MATSUO, H. Effect of the Addition of Free Tryptophan to a 20% Casein Diet on the Ratio of N1--Methyl-l-pyridone-S-carboxamide plus N1 -Methyl-4-pyridone-3-carboxamide to N1- Methylnicotinamide Excretion. Agricultural Biology and Chemistry , v. 53, n.9, p. 2399-2402, 1989.
SILVEIRA, L. R.; FIAMONCINI, J.; HIRABARA, S. M.; PIO J. P.; CAMBIAGHI, T. D.; PINHEIRO, C. H. J.; LOPES, L. R.; CURI, R. Updating the Effects of Fatty Acids on Skeletal Muscle. Journal of Cellular Physiology , v. 217, n.1, p.1–12, 2008. SIMOPOULOS, A. P. The importance of the ratio of omega-6/omega-3 essential fatty acids. Biomedicine & Pharmacoterapy , v.56, n. 8, p.365-379, 2002. SOUZA, M. L.; MENEZES, H. C. Processamentos de amêndoa e torta de castanha-do-brasil e farinha de mandioca: parâmetros de qualidade. Ciência e Tecnologia de Alimentos , v. 24, n. 1, p.120-128, 2004. SPINI, V. B. M. G.; FERREIRA, F. R.; PADUANI, G. F.; SOUZA, C. S.; KERR, W. E. Efeito da adição de Castanha-do-Pará à dieta de arroz e feijão sobre o ganho de peso em camundongos. Bioscience Journal , v. 22, n. 3, p. 89-93, 2006. STANDING COMMITTEE ON THE EVALUATION OF DIETARY REF ERENCE INTAKES OF THE FOOD AND NUTRITION BOARD, INSTITUTE OF MEDICINE, THE NATIONAL ACADEMIES AND HEALTH CANADA: Dietary R eference Intakes for Vitamin C, Vitamin E, Selenium and Caro tenoids , Washington, DC: National Academy Press, 2000. THABUIS, C.; DESTAILLATS, F.; TISSOT-FAVRE, D.; MARTIN, J-C. Oleoyl-ethanolamide (OEA): A bioactive lipid derived from oleic acid and phosphatidylethanolamine. Lipid Technology , v. 19, n. 10, p. 225-227,2007. THABUIS, C.; TISSOT-FAVRE, D.; BEZELGUES, J-B.; MARTIN, J-C.; CRUZ-HERNANDEZ, C.; DIONISI, F.; DESTAILLATS, F. Biological Functions and Metabolism of Oleoylethanolamide. Lipids , v. 43, n.10, p. 887 – 894, 2008.
80
THOMSON, C. D.; CHISHOLM, A.; MCLAHLAN, S.; CAMPBELL, J. M. Brazil nuts: an effective way to improve selenium status. American Journal of Clinical Nutrition . v. 87, n.2, p. 379-384, 2008. VADHANAVIKIT, S.; GANTHER, H. E. Selenium Requirements of Rats for Normal Hepatic and Thyroidal 5´-Deiodinase (Type I) Activities. Journal of Nutrition , v.123, n.6, p. 1124-1128, 1993. VENKATACHALAM, M.; SATHE, S. K. Chemical Composition of Selected Edible Nuts Seeds. Journal of Agricultural and Food Chemistry , v.54, n.13, p. 4705-47014, 2006. VONDERHEIDE A. P; WROBEL, K.; KANNAMKUMARATH, S. S; CLAYTON BHYMER, C.; MONTES-BAYN, M.; LEN, C. P. Characterization of Selenium Species in Brazil Nuts by HPLC−ICP-MS and ES-MS. Journal of Agricultural and Food Chemistry , v. 50, n. 20, p. 5722-5728, 2002. WANG, Y.; VOY, B. J.; URS, S.; KIM, S.; SOLTANI-BEJNOOD, M.; QUIGLEY, N.; HEO, Y. R.; STANDRIDGE, M.; ANDERSEN, B.; DHAR, M.; JOSHI, R.; WORTMAN, P.; TAYLOR, J.W.; CHUN, J.; LEUZE, M.; CLAYCOMBE, K.; SAXTON, A. M.; MOUSTAID-MOUSSA, N. The Human Fatty Acid Synthase Gene and De Novo Lipogenesis Are Coordinately Regulated in Human Adipose Tissue. Journal of Nutrition , v. 134, n.5, p. 1032-1038, 2004. YAMAMOTO, S.; SMITH, W. L. Preface: Molecular Biology of the Arachidonate Cascade (second edition). Prostaglandins & Other Lipid Mediators .v.68-69, n.2 p.1, 2002. YUAN, Y. V.; KITTS, D. D. Calcium absorption and bone utilization in spontaneously hypertensive rats fed on native and heat-damaged casein and soya-bean protein. British Journal of Nutrition , v. 71, n.4, p. 583-603, 1994. ZUO, W. N.; SUN, S. S. M. Purification and Characterization of Methionine-Rich 2S Seed Proteins from the Brazil Nut Family (Lecythidaceae. Journal of Agricultural and Food Chemistry , v. 44, n.5, p.1206–1210, 1996.
81
Conclusão Geral Diante de todos os resultados expostos, conclui-se que a torta
desengordurada de castanha do Brasil é uma excelente fonte de proteínas, uma
vez que, adicionada à dieta padrão (proteína de fonte animal – caseína), manteve
seu percentual de digestibilidade e valor biológico, além de valores mais elevados
de proteína corpórea, mesmo sendo uma proteína de fonte vegetal. Apresentou
ainda, valores de PER e BN próximos a valores encontrados para proteínas de
origem animal. Desta forma, a torta de castanha do Brasil, apesar de ser um
resíduo industrial, pode ser incluída no cardápio do brasileiro, de forma a
enriquecer a dieta, seja ela de indivíduos de baixa renda, de instituições carentes,
de correntes vegetarianas ou mesmo para complementar o requerimento de
aminoácidos indispensáveis.
A torta utilizada neste trabalho, apesar de receber o nome
‘desengordurada’, apresentava ainda conteúdo de lipídeo (32.9%) em sua
composição. Isso muito provavelmente interferiu na composição corpórea dos
animais uma vez que o óleo continha altos teores dos ácidos oléico e linoléico; os
quais, de acordo com a literatura consultada, possuem ação hipolipidêmica, fato
corroborado no presente estudo, uma vez que os animais alimentados com
diferentes proporções de torta de castanha apresentaram significativa redução de
gordura corpórea.

82
ANEXO 1 – Certificado de Aprovação do Comitê de Ética em Experimentação Animal