Embed Size (px)
Citation preview

Rendibilidade da Educação
Pedro Telhado PereiraUniversidade da Madeira, CEPR and IZA

Os trabalhadores portugueses apresentam uma baixa instrução
Gráfico 1 - Anos de Estudo dos Trabalhadores, 1982-1998Fonte: "Quadros de Pessoal"
0,0
10,0
20,0
30,0
40,0
50,0
60,0
70,0
1982 1983 1984 1985 1986 1987 1988 1989 1990 1991 1992 1993 1994 1995 1996 1997 1998
Years
4 6 9 11+12 14+15 16+17

Relembremos que as populações mais jovens não estavam a
recuperar a um bom ritmo População com o Secundário Completo (1999), por grupos de idade
País 25-64 25-34 35-44 45-54 55-64
Espanha 35 55 41 25 13
Grécia 50 71 58 42 24
Irlanda 51 67 56 41 31
Itália 42 55 50 37 21
Portugal 21 30 21 15 11

Todos os países, com excepção de Portugal, apresentam um crescimento de mais de 30% entre a geração dos 55-64 e a dos 25-34
Portugal apresenta um crescimento de menos de 20%

Passados quase dez anos em 2008
População com o Secundário Completo (2008), por grupos de idade
País 25-64 25-34 35-44 45-54 55-64
Espanha 51 65 57 45 29
Grécia 61 75 69 56 39
Irlanda 69 85 75 62 45
Itália 53 69 57 49 35
Portugal 28 47 29 20 13

Portugal já ultrapassou os 30% de diferença
No entanto menos de metade da geração mais jovem (25-34) tem o secundário completo.
Os valores apresentados por esta geração são semelhantes aos das gerações 20 anos mais velhas nos países comparados.

No Ensino SuperiorPopulação com o Ensino Superior Completo (2008), por grupos de idade
País 25-64 25-34 35-44 45-54 55-64
Espanha 29 39 33 24 16
Grécia 23 28 27 22 15
Irlanda 34 45 37 27 19
Itália 14 20 15 12 10
Portugal 14 23 15 10 8

Para a geração mais nova, a Itália está pior
No entanto, Portugal ainda está muito abaixo dos outros países com os quais comparamos

Relembre o investimento em capital humano
Suponha que não existem custos de estudar ou que estes são compensados pelos rendimentos durante o tempo de estudo.
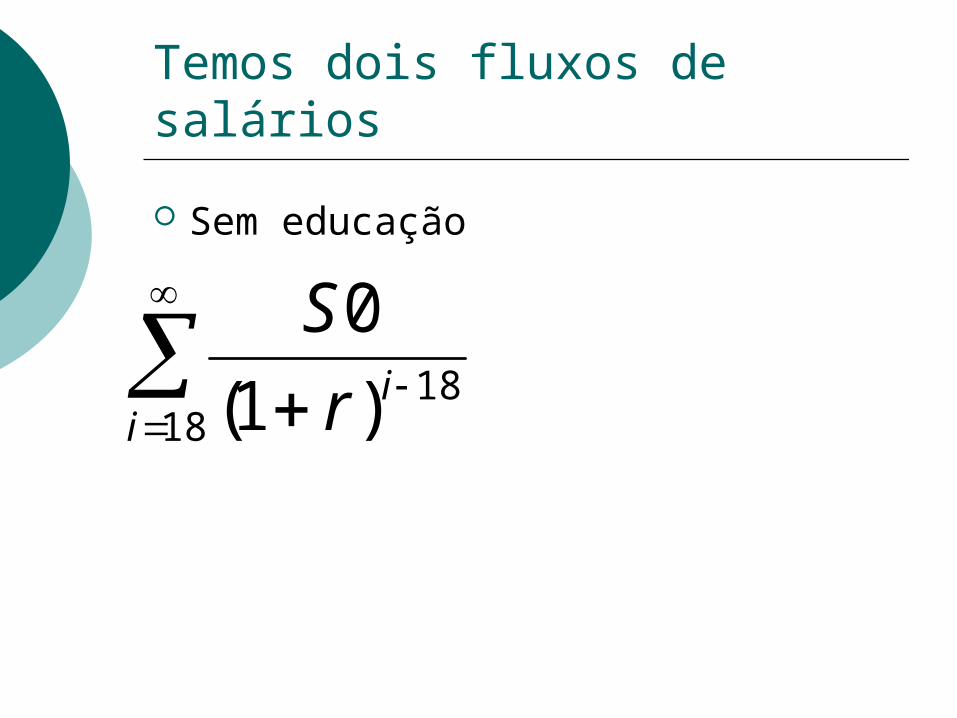
Temos dois fluxos de salários
Sem educação
1818)1(
0i
irS

Com educação
1918)1(
1i
irS
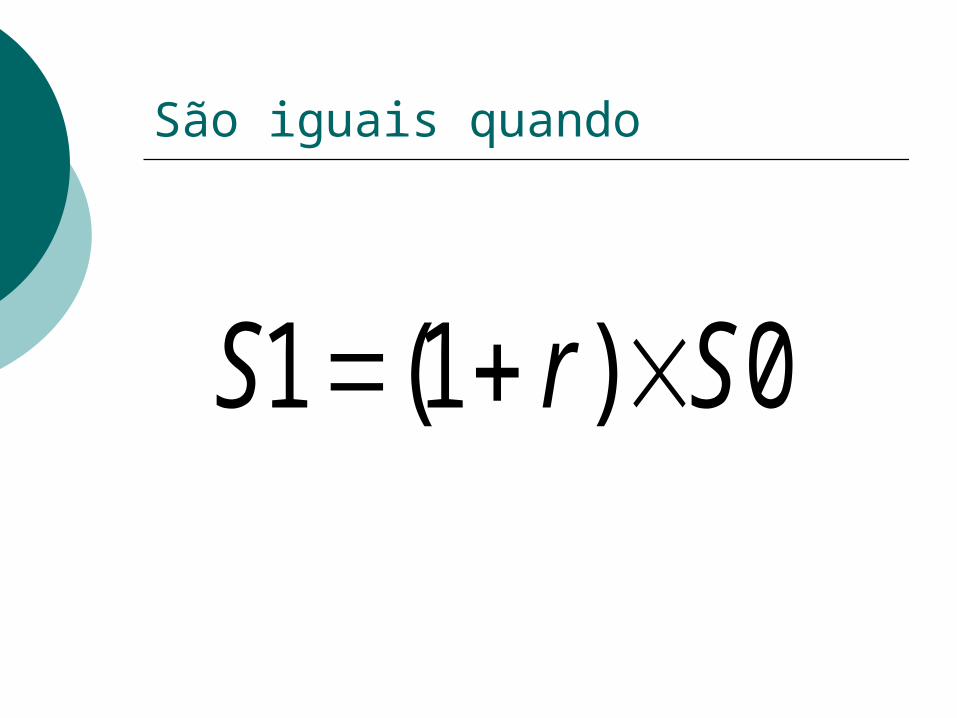
São iguais quando
0)1(1 SrS

O que os economistas calculam
rEdAS ln
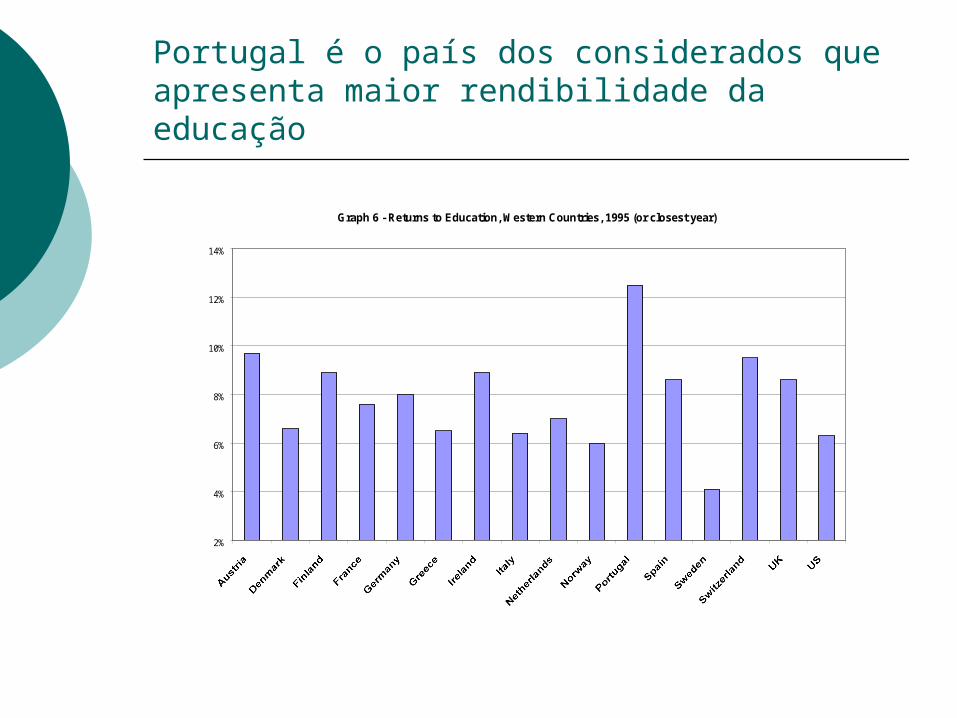
Portugal é o país dos considerados que apresenta maior rendibilidade da educação
Graph 6 - Returns to Education, Western Countries, 1995 (or closest year)
2%
4%
6%
8%
10%
12%
14%

A taxa de rendibilidade média para os países considerados é de 7,8%.
A taxa mínima é de 4.1% para a Suécia
A taxa máxima é para Portugal 12,6

A rendibilidade da educação tem apresentado uma tendência crescente (cerca de 1% por década).
Graph 3 - Returns to Education, Linear Specification, 1982-1995
8.0%
8.5%
9.0%
9.5%
10.0%
10.5%
11.0%
11.5%
12.0%
12.5%
13.0%
1982 1985 1986 1987 1988 1989 1991 1992 1993 1994 1995 1996 1997 1998
Years
All Men Women

O aumento de rendibilidade não resultou de uma diminuição dos salários reais das pessoas com menor educação
Graph 4 - Average Hourly Real Wages, Different Skill Groups, Men, 1982-19981998 Escudos
0
500
1000
1500
2000
2500
3000
1982 1985 1986 1987 1988 1989 1991 1992 1993 1994 1995 1996 1997 1998
Years
Young, Low Ed Old, Low Ed Young, Med Ed Old, Med Ed Young, High Ed Old, High Ed

A cohort dos mais velhos e mais educados é a que apresenta evolução mais crescente
Graph 5 - Average Hourly Real Wages, Different Skill Groups, Men, 1982-1998Base Period: 1982
80%
90%
100%
110%
120%
130%
140%
150%
160%
170%
180%
1982 1985 1986 1987 1988 1989 1991 1992 1993 1994 1995 1996 1997 1998
Years
Young, Low Ed Old, Low Ed Young, Med Ed Old, Med Ed Young, High Ed Old, High Ed

A licenciatura é o grau que apresenta maior rendibilidade
Graph 8 - Average Marginal Returns to School Degrees , 1982, 1991 and 1998
0%
2%
4%
6%
8%
10%
12%
14%
16%
18%
20%
2nd/1st cycles 3rd/2nd cycles Sec/3rd cycle Bachar/Sec. Licenc/Sec.
School Degrees Compared
1982 1991 1998

A Licenciatura apresentava uma taxa de rendibilidade média por ano de 18%
Esta taxa é 10% superior à do Ensino Secundário

As engenharias, a gestão e a economia lideram
Table 1 – Returns to Degree Type and Content, 1995
Degree Type Degree Content All Men Women
"Bacharelato" Management and Economics 270% 262% 267%
"Bacharelato" Engineering 368% 325% 408%
"Bacharelato" Human and Social Sciences 240% 224% 262%
"Bacharelato" Other Degrees 318% 327% 319%
"Licenciatura" Management and Economics 500% 471% 498%
"Licenciatura" Engineering 504% 450% 548%
"Licenciatura" Human and Social Sciences 431% 331% 492%
"Licenciatura" Other Degrees 438% 373% 492%
Na rendibilidade do superior….

Em 2006 (EAG 2010)
Os homens com Ensino Superior ganhavam mais 90% e as mulheres mais 78% do que o correspondente aos que ficaram com o Ensino Secundário.
Este valor tem permanecido quase constante na última década.

Conclusão sobre a rendibilidade da Educação
Portugal é um país que apresenta uma alta rendibilidade da educação
No entanto, apresenta também um alto risco no investimento em educação, como veremos a seguir.
A alta rendibilidade tem-se mantido

Quanto à formação profissional:
Parece não haver aumentos de salários com o sistema de aprendizes ou nas escolas profissionais.
Existem aumentos de salários quando a formação profissional se executa em instituições de ensino superior ou nas empresas
Os resultados utilizando o ECHP
Confirmam os resultados obtidos utilizando os Quadros de Pessoal
A rendibilidade da educação é maior no sector privado que no público (como veremos a seguir)
Não existe problema de selectividade na amostra feminina
Não confirmam a teoria do sinal. Discutiremos mais adiante esta teoria.
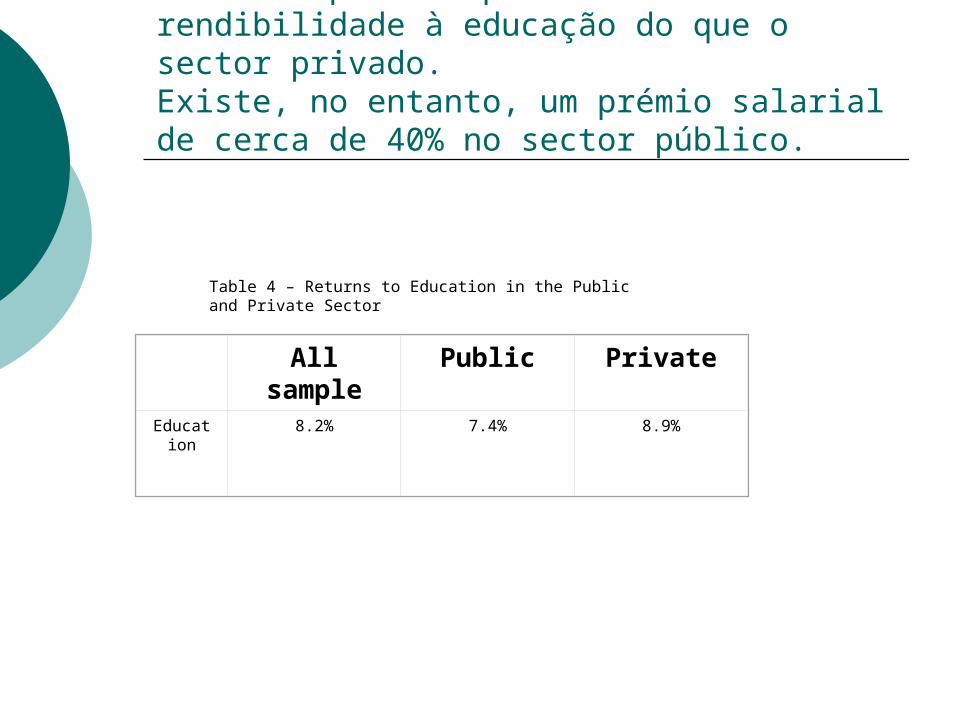
O sector público parece oferecer menor rendibilidade à educação do que o sector privado. Existe, no entanto, um prémio salarial de cerca de 40% no sector público.
All sample Public Private
Education
8.2% 7.4% 8.9%
Table 4 – Returns to Education in the Public and Private Sector

Os resultados não confirmam a teoria do sinal
Table 6 – Returns to Education, Employees and Self-Employed
Employees Self-Employed
Education
.099 .117
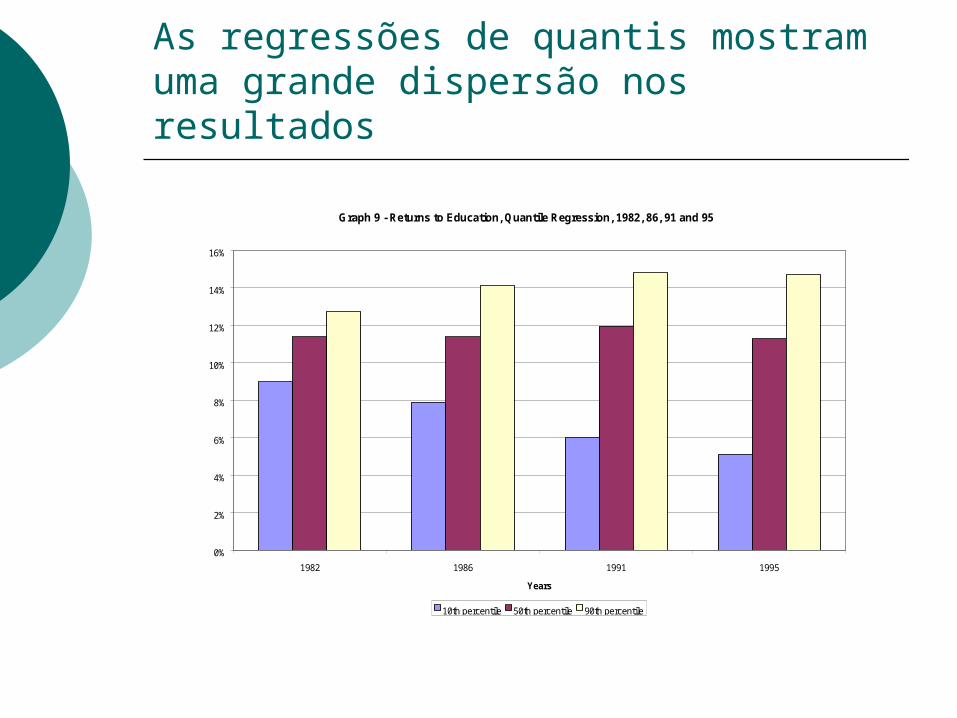
As regressões de quantis mostram uma grande dispersão nos resultados
Graph 9 - Returns to Education, Quantile Regression, 1982, 86, 91 and 95
0%
2%
4%
6%
8%
10%
12%
14%
16%
1982 1986 1991 1995
Years
10th percentile 50th percentile 90th percentile
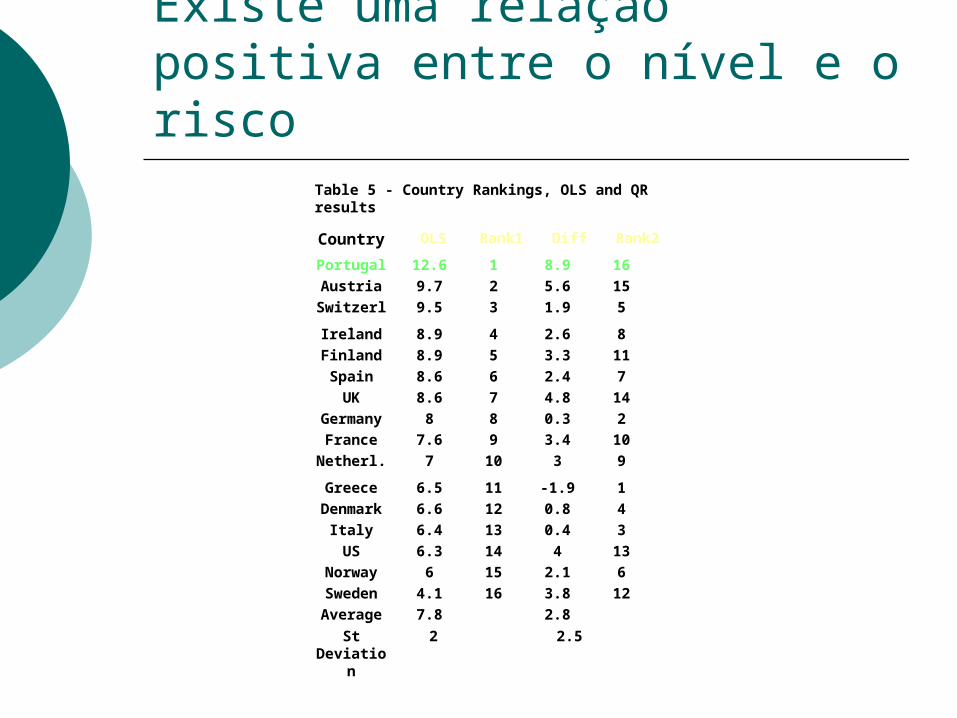
Existe uma relação positiva entre o nível e o risco
Table 5 - Country Rankings, OLS and QR results
Portugal 12.6 1 8.9 16Austria 9.7 2 5.6 15
Switzerl. 9.5 3 1.9 5
Ireland 8.9 4 2.6 8Finland 8.9 5 3.3 11Spain 8.6 6 2.4 7
UK 8.6 7 4.8 14Germany 8 8 0.3 2France 7.6 9 3.4 10Netherl. 7 10 3 9
Greece 6.5 11 -1.9 1Denmark 6.6 12 0.8 4
Italy 6.4 13 0.4 3US 6.3 14 4 13
Norway 6 15 2.1 6Sweden 4.1 16 3.8 12Average 7.8 2.8
Country OLS Rank1 Diff Rank2
St Deviation
2 2.5

A soma das duas ordens dá cerca de 17 para grande número de países. Verifica-se que a alta rendibilidade está associada ao alto risco.
Table 5 - Country Rankings, OLS and QR results
Portugal 12.6 1 8.9 16Austria 9.7 2 5.6 15
Switzerl. 9.5 3 1.9 5
Ireland 8.9 4 2.6 8Finland 8.9 5 3.3 11Spain 8.6 6 2.4 7
UK 8.6 7 4.8 14Germany 8 8 0.3 2France 7.6 9 3.4 10Netherl. 7 10 3 9
Greece 6.5 11 -1.9 1Denmark 6.6 12 0.8 4
Italy 6.4 13 0.4 3US 6.3 14 4 13
Norway 6 15 2.1 6Sweden 4.1 16 3.8 12Average 7.8 2.8
Country OLS Rank1 Diff Rank2
St Deviation
2 2.5

Os países que apresentam mais alta rendibilidade são os que menos apoiam os alunos e as suas famílias
Ordem na Rendibilidade
Ordem no Apoio Financeiro
Soma
Portugal 1 7 8Áustria 2 7 9Irlanda 3 5 8Espanha 4 9 13UK 5 4 9Alemanha 6 6 12Holanda 7 3 10Grécia 8 11 19Dinamarca 9 2 11Itália 10 11 21Suécia 11 1 12

Alguns resultados da investigação levada a cabo na UMa sobre a rendibilidade da formação profissional
Algumas notas sobre a formação profissional
Resultados de Budria e Pereira (“The Wage Effects of Training in Portugal: Differences across skill groups, genders, sectors and training types”, Applied Economics, 2007, “The Contribution of Vocational Training to Employment, Job-related Skills and Productivity: Evidence from Madeira Island”, International Journal of Training and Development, 2009, “Are Vocational Training Programs Truly Effective? Evidence from Self-assessed Data”, ICFAI Journal of Training and Development, 2009 and “Subjective Assessment on Vocational Training Activities: A Generalized Ordered Probit Approach”, Empirical Research in Vocational Education and Training, 2010.

Resultados usando Inquérito ao Emprego 1998 a 2000
A participação na formação profissional aumenta com a educação sendo que os mais educados têm uma probabilidade de participação que é 3 vezes superiores.
A participação decresce com a idade, é superior no Sector Público e se a pessoa tem um segundo emprego.
Tem taxas de rendibilidade superiores a 10%. A rendibilidade é menor para os mais
educados

Resultados usando o Inquérito à Inserção, Direcção Regional de Formação Profissional, 2000 a 2005.
Um mês após o fim da formação profissional a maioria encontra emprego.
A educação primária aumenta a probabilidade de estar empregue após dois anos em 1,75 vezes
A educação secundária aumenta a probabilidade de estar empregue após dois anos em 7,22 vezes
A educação superior aumenta a probabilidade de estar empregue após dois anos 11,78 vezes

Existe complementaridade entre a educação e a formação profissional. Os mais educados têm não só maior probabilidade de encontrar emprego mas também são os que mais consideram que a formação os ajudou a encontrar o emprego, que está relacionada com o emprego corrente e que aumentou a sua produtividade nesse emprego.
Existe um alto nível de satisfação com a formação profissional na Madeira.
Conclusão sobre a formação profissional
Usando dados para Portugal vemos que são os menos educados os que mais ganham com a formação profissional. No entanto, dados para a Madeira mostram que os aumentos da empregabilidade, das competências no emprego e da produtividade resultantes da formação profissional aumentam com a educação.

Previous results Results from “The Wage Effects of Training in Portugal:
Differences across skill groups, genders, sectors and training types”
Results from “The Contribution of Vocational Training to Employment, Job-related Skills and Productivity: Evidence from Madeira Island”, International Journal of Training and Development, 2009, 13:1, pp. 53-72, “Are Vocational Training Programs Truly Effective? Evidence from Self-assessed Data”, ICFAI Journal of Training and Development, 2009 and “Subjective Assessment on Vocational Training Activities: A Generalized Ordered Probit Approach”, forthcoming Empirical Research in Vocational Education and Training
Revisão da literatura

In a research previous to our joint research, Pedro Pereira and some colleagues ( Joop Hartog , Pedro Pereira, José Vieira, "Vocational Training and Earnings in Portugal", Economia, vol. XXIV, Janeiro/Maio/Outubro 2000, 35-52) using data from the European Community Household Panel, 1994 (3598 obs., men 2193, women 1405), five training types: 1) at College; 2) at Vocational School; 3) in a Working environment; 4) in a Dual system and 5) Less than one year, found that:
Returns to training are significant: Men 11,4%, Women 6,7%, but not in all types of training. It is higher if the training is taken in at a College ( Men 32,6%, Women 15,2%) and for men also in a working environment (Men 18,1%, Women not significantly different from zero). It is lower but still significantly different from zero if the training is less than one year (Men 9,3%, Women 7,6%), but it is not significantly different from zero if taken in a Vocational School or in a Dual system.

Using data from Inquérito ao Emprego (Labor Survey) 1998 to 2000, we (see Santiago Budria e Pedro Pereira, “The Wage Effects of Training in Portugal: Differences across skill groups, genders, sectors and training types”, Applied Economics, 2007, 39, 787–807) saw the influence of different types of training in wages and studied the participation in training.
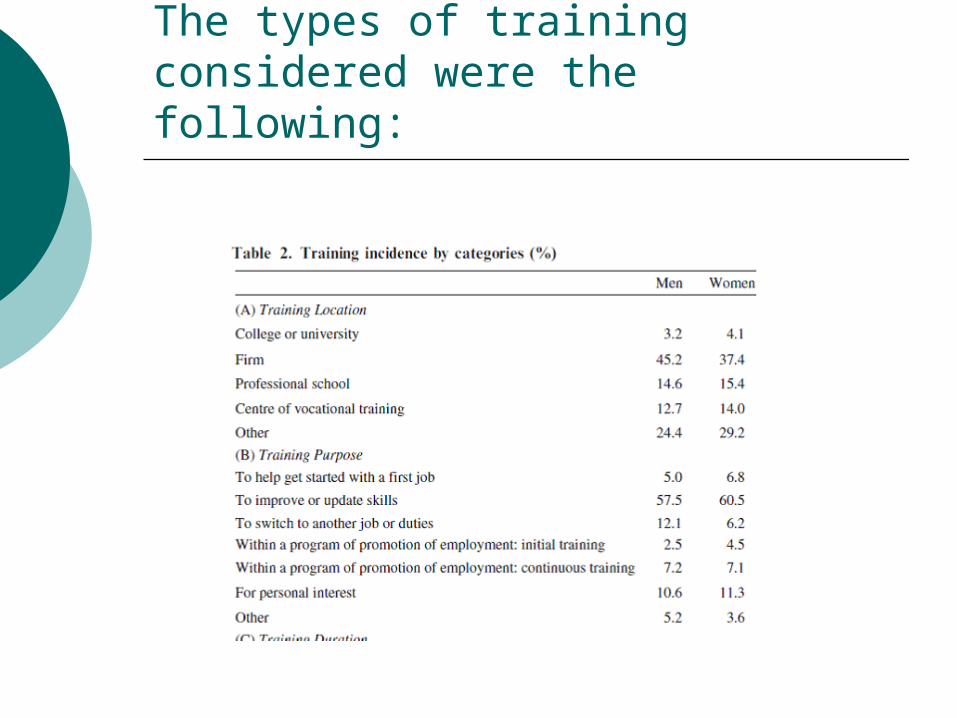
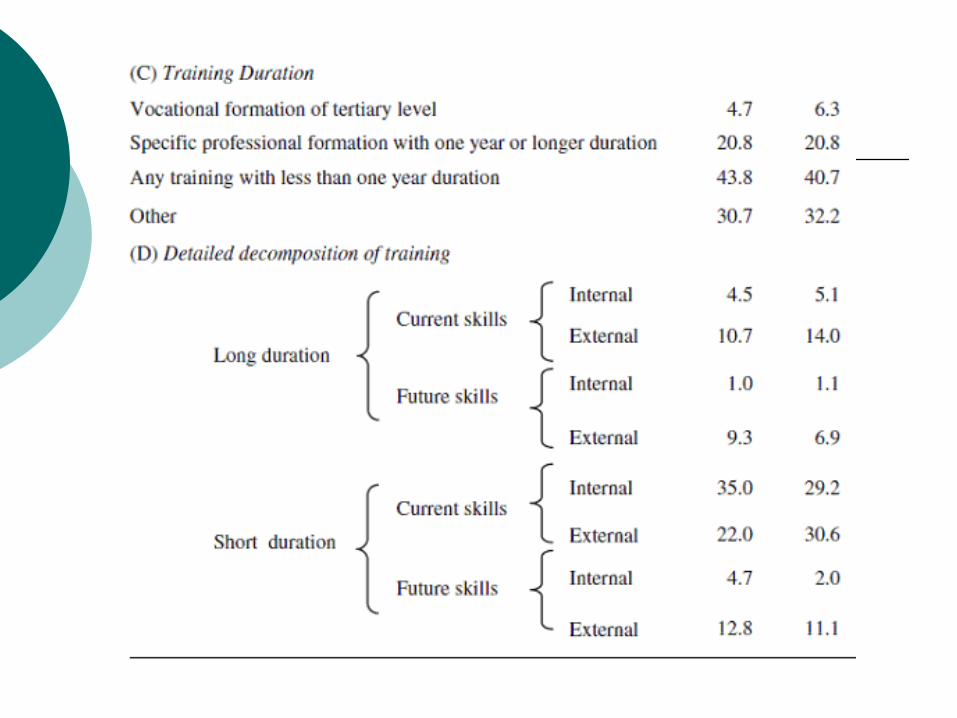
The types of training considered were the following:
The empirical results show that the participation into training increases with education (more educated are more prone to participate - more than 3 times), decreases with age, increases if in the Public Sector for men and is higher if a person has a second job.
The returns to training were 12.7% for men and for women 8.4%, but were much higher if we corrected by selectivity (returns to training with treatment effects - 30.3% for men, 37.5% for women).

When considering the returns to different types of training we found that they are higher in company training than in external training.
When considering the selectivity correction training to improve future skills has a return that is not significantly different from zero while the returns are positive if the training is to increase skills at the current job.
Training of short term duration seems to bring higher returns than longer term courses.
We used interactions terms to see the influence of education on returns to training and found that, in our data, returns are lower for more educated people.

Conclusion
That lead us to conclude that training has a remedial effect meaning that people with lower education can overcome this “handicap” through training and this way decrease the wage gap to people with more education.
In more recent research we used data from the Survey of Insertion 2000 to 2005 (Inquérito à Inserção, Direcção Regional de Formação Profissional) (Santiago Budria and Pedro Telhado Pereira, “The Contribution of Vocational Training to Employment, Job-related Skills and Productivity: Evidence from Madeira Island”, International Journal of Training and Development, 2009, 13:1, pp. 53-72, “Are Vocational Training Programs Truly Effective? Evidence from Self-assessed Data”, ICFAI Journal of Training and Development, 2009 and “Subjective Assessment on Vocational Training Activities: A Generalized Ordered Probit Approach”, forthcoming Empirical Research in Vocational Education and Training)

This survey is carried out to evaluate the effects of vocational training programs on the transition to the labor market in Madeira Island, Portugal. The information provided in the survey can be divided in two main blocks. In the first block, individuals are asked to report their employment status at three different dates: one month, one year, and two years after the completion of the program. We use this information to explore how the probability of employment depends on the individual characteristics and on the type of vocational program. In the second block, individuals are asked to assess the extent to which the training i) facilitated their access to employment, ii) was related to their current job and iii) enhanced their productivity in the job. We use this information to assess the contribution of training along these dimensions and to explore how this contribution differs across groups of workers and across training programs.

One month after the completion of the training the majority had found a paid job, but the percentage of males that found it was higher than the percentage of females. This percentage was increasing with time for males, but no for females as the percentage that were unemployed after two years is higher than the percentage after one year This means that women have more difficulty of finding a job and the job is less stable.

We use a logit model to study the influence of education, age, gender, duration of training, field of training in the probability of being employed.
Having primary, secondary or tertiary education increases the predicted probability by a factor of 1.75, 7.22, and 11.78 respectively of being employed after two years. After one month the coefficients are not significantly different from zero, and after one year only the coefficient for having a secondary education is significant.

Age has a negative effect (significant at the two years span). Being a woman also has a negative impact, especially after two years where the odd ratio is less than 0.3.
Training in Tourism or Electronics or Energy has a positive impact on employment. The duration of training has also a positive effect.

To study the effectiveness of the training we start by doing a ordered
logit regression.
We see that there are complementary effects between schooling and training. Not only do the more educated have higher chances of getting a job, they also consider that training helped them to get that job and that the training was related to their current job and that they are more productive due to the training.
This is even more evident when we consider the results of a generalized order probit approach below.
The probability of being completely satisfied with the training in terms of contributing for employment increases with education. 25.7% for those with secondary education and 37.8% for those with higher education. This observation suggests that the complementarity of training and education acts, therefore, by improving the chances that an individual is completely satisfied with his/her training activity.
Having participated in a long program significantly raises the probability of giving the highest score to the training activity but, in turn, does not prevent an individual from reporting the lowest evaluation.
The same kind of results was obtained for the satisfaction with the skills and with the increase in productivity.
The degree of satisfaction with the training is high

In Madeira Island, the public provision of vocational training is highly centralized at the regional level, which has resulted in a relatively small number of vocational paths, a clearer mapping between the regional labor market needs and vocational courses and a wider recognition by regional employers. Screening and signaling effects are more likely to operate in this particular context, providing training completers with useful labor market credentials.

Final conclusion In Portugal less educated workers earned a higher
wage premium from training activities, and concluded that training had a remedial nature. The results using the data from Madeira suggest that this is not the case when it comes to employment opportunities, job-related skills and productivity. If policy makers are concerned with promoting employment among the less favoured in the labour market, the existing training schemes should be redesigned in order to amend the educational and skills limitations that some training participants exhibit from the start. In this respect, training aimed to acquire general skills and competencies rather than specific knowledge may be of particular importance

Rendibilidade da Educação e Função Salários

The paradigm of the two islands – Pereira and Martins (2004)
two islands (I1) with a productivity per capita of
P (I2) with a productivity per capita of Q P<Q. The inhabitants of the islands live an
eternal life (all are born at the same moment) and maximize the present value of their production.
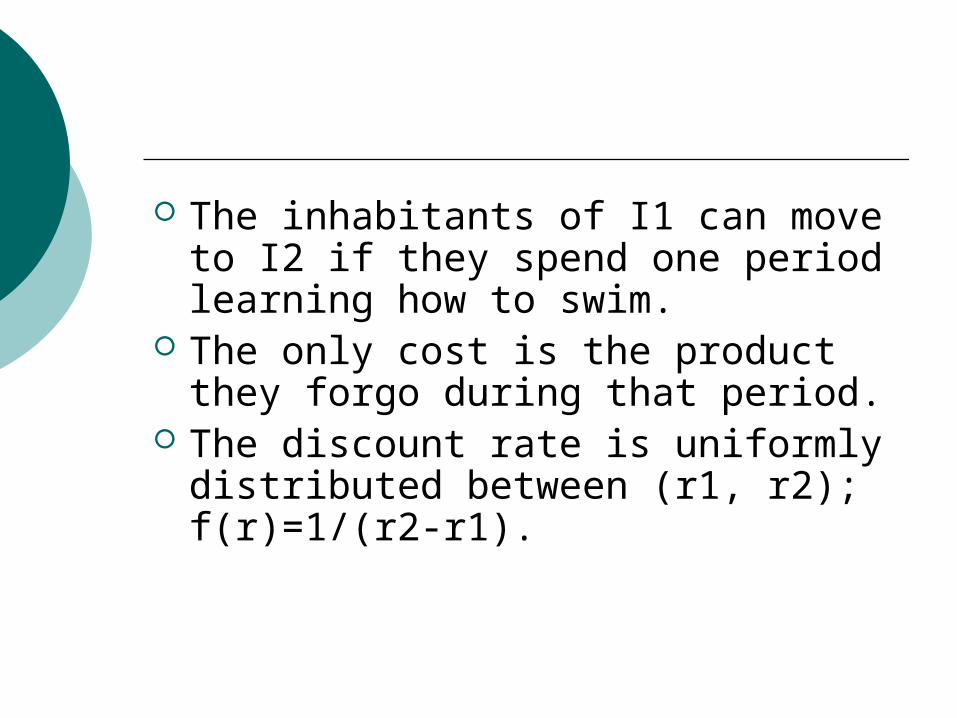
The inhabitants of I1 can move to I2 if they spend one period learning how to swim.
The only cost is the product they forgo during that period.
The discount rate is uniformly distributed between (r1, r2); f(r)=1/(r2-r1).
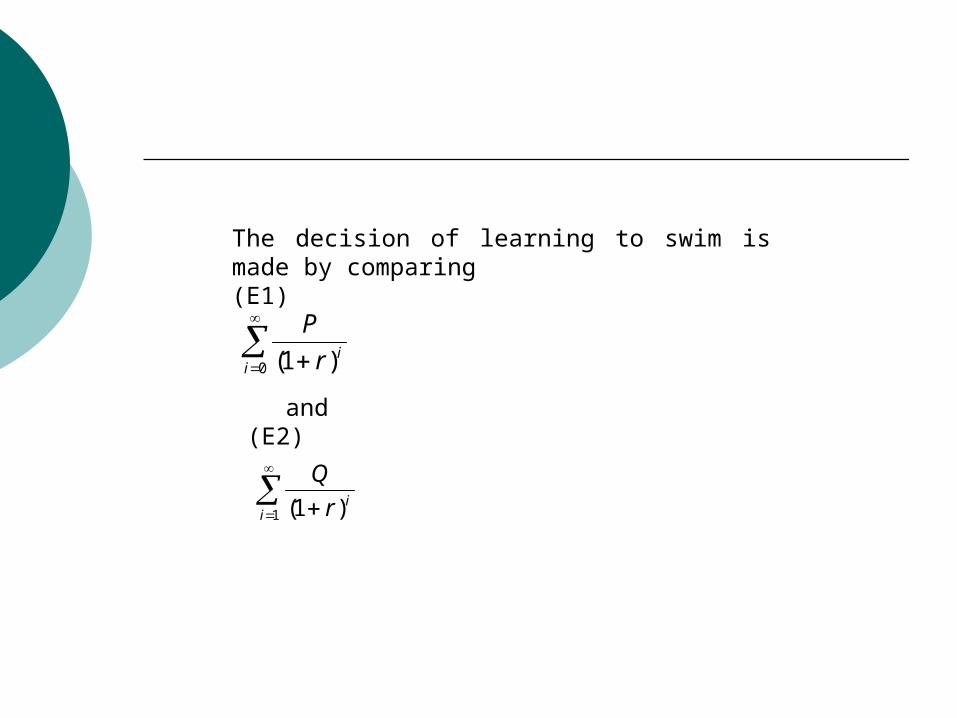
The decision of learning to swim is made by comparing(E1)
0 )1(iir
P
and(E2)
1 )1(iir
Q
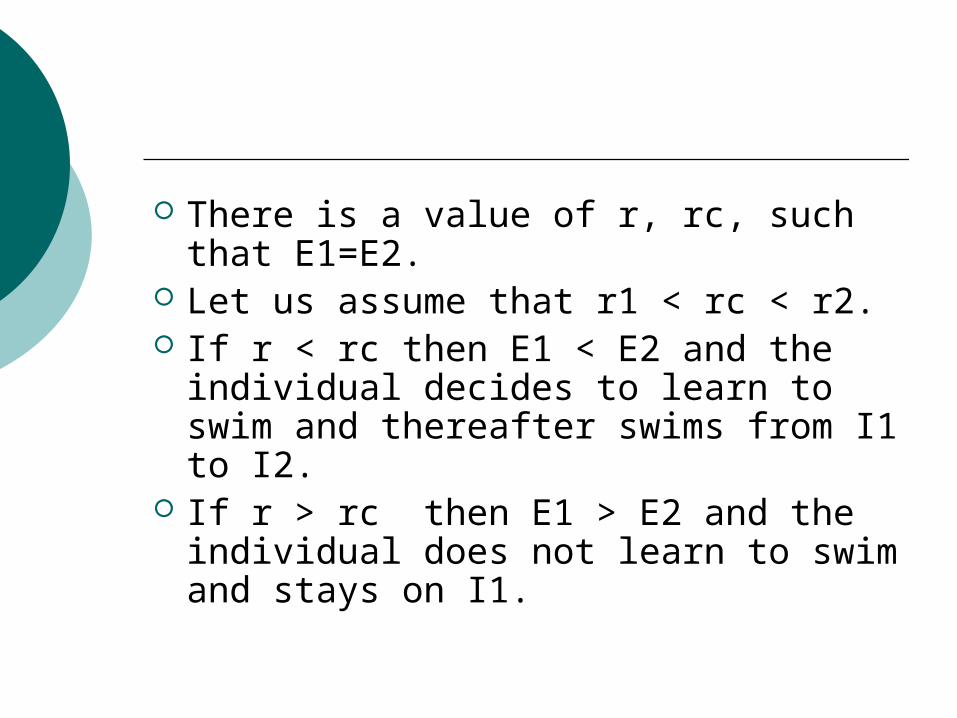
There is a value of r, rc, such that E1=E2.
Let us assume that r1 < rc < r2. If r < rc then E1 < E2 and the
individual decides to learn to swim and thereafter swims from I1 to I2.
If r > rc then E1 > E2 and the individual does not learn to swim and stays on I1.
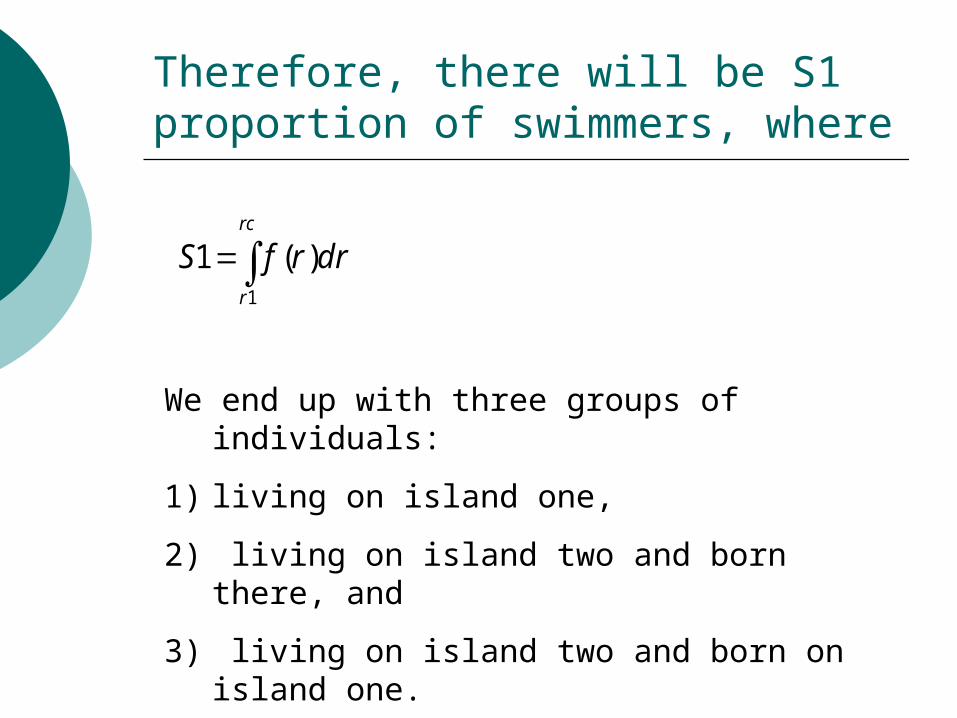
Therefore, there will be S1 proportion of swimmers, where
rc
r
drrfS1
)(1
We end up with three groups of individuals:
1) living on island one,
2) living on island two and born there, and
3) living on island two and born on island one.

The “labour economists” want to explain the differences in productivity and therefore they can do so by examining the place where the person is living (the wage equation approach).
But suppose that we are interested in studying the “returns” to education (learning to swim). We must then look at the persons born on island one and see the differentials in their productivities as the return we are looking for. This is what “education economists” look for.
We could never find this return if we considered the place of residence as one of the explanatory variables of the productivity differential, the reason being that this covariate is a result of learning to swim for people born on island one.
This example illustrates
the difference between wage equations - where education is one of the explanatory variables - and returns to education - where all the indirect effects should be accounted for.

When an individual (or his family) decides the amount of education he wants to have
he knows that education is going to bring him a better paid job,
but at the same time gives him more opportunities in choosing other characteristics as, for instance, the sector and firm where he ends up working in.
Part of the private return from education to the individual is going to be through the return he will get from the posterior choices he can make.