Embed Size (px)
Citation preview

UNIVERSIDADE DA BEIRA INTERIOR
Ciências
Screening of polyhydroxyalkanoates producing
bacteria isolated from marine ecosystems
Sílvia De Almeida Baptista
Dissertação para obtenção do Grau de Mestre em
Biotecnologia
(2º ciclo de estudos)
Orientador: Prof. Doutor Christophe Roca
Co-orientador: Prof. Doutor Luís Passarinha
Covilhã, Junho 2013

ii

iii
"If people feel they understand the world around them, or, probably, even
if they have the conviction that they could understand it if they wanted
to, then and only then are they also able to feel that they can make a
difference through their decisions and activities".
Frank Oppenheimer

iv

v
To my greatest treasure,
My parents…

vi

vii
ACKNOWLEDGEMENTS
This Thesis would not have been possible without the guidance and the help of several
individuals who in one way or another contributed and extended their valuable assistance in
the preparation and completion of this study. It is a pleasure to convey my gratitude to them
all in my humble acknowledgment.
First and foremost, it gives me immense pleasure and privilege to express deep gratitude to
my supervisor Professor Doctor Christophe Roca. I would like to acknowledge him for
dedication, perseverance, patience and availability throughout this year, the scientific
expertise, as well as the constructive criticisms and suggestions made during the guidance of
the work. Above all and the most needed, he provided me with unflinching encouragement
and support in various ways whilst allowing me the room to work in my own way, has inspired
me to become an independent researcher and helped me realize the power of critical
reasoning. Also like to thank him for the moments of laughter and joking and also his worry
when I was sad or sick, proving to be a very human and caring person. Without him this thesis
would not have been completed or written. One simply could not wish for friendlier
supervisor. I am indebted to him more than he knows.
I would like to express my deep gratitude to my co-supervisor Professor Doctor Luís
Passarinha, without him this dream wouldn't be possible. I would like to thank not only for the
guidance of this work and your advices, but also for the trust placed on me. It was during his
classes that my passion for the production area emerged. His involvement with his originality
has triggered and nourished my intellectual maturity that I will benefit from, for a long time
to come. Your passion, enthusiasm and dedication for what he does are unmatched. He is
always ready to help their students and is a very comprehensive person. I am grateful in every
possible way.
I am deeply grateful to a Professor Doctor Filomena Freitas, for this immediate availability to
guide me in this work. I really appreciate the enthusiastic and calm way how she shared her
knowledge, always being willing to fruitful discussions. I still wanted to thank him for his
guidance, constructive criticism, while not having been able to also be my official co-
supervisor. She also demonstrated what a brilliant and hard-working scientist can accomplish.
I wish I had time to learn more from her.
To Universidade da Beira Interior and Professor Doctor João Queiroz, I would like to express
my sincere gratitude for his contribution and availability during my academic course.

viii
I would like to thank Professor Doctor Maria Reis from Faculdade das Ciências e Tecnologia da
Universidade Nova de Lisboa for his contribution and availability in the development of this
research project and for giving me the opportunity of doing the research within the Bioeng
research group.
I am very much thankful to Professors Doctors Fernada Domingues, Candida Tomaz and Fani
Sousa for flexibility and understanding.
I would also like to express my gratitude to all the people involved in Bioeng research group,
in especial Sílvia Antunes, Inês Farinha and Margarida Carvalho for advices and help when I
needed; Catarina Almeida and Mónica Carvalho for helping me with the GC analysis and
patience. I am grateful for all.
I am also grateful to my brother for constitute a true example for a professional level and my
friends for putting up with my bad temper, crying, laughter and happiness over all these
years. Nobody exists truly without friends.
I acknowledge my gratitude to Carlos Branco for his love, care and patient.
Finally and more important for me, I would like thankful to my greatest love, my parents.
Nothing I write can describe what my parents mean to me and how much are important in my
life. I will be eternally grateful for all their sacrifices, patience and support throughout all
the last years. I am deeply appreciative for yours presence during the difficult moments, for
yours advices and encouragement to believe that it is possible to overcome all the challenges.
I love you so much.

ix
RESUMO
Os Polihidroxialcanoatos (PHAs) são biopoliésteres biodegradáveis e termoplásticos
ecológicos, que são acumulados sob a forma de materiais de armazenamento de energia em
várias bactérias em condições de crescimento limitado e fonte de carbono em excesso.
Neste estudo, as bactérias foram isoladas a partir de amostras recolhidas a partir de vários
ecossistemas marinhos no arquipélago da Madeira, no Oceano Atlântico e seleccionadas pela
sua capacidade de acumular poli-hidroxialcanoatos. Estas amostras foram extraídas do fundo
do mar a uma profundidade de 30 e 1,700 metros para se obter uma maior diversidade de
microorganismos e, por conseguinte, numa tentativa de obter novas estruturas de PHAs. As
estirpes foram directamente isoladas de 612 placas mãe onde as amostras marinhas tinham
sido previamente espalhadas. Na totalidade foram isoladas 724 estirpes a partir das placas-
mãe, das quais 174 demonstraram resultado positivo durante o screening com o corante
Vermelho do Nilo. Todas as estirpes com resultado positivo sintetizaram inclusões
intracelulares durante o crescimento em amido como fonte de carbono. Vinte e cinco isolados
bacterianos foram testados em cultura de 25 mL com resultados promissores quanto à
produção de PHA com armazenamento de 17,71 % para a estirpe MD12-107 e 9,30 % para a
estirpe MD12-581. As inclusões foram analisadas através da técnica de cromatografia gasosa
como sendo predominantemente poli-β-hidroxibutirato (PHB). A produção a partir das
estirpes MD12-107 e MD12-581 foi testada em 100 ml e em bioreactor. Os melhores resultados
foram alcançados pela estirpe MD12-581 com um armazenamento de PHA de 15,40% em
menos de 6,5 horas, com 5,5 g/L de concentração de biomassa e uma taxa específica de
crescimento de 0,24 h-1 quando cultivada num meio contendo 40 g/L de amido, 8 g/L de
extracto de levedura e 4 g/L de peptona durante a produção em bioreactor.
Palavras-chave
Polihidroxialcanoatos, biodegradável, bactérias marinhas, vermelho do Nilo, azul do Nilo,
cultura pura.

x

xi
RESUMO ALARGADO
A descoberta e o isolamento de novos compostos a partir de bactérias marinhas sempre foram
estimulados pela indústria farmacêutica em pesquisa de novas entidades químicas. Os
microrganismos isolados são cultivados a fim de extrair os metabólitos secundários, que
geralmente apresentam interesse terapêutico. Com os métodos de extracção normalmente
usados, os compostos de elevado peso molecular, tais como proteínas, polissacáridos ou
poliésteres produzidos pelo microorganismo são normalmente descartados. No entanto, os
biopolímeros, tais como polihidroxialcanoatos (PHAs), produzido por estes microorganismos
apresentam um potencial enorme em termos de aplicações industriais. Com efeito, o PHA é
um poliéster biodegradável e trata-se de um polímero de armazenamento de energia
produzida pelas células em condições de excesso e limitação de nutrientes e que podem ser
usados como materiais termoplásticos e elastómeros. A longo prazo, eles podem substituir os
plásticos comuns, produzidos a partir de derivados de combustíveis fósseis.
O objectivo deste estudo visa um isolamento de bactérias a partir de uma colecção de 612
placas mãe e posterior screening para identificar novas estirpes que apresentam capacidade
para produzir PHA.
A fase inicial deste estudo passou pelo isolamento de bactérias em meio sólido a partir das
placas mãe onde as amostras marinhas tinham sido inicialmente semeadas. O meio utilizado
no isolamento designou-se meio A1 e foi constituído por 10 g/L de amido, 2 g/L de peptona, 4
g/L de extracto de levedura. Foram obtidos 724 isolados que posteriormente foram sujeitos
ao screening com o corante vermelho do Nilo utilizando um meio com condições de excesso
de fonte de carbono e limitação de fonte de azoto, condições ideais para a produção de PHA
pelas bactérias. O Meio utilizado nesta fase designou-se de Meio A2 e foi constituído por 20
g/L de amido, 1 g/L de peptona e 2 g/L de extracto de levedura. Após o meio ser
autoclavado, foi adicionado o corante lipofílico vermelho do Nilo com uma concentração final
de 0.5 µg/mL. Após 72 horas de crescimento, as placas foram visualizadas através de uma
lâmpada azul (Safe ImagerTM, Invitrogen) que possibilitou distinguir claramente as bactérias
produtoras de PHA das bactérias não produtoras.
Após o screening, foram escolhidas 25 bactérias que apresentaram sinal de fluorescência mais
significativo. Como o corante vermelho do Nilo não é específico para o PHA, permitindo
também a coloração de lípidos intracelulares, era necessário conferir que a acumulação de
PHA era responsável pelo sinal de fluorescência, e não a acumulação de lípidos.
Foi feito um crescimento em 25 mL em meio líquido e a produção de PHA foi posteriormente
analisada por cromatografia gasosa. Nesta fase do estudo, foram identificadas duas estirpes:
a Gram-positiva MD12-107 e Gram-negativa MD12-581 como sendo produtoras de maior
percentagem de PHA, com 17,71 % e 9,30 % respectivamente.

xii
Para determinar o máximo de capacidade de acumulação de PHA pelas estirpes MD12-107 e
MD12-581, foi feito um crescimento em 100 mL de meio líquido com a mesma proporção de
fonte de carbono e azoto do passo anterior. Durante o crescimento em 25 mL em meio
líquido, a estirpe MD12-107 revelou-se melhor produtora que a estirpe MD12-581, todavia,
durante o crescimento em 100 mL obteve apenas 2,3 % de PHA após 16 horas de crescimento,
relativamente à estirpe MD12-581 que produziu 11,1 % de PHA em após 26 horas de
crescimento. Nesta fase foram também testados dois meios sintéticos: o meio Marinho
Mineral e meio E suplementado de 40 g/L de glucose. No primeiro caso as bactérias não
apresentaram crescimento significativo e no segundo caso, a inoculação nem sequer foi
possível devido à precipitação de fosfatos quando se adicionou glucose ao meio E.
Numa produção em bioreactor, a estirpe MD12-581 foi testada em meio A2 obtendo 10,23 %
de PHA ao fim de 8 horas de crescimento, com uma taxa específica de crescimento de 0.30 h-
1. Para aumentar a produção de PHA, a proporção de fonte de carbono e azoto foi alterada.
Foram realizados duplicados para a produção das duas estirpes em meio A3 constituído por 40
g/L de amido, 4 g/L de peptona e 8 g/L de extracto de levedura. No caso da produção de PHA
pela estirpe MD12-107, os valores obtidos foram inferiores a 1 % com uma taxa específica de
crescimento de 0,18 h-1 e 0,16 h-1. No caso da produção pela estirpe MD12-581 foi obtido um
valor máximo de 15,40 % de PHA após 6,5 horas de crescimento, com uma taxa específica de
crescimento de 0,24 h-1; e 5,37 % após 7 horas de crescimento, com uma taxa específica de
crescimento de 0,34 h-1.

xiii
ABSTRACT
Polyhydroxyalkanoates (PHAs) are biodegradable polyesters and environmentally friendly
thermoplastics, which are accumulated as carbon and energy storage materials in various
bacteria in limited growth conditions with excess carbon sources.
In this study, bacteria were isolated from samples taken from various marine ecosystems in
the Archipelago of Madeira in the Atlantic Ocean, and screened for their ability to accumulate
polyhydroxyalkanoates. These samples were taken from the seabed at depths of 30 and 1,700
meters to obtain a larger diversity of microorganisms and therefore, in an attempt to obtain
new structures of PHAs. Strains were directly isolated from 612 mother plates where marine
samples had been initially plated. A total of 724 isolates from mother plates were obtained,
of which 174 were found PHA-positive using Nile red viable-colony screening. All synthesized
intracellular inclusions during growth on starch carbon source. Twenty-five bacterial isolates
in 25 mL-scale cultivation were proven promising for PHA production with PHA storage
maximum 17.71 % for MD12-107 and 9.30 % for MD12-581 strain. The inclusions were
predominantly identified as poly-β-hydroxybutyrate (PHB) using gas chromatography. Strains
MD12-107 and MD12-581 were tested in 100 mL-scale and bioreactor cultivation. The best
results were achieved with strain MD12-581 accumulated PHA storage 15.40 % in less than 6.5
hours with 5.5 g/L of cell dry weight and a specific growth rate was 0.24 h-1 when grown in
medium containing 40 g/L of starch, 8 g/L of yeast extract and 4 g/L of peptone during batch
cultivation.
Keywords
Polyhydroxyalkanoates, biodegradable, marine bacteria, Nile red, Nile blue, pure culture.

xiv

xv
Table of Contents
Chapter I - Introduction
1.1. Plastic and Daily Life ................................................................................. 1
1.2. Bioplastics .............................................................................................. 1
1.3. Polyhydroxyalkanoates (PHA): characteristics and advantages .............................. 2
1.4. PHA Extraction, Industrial Production and Applications ....................................... 4
1.5. Strains for PHA production .......................................................................... 6
1.5.1. PHA production by pure cultures ............................................................. 6
1.5.2. PHA production in recombinant Escherichia coli ........................................ 10
1.5.3. PHA synthesis in transgenic plants ......................................................... 11
1.5.4. PHA production by mixed cultures ......................................................... 11
1.6. Bioproduction Process ............................................................................. 12
1.7. Methods for quantification and/or detection of PHA and compositional analysis. ..... 12
Chapter II- Motivation
Chapter III- Materials and methods
3.1. Isolation of microorganisms ....................................................................... 17
3.2. Primary screening of bacterial isolates for PHA production on solid medium ........... 17
3.3. Secondary screening in 25 mL liquid cultivation .............................................. 17
3.4. 100 mL-scale cultivation for growth and PHA determination ............................... 18
3.5 Bioreactor cultivation ............................................................................... 19
3.5.1. Medium preparation .......................................................................... 19
3.5.2. Inocula preparation ........................................................................... 19
3.5.3. Operating conditions ......................................................................... 19
3.2. Analytical Methods ................................................................................. 20
3.2.1. Cell growth ..................................................................................... 20
3.2.2. PHA quantification ............................................................................ 21
3.2.3. Total organic carbon (TOC) ................................................................. 21
3.2.4. Film preparation .............................................................................. 21
3.2.5. Microscopical analysis ........................................................................... 22
3.2.5.1. Routine visualization ....................................................................... 22
3.2.5.2. PHA content visualization ................................................................. 22
3.2.5.3. Gram staining preparations ............................................................... 22
3.2.6. Calculations .................................................................................... 22
Chapter IV- Results and Discussion
4.1. Marine bacterial isolates .......................................................................... 25
4.2. Screening of bacterial isolates for PHA production on solid medium ..................... 26
4.3. Secondary screening in 25 mL liquid cultivation .............................................. 28
4.4. 100 mL-scale cultivation for growth and product determination .......................... 30

xvi
4.5. Bioreactor cultivations ............................................................................ 32
4.5.1. Bioreactor cultivation with Medium A2 ................................................... 32
4.5.1 Bioreactor cultivation with medium A3 .................................................... 34
4.5.1.1. Strain MD12-107: ......................................................................... 34
4.5.1.2. Strain MD12-581 .......................................................................... 36
4.7. PHA film .............................................................................................. 37
Chapter V- Conclusion and future work ................................................................. 39
Chapter VI- Bibliography ................................................................................... 41
Chapter VI- Annexes ......................................................................................... 49
Anexx 1- Colony picking of 612 mother plates. ..................................................... 49
Annex 2- Level intensity with Nile red of strains. .................................................. 77

xvii
List of Figures
Figure 1- Bio-based to biodegradable plastics life cycle (copyright: EBA, 2009). .................. 2
Figure 2- General structure of polyhydroxyalkanoates. R is alkyl groups (Lee, 1996)............. 4
Figure 3- Batch reactor (BioStat® B-Plus, Sartorius) .................................................. 20
Figure 4- Agar plates. Left Mother plate; Right Bacteria isolate. ................................... 25
Figure 5-Fluorescent Nile red staining on agar plates of isolates 1: MD12-006; 2: MD12-581; 3:
MD12-226; 4: MD12-107. ................................................................................... 27
Figure 6- Fresh samples of MD12-107 and MD12-581 strains with Nile blue solution after 72
hours of incubation (1000x); Left: MD12-107; Right: MD12-581. ................................... 29
Figure 7- Growth of strains MD12-107 and MD12-581 in Marine Mineral Medium. ................ 30
Figure 8- Growth of MD-107 on Medium A2 in 100ml-scale cultivation. ........................... 31
Figure 9- Growth of MD-581 on Medium A2 in 100ml-scale cultivation. ........................... 32
Figure 10- Growth of the Gram-negative MD12-581 with Medium A2 in bioreactor, % PHA, OD
and % pO2. ..................................................................................................... 33
Figure 11- Growth of Gram-negative MD12-581 with Medium A2 in Bioreactor. ................. 33
Figure 12- Growth of Gram-positive MD12-107 strain in Bioreactor with Medium A3. OD, % pO2,
% PHA, CDW (g/L) and [Organic Carbon] (ppm). First bioreactor cultivation. .................... 34
Figure 13- Growth of Gram-positive MD12-107 strain in Bioreactor with Medium A3. OD, %
pO2, % PHA, CDW (g/L) and [Organic Carbon] (ppm). Second bioreactor cultivation. .......... 35
Figure 14- Growth of Gram-negative MD12-581 strain in Bioreactor with Medium A3. OD, %
pO2, % PHA, CDW (g/L) and [Organic Carbon] (ppm). First bioreactor cultivation. ............. 36
Figure 15- Growth of Gram-negative MD12-107 strain in Bioreactor with Medium A3. OD, %
pO2, % PHA, CDW (g/L) and [Organic Carbon] (ppm). Second bioreactor cultivation. .......... 36
Figure 16- PHA film produced from MD12-581 biomass. .............................................. 38

xviii
xix
List of Tables
Table 1- Market prices of bio-based polymers and conventional, petroleum-based polymers... 8
Table 2- PHA production using pure microbial cultures grown on refined sugars as substrates
or low-cost carbon feedstocks ............................................................................... 9
Table 3- Constitution of Mineral Marine (Brauman et al, 1971) ..................................... 18
Table 4- Constitution E medium (Adapted from Brandl et al., 1988) .............................. 18
Table 5- Level of fluorescence intensity of 25 selected strains ..................................... 27
Table 6- PHA storage content, %HB, %HV, cell dry weight and level of fluorescence on plates
with Nile Red ................................................................................................. 28

xx
Nomenclature
%PHA – PHA content (% w/w)
CDW – Dry Weight Cell, cell concentration (g/L)
DMSO - dimethylsulfoxide
DOC – Dissolved Oxygen Concentration (pO2 (%))
FTIR - Fourier Transmission Infra Red spectroscopy
GC – gas chromatography
HA – hydroxyalkanoate
HB – hydroxybutyrate
HPLC - High Performance Liquid Chromatography
LDPE - low density polyethylene
MCL – medium-chain length
MMC - microbial mixed cultures
NMR - Nuclear Magnetic Resonance spectroscopy
OD600 – Optical Density at 600 nm
[Organic Carbon]- Organic Carbon concentration (ppm)
PHAs – polyhydroxyalkanoates
PHB – polyhydroxybutyrate
PHH - polyhydroxyhexanoate
P(3HB) – poly(3-hydroxybutyrate)
rpm – rotation per minute
SCL – short-chain length
TOC – total organic carbon
UV – ultraviolet
µ- Specific growth rate (h-1)

xxi


1
Chapter I - Introduction
1.1. Plastic and Daily Life
Plastics have infiltrated every part of daily life and have basically become indispensable.
Because of their versatility and durability, petroleum based plastics have had a variety of
both small and large scale uses for over seventy years now (Keshavarz et al., 2010). While
they are extremely pliable and can be formed into almost any shape including fibers and thin
films, they remain chemically resistant and maintain their durability and strength under a
wide range of temperatures (Andrady, 2009; Reddy et al., 2003).
Despite these valuable characteristics, the drawbacks of plastics have become increasingly
apparent during the last century. First, plastics are derived from crude oil, a non-renewable
energy source that will eventually be depleted. During production, the petroleum-based
plastics emit gases considered to be non-environmentally friendly, negatively affecting the
global climate (Andrady, 2003). Second, the non-biodegradable nature of plastic wastes has
become a cause for environmental concern. These wastes accumulate in landfills and the
marine environment if not incinerated. When incinerated, they emit toxic compounds
(Suriyamongkol et al., 2007; Reddy et al, 2003). For these reasons, there is special interest in
producing plastics from materials able to be eliminated in an “environmentally friendly” way
(Gross and Karla, 2002).
1.2. Bioplastics
Thanks to chemical engineering and biotechnology companies, biodegradable plastics are
being manufactured using renewable resources and their availability is increasing
significantly. For example, starch-based plastics have become an important variety of
bioplastics used in the production of biodegradable products and an increase in plastics
biodegradability would certainly help to alleviate waste problem of our current society (Kim,
2000).
Bioplastics are materials that contain biopolymers in varying percentages and are moldable
when applied with heat and pressure. Therefore, they are a potential alternative option to
the above mentioned conventional petroleum based plastics (Queiroz et al., 2009). Both
polymers produced from renewable biological sources and polymers which are biodegradable
can be classified as bioplastics. Figure 1 illustrates Bio-based to biodegradable plastics life
cycle (Albuquerque, 2009). While some conventional plastics today, such as polyethylene

2
(PE), polyvinyl chloride (PVC) and polyethylene terephthalate (PET) are able to be
manufactured using renewable resources, they remain non-biodegradable, which causes
confusion in the plastic market (Razza et al., 2012; Schut, 2008).
Biopolymers can be classified into three groups as follows: polymers extracted directly from
biomass, having been modified or not, such as starch or cellulose-based polymers; polymers
produced directly by microorganisms in their natural or genetically modified state,
exemplified by polyhydroxyalkanoates (PHAs); and polymers obtained with the utilization of
bio-intermediaries, produced with renewable raw materials. Examples include: polylactic acid
(PLA); bio-polyethylene (BPE), from the polymerization of ethylene produced from bio-
ethanol; bio-nylons via diacids from biomass and bio-polyurethanes, incorporating polyols of
vegetal origin (Albuquerque, 2009; Queiroz et al., 2009; Reddy et al, 2003)
Figure 1- Bio-based to biodegradable plastics life cycle (copyright: EBA, 2009).
1.3. Polyhydroxyalkanoates (PHA): characteristics and
advantages
Biopolymers can be produced by a variety of microorganisms. As mentioned before, bacterial
polyhydroxyalkanoates (PHAs) represent a unique family of polymers acting as a
carbon/energy store for more than 300 species of Gram-positive and Gram-negative bacteria
as well as for a wide range of Archaea (Chansatein et al., 2012; Laycock et al., 2013).

3
PHAs are biopolyesters that generally consist of 3-, 4-, 5-, and 6-hydroxycarboxylic acids. In
the presence of a limited quantity of essential nutrients such as oxygen, phosphorous or
nitrogen, they are synthesized intracellularly as insoluble cytoplasmic inclusions in the
presence of excess carbon. Since they do not substantially alter its osmotic state, these
polymeric materials are able to be stored at high concentrations within the cell (Chansatein
et al., 2012; Laycock et al., 2013; Park et al., 2012). As intracellular granules, these
polymers can accumulate to levels as high as 90 % of the cell dry weight (Reddy et al., 2003).
PHA-producing bacteria have been reported to be found in various environments such as
wastewater, industrial waste, municipal waste, soil, compost, hot spring water, fresh water
and marine water (Chansatein et al., 2012). Utilization of these economically appealing
substrates allows for a sustainable closed cycle process for PHA production and use (Figure 1)
(Satoh et al., 1998; Braunegg et al., 1998; Reis et al., 2006). Additionally, PHAs are non-
toxic, biocompatible, biodegradable thermoplastics, with a high degree of polymerization,
highly crystalline, optically active and isotactic, piezoelectric and insoluble in water (Reddy
et al., 2003).
The first PHA to be identified was poly-3-hydroxybutyrate P(3HB), which showed that could
be cast into a transparent film by forming intracellular granules in Gram-positive bacterium
Bacillus megaterium (Lemoigne, 1926; Laycock et al, 2013; Castilho et al, 2009). This
homopolymer is highly crystalline, between 55–80 %, rendering it brittle and giving it little
strength to withstand impact. These characteristics limit its uses. The glass transition
temperature of P(3HB) is approximately 5ºC and its melting point is approximately 175 ºC
(Reis et al., 2003).
Although over 150 different types of hydroxyalkanoate (HA) monomers synthesized by over
three hundred different bacterial have been identified since the discovery of P(3HB), it
remains the most commonly observed and well-studied PHA (Albuquerque, 2009; Laycock et
al., 2013; Steinbuchel and Valentin, 1995). PHAs are essentially composed of monomers of R-
(-)-3-hydroxyalkanoic acid. The different types of PHAs are distinguishable by chain size, type
of functional group and unsaturated bonds degree (Braunegg et al., 1998; Alves, 2009). Figure
2 represents the general polyhydroxyalkanoate chemical structure.
PHAs are classified into two main groups by their carbon numbers. The two groups with
different material properties are short-chain-length (SCL) and medium-chain-length (MCL)-
PHAs. SCL-PHAs are composed of monomers having 3 to 5 carbon atoms. They are often
crystalline, stiff and brittle in texture and display thermoplastic material properties similar to
polypropylene. MCL-PHAs are composed of monomers having 6 to 14 carbon atoms. They
present lower crystallinity (20-40 %) and have elastic material properties similar to rubber
and elastomer. Recently, PHAs with low density polyethylene (LDPE)-like material properties
have been synthesized by incorporating a small amount of MCL-monomers into the poly-3-

4
hydroxybutyrate backbone (Farinha, 2009; Keshavarz et al. 2010; Lee et al, 1995; Park et al,
2012; Suriyamongkol et al, 2007). The average number of repeating units in each polymer
chain can range between 100 and 30,000, resulting in polymer molar masses ranging from
10,000 to 3x10⁶ Da (Albuquerque, 2009; Cranc and Pattel, 2005; Lee, 1996).
Figure 2- General structure of polyhydroxyalkanoates. R is alkyl groups (Lee, 1996).
Biosynthetic polymers can be produced through microbial or plant route. Currently, microbes
are considered to be the major source for production of PHAs (Steinbüchel et al., 2003),
although they can also be produced in plants (Keshavarz et al., 2010). Production of
bioplastics via microbial route requires technical viability and feasibility for a challenging
production (Keshavarz et al., 2010).
Due to their varied monomer content, PHAs differ in their physical and chemical
characteristics. Types of organisms, media ingredients, fermentation conditions, modes of
fermentation (batch, fed-batch, continuous), and recovery are all factors that affect PHA
monomer content (Keshavarz et al., 2010).
Exposure to soil, compost, or marine sediment can degrade PHAs. Biodegradation depends on
a variety of factors including microbial activity of the environment, the amount of exposed
surface area, temperature, pH, polymer composition, as well as crystallinity (Farinha, 2009;
Reddy et al., 2003). Biodegradation of PHAs under aerobic conditions results in carbon
dioxide and water, while carbon dioxide and methane are produced during degradation in
anaerobic conditions. According to studies, 85 % of PHAs can be degraded in seven weeks
(Farinha, 2009; Reddy et al., 2003).
1.4. PHA Extraction, Industrial Production and Applications
PHA recovery process contributes significantly to the overall production cost, therefore there
is a need to pursuit a simple, low-cost and highly efficient extraction method,
environmentally friendly (Dias et al., 2006). The methods used for cell disruption can be
divided into chemical, enzymatic, and mechanical processes (Dias et al., 2006).

5
There are two commonly employed methods of PHA extraction from bacteria. Using solvents
such as chloroform, methylene chloride, propylene carbonate and dichloroethane, is the most
common method of extraction (Dias et al., 2006). The conventional method is based on the
solubility of PHA in chloroform and insolubility in methanol. Unfortunately, this method is
neither environmentally friendly nor suitable for mass production. The chloroform extraction
method is widely used at the laboratory scale because it allows for high purity without
polymer fractionation of the bioplastic (Dias et al., 2006; Suriyamongkol et al., 2007).
However, it requires a large amount of solvent which makes this method too costly for large
scale processes (Dias et al., 2006). The second method purposely avoids the use of organic
solvents. In this method, bacterial cells are treated with a cocktail of enzymes such as
proteases, nucleases and lysozymes, and detergents to remove proteins, nucleic acids, and
cell walls, while leaving the PHA intact (Suriyamongkol et al., 2007).
Recently, two new methods were discovered during the search for an environmentally
friendly and more cost-efficient extraction. They consist in supercritical CO2 extraction and
non-PHA-selective cell mass dissolution by protons, with PHA crystallization (Dias et al.,
2006). Supercritical CO2 extraction results in higher final purities and a maximum reported
value of 89 % efficiency in polymer recovery due to the removal of lipid impurities, its main
advantage (Dias et al., 2006). The non-PHA-selective cell mass dissolution by protons seems
more cost-effective than conventional chemical treatment methods, with recovery efficiency
and purity of 95 and 97 %, respectively (Dias et al., 2006).
Production of PHAs at an industrial scale has been achieved using pure culture, either of
natural strains such as Alcaligenes latus or Burkholderia sacchari, or recombinant strains of
Escherichia coli and Cupriavidus necator. These strains are currently being used to produce
four commercial brands of PHA: Biomer®
, Nodax®
, Biocycle®
and Mirel®
(for review see
Albuquerque, 2009; Lemos et al., 2006).
PHAs have a large variety of uses including packaging, cosmetic containers, shampoo bottles,
cardboards and papers, milk cartons and films, moisture, barriers in diapers and sanitary
napkins and other personal hygiene materials, pens, combs, bullets, flavor delivery agents in
foods, dairy cream substitutes, and bulk chemical production using depolymerised PHA
(Keshavarz et al., 2010). Recently, medical uses for PHAs have captured a reasonable amount
of attention. These include cardiovascular products, prodrugs, efficacy in nerve and soft
tissue repair, dental and maxillofacial treatment, drug delivery, nutrition, orthopedic and
urology procedures and wound management (Chen, 2010; Keshavarz et al., 2010).

6
1.5. Strains for PHA production
1.5.1. PHA production by pure cultures
Since the 1980’s, a considerable amount of research has been devoted to the development of
pure microbial culture strategies for the production of PHA by microorganisms at an industrial
scale. Approximately 14 companies are currently involved in PHA production with either wild
type PHA producers or genetically modified organisms (Chen, 2009). Although many types of
PHA have been discovered, only a few of these have been able to be produced at large scale
including the homopolymer PHB, copolymer PHB and PHV, and the copolymer of PHB and PHH
(polyhydroxyhexanoate). Generally, PHA production by pure microbial culture is performed in
batch or fed-batch mode, taking anywhere from 38 to 72 hours for fermentation. In order to
attain a high cell density, the microorganisms are pre-cultivated in growth medium. The
accumulation of PHA during this period is typically minimal. Once the growth medium is
depleted, the growth limiting medium is fed to the microorganisms in order to induce and
maximize the PHA content of the biomass (Chen, 2009; Albuquerque, 2009). In other words,
growth limiting conditions are imposed in order to induce PHA storage. Subsequently, the
microbial cells accumulate PHA until saturation is reached and the fermenter is then
discharged. In following, extraction of the intracellular polymer takes place by recovering and
disrupting the cells (Albuquerque, 2009).
In recent years, a considerable effort has been made to develop pure culture fermentation
strategies for more cost-efficient viable PHA production. Research goals were set, attempting
to increase process productivity including maximizing PHA cell content. This in turn increases
fermentation productivity and improves PHA recovery yield while maximizing cell growth and
polymer production rates (Albuquerque, 2009).
PHA production using pure cultures involves a two-stage batch production process. In the first
stage (growth), an inoculum of bacteria is introduced into a sterile solution of trace metal
nutrients and a suitable carbon source (Laycock et al., 2013). In the second stage, an
essential nutrient (such as N, P or O2) is purposely limited so that PHA accumulation can take
place. The properties of the final polymer depend on at least three factors including the mix
of carbon feedstocks fed during accumulation, the metabolic pathways that the bacteria use
for the following conversion into precursors, and the substrate specificities of the enzymes
involved (Laycock et al., 2013).
The most commonly used wild type strain for production of SCL PHA is R. eutropha. In order
to generate PHB or a copolymer of PHB and PHV, this strain is usually fed with glucose or a
mixture of glucose and propionate. The maximum PHA content (% w/w) of R. eutropha can

7
reach 75 % to 80 % of cell dry weight in 48 hours to 60 hours (Chen, 2009). Besides R.
eutropha, Alcaligenes latus is also used for SCL PHA production (Biomer, Germany). A. latus
can accumulate up to 50 % PHB on glucose or sucrose in 18 hours of growth (Yamane et al.,
1996). MCL PHA production by wild type strain on a commercial scale is rare. In addition,
Amerononas hydrophila and Pseudomonas oleovorans have also been used for PHB and PHH
copolymer production. The maximum PHA contents of these two strains were reported as 50 %
and 63 %, respectively (Chen, 2001; Jung, 2001).
Cost analysis of PHA production identified two main factors contributing to high PHA price:
high fermentation operating costs and high downstream processing costs (Castilho et al.,
2009; Choi and Lee, 1997; Povolo and Romanelli, 2012). The major contributor to
fermentation operating costs is the cost of substrate. In almost all instances, substrates used
in current industrial processes are refined sugar feedstocks such as glucose, sucrose, and corn
which have a high market price (Albuquerque, 2009; Lee, 1996; Madison and Huisman, 1999;
Reddy et al., 2003). Compared with the prices of conventional polymers, it is evident that
even the most efficient processes will not allow PHAs to compete with petroleum-based
polymers on the basis of price so long as expensive substrates such as glucose are used, as can
be seen in Table 1 (Castilho et al, 2009). Therefore, it became necessary for
genetic/metabolic engineering strategies for PHA production by bacterial fermentation to
include the ability to use several inexpensive substrates. These have been attempted mostly
at laboratory scale, often with promising results (Albuquerque, 2009; Reddy et al, 2003).
Some of the best results obtained using pure microbial cultures fed with low cost feedstocks
(starch, sugar molasses, tapioca, and whey) are displayed in Table 2 (Albuquerque, 2009).

8
Table 1- Market prices of bio-based polymers and conventional, petroleum-based polymers
Polymer Market
Price
Reference
P(3HB) from Biomer (Germany) €12/kg Hänggi (2004)
P(3HB-co-3HV) from Metabolix (US) €10–12/kg Crank et al. (2004)
Modified starch polymers from Novamont (Italy) €2.5–3.0/kg Crank et al. (2004)
Polypropylene (PP) €0.74/kg CMAI Global (2009)
High-density polyethylene (HDPE) €0.78/kg CMAI Global (2009)
Low-density polyethylene (LDPE) €0.74/kg CMAI Global (2009)
Polyvinyl chloride (PVC) €0.72/kg CMAI Global (2009)
Polystyrene (PS) €0.70/kg CMAI Global (2009)
Polyethyleneterephtalate (PET) €0.81/kg CMAI Global (2008)
Source: adapted from Castilho et al., 2009

9
Table 2- PHA production using pure microbial cultures grown on refined sugars as substrates or low-cost carbon feedstocks
Source: adapted from Albuquerque, 2009.
Feedstock
Microorganism
Fermentation
strategy
CDW
(g/L)
PHA
content
(%)
PHA
composition
Ref R
efi
ned S
ubst
rate
s
Glucose
Cupriavidus
necator
Fed-batch 281 82 PHB Lee et
al.(1999)
Sucrose Alcaligenes
latus
Fed-batch 112 88 PHB Lee et
al.(1999)
Glucose r Escherichia
coli
Fed-batch 204
77 PHB Lee et
al.(1999)
Low
cost
feedst
ocks
Starch Haloferax
mediterranei
Batch 10 60 PHB Lillo et
al.(1990)
Starch Azotobacter
chroococcum
Fed-batch 54 46 PHB Kim(2000)
Molasses Azotobacter
vinelandii
UWD
Fed-batch 33 66 PHB Page et
al.(1993)
Tapioca Cupriavidus
Necator
Fed-batch 106 58 PHB Kim et
al.(1995)
Whey r Escherichia
coli
Fed-batch 31 80 PHB Kim(2000)
Whey r Escherichia
coli
Fed-batch 55 57 PHB Kim(2000)
Whey r Escherichia
coli
Fed-batch 87 80 PHB Lee et
al.(1999)
whey r Escherichia
coli
Fed-batch 83-
150
67-80 PHB Lee et
al.(2000)
Different
vegetable
oils (5g/L)
Cupriavidus
necator
Shake flask 4.4-
5.6
67-80 PHB Lee et
al.(2008)
Different
vegetable
oils (5g/L)
+
Propionic
Acid
Cupriavidus
necator
Shake flask 3.6-
7,5
74-90 P(HB/HV) Lee et
al.(2008)

10
1.5.2. PHA production in recombinant Escherichia coli
In recent years, both genetic engineering and molecular microbiology techniques have
contributed to the enhancement of PHA production in microorganisms. In order to develop
optimal recombinant host strains, several mutants with phenotypes in PHA synthesis were
characterized. However, little difference in polymer accumulation was achieved due to over-
expression of PHA genes in the natural PHA producer. Unfortunately, growth time during
fermentation is lengthy for most natural producers, and extraction of polymers from their
cells is difficult, making these PHA producers unsuitable for biopolymer production on an
industrial scale (Suriymongkol et al, 2007).
Though E. coli does not naturally produce PHA, it is considered to be an appropriate host for
generating higher yields of the biopolymer for several reasons including its fast growth rate,
high productivity, easy lysis, easily manipulated genome, easy scale up, and well understood
genetics and biochemistry. In addition, a wide range of substrates can be used, its PHA
production is not tied to natural regulation, and PHA polymerase is absent (Lee, 1997; Li et
al., 2006; Sudesh et al, 2000; Suriymongkol et al, 2007).
In 1988, PHA genes were introduced into E. coli for the first time and PHB granules were
formed in recombinant E. coli host cells (Slater et al., 1988; Suriymongkol et al., 2007). In
order to enhance PHA synthesis, and produce novel PHA, metabolic engineering is being
intensely explored. By inserting the genes involved in PHA synthesis from different bacteria
into E. coli, it gained the capacity for producing both SCL and MCL PHA. Furthermore, the
PHA degradation genes were not transferred into E. coli (Reddy et al., 2003). E. coli ability
to utilize various carbon sources, including glucose, sucrose, lactose and xylose, further
reducing production cost of PHA by using cheap substrates such as molasses, whey and
hemicellulose hydrolysate (Lee and Chang, 1995; Reddy et al., 2003). This strategy can be
extended to virtually any bacterium if it possesses metabolic advantages over those currently
in use (Reddy et al., 2003). The maximum PHA content from the recombinant E. coli
harboring R. eutropha PHA synthesis gene reached up to 90 % of the cell dry weight (Lee and
Choi, 1998).

11
1.5.3. PHA synthesis in transgenic plants
In comparison with bacteria or yeast, crop plants are capable of producing large amounts of a
variety of useful chemicals at low cost. In comparison, PHA production in bacteria or yeasts
has a costly fermentation process because it requires growth under sterile condition with an
external energy source such as electricity (Reddy et al., 2003; Snell and Peoples, 2002). In
contrast, PHA production in plant systems is considerably less expensive because the system
only relies on water, soil nutrients, atmospheric CO2 and sunlight. The cost of producing
starch and sugar in plants is less than the cost of commodity plastics, so it may be possible to
produce PHA at a similar low cost. Unlike the bacterial cell, the plant cell has different
subcellular compartments in which PHA synthesis can be metabolically localized (Hanley et
al, 2000; Moire et al, 2003). Plants use photosynthetically fixed CO2 and water to generate
the bioplastic, which after disposal is degraded back to CO2 and water, which makes a plant
production system much more environmentally friendly. Synthesis of PHAs in crops is also an
excellent way of increasing the value of the crops (Reddy et al., 2003; Somerville and
Bonetta, 2001). However, the production of PHA in transgenic plants presents barriers
associated with the expression of transgenes and metabolic load on plant growth and the
constitutive expression of PHA synthesis genes is still a crucial obstacle (Suriyamongkol et al.,
2007).
1.5.4. PHA production by mixed cultures
One proposed way of lowering production costs is PHA production by microbial mixed cultures
(MMC) (Dias et al, 2006; Serafim et al, 2008). Costs are reduced by using low value
substrates, such as waste or surplus feedstocks, and by eliminating the necessity of reactor
sterilization since the culture is able to adapt to various complex waste feedstocks, which
reduces fermentation equipment costs (Albuquerque, 2009; Dias et al, 2006; Kim, 2000;
Laycock et al, 2013; Reddy et al., 2003; Serafim et al, 2008). Another advantage of MMC
processes is based on the fact that these cultures can use a wide variety of complex
substrates, even substrates which are rich in nutrients, since PHA storage by mixed culture is
not induced by nutrient limitation (Albuquerque, 2009). Mixed cultures are composed of
microbial populations of unknown composition, selected by the operational conditions
imposed on the open biological system (Albuquerque, 2009).
PHA storage in mixed microbial cultures takes place in systems where the substrate is not
continuously available to the microorganisms or in systems where electron donor and
acceptor availability are interrupted (Reis et al., 2003). In the case where the substrate is not
continuously available to the microorganism, the culture is subjected to a transient carbon
supply. Unbalanced growth occurs under these conditions as the sludge is subjected to

12
consecutive periods of external substrate accessibility (feast) and unavailability (famine).
During the famine phase, the carbon uptake is mainly driven to PHA storage and, to a lesser
extent, to biomass growth. Following substrate exhaustion, the stored polymer becomes an
accessible source of energy and carbon. The ability to internally store carbon gives these
microorganisms a competitive advantage over those that do not have this capacity. Due to
this quality, they have become predominant in the system. This enrichment strategy is known
as aerobic dynamic feeding (ADF) or feast and famine (Reis et al., 2003; Serafim et al., 2004).
1.6. Bioproduction Process
Currently, there are four methods of producing PHAs: in vitro, via PHA-polymerase catalyzed
polymerization; and in vivo with batch, fed-batch and continuous cultures (Zinn et al., 2001).
The synthesis of PHA in vivo has been and is still being investigated using batch cultures
because batch cultures are easy to handle, and they are suited for growth studies and
screenings for potential PHA accumulating organisms. Typically, the medium is designed in
such a way that one nutrient limits growth of biomass whiles other nutrients, including the
carbon source, are in excess. The experiments are performed within 1-2 days, during which
time the cells undergo a progression of growth stages (Zinn et al, 2001). Simultaneously, the
cells perceive continuous changes of their environment due to constant change in nutrient
concentration caused by the cell metabolism. This method seldom gives an accurate
indication of the maximum capacity of the cells to accumulate PHA since cells starved for
carbon degrade PHA again (Zinn et al., 2001).
1.7. Methods for quantification and/or detection of PHA and
compositional analysis.
Several techniques are appropriate to detect organisms that are able to synthesize PHA and
determine PHA inside intact cells. The lipophilic dyes Sudan black, Nile blue and Nile red are
used to stain colonies and to distinguish between PHA-accumulating and non-accumulating
strains (Amara, 2008; Spiekermann et al., 1999).
Using Nile blue and Nile red allows for a more specific and sensitive visualization of PHA
granules (Serafim et al., 2002). The Nile blue and Nile red are able to penetrate the
membrane and stain biopolymer granules in live cells, allowing for the identification of PHA
producing bacteria using fluorescence. However, they cannot identify the monomer
composition of PHA produced (Spiekermann et al., 1999). The Nile blue is soluble in water

13
and ethanol while Nile Red has low solubility in water, though it dissolves in most organic
solvents (Ostle and Holt, 1982; Greenspan et al., 1985).
Of these screening techniques for isolating potential PHA-producing strains from
environmental samples, Nile red fluorescence offers an easy, rapid screening option (Berlanga
et al., 2006). The Nile red is introduced directly in the agar medium, resulting in fluorescent
colonies of PHA-positive strains that can be observed by UV illumination omitting the
microscopic observation step (Tanamool et al., 2011).
Neither the growth of the bacteria nor PHA production was affected by the presence of the
solvents and Nile red or Nile blue dyes (Spiekermann et al., 1999).
Gas Chromatographic (GC) analysis of PHA offers measurable information about the total
number and concentration of monomers present in the PHA. When used in addition with Mass
Spectroscopy, information about the mass and identity of the monomer involved is also
obtained (Lee et al., 1997). This method involves simultaneous extraction and methanolysis
of PHA, in mild acid or alkaline conditions, to form hydroxyalkanoate methyl esters which are
then analyzed by GC (Reetha, 2008). This method can handle small quantities of samples and
can be described as rapid, sensitive, and reproducible (Reetha, 2008).
Other methods of analyzing PHA include High Performance Liquid Chromatography (HPLC),
Nuclear Magnetic Ressonance spectroscopy (NMR) and Fourier Transmission Infra Red
spectroscopy (FTIR) (Reetha, 2008).

14

15
Chapter II- Motivation
Synthetic plastics have become one of the most utilized materials over many years because of
their versatility and outstanding technical properties including high chemical resistance and
elasticity as well as their relatively low production cost, however there has been an
increasing concern for the environment over the harmful effects of petrochemical-derived
plastic materials, especially because they are not biologically degraded (Zinn et al., 2001;
Reddy et al., 2003).
Polyhydroxyalkanoates (PHAs) are polyesters synthesized by a number of microorganisms as
an energy reserve material, particularly in the presence of excess carbon and an essential
nutrient such as nitrogen or phosphorous is limited (Laycock et al., 2013). PHAs possess
properties similar to currently used synthetic thermoplastics and elastomers making them
strong candidates for biodegradable polymer material. Upon disposal, they are completely
degraded to water and carbon by microorganisms in various environments such as soil, sea
and lake water (Lee, 1996).
The objective of this study was to screen for strains with capability of producing innovative
PHAs. Although many bacteria can produce PHA when supplied with the suitable growth
conditions and carbon substrates, not all bacteria can yield a high production level of PHA.
The selection of the best producers was made and optimization of PHA production by the
selected microorganisms was performed.

16

17
Chapter III- Materials and methods
3.1. Isolation of microorganisms
In this study, bacteria were isolated from samples taken from various marine ecosystems in
the Archipelago of Madeira in the Atlantic Ocean, obtained through the Ocean Treasures
project. Strains were directly isolated from 1,918 mother plates where marine samples had
been initially plated.
The composition of the agar medium used for isolation of the microorganisms was named A1
and contained the following compounds: 10 g/L of starch, 4 g/L of yeast extract, 2 g/L of
peptone, 18 g/L of Agar, 750 ml of filtered sea water and 250 ml of Milli Q water. To ensure
sterility and total dissolution, the medium was autoclaved at 121ºC for 20 minutes before
using. The plates were prepared in a laminar flow chamber to ensure total sterility and
prevent contamination of the plates.
3.2. Primary screening of bacterial isolates for PHA production
on solid medium
In order to evaluate the PHA content in cells, the lipophilic dye Nile Red was added directly
to the agar medium to a final concentration of 0.5 µg/mL was used. A solution of 5 mg Nile
red per 10 mL dimethylsulfoxide (DMSO) was prepared previously.
Medium A2 used for screening of the PHA-producing microorganisms contained the following
compounds: 20 g/L of starch, 2 g/L of yeast extract, 1 g/L of peptone, 18 g/L of Agar, 750 ml
of filtered sea water and 250 mL of Milli Q water. The medium was autoclaved at 121 ºC for
20 minutes after 500 µL of Nile red solution was added separately to the sterilized medium.
Previously isolated colonies were spread on the agar plates. After growth during 72 hours at
room temperature, plates were exposed to Blue Light Transilluminator (Safe ImagerTM,
Invitrogen) and PHA positive isolates were seen as orange/yellow fluorescent colonies.
3.3. Secondary screening in 25 mL liquid cultivation
To confirm the production of PHA, the 25 bacteria presenting a fluorescence signal with the
highest intensity were selected and grown in liquid medium. The 25 PHA positive bacteria
isolates were grown in 250 mL Erlenmeyer flasks containing 25 mL of the Medium A2 (without

18
agar). One isolated colony from agar plates was used to inoculate. The inocula were
incubated at 28 ºC and 200 rpm. After 120 hours, the bacterial cells were harvested. The
biomass was analyzed for PHA content.
3.4. 100 mL-scale cultivation for growth and PHA determination
The 2 strains with the highest PHA content obtained during 25 mL liquid culture were grown
in 100 mL liquid culture to determine better growth parameters. Three media were tested:
Medium A2, medium E (adapted from Brandl et al., 1988) supplemented with glucose and
Mineral Marine Medium (Brauman et al, 1971). Solutions 1 and 2 were autoclaved separately
at 121 ºC for 20 minutes.
Table 3- Constitution of Mineral Marine (Brauman et al, 1971)
Mineral Marine medium g/L
Solution 1 NaCl,
MgSO4.7H2O;
KCl;
CaCl2.2H2O;
C4H11NO3;
NH4Cl
K2HPO4.3H2O
FeSo4.7H2O.
11.7
12.3
0.75
1.47
6.05
6.65
0.062
0.026
Solution 2 Starch 20
Table 4- Constitution E medium (Adapted from Brandl et al., 1988)
Mineral Marine medium g/L
Solution 1 (NH4)2HPO4
K2HPO4
KH2PO4;
MgSO4
Micronutrient
3.3
5.8
3.7
10 ml
1 ml
Solution 2 Glucose 20
Inocula were prepared in 25 mL of respective medium using one isolated colony from agar
plates and incubated for 17 hours at 28 ºC and 200 rpm. 25 mL of inocula in exponential
phase (with 17 hours of incubation time) were added to 100 mL of fresh medium. Cultures
were performed in 250 mL shake flasks without pH control at 28 ºC and 200 rpm. The assays
were run for 46 hours. 2 mL samples were taken periodically. Optical density was monitored
immediately and 1 mL samples were frozen at -20 ºC for further PHA quantification.

19
3.5 Bioreactor cultivation
3.5.1. Medium preparation
The medium used for inocula preparation in the batch reactor was named A3 and contained
the following compounds: 40 g/L of starch, 8 g/L of yeast extract, 4 g/L of peptone, 750 mL
of filtered sea water and 250 mL of Milli Q water. The medium was autoclaved at 121 ºC for
30 minutes. The Medium A2 was also tested.
3.5.2. Inocula preparation
One isolated colony from agar plate was used to inoculate 100 mL of medium in a 1 L shake
flask. The inocula were incubated 24 hours at 28 ºC and 200 rpm.
3.5.3. Operating conditions
This assay was performed in a 2 L reactor (BioStat® B-Plus, Sartorius) with 2 L of working
volume where sterile conditions were maintained (Figure 3). The reactor was operated at 28
ºC. pH was maintained at 7.0±0.05 by automatic addition of 2M HCl and 2M NaOH. The
dissolved oxygen inside the bioreactor was maintained above 30 % by manually increasing the
agitation speed from 400 rpm to 900 rpm. Air flow rate was maintained at 1 vvm. Foam
formation was suppressed by addition of an Antifoam solution (BDH Prolabo – VWR).
100 mL of inoculum in the exponential phase were used to inoculate the bioreactor. 10 mL
samples were taken periodically during approximately 12 hours. OD at 600 nm was monitored
immediately after sampling. Samples were frozen for further analysis of biomass production,
PHB content and total organic carbon quantification.

20
Figure 3- Batch reactor (BioStat® B-Plus, Sartorius)
3.2. Analytical Methods
3.2.1. Cell growth
Cell growth was monitored by measuring the optical density of 1 mL of sample, at 600 nm
(OD600) with a spectrophotometer (Elios α, ThermoSpectronic).
For cell dry weight determination, biomass was collected from 10 or 25 ml of culture broth by
centrifugation at 10,000 rpm for 10 minutes. The supernatant was collected for further
analysis (see 2.2.3). The pellet was resuspended in 10 or 25 mL of NaCl 0.9 % (w/v) and
centrifuged again (10,000 rpm for 10 minutes). After centrifugation, the supernatant was
discarded and the pellets were frozen in liquid nitrogen before being lyophilized (Telstar,
Cryodos) for 20 hours, at approximately -50 ºC and 0.07 mbar. Cell dry weight (CDW) was
defined by the dry weight of cells per L of culture broth.
(Equation 1):
(1)
Where m is the mass of the biomass lyophilized (g) and V is the volume of culture (L).

21
3.2.2. PHA quantification
PHAs were determined by gas chromatography (GC) using a method adapted from Serafim et
al., 2004. After lyophilization, 2-4 mg of biomass was resuspended in 1 mL of a solution of
methanol with 20 % sulfuric acid and 1 mL of chloroform containing 0.88 mg/ml of
heptadecane (internal standard) to dissolve walls and extract PHA granules. Samples were
digested in a thermoblock (AccuBlockTM, Labnet) for 3.5 hours at 100 ºC. After cooling, 1 mL
of distilled water was added. Samples were shaken for 1 minute in vortex. Chloroform phase
contains the dissolved PHA was extracted and transferred to a 2 mL vial (0.3nm, Merck) with
molecular sieves to remove traces of water. 2 µL of sample were injected in a gas
chromatographer equipped with a flame ionization detector (Bruker 430-GC) and a BR-SWax
column (60 m, 0.53 mm internal diameter, 1 µm film thickness, Bruker, USA), using helium as
carrier gas at 1.0 mL/min. Samples were analyzed under a temperature regime starting at 40
ºC, increasing to 100 ºC at a rate of 20 ºC/min, to 175 ºC at a rate of 3 ºC/min and reaching
a final temperature of 220 ºC at a rate of 20 ºC / min for ensuring cleaning of the column
after each injection. Injector and detector temperatures were 280 ºC and 230 ºC,
respectively. Hydroxybutyrate (HB) and hydroxyvalerate (HV) concentrations were
determined through the use of two calibration curves, one for HB and other for HV, using
standards (0.1-10 g L-1) of a commercial co-polymer P(HB-HV) (88 %/12 %) (Sigma), and
corrected using heptadecane as internal standard (concentration of approximately 1 g L-
1).Standards were processed in the same way as the samples.
3.2.3. Total organic carbon (TOC)
Total Organic Carbon was determined using a Shimadzu TOC automatic analyzer. Calibration
curves in the range of 1 to 500 ppm were obtained with potassium hydrogen phthalate
standards for total carbon and with sodium hydrogen carbonate standards and sodium
carbonate standard for inorganic carbon. For the analysis, liquid samples were unfrozen, and
5 ml of sample was diluted to 5 mL with milliQ water.
3.2.4. Film preparation
Extraction of PHB from the biomass with chloroform is described in Fiorence et al., 2009 with
modifications. 4 g of lyophilized biomass was heated in 200 mL of chloroform to a
temperature of 65 ºC, under constant stirring, for 2 hours. Then, the cell debris was
separated by centrifugation at 8,000 rpm for 20 min at room temperature. The polymer was
recovered by solvent evaporation.

22
3.2.5. Microscopical analysis
3.2.5.1. Routine visualization
For microscopic visualization of fresh samples, a few drops of culture were put in a slide and
observed under a microscope in phase contrast (Olympus BX51).
3.2.5.2. PHA content visualization
For visualization of the samples, 1 ml of culture broth was centrifuged at 8,000 rpm for 10
minutes and the supernatant was discarded. Then the pellet was resuspended in 1 mL of sea
water and centrifuged again (8,000 rpm for 10 minutes). After centrifugation, the
supernatant was discarded and it was added 50 μL of Nile blue solution and 500 μL of sea
water was added to the pellet. This pellet was incubated at 40 ºC for 15 minutes for the
purpose of cell immobilization. 20 μL were put in a slide and were observed in the same
microscope using fluorescent lighting.
3.2.5.3. Gram staining preparations
To know if the samples are gram-positive or gram-negative, a thin smear of the culture was
prepared on a glass slide and heat fixed. Primary crystal violet was added for 1 minute.
Excess stain was washed off with distilled water. Lugol solution was added for 1 minute. The
smear was then rinsed with water and ethanol. The secondary stain, Safranin, was added for
30 seconds. The slide was then washed with water and observed under a light microscope
(Olympus BX51).
3.2.6. Calculations
The proportion of PHA monomers was calculated as a percentage of the total polymer
produced on a Cmmol.
Assuming that the isolated PHA is a P(HB-co-HV) polymer, the PHA content (% PHA) was
determined by Equation 1:
(1)
The PHA content (%PHA) was determined by the Equation 2

23
(2)
Where mPHA is the amount of PHA (mg) and mcells (mg) is the amount of liophylized
biomass in sample.
The specific growth rate (µ) was determined by the equation 3:
(3)
Where X represents the concentration in biomass during time.

24

25
Chapter IV- Results and Discussion
4.1. Marine bacterial isolates
It is evident from various studies (Shrivastav et al., Quillaguamán et al., 2010) that marine
environments can be an excellent source of PHA producing bacteria. However, despite the
remarkable potential of the marine ecosystems to provide new and interesting strains for the
production of polymers, there are only a limited number of marine bacteria with such
characteristics (Quillaguamán et al. 2010).
In the present study, bacteria were isolated from samples taken from various marine
ecosystems in the Archipelago of Madeira in the Atlantic Ocean. These samples were taken
from the seabed at depths of 30 and 1,700 meters to obtain a larger diversity of
microorganisms in an attempt to obtain new microorganisms and possibly new structures of
PHAs.
A total of 724 strains were isolated from 612 mother plates where marine samples had been
initially plated. All of the strains were successfully grown and pure colonies show different
characteristics in morphologies and sizes (see Appendix I). Figure 4 illustrates an example of a
mother plate with various colonies and an example with bacteria isolate with one single
strain.
Figure 4- Agar plates. Left Mother plate; Right Bacteria isolate.

26
4.2. Screening of bacterial isolates for PHA production on solid
medium
The production of PHA by microorganisms depends on the cultivation conditions including
substrates and supplements provided. For regulation of their metabolism and for starting the
process of carbon uptake and carbon accumulation in the form of granules as an energy
reserve, the limitation of an essential nutrient as well as an excess of carbon in the
environment in which they develop is necessary (Luengo et al., 2003).
Nile Red was used during this work to develop a simple and highly sensitive staining method
to detect PHAs directly in growing bacterial colonies (Spiekermann et al., 1999). It is known
that the Nile Red stain emits strong positive orange/yellow fluorescence signals only when it
is linked to hydrophobic compounds like PHAs and lipids (Desouky et al., 2007).
During growth, the Nile red diffuses into the cytoplasm and subsequently into the PHA
inclusions, colonies of PHA-accumulating strains should fluorescence when the cells were
cultivated under conditions permitting PHA accumulation, so, the direct addition of this dye
to the medium provides a tool to discriminate between PHA-negative and PHA-positive strains
without killing the cells (Spiekermann et al., 1999).
The medium used at this stage contained 20 g/L of starch, 2 g/L of yeast extract and 1 g/L of
peptone. The lipophilic dye Nile Red was added directly to the agar medium to a final
concentration of 0.5 µg/mL (Shrivatav et al., 2010; Spiekermann et al., 1999).
The 724 isolated strains previously obtained were grown on agar plates containing Nile Red
and incubated for 72 hours, time long enough to permit PHA accumulation but avoid PHA
reutilization by the cells.
A total of 174 isolate strains from the 724 tested were found to emit a strong orange/yellow
fluorescence under Blue Light after growth of 72 hours, suggesting the accumulation of
polymer through the lipophilic dye Nile red (see Appendix II). Almost 75% of the isolated
strains did not present any fluorescence.
Fluorescence signal was evaluated macroscopically as followed:
(+ + +) intense orange fluorescence;
(+ +) bright yellow fluorescence;
(+) yellow fluorescence and
(-) no fluorescence.

27
Table 5- Level of fluorescence intensity of 25 selected strains
Bacteria with the most intense fluorescence signal were selected for further studies. Table 5
shows the fluorescence intensity of the 25 strains presenting the strongest fluorescence
signal. Figure 5 shows the fluorescence signal emitted by four selected strains.
Figure 5-Fluorescent Nile red staining on agar plates of isolates 1: MD12-006; 2: MD12-581; 3: MD12-226; 4: MD12-107.
Colonies of PHA-positive strains of MD12-581(+), MD12-107(+ +), MD12-226(+ + +) exhibited a
strong fluorescence, whereas the MD12-006 corresponded to a PHA-negative strain without
any fluorescence. Isolated colonies of PHA-positive and PHA-negative strains located on the
same agar plate were this way clearly distinguished.
Strain Intensity level Strain Intensity level
MD12-071 ++ MD12-581 +
MD12-103 ++ MD12-582 +
MD12-107 ++ MD12-017 +
MD12-125 ++ MD12-018 +
MD12-222 ++ MD12-020 +
MD12-226 +++ MD12-025 +
MD12-398 ++ MD12-028 +
MD12-511 ++ MD12-030 +
MD12-115 + MD12-033 +
MD12-117 + MD12-034 +
MD12-575 ++ MD12-037 +
MD12-337 ++ MD12-038 +
MD12-580 + MD12-006 -
3
4
2
1
28
As Nile red staining is not specific to PHA but could also bind to hydrophobic polymers such as
lipids, and therefore to confirm the content of PHA, these 25 strains were grown in liquid
medium for further analysis of PHA content via GC analysis.
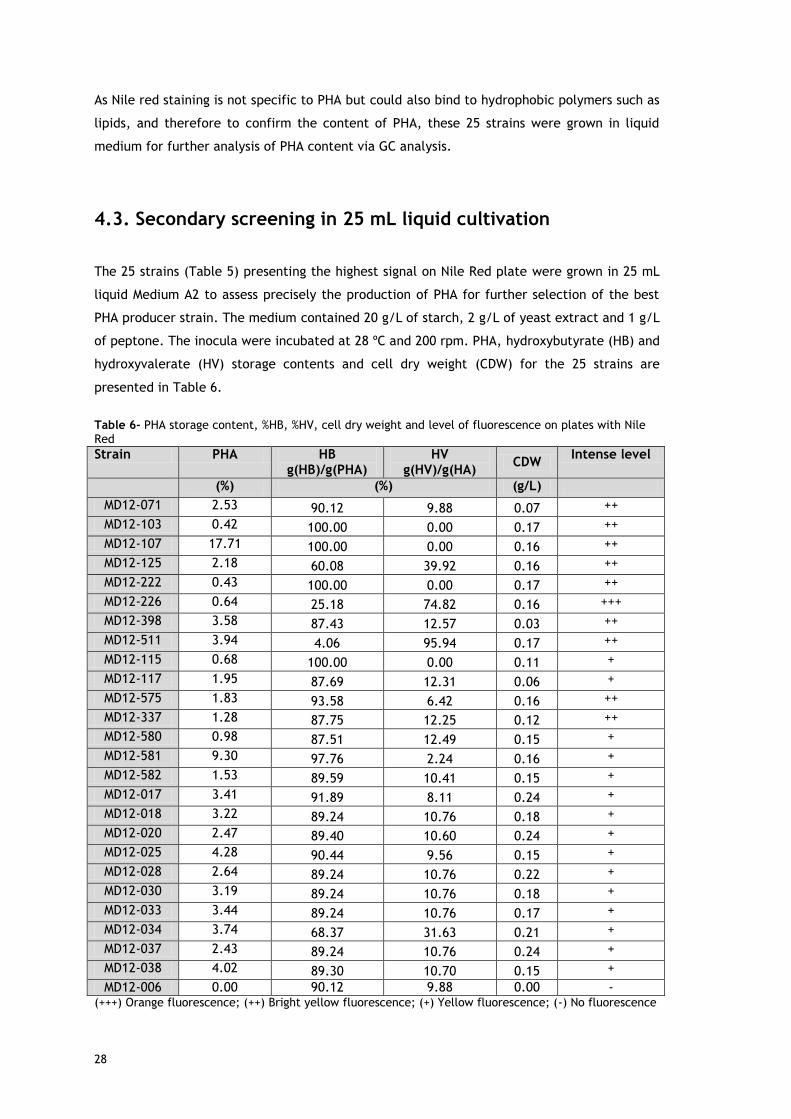
4.3. Secondary screening in 25 mL liquid cultivation
The 25 strains (Table 5) presenting the highest signal on Nile Red plate were grown in 25 mL
liquid Medium A2 to assess precisely the production of PHA for further selection of the best
PHA producer strain. The medium contained 20 g/L of starch, 2 g/L of yeast extract and 1 g/L
of peptone. The inocula were incubated at 28 ºC and 200 rpm. PHA, hydroxybutyrate (HB) and
hydroxyvalerate (HV) storage contents and cell dry weight (CDW) for the 25 strains are
presented in Table 6.
Table 6- PHA storage content, %HB, %HV, cell dry weight and level of fluorescence on plates with Nile Red
Strain PHA HB g(HB)/g(PHA)
HV g(HV)/g(HA)
CDW Intense level
(%) (%) (g/L)
MD12-071 2.53 90.12 9.88 0.07 ++
MD12-103 0.42 100.00 0.00 0.17 ++
MD12-107 17.71 100.00 0.00 0.16 ++
MD12-125 2.18 60.08 39.92 0.16 ++
MD12-222 0.43 100.00 0.00 0.17 ++
MD12-226 0.64 25.18 74.82 0.16 +++
MD12-398 3.58 87.43 12.57 0.03 ++
MD12-511 3.94 4.06 95.94 0.17 ++
MD12-115 0.68 100.00 0.00 0.11 +
MD12-117 1.95 87.69 12.31 0.06 +
MD12-575 1.83 93.58 6.42 0.16 ++
MD12-337 1.28 87.75 12.25 0.12 ++
MD12-580 0.98 87.51 12.49 0.15 +
MD12-581 9.30 97.76 2.24 0.16 +
MD12-582 1.53 89.59 10.41 0.15 +
MD12-017 3.41 91.89 8.11 0.24 +
MD12-018 3.22 89.24 10.76 0.18 +
MD12-020 2.47 89.40 10.60 0.24 +
MD12-025 4.28 90.44 9.56 0.15 +
MD12-028 2.64 89.24 10.76 0.22 +
MD12-030 3.19 89.24 10.76 0.18 +
MD12-033 3.44 89.24 10.76 0.17 +
MD12-034 3.74 68.37 31.63 0.21 +
MD12-037 2.43 89.24 10.76 0.24 +
MD12-038 4.02 89.30 10.70 0.15 +
MD12-006 0.00 90.12 9.88 0.00 - (+++) Orange fluorescence; (++) Bright yellow fluorescence; (+) Yellow fluorescence; (-) No fluorescence

29
The results obtained showed that all 25 strains selected, were able to produce PHA. MD12-107
strain was considered the best PHB producer, because it accumulated up to 17.71 % PHA
content, in agreement with its bright yellow fluorescence (see Figure 5) signal, indicating PHA
accumulation during growth on plates. However, biomass production was quite low, below
0.24 g/L.
Although it presented a weak positive fluorescence signal, the MD12-581 strain still produced
9.3% PHA (Figure 5). Similarly, although strain MD12-103 presented a bright yellow
fluorescent colonies with Nile red (+ + +), it had the lowest PHA content with only 0.42 %,
Besides, the strain MD12- 226 showed high positive fluorescence signal (Figure 5), but was a
weak producer PHA with only 0.64 % PHA content.
In conclusion, Nile red screening cannot be directly correlated to PHA content as a strong
fluorescence signal does not correspond necessarily to a high percentage of PHA within the
bacteria. It estimates only the level of hydrophobic compounds whether PHA or other types of
lipids (Doan and Obbard, 2011).
To confirm that the MD12-006 strain was PHA-negative, the strain was included in the 25 mL
liquid culture screening. As expected, this strain did not accumulate PHA (proving to be a
true negative).
The 2 best PHA-producers strains were further tested with Nile blue. Nile blue is another
lipophilic dye used to stain colonies and to distinguish between PHA-accumulating and non-
accumulating strains (Spiekermann et al., 1999). This way, it is possible to observe the PHA
accumulation by fluorescence microscopy (Ostle and Holt, 1982). 1 ml of culture broth with
50 μL of Nile blue solution was used. Figure 6 illustrates the florescence obtained after
staining with Nile blue with MD12-107 and MD12- 581 strains, showing clearly accumulation of
PHA granules.
Figure 6- Fresh samples of MD12-107 and MD12-581 strains with Nile blue solution after 72 hours of incubation (1000x); Left: MD12-107; Right: MD12-581.

30
Based on these results, the strains selected for further optimization were strains MD12-107
and MD12-581. However, one cannot despise the remaining 149 strains that were not tested
because, although they showed no intense fluorescence signal, they might still be able
produce high percentage of PHA.
4.4. 100 mL-scale cultivation for growth and product
determination
In order to determine better the maximum PHA storage capacity of strains MD-107 and MD-
581, cells were grown still in medium A2 but in a 100 mL-scale cultivation. Inocula were
prepared in 25 mL of 20 g/L of starch, 2 g/L of yeast extract and 1 g/L of peptone and
incubated for 17 hours at 28 ºC and 200 rpm.
The medium used in the present work is composed of sea water (75 % per Liter) with a salinity
of about 3.5 % (Stanley and Morita, 1965). However, variation in sea water composition could
interfere with reproducibility of experiments. In order to insure reproducibility, two media of
known composition were tested: Marine Mineral medium (Baumam et al., 1971) and the E
medium (Adapted from Brandl et al., 1988) (with 75 % seawater) supplemented with glucose.
Figure 7- Growth of strains MD12-107 and MD12-581 in Marine Mineral Medium.
The synthetic Marine Mineral medium has a defined composition substituting seawater. This
medium was constituted with 11.7 g/L of NaCl, 12.3 g/L of MgSO4.7H2O; 0.75 g/L of KCl; 1.47
g/L of CaCl2.2H2O; 6.05 g/L of C4H11NO3; 6.65 g/L of NH4Cl; 0.062 g/L of K2HPO4.3H2O and
0.026 g/L of FeSo4.7H2O. Figure 7 illustrates the growth of MD12-107 and MD12-581 on Mineral
Marine medium. Bacteria showed very slow growth with very low biomass production with a
maximum OD of 0.210 after 72 hours.
31
As previously mentioned, the environment where strain growth has been performed was a
starch carbon source. Starch is a low cost carbon source available in large quantities (Kim,
2000). It has become of interest to use less expensive substrates as an alternative to glucose
in PHA production (Song et al., 2012) but a traditional and commonly used substrate for
bacterial production of PHAs is glucose (Lee, 1996). A medium with 20 g/L of glucose; 3.3 g
of (NH4)2HPO4; 5.8 g of K2HPO4; 3.7 of g KH2PO4; 10 mL of MgSO4 and 1 mL of micronutrient
was tested. However, when glucose was added to the medium E, phosphates precipitated due
to the high salt concentration of seawater, turning the cultivation impossible.
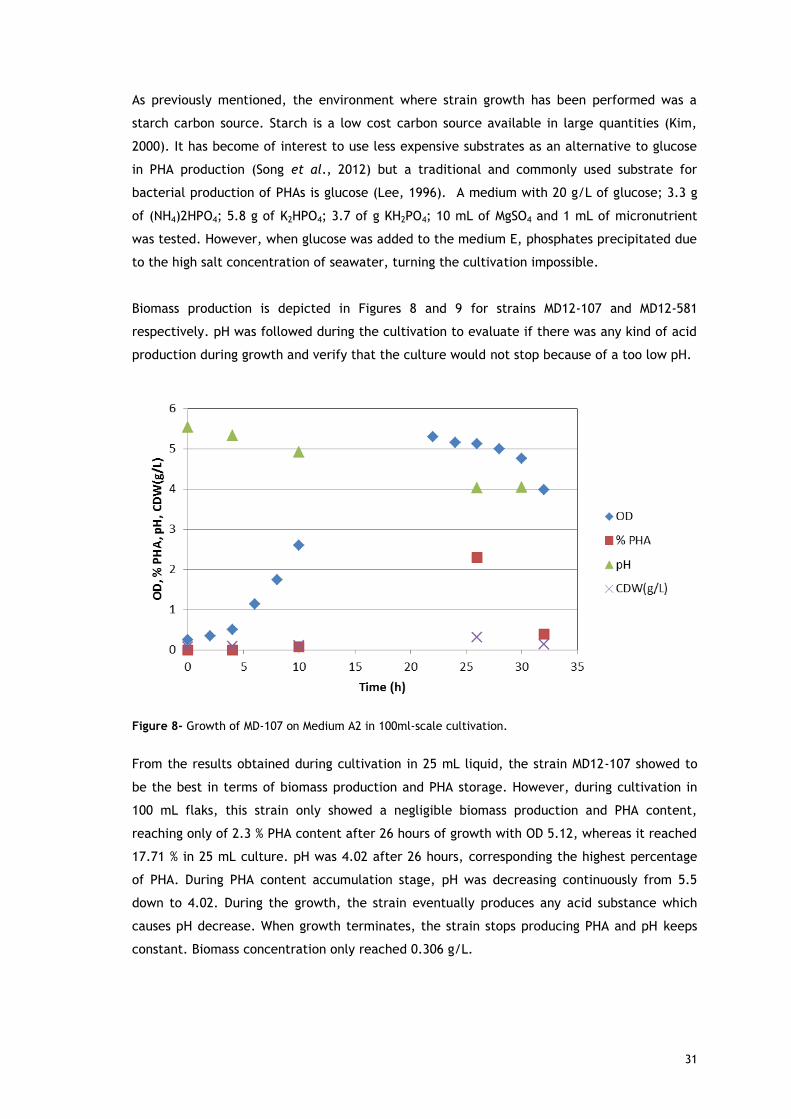
Biomass production is depicted in Figures 8 and 9 for strains MD12-107 and MD12-581
respectively. pH was followed during the cultivation to evaluate if there was any kind of acid
production during growth and verify that the culture would not stop because of a too low pH.
Figure 8- Growth of MD-107 on Medium A2 in 100ml-scale cultivation.
From the results obtained during cultivation in 25 mL liquid, the strain MD12-107 showed to
be the best in terms of biomass production and PHA storage. However, during cultivation in
100 mL flaks, this strain only showed a negligible biomass production and PHA content,
reaching only of 2.3 % PHA content after 26 hours of growth with OD 5.12, whereas it reached
17.71 % in 25 mL culture. pH was 4.02 after 26 hours, corresponding the highest percentage
of PHA. During PHA content accumulation stage, pH was decreasing continuously from 5.5
down to 4.02. During the growth, the strain eventually produces any acid substance which
causes pH decrease. When growth terminates, the strain stops producing PHA and pH keeps
constant. Biomass concentration only reached 0.306 g/L.
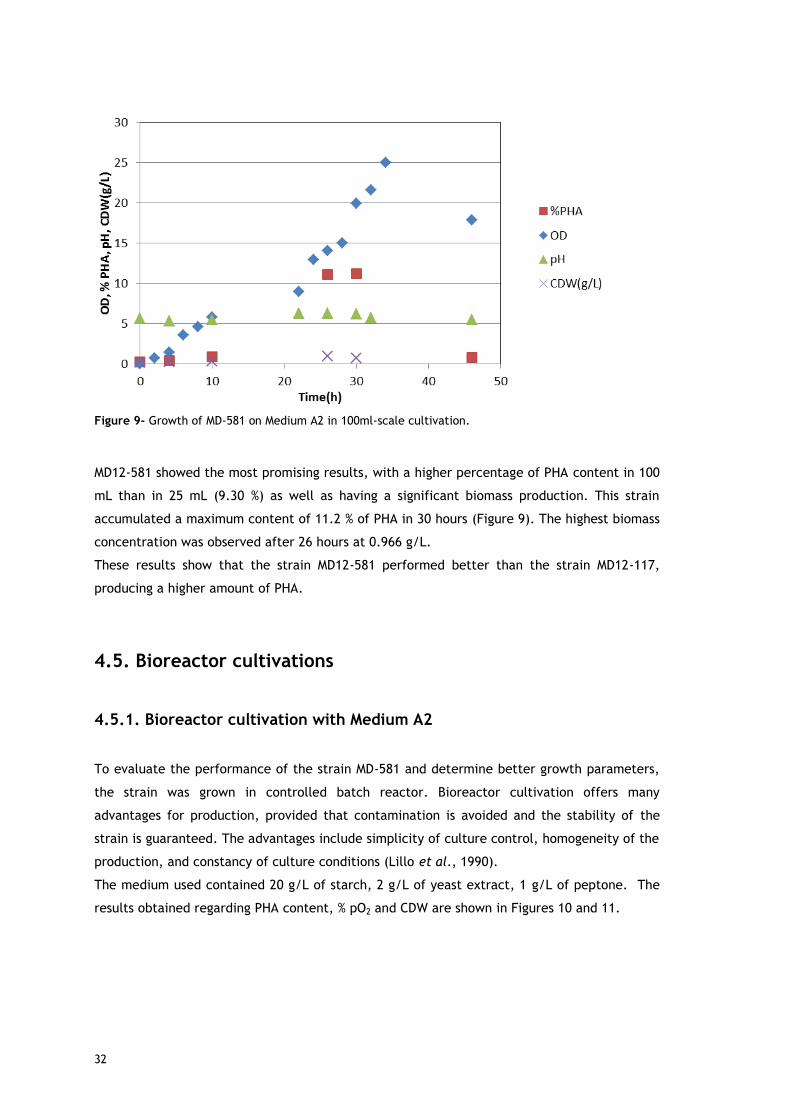
32
Figure 9- Growth of MD-581 on Medium A2 in 100ml-scale cultivation.
MD12-581 showed the most promising results, with a higher percentage of PHA content in 100
mL than in 25 mL (9.30 %) as well as having a significant biomass production. This strain
accumulated a maximum content of 11.2 % of PHA in 30 hours (Figure 9). The highest biomass
concentration was observed after 26 hours at 0.966 g/L.
These results show that the strain MD12-581 performed better than the strain MD12-117,
producing a higher amount of PHA.
4.5. Bioreactor cultivations
4.5.1. Bioreactor cultivation with Medium A2
To evaluate the performance of the strain MD-581 and determine better growth parameters,
the strain was grown in controlled batch reactor. Bioreactor cultivation offers many
advantages for production, provided that contamination is avoided and the stability of the
strain is guaranteed. The advantages include simplicity of culture control, homogeneity of the
production, and constancy of culture conditions (Lillo et al., 1990).
The medium used contained 20 g/L of starch, 2 g/L of yeast extract, 1 g/L of peptone. The
results obtained regarding PHA content, % pO2 and CDW are shown in Figures 10 and 11.

33
Figure 10- Growth of the Gram-negative MD12-581 with Medium A2 in bioreactor, % PHA, OD and % pO2.
Figure 11- Growth of Gram-negative MD12-581 with Medium A2 in Bioreactor.
The higher supply of air contributed for enhancing cells growth, going from 0.966 g/L in 100
mL cultivation to 7.45 g/L in bioreactor (Figure 11). Exponential phase started just 2 hours
after inoculation. After 8 hours, cells reached already the decline phase. Specific growth rate
was 0.30 h-1. The PHA production began after 2 hours and within 8 hours reached 10.23 %.
However, after 10 hours of cultivations, PHA concentration started to decrease as the strain
switches to PHA storages reserve.

34
4.5.1 Bioreactor cultivation with medium A3
PHA content using Medium A2 (20 g/L of starch; 2 of yeast extract and 1 g/L of peptone)
reaches approximately 10 %. This is a promising value but still very low to be of practical
relevance. In order to further increase PHA content, the medium was modified with both
higher content in carbon source and nitrogen source. Nitrogen limitation was maintained to
promote PHA storage.
The medium A3 contained 40 g/L of starch; 8 of yeast extract and 4 g/L of peptone. Both
strains MD-107 and MD-581 were grown in duplicates.
4.5.1.1. Strain MD12-107:
The results obtained with the Gram-positive MD12-107 strain in bioreactor cultivation
regarding PHA content, pH, % pO2, CDW and Organic Carbon concentration are illustrated in
Figures 12 and 13.
Figure 12- Growth of Gram-positive MD12-107 strain in Bioreactor with Medium A3. OD, % pO2, % PHA, CDW (g/L) and [Organic Carbon] (ppm). First bioreactor cultivation.

35
Figure 13- Growth of Gram-positive MD12-107 strain in Bioreactor with Medium A3. OD, % pO2, % PHA, CDW (g/L) and [Organic Carbon] (ppm). Second bioreactor cultivation.
The results obtained with the strain MD12-107 showed that PHA content storage in bioreactor
was much lower than in 100 ml cultivation (10.23 %) (Figures 12 and 13). PHA percentage in
both experiments was less than 1 % whereas biomass reached 8-10 g/L.
In both experiments, the dissolved oxygen showed a decrease of throughout time but organic
carbon consumption was insignificant (less than 3000 ppm).Organic carbon estimation was
used to get an estimation of starch consumption, as its complex polymeric structure does not
allow a precise measurement. Specific growth rate was 0.18 h-1 (Figure 12) and 0.16 h-1
(Figure 13). pH was maintained at 7.0±0.05 by automatic addition of 2 M HCl and 2 M NaOH
for efficient production. A possible explanation for no PHA accumulation may be this pH
value. In 100 mL cultivation, the pH value was around 4-5 which may be an optimal pH for
PHA accumulation in the marine bacterium MD12-107. Another explanation could actually be
excess of nitrogen source: in flasks, the ratio starch:YE:peptone (20:2:1) was used whereas in
the bioreactor a ratio of 40:8:4; in these conditions, the limitation in nitrogen might not be
strong enough for PHA accumulation .

36
4.5.1.2. Strain MD12-581
The results obtained in bioreactor cultivation for the Gram-negative MD12-581 strain
regarding PHA content, pH, % pO2, CDW and Organic Carbon concentration are illustrated in
Figures 14 and 15.
Figure 14- Growth of Gram-negative MD12-581 strain in Bioreactor with Medium A3. OD, % pO2, % PHA, CDW (g/L) and [Organic Carbon] (ppm). First bioreactor cultivation.
Figure 15- Growth of Gram-negative MD12-107 strain in Bioreactor with Medium A3. OD, % pO2, % PHA, CDW (g/L) and [Organic Carbon] (ppm). Second bioreactor cultivation.

37
In first bioreactor cultivation (Figure 14), exponential phase started just 2.5 hours after
inoculation. After 8.5 hours, cells reached already the decline phase. Specific growth rate
was 0.24 h-1. The PHA was produced after 2 hours and maximum PHA production was obtained
at 15.40 % within 6.5 hours of batch fermentation. The highest CDW in microbial cell was 7.12
g/L when OD600nm was 3.96. A significant consumption of organic carbon 12200 ppm
(corresponding to around 12.2 g organic carbon/L) was verified. The pH was maintained at
7.0±0.05 by automatic addition of 2 M HCl and 2 M NaOH.
The PHA content obtained is promising, but still low compared to others studies. The
maximum PHA content of Ralstonia eutropha can reach 75 % to 80 % of cell dry weight in 48
hours to 60 hours (Chen, 2009). Alcaligenes latus can accumulate up to 50 % PHB on glucose
or sucrose in 18 hours of growth (Yamane et al., 1996). Maximum PHA contents for
Amerononas hydrophila and Pseudomonas oleovorans were reported as 50 % and 63 %,
respectively (Chen, 2001; Jung, 2001). Azotobacter chroococum in fed-batch cultivation with
carbon source hydrolyzed starch and oxygen limitation had PHA content 46 % (Dalcanton et
al., 2010).
It seems that during the second cultivation, PHA production was actually compromised by low
levels of air in the reactor (Figure 15 compared to Figure 14). The main difference between
the two experiments was the level of dissolved oxygen during growth. In the first cultivation,
pO2 did not decrease below 38 % whereas in the second cultivation the dissolved oxygen
presented very low values, reaching minimum value 0.9 % after 7 hours. Cell concentration
and PHA productivity usually increased with increasing maximum agitation speed (Kim et al.,
2000). Exponential phase started just 3 hours after inoculation. After 7 hours, cells reached
the decline phase. In this second bioreactor, specific growth rate was slightly higher at 0.34
h-1. The PHA was produced after 3 hours and maximum PHA production was obtained at 5.37
% within 7 hours of batch fermentation. The biomass production reached 10.54 g/L, much
higher than during the 1st batch where it reached 7.5 g/L. only 3920 ppm of organic carbon
(corresponding to around 3.9 g/L) was consumed, suggesting that limitation in aeration
actually compromised carbon consumption and therefore PHA accumulation.
4.7. PHA film
The main objective of PHA production by microorganisms is the substitution of common fossil-
fuel based plastics by biodegradable ones. However, to compete with these already
established plastics, PHAs have to fulfill several mechanical properties. In particular, the
produced polymer has to be able to form films.
In order to assess the film formation capacity of the PHA produced in this work, PHA was
extracted from 4 g of lyophilized biomass in 200 mL chloroform at 65 ºC, under constant
stirring, for 2 hours. The polymer was recovered by solvent evaporation.
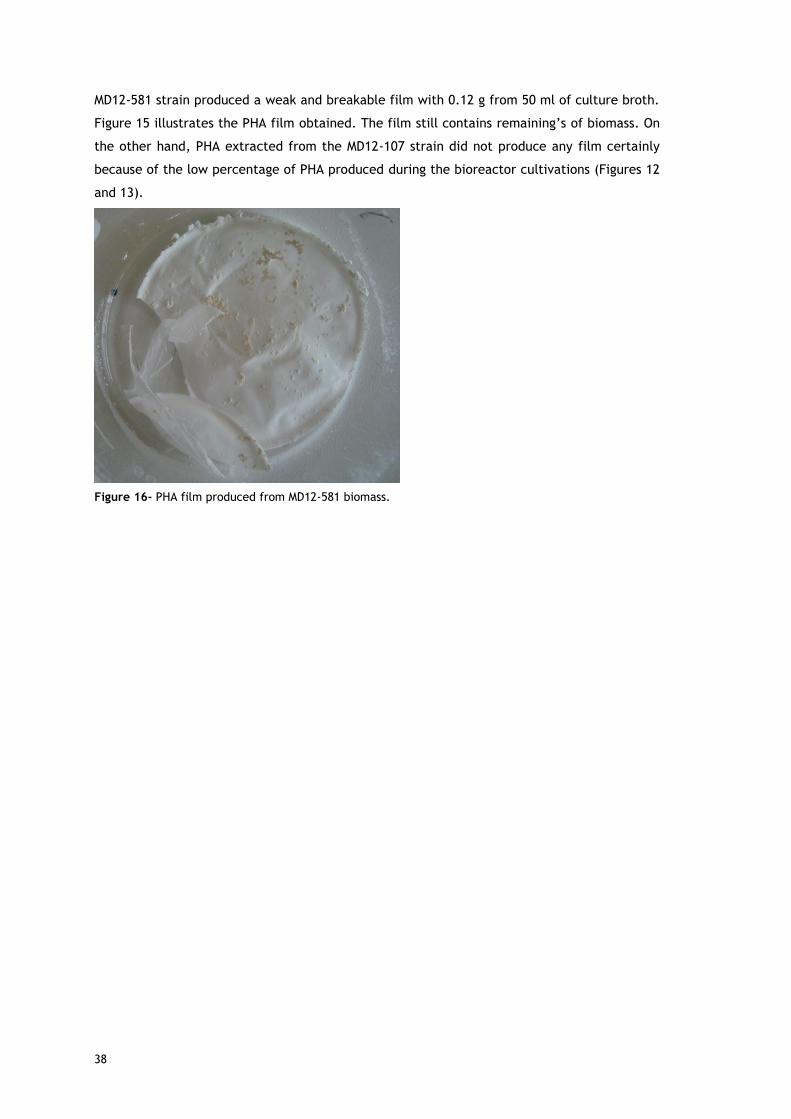
38
MD12-581 strain produced a weak and breakable film with 0.12 g from 50 ml of culture broth.
Figure 15 illustrates the PHA film obtained. The film still contains remaining’s of biomass. On
the other hand, PHA extracted from the MD12-107 strain did not produce any film certainly
because of the low percentage of PHA produced during the bioreactor cultivations (Figures 12
and 13).
Figure 16- PHA film produced from MD12-581 biomass.

39
Chapter V- Conclusion and future work
The efficiency of PHA production by bacteria depends on the species and how the nutrient is
given to the bacteria. Plastics produced from bacteria have become a possible solution to
dumping waste because these plastics can break down easily when compared with
conventional plastics produced from petroleum-based compounds.
The carbon sources contribute significantly to the high production costs of PHA, generally
representing about 50 % of the cost (Posada et al., 2011). Therefore, the selection of
microorganisms capable of producing PHA efficiently using inexpensive substrates is of utmost
importance (Kim, 2000). In order to analyze the polymer’s ability to synthesize from
renewable sources at a low cost, starch was used as a carbon source. According to Kim, 2000
and Sheu et al. 2009, since starch is a renewable carbon source available in large quantities,
several studies have been conducted to assess the production of the polymer from this
substrate.
The marine ecosystem is an important resource for searching for PHA producing bacteria. In
this study, 25 % of the organisms showed high fluorescence through the lipophilic dye Nile red
under the growth conditions studied, indicative of accumulation of the polymer and 25 strains
were grown to confirm PHA content by gas chromatography. MD12-107 and MD12-581 strains
presented a high PHA production capacity (17.71 % and 9.30 % respectively) relatively other
23 strains studied. PHA granules were identified in microscopic samples of fresh cultures of
strains MD12-107 and MD12-581 stained with Nile blue.
The MD12-581 strain proved to be efficient in PHA production with a maximum production of
15.4 %, during bioreactor cultivation on 40 g/L starch demonstrating its potential for
bioconversion in PHA. This strain produced a weak and breakable PHA film.
The MD12-107 strain was able to produce 17.71 % in 25 ml culture, but showed no significant
results when grown in 100 mL or in a bioreactor, presenting a PHA maximum of 2.3 % and 0.69
% respectively. This strain might be less tolerant in the reactor at pH 7 and the culture
conditions might have had carbon and nitrogen source in excessive amounts.
Biomass production showed low values for production in 25 mL and 100 mL cultures. However,
in the bioreactor that showed higher percentage of PHA content, the CDW maximum obtained
was 10.54 g/L and 10.01 g/L for strain MD12-107 and MD12-581 respectively.
The values for specific growth route (0.18 h-1 - 0.16 h-1 for MD12-107 and 0.24 h-1-0.34 h-1)
showed that strains MD12-107 and MD12-581 had a very rapid growth in a bioreactor.

40
The objective of this work was to screen and isolate promising PHA-producing bacteria from a
marine environment. Selection of the best producers was made and preliminary optimization
of PHA production by the selected microorganisms was performed. However, the results
regarding the production of PHA content obtained are still low compared to what can be
found in the literature (Dalcanton et al., 2010; Chen, 2009; Chen, 2001; Jung, 2001;; Yamane
et al., 1996).
For this reason, the following strategies could be implemented:
- Better optimization and control of the PHA production system by using several other
carbon sources and environmental factors such as pH, temperature and the
availability of oxygen. These factors can be manipulated to check whether the
production can be enhanced and whether or not high productivity can be
accumulated;
- Optimization of culture conditions for strains MD12-107 and MD12-58 to increase
production;
- Evaluation of the polymer’s physical properties obtained and film purity;
- Testing of the other positive PHA-accumulators to find more efficient bacteria;
- 16S rRNA sequencation to characterize better the producing bacteria.

41
Chapter VI- Bibliography
Albuquerque M.G.E., (2009). Production of polyhydroxyalkanoates (PHA) from sugar
canemolasses by mixed microbial cultures. PhD thesis.
Albuquerque M.G.E, Eiroa M., Torres C., Nunes B.R., Reis M.A.M., (2007). Strategies for the
development of a side stream process for polyhydroxyalkanoates (PHA) production from sugar
cane molasses. Journal of Biotechnology. 130: 411–21.
Alves M.A.R., (2009). Desenvolvimento de um método de análise quantitativa de
concentração celular e PHB por microscopia de fluorescência e análise de imagem. Master
thesis.
Amara A.A., (2008). Polyhydroxyalkanoates: from basic research and molecular biology to
application. IUM Engineering Journal. 9(1): 37-73.
Andrady A.L., (2003). Plastics and the environment. West Sussex, England. John Wiley and
Sons.
Andrady A.L., Neal M.A., (2009). Applications and societal benefits of plastics. Philosophical
Transactions of the Royal Society B: Biological Sciences. 364(1526): 1977-1984.
Baumann P., Baumann L., Mandel M., (1971). Toxonomy of Marine Bacteria: the genus
Beneckea. Journal of Bacteriology. 107(1): 268-294.
Berlanga M., Montero M.T., Fernández-Borrell J., Guerrero R., (2006). Rapid
spectrofluorometric screening of poly-hydroxyalkanoate-producing bacteria from microbial
mats. International Microbiology. 9(2): 95-102.
Brandl H., Gross R.A., Lenz R.W., Fuller R.C., (1988). Pseudomonas oleovorans as a source of
poly(β-hydroxyalkanoates) for potential applications as biodegradable polyesters. Applied and
Environmental Microbiology. 54(8): 1977–1982.
Braunegg G., Lefebvre G., Genser K.F., (1998). Polyhydroxyalkanoates, biopolyesters from
renewable resources: physiological and engineering aspects. Journal of Biotechnology. 65:
127-161.
42
Castilho L.R, Mitchell D.A, Freire D.M.G., (2009). Production of polyhydroxyalkanoates (PHAs)
from waste materials and by-products by submerged and solid-state fermentation.
Bioresource Techonology. 100: 5996-6009.
Chansatein O., Urairong H., Rodtong S., (2012). Development of cultivation media for
polyhydroxyalkanoates accumulation in bacterial cells isolated from cassava pulp. Research
Journal of Biological Sciences. 7(1): 31-37.
Chen G.Q., Zhang G., Park S.J., Lee S.Y., (2001). Industrial scale production of poly(3-
hydroxybutyrate-co-3-hydroxyhexanoate). Applied Microbiology and Biotechnology. 57: 50-55.
Chen G-Q., (2010). Plastics from bacteria, nature functions and application. Microbiology
Monographs. Volume 14. Springer Berlin-Heidelberg.
Chen GQ., (2009). A microbial polyhydroxyalkanoates (PHA) based bio- and materials industry.
Chemical Society Reviews. 38(8): 2434-2446.
Choi J., Lee S. Y., (1997). Process analysis and economic evaluation for Poly(3-
hydroxybutyrate) production by fermentation. Bioprocess Engineering. 17: 335–342.
Crank M., Patel M., (2005). Techno-Economic Feasibility of Large scale Production of Bio-
Based Polymers in Europe. European Commission.
Davis R., (2008). Studies on the molecular mechanism of polyhydroxyalkanoates biosynthesis
in Pseudomonas species. PhD thesis.
Desouky A.M., El-Haleem A.B.D., Zaki S.A., Abuelhamd A.T., Amara A., Aboelreesh G.M.S.,
(2007). Biosynthesis of polyhydroxyalkanotes in wildtype yeasts. Journal of Applied
Sciences and Environmental Management. 11(3): 5–10.
Dias J.M.L., Lemos P.C., Serafim L.S., Oliveira C., Eiroa M., Albuquerque M.G.E., Ramos A.M.,
Oliveira R., Reis M.A.M., (2006). Recent advances in polyhydroxyalkanoate production by
mixed aerobic cultures: From the substrate to the final product. Macromolecular Bioscience.
6: 885-906.
Doan T-T.Y., Obbard J.P., (2011). Improved Nile Red staining of Nannochloropsis sp. 23(5):
895-901.
Farinha I.S., (2009). Optimization of Bioplastics Production from Cheese Whey. Master Thesis.

43
Fiorese M.L., Freitas F., Pais J., Ramos A.M., Aragão G.M.F., Reis M.A.M., (2009). Recovery of
polyhydroxybutyrate (PHB) from Cupriavidus necator biomass by solvente extraction with 1,2-
propylene carbonate. Engineering in Life Sciences. 9(6): 454-461.
Greenspan P., Mayer E.P., Fowler S.D., (1985). Nile red: a selective fluorescent stains for
intracellular lipid droplets. The Journal of Cell Biology. 100: 965-973.
Gross R.A., Kalra B., (2002). Biodegradable Polymers for the Environment. Science. 297: 803–
807.
Hanley Z, Slabas T, Elborough KM., (2000). The use of plant biotechnology for the production
of biodegradable plastics. Trends in Plant Science. 5: 45–6.
Jung K., Hazenberg W., Prieto M., Witholt B., (2001). Two-stage continuous process
development for the production of medium-chain-length poly(3-hydroxyalkanoates).
Biotechnology and Bioengineering. 72(1): 19-24.
Keshavarz T., Roy I., (2010). Polyhydroxyalkanoates: bioplastics with a green agenda. Current
Opinion in Microbiology. 13(3): 321-326
Kim, B. S., (2000). Production of poly(3-hydroxybutyrate) from inexpensive substrates.
Enzyme and Microbial Technology. 27: 774–777.
Laycock B., Halley P., Pratt S., Werker A., Lant P., (2013). The chemomechanical properties
of microbial polyhydroxyalkanoates. Progress in Polymer Science. 38: 536-583.
Lee, S.Y., Chang, H.N., (1995). Production of poly(hydroxyalkanoic acid). Advances in
Biochemical Engineering / Biotechnology. 52: 27–58.
Lee S.Y., (1996). Plastic bacteria? Progress and prospects for polyhydroxyalkanoate
production in bacteria. Trends in Biotechnology 14(11): 431-438.
Lee S.Y., (1997). E.coli moves into the plastic age. Nature Biotechnology. 15: 17-18.
Lee S.Y., Middelberg, A. P. J., Lee Y. K., (1997). Poly(3-hydroxybutyrate) production from
whey using recombinant Escherichia coli. Biotechnology Letters. 19(10): 1033–1035.
Lee S.Y., Choi J.I., (1998). Effect of fermentation performance on the economics of poly(3-
hydroxybutyrate) production by Alcaligenes latus. Polymer Degradation and Stability. 59(1-3):
387-393.
44
Lemoigne M., (1926). Products of dehydration and of polymerization of ß-hydroxybutyric acid.
Bulletin des Societes Chimiques Belges. 8: 770-782.
Lemos P.C., Serafim L.S., Reis M.A.M., (2006). Synthesis of polyhydroxyalkanoates from
different short-chain fatty acids by mixed cultures submitted to aerobic dynamic feeding.
Journal of Biotechnology. 122: 226-238.
Li R., Zhang H., Qu Q., (2007). The production of polyhydroxyalkanoates in recombinat
Escherichia coli. Bioresource Technology. 98: 2313-2320.
Lillo J.G., Rodriguez –Valera F., (1990). Effects of culture Conditions on Poly(β-
Hydroxybutyric Acid) Production by Haloferax mediterranei. Applied and Environmental
Microbiology. 56(8): 2517-2521.
Luengo J.M., Garcia B., Sandoval A., Naharro G., Oliveirra E.R., (2003). Bioplastics from
microorganisms. Current Opinion Microbiology. 6(3): 251-260.
Madison L., Huisman G., (1999). Metabolic engineering of poly(3- Hydroxyalkanoates): from
DNA to plastic. Microbiology and Molecular Biology Reviews. 63(1): 21–53.
Moire L., Rezzonico E., Goepfert S., Poirier Y., (2004). Impact of unusual fatty acid synthesis
on futile cycling through β-oxidation and on gene expression in transgenic plants. Plant
Physiology. 134: 432–42.
Ostle A.G., Holt J.G., (1982). Nile Blue A as a Fluorescent Stain for Poly-Beta-
Hydroxybutyrate. Applied and Environmental Microbiology. 44(1): 238-241.
Park S.J., Kim T.W., Kim M.K., Lee S.Y., Lim S-C., (2012). Advanced bacterial
polyhydroxyalkanoates: Towards a versatile and sustainable platform for unnatural tailor-
made polyesters. 30: 1196–1206.
Posada J.A., Naranjo J.M., López J.A., Higuita, J.C., Cardona C.A., (2011). Design and
analysis of poli-3-hydroxybutyrate production processes from crude glycerol. Process
Biochemistry. 46(1): 310-317.
Povolo S., Romanelli M.G., (2012). Production of polyhydroxyalkanoates from fatty wastes.
Journal of Polymers and the Environment. 20: 944-949.
Queiroz, A.U.B., Collares-Queiroz F.P., (2009). Innovation and Industrial Trends in Bioplastics.
Polymer Reviews. 49(2): 65-78.

45
Quillaguamán J., Guzmán H., Van-Thuoc D., Hatty-Kaul R., (2010). Synthesis and production
of polyhydroxyalkanoates by halophiles: current potencial and future prospects. Applied
Microbiology and Biotechnology. 86(6): 1687-1696.
Razza F., Innocenti F.D., (2012). Bioplastics from renewable resources: the benefits of
biodegradability. Asia-Pacific Journal of Chemical Engineering. 7(3): 301-309.
Reddy C.S.K, Ghai R., Rashmi, K.V.C., (2003). Polyhydroxyalkanoates: an overview.
Bioresource Technology. 87: 137-146.
Reis M.A.M., Serafim L.S., Lemos P.C., Ramos A.M., Aguiar F.R., van Loosdrecht M.C.M.,
(2003). Production of polyhydroxyalkanoates by mixed microbial cultures. Bioprocess
Biosystems Engineering. 25: 377–385.
Satoh H., Mino T., Matsuo T., (1992). Uptake of organic substrates and accumulation of
polyhydroxyalkanoates linked with glycolysis of intracellular carbohydrates under anaerobic
conditions in the biological excess phosphate removal processes. Water Science and
Technology. 26: 933-942.
Serafim L.S., Lemos P.C., Albuquerque, M.G.E, Reis MAM., (2008). Strategies for PHA
production by mixed cultures and renewable waste materials. Applied Microbiology and
Biotechnology. 81: 615–28.
Serafim L.S., Lemos P.C., Oliveira R., Reis M.A.M., (2004). Optimization of
polyhydroxybutyrate production submitted to aerobic dynamic feeding conditions.
Biotechnology and Bioengineering. 87(2): 145-160.
Serafim L.S., Lemos P., Lavantesi C., Tandoi V., Santos H., Reis M.A.A., (2002). Methods for
detection and visualization of intracellular polymers stored by polyphosphate-accumulating
microorganisms. Journal of Microbiological Methods. 51(1): 1-18.
Sheu D.S., Chen W.M., Yang J.Y., Chang R.C., (2009). Thermophilic bacterium Caldimonas
taiwanensis produces poly(3-hydroxybutyrate-co-3-hydroxyvalerate) form starch and valerate
as carbon source. Enzyme and Microbial Technology. 44(5): 289-294.
Shrivastav A., Mishra S.K., Shethia B., Prancha I., Jain D., Mishra S., (2010). Isolation of
promising bacterial strains from soil and marine environment for polyhydroxyalkanoates
(PHAs) production utilizing Jatropha biodiesel byproduct. Internacional Journal of Biological
Macromolecules. 47: 283-287.
46
Schut JH. (2008). What's ahead for "green" plastics. Plastics technology. February 2008: 64-71.
Slater S.C., Voige W.H., Dennis D.E., (1988). Cloning and expression in Escherichia coli of the
Alcaligenes eutrophus H16 poly-β-hydroxybutyrate biosynthetic pathway. Journal of
Bacteriology. 170: 4431-4436.
Snell K.D., Peoples O.P., (2002). Polyhydroxyalkanoate polymers and their production in
transgenic plants. Metabolic Engineering. 4(1): 29–40.
Somerville CR, Bonetta D., (2001). Plants as factories for technical materials. Plant
Physiology. 125: 168–71.
Song S., Dai X., Zhang W-H., (2012). A rice F-box gene, OsFbx352, is involved in glucose-
delayed seed germination in rice. Journal of Experimental Botany. 15: 5559–5568.
Spiekermann P., Rehm B.H.A., (1999). A sensitive, viable-colony staining method using Nile
red for direct screening of bacteria that accumulate polyhydroxyalkanoic acids and other lipid
storage compounds. Archives of Microbiology. 171: 73-80.
Stanley S.O., Morita R.Y., (1966). Salinity effect on the maximal growth temperature of some
bacteria isolated from marine environments. American Society for Microbiology. 95(1): 169-
173.
Steinbüchel A., Lutke-Eversloh T., (2003). Metabolic engineering and pathway construction
for biotechnological production of relevant polyhydroxyalkanoates in microorganisms.
Biochemical Engineering Journal. 16: 81-96
Steinbüchel A, Valentin H., (1995). Diversity of bacterial polyhydroxyalkanoic acids. FEMS
Microbiology Letters. 128: 219–28.
Sudesh K., Abe H., Doi Y., (2000). Synthesis, structure and properties of
polyhydroxyalkanoates: biological polyesters. Progress in Polymer Science. 25: 1503-1555.
Suriyamongkol P., Weselake R. Narine S., Moloney M., Shah S., (2007). Biotechnological
approaches for the production of polyhydroxyalkanoates in microorganisms and plants – A
review. Journal of Biotechnology. 25: 148-175.
Tanamool V., Imai T., Danvirutai P., Kaewkannetra P., (2011). Biosynthesis of poly
hydroxylalkanoate (PHA) by Hydrogenophaga sp. isolated from soil environments during batch
fermentation. Life Science Journal. 5(12): 1003-1012.

47
Yamane T., Fukunaga M., Lee Y.W., (1996). Increased PHB productivity by high-cell-density
fed-batch culture of Alcaligenes latus, a growth-associated PHB producer. Biotechnology and
Bioengineering 50(2): 197-202.
Zinn M., Witholt B., Egli T., (2001). Occurrence, synthesis and medical application of
bacterial polyhydroxyalkanoate. Advanced Drug Delivery Reviews. 53: 5–21.

48

49
Chapter VI- Annexes
Anexx 1- Colony picking of 612 mother plates.
07/09/12 Sample Number Mother Plating date Medium/Method Colony ID Color Shape 1 Shape 2
MD12 30 7-06-12 S1 A white atomic bomb shape dry
MD12 30 7-06-12 S1 B white atomic bomb shape
MD12 30 7-06-12 S1 C clear brwon dry
MD12 530 14-06-12 A1 S2 A white pink wet
MD12 234 11-061-2 A1 A white pink translucide semi-wet
MD12 234 11-06-12 A1 B small transparente
MD12 234 11-06-12 A1 C yellow opaque semi-wet
MD12 560 15-06-12 112 S2 A yellow wet
MD12 560 15-06-12 112 S2 B clear brown semi-wet
MD12 560 15-06-12 112 S2 C white brownish semi-wet
MD12 517 14-06-12 SWA S2 A orange
MD12 517 14-06-12 SWA S2 B translucide creamy
MD12 517 14-06-12 SWA S2 C yellow creamy
MD12 540 14-06-12 112 S2 A pink white wet
MD12 540 14-06-12 112 S2 B white yellow dry
MD12 540 14-06-12 112 S2 C orange wrinkles
MD12 540 14-06-12 112 S2 D red pink
MD12 540 14-06-12 112 S2 E white creamy
MD12 523 14-06-12 SWA S2 A yellow
MD12 523 14-06-12 SWA S2 B pink creamy
MD12 523 14-06-12 SWA S2 C yellow spread

50
MD12 523 14-06-12 SWA S2 D white
MD12 85 7-06-12 SWA S1 A orange
MD12 85 7-06-12 SWA S1 B translucide creamy
MD12 85 7-06-12 SWA S1 C white creamy
MD12 40 7-06-12 112 S1 A beige creamy
MD12 40 7-06-12 112 S1 B white creamy
MD12 518 21-07-12 A1 P1 A brownish beige translucide
MD12 518 21-07-12 A1 P1 B yellow wet
MD12 518 21-07-12 A1 P1 C beige translucide
MD12 518 21-07-12 A1 P1 D tan
MD12 521 21-07-12 A1 P1 A white slight grey semi-wet
MD12 521 21-07-12 A1 P1 B dark pink wet
MD12 521 21-07-12 A1 P1 C yellow translucide wet
MD12 521 21-07-12 A1 P1 D yellow grey translucide wet
MD12 521 21-07-12 A1 P1 E pink grey dry
MD12 558 15-06-12 M2 S2 A huge white wet
MD12 130 8-06-12 A1 S2 A white shining
MD12 130 8-06-12 A1 S2 B brown on dry spread
MD12 130 8-06-12 A1 S2 C very dry wrinkles light brwon
MD12 130 8-06-12 A1 S2 D pinkish dry
MD12 130 8-06-12 A1 S2 E dry flat pink
MD12 528 14-06-12 M2 S2 A yellow translucide wet
MD12 528 14-06-12 M2 S2 B completely translucide wet
MD12 528 14-06-12 M2 S2 C translucide pink
MD12 528 14-06-12 M2 S2 D brown with white ring
MD12 528 14-06-12 M2 S2 E blach with yelloe wet
MD12 528 14-06-12 M2 S2 F whitish translucide

51
MD12 515 21-07-12 A1 P1 A orange dry
MD12 515 21-07-12 A1 P1 B spread transparent translucide
MD12 515 21-07-12 A1 P1 C light yellow
MD12 515 21-07-12 A1 P1 D grey brownigh
MD12 555 15-06-12 M2 S2 A transparent white pink
MD12 555 15-06-12 M2 S2 B red pink dry
MD12 555 15-06-12 M2 S2 C white brownish semi-wet
MD12 365 11-06-12 112 S2 A yellow white opaque big
MD12 365 11-06-12 112 S2 B white translucide
MD12 365 11-06-12 112 S2 C greyish semi-wet
MD12 523 14-06-12 A1 S2 A yellow grey translucide wet
MD12 523 14-06-12 A1 S2 B yellow white opaque wet
MD12 523 14-06-12 A1 S2 C white pink wet
MD12 523 14-06-12 A1 S2 D pink brown translucide semi-wet
MD12 523 14-06-12 A1 S2 E red dry
MD12 512 14-06-12 112 S2 A pink orange slimmy
MD12 512 14-06-12 112 S2 B grey white slimmy
MD12 512 14-06-12 112 S2 C transparent
MD12 512 14-06-12 112 S2 D light brown dry
MD12 115 8-06-12 SWA S2 A red orange dry
MD12 115 8-06-12 SWA S2 B light orange wet
MD12 115 8-06-12 SWA S2 C white
MD12 115 8-06-12 SWA S2 D white
MD12 3 7-06-12 SWA S1 A orange dry
MD12 3 7-06-12 SWA S1 B pink wet
MD12 3 7-06-12 SWA S1 C clear brwon dry
MD12 506 14-06-12 SWA S2 A orange wet

52
MD12 506 14-06-12 SWA S2 B greyish small dry
MD12 506 14-06-12 SWA S2 C light orange dry
MD12 506 14-06-12 SWA S2 D white translucide wet
MD12 369 11-06-12 A1 S2 A white wet
MD12 369 11-06-12 A1 S2 B white dry and flat
12/09/13 Sample Number Mother Plating date Medium/Method Colony ID Color Shape 1 Shape 2
MD12 579 15-06-12 SWA S2 A roasted yellow
MD12 B white dry
MD12 C dark red
MD12 517 14-06-12 1/2 S2 A grey dry
MD12 B dirty white wet
MD12 C roasted yellow
MD12 99 7-06-12 S1 A white yellow semi-wet
MD12 137 6-08-12 SWA S1 A green
MD12 B black
MD12 513 14-06-12 1/2 S2 A pink wet
MD12 yellow wet
MD12 299 11-06-12 S2 A salmon wet
MD12 B orange umber semi-wet
MD12 C bright yellow wet
MD12 396 1-106-12 1/2 S2 A white yellow semi-wet rugous
MD12 528 14-06-12 A1 A white yellow wet
MD12 B translucide creamy wet
MD12 C brownish beige wet
MD12 175 8-06-12 1/2 S2 A transparent rugous big
MD12 100 8-06-12 A1 A black center dry

53
MD12 B grey
MD12 512 14-06-12 SWA S2 A green center
MD12 B yellow wet small
MD12 294 11-06-12 S2 A yellow translucide flowery
MD12 35 7-06-12 1/2 S1 A beige creamy shining
MD12 252 11-06-12 S2 A brown
MD12 361 11-06-12 1/2 S2 A beige rugous
MD12 B white
MD12 C yellow wet
MD12 183 30-17-12 1/2 P1 A white slight grey dry
MD12 B brownish beige relief
MD12 138 30-07-12 SWA P1 A light pink semi-wet
MD12 B transparent wet
MD12 174 30-07-12 A1 P1 A orange semi-wet
MD12 178 30-07-12 A1P1 A old rose pale shining
MD12 B greenish brown dry
MD12 107 30-07-12 A1P1 A light brown spleen
MD12 B beige pale
MD12 438 28-07-12 A1P1 A orange shining wet
13/09/12 Sample Number Mother Plating date Medium/Method Colony ID Color Shape 1 Shape 2
MD12 487 13-06-12 S2 A orange shining
MD12 157 8-06-12 A1 A light beige shining wet
MD12 B dark beige dry spleen
MD12 555 13-06-12 A1 A yellow shining wet
MD12 123 8-06-12 A1 A beige transparent semi-wet

54
MD12 B transparent shining
545 15-06-12 SWAS2 A white translucide
MD12 B yellow translucide wet
MD12 213 23-07-12 SWAP1 A dark beige shining
MD12 B beige spleen
MD12 576 23-07-12 A1 A salmon
MD12 B yellow
MD12 C dark yellow
MD12 514 11-07-12 A1 A dark yellow wet shining
MD12 56 7-06-13 SWAS1 A light beige
MD12 348 23-07-13 SWAP1 A white shining
14/09/12 Sample Number Mother Plating date Medium/Method Colony ID Color Shape 1 Shape 2
MD12 311 11-06-12 A1S2 A dark orange shining
MD12 340 11-06-12 1/2S2 A light yellow
MD12 331 11-06-12 SWAS2 A white small
MD12 59 7-06-12 S1 A orange shining
MD12 52 7-06-12 A1s1 A dark orange small shining
MD12 B white dry pale
MD12 400 13-06-12 1/2S2 A dark green dry
MD12 352 11-06-12 S2 A light yellow spleen
MD12 B dark orange dry
MD12 C dark yellow aqueous wet
MD12 D light yellow
MD12 454 13-06-12 1/2S2 A grey shining wet
MD12 384 11-06-12 1/2S2 A dark orange shining wet
MD12 B dark beige wet shining

55
MD12 C white yellow wet
MD12 9 7-06-12 1/2S1 A dark yellow dry
MD12 B dark yellow wet
MD12 225 11-06-12 1/2S2 A orange
MD12 B light pink dry
MD12 C light yellow spleen
MD12 319 28-07-12 A1 A red
MD12 B dark yellow dry
1 8/09/12 Sample Number Mother Plating date Medium/Method Colony ID Color Shape 1 Shape 2
MD12 442 13-06-12 SWA A orange/salmon dry
MD12 382 23-07-12 A1 A dark yellow wet
MD12 553 20-07-12 P1 A light pink
MD12 531 21-07-12 P1 A beige wet
MD12 B dark pink wet
MD12 C black dry
MD12 655 21-07-12 P1 A beige creamy
MD12 B dark yellow
MD12 554 25-07-12 A1 A dark beige wet
MD12 535 21-07-12 A1 A yellow shining
MD12 B light yellow shining
MD12 657 21-07-12 SWAP1 A pink
MD12 B green
MD12 657 21-07-12 A1 A dark yellow dry
MD12 582 21-07-12 A1 A dark pink dry
MD12 B beige wet
MD12 3?5 23-07-12 P1 A dark yellow

56
MD12 224 21-07-12 A1 A pink
MD12 224 21-07-12 SWA A pink
MD12 257 23-07-12 SWAP1 A beige translucide dry
MD12 351 23-07-12 P1 A beige translucide dry
MD12 203 23-07-12 P1 A dark yellow spleen
MD12 257 23-07-12 P1 A beige translucide
MD12 B beige spleen
MD12 208 23-07-12 P1 A dark yellow verry shining
MD12 B salmon creamy
MD12 21? 21-07-12 P1 A orange dry
MD12 B brownish beige shining
MD12 652 21-07-12 SWAP1 A light pink
MD12 544 21-07-12 P1 A light yellow semi-wet
MD12 642 21-07-12 P1 A dark yellow shining
MD12 B light yellow shining
MD12 632 21-07-12 A1 A orange
MD12 B dark orange creamy
MD12 276 23-07-12 A1 P1 A dark pink
MD12 B dark yellow
19/09/12 Sample Number Mother Plating date Medium/Method Colony ID Color Shape 1 Shape 2
MD12 384 11-06-12 1/2S1 A dark yellow shining
MD12 B yellow creamy atomic bomb shape wet
MD12 C light yellow creamy wet
MD12 333 23-07-12 A1 P1 A beige wet
MD12 201 23-07-12 SWAP1 A pink translucide semi-wet
MD12 72 7-061-2 SWAS1 A light orange

57
MD12 B orange wrinkles semi-wet
MD12 228 21-07-12 SWAP1 A white
MD12 569 15-06-12 A1P1 A orange creamy wet
MD12 B beige wet
MD12 C light orange
MD12 D dark beige
MD12 590 21-07-12 A1P1 A brown branched
MD12 237 21-07-12 SWAP1 A light orange
MD12 287 23-07-12 A1P1 A grey dry
MD12 251 21-07-12 A1P1 A dark yellow
MD12 B black
MD12 231 21-07-12 A1P1 A dark brown
MD12 231 21-07-12 SWAP1 A transparent
MD12 569 23-07-12 SWAP1 A pink creamy
MD12 274 23-07-12 A1P1 A beige creamy wet
MD12 B white
MD12 C light brown wet
MD12 271 23-07-12 A1P1 A light salmon dry
MD12 B brown creamy
MD12 271 23-07-12 SWAP1 A ligth green
MD12 B dark green
MD12 598 21-07-12 SWAP1 A white translucide
MD12 346 23-07-12 A1 P1 A yellow wet translucide
MD12 347 23-07-12 A1 P1 A brown rugous
MD12 135 8-06-12 A1S2 A dark beige
MD12 B white slight grey dry
MD12 C beige dry

58
MD12 D transparent small
MD12 45 23-07-12 SWAP1 A light orange wet
MD12 B tan dry
MD12 355 23-07-12 A1P1 A dark red dry
MD12 420 23-07-12 SWAP1 A orange shining
MD12 343 23-07-12 SWAP1 b white dry
MD12 267 23-07-12 SWAP1 A very dry wrinkles light green
MD12 367 13-07-12 SWAP1 A white dry
MD12 425 23-07-12 A1P1 A dry flat light brown
MD12 B beige creamy wet
MD12 338 23-07-12 A1P1 A orange wet small
MD12 255 23-07-12 A1P1 A light salmon semi-wet
MD12 367 23-07-12 230712 A brown with white ring shining
MD12 254 23-07-12 A1P1 A yellow wet gelatinous
MD12 281 23-07-12 A1P1 A beige creamy
MD12 255 23-07-12 SWAA1 A light yellow creamy wet
MD12 B green semi-wet small
MD12 420 23-07-12 A1P1 A light orange semi-wet small
MD12 341 23-07-12 SWAP1 A orange small semi-wet
MD12 423 23-07-12 A1P1 A light beige wet big
MD12 B beige dry big
MD12 282 32-07-12 A1P1 A white brownish wet gelatinous
MD12 272 23-07-12 A1P1 A dark beige opaque semi-wet
MD12 B transparent semi-wet small
MD12 404 23-07-12 A1P1 A light green pale spleen
MD12 288 23-07-12 A1P1 A brown
MD12 B yellow brown opaque wet

59
MD12 340 23-07-12 A1 P1 A orange dry
MD12 341 23-07-12 A1 P1 A dirty transparent translucide semi-wet
MD12 B beige
MD12 278 23-07-12 A1P1 A dark green small semy-wet
20/09/12 Sample Number Mother Plating date Medium/Method Colony ID Color Shape 1 Shape 2
MD12 290 23-0712 SWAP1 A white opaque
MD12 269 23-07-12 SWAP1 A dark salmon wet small
MD12 289 23-07-12 SWAP1 A white aqueous
MD12 387 23-07-12 A1P1 A dark orange wet small
MD12 490 13-06-12 A1S2 A beige dry
MD12 B white creamy big
MD12 C beige big
MD12 411 23-07-12 A1P1 A white brownish dry
MD12 B beige rough
MD12 553 21-07-12 A1P1 A light brown shining
MD12 B orange pale
MD12 374 23-07-12 A1 A brown mud
MD12 B dark yellow small semi-wet
MD12 216 21-07-12 A1 A dark beige wet
MD12 630 21-07-12 A1 A beige dry
MD12 B caramel wet big
MD12 652 21-07-12 A1P1 A beige rough
MD12 B light green
MD12 339 23-07-12 A1 A dark beige wet big
MD12 B light caramel dry
MD12 342 23-07-12 SWAP1 A yellow

60
MD12 348 23-07-12 A1P1 A light yellow translucide
MD12 B beige translucide creamy
MD12 261 23-07-12 A1P1 A dark beige gelatinous
MD12 B yellow verry shining translucide
MD12 378 23-07-12 A1P1 A white
MD12 275 23-07-12 SWAP1 A dark beige
MD12 B brownish beige shining rugous
MD12 C dark beige opaque
MD12 114 8-06-12 1/2S2 A salmon semi-wet
MD12 B dark beige shining
MD12 C light beige shining
MD12 49 7-06-12 A1S1 A dark beige shining
MD12 B beige dry small
21/09/12 Sample Number Mother Plating date Medium/Method Colony ID Color Shape 1 Shape 2
MD12 111 8-06-12 A1S2 A orange
MD12 B tan shining wet
MD12 C beige creamy
MD12 D white
MD12 118 8-06-12 SWAS2 A orange semi-wet
MD12 22 7-06-12 A1S1 A beige translucide
B beige greyish
MD12 45 7-06-12 A1S1 A beige creamy wet
MD12 B yellow pale
MD12 white spleen
MD12 beige creamy semi-wet
MD12 523 14-06-12 1/2S2 A dirty white dry

61
MD12 245 21-07-12 A1 A dark yellow wet
MD12 dark beige creamy shining
24/09/12 Sample Number Mother Plating date Medium/Method Colony ID Color Shape 1 Shape 2
MD12 626 28-07-12 SWAP1 A dark salmon
MD12 613 28-07-12 A1P1 A dark yellow dry small
MD12 245 21-07-12 SWA A white
MD12 B salmon
MD12 10 7-06-12 SWAS1 A black star dry
MD12 B light orange
MD12 C white orange
MD12 D beige creamy
MD12 F caramel wet creamy
MD12 159 30-07-12 P1 A beige dry
MD12 B beige wet
MD12 75 7-06-12 SWAP1 A white creamy
MD12 B white umber dry
MD12 C light salmon dry
MD12 143 8-06-12 SWAS2 A dark caramel semi-wet rugous
MD12 200 23-07-13 A1 A light beige rugous
MD12 B translucide creamy star
MD12 258 23-07-12 P1 A brownish beige gelatinous
MD12 B light brown dry
MD12 291 23-07-12 P1 A dark beige center dry
MD12 B light beige center dry
MD12 269 24-07-12 P1 A light brown gelatinous
MD12 277 23-07-12 P1 A grey rugous big

62
MD12 277 23-07-12 SWAP1 A white flowery dry
MD12 292 23-07-12 P1 A beige creamy flowery big
MD12 B brown creamy
MD12 267 23-07-12 P1 A caramel dry
MD12 B caramel gelatinous
MD12 343 23-07-12 P1 A beige creamy dry
MD12 B brown gelatinous
MD12 57 23-07-12 SWAP1 A brownish yellow relief
MD12 201 23-07-12 P1 A caramel semi-wet
MD12 B brown wet
MD12 370 23-07-12 P1 A beige relief gelatinous
MD12 B beige pale rugous
MD12 577 23-07-12 SWAP1 A greenish beige creamy
MD12 273 23-07-12 SWA A orange spleen
MD12 373 23-07-12 P1 A old orange pale
MD12 438 28-07-12 A1P1 A orange shining wet
MD12 386 23-07-12 P1 A beige atomic bomb shape gelatinous
MD12 B beige translucide
MD12 C light yellow creamy
MD12 337 23-07-12 SWAP1 A white atomic bomb shape
MD12 337 23-07-12 P1 A brown translucide semi-wet
MD12 B beige creamy wet
MD12 604 23-07-12 A1P1 A beige opaque semi-wet
MD12 B caramel wet
MD12 586 210712 P1 A beige
MD12 594 210712 p1 A yellow
MD12 B caramel wet

63
MD12 594 210712 SWA A yellow creamy very wet big
MD12 592 210712 P1 A dark beige gelatinous
MD12 B light salmon creamy wet
MD12 584 210712 112 S2 A light orange dry
MD12 B dark yellow
MD12 645 210712 P1A1 A dark beige creamy
MD12 B light yellow
MD12 C beige translucide wet
MD12 D white
MD12 651 210712 SWA A dark salmon
MD12 B light salmon
MD12 651 210712 P1 A orange and black
MD12 B beige gelatinous
MD12 C dark beige
MD12 D white creamy
MD12 219 210712 A1 A dark beige creamy
MD12 B caramel translucide
MD12 C white brownish wet
MD12 D beige spore
MD12 219 210712 SWAP1 A white
MD12 27 70612 1/2S2 A light yellow semi-wet
MD12 B dark yellow wet
MD12 C beige creamy wet
MD12 593 210712 P1 A white shining
MD12 B caramel
MD12 597 210712 P1 A dark red dry small
MD12 B light salmon shining

64
MD12 C dark beige
28/09/12 Sample Number Mother Plating date Medium/Method Colony ID Color Shape 1 Shape 2
MD12 654 210712 A1P1 a dark orange small shining
MD12 B dark yellow gelatinous
MD12 C white brownish small wet
MD12 661 210712 SWAP1 A dark yellow wet
MD12 B dark orange small semi-wet
MD12 653 210712 P1 A dark yellow big wet
MD12 B beige/white creamy
MD12 658 210712 P1 A white translucide small
MD12 575 230712 A1P1 A white brownish semi-wet small
MD12 B grey dry small
MD12 366 230712 A1P1 A light pink dry small
MD12 B dark yellow small semi-wet
MD12 C dark beige big dry
MD12 366 230712 SWAP1 A light yellow small dry
MD12 B dark yellow small semi-wet
MD12 C dark beige big dry
MD12 366 230712 SWAP1 A light yellow small dry
MD12 356 230712 SWAP1 A transparent small
MD12 375 230712 SWAP1 A beige semi-wet small
MD12 B light beige big dry
MD12 389 230712 SWAP1 A orange translucide small
MD12 407 230712 A1P1 A dark yellow small semi-wet
MD12 B light brown dry
MD12 352 230712 A1P1 A light yellow gelatinous wet

65
MD12 B light brown dry
MD12 C beige creamy semi-wet
MD12 D castanho creamy semi-wet
MD12 375 230712 SWA A light orange small dry
MD12 389 230712 A1 P1 A light beige dry
MD12 B dark beige rugous
MD12 552 210712 SWAP1 A dark salmon small semi-wet
MD12 B dark orange small semi-wet
MD12 656 210712 SWAP1 A white small dry
MD12 B dark yellow small semi-wet
MD12 C white creamy small
MD12 658 210712 A1 P1 A light beige translucide and gelatinous wet
MD12 B caramel creamy wet
MD12 C light beige wet translucide
MD12 356 230712 A1P1 A light brown dry
MD12 B light beige gelatinous wet
MD12 C white dry
MD12 206 230712 A1P1 A brown semi-wet
MD12 B beige semi-wet creamy
MD12 C dark yellow gelatinous wet
MD12 266 230712 SWAP1 A dark pink small semi-wet
MD12 B light pink small wet
MD12 275 230712 A1P1 A yellow translucide wet small
MD12 B light salmon creamy small semi-wet
MD12 C light pink semi-wet small
MD12 D beige creamy small wet
MD12 285 230712 A1P1 A light salmon creamy dry

66
MD12 B dark yellow dry
MD12 C white brownish semi-wet
MD12 D white opaque dry
MD12 E beige dry
MD12 F salmon small semi-wet
MD12 273 230712 A1P1 A dark beige gelatinous wet
MD12 B dark beige semi-wet
MD12 388 230712 A1P1 A brown small wet
MD12 B beige wet small
MD12 C white brownish creamy small
MD12 D dark yellow small dry
MD12 388 230712 SWAP1 A yellow small semi-wet
MD12 336 230712 A1P1 A caramel small semi-wet
MD12 B caramel dry
MD12 374 230712 A1P1 A light salmon semi-wet small
MD12 B green earth dry
MD12 372 230712 A1P1 A beige creamy semi-wet
MD12 B dark beige gelatinous wet
MD12 376 230712 A1P1 A dark yellow small dry
MD12 B dark beige semi-wet creamy
MD12 C light beige semi-wet creamy
MD12 380 230712 SWAP1 A light orange small wet
MD12 354 230712 A1P1 A brown semi-wet
MD12 B light brown semi-wet
MD12 C beige translucide wet big
MD12 D beige creamy wet
MD12 259 230712 A1P1 A light pink dry

67
MD12 B dark beige dry
01/10/12 Sample Number Mother Plating date Medium/Method Colony ID Color Shape 1 Shape 2
MD12 466 23-07-12 A1P1 A light yellow
MD12 B yellow small semi-wet
MD12 415 23-07-12 A1P1 A dark beige wet small
MD12 B light brown wet small
MD12 264 23-07-12 A1P1 A caramel dry
MD12 B beige creamy wet
MD12 C brick color small wet
MD12 406 23-07-12 A1P1 A light salmon dry small
MD12 B white brownish semi-wet small
MD12 B dark beige dry
MD12 390 23-07-12 A1P1 A beige creamy wet
MD12 B light beige dry
MD12 380 23-07-12 A1P1 A beige dry
MD12 B white brownish semi-wet big
MD12 285 23-07-12 A1P1 A white wet
MD12 268 23-07-12 A1P1 A white semi-wet
MD12 567 23-07-12 A1P1 A light salmon small dry
MD12 242 21-07-12 A1P1 A orange wet
MD12 521 21-07-12 SWAP1 A transparent dry small
MD12 279 23-07-12 SWAP1 A light pink aqueous wet small
MD12 B dark salmon small semi-wet
MD12 292 23-07-12 SWAP1 A white creamy wet small
MD12 B orange wet small
MD12 C white dry

68
MD12 371 23-07-12 A1P1 A dark yellow dry
MD12 B caramel dry
MD12 340 21-07-12 SWAP1 A transparent small dry
MD12 535 21-07-12 SWAP1 A yellow creamy wet small
MD12 B salmon wet
MD12 C light salmon wet
MD12 D white semi-wet
MD12 655 21-07-12 SWAP1 A light pink translucide small wet
MD12 B dark yellow small semi-wet
MD12 C dark yellow translucide small wet
MD12 345 21-07-12 A1P1 A white dry
MD12 650 21-07-12 A1 P1 A brick color wet
MD12 B dark beige gelatinous wet
MD12 C beige wet
MD12 226 21-07-12 A1P1 A beige dry
MD12 B orange dry
MD12 C brown semi-wet
MD12 629 21-07-12 A1P1 A beige creamy wet
MD12 B beige semi-wet
MD12 234 21-07-12 SWAP1 A orange small semi-wet
MD12 234 21-07-12 A1P1 A beige gelatinous wet
MD12 B dark beige semi-wet
MD12 381 23-07-12 SWAP1 A yellow semi-wet small
MD12 B light yellow semi-wet
MD12 402 23-07-12 A1P1 A beige semi-wet
MD12 B beige creamy wet

69
02/10/12 Sample Number Mother Plating date Medium/Method Colony ID Color Shape 1 Shape 2
MD12 404 23-07-12 SWAP1 A white wet
MD12 B orange small semi-wet
MD12 648 21-07-12 A1 A white dry small
MD12 381 21-07-12 A1P1 A orange wet
MD12 662 21-07-12 A1P1 A light pink dry
MD12 B beige creamy semi-dry
MD12 540 21-07-12 A1P1 A dark beige creamy small wet
MD12 643 21-07-12 A1P1 A caramel translucide dry
MD12 306 21-07-12 A1P1 A light salmon semi-wet small
MD12 301 21-07-12 A1P1 A orange dry
MD12 unknown unknown A1P1 A dark orange dry
MD12 B dark salmon dry
MD12 549 21-07-12 SWAP1 A light pink wet small
MD12 446 21-07-12 SWAP1 A pink semi-wet small
MD12 530 21-07-12 A1 A salmon semi-wet
MD12 546 21-07-12 A1P1 A yellow semi-wet
MD12 412 23-07-12 SWAP1 A light yellow translucide small wet
MD12 372 11-06-12 A1S2 A yellow fluorescent wet
MD12 85 7-06-12 1/2S1 A dark yellow wet small
MD12 296 11-06-12 A1 A salmon semi-wet
MD12 150 8-06-12 1/2S2 A dark yellow wet small
MD12 72 7-06-12 1/2S1 A light yellow wet
MD12 B dark yellow wet
MD12 373 11-06-12 1/2S2 A light yellow rugous dry
MD12 32 7-06-12 A1P1 A brown rugous semi-wet
MD12 B light beige with halo dry
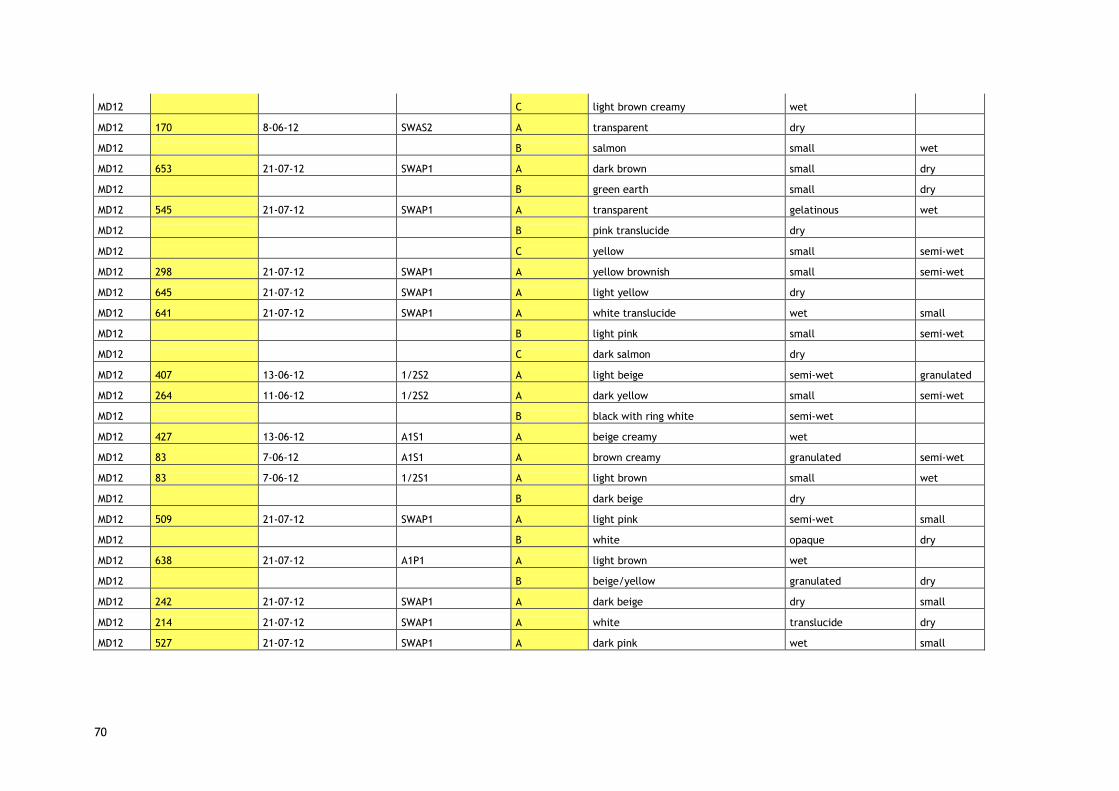
70
MD12 C light brown creamy wet
MD12 170 8-06-12 SWAS2 A transparent dry
MD12 B salmon small wet
MD12 653 21-07-12 SWAP1 A dark brown small dry
MD12 B green earth small dry
MD12 545 21-07-12 SWAP1 A transparent gelatinous wet
MD12 B pink translucide dry
MD12 C yellow small semi-wet
MD12 298 21-07-12 SWAP1 A yellow brownish small semi-wet
MD12 645 21-07-12 SWAP1 A light yellow dry
MD12 641 21-07-12 SWAP1 A white translucide wet small
MD12 B light pink small semi-wet
MD12 C dark salmon dry
MD12 407 13-06-12 1/2S2 A light beige semi-wet granulated
MD12 264 11-06-12 1/2S2 A dark yellow small semi-wet
MD12 B black with ring white semi-wet
MD12 427 13-06-12 A1S1 A beige creamy wet
MD12 83 7-06-12 A1S1 A brown creamy granulated semi-wet
MD12 83 7-06-12 1/2S1 A light brown small wet
MD12 B dark beige dry
MD12 509 21-07-12 SWAP1 A light pink semi-wet small
MD12 B white opaque dry
MD12 638 21-07-12 A1P1 A light brown wet
MD12 B beige/yellow granulated dry
MD12 242 21-07-12 SWAP1 A dark beige dry small
MD12 214 21-07-12 SWAP1 A white translucide dry
MD12 527 21-07-12 SWAP1 A dark pink wet small

71
MD12 527 21-07-12 A1P1 A dark pink wet small
MD12 217 21-07-12 A1P1 A brown point with dark beige ring wet small
MD12 522 21-0712 SWAP1 A dark yellow dry small
31/10/12 Sample Number Mother Plating date Medium/Method Colony ID Color Shape 1 Shape 2
MD12 232 21-07-12 A1P1 A orange small gelatinous
MD12 157 8-06-12 SWAS2 A beige point whith white ring semi-wet
MD12 B beige and shining semi-wet small
MD12 145 8-06-12 SWAS2 A white flour dry small
MD12 B brick color small dry
MD12 C black whith grey ring small
MD12 145 8-06-12 A1S2 A light orange with beige extension dry
MD12 127 8-06-12 1/2S2 A lemon yellow semi-wet
MD12 unknown unknown A1 A beige granulated semi-wet
MD12 B dirty beige dry
MD12 554 15-06-12 SWAS2 A brown earth shining and wet small
MD12 105 8-06-12 1/2S2 A dark yellow small semi-wet
MD12 B beige creamy opaque wet
MD12 321 11-06-12 A1S2 A old orange rugous semi-wet
MD12 B dark beige gelatinous wet
MD12 27 30-07-12 SWAP1 A dirty orange dry small
MD12 B light yellow translucide small semi-wet
MD12 46 30-07-12 SWAP1 A orange translucide small wet
MD12 36 30-07-12 SWAP1 A yellow ocher
MD12 337 11-06-12 SWAS2 A beige translucide small wet
MD12 321 11-06-12 SWAS2 A beige creamy wet small
MD12 220 21-07-12 SWAP1 A light pink translucide small semi-wet

72
MD12 519 21-07-12 SWA A dark yellow dry small
MD12 252 21-07-12 A1P1 A dark beige creamy big semi-wet
MD12 516 21-07-12 A1P1 A yellow shining wet small
MD12 B beige creamy translucide big wet
MD12 516 21-07-12 SWAP1 A white opaque small and dry
MD12 375 23-07-12 SWA A light orange small dry
MD12 511 21-07-12 SWAP1 A light pink translucide small wet
MD12 511 21-07-12 A1P1 A darl salmon wet small
MD12 552 21-07-12 SWAP1 A dark salmon small semi-wet
MD12 B yellow shining small wet
MD12 C light brown small wet
MD12 D dark yellow creamy semi-wet
MD12 F dark brown small wet
MD12 109 8-06-12 1/2S2 A amarelo/orange small semi-wet
MD12 B beige creamy wet
04/10/12 Sample Number Mother Plating date Medium/Method Colony ID Color Shape 1 Shape 2
MD12 487 13-06-12 1/2S2 A white star semi-wet
+MD12 479 13-06-12 1/2S2 A beige atomic bomb shape granulated
MD12 238 21-07-12 A1P1 A dirty white translucide wet gelatinous
MD12 414 13-06-12 1/2S2 A beige opaque semi-wet
MD12 445 13-06-12 A1S2 A green earth rugous semi-wet
MD12 445 13-0612 1/2S2 A dark beige small wet
MD12 B light beige semi-wet small
MD12 C transparent dry small
MD12 445 13-06-12 SWAS2 A beige creamy small wet
MD12 B light orange small semi-wet

73
MD12 C white creamy
MD12 D beige semi-wet
MD12 443 13-06-12 A1S2 A dark beige dry
MD12 170 8-06-12 A1S2 A light orange semi-wet
MD12 70 7-06-12 A1S1 A brown rugous dry and small
MD12 188 8-06-12 1/2S2 A red small wet
MD12 B dark yellow dry
MD12 C yellow small semi-wet
MD12 D white dry
MD12 381 11-06-12 A1S2 A dark beige rugous semi-wet
MD12 B beige granulated semi-wet
MD12 359 11-06-12 SWAS2 A white star small semi-wet
MD12 375 11-06-12 SWAS2 A dark beige translucide small semi-wet
MD12 385 11-06-12 SWAS2 A white translucide semi-wet
MD12 381 11-06-12 SWAS2 A white shining semi-wet
MD12 308 11-06-12 SWAS2 A dark beige small creamy
MD12 B white dry
MD12 275 11-06-12 A1S2 A brown gelatinous wet
MD12 285 11-06-12 A1S2 A old orange gelatinous wet
MD12 337 11-06-12 172S2 A bright yellow semi-wet
MD12 183 8-06-12 A1S2 A old orange dry
MD12 600 21-07-12 SWAP1 A yellow translucide small wet
MD12 538 14-06-12 1/2S2 A dark green wet
MD12 538 14-06-12 A1S2 A yellow wet
MD12 B light brown wet
MD12 568 23-07-12 A1P1 A yellow semi-wet
MD12 B orange semi-wet

74
MD12 C dark orange dry
MD12 588 23-07-12 A1P1 A light pink dry
MD12 B light yellow gelatinous wet
MD12 C yellow/orange wet
MD12 575 23-07-12 A1P1 A orange wet
MD12 B brown wet
MD12 506 21-07-12 A1P1 A dark salmon small semi-wet
MD12 B dark oprange small semi-wet
MD12 C light pink translucide gelatinous wet
MD12 443 13-06-12 1/2S2 A light salmon wet
MD12 350 11-06-12 1/2S2 A dark orange with black spores dry
MD12 543 21-07-12 A1P1 A brown/yellow semi-wet
MD12 303 21-07-12 A1 P1 A light salmon semi-wet
MD12 514 21-0712 A1 P1 A dark red with grey
MD12 B brown/orange dry
MD12 433 13-06-12 A1S2 A dark red dry
MD12 525 21-07-12 A1P1 A light salmon wet
MD12 519 21-07-12 A1P1 A dark salmon creamy wet
MD12 B salmon semi-wet
MD12 C light salmon semi-wet
MD12 548 21-07-12 SWAP1 A pink translucide semi-wet
MD12 561 23-07-12 A1P1 A pink translucide gelatinous wet
MD12 25 7-06-12 1/2S1 A brown with light brown ring wet
MD12 32 7-06-12 SWAS1 A baby pink dry
MD12 B light yellow granulated wet
MD12 512 21-07-12 A1P1 A old orange dry
MD12 B light yellow granulated wet
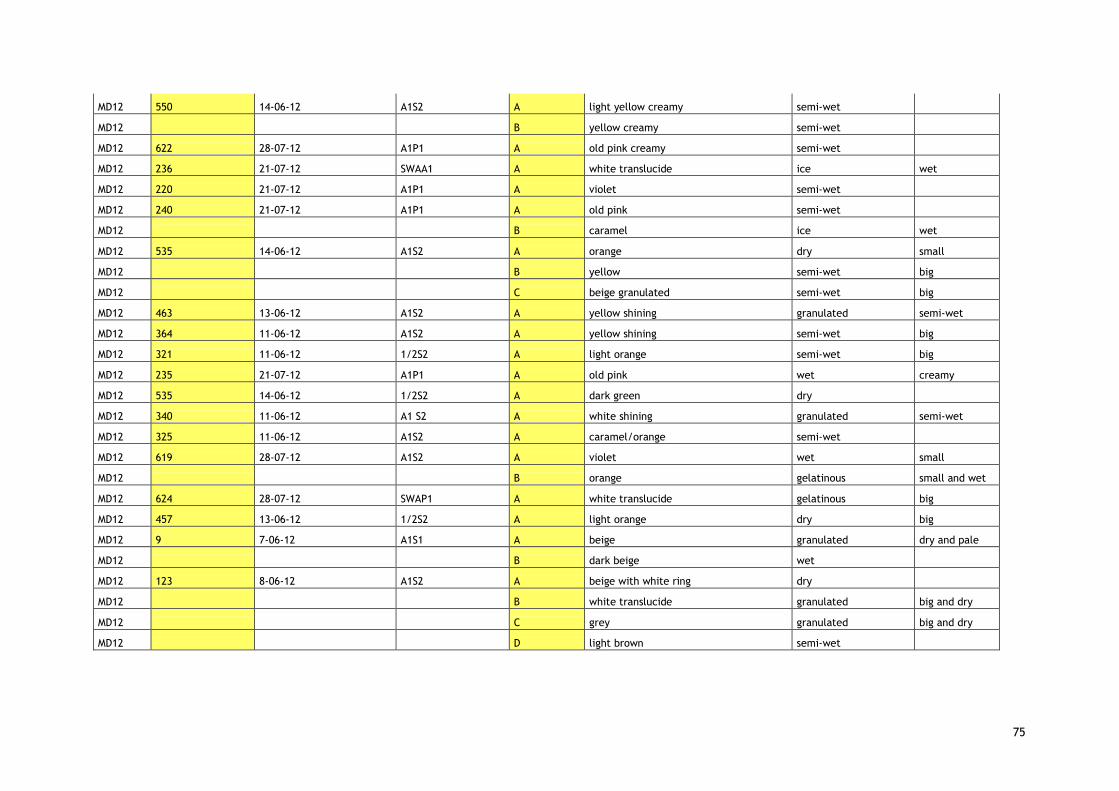
75
MD12 550 14-06-12 A1S2 A light yellow creamy semi-wet
MD12 B yellow creamy semi-wet
MD12 622 28-07-12 A1P1 A old pink creamy semi-wet
MD12 236 21-07-12 SWAA1 A white translucide ice wet
MD12 220 21-07-12 A1P1 A violet semi-wet
MD12 240 21-07-12 A1P1 A old pink semi-wet
MD12 B caramel ice wet
MD12 535 14-06-12 A1S2 A orange dry small
MD12 B yellow semi-wet big
MD12 C beige granulated semi-wet big
MD12 463 13-06-12 A1S2 A yellow shining granulated semi-wet
MD12 364 11-06-12 A1S2 A yellow shining semi-wet big
MD12 321 11-06-12 1/2S2 A light orange semi-wet big
MD12 235 21-07-12 A1P1 A old pink wet creamy
MD12 535 14-06-12 1/2S2 A dark green dry
MD12 340 11-06-12 A1 S2 A white shining granulated semi-wet
MD12 325 11-06-12 A1S2 A caramel/orange semi-wet
MD12 619 28-07-12 A1S2 A violet wet small
MD12 B orange gelatinous small and wet
MD12 624 28-07-12 SWAP1 A white translucide gelatinous big
MD12 457 13-06-12 1/2S2 A light orange dry big
MD12 9 7-06-12 A1S1 A beige granulated dry and pale
MD12 B dark beige wet
MD12 123 8-06-12 A1S2 A beige with white ring dry
MD12 B white translucide granulated big and dry
MD12 C grey granulated big and dry
MD12 D light brown semi-wet

76
MD12 391 13-06-12 1/2S2 A beige with a white points dry big
MD12 27 7-06-12 A1S1 A dark red rugous dry
MD12 480 28-07-12 A1P1 A caramel ice wet
MD12 B orange semi-wet
MD12 C black semi-wet semi-wet
MD12 547 14-06-12 1/2S2 A green earth wet

77
Annex 2- Level intensity with Nile red of strains.
A2 plate Mother plate
Date Colony ID Intensity level
A2 plate Mother plate
Date Colony ID
Intensity signal
MD12 1 244 18-09-12 A - MD12 311 527 02-10-12 A +
MD12 2 224 18-09-12 A - MD12 312 214 02-10-12 A +
MD12 3 642 18-09-12 A + MD12 313 249 02-10-12 A +
MD12 4 212 18-09-12 B + MD12 314 638 02-10-12 A -
MD12 5 279 18-09-12 A + MD12 315 109 02-10-12 B -
MD12 6 652 18-09-12 A - MD12 316 511 02-10-12 F +
MD12 7 582 18-09-12 B + MD12 317 511 02-10-12 C -
MD12 8 341 19-09-12 B - MD12 318 511 02-10-12 D -
MD12 9 367 19-09-12 A - MD12 319 511 02-10-12 B +
MD12 10 255 19-09-12 A + MD12 320 511 02-10-12 A +
MD12 11 338 19-09-12 A - MD12 321 511 02-10-12 A +
MD12 12 655 18-09-12 B + MD12 322 516 02-10-12 A -
MD12 13 531 18-09-12 A - MD12 323 516 02-10-12 B -
MD12 14 531 18-09-12 B - MD12 324 516 02-10-12 A -
MD12 15 531 18-09-12 C - MD12 325 252 02-10-12 A -
MD12 16 657 18-09-12 A - MD12 326 519 02-10-12 A +
MD12 17 535 18-09-12 B + MD12 327 321 02-10-12 A +
MD12 18 535 18-09-12 A + MD12 328 337 02-10-12 A -
MD12 19 276 18-09-12 B - MD12 329 427 02-10-12 A -
MD12 20 553 18-09-12 A + MD12 330 264 02-10-12 B -
MD12 21 382 18-09-12 A - MD12 331 407 02-10-12 A -
MD12 22 279 18-09-12 A + MD12 332 545 02-10-12 C -
MD12 23 208 18-09-12 A - MD12 333 545 02-10-12 B -
MD12 24 208 18-09-12 B - MD12 334 545 02-10-12 A -

78
MD12 25 203 18-09-12 A + MD12 335 567 01-10-12 A -
MD12 26 311 18-09-12 B - MD12 336 242 01-10-12 A +
MD12 27 9 18-09-12 B - MD12 337 286 01-10-12 A +
MD12 28 255 19-09-12 A + MD12 338 268 01-10-12 A -
MD12 29 331 14-09-12 A - MD12 339 285 01-10-12 A -
MD12 30 340 19-09-12 A + MD12 340 380 01-10-12 B -
MD12 31 287 19-09-12 A - MD12 341 380 01-10-12 A -
MD12 32 52 14-09-12 A - MD12 342 390 01-10-12 B -
MD12 33 255 14-09-12 A + MD12 343 390 01-10-12 A -
MD12 34 257 18-09-12 A + MD12 344 406 01-10-12 B -
MD12 35 642 18-09-12 A - MD12 345 406 01-10-12 A -
MD12 36 9 14-09-12 A - MD12 346 264 01-10-12 C -
MD12 37 299 12-09-12 A + MD12 347 264 01-10-12 B
MD12 38 384 14-09-12 A + MD12 348 264 01-10-12 A -
MD12 39 352 14-09-12 B - MD12 349 415 01-10-12 B -
MD12 40 5 12-10-12 C + MD12 350 415 01-10-12 A -
MD12 41 175 12-10-12 A + MD12 351 466 01-10-12 B +
MD12 42 528 12-10-12 B + MD12 352 240 01-10-12 B -
MD12 43 528 12-10-12 A - MD12 353 240 01-10-12 A +
MD12 44 396 12-10-12 A - MD12 354 220 01-10-12 A +
MD12 45 545 12-10-12 B + MD12 355 236 01-10-12 A -
MD12 46 213 12-10-12 B + MD12 356 622 01-10-12 A -
MD12 47 213 12-10-12 A + MD12 357 512 01-10-12 B -
MD12 48 576 12-10-12 C + MD12 358 512 01-10-12 A -
MD12 49 214 12-10-12 B - MD12 359 23 01-10-12 B -
MD12 50 157 12-10-12 A + MD12 360 32 01-10-12 A -
MD12 51 157 12-10-12 B + MD12 361 25 01-10-12 A -

79
MD12 52 555 12-10-12 A - MD12 362 561 01-10-12 A -
MD12 53 123 12-10-12 A + MD12 363 525 01-10-12 A -
MD12 54 123 12-10-12 B - MD12 364 433 01-10-12 A -
MD12 55 487 12-10-12 A - MD12 365 514 01-10-12 B -
MD12 56 187 12-10-12 A + MD12 366 514 01-10-12 A -
MD12 57 119 12-09-12 A - MD12 367 27 01-10-12 A -
MD12 58 361 12-10-12 A - MD12 368 341 01-10-12 A -
MD12 59 512 12-10-12 A - MD12 369 303 01-10-12 A -
MD12 60 599 19-09-12 B - MD12 370 543 01-10-12 A -
MD12 61 333 19-09-12 A + MD12 371 350 01-10-12 A -
MD12 62 288 19-09-12 A + MD12 372 443 01-10-12 A +
MD12 63 315 18-09-12 A - MD12 373 506 01-10-12 C -
MD12 64 274 19-09-12 C + MD12 374 506 01-10-12 B -
MD12 65 271 19-09-12 B + MD12 375 506 01-10-12 A -
MD12 66 271 19-09-12 A - MD12 376 558 01-10-12 B -
MD12 67 271 19-09-12 B - MD12 377 558 01-10-12 A +
MD12 68 346 19-09-12 A - MD12 378 560 01-10-12 A -
MD12 69 425 19-09-12 B - MD12 379 568 01-10-12 B -
MD12 70 423 19-09-12 B - MD12 380 568 01-10-12 A +
MD12 71 72 19-09-12 B ++ MD12 381 123 01-10-12 C -
MD12 72 257 18-09-12 B - MD12 382 123 01-10-12 B -
MD12 73 274 19-09-12 A - MD12 383 123 01-10-12 A -
MD12 74 282 19-09-12 A - MD12 384 9 01-10-12 B -
MD12 75 423 19-09-12 A - MD12 385 9 01-10-12 A -
MD12 76 420 19-09-12 A - MD12 386 457 01-10-12 A -
MD12 77 425 19-09-12 A + MD12 387 624 01-10-12 A -
MD12 78 420 19-09-12 A + MD12 388 624 01-10-12 B -

80
MD12 79 355 19-09-12 A - MD12 389 619 01-10-12 B -
MD12 80 45 19-09-12 A - MD12 390 325 01-10-12 A -
MD12 81 45 19-09-12 B - MD12 391 340 01-10-12 A -
MD12 82 135 19-09-12 D + MD12 392 535 01-10-12 A -
MD12 83 456 12-09-12 A - MD12 393 235 01-10-12 A +
MD12 84 513 12-09-12 A - MD12 394 445 01-10-12 D -
MD12 85 183 12-09-12 B + MD12 395 445 01-10-12 C -
MD12 86 183 12-09-12 A - MD12 396 445 01-10-12 A -
MD12 87 384 12-09-12 C - MD12 397 414 01-10-12 A -
MD12 88 352 12-09-12 A + MD12 398 414 01-10-12 A ++
MD12 89 352 12-09-12 D - MD12 399 238 01-10-12 A -
MD12 90 137 12-09-12 B + MD12 400 479 01-10-12 A -
MD12 91 5 12-09-12 A - MD12 401 487 01-10-12 B +
MD12 92 517 12-09-12 C + MD12 402 538 01-10-12 A -
MD12 93 294 12-09-12 A - MD12 403 463 01-10-12 C +
MD12 94 99 12-09-12 A - MD12 404 535 01-10-12 B -
MD12 95 454 12-09-12 A - MD12 405 535 01-10-12 A -
MD12 96 5 12-09-12 B - MD12 406 547 01-10-12 C -
MD12 97 183 12-09-12 B - MD12 407 480 01-10-12 A -
MD12 98 183 12-09-12 A - MD12 408 660 01-10-12 B -
MD12 99 12-09-12 A + MD12 409 285 01-10-12 A -
MD12 100 517 12-09-12 B + MD12 410 188 01-10-12 A -
MD12 101 361 12-09-12 B - MD12 411 70 01-10-12 A +
MD12 102 187 12-09-12 B - MD12 412 170 01-10-12 A +
MD12 103 517 12-09-12 A ++ MD12 413 232 03-10-12 A +
MD12 104 35 12-09-12 A - MD12 414 337 04-10-12 A -
MD12 105 107 12-09-12 A - MD12 415 183 04-10-12 A -

81
MD12 106 170 12-09-12 A - MD12 416 275 04-10-12 A -
MD12 107 352 14-09-12 C + MD12 417 308 04-10-12 B -
MD12 108 400 14-09-12 A - MD12 418 308 04-10-12 A +
MD12 109 338 19-09-12 A - MD12 419 375 04-10-12 A -
MD12 110 278 19-09-12 A - MD12 420 359 04-10-12 A -
MD12 111 135 19-09-12 C - MD12 421 381 04-10-12 B -
MD12 112 135 19-09-12 B - MD12 422 381 04-10-12 A -
MD12 113 135 19-09-12 A - MD12 423 165 04-10-12 D -
MD12 114 114 20-09-12 C - MD12 424 165 04-10-12 C -
MD12 115 333 19-09-12 A + MD12 425 165 04-10-12 B -
MD12 116 341 19-09-12 A - MD12 426 188 04-10-12 B -
MD12 117 590 19-09-12 A + MD12 427 36 03-10-12 A -
MD12 118 275 20-09-12 B - MD12 428 27 03-10-12 A -
MD12 119 114 20-09-12 B - MD12 429 Unknown 03-10-12 B -
MD12 120 378 20-09-12 A - MD12 430 145 03-10-12 A -
MD12 121 261 20-09-12 B + MD12 431 145 03-10-12 C -
MD12 122 261 20-09-12 A - MD12 432 145 03-10-12 B -
MD12 123 347 20-09-12 A - MD12 433 145 03-10-12 A -
MD12 124 347 20-09-12 A + MD12 434 157 03-10-12 B +
MD12 125 594 24-09-12 A ++ MD12 435 157 03-10-12 A +
MD12 126 594 24-09-12 B + MD12 436 255 11-10-12 2 -
MD12 127 594 24-09-12 A + MD12 437 255 11-10-12 1B -
MD12 128 290 20-09-12 A - MD12 438 311 11-10-12 2A +
MD12 129 269 20-09-12 A + MD12 439 311 11-10-12 1A -
MD12 130 553 20-09-12 A + MD12 440 288 11-10-12 2A -
MD12 131 490 20-09-12 A - MD12 441 576 11-10-12 2A -
MD12 132 490 20-09-12 B - MD12 442 576 11-10-12 1A -

82
MD12 133 133 20-09-12 C + MD12 443 251 11-10-12 2A -
MD12 134 411 20-09-12 A + MD12 444 251 11-10-12 1A -
MD12 135 411 20-09-12 B - MD12 445 59 11-10-12 2A -
MD12 136 387 20-09-12 A - MD12 446 59 11-10-12 1A -
MD12 137 118 21-09-12 A - MD12 447 251 11-10-12 1B -
MD12 138 22 21-09-12 A + MD12 448 231 11-10-12 1A +
MD12 139 111 21-09-12 D + MD12 449 231 11-10-12 2 +
MD12 140 111 21-09-12 B + MD12 450 274 11-10-12 2 +
MD12 141 111 21-09-12 A - MD12 451 404 11-10-12 1A -
MD12 142 348 29-09-12 B + MD12 452 598 11-10-12 1A -
MD12 143 348 29-09-12 A - MD12 453 288 11-10-12 1B -
MD12 144 342 29-09-12 A - MD12 454 274 11-10-12 1B +
MD12 145 245 21-09-12 B + MD12 455 231 11-10-12 2A -
MD12 146 245 21-09-12 A + MD12 456 231 11-10-12 1A +
MD12 147 523 21-09-12 A - MD12 457 251 11-10-12 3B -
MD12 148 45 21-09-12 D - MD12 458 251 11-10-12 B -
MD12 149 45 21-09-12 C - MD12 459 107 11-10-12 1B -
MD12 150 45 21-09-12 B - MD12 460 404 11-10-12 2A -
MD12 151 45 21-09-12 A - MD12 461 438 11-10-12 A -
MD12 152 22 21-09-12 B - MD12 462 569 11-10-12 A -
MD12 153 339 20-09-12 B + MD12 463 569 11-10-12 A -
MD12 154 339 20-09-12 A + MD12 464 554 11-10-12 2A -
MD12 155 652 20-09-12 B - MD12 465 554 11-10-12 1A -
MD12 156 630 21-09-12 B - MD12 466 665 11-10-12 A -
MD12 157 630 21-09-12 A - MD12 467 276 11-10-12 1A -
MD12 158 216 21-09-12 A + MD12 468 632 11-10-12 D -
MD12 159 374 21-09-12 B - MD12 469 513 11-10-12 1B -

83
MD12 160 625 21-09-12 A - MD12 470 282 11-10-12 2A +
MD12 161 269 24-09-12 A - MD12 471 282 11-10-12 1A +
MD12 162 291 24-09-12 B - MD12 472 569 11-10-12 2 +
MD12 163 291 24-09-12 A - MD12 473 569 11-10-12 1D -
MD12 164 258 24-09-12 A + MD12 474 114 11-10-12 2A -
MD12 165 200 24-09-12 B - MD12 475 114 11-10-12 1A -
MD12 166 75 24-09-12 B - MD12 476 282 11-10-12 3A +
MD12 167 75 24-09-12 A + MD12 477 254 11-10-12 3A +
MD12 168 159 24-09-12 B + MD12 478 254 11-10-12 1A -
MD12 169 159 24-09-12 A - MD12 479 254 11-10-12 A2 -
MD12 170 10 24-09-12 D - MD12 480 340 11-10-12 2B -
MD12 171 10 24-09-12 A - MD12 481 340 11-10-12 1B -
MD12 172 246 24-09-12 B + MD12 482 255 11-10-12 2A -
MD12 173 245 24-09-12 A + MD12 483 255 11-10-12 1A -
MD12 174 219 24-09-12 C + MD12 484 582 11-10-12 2A +
MD12 175 219 24-09-12 B - MD12 485 544 11-10-12 1A -
MD12 176 219 24-09-12 A - MD12 486 582 11-10-12 1A -
MD12 177 651 24-09-12 D + MD12 487 544 11-10-12 2A -
MD12 178 651 24-09-12 C + MD12 488 57 11-10-12 1A -
MD12 179 651 24-09-12 B - MD12 489 57 16-10-12 2A +
MD12 180 651 24-09-12 B - MD12 490 319 11-10-12 2A -
MD12 181 651 24-09-12 A - MD12 491 319 11-10-12 2A -
MD12 182 277 24-09-12 A - MD12 492 201 16-10-12 3A -
MD12 183 292 24-09-12 B - MD12 493 201 16-10-12 1A +
MD12 184 292 24-09-12 A + MD12 494 201 16-10-12 4B -
MD12 185 597 24-09-12 B + MD12 495 201 16-10-12 3 -
MD12 186 597 24-09-12 A + MD12 496 201 16-10-12 1B -

84
MD12 187 593 24-09-12 B - MD12 497 642 16-10-12 3B +
MD12 188 27 24-09-12 C - MD12 498 201 16-10-12 1A +
MD12 189 27 24-09-12 B + MD12 499 642 16-10-12 2B +
MD12 190 27 24-09-12 A + MD12 500 201 16-10-12 1B ++
MD12 191 219 24-09-12 D - MD12 501 373 16-10-12 2A -
MD12 192 593 24-09-12 A + MD12 502 373 16-10-12 1A -
MD12 193 584 24-09-12 B - MD12 503 27 16-10-12 2D -
MD12 194 370 24-09-12 B - MD12 504 27 16-10-12 1D +
MD12 195 370 24-09-12 A + MD12 505 277 16-10-12 2A -
MD12 196 343 24-09-12 B - MD12 506 277 16-10-12 1A -
MD12 197 343 24-09-12 A - MD12 507 553 16-10-12 2B -
MD12 198 373 24-09-12 A - MD12 508 553 16-10-12 1B -
MD12 199 604 24-09-12 B + MD12 509 513 15-10-12 1B -
MD12 200 577 24-09-12 A + MD12 510 72 15-10-12 2A -
MD12 201 604 24-09-12 A - MD12 511 72 15-10-12 1A ++
MD12 202 337 24-09-12 A - MD12 512 281 15-10-12 2A -
MD12 203 386 24-09-12 C + MD12 513 281 15-10-12 1A -
MD12 204 386 24-09-12 B + MD12 514 237 15-10-12 3A -
MD12 205 386 24-09-12 A + MD12 515 237 15-10-12 2A -
MD12 206 645 24-09-12 D - MD12 516 597 16-10-12 1B +
MD12 207 645 24-09-12 C - MD12 517 597 16-10-12 2B -
MD12 208 645 24-09-12 B - MD12 518 292 16-10-12 1A ++
MD12 209 404 02-10-12 B + MD12 519 292 16-10-12 2A +
MD12 210 404 02-10-12 A - MD12 520 10 16-10-12 1B -
MD12 211 648 02-10-12 A - MD12 521 10 16-10-12 1C -
MD12 212 306 02-10-12 A - MD12 522 626 16-10-12 2A +
MD12 213 634 02-10-12 A + MD12 523 626 16-10-12 1A -

85
MD12 214 662 02-10-12 B + MD12 524 558 16-10-12 3B -
MD12 215 656 02-10-12 B - MD12 525 258 16-10-12 2B -
MD12 216 656 28-09-12 A - MD12 526 258 16-10-12 1B -
MD12 217 389 28-09-12 B - MD12 527 10 16-10-12 2E -
MD12 218 389 28-09-12 A - MD12 528 10 16-10-12 1E -
MD12 219 375 28-09-12 A - MD12 529 296 25-10-12 4A -
MD12 220 357 28-09-12 D + MD12 530 234 25-10-12 1A -
MD12 221 352 28-09-12 C - MD12 531 292 25-10-12 1C +
MD12 222 352 28-09-12 B ++ MD12 532 301 02-10-12 A -
MD12 223 352 28-09-12 A + MD12 533 10 16-10-12 C -
MD12 224 549 02-10-12 A - MD12 534 10 16-10-12 B -
MD12 225 546 02-10-12 A - MD12 535 237 15-10-12 A -
MD12 226 562 02-10-12 A +++ MD12 536 292 25-10-12 2C -
MD12 227 259 28-09-12 B - MD12 537 83 25-10-12 1C -
MD12 228 530 02-10-12 A - MD12 538 509 25-10-12 1B +
MD12 229 356 28-09-12 C - MD12 539 509 25-10-12 3B -
MD12 230 356 28-09-12 B + MD12 540 638 25-10-12 2B -
MD12 231 354 28-09-12 A - MD12 541 638 25-10-12 1B -
MD12 232 259 28-09-12 A - MD12 542 296 25-10-12 1A -
MD12 233 373 28-09-12 A - MD12 543 296 25-10-12 2A -
MD12 234 366 28-09-12 C - MD12 544 296 25-10-12 3A -
MD12 235 356 28-09-12 A - MD12 545 535 25-10-12 1B -
MD12 236 658 28-09-12 B - MD12 546 345 25-10-12 1A -
MD12 237 658 28-09-12 A - MD12 547 234 25-10-12 A -
MD12 238 258 28-09-12 E - MD12 548 535 25-10-12 2B -
MD12 239 380 28-09-12 A - MD12 549 656 25-10-12 2B -
MD12 240 376 28-09-12 C - MD12 550 656 25-10-12 1B +

86
MD12 241 385 28-09-12 F - MD12 551 301 25-10-12 2A -
MD12 242 285 28-09-12 D + MD12 552 301 25-10-12 1A -
MD12 243 285 28-09-12 C - MD12 553 661 25-10-12 2A -
MD12 244 285 28-09-12 B + MD12 554 661 25-10-12 1A -
MD12 245 285 28-09-12 A + MD12 555 388 25-10-12 1A +
MD12 246 273 28-09-12 D - MD12 556 538 02-10-12 1A -
MD12 247 273 28-09-12 C + MD12 557 538 02-10-12 2A -
MD12 248 273 28-09-12 B - MD12 558 538 02-10-12 1A -
MD12 249 266 28-09-12 B + MD12 559 538 02-10-12 2A -
MD12 250 266 28-09-12 A + MD12 560 550 02-10-12 1A -
MD12 251 266 28-09-12 B - MD12 561 550 02-10-12 2A +
MD12 252 266 28-09-12 C + MD12 562 568 02-10-12 1B -
MD12 253 376 28-09-12 B - MD12 563 568 02-10-12 B -
MD12 254 376 28-09-12 A - MD12 564 548 02-04-12 1A +
MD12 255 372 28-09-12 B + MD12 565 548 02-04-12 2A +
MD12 256 372 28-09-12 A + MD12 566 641 02-04-12 1B +
MD12 257 374 28-09-12 B - MD12 567 641 02-04-12 2B -
MD12 258 374 28-09-12 A + MD12 568 298 02-04-12 1A -
MD12 259 388 28-09-12 E - MD12 569 298 02-04-12 2A -
MD12 260 388 28-09-12 D - MD12 570 105 02-04-12 1B -
MD12 261 388 28-09-12 C - MD12 571 105 02-04-12 2B -
MD12 262 388 28-09-12 B - MD12 572 46 02-04-12 1A -
MD12 263 292 01-10-12 A + MD12 573 46 02-04-12 2A -
MD12 264 373 28-09-12 B - MD12 574 321 02-04-12 1A -
MD12 265 273 28-09-12 A - MD12 575 321 02-04-12 2A ++
MD12 266 366 28-09-12 B - MD12 576 641 02-04-12 2C -
MD12 267 575 28-09-12 A - MD12 577 641 02-04-12 1C -

87
MD12 268 653 28-09-12 B - MD12 578 407 02-04-12 2B +
MD12 269 653 28-09-12 A - MD12 579 407 02-04-12 1B +
MD12 270 661 28-09-12 B - MD12 580 266 02-04-12 2A +
MD12 271 654 28-09-12 C - MD12 581 266 02-04-12 1A +
MD12 272 354 28-09-12 D + MD12 582 407 02-04-12 2A +
MD12 273 354 28-09-12 C - MD12 583 407 02-04-12 1A -
MD12 274 354 28-09-12 B + MD12 584 662 02-04-12 A -
MD12 275 366 28-09-12 A - MD12 585 662 02-04-12 1A -
MD12 276 656 28-09-12 A - MD12 586 552 02-04-12 2B -
MD12 277 535 01-10-12 D - MD12 587 552 02-04-12 1B -
MD12 278 371 01-10-12 A - MD12 588 552 02-04-12 1A -
MD12 279 535 01-10-12 C - MD12 589 552 02-04-12 2A -
MD12 280 650 01-10-12 B - MD12 590 DESC 02-04-12 2B +
MD12 281 650 01-10-12 A - MD12 591 Unknown 02-04-12 1B +
MD12 282 629 01-10-12 A - MD12 592 Unknown 02-04-12 2A -
MD12 283 340 01-10-12 A + MD12 593 Unknown 02-04-12 1A -
MD12 284 371 01-10-12 B - MD12 594 658 02-04-12 2C +
MD12 285 292 01-10-12 B + MD12 595 558 02-04-12 1C -
MD12 286 226 01-10-12 C - MD12 596 165 03-10-12 A -
MD12 287 226 01-10-12 B - MD12 597 443 03-10-12 A -
MD12 288 226 01-10-12 D - MD12 598 285 03-10-12 A -
MD12 289 226 01-10-12 A + MD12 599 321 03-10-12 A -
MD12 290 283 01-10-12 A - MD12 600 554 03-10-12 A +
MD12 291 283 01-10-12 B + MD12 601 Unknown 03-10-12 A +
MD12 292 279 01-10-12 B + MD12 602 111 03-10-12 C -
MD12 293 279 01-10-12 A + MD12 603 267 03-10-12 A +
MD12 294 234 01-10-12 A - MD12 604 337 03-10-12 A ++

88
MD12 295 234 01-10-12 B - MD12 605 576 03-10-12 A -
MD12 296 381 01-10-12 A - MD12 606 364 03-10-12 A -
MD12 297 402 01-10-12 A + MD12 607 381 03-10-12 A +
MD12 298 402 01-10-12 B - MD12 608 385 03-10-12 A -
MD12 299 170 02-10-12 B - MD12 609 632 03-10-12 B -
MD12 300 85 02-10-12 A - MD12 610 10 03-10-12 F -
MD12 301 372 02-10-12 A - MD12 611 651 03-10-12 A -
MD12 302 170 02-10-12 A + MD12 612 592 03-10-12 A -
MD12 303 32 02-10-12 C - MD12 613 267 03-10-12 B -
MD12 304 32 02-10-12 A - MD12 614 519 03-10-12 A -
MD12 305 373 02-10-12 A - MD12 615 480 03-10-12 A -
MD12 306 72 02-10-12 B - MD12 616 375 03-10-12 B -
MD12 307 72 02-10-12 A + MD12 617 109 03-10-12 A +
MD12 308 150 02-10-12 A - MD12 618 366 03-10-12 A -
MD12 309 546 02-10-12 A + MD12 619 654 03-10-12 B +


![Molecular Imprinting as a tool for producing Molecularly ... · Molecular Imprinting as a tool for producing Molecularly Intelligent Scaffolds for Tissue Engineering [Título da Tese]](https://img.document.onl/doc/110x75/604d7bd935a49f0da77b89a6/molecular-imprinting-as-a-tool-for-producing-molecularly-molecular-imprinting.jpg)