Embed Size (px)
Citation preview

UM
inho
|201
2
Universidade do Minho
Vítor Sérgio Amorim e Silva
Maio de 2012
Identification and Analysis of RegulatoryComponents of the Mevalonate BiosyntheticPathway in Arabidopsis thaliana usingGenetic Approaches
Escola de Ciências
Víto
r Sé
rgio
Am
orim
e S
ilva
Ide
nti
fica
tio
n a
nd
An
aly
sis
of
Re
gu
lato
ry C
om
po
ne
nts
of
the
Mev
alo
na
te
Bio
syn
the
tic
Pa
thw
ay
in A
rabi
dops
is t
hal
ian
a u
sin
g G
en
eti
c A
pp
roa
che
s

Tese de Doutoramento em CiênciasEspecialidade em Biologia
Trabalho realizado sob a orientação doProf. Doutor Miguel Angel Botellae doProf. Doutor Rui Manuel Tavarese doProf. Doutor Herlânder Azevedo
Universidade do Minho
Vítor Sérgio Amorim e Silva
Maio de 2012
Escola de Ciências
Identification and Analysis of RegulatoryComponents of the Mevalonate BiosyntheticPathway in Arabidopsis thaliana usingGenetic Approaches

iii
ACKNOWLEDGMENTS
First of all, my sincere gratitude goes to my supervisors Miguel Angel Botella, Rui Tavares and Herlânder Azevedo, for giving me the opportunity to perform scientific work, the unconditional support and guidance and, finally, for the critical reading of this manuscript. I am very grateful to Rui Tavares and Herlânder Azevedo for believing in my skills as a scientist, and for the time invested on my training that permitted me to go abroad and apply for a PhD fellowship. A special thanks to Herlânder for teaching me the ground bases of the lab’s work in such a committed way, for the constant coaching regarding laboratory techniques and work planning, but also for the scientific comments and discussion. A special thanks to Rui for the inspiring scientific discussions that helped me project my scientific career and for taking charge of solving all the administrative issues and troubles (not little!) that arose towards the end, with incomparable dedication, which allowed me to totally focus on the scientific work and writing. I am very grateful to Miguel Angel, for welcoming me in his lab so greatly, for believing in me and giving me the opportunity to be a member of his research group, allowing me to participate in his challenging projects, expanding my technical and scientific knowledge. Thank you for your constant guidance and interest on my orientation, to always challenge and push me to go further, for having trained my scientific thinking, not only showing me what to do next but, more important, to make the right decisions about the next step. Thank you for the constant long-distance encouragement, and most of all, for inspiring me with your passionate way of thinking and developing scientific work.
To all my colleagues in Braga I wish to thank them all for the good working atmosphere,
the good-fellowship, and for all the cooperation in the lab. Hoping not to forget anyone, a special thanks goes to those who more closely followed me throughout these years of work: Alice Agasse, Cátia, Joana, Manú, Marta, Paulo, Luís, Conde, Franklin, Natacha, Mafalda and Raúl for all the support during my first steps in the lab. Juliana, Rómulo, Rute, Sara Freitas, Óscar, Daniela, Eva, João, Eduarda, Inês, Cláudia, Francisca, Daniel, Herlânder, Sara and Humberto, thank you for your companionship in and outside the lab during all these years. A special thanks to Professor Teresa and Professor Manuela for all the invaluable guidelines given and also for being such good work colleagues. I also wish to thanks the entire lab teach and investigation technicians of the Biology Department for saving my life so many times. To Eduarda for borrowing me the amazing cDNA tube number eight! A special thanks to Rómulo for teaching me his expertise on constructs. A special thanks to Daniel for being such a good fellow inside and outside the lab. A very special thanks to Sara, whose friendship and companionship I could always expect, since my first beginner steps into the world of science until today, and surely it will continue to be so in the future. Thank you, Sara, for being such a great bench partner during this entire odyssey. A very special thanks to my good friend Humberto, for being always so scientific updated and available to help. You are certainly the most user-friendly “scientific search engine” ever created! Thank you, Humberto, for all the great ideas, for all the passionate scientific discussions and fruitful brainstorming, for being an example of how a scientist should face his work in terms of never ending motivation and high quality standards, but, most of all, thanks for your friendship.

iv
To all my colleagues and friends in Málaga I also wish to express my deep gratitude for the warm welcome, the great working atmosphere and support, for the permanent help and good mood inside the lab and outside, and for their friendship. All of you helped me with your scientific comments and discussion to grow as a scientist! To all the members of the Laboratorio de Bioquímica y Biotecnología Vegetal: Vero, Fabiana, Viviana, Karen, Camilla, Paqui, Ali, Carmen, Cristina, Ana, Itziar, Edu, David, Arni, Victoriano Meco, Naoufal, Irene Araguez, Irene Nevado, Yasmine, and of course Vitoriano Valpuesta, and once again to my supervisor Miguel Angel Botella, thanks for making me feel part of the family. I also which to thanks to all the members of the genetics group in Málaga: Adela, Alberto, Rosa, Manolo, Ana, Tábata, Zaira, Miguel, Edgar, Natacha, Juanjo, Humberto and Eduardo Bejarano for all the support and friendly welcome. Can’t also forget all the people that I met in Churriana lab, for the warm welcome, the great working atmosphere and support, and for the pleasant breakfasts! Also thanks to Lucas for his friendship that undoubtedly helped me a lot during those years of my Ph.D project in Málaga. A special thanks to Manolo for teaching me his expertise with Agro. A special thanks to Edu for all the scientific insight and for the support in my last experiments in Málaga with tobacco. A special thanks to David for helping me a lot during my adaptation to a new lab but and at same time to a new culture. A very special thank you to Abel Rosado Rey and Aureliano Bombarely for all the help and assistance regarding the high throughput sequencings and the bioinformatic analayis of obtained results. Very special thanks to Ali, for giving me an invaluable help with the lab experiments and for the permanent support and assistance, which allowed me to achieve my goals during these four years of my Ph.D project. Very special thanks to Vero for being such a hard worker and inspire me to follow the same path, pushing me to be more productive (I can´t forget: “más rápido Vítooorrrr”), and a better lab worker. Thanks, Vero, for teaching me so much during my first period in the lab, for all the scientific discussions and for being the perfect project and bench partner during all the time. To Vero and Ian, I reserve a special thank you for receiving me so well and for the constant support, also in the weekends, taking me to travel and discover new places outside the lab and the city premises!, and for your friendship that I enjoy so much.
To all my colleagues and friends in Barcelona, in particular to Pedro, Josep, Annamaria, Alex and Ombreta I wish to thank their warm welcome, their excellent work atmosphere, for all support and assistance. I am very grateful to Pedro Carvalho for the great collaboration opportunity which allowed me to work under his supervision in a different and challenging project, expanding further and diversely my technical and scientific knowledge. Thank you, Pedro, for the permanent assistance, for all the constructs provided, for the scientific discussion and all the scientific experiment suggestions and advices. I would like to thank to Alba Shaw for all the assistance with the administrative issues. I also wish to thanks to all the Pedro Carvalho’s and Vivek Malhotra’s group members for allowing me to be part of the scientific discussions of the group meetings and also bringing me into the social events like the volleyball tournaments. To Josep I wish to express my deep gratitude for teaching me the ground basis of the yeast lab work and for all the cooperation and technical support. A special thanks to Josep and Annamaria for all the scientific insight and the experimental support and help during all my stay in the lab and mainly during my last experiments in Barcelona.

v
A special thank you goes to my friends that are at the same time also work colleagues: Humberto, João, Miguel, Sara, Rómulo, Isabel, Jorge, Regina, Marisa, Alberto, Francisca, Susana, Luís, for the great moments during these last years prior and during my Ph.D. Also thanks to those of my colleagues who, one way or another, helped me during this endeavor and that I haven´t mentioned for forgetfulness. A very special thanks to Mr. Barbosa, Mrs. Rosa and Carla for the “online support” and the nice meals over the writing period. “Um obrigado muito especial ao Sr. Barbosa, à D. Rosa e à Carla pelo apoio on-line e pelas refeições agradáveis durante o período de escrita”. A very special thanks to my whole family. I am deeply grateful to my sister Marisa and my good friend Filipe for being such a good buddies, and for having always available their facilities for me over the writing period. I am deeply grateful to my parents Firmino and Rosa for being always present and for the unconditional dedication. “Gostaria de expressar a minha gratidão aos meus pais, Firmino e Rosa, por estarem sempre presente e pela sua dedicação incondicional”.
Last but not least, the most special thanks to you Teresa, my love, for the incredible
serenity that you bring to my life and consequently to my work. Thank you for motivating me to live my work as a vocation, for supporting me both in the hard and in the good moments, and encourage me to learn how to enjoy what I am doing each time. Thank you for imprinting on me the fortitude to face failure and respond positively. Thank you for critical reading my ideas prior and during the writing of this manuscript. Thank you for driving me to proactively search for a resolution not just about the tricky but also the common difficulties. Thank you for being the one that can do all this for me and for my work, and most of all, thank you because this is just a small part!
“All praise be to A LOVE SUPREME to whom all praise is due”
John Coltrane

vi
O presente trabalho, incluindo a sua publicação beneficiou do
seguinte apoio da Fundação para a Ciência e a Tecnologia:
Bolsa de Doutoramento - SFRH/BD/38583/2007
Bolsa de Investigação no âmbito do QREN - POPH - Tipologia 4.1 -
Formação Avançada, comparticipado pelo Fundo Social Europeu e
por fundos nacionais do MCTES.
vii
Identification and Analysis of Regulatory Components of the Mevalonate Biosynthetic Pathway in Arabidopsis thaliana using Genetic Approaches
ABSTRACT
The capacity of plants to survive under conditions of abiotic stresses is the result of
complex and coordinated responses involving hundreds of genes. These responses are affected by
interactions between different environmental factors and the developmental stage of the plant and
could result in shortened life cycle, reduced or aborted seed production, or accelerated
senescence. Drought or continuous water deficit is arguably one of the most important factors
affecting plant growth, development, survival and crop productivity. The current marginal success
in increasing crop yield under unfavourable environmental conditions is partially due to the large
number of cellular processes affected by abiotic stresses which in turn cause severe impact on
plant growth, development and finally production. Thus, an essential aspect of abiotic stress
research in plants is to determine both, how plants sense and acclimate to abiotic stress
conditions, and which are the genetic determinants involved in these processes. Significant
progress has been made in understanding the physiological, cellular and molecular mechanisms of
plant responses to environmental stress factors, and significant achievements with relevance to
agriculture have been obtained, in many cases due to the use of Arabidopsis thaliana as a genetic
model system in abiotic stress research. Arabidopsis has facilitated the functional characterization
of numerous genes by use of loss- or gain-of-function experimental approaches.
In a previously study, the Arabidopsis dry2/sqe1-5 mutant was isolated by its extreme
sensitivity to drought stress. DRY2/SQE1-5 encodes a hypomorphic allele of the squalene
epoxidase 1 involved in sterol biosynthesis. Further analysis of the dry2/sqe1-5 mutant indicated
that this mutant is affected in the function of NADPH oxidases, revealling a central role the
regulation of this pathway in drought tolerance and regulation of Reactive Oxygen Species (ROS)
production. In the present work, to identify new regulatory components of the mevalonate (MVA)
pathway in Arabidopsis, it was performed a suppressor screening of the dry2/sqe1-5 mutant,
which is affected in the MVA pathway due to the decrease of the activity of the squalene epoxidase
1 (SQE1). Several mutants (named sud for suppressors of dry2 defects) that reversed most of the
dry2/sqe1-5 developmental phenotypes, including drought hypersensivity were isolated and
characterized, thus allowing the identification of new genetic components regulating the MVA

viii
pathway. In this pathway, the 3-hydroxy-3-methylglutaryl coenzyme A reductase (HMGR) enzyme is
located upstream of SQE1, and catalyzes a rate-limiting step of the MVA pathway from which
isoprenoids and sterols are synthesized. In animals and yeasts, an essential regulatory mechanism
of the MVA pathway is the ubiquitin-mediated degradation of HMGR by the Endoplasmic Reticulum-
Associated Protein Degradation (ERAD) HRD pathway. Still, in plants very little is known about the
regulatory mechanisms controlling HMGR activity. The analysis of four semidominant dry2/sqe1-5
suppressors led to the identification of SUD1, which encodes a protein showing sequence and
structural homology to the E3 ubiquitin ligases involved in ERAD pathway. However, while in yeasts
and animals the HMGR regulation occurs by controlling the protein stability through the HRD
pathway, the regulation of HMGR in plants by SUD1 is exerted at the activity level by the alternative
ERAD Doa10 pathway. Thus, this work contributed to the identification of common elements but
mechanistic differences in HMGR regulation between plants, yeast and animals
ix
Identificação e Análise de Componentes Reguladores da Via Biosintética do Mevalonato em Arabidopsis thaliana usando Abordagens Genéticas
RESUMO
A capacidade de plantas para sobreviverem em condições de stresse abiótico é o
resultado de respostas complexas e coordenadas envolvendo centenas de genes. Estas respostas
são afetados pelas interações entre os diferentes fatores ambientais e o estádio de
desenvolvimento da planta e podem resultar no encurtamento do ciclo de vida, produção reduzida
(ou mesmo inexistente) de sementes ou ainda senescência acelerada. A secura ou (ou deficit
hídrico contínuo) é sem dúvida um dos fatores mais importantes que afetam o crescimento das
plantas e, consequentemente a sobrevivência, desenvolvimento e produtividade das culturas de
interesse. O escasso sucesso obtido no aumento da produtividade de cultivares de interesse,
quando sujeitas a condições ambientais desfavoráveis deve-se, em parte, ao elevado número de
processos celulares afetados pelo stresse abiótico, conduzindo à diminuição da produtividade
vegetal. Assim, torna-se essencial na investigação sobre stresse abiótico em plantas, determinar
como as plantas percecionam e se aclimatam a essas condições de stresse, e quais os
determinantes genéticos envolvidos nestes processos. Progressos significativos na compreensão
dos mecanismos fisiológicos, celulares e moleculares de respostas das plantas a fatores de
stresses ambiental, e a aplicação deste conhecimento na agricultura têm sido obtidos e, em
muitos casos, conseguidos devido ao uso de Arabidopsis thaliana como modelo de estudo. Com
efeito, a utilização desta espécie tem permitindo a caracterização funcional de genes utilizando
estratégias de ganho- ou de perda de função.
Em trabalhos anteriores, o mutante de Arabidopsis dry2/sqe1-5 foi identificado através da
sua extrema sensibilidade ao stresse hídrico. O gene DRY2/SQE1-5 codifica um alelo hipomórfico
da enzima esqualeno epoxidase 1, envolvida na biossíntese de esteróis. Estudos ulteriores,
efetuados neste mutante indicam que ele está afetado ao nível da atividade de NADPH oxidases, o
que sugere fortemente um papel central da regulação da via biossíntética de esteróis na tolerância
à secura e na produção de espécies reactivas de oxigénio. Neste trabalho, para identificar novos
componentes reguladores da via do mevalonato (MVA) em Arabidopsis, foi realizado um rastreio de
supressores do mutante dry2/sqe1-5, o qual está afetado ao nível da via do MVA, devido à
diminuição da atividade da esqualeno epoxidase 1 (SQE1). Foram isolados e caracterizados vários

x
mutantes sud (supressores dos defeitos de dry2) que revertem a maioria dos fenótipos de
desenvolvimento do mutante dry2/sqe1-5, incluindo a hipersensibilidade à secura, permitindo a
identificação de novos componentes genéticos reguladores da via do MVA. Nesta via metabólica, a
enzima 3-hidroxi-3-metilglutaril coenzima A redutase (HMGR) está localizada a montante da enzima
SQE1, e catalisa um passo limitante desta via, através da qual são sintetizados os isoprenóides e
os esteróis. Em animais e leveduras foi já assinalado que um mecanismo de regulação essencial
da via do MVA consiste na degradação, mediada por ubiquitina, da enzima HMGR (via HRD), ao
nível da via de degradação de proteínas associada ao retículo endoplasmático (ERAD). Contudo,
em plantas, permanece reduzido o conhecimento sobre os mecanismos reguladores que
controlam a atividade da enzima HMGR. No presente trabalho, a análise de quatro supressores de
dry2/sqe1-5 semidominantes conduziu à identificação de SUD1, que codifica uma proteína que
apresenta homologia quer ao nível da sequência nucleotídica e aminoacídica quer ao nível
estrutural com ubiquitina E3 ligases envolvidas na via ERAD em leveduras e em animais. Enquanto
em leveduras e em animais a regulação da HMGR ocorre através do controlo da estabilidade da
proteína, através da via HRD, em plantas, a regulação desta enzima por SUD1 é exercida ao nível
da sua atividade, pela via ERAD alternativa Doa10. Os resultados obtidos no presente trabalho,
contribuem significativamente para a identificação de elementos comuns, mas apresentando
diferenças mecanísticas na regulação da HMGR entre plantas, fungos e animais.
xi
TABLE OF CONTENTS ACKNOWLEDGMENTS iii TITLE AND ABSTRACT vii
TÍTULO E RESUMO ix TABLE OF CONTENTS xi ABBREVIATIONS AND SYMBOLS xv
CHAPTER 1
General Introduction 1.1. THE CHALLENGE OF PLANT ABIOTIC STRESS IN CROP PRODUCTION 3 Drought Stress and Stomatal Regulation 4 1.2. REACTIVE OXYGEN SPECIES IN PLANT DEVELOPMENT 5
Production of ROS in plants 6 Cellular localization and coordination of the ROS scavenging pathways of plants 7 NADPH Oxidases Generate ROS Involved in Stomatal Regulation and Plant Development 9 Small GTPases Spatially Control ROS Production and Growth 11 1.3. THE SELECTIVE DEGRADATION OF PROTEINS IN CELLULAR REGULATION AND QUALITY CONTROL 12 The Ubiquitin Proteasome System 12 The Endoplasmic Reticulum-Associated Degradation in Protein Quality Control 14 Distinct ERAD Pathways for the Degradation of ER Proteins in Yeast 14 The Endoplasmic Reticulum-Associated Degradation in Cellular Regulation 16 Conserved Endoplasmic Reticulum-Associated Protein Degradation in Plants 16 1.4. STEROL IN PLANTS 17
Biosynthetic Pathway of Plant Sterols 18 Regulation of the Plant Sterol Biosynthetic Pathway by HMGR 20 Sterol Metabolism in Plants 21 1.5. GENETIC APPROACHES TOWARDS THE STUDY OF STEROL BIOSYNTHESIS AND FUNCTION 22 Squalene Epoxidase Gene Family 23 Phenotypical Analysis of Squalene Epoxidase Mutants 24 Chemical Analysis of Squalene Epoxidase Mutants 24 Arabidopsis dry2/sqe1-5 Mutant Reveals a Central Role for Sterols in Drought Tolerance and Regulation of ROS 26 Isolation and Characterization of dry2 Suppressors 28 1.6. AIMS AND OUTLINE OF THE THESIS 32
xii
CHAPTER 2
Investigating the role of Reactive Oxygen Species in dry2 2.1. INTRODUCTION 37 2.2. RESULTS AND DISCUSSION 38 ROS Generators Suppress Root Branching Defects in dry2 38 Suppressors Recover Wild-type ROS Production 41 Imaging Intracellular Hydrogen Peroxide Production using HyPer 43 2.3. MATERIALS AND METHODS 45
Plant Material 45 Plant Manipulation and Growth Conditions 45 Root Branching Measurements 45 Detection of Reactive Oxygen Species 45 Generation of Transgenic HyPer-As Constructs/Plants 46 Arabidopsis Transformation by Floral Dipping 46 Selection of Arabidopsis Transformants 47
CHAPTER 3
Identification of dry2 Suppressor Mutations 3.1. INTRODUCTION 51 3.2. RESULTS AND DISCUSSION 52 Four dry2 Suppressor Mutations are Semi-dominants 52 Map-based Cloning of the sud Mutations 53 Four dry2 Suppressors are Independent sud1 Mutant alleles 58 3.3. MATERIALS AND METHODS 60 Plant Material 60 Plant Manipulation and Growth Conditions 60 Arabidopsis Cross-fertilization 60 Identification of homozygous plants for the dry2 and sud22 mutations 61 Map-based Cloning of SUD1 61 Bioinformatic Tools Used for Identification of SUD1 61
CHAPTER 4
In Silico Analysis of SUD1 Expression and Whole-genome Transcript Profile of wild-type, dry2, dry2/sud9, and dry2/sud22 4.1. INTRODUCTION 65
4.2. RESULTS AND DISCUSSION 66 In Silico Analysis of SUD1 Expression 66 Effect of SUD1 Inactivation on dry2 Whole-genome Transcriptional Activity 68 4.3. MATERIALS AND METHODS 75 Plant Material 75 Plant Manipulation and Growth Conditions 75 Biological Sample preparation for Microarray Hybridization 75 Microarray Hybridization and Evaluation 75 Microarray Bioinformatic Data Analysis 75
xiii
CHAPTER 5
In Silico Structural and Phylogenetic Analysis of SUD1 5.1. INTRODUCTION 79 5.2. RESULTS AND DISCUSSION 79 Structural Features of SUD1 79 Topology Model for SUD1 Protein 82 Identification of Essential Amino Acid Residues for SUD1 Function 85 Phylogenetic Analysis of SUD1 87 5.3. MATERIALS AND METHODS 90
Bioinformatic Tools Used for in Silico Structural Analysis of SUD1 90 Bioinformatic Tools Used for Phylogenetic Analysis of SUD1 90
CHAPTER 6
Functional Characterization of Arabidopsis thaliana SUD1, HRD1A and HRD1B 6.1. INTRODUCTION 93
6.2. RESULTS AND DISCUSSION 94 Molecular Cloning of SUD1 in E. coli 94 SUD1 Complementation of Yeast doa10Δ Mutation 95
Degradation of Yeast Doa10 Substrates in doa10-G498E Mutant Cells 97 AtHRD1 Complementation of Yeast hrd1Δ Mutation 99
Investigating the Function of the Arabidopsis ERAD E3-ligases 105 6.3. MATERIALS AND METHODS 105 Plant Material 105 Plant Manipulation and Growth Conditions 105 Yeast Strains and Plasmids 105 Yeast Genetic Manipulation 106 Molecular Cloning of Arabidopsis ERAD-Homolog Genes in Shuttle Vectors 106 Site-directed mutagenesis to construct doa10-G498E Mutant Strain 107 ERAD-Substrate Degradation Experiments 106 Site-directed Mutagenesis to Construct doa10-G498E Mutant Strain 108 Immunoblotting 108
CHAPTER 7
Investigating Use of Grafting in the Study of Long-distance Isoprenoid-derived Signalling in dry2 7.1. INTRODUCTION 111 7.2. RESULTS 112 Grafting analysis of long-distance signalling in dry2 112 Rejection of Wild-type and dry2/sud1-9 Scions by dry2 Rootstocks 114 Wild-type Rootstocks Do Not Complement dig4 Mutant Shoot Defects 115 7.3. DISCUSSION 117 The Nature of the Long-distance Signal Impaired in dry2 117 7.4. MATERIALS AND METHODS 118
Plant Material 118 Arabidopsis Grafting 119 Sequencing Analysis to Confirm Successful Grafting Unions 119
xiv
CHAPTER 8
Concluding Remarks and Future Perspectives 8.1. CONCLUDING REMARKS 123 A Genetic Approach to Identify Regulators of the MVA Biosynthetic Pathway 123 8.2. CONCLUDING REMARKS AND FUTURE PERPECTIVES 123 Regulation of HMGR Activity by SUD1 123
Looking for the Identification of a New MVA-derived Signal Putatively Involved into Plant Long-distance Signalling 125
CHAPTER 9
Bibliographic References 129
APPENDIXES
Appendix I – Standard Molecular Biology Methods 1. NUCLEIC ACID METHODS 149 1.1. DNA Methods 149 1.1.1. Oligonucleotide Design and Preparation 149 1.1.2. Plant Genomic DNA Isolation 149 1.1.3. Plasmid Isolation 150 1.1.4. DNA Fragment Purification 150 1.1.5. DNA Precipitation 150 1.1.6. DNA Digestion with Endonucleases 150 1.1.7. Amplification of DNA Fragments by Polymerase Chain Reaction (PCR) 151 1.1.8. DNA Sequencing 151 1.1.9. Gateway Cloning 151 1.1.10. Subcloning of PCR Fragments into pGEM-T Easy 151 1.1.11. Cloning of PCR Fragments into a Vector 152 1.2. RNA Methods 152 1.2.1. RNA Extraction 152 1.2.2. cDNA Synthesis 152 1.3. Quantification of Nucleic Acids 153 1.4. Nuclecic Acids Electrophoretic Separation 153 2. TRANSFORMATION OF BACTERIA 153 2.1. Transformation of E. coli cells 153 2.1.1. E. coli Competent Cells Preparation 154 2.1.2. E. coli Transformation 154 2.2. Transformation of Agrobacterium Cells 154 2.2.1. Preparation of Electrocompetent Cells 154 2.2.2. Electroporation Method 154 Appendix II – Oligonucleotides used for Map-based Cloning 155 Appendix III – Vectors Maps 157
xv
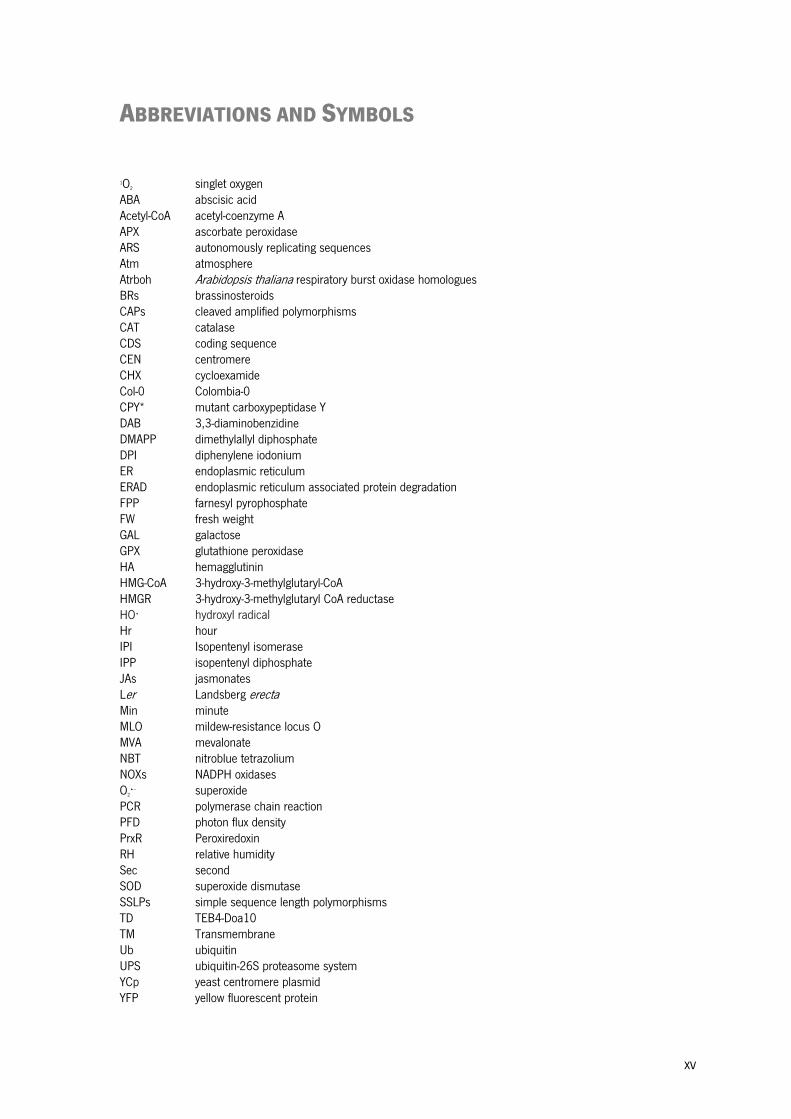
ABBREVIATIONS AND SYMBOLS
1O2 singlet oxygen ABA abscisic acid Acetyl-CoA acetyl-coenzyme A APX ascorbate peroxidase ARS autonomously replicating sequences Atm atmosphere Atrboh Arabidopsis thaliana respiratory burst oxidase homologues BRs brassinosteroids CAPs cleaved amplified polymorphisms CAT catalase CDS coding sequence CEN centromere CHX cycloexamide Col-0 Colombia-0 CPY* mutant carboxypeptidase Y DAB 3,3-diaminobenzidine DMAPP dimethylallyl diphosphate DPI diphenylene iodonium ER endoplasmic reticulum ERAD endoplasmic reticulum associated protein degradation FPP farnesyl pyrophosphate FW fresh weight GAL galactose GPX glutathione peroxidase HA hemagglutinin HMG-CoA 3-hydroxy-3-methylglutaryl-CoA HMGR 3-hydroxy-3-methylglutaryl CoA reductase HO• hydroxyl radical Hr hour IPI Isopentenyl isomerase IPP isopentenyl diphosphate JAs jasmonates Ler Landsberg erecta Min minute MLO mildew-resistance locus O MVA mevalonate NBT nitroblue tetrazolium NOXs NADPH oxidases O2
•− superoxide PCR polymerase chain reaction PFD photon flux density PrxR Peroxiredoxin RH relative humidity Sec second SOD superoxide dismutase SSLPs simple sequence length polymorphisms TD TEB4-Doa10 TM Transmembrane Ub ubiquitin UPS ubiquitin-26S proteasome system YCp yeast centromere plasmid YFP yellow fluorescent protein
xvi
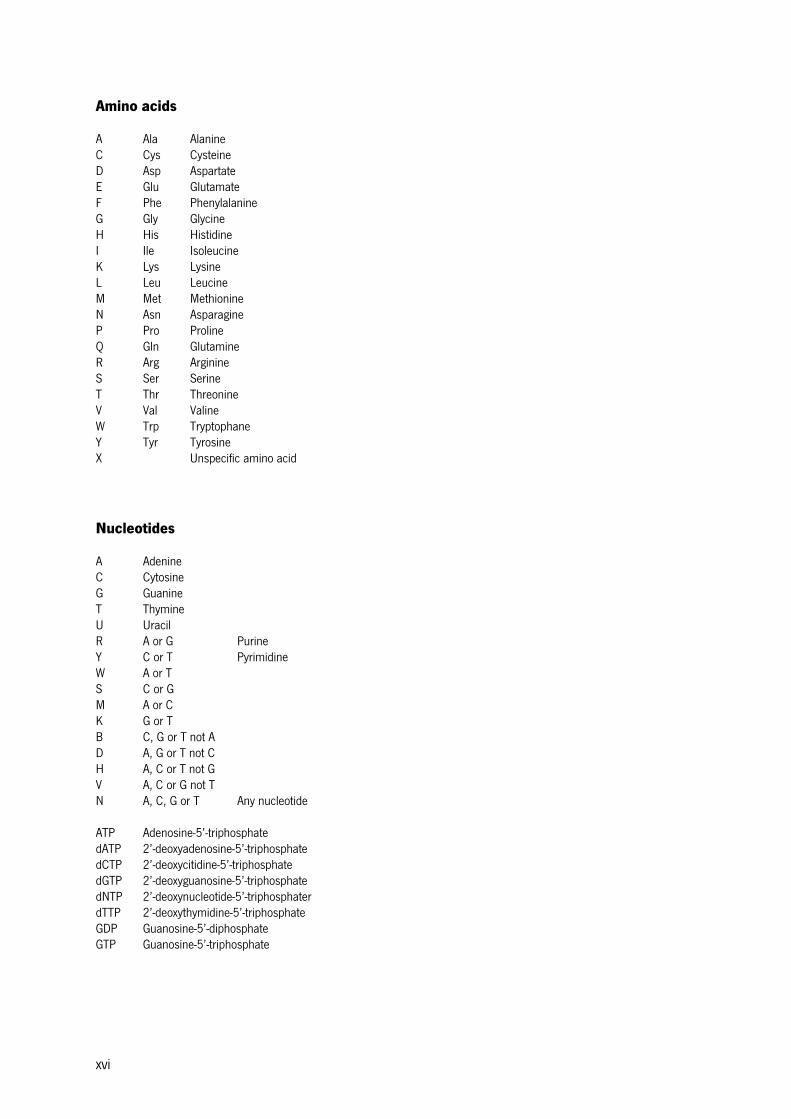
Amino acids A Ala Alanine C Cys Cysteine D Asp Aspartate E Glu Glutamate F Phe Phenylalanine G Gly Glycine H His Histidine I Ile Isoleucine K Lys Lysine L Leu Leucine M Met Methionine N Asn Asparagine P Pro Proline Q Gln Glutamine R Arg Arginine S Ser Serine T Thr Threonine V Val Valine W Trp Tryptophane Y Tyr Tyrosine X Unspecific amino acid Nucleotides A Adenine C Cytosine G Guanine T Thymine U Uracil R A or G Purine Y C or T Pyrimidine W A or T S C or G M A or C K G or T B C, G or T not A D A, G or T not C H A, C or T not G V A, C or G not T N A, C, G or T Any nucleotide ATP Adenosine-5’-triphosphate dATP 2’-deoxyadenosine-5’-triphosphate dCTP 2’-deoxycitidine-5’-triphosphate dGTP 2’-deoxyguanosine-5’-triphosphate dNTP 2’-deoxynucleotide-5’-triphosphater dTTP 2’-deoxythymidine-5’-triphosphate GDP Guanosine-5’-diphosphate GTP Guanosine-5’-triphosphate

Chapter 1
General Introduction
CONTENTS
1.1. THE CHALLENGE OF PLANT ABIOTIC STRESS IN CROP PRODUCTION
1.2. REACTIVE OXYGEN SPECIES IN PLANT DEVELOPMENT
1.3. THE SELECTIVE DEGRADATION OF PROTEINS IN CELLULAR REGULATION AND QUALITY CONTROL
1.4. STEROL IN PLANTS
1.5. GENETIC APPROACHES TOWARDS THE STUDY OF STEROL BIOSYNTHESIS AND FUNCTION
1.6. AIMS AND OUTLINE OF THE THESIS

CHAPTER 1. GENERAL INTRODUCTION
3
1.1. THE CHALLENGE OF PLANT ABIOTIC STRESS IN CROP PRODUCTION
Climate changes on Earth and the course of millions of years of evolution contributed to a
high genetic diversity, demonstrating living creatures capacity to adapt to the environment and its
fluctuations (Zhu, 2002; Koiwa et al., 2006). Environmental stresses can either be biotic, when
imposed by living organisms, or abiotic, when they are the result of a deficit or an excess in the
physical or chemical environment. During their life span, plants are normally exposed to a variety
of different conditions/stresses that affect their growth, development and productivity. As sessile
organisms, plants are particularly vulnerable to abiotic stress challenges, and have developed an
amazing array of responses to face stress imposition (Buchanan et al., 2000). Current climatic
conditions, such as prolonged drought and heat episodes, pose a serious challenge for agricultural
production worldwide, affecting plant growth and yield. This abiotic stress conditions cause
extensive losses to agricultural production worldwide (Mittler, 2006; Mittler and Blumwald, 2010).
Transgenic crops provide a promising avenue to reduce yield losses, improve growth, and provide a
secure food supply for a growing world population (Lemaux, 2008, 2009; Mittler and Blumwald,
2010). The acclimation of plants to abiotic stress conditions is a complex and coordinated
response involving hundreds of genes. These responses are also affected by interactions between
different environmental factors and the developmental stage of the plant and could result in
shortened life cycle, reduced or aborted seed production, or accelerated senescence (Mittler and
Blumwald, 2010).
The central dogma of abiotic stress research in plants is to study how plants sense and
acclimate to abiotic stress conditions, and then use this knowledge to develop crops with enhanced
tolerance to abiotic stresses (Mittler and Blumwald, 2010). Significant progress has been made in
understanding the physiological, cellular and molecular mechanisms of plant responses to
environmental stress factors, and significant achievements with relevance to agriculture has been
obtained (Vinocur and Altman, 2005; Mittler and Blumwald, 2010). In fact, the development of
new methodologies has been a major driving force in this research. For instance, microarray
technology have driven much of the research into transcriptional networks during abiotic stress,
whole-genome sequencing and chromatin immunoprecipitation have driven research into
epigenetic control of gene expression during stress, and metabolic profiling has driven research
into metabolic networks and their role in stress tolerance (Mittler and Blumwald, 2010).
CHAPTER 1. GENERAL INTRODUCTION
4
Gene-centered functional studies, either by forward genetics, in which the mutant
population is screened for a phenotype of interest or by reverse genetics, which goes from gene
selection to detection of a visible phenotype, allow to get information about the function of genes
within the complex network that is the plant abiotic stress response (Alonso and Ecker, 2006;
Azevedo et al., 2011). Modulating the response of these genes in crops and cultivars-of-interest is a
most relevant strategy for plant improvement, and fundamental knowledge obtained in Arabidopsis
thaliana has been systematically translated to plants of higher agronomic interest. Recent
examples include an easier and cheaper method to extract sugars from plant material developed in
Arabidopsis to meet biofuel demands; identification of a master regulator of plant root hair growth
as the nutrient mining machinery to enhance the plant root system; the extraction of petroleum
precursors from plants to produce green plastic; an Arabidopsis gene that confers resistance in
Brassica; insight into chromosome imbalances and predictable plant defects; and an Arabidopsis
gene employed by the Monsanto company to improve soybean yields (MASC Report, 2011).
These studies, in their gene-centric approach, are best carried out in model organisms such as
Arabidopsis thaliana. Therefore, they will continue to be pivotal tools in the extending of knowledge
that will allows us to face the challenges ahead, increasing crop yield and tolerance, and ultimately
diminishing hunger worldwide (MASC Report, 2011). Although, despite this enormous research
endeavor, knowledge on the capacity of plants to cope with all these stresses is still clearly
insufficient, as the roles of many genes in enhancing abiotic stress tolerance are still functionless in
the whole-plant concept (Ahuja et al., 2010).
Drought Stress and Stomatal Regulation
Drought or continuous water deficit is one of the most important factors affecting plant
growth, development, survival and crop productivity (Boyer, 1982; Ahuja et al., 2010).
Physiological responses to drought include stomatal closure, decreased photosynthetic activity,
altered cell wall elasticity, and even generation of toxic metabolites causing plant death.
Concomitant molecular re-programming includes extensive changes in gene expression incurring
alterations in the biochemical and proteomic machinery (Ahuja et al., 2010). As the control of
transpirational water movement through stomata is a major factor in drought tolerance and water
balance (Hetherington and Woodward, 2003), in the present thesis, specific focus is given to briefly
stomatal regulation.

CHAPTER 1. GENERAL INTRODUCTION
5
The opening and closing of stomata is mainly regulated by the plant hormone abscisic acid
(ABA) (Li et al., 2006). Although ABA has broad functions in plant growth and development,
its main function is to promote plant adaptation to distinct stress factors, mainly drought
(Ahuja et al., 2010). The importance of ABA in response to water stress is arguably due to its
involvement in stomatal closure, as this process is critical for the regulation of plant water balance
and osmotic stress tolerance (Horton, 1971; Tucker and Mansfield, 1971; Li et al., 2006). The
concentration of ABA increases under drought and induces stomatal closure through second
messengers such as ROS (Pei et al., 2000; Borsani et al., 2002). The obvious result of stomatal
closure is decreased transpiration rate and, consequently, the water consumed by the plant. The
decline in stomatal conductance (and the parallel decline concentration values of intercellular CO2)
leads to a reduction assimilation of CO2 and induces other associated effects, such as the
accumulation of reducing power and susceptibility to photoinhibition and/or photooxidation
(Ma et al., 2006). The guard cells, which generate the stomatal pore, respond to changes in water
levels using the ABA as the main signal. Plants ABA-deficient mutants or insensitive to ABA tend
to wilt and cannot withstand water stress conditions due to stomatal closure deregulation
(Zhu, 2002). The closing of stomata is mediated by a reduction in pressure of guard cell turgor due
to water outlet, which is caused by efflux of K+, the sucrose removal and conversion of malate into
starch, which is osmotically inactive (Schroeder et al., 2001). ABA induces hydrogen peroxide
production and reorganization of the cytoskeleton, specifically actin that is a key to stomatal
closure (Eun and Lee, 1997; Hwang and Lee, 2001). Hydrogen peroxide in turn activates Ca2+
channels causing an increase in cytosolic Ca2+, which is the responsible for the regulation of ion
channels (McAinsh, 1990; Pei et al., 2000).
1.2. REACTIVE OXYGEN SPECIES IN PLANT DEVELOPMENT
Highly reactive reduced oxygen molecules, usually designated Reactive Oxygen Species
(ROS), are continuously produced in plants as byproducts of aerobic metabolism (Halliwell
and Gutteridge, 1999). In plants, the major ROS include hydrogen peroxide (H2O2), superoxide
anion (O2•−), singlet oxygen (1O2) and hydroxyl radical (HO•) (Mittler et al., 2004; Moller et al.,
2007). ROS are the products of the sequential reduction of molecular oxygen (Figure 1.1).
CHAPTER 1. GENERAL INTRODUCTION
6
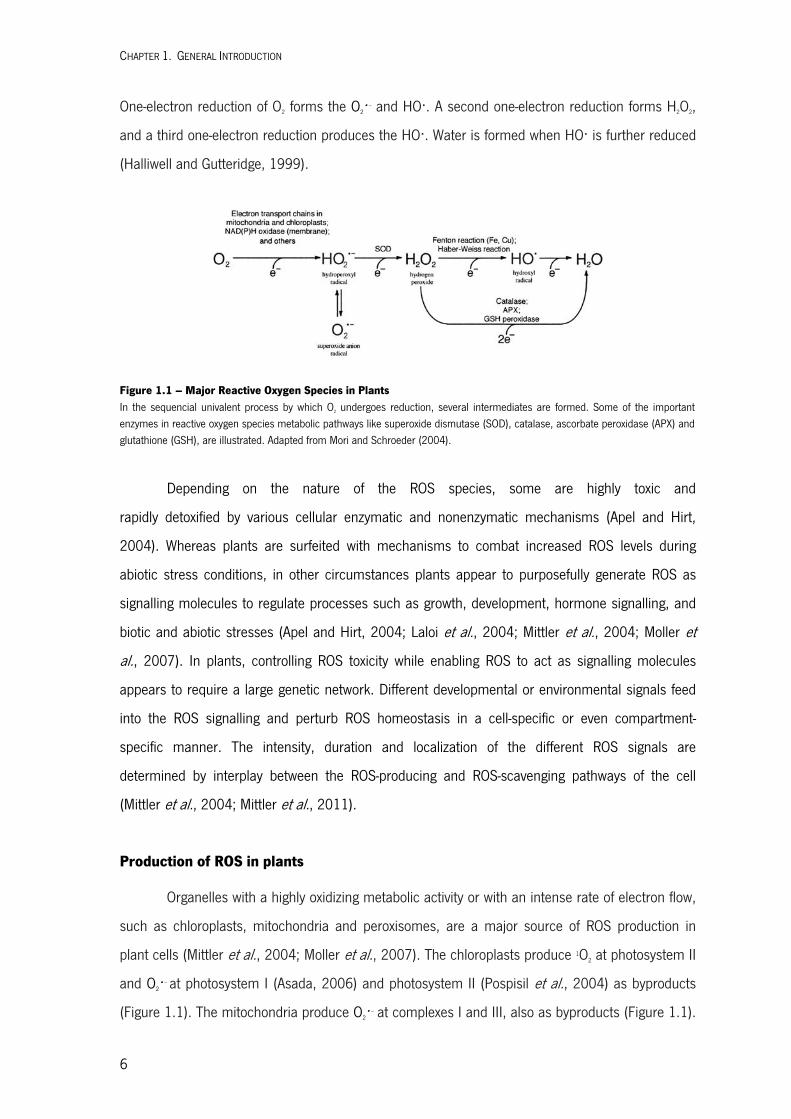
One-electron reduction of O2 forms the O2•− and HO•. A second one-electron reduction forms H2O2,
and a third one-electron reduction produces the HO•. Water is formed when HO• is further reduced
(Halliwell and Gutteridge, 1999).
Figure 1.1 – Major Reactive Oxygen Species in Plants In the sequencial univalent process by which O2 undergoes reduction, several intermediates are formed. Some of the important enzymes in reactive oxygen species metabolic pathways like superoxide dismutase (SOD), catalase, ascorbate peroxidase (APX) and glutathione (GSH), are illustrated. Adapted from Mori and Schroeder (2004).
Depending on the nature of the ROS species, some are highly toxic and
rapidly detoxified by various cellular enzymatic and nonenzymatic mechanisms (Apel and Hirt,
2004). Whereas plants are surfeited with mechanisms to combat increased ROS levels during
abiotic stress conditions, in other circumstances plants appear to purposefully generate ROS as
signalling molecules to regulate processes such as growth, development, hormone signalling, and
biotic and abiotic stresses (Apel and Hirt, 2004; Laloi et al., 2004; Mittler et al., 2004; Moller et
al., 2007). In plants, controlling ROS toxicity while enabling ROS to act as signalling molecules
appears to require a large genetic network. Different developmental or environmental signals feed
into the ROS signalling and perturb ROS homeostasis in a cell-specific or even compartment-
specific manner. The intensity, duration and localization of the different ROS signals are
determined by interplay between the ROS-producing and ROS-scavenging pathways of the cell
(Mittler et al., 2004; Mittler et al., 2011).
Production of ROS in plants
Organelles with a highly oxidizing metabolic activity or with an intense rate of electron flow,
such as chloroplasts, mitochondria and peroxisomes, are a major source of ROS production in
plant cells (Mittler et al., 2004; Moller et al., 2007). The chloroplasts produce 1O2 at photosystem II
and O2•− at photosystem I (Asada, 2006) and photosystem II (Pospisil et al., 2004) as byproducts
(Figure 1.1). The mitochondria produce O2•− at complexes I and III, also as byproducts (Figure 1.1).
CHAPTER 1. GENERAL INTRODUCTION
7
An estimated 1-5% of the oxygen consumption of isolated mitochondria results in ROS production
(Moller, 2001). The peroxisomes produce O2•− and H2O2 in several key metabolic reactions (del Rio
et al., 2006). And, finally, the NADPH oxidase in the plasma membrane produces O2•−, which
participates in processes such as development and tolerance to biotic and abiotic stresses (Torres
and Dangl, 2005) (Figure 1.1). During endogenous ROS elevation, the superoxide anion produced
by a plasma membrane NADPH oxidase can be converted to H2O2 by superoxide dismutases (SOD)
in the apoplast. H2O2 can give rise to HO• through the Fenton reaction, which is catalysed mainly by
free transition metal ions (such as Cu2+ or Fe2+) (Fry, 1998; Halliwell and Gutteridge, 1999;
Foreman et al., 2003) (Figure 1.1). HO• are the most reactive and toxic ROS and interact directly
with most target biomolecules (Halliwell and Gutteridge, 1999).
Cellular localization and coordination of the ROS scavenging pathways of plants
The balance between ROS production and the activities of these ROS-removing systems
determines the type and concentration of ROS present and thus to what extent signalling and/or
damage will occur. Plant cells possess a range of non-enzymatic as well as enzymatic mechanisms
to scavenge oxygen radicals (Apel and Hirt, 2004). A sensible energetic effort is diverted to the
removal of O2•− and H2O2, which are the main oxygen radicals being produced and are the source of
HO• (Halliwell and Gutteridge, 1999; Mittler, 2002). Detoxification of O2•− and H2O2 is possible
through enzymatic catalysis. The main enzymatic mechanisms of scavenging ROS include the
enzymes superoxide dismutase (SOD), catalase (CAT), ascorbate peroxidase (APX) and glutathione
peroxidase (GPX) (Mittler, 2002). SODs catalyse the dismutation of O2•− into H2O2, whereas CAT,
APX and GPX are involved in H2O2 detoxification (Bowler et al., 1991; Mittler, 2002) (Figure 1.1).
Unlike CAT, APX and GPX require reducible substrates such as the antioxidants ascorbate and
reduced glutathione, respectively (Noctor and Foyer, 1998). Peroxiredoxin (PrxR) is also capable of
H2O2 reduction (Rouhier and Jacquot, 2002).
The various scavenging enzymes can be found in almost every subcellular compartment.
In addition, usually more than one enzymatic scavenging activity per a particular ROS can be found
in each of the different compartments (e.g. GPXs, PrxRs and APXs in the cytosol and chloroplast,
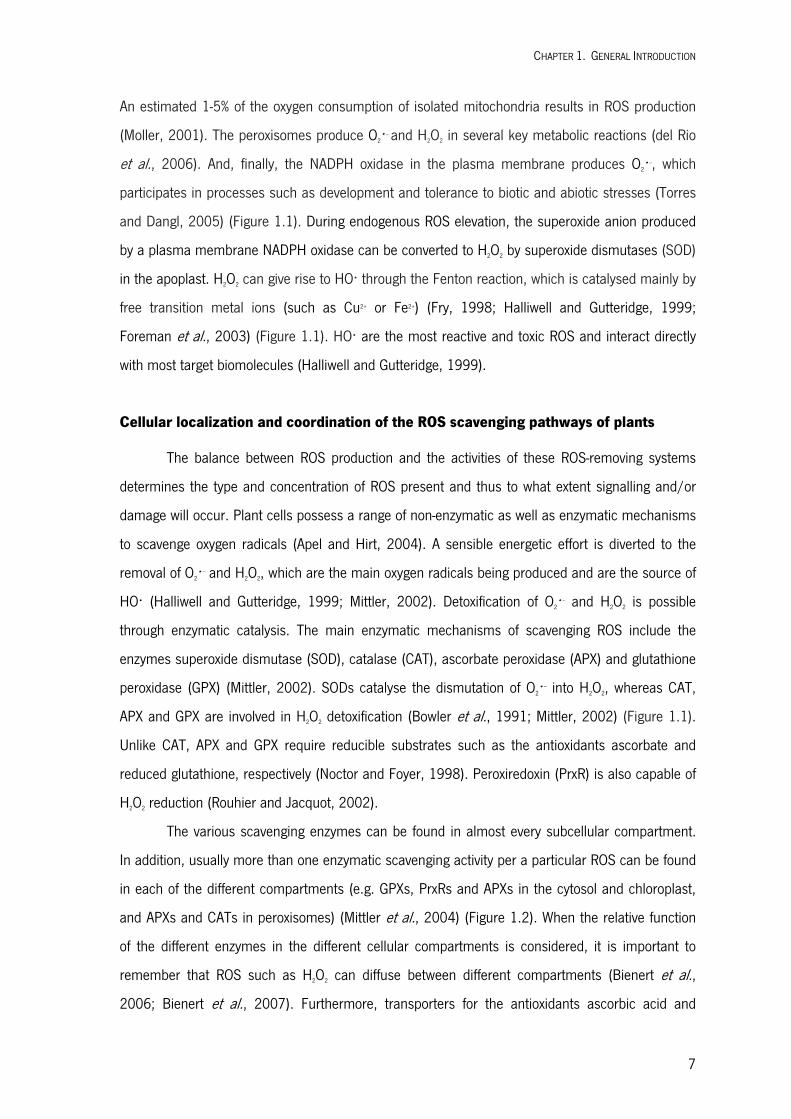
and APXs and CATs in peroxisomes) (Mittler et al., 2004) (Figure 1.2). When the relative function
of the different enzymes in the different cellular compartments is considered, it is important to
remember that ROS such as H2O2 can diffuse between different compartments (Bienert et al.,
2006; Bienert et al., 2007). Furthermore, transporters for the antioxidants ascorbic acid and
CHAPTER 1. GENERAL INTRODUCTION
8
glutathione are central in determining the specific concentrations of these compounds and the
redox potential in the different cellular compartments (Noctor and Foyer, 1998; Pignocchi and
Foyer, 2003; Mittler et al., 2004).
Figure 1.2 – Subcelular ROS Generated Compartments and Major ROS Scavenging Pathways The enzymatic pathways responsible for ROS detoxification are in different cell compartments. In chloroplasts, the water–water cycle detoxifies O2- and H2O2, and alternative oxidase (AOX) reduces the production rate of O2- in thylakoids (top left). ROS that escape this cycle and/or are produced in the stroma undergo detoxification by the stromal ascorbate–glutathione cycle envolving ascorbate peroxidase (APX) and Cu, Zn-SOD or Fe-SOD. Peroxiredoxin (PrxR) and glutathione peroxidase (GPX) are also involved in H2O2 removal in the stroma (top right). ROS produced in peroxisomes during photorespiration, fatty acid oxidation or other reactions are decomposed by SOD, catalase (CAT) and APX (middle right). SOD and other components of the ascorbate–glutathione cycle are also present in mitochondria. In addition, AOX prevents oxidative damage in mitochondria (bottom right). In principle, the cytosol contains the same set of ROS-scavenging enzymes found in the stroma (bottom left). The enzymatic components responsible for ROS detoxification in the apoplast and cell wall (W), and the ROS scavenging pathways at the vacuole (V) are not described in the present figure. Membrane-bound enzymes are depicted in white, GPX pathways are indicated by dashed lines and PrxR pathways are indicated by dotted lines in the stroma and cytosol. Although the pathways in the different compartments are mostly separated from each other, H2O2 can easily diffuse through membranes and antioxidants such as glutathione and ascorbic acid (reduced or oxidized) can be transported between the different compartments. (DHA, dehydroascorobate; DHAR, DHA reductase; FD, ferredoxin; FNR, ferredoxin NADPH reductase; GLR, glutaredoxin; GR, glutathione reductase; GSH, reduced glutathione; GSSG, oxidized glutathione; IM, inner membrane; IMS, IM space; MDA, monodehydroascorbate; MDAR, MDA reductase; PSI, photosystem I; PSII, photosystem II; Trx, thioredoxin; tyl, thylakoid). From Mittler et al. (2004).
CHAPTER 1. GENERAL INTRODUCTION
9
NADPH Oxidases Generate ROS Involved in Stomatal Regulation and Plant Development
ROS that have been shown to play a role in development and stomatal closure are
produced by NADPH oxidases (NOXs) (Torres and Dangl, 2005; Gapper and Dolan, 2006; Kwak et
al., 2006). The plant NOX proteins are analogs to the enzymes first identified in mammals that are
responsible for the respiratory burst that occurs in activated mammalian neutrophils (Segal and
Abo, 1993) and were identified by their homology to the catalytic subunit gp91phox of mammalian
phagocyte NOX (Torres et al., 1998). In Arabidopsis (Arabidopsis thaliana), NADPH oxidases genes
are referred to as Arabidopsis thaliana respiratory burst oxidase homologues (Atrboh) (Keller et
al., 1998; Torres et al., 1998). Plant NADPH oxidases are predicted to be localized in the plasma
membrane, where they transfer electrons from cytosolic NADPH or NADH to apoplastic oxygen,
leading to the production of apoplastic superoxide (Sagi and Fluhr, 2006). It is important to note
that, O2•− produced by NADPH oxidases readily gives rise to other ROS including H2O2, by
dismutation, and the HO• via the Fenton reaction (Halliwell and Gutteridge, 1999), like previously
described in this chapter.
In Arabidopsis, there are 10 known members of the rboh gene family (Torres and Dangl,
2005). The activity of three members of this family has been shown to be involved in various
aspects of stomatal regulation (Kwak et al., 2003) and root growth (Foreman et al., 2003).
The regulation of stomatal closure involves various control points that help the plant to adapt to a
variety of environments (Hetherington and Woodward, 2003). ROS are essential signals in this
complex regulatory network, mediating stomatal closure induced by the plant hormone ABA
(Kwak et al., 2006). In stomata, ABA induces the production of H2O2 in guard cells, that activate the
calcium-permeable channels in the plasma membrane, which in turn increase the cytosolic
concentration of Ca2+ and lead to stomatal closure (McAinsh, 1990; Pei et al., 2000). The NADPH
oxidases proteins AtrbohD and AtrbohF were identified as the responsible for the H2O2 production
during ABA-induced stomatal closure (Kwak et al., 2003). If H2O2 production by AtrbohD and
AtrbohF NADPH oxidases is blocked, ABA-induced closure of stomata is inhibited. The atrbohD/F
double mutations impair ABA-induced stomatal closing, ABA promotion of ROS production,
ABA-induced cytosolic Ca2+ increases and ABA activation of plasma membrane calcium-permeable
channels in guard cells wile exogenous H2O2 rescues both Ca2+channel activation and stomatal
closing in atrbohD/F double mutant (Kwak et al., 2003). However, ROS derived from the
AtrbohD and AtrbohF proteins are not only involved in the stomatal response to ABA, but rather in
the ABA-signalling mechanism that controls plant growth responses in drought conditions.
CHAPTER 1. GENERAL INTRODUCTION
10
The roots of plants lacking both AtrbohD and AtrbohF (atrbohD/F double mutants) are
indistinguishable from the wild-type, indicating that they are not involved in growth per se under
standard conditions, but the double-mutant roots are less sensitive to the inhibitory effects of ABA
on root elongation (Kwak et al., 2003). Another NADPH oxidase, the AtrbohC protein, also known
as ROOT HAIR DEFECTIVE2 (RHD2), is known to be required for root elongation under normal
growth conditions. The roots of plants homozygous for loss-of-function rhd2 mutations have
decreased levels of ROS and are 20% shorter than the wild-type, indicating that cell expansion is
defective in these plants (Foreman et al., 2003). Similarly, inhibitor experiments suggest that the
promotion of maize root growth may be under the control of NADPH oxidases (Liszkay et al.,
2004). Therefore, there are at least two distinct ROS-requiring mechanisms that occur during root
growth in Arabidopsis. There is the requirement of RHD2/AtrbohC for elongation (Foreman et al.,
2003) and there is an ABA related growth inhibition process that requires AtrbohD and AtrbohF
(Kwak et al., 2003). In addition to its role in root elongation, the AtrbohC protein is required for root
hairs development mediated by activation of Ca2+ channels (Foreman et al., 2003).
The RHD2/AtrbohC activity produces ROS that accumulate at the tip of root hairs allowing their
growth. Relatively high cytoplasmic Ca2+ are found at the tip, leading to the formation of a so-called
tip-high calcium gradient, and this gradient is absent in the rhd2 mutant (Wymer et al., 1997;
Foreman et al., 2003).
Whereas the above evidence supports clearly a role for NADPH oxidases in root elongation
and root hairs development, there is also evidence that NADPH oxidase-derived ROS are required
for plant development during the growth of other organs besides roots. During leaf expansion, a
wave of ROS-dependent cell growth sweeps through the leaf (Rodriguez et al., 2002). This local
expansion zone is the site of the accumulation of ROS, and inhibition of ROS formation by
treatment with diphenylene iodonium (DPI), a general inhibitor of flavin-containing enzymes,
inhibits leaf growth. This indicates that not only are ROS involved in growth, but also that a flavin-
containing oxidase such as a NADPH oxidase is required for its production (Gapper and Dolan,
2006). Furthermore, the accelerated elongation that occurs upon auxin treatment is accompanied
by the formation of higher levels of ROS than in coleoptiles grown without auxin treatment
(Rodriguez et al., 2002; Schopfer et al., 2002). This suggests that the rate of cell growth may be
proportional to the amount of ROS produced in growing organs (Gapper and Dolan, 2006).
Suppression of tomato rboh gene expression by the antisense approach not only had both reduced
NADPH oxidases activity and ROS levels, but also exhibited a number of morphological defects,
CHAPTER 1. GENERAL INTRODUCTION
11
including reduced apical dominance, leading to an increase in branching, reduced leaf lobbing, and
curled leaflets (Sagi et al., 2004). These phenotypes suggest that ROS control more developmental
processes than just cell expansion, like apical dominance and leaf shape (Gapper and Dolan,
2006).
Small GTPases Spatially Control ROS Production and Growth
The regulation of NADPH oxidase is an issue of an important consideration to understand
NADPH oxidase derived ROS controls plant growth and development. In addition to the NOX
catalytic subunit, gp91phox, mammalian phagocyte NOX consists of a complex of different regulatory
subunits, among which the small GTPase of the Rho class, Rac2, is a key regulator of the NOX
activity (Diekmann et al., 1994; Diebold and Bokoch, 2001). In the absence of other homologs of
the mammalian NOX subunits (Sagi and Fluhr, 2001), the small GTPase of the Rho class (called
ROPs in plants) becomes a prime candidate for being a regulator of plant NADPH oxidase. There
are 11 genes encoding ROP GTPases in Arabidopsis with different expression profiles as reviewed
by (Vernoud et al., 2003). In A. thaliana, ROP2, ROP4 and ROP6 have been shown to be involved
in correct cellular expansion in the root elongation zone, the establishment of the tip-high Ca2+
gradient and root-hair growth (Molendijk et al., 2001; Jones et al., 2002), and experimental studies
with rice Rboh proteins revealed that binding of a Rho-GTPase to the N-terminal a rice NADPH
oxidase is important for activating NADPH oxidase activity (Wong et al., 2007). Furthermore,
genetic evidences obtained through the characterization of Rho GTPase GDP dissociation inhibitor
(RhoGDI), suggest that ROPs are involved in spatial regulation of ROS production, which leads to
spatial control of growth (Carol et al., 2005; Carol and Dolan, 2006). The RhoGDI proteins are
thought to negatively regulate the GTPase ‘switch’ by maintaining the GTPase in a GDP-bound
‘inactive’ state (Yang, 2002). In Arabidopsis, loss of function of one member of the RhoGDI family,
called SUPERCENTIPEDE1 (SCN1)/AtRhoGDI1, results in both spatially deregulated ROS
accumulation and root hair outgrowth. Additionally, the ectopic sites of ROS accumulation in the
scn1/atrhogdi1 mutant require the activity of RHD2/AtrbohC, indicating that spatial regulation of
RHD2/AtrbohC involves SCN1/AtRhoGDI1 (Carol et al., 2005). Like RHD2/AtrbohC, ROPs (ROP2,
ROP4 and ROP6) also localize to the growing region of the hair tip (Molendijk et al., 2001; Jones et
al., 2002; Takeda et al., 2008). SCN1/RhoGDI1 is likely to act by regulating a ROP. It can interact
with ROP4 and ROP6 in yeast two-hybrid and in vitro assays (Bischoff et al., 2000). Knowing that, it
has been proposed that, if SCN1/AtRhoGDI1 were active in the spatial control of growth, then it
CHAPTER 1. GENERAL INTRODUCTION
12
might be expected that its regulatory targets, the ROP GTPases, should also be involved (Gapper
and Dolan, 2006).
1.3. THE SELECTIVE DEGRADATION OF PROTEINS IN CELLULAR REGULATION AND
QUALITY CONTROL
Several aspects of plant physiology, growth, and development are controlled by the
selective removal of short-lived regulatory proteins. Moreover, as sessile organisms, plants must
adapt their growth and development to protect themselves from detrimental conditions by
triggering a variety of signaling pathways, including the activation of the ubiquitin-mediated protein
degradation pathway. The removal of these proteins by various quality control pathways within the
ubiquitin-26S proteasome system (UPS) is critical for cell survival. Genome-wide studies have
revealed that the UPS in particular is a large and complex mechanism for protein removal,
occupying nearly 6% of the Arabidopsis thaliana proteome, with potentially thousands of additional
proteins serving as targets (Vierstra, 2003; Smalle and Vierstra, 2004). Moreover, genetic studies
enabled by genome-based programs such as the Arabidopsis 2010 project, revealed that the UPS
impacts nearly every aspect of plant growth and development including the cell-cycle,
embryogenesis, senescence, defense, environmental responses, and hormone signaling (Vierstra,
2009). The ubiquitin-proteasome pathway is of such importance for cellular regulation that in 2004
the Nobel Prize in Chemistry was awarded to Aaron Ciechanover, Avram Hershko and Irwin Rose
for their pioneering biochemical studies utilizing a reticulocyte lysate expression system to discover
and characterize ubiquitin and the enzyme activities required to conjugate it to substrates
(Wilkinson, 2005).
The Ubiquitin Proteasome System
The selective degradation of many short-lived proteins in eukaryotic cells is carried out by
the ubiquitin proteasome system. In the ubiquitin proteasome system a small protein, ubiquitin
(Ub), is covalently attached to target proteins and either regulates their function or marks them for
destruction by the multisubunit 26S proteasome (Figure 1.3) (Hershko and Ciechanover, 1998;
Mukhopadhyay and Riezman, 2007; Deshaies and Joazeiro, 2009). The consequence of this post-
CHAPTER 1. GENERAL INTRODUCTION
13
translational modification depends on the extent of polyubiquitination and the position of the
ubiquitin linkage in the polyubiquitin chain (Chau et al., 1989; Thrower et al., 2000; Haglund et al.,
2003; Hicke et al., 2005).
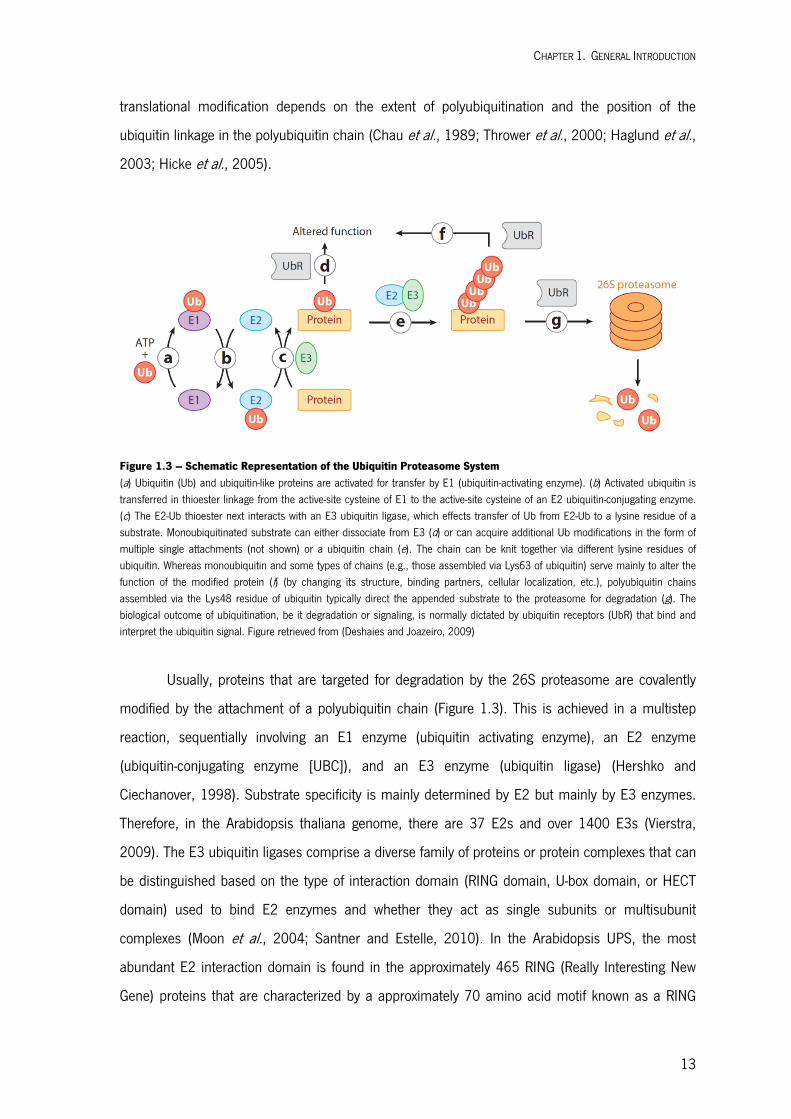
Figure 1.3 – Schematic Representation of the Ubiquitin Proteasome System (a) Ubiquitin (Ub) and ubiquitin-like proteins are activated for transfer by E1 (ubiquitin-activating enzyme). (b) Activated ubiquitin is transferred in thioester linkage from the active-site cysteine of E1 to the active-site cysteine of an E2 ubiquitin-conjugating enzyme. (c) The E2-Ub thioester next interacts with an E3 ubiquitin ligase, which effects transfer of Ub from E2-Ub to a lysine residue of a substrate. Monoubiquitinated substrate can either dissociate from E3 (d) or can acquire additional Ub modifications in the form of multiple single attachments (not shown) or a ubiquitin chain (e). The chain can be knit together via different lysine residues of ubiquitin. Whereas monoubiquitin and some types of chains (e.g., those assembled via Lys63 of ubiquitin) serve mainly to alter the function of the modified protein (f) (by changing its structure, binding partners, cellular localization, etc.), polyubiquitin chains assembled via the Lys48 residue of ubiquitin typically direct the appended substrate to the proteasome for degradation (g). The biological outcome of ubiquitination, be it degradation or signaling, is normally dictated by ubiquitin receptors (UbR) that bind and interpret the ubiquitin signal. Figure retrieved from (Deshaies and Joazeiro, 2009)
Usually, proteins that are targeted for degradation by the 26S proteasome are covalently
modified by the attachment of a polyubiquitin chain (Figure 1.3). This is achieved in a multistep
reaction, sequentially involving an E1 enzyme (ubiquitin activating enzyme), an E2 enzyme
(ubiquitin-conjugating enzyme [UBC]), and an E3 enzyme (ubiquitin ligase) (Hershko and
Ciechanover, 1998). Substrate specificity is mainly determined by E2 but mainly by E3 enzymes.
Therefore, in the Arabidopsis thaliana genome, there are 37 E2s and over 1400 E3s (Vierstra,
2009). The E3 ubiquitin ligases comprise a diverse family of proteins or protein complexes that can
be distinguished based on the type of interaction domain (RING domain, U-box domain, or HECT
domain) used to bind E2 enzymes and whether they act as single subunits or multisubunit
complexes (Moon et al., 2004; Santner and Estelle, 2010). In the Arabidopsis UPS, the most
abundant E2 interaction domain is found in the approximately 465 RING (Really Interesting New
Gene) proteins that are characterized by a approximately 70 amino acid motif known as a RING
CHAPTER 1. GENERAL INTRODUCTION
14
finger (Deshaies and Joazeiro, 2009; Santner and Estelle, 2010). The RING finger is a zinc-binding
motif that binds to the E2 Ub-conjugating enzyme during the ubiquitin conjugation cascade
(Deshaies and Joazeiro, 2009). Moreover, the RING E3s ligases are enzymes that bind ubiquitin-
conjugating (E2) enzyme and substrate catalyzing direct transfer of ubiquitin from E2 to substrate
(Deshaies and Joazeiro, 2009).
The Endoplasmic Reticulum-Associated Degradation in Protein Quality Control
Some nascent proteins that fold within the endoplasmic reticulum (ER) never reach their
native state. It was estimated that 30% of newly synthesized proteins in mammalian cells are
inappropriately folded (Schubert et al., 2000). The accumulation of unfolded proteins in the ER can
be induced by impairment of protein folding derived from mutation, perturbation of protein-protein
interactions, or different biotic and abiotic stress stimuli (Vembar and Brodsky, 2008). Misfolded
proteins accumulating in the lumen or membrane of the endoplasmic reticulum (ER) cause the
unfolded protein response (UPR), a collection of signaling pathways that adapt cells to ER stress
(Travers et al., 2000). These misfolded proteins are removed from the folding machinery,
dislocated from the ER into the cytosol, and degraded in a series of pathways collectively referred
to as Endoplasmic Reticulum-Associated Degradation (ERAD) (Vembar and Brodsky, 2008; Smith
et al., 2011). ERAD is a specific ubiquitin/proteasome system associated with the ER. Similar to
the general ubiquitination/degradation systems, it requires ubiquitin-activating enzyme (E1),
ubiquitin-conjugating enzyme (E2), ubiquitin ligase (E3), and 26S proteasome, as well as other
associated proteins (Hampton and Garza, 2009).
Distinct ERAD Pathways for the Degradation of ER Proteins in Yeast
Proteins transiting the ER can be soluble or membrane bound with significant portions in
the lumen, membrane, and cytosol. To accommodate the topological diversity, distinct pathways
work side by side to monitor misfolding. Substrates are targeted to an appropriate ERAD pathway
depending on the site of the misfolded lesion (Ismail and Ng, 2006). Most of our knowledge on
ERAD came from genetic/biochemical studies in yeast and mammalian systems (Hampton and
Garza, 2009). Due to the availability of mutant strains and well-characterized ERAD substrates,
recently studies performed in yeast allowed an extensive comprehension of the ERAD system.
Yeast has at least three different ERAD pathways, known as ERAD-L, ERAD-M, and ERAD-C, to
remove misfolded proteins with folding defects exposed in the ER lumen (L), ER membrane (M),

CHAPTER 1. GENERAL INTRODUCTION
15
and cytosol (C), respectively (Vashist and Ng, 2004; Carvalho et al., 2006). The central component
of the three ERAD pathways is an ER membrane-localized ubiquitin ligase (E3) Doa10a and Hrd1,
both containing multiple transmembrane segments and a cytosolic-facing E3-catalytic RING
domain, that ubiquitinates misfolded proteins (Kostova et al., 2007). The Doa10 and Hrd1 E3
ligases form two distinct membrane protein complexes that define the distinct ERAD pathways: the
Doa10 complex used by the ERAD-C pathway and Hrd1p complex used by the ERAD-L/-M pathway
(Ismail and Ng, 2006). The Doa10 complex, aside from Doa10 E3 ligase, contains an E2 complex
(Ubc7 and its membrane-anchoring factor Cue1) and the Cdc48 complex (the AAA-ATPase Cdc48,
its cofactors Ufd1 and Npl4, and its membrane anchorage protein Ubx2 (Carvalho et al., 2006)
(Figure 1.4). The Hrd1 complex shares some common components with the Doa10 complex,
namely the Ubc7/Cue1 dimer and the Cdc48 complex, partners of Doa10 (Carvalho et al., 2006).
In addition, other components, like: Hrd3 protein, an ERAD factor with a large ER luminal domain
that form a 1:1 complex with Hrd1 protein (Gardner et al., 2000); Der1 protein; Yos9 protein; and
Usa1 protein are unique to the Hrd1 complex (Figure 1.4) (Carvalho et al., 2006). Analysis of
pathway-specific substrates showed that the same Hrd1 core complex is employed in both ERAD-M
and ERAD-L, although only a subset of the components is functionally required for ERAD-M
(Carvalho et al., 2006).
Figure 1.4 – Distinct Ubiquitin-Ligase Complexes Defining Different ERAD Pathways in Yeast The scheme shows the ubiquitin-ligase complexes involved in the ERAD-L, -M, and -C pathways. Components in orange and green belong to the Hrd1 protein core and Cdc48 protein ATPase complexes, respectively. Stars show the location of the misfolded domain of a substrate. Ub is ubiquitin. Figure retrieved from Carvalho et al. (2006).
a Saccharomyces cerevisiae proteins are referred to by the relevant gene symbol, non‐italic, initial letter uppercase.
CHAPTER 1. GENERAL INTRODUCTION
16
The Endoplasmic Reticulum-Associated Degradation in Cellular Regulation
So far, in the present thesis, ERAD system was described in the context of protein
degradation as quality control. The ERAD process is responsible for the destruction of proteins
transiting the ER, that can be soluble or membrane bound with significant portions in the lumen,
membrane, and cytosol. This degradation process functions in protein quality control, where
damaged or unfolded proteins are selectively targeted for degradation, while correctly folded ones
are spared. However, ERAD is not restricted to aberrant proteins and is also employed for selective
degradation of correctly folded proteins underling cellular regulation (Hampton, 2002; Hampton
and Garza, 2009). In yeast and mammalian cells, the ERAD system is employed for the regulated
degradation of normal proteins such as the HMG-coenzyme (CoA) Reductase (HMGR) (Hampton
and Garza, 2009). HMGR is a rate-limiting enzyme of the mevalonate pathway, by which sterols
and a variety of essential isoprenoids are synthesized (for details, see above). In yeast and
mammalian cells, feedback regulation of the sterol pathway centers on regulated degradation of
HMGR (Hampton and Garza, 2009). When flux through the sterol pathway is high, degradation rate
is high and therefore the levels of HMGR are reduced. When flux is low, degradation rate is low and
enzyme levels increase in order to activate the pathway. Depending on cell type and signal
strength, HMGR half life can vary between >10 h, and <20 min (Hampton, 2002). Yeast has two
HMGR isozymes, Hmg1 and Hmg2. Nevertheless, only the Hmg2 isozyme undergoes regulated
degradation, in a manner strikingly similar to the mammalian enzyme: high flux through the sterol
pathway promotes more degradation, while diminished production of sterol pathway products
causes high stability (Hampton and Garza, 2009). In yeast, numerous genetic analyses were
conducted to find the HRD genes responsible for Hmg-CoA Reductase Degradation, and only the
Hrd1/Hrd3 ERAD complex has been associated with regulated degradation of HMGR (Hampton et
al., 1996). Moreover, in yeast, the ER-associated Hrd1p ligase is absolutely required for regulated
degradation of Hmg2p. In the absence of Hrd1, Hmg2 is completely stable no matter what the
level of sterol pathway activity (Hampton et al., 1996).
Conserved Endoplasmic Reticulum-Associated Protein Degradation in Plants
Compared with the level of knowledge regarding ER stress signalling in yeast and
mammalian cells, understanding of these processes in plants is limited. As most components of
ERAD are evolutionarily conserved, the basic conclusions derived from studies performed using
yeast and mammals are likely to be applicable to all eukaryotes. In yeast, one cellular function of
CHAPTER 1. GENERAL INTRODUCTION
17
the Cdc48 protein is a direct contribution to the retrotranslocation of ERAD substrates at an
intermediate step preceding proteasomal protein degradation in mammalian cells and yeast
(Jarosch et al., 2002). An earlier study suggested the involvement of Arabidopsis Cdc48 homolog,
in the degradation of mutated barley mildew-resistance locus O (MLO) protein when expressed in
Arabidopsis (Muller et al., 2005). In yeast, Der1 is a small protein that spans the ER membrane
four times and was one of the first ERAD factors identified and it comes in direct contact with
substrates (Knop et al., 1996). Other study reported the complementation of an ERAD defect of a
yeast der1Δ mutant by two maize homologs of the yeast/mammalian Derlins (Kirst et al., 2005).
Two genome wide gene-expression analyses reported up-regulation of Arabidopsis genes encoding
potential homologs of the known yeast/mammalian ERAD components in response to ER stresses
(Martinez and Chrispeels, 2003; Kamauchi et al., 2005). More recently, the identification and
characterization of some crucial components of the Hrd1 complex, as the ubiquitin E3 ligase and
E2 conjugase, that operates in ERAD system, have been reported in Arabidopsis (Liu et al., 2011;
Su et al., 2011; Cui et al., 2012). However, the Doa10 complex is still uncharacterized in plants.
1.4. STEROLS IN PLANTS
Sterols are isoprenoid-derived lipids that play essential roles in plant growth and
development (Benveniste, 2004; Phillips et al., 2006). Plant sterols have been extensively studied
with a major focus on biosynthetic and biochemical aspects (Schaller, 2003). Sterols are important
not only as structural components of eukaryotic cell membranes with an important role in
membrane fluidity and permeability (Hartmann, 1998), but also because they are the biosynthetic
precursors of steroid hormones in animals, insects and plants (Clouse, 2002; Schaller, 2004).
The role of animal steroids in the regulation of embryonic and postembryonic development along
with adult homeostasis is well known (Beato et al., 1995). However, cholesterol itself can also
serve as a signaling molecule, without conversion to steroid hormones (Farese and Herz, 1998;
Edwards and Ericsson, 1999; Bensinger et al., 2008). Whereas in animals, cholesterol is the only
structural sterol, plant membranes consist of a variable mixture of several phytosterols, being
sitosterol the most abundant (Schaller, 2004).
CHAPTER 1. GENERAL INTRODUCTION
18
Brassinosteroids (BRs) are the only sterol derived steroid hormones in plants. The diverse
functions of BRs in growth and development have been deeply investigated (Vert et al., 2005;
Gendron and Wang, 2007) but little is known about the putative regulatory roles of other
phytosterols. Several lines of evidence support the hypothesis that, beside their structural roles,
plant sterols also have signaling roles independent of BRs (Clouse, 2002). First, sterol deficient
mutants show defects in embryogenesis while BRs-deficient mutants do not. In addition sterol
mutants cannot be rescued by BRs treatment (Clouse, 2002). Second, typical sterols such
sitosterol and stigmasterol thought to have exclusively a structural role induce the specific
expression of genes involved in cell expansion and division (He et al., 2003). Third, lipid/sterol-
binding StAR-related lipid transfer (START) protein domains have been identified in plants (Schrick
et al., 2004). In fact, START domains are more common in plants than in animals and are
primarily found within homeodomain (HD) transcription factors, suggesting a mechanism by which
lipid/sterol ligands can directly modulate transcription in plants (Clouse, 2002). Fourth, an
intermediate sterol such obtusifoliol can be transported to distal parts of the plant away from the
sprayed leaves (O'Brien et al., 2005).
Biosynthetic Pathway of Plant Sterols
Acetyl-Coenzyme A (Acetyl-CoA) serves as a precursor molecule for sterol biosynthesis and
is converted into mevalonate (MVA) via several steps (Figure 1.5). The rate-limiting step from 3-
hydroxy-3-methylglutaryl-CoA (HMG-CoA) to MVA is catalyzed by HMG-CoA Reductase (HMGR). This
enzyme catalyzes the first committed step of the MVA pathway for isoprenoid biosynthesis (Stermer
et al., 1994). In plants, the MVA pathway provides precursors for a wide variety of isoprenoid
products that are required for sterols biosynthesis, but also for several other functions including:
membrane biogenesis, sesquiterpenoid phytoalexins and steroid glycoalkaloids for defense,
brassinosteroids and cytokinins for control of growth and development, farnesyl and geranyl groups
for protein prenylation, dolichols for protein glycosylation, and ubiquinone for respiration (Stermer
et al., 1994; Chappell, 1995).

CHAPTER 1. GENERAL INTRODUCTION
19
Figure 1.5 – Simplified Scheme of the Sterol Biosynthesis in Arabidopsis Mevalonate (MVA) synthesis from 3-hydroxy-3-methylglutaryl coenzyme A (HMG–CoA) is catalyzed by HMG-CoA Reductase (HMGR). A later step involves isopentenyl isomerase (IPI) that catalyzes the isomerization between isopentenyl diphosphate (IPP) and dimethylallyl diphosphate (DMAPP) in the MVA pathway. These serve as substrates for the production of farnesyl diphosphate (FPP) catalyzed by farnesyl phosphate transferase (FPS). The synthesis of squalene is catalyzed by squalene synthase (SQS) and its epoxidation catalyzed by squalene epoxidase (SQE), producing 2,3-oxidosqualene that is mainly cyclized to cycloartenol which requires cycloartenol synthase (CAS). Cycloartenol is further metabolized to produce steroids, including membrane sterols and brassinosteroids. In sterol biosynthesis schematic representation, only selected steps of sterol biosynthesis are indicated. Downstream squalene, only those intermediates whose levels are discussed below, on the present thesis, are shown. Dashed arrows indicate multiple reactions. The figure is an adaptation of the schemes presented in Boutte and Grebe (2009) and Pose et al. (2009).
CHAPTER 1. GENERAL INTRODUCTION
20
Sterols are synthesized from isopentenyl diphosphate (IPP) produced through the
mevalonate pathway located in the cytosol/endoplasmic reticulum (Figure 1.5). Isopentenyl
isomerase (IPI) catalyses the isomerisation between isopentenyl diphosphate (IPP) and
dimethylallyl diphosphate (DMAPP) in the MVA pathway. One molecule of DMAPP and two
molecules of IPP condense to form farnesyl pyrophosphate (FPP). The tail-to-tail coupling of two
molecules of FPP yields squalene, the first committed precursor to the sterol pathway, by action of
squalene synthase (SQS), and its epoxidation is catalyzed by squalene epoxidase (SQE), converting
squalene to 2,3-oxidosqualene, which is the first oxygenation step in the sterol biosynthetic
pathway (Benveniste, 2004; Boutte and Grebe, 2009). From 2,3-oxidosqualene, plant cells use a
sterol biosynthetic pathway that is different to that of other eukaryotes (Figure 1.5) (Schaller, 2003;
Benveniste, 2004; Schaller, 2004). Following conversion of 2,3-oxidosqualene to cycloartenol, the
first cyclic intermediate of plant sterol biosynthesis, the pathway is essentially linear until reaching
24-methylene lophenol. After formation of this compound, there is a bifurcation leading to either
24-methyl sterols, which include campesterol and its derivatives, the brassinosteroids, or 24-ethyl
sterols, which include the structural sterols sitosterol and stigmasterol (Clouse, 2002) (Figure 1.5).
Regulation of the Plant Sterol Biosynthetic Pathway by HMGR
Several evidences support that HMGR is the main rate-limiting step in isoprenoid
biosynthesis and has a key role in the regulation of the metabolic flux thought plant sterol
biosynthetic pathway (Figure 1.5). The genome of Arabidopsis thaliana contains two differentially
expressed HMGR genes, AtHMG1 and AtHMG2 that encode three HMGR isoforms: HMGR1S (short
isoform), HMGR1L (long isoform) and HMGR2 (Enjuto et al., 1994; Lumbreras et al., 1995).
HMGR1S and HMGR1L proteins derive from the HMG1 gene and are identical in sequence, but the
1L isoform has an N-terminal extension of 50 amino acid residues. The analysis of a null HMG1
mutant (hmg1-1) evidenced the essential role of this gene in plant development (Suzuki et al.,
2004). The hmg1-1 plants show dwarfism, early senescence, and male sterility. By contrast,
disruption of HMG2 does not affect the phenotype nether the fertility of the plant under normal
growth conditions, but chemical phenotypes of the hmg1 and hmg2 mutants demonstrated that
HMG2 as well as HMGR1 is responsible for the biosynthesis of triterpenes in spite of the lack of
visible phenotypes in hmg2 (Ohyama et al., 2007). Moreover, complete blockage of the MVA
pathway in hmg1 hmg2 double mutant results in male gametophyte lethality (Suzuki et al., 2009).
More evidences supporting a limiting role of plant HMGR in the biosynthesis of MVA-derived
CHAPTER 1. GENERAL INTRODUCTION
21
products has been obtained by the overexpression of the Arabidopsis HMGR isoforms in transgenic
Arabidopsis plants that led to an increase accumulation of leaf plant sterols (Manzano et al.,
2004). However, regulation of downstream enzymes in the plant sterols biosynthetic pathway still
limit the production of end-of-chain plant sterols, and excess of intermediates, accumulate in lipid
droplets in the cytosol of HMGR overexpressing plant cells (Schaller et al., 1995).
In yeast and mammals HMGR activity is tightly regulated at different levels, from
transcriptional to post-translational (Goldstein and Brown, 1990; Hampton et al., 1996). Moreover,
yeast and mammals HMGR is feedback regulated at post-translational level by a mechanism that
involves ERAD system and has described previously in the present thesis (DeBose-Boyd, 2008;
Hampton and Garza, 2009). In plants, the knowledge of regulatory mechanisms controlling HMGR
activity is still limited, but some key aspects of HMGR regulation have been uncovered. All known
plant HMGR variants have a diverged N-terminal region and a conserved catalytic domain located
in the cytosol, and a membrane domain whereas only a short stretch of amino acids connecting
the two transmembrane segments is in the lumen (Campos and Boronat, 1995). It is known that
the membrane domain of plant HMGR exerts negative regulation on the catalytic domain, thus
limiting plant sterols biosynthesis (Harker et al., 2003).
Recently, the regulation of plant HMGR was reviewed leading to conclude that HMGR has a
key regulatory role in the MVA pathway, critical not only for normal plant development, but also for
the adaptation to demanding environmental conditions. Consistent with this notion, plant HMGR is
modulated by endogenous signals and external stimuli, such as phytohormones, calcium,
calmodulin, light, blockage of isoprenoid biosynthesis, chemical challenge, wounding, elicitor
treatment, and pathogen attack (Stermer et al., 1994; Rodríguez-Concepción et al., 2011).
It has been proposed that the major changes in HMGR activity would be determined at the
transcriptional level, whereas the post-translational control would allow a finer and faster
adjustment (Chappell, 1995). Whereas transcriptional modulation of HMGR has been
demonstrated in many plant systems, evidence of post-translational regulation is still scarce
(Rodríguez-Concepción et al., 2011).
Sterol Metabolism in Plants
Two sets of experiments studies performed with a tobacco mutant line (sterov, sterol
overproducer) overproducing sterols have shown that the free sterol content of this mutant
remained close to this of wild-type plants and that the excess of sterols was converted into steryl
CHAPTER 1. GENERAL INTRODUCTION
22
esters (mostly steryl palmitate, oleate, linoleate and linolenate) that accumulated as lipid droplets
(Gondet et al., 1994; Schaller et al., 1994; Benveniste, 2002). These results, emphasized the
importance of sterol metabolism in order to maintain a level of free sterols in membranes
compatible with their vital functions (Benveniste, 2002; Schaller, 2004). At least three pathways
are universally involved in sterol metabolism in plants and especially in Arabidopsis: sterol
acylation, sterol glycosylation and oxydative conversion of sterols into brassinosteroids (Benveniste,
2002; Schaller, 2004). Other pathways involved in sterol metabolism (e.g. formation of
ecdysteroids, steroidal alkaloids, cardiotonic steroidal glucosides) have also been reported, but
associated to the secondary metabolism in specific plant families and therefore would not be
relevant of the general plant metabolism (Benveniste, 2002).
1.5. GENETIC APPROACHES TOWARDS THE STUDY OF STEROL BIOSYNTHESIS AND
FUNCTION
Genetic approaches based on mutants isolation and characterization have been essential
in the elucidation of mechanisms underlying plant growth and development, as well as those used
by plants to cope with environmental stresses. Sterols are isoprenoid-derived lipids that play
essential roles in plant growth and development (Benveniste, 2004; Phillips et al., 2006). Critical
for elucidation of the biological functions of sterols and their role in plant growth and development
has been the identification of Arabidopsis mutants with altered sterol profiles due to disruption of
specific enzymatic steps of the of the sterol pathway (Clouse, 2002; Schaller, 2004; Boutte and
Grebe, 2009).
Recently, the isolation of novel mutations affecting the early part of the sterol biosynthesis
pathway allowed the identification and characterization of physiological processes regulated by
sterols, that otherwise would be concealed. The Identification of the hypomorphic dry2/sqe1-5
allele revealed a central role for sterols in drought tolerance and regulation of Reactive Oxygen
Species, ROS (Pose et al., 2009). ROS are emerging as essential regulators of plant development.
The location at which ROS production takes place is also an important factor controlling plant
growth and development (Laloi et al., 2004; Gapper and Dolan, 2006; Kwak et al., 2006; Swanson
and Gilroy, 2010). Furthermore, the identification of a large number of independent mutants that
CHAPTER 1. GENERAL INTRODUCTION
23
reverted the extreme drought sensitivity and other developmental defects of sterol biosynthesis
pathway mutant dry2/sqe1-5, opened new possibilities for study the role sterol and isoprenoid
pathway in plant development and ROS production (Pose, 2008). Recent progress on the isolation
and characterization of novel Arabidopsis mutants affected in the regulation of sterol and
isoprenoid biosynthetic pathways are on the bases of the experimental work presented in this
thesis and will be further summarized.
Squalene Epoxidase Gene Family
Squalene epoxidase (SQE) enzymes convert squalene into 2,3-oxidosqualene, in an
oxidation process important in sterol biosynthesis. Yeast and mammals only contain one gene
encoding for SQE (Landl et al., 1996; Nagai et al., 1997). In contrast, multiple genes putatively
encoding SQEs have been described in several plants (Schafer et al., 1999; Suzuki et al., 2002;
Rasbery et al., 2007), suggesting that this step of sterol biosynthesis may be subject to additional
regulation in plants. In Arabidopsis thaliana, six putative SQE genes were identified based on
sequence homology (Rasbery et al., 2007). However, only SQE1, SQE2 and SQE3 cDNAs were
able to complement the yeast erg1, a mutant that lacks the SQE, functionally demonstrating
enzymatic SQE activity for the proteins encoded by the three genes (Rasbery et al., 2007).
The other Arabidopsis genes that show homology to SQEs (SQE4, SQE5 and SQE6) are expected to
have different catalytic activity, which is evidenced by its location in a different phylogeny clade with
the others and the inability to complement the yeast erg1 mutant (Rasbery et al., 2007; Laranjeira,
2011). Therefore, the function of SQE2 and SQE3 could potentially overlap with that of SQE1.
Expression analysis based on microarray databases, suggests that SQE1 is the SQE that is most
highly expressed in roots, SQE2 is expressed at low levels in most tissues and SQE3 is highly
expressed in leaves and expressed at low levels in roots. GUS histochemical analysis revealed that
SQE1 is expressed in the shoot and in the elongation zone of the root whereas SQE3 is expressed
in the entire seedling, with predominance in the cotyledon (namely the stomata, the vasculature
and meristematic tissues) (Pose et al., 2009; Laranjeira, 2011), thus, suggesting that some tissue
specificity exists within SQEs.
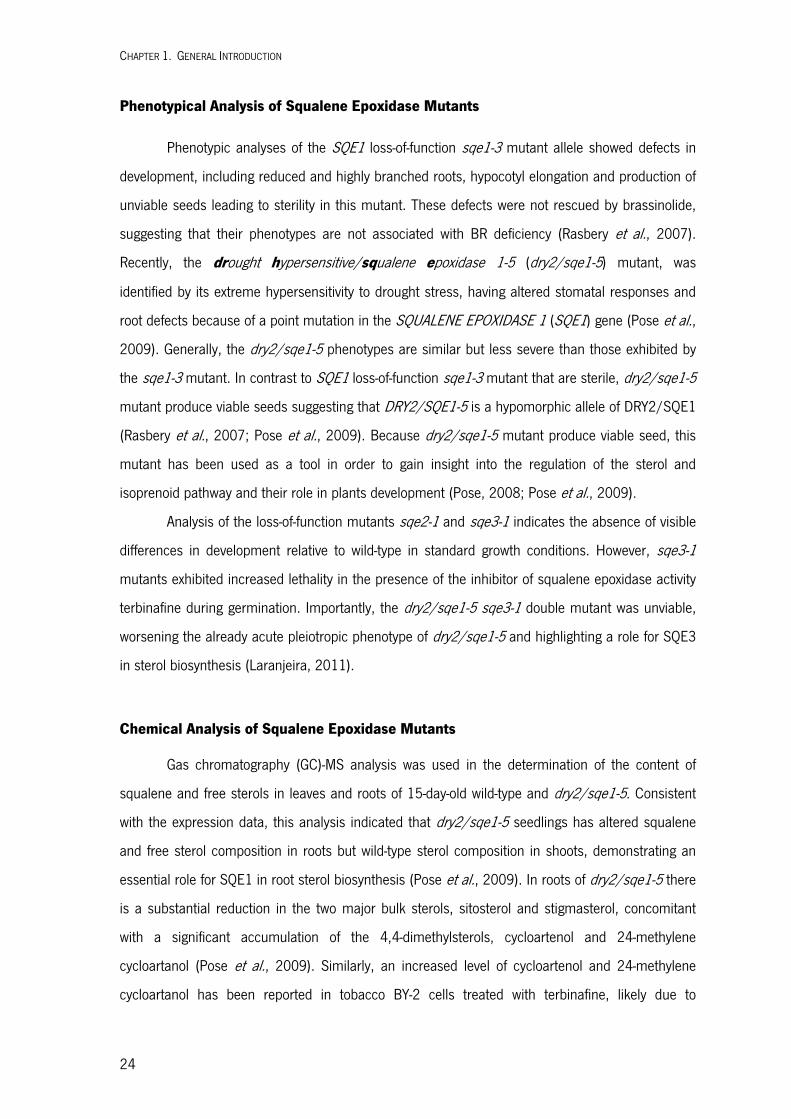
CHAPTER 1. GENERAL INTRODUCTION
24
Phenotypical Analysis of Squalene Epoxidase Mutants
Phenotypic analyses of the SQE1 loss-of-function sqe1-3 mutant allele showed defects in
development, including reduced and highly branched roots, hypocotyl elongation and production of
unviable seeds leading to sterility in this mutant. These defects were not rescued by brassinolide,
suggesting that their phenotypes are not associated with BR deficiency (Rasbery et al., 2007).
Recently, the drought hypersensitive/squalene epoxidase 1-5 (dry2/sqe1-5) mutant, was
identified by its extreme hypersensitivity to drought stress, having altered stomatal responses and
root defects because of a point mutation in the SQUALENE EPOXIDASE 1 (SQE1) gene (Pose et al.,
2009). Generally, the dry2/sqe1-5 phenotypes are similar but less severe than those exhibited by
the sqe1-3 mutant. In contrast to SQE1 loss-of-function sqe1-3 mutant that are sterile, dry2/sqe1-5
mutant produce viable seeds suggesting that DRY2/SQE1-5 is a hypomorphic allele of DRY2/SQE1
(Rasbery et al., 2007; Pose et al., 2009). Because dry2/sqe1-5 mutant produce viable seed, this
mutant has been used as a tool in order to gain insight into the regulation of the sterol and
isoprenoid pathway and their role in plants development (Pose, 2008; Pose et al., 2009).
Analysis of the loss-of-function mutants sqe2-1 and sqe3-1 indicates the absence of visible
differences in development relative to wild-type in standard growth conditions. However, sqe3-1
mutants exhibited increased lethality in the presence of the inhibitor of squalene epoxidase activity
terbinafine during germination. Importantly, the dry2/sqe1-5 sqe3-1 double mutant was unviable,
worsening the already acute pleiotropic phenotype of dry2/sqe1-5 and highlighting a role for SQE3
in sterol biosynthesis (Laranjeira, 2011).
Chemical Analysis of Squalene Epoxidase Mutants
Gas chromatography (GC)-MS analysis was used in the determination of the content of
squalene and free sterols in leaves and roots of 15-day-old wild-type and dry2/sqe1-5. Consistent
with the expression data, this analysis indicated that dry2/sqe1-5 seedlings has altered squalene
and free sterol composition in roots but wild-type sterol composition in shoots, demonstrating an
essential role for SQE1 in root sterol biosynthesis (Pose et al., 2009). In roots of dry2/sqe1-5 there
is a substantial reduction in the two major bulk sterols, sitosterol and stigmasterol, concomitant
with a significant accumulation of the 4,4-dimethylsterols, cycloartenol and 24-methylene
cycloartanol (Pose et al., 2009). Similarly, an increased level of cycloartenol and 24-methylene
cycloartanol has been reported in tobacco BY-2 cells treated with terbinafine, likely due to
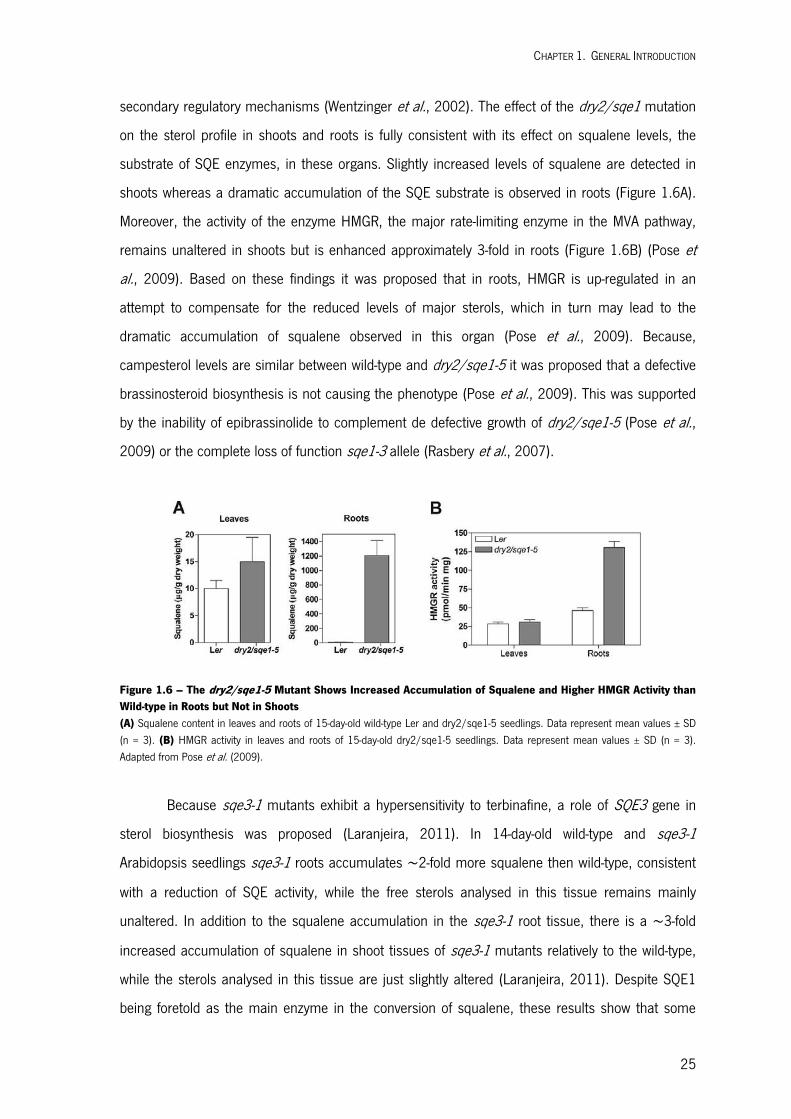
CHAPTER 1. GENERAL INTRODUCTION
25
secondary regulatory mechanisms (Wentzinger et al., 2002). The effect of the dry2/sqe1 mutation
on the sterol profile in shoots and roots is fully consistent with its effect on squalene levels, the
substrate of SQE enzymes, in these organs. Slightly increased levels of squalene are detected in
shoots whereas a dramatic accumulation of the SQE substrate is observed in roots (Figure 1.6A).
Moreover, the activity of the enzyme HMGR, the major rate-limiting enzyme in the MVA pathway,
remains unaltered in shoots but is enhanced approximately 3-fold in roots (Figure 1.6B) (Pose et
al., 2009). Based on these findings it was proposed that in roots, HMGR is up-regulated in an
attempt to compensate for the reduced levels of major sterols, which in turn may lead to the
dramatic accumulation of squalene observed in this organ (Pose et al., 2009). Because,
campesterol levels are similar between wild-type and dry2/sqe1-5 it was proposed that a defective
brassinosteroid biosynthesis is not causing the phenotype (Pose et al., 2009). This was supported
by the inability of epibrassinolide to complement de defective growth of dry2/sqe1-5 (Pose et al.,
2009) or the complete loss of function sqe1-3 allele (Rasbery et al., 2007).
Figure 1.6 – The dry2/sqe1-5 Mutant Shows Increased Accumulation of Squalene and Higher HMGR Activity than Wild-type in Roots but Not in Shoots (A) Squalene content in leaves and roots of 15-day-old wild-type Ler and dry2/sqe1-5 seedlings. Data represent mean values ± SD (n = 3). (B) HMGR activity in leaves and roots of 15-day-old dry2/sqe1-5 seedlings. Data represent mean values ± SD (n = 3). Adapted from Pose et al. (2009).
Because sqe3-1 mutants exhibit a hypersensitivity to terbinafine, a role of SQE3 gene in
sterol biosynthesis was proposed (Laranjeira, 2011). In 14-day-old wild-type and sqe3-1
Arabidopsis seedlings sqe3-1 roots accumulates 2-fold more squalene then wild-type, consistent
with a reduction of SQE activity, while the free sterols analysed in this tissue remains mainly
unaltered. In addition to the squalene accumulation in the sqe3-1 root tissue, there is a 3-fold
increased accumulation of squalene in shoot tissues of sqe3-1 mutants relatively to the wild-type,
while the sterols analysed in this tissue are just slightly altered (Laranjeira, 2011). Despite SQE1
being foretold as the main enzyme in the conversion of squalene, these results show that some
CHAPTER 1. GENERAL INTRODUCTION
26
tissue specificity exists within SQEs. In terms of biochemical analysis of the mutants, SQE1 role is
more important in roots, while SQE3 (probably together with SQE1) seems to have a major role in
shoots (Laranjeira, 2011).
Arabidopsis dry2/sqe1-5 Mutant Reveals a Central Role for Sterols in Drought
Tolerance and Regulation of ROS
The EMS recessive mutant dry2/sqe1-5 was identified by its drought hypersensitivity
(Figure 1.7A) (Pose et al., 2009). In low relative humidity (RH) conditions (35% RH) dry2 plants are
smaller than wild type and also have a pale green phenotype because of a reduced chlorophyll
content (Figures 1.7B,C,E). dry2 seedlings also shows increased proline levels (Figure 1.7F), an
osmolyte that accumulates under conditions of water deficit. However, in 95% RH, dry2 mutant
shows a phenotype and both chlorophyll and proline content similar to Ler (Figures 1.7D,E,F)
(Pose et al., 2009). The extreme sensitivity of dry2/sqe1-5 mutant to dehydration suggests that
shoot developmental defects could be caused by a defective water balance. dry2/sqe1 is impaired
in stomatal function, showing a defective response to the decrease of the HR (Figure 1.7G)
(Pose et al., 2009).
Root architecture is very affected in dry2/sqe1-5. The length of its primary root and root
hairs are shorter than that of wild type (Figure 1.8A) and developed branched root hairs (Figure
1.8B) and more than one hair per trichoblast (Figure 1.8C), implicating SQE1 in both root hair
initiation and polar growth (Pose et al., 2009). Because superoxide (O2•−) accumulation in root hairs
is defective in dry2/sqe1-5 (Figure 1.8D), the altered morphology of root hairs in dry2/sqe1-5
mutants is proposed to be caused by de-localization of RHD2 NADPH oxidase (Figure 1.8E) (Pose
et al., 2009).
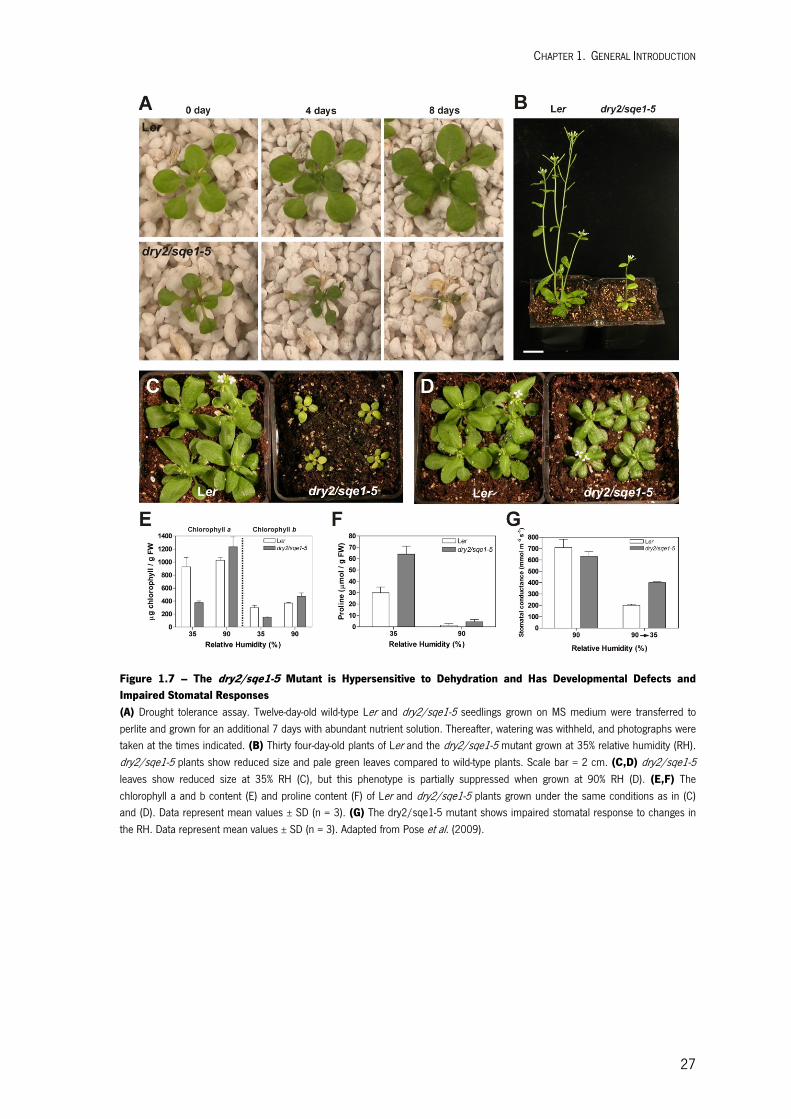
CHAPTER 1. GENERAL INTRODUCTION
27
Figure 1.7 – The dry2/sqe1-5 Mutant is Hypersensitive to Dehydration and Has Developmental Defects and Impaired Stomatal Responses (A) Drought tolerance assay. Twelve-day-old wild-type Ler and dry2/sqe1-5 seedlings grown on MS medium were transferred to perlite and grown for an additional 7 days with abundant nutrient solution. Thereafter, watering was withheld, and photographs were taken at the times indicated. (B) Thirty four-day-old plants of Ler and the dry2/sqe1-5 mutant grown at 35% relative humidity (RH). dry2/sqe1-5 plants show reduced size and pale green leaves compared to wild-type plants. Scale bar = 2 cm. (C,D) dry2/sqe1-5 leaves show reduced size at 35% RH (C), but this phenotype is partially suppressed when grown at 90% RH (D). (E,F) The chlorophyll a and b content (E) and proline content (F) of Ler and dry2/sqe1-5 plants grown under the same conditions as in (C) and (D). Data represent mean values ± SD (n = 3). (G) The dry2/sqe1-5 mutant shows impaired stomatal response to changes in the RH. Data represent mean values ± SD (n = 3). Adapted from Pose et al. (2009).
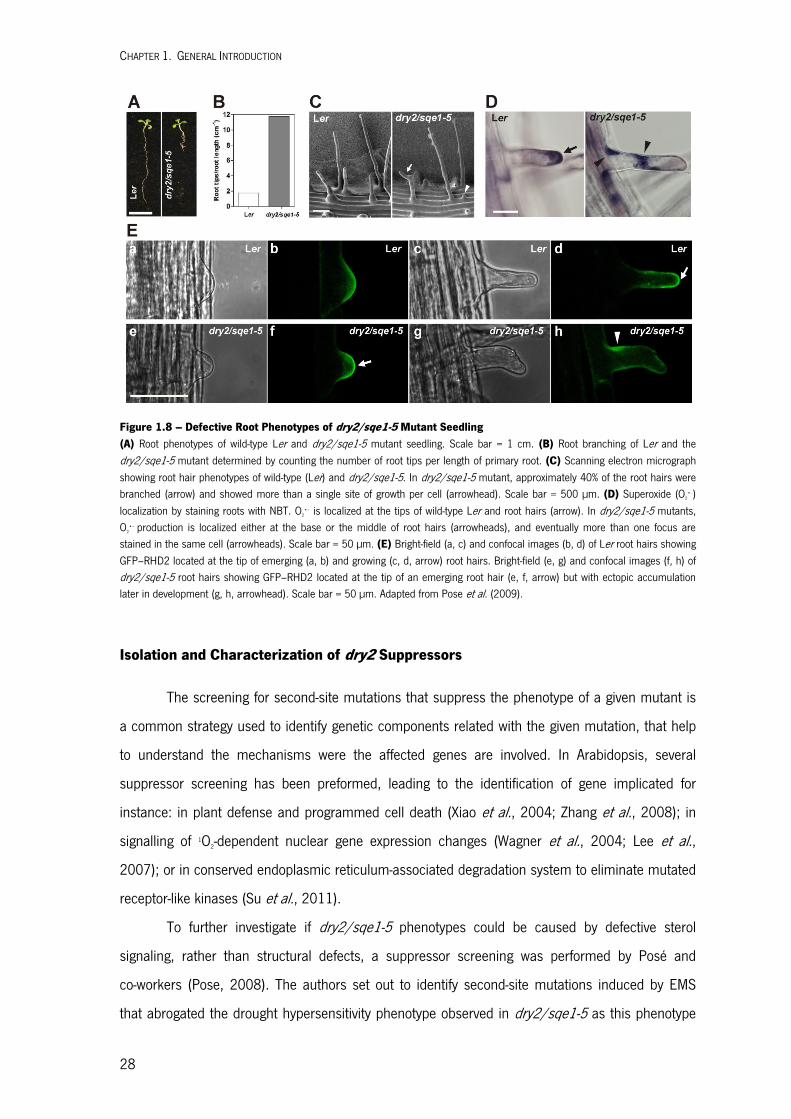
CHAPTER 1. GENERAL INTRODUCTION
28
Figure 1.8 – Defective Root Phenotypes of dry2/sqe1-5 Mutant Seedling (A) Root phenotypes of wild-type Ler and dry2/sqe1-5 mutant seedling. Scale bar = 1 cm. (B) Root branching of Ler and the dry2/sqe1-5 mutant determined by counting the number of root tips per length of primary root. (C) Scanning electron micrograph showing root hair phenotypes of wild-type (Ler) and dry2/sqe1-5. In dry2/sqe1-5 mutant, approximately 40% of the root hairs were branched (arrow) and showed more than a single site of growth per cell (arrowhead). Scale bar = 500 μm. (D) Superoxide (O2
•−) localization by staining roots with NBT. O2
•− is localized at the tips of wild-type Ler and root hairs (arrow). In dry2/sqe1-5 mutants, O2
•− production is localized either at the base or the middle of root hairs (arrowheads), and eventually more than one focus are stained in the same cell (arrowheads). Scale bar = 50 μm. (E) Bright-field (a, c) and confocal images (b, d) of Ler root hairs showing GFP–RHD2 located at the tip of emerging (a, b) and growing (c, d, arrow) root hairs. Bright-field (e, g) and confocal images (f, h) of dry2/sqe1-5 root hairs showing GFP–RHD2 located at the tip of an emerging root hair (e, f, arrow) but with ectopic accumulation later in development (g, h, arrowhead). Scale bar = 50 μm. Adapted from Pose et al. (2009).
Isolation and Characterization of dry2 Suppressors
The screening for second-site mutations that suppress the phenotype of a given mutant is
a common strategy used to identify genetic components related with the given mutation, that help
to understand the mechanisms were the affected genes are involved. In Arabidopsis, several
suppressor screening has been preformed, leading to the identification of gene implicated for
instance: in plant defense and programmed cell death (Xiao et al., 2004; Zhang et al., 2008); in
signalling of 1O2-dependent nuclear gene expression changes (Wagner et al., 2004; Lee et al.,
2007); or in conserved endoplasmic reticulum-associated degradation system to eliminate mutated
receptor-like kinases (Su et al., 2011).
To further investigate if dry2/sqe1-5 phenotypes could be caused by defective sterol
signaling, rather than structural defects, a suppressor screening was performed by Posé and
co-workers (Pose, 2008). The authors set out to identify second-site mutations induced by EMS
that abrogated the drought hypersensitivity phenotype observed in dry2/sqe1-5 as this phenotype

CHAPTER 1. GENERAL INTRODUCTION
29
is easily scored. This screening leaded to the identification of a large number of independent
mutants that reverts the extreme drought sensitivity of dry2/sqe1-5 and other developmental
defects. In this screening, a total of 27 independent M2 lines, originating from 131 different pools
of 50 M1 plants that showed a significant reversion of dry2/sqe1-5 drought hypersensitivity, were
identified. The suppressors affected where name sud for suppressor of dry2/sqe1-5 defects and
subsequently named dry2/sud1 to dry2/sud27 (Pose, 2008). After analyzing the suppression of
dry2 phenotypic defects in the next generation, 4 suppressors (dry2/sud9, dry2/sud22,
dry2/sud26, dry2/sud27) were selected for further characterization, because in addition to the
drought hypersensitivity also suppressed the root growth defects of dry2/sqe1-5 (Doblas, Amorim-
Silva et al. Submitted). Sequencing of the DRY2/SQE1-5 gene in the 4 suppressors confirmed that
they contained the dry2/sqe1-5 mutation and the recovery of the phenotypes was not caused by
seed contamination of wild-type plants (Pose, 2008).
A more detailed phenotypic characterization of dry2/sud9 and dry2/sud22 roots relative to
wild-type and dry2/sqe1-5 mutant (hereafter named dry2) was performed. The root length of
dry2/sud9 and dry2/sud22 was double than that of dry2, reaching 70% that of the primary root
length of wild-type plants (Figure 1.9A,B) and also showed decreased number of lateral roots
compared to dry2 (Figure 1.9C) (Pose, 2008). dry2 also showed striking defects in root hairs.
While almost an 80% of root hairs from wild-type plants were over 300 m in length, most root
hairs of dry2 were shorter than 200 m (Pose et al., 2009). As shown in Figure 1.9D and 1.9E,
second site mutations in dry2/sud9 and dry2/sud22 substantially restore the root hair defects
(Pose, 2008). Root hair growth requires the localized production of ROS by RHD2/AtrbohC NADPH
oxidase (Foreman et al., 2003; Carol et al., 2005; Takeda et al., 2008) and dry2 show
defective ROS production caused by a misslocalization of AtrbohC (Pose et al., 2009). As shown
in Figure 1.9F, dry2/sud9 and dry2/sud22 showed wild-type H2O2 production at the bulge
of the root tip, which is consistent with the restoration of the growth defects (Doblas, Amorim-Silva
et al. Submitted).

CHAPTER 1. GENERAL INTRODUCTION
30
Figura 1.9 – Suppressors Rescue the Root Growth Defects of dry2 Mutant (A) Root phenotypes of wild-type (WT) Ler, dry2 and dry2/sud9 mutant seedling. Scale bar = 1 cm. (B) Primary root growth over 10 days for Ler, dry2, dry2/sud9 and dry2/sud22. (C) Root branching of wild type Ler, dry2, dry2/sud9, and dry2/sud22 estimated by counting the number of root tips per primary root length. (D) Percentage root hair length of Ler, dry2, dry2/sud9, and dry2/sud22. (E) Roots of wild-type Ler, dry2, dry2/sud9, and dry2/sud22. Scale bar = 500 μm. (F) ROS staining in roots using DAB. H2O2 is localized at the tips of Ler, dry2/sud9 and dry2/sud22 root hairs and not in dry2 (arrows) Scale bar = 200 m. Figure
A-E adapted from (Pose, 2008) and figure F adapted from Doblas, Amorim-Silva et al. (Submitted).
Although at seedling stage dry2/sud9 and dry2/sud22 show a slight delay in development,
shoot growth recover and reach similar size in adult to wild-type plants (Figure 1.10A) (Doblas,
Amorim-Silva et al. Submitted), however the extreme drought sensitivity that exhibit dry2 is
suppressed in dry2/sud9 and dry2/sud22 (Pose, 2008). dry2 show insensitivity to ABA-induced
stomatal closure. Treatment with exogenously applied 20 M ABA only reduced 20% of stomatal

CHAPTER 1. GENERAL INTRODUCTION
31
conductance compared with the 80% reduction that occurs in wild-type plants (Figure 1.10B)
(Pose et al., 2009). dry2/sud9 showed similar stomatal responses as wild-type plants (Figure
1.10B) indicating a suppression of this phenotype (Pose, 2008). Proline content in dry2/sud9 is
also similar to wild-type plants indicating a restoration of water relations (Figure 1.10C) (Pose,
2008).
Figura 1.10 – Suppressors Show Wild-type Shoot Growth (A) Shoot phenotype of 28 days-old plant of wild-type (WT) Ler, dry2, dry2/sud9 and dry2/sud22. (B) Stomatal conductance of wild-type Ler, dry2 and dry2/sud9 four hours after spraying the indicated Abscisic Acid (ABA) concentrations. The dry2 mutant shows reduced stomatal responses to exogenous ABA compared to Ler and to dry2/sud9. Data represent mean values ± SD (n = 3). (C) Proline content was determined in Ler, dry2 and dry2/sud9 plants grown at 35% and 90% Relative Humidity. Data represent mean values ± SD (n = 3). Figure 1.10A was adapted from Doblas, Amorim-Silva et al. (Submitted). Figure 1.10B and C was adapted from Pose et al. (2009).
Suppression of dry2 defects is not likely to be caused by a restoration of sterol
composition. However the roots of dry2 shows important differences in sterol content relative to
wild-type, sterol composition of dry2/sud9 was similar to dry2 and both significantly different from
wild-type (Table 1.1) (Pose, 2008). Therefore, the reversion of dry2/sud9 root defects cannot be
simply explained by a recovery of major sterols to wild-type levels.
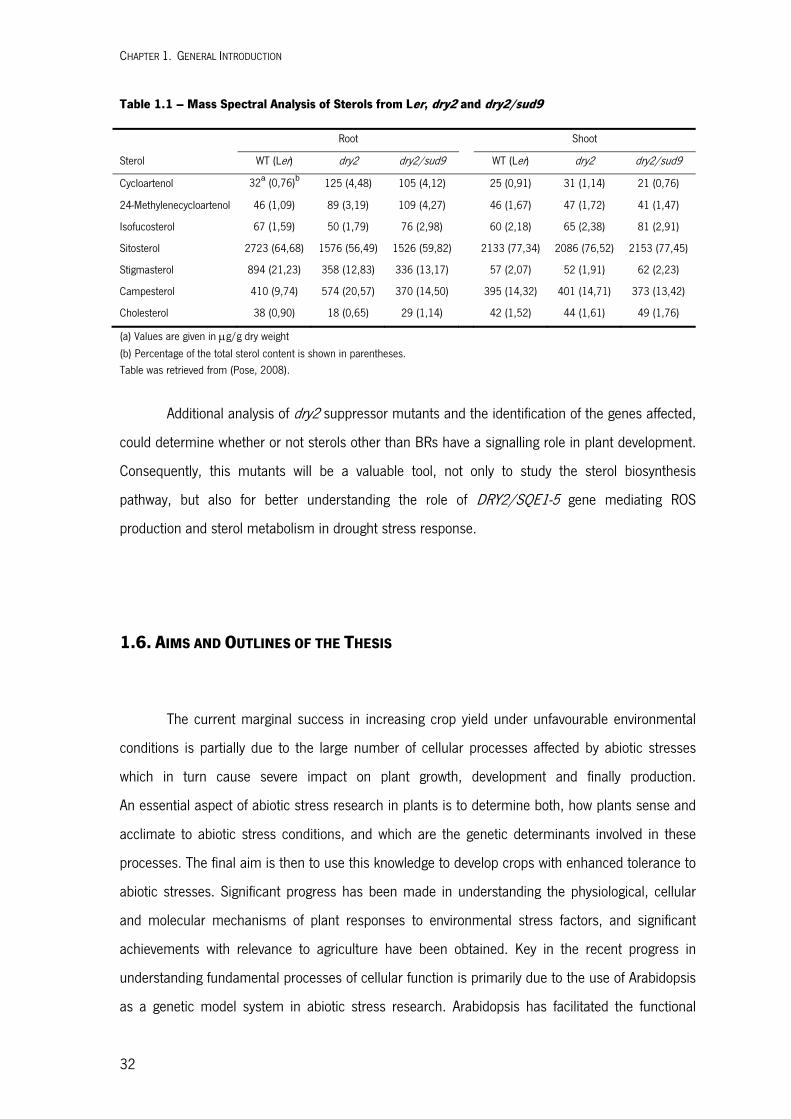
CHAPTER 1. GENERAL INTRODUCTION
32
Table 1.1 – Mass Spectral Analysis of Sterols from Ler, dry2 and dry2/sud9
Root Shoot
Sterol WT (Ler) dry2 dry2/sud9 WT (Ler) dry2 dry2/sud9
Cycloartenol 32a (0,76)b 125 (4,48) 105 (4,12) 25 (0,91) 31 (1,14) 21 (0,76)
24-Methylenecycloartenol 46 (1,09) 89 (3,19) 109 (4,27) 46 (1,67) 47 (1,72) 41 (1,47)
Isofucosterol 67 (1,59) 50 (1,79) 76 (2,98) 60 (2,18) 65 (2,38) 81 (2,91)
Sitosterol 2723 (64,68) 1576 (56,49) 1526 (59,82) 2133 (77,34) 2086 (76,52) 2153 (77,45)
Stigmasterol 894 (21,23) 358 (12,83) 336 (13,17) 57 (2,07) 52 (1,91) 62 (2,23)
Campesterol 410 (9,74) 574 (20,57) 370 (14,50) 395 (14,32) 401 (14,71) 373 (13,42)
Cholesterol 38 (0,90) 18 (0,65) 29 (1,14) 42 (1,52) 44 (1,61) 49 (1,76)
(a) Values are given in g/g dry weight
(b) Percentage of the total sterol content is shown in parentheses. Table was retrieved from (Pose, 2008).
Additional analysis of dry2 suppressor mutants and the identification of the genes affected,
could determine whether or not sterols other than BRs have a signalling role in plant development.
Consequently, this mutants will be a valuable tool, not only to study the sterol biosynthesis
pathway, but also for better understanding the role of DRY2/SQE1-5 gene mediating ROS
production and sterol metabolism in drought stress response.
1.6. AIMS AND OUTLINES OF THE THESIS
The current marginal success in increasing crop yield under unfavourable environmental
conditions is partially due to the large number of cellular processes affected by abiotic stresses
which in turn cause severe impact on plant growth, development and finally production.
An essential aspect of abiotic stress research in plants is to determine both, how plants sense and
acclimate to abiotic stress conditions, and which are the genetic determinants involved in these
processes. The final aim is then to use this knowledge to develop crops with enhanced tolerance to
abiotic stresses. Significant progress has been made in understanding the physiological, cellular
and molecular mechanisms of plant responses to environmental stress factors, and significant
achievements with relevance to agriculture have been obtained. Key in the recent progress in
understanding fundamental processes of cellular function is primarily due to the use of Arabidopsis
as a genetic model system in abiotic stress research. Arabidopsis has facilitated the functional
CHAPTER 1. GENERAL INTRODUCTION
33
characterization of numerous genes by use of loss- or gain-of-function experimental approaches. In
a previous study, the extreme drought hypersensitive dry2/sqe1-5 mutant was isolated and used to
perform a suppressor screening. Several mutants (named sud for suppressors of dry2 defects)
that reversed most of the dry2/sqe1-5 developmental phenotypes, including its drought
hypersensitivity were isolated. Thus, within this Ph.D thesis, the main aim was to identify the
molecular nature of the dry2 suppressors and determine mechanistically how they restore wild-type
phenotypes. This was initiated by the positional cloning of the gene affected by the suppressor
mutations that led to the identification of SUD1. Later, a detailed physiological, biochemical and
molecular characterization of dry2/sud1-9 and dry2/sud1-22 suppressors was performed.
Following the phenotypic characterization of these genes, research was ultimately focused on the
identification of gene function, thus allowing the identification of new genetic components
regulating the MVA pathway. The present thesis is organised in an outline that reflects specific
aims:
Chapter 1 provides a general introduction to the effects that abiotic stresses cause in
crop production, underlying research strategies that try to meet the worldwide demand of
increased crop yield. In addition, a review is presented on related research issues related with the
present thesis, like the role of reactive oxygen species in plant development, the selective
degradation of proteins and their function in cellular regulation and quality control, sterol
production and function in plants, and finally genetic approaches towards the study of sterol
biosynthesis. Chapters 2 to 7 are devoted for specific aims subordinated to the global aim of the
thesis, each chapter including a brief introduction, results and discussion, and materials and
methods used to perform the experiments and analysis presented in the given chapter.
In Chapter 2 is investigated the role of reactive oxygen species in dry2 and dry2 suppressors. In
Chapter 3 is presented the map-based cloning of four semidominant dry2 suppressors that led to
the identification of SUD1. In Chapter 4 is described the in silico analysis of SUD1 expression and
the microarray-based whole-genome transcript profiling of wild-type, dry2, dry2/sud9, and
dry2/sud22. Chapter 5 is devoted to the in silico structural and phylogenetic analysis of SUD1,
which encodes a protein showing sequence and structural homology to the E3 ubiquitin ligases
involved in ERAD-C pathway. Chapter 6 describes the series of experiments that were conducted
as an effort to functionally characterize the likely Arabidopsis DOA10 ortholog gene SUD1 using
yeast. Because SUD1 is a putative member of the ERAD pathway, the two Arabidopsis redundant
genes AtHRD1A and AtHRD1B, which are the most likely orthologs of the yeast ERAD component

CHAPTER 1. GENERAL INTRODUCTION
34
Hrd1, were also included in this chapter. Chapter 7 describes the use of micro-grafting in the
study of long-distance isoprenoid-derived signalling in dry2. Chapter 8 includes the final remarks
and future prospects concerning the presented research lines. Chapter 9 details the bibliographic
references cited throughout this manuscript.
The specific Materials and Methods are included in the correspondent thesis chapter.
Standard molecular biology methods are presented in more detail in Appendix I. Detailed
information regarding the genetic markers in Arabidopsis chromosomes used for map-based
cloning of SUD1 are presented in Appendix II and maps of commercial vectors used for cloning
procedures are depicted in Appendix II.
Chapter 2
Investigating the role of Reactive Oxygen Species in dry2
CONTENTS
2.1. INTRODUCTION 2.2. RESULTS AND DISCUSSION
ROS Generators Suppress Root Branching Defects in dry2 Suppressors Recover Wild-type ROS Production Imaging Intracellular Hydrogen Peroxide Production using HyPer
2.3. MATERIALS AND METHODS

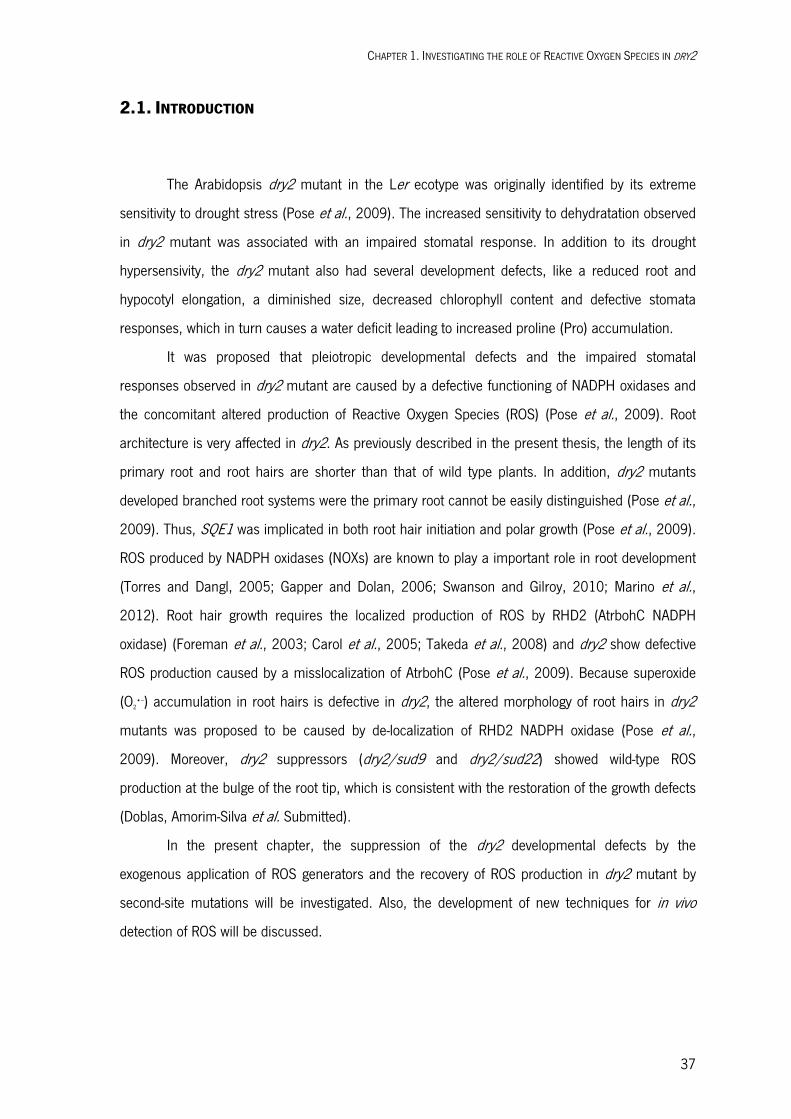
CHAPTER 1. INVESTIGATING THE ROLE OF REACTIVE OXYGEN SPECIES IN DRY2
37
2.1. INTRODUCTION
The Arabidopsis dry2 mutant in the Ler ecotype was originally identified by its extreme
sensitivity to drought stress (Pose et al., 2009). The increased sensitivity to dehydratation observed
in dry2 mutant was associated with an impaired stomatal response. In addition to its drought
hypersensivity, the dry2 mutant also had several development defects, like a reduced root and
hypocotyl elongation, a diminished size, decreased chlorophyll content and defective stomata
responses, which in turn causes a water deficit leading to increased proline (Pro) accumulation.
It was proposed that pleiotropic developmental defects and the impaired stomatal
responses observed in dry2 mutant are caused by a defective functioning of NADPH oxidases and
the concomitant altered production of Reactive Oxygen Species (ROS) (Pose et al., 2009). Root
architecture is very affected in dry2. As previously described in the present thesis, the length of its
primary root and root hairs are shorter than that of wild type plants. In addition, dry2 mutants
developed branched root systems were the primary root cannot be easily distinguished (Pose et al.,
2009). Thus, SQE1 was implicated in both root hair initiation and polar growth (Pose et al., 2009).
ROS produced by NADPH oxidases (NOXs) are known to play a important role in root development
(Torres and Dangl, 2005; Gapper and Dolan, 2006; Swanson and Gilroy, 2010; Marino et al.,
2012). Root hair growth requires the localized production of ROS by RHD2 (AtrbohC NADPH
oxidase) (Foreman et al., 2003; Carol et al., 2005; Takeda et al., 2008) and dry2 show defective
ROS production caused by a misslocalization of AtrbohC (Pose et al., 2009). Because superoxide
(O2•−) accumulation in root hairs is defective in dry2, the altered morphology of root hairs in dry2
mutants was proposed to be caused by de-localization of RHD2 NADPH oxidase (Pose et al.,
2009). Moreover, dry2 suppressors (dry2/sud9 and dry2/sud22) showed wild-type ROS
production at the bulge of the root tip, which is consistent with the restoration of the growth defects
(Doblas, Amorim-Silva et al. Submitted).
In the present chapter, the suppression of the dry2 developmental defects by the
exogenous application of ROS generators and the recovery of ROS production in dry2 mutant by
second-site mutations will be investigated. Also, the development of new techniques for in vivo
detection of ROS will be discussed.
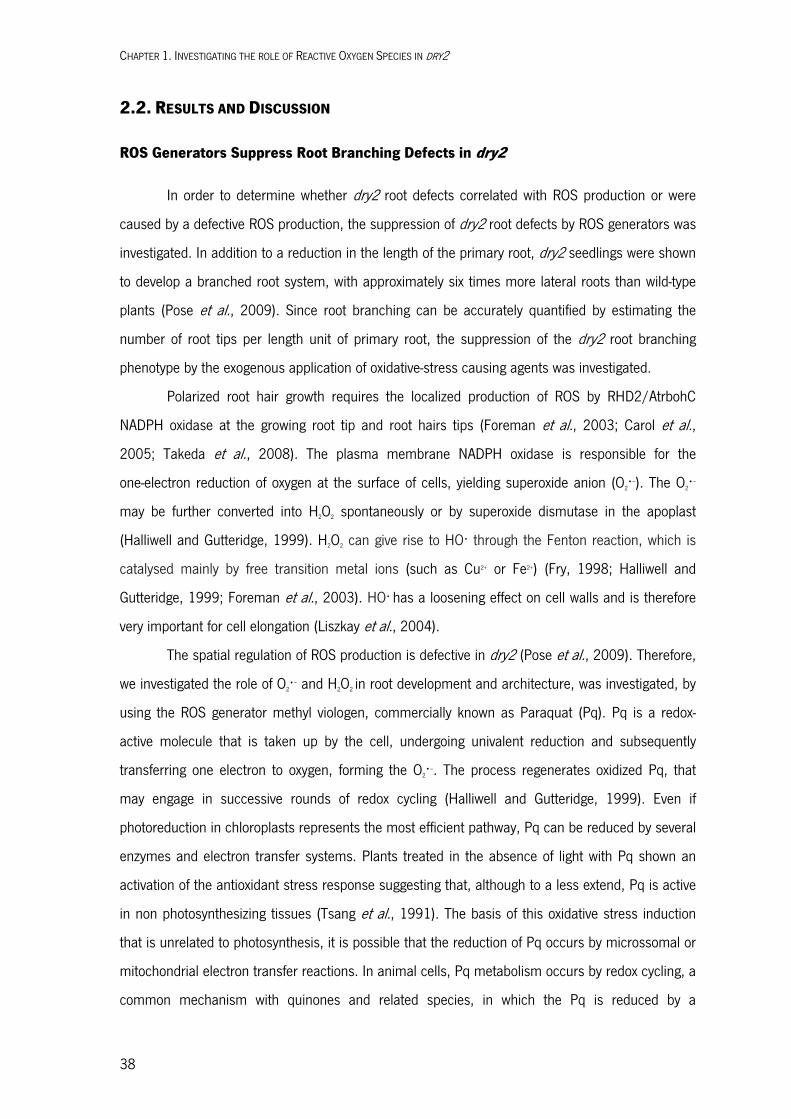
CHAPTER 1. INVESTIGATING THE ROLE OF REACTIVE OXYGEN SPECIES IN DRY2
38
2.2. RESULTS AND DISCUSSION
ROS Generators Suppress Root Branching Defects in dry2
In order to determine whether dry2 root defects correlated with ROS production or were
caused by a defective ROS production, the suppression of dry2 root defects by ROS generators was
investigated. In addition to a reduction in the length of the primary root, dry2 seedlings were shown
to develop a branched root system, with approximately six times more lateral roots than wild-type
plants (Pose et al., 2009). Since root branching can be accurately quantified by estimating the
number of root tips per length unit of primary root, the suppression of the dry2 root branching
phenotype by the exogenous application of oxidative-stress causing agents was investigated.
Polarized root hair growth requires the localized production of ROS by RHD2/AtrbohC
NADPH oxidase at the growing root tip and root hairs tips (Foreman et al., 2003; Carol et al.,
2005; Takeda et al., 2008). The plasma membrane NADPH oxidase is responsible for the
one-electron reduction of oxygen at the surface of cells, yielding superoxide anion (O2•−). The O2
•−
may be further converted into H2O2 spontaneously or by superoxide dismutase in the apoplast
(Halliwell and Gutteridge, 1999). H2O2 can give rise to HO• through the Fenton reaction, which is
catalysed mainly by free transition metal ions (such as Cu2+ or Fe2+) (Fry, 1998; Halliwell and
Gutteridge, 1999; Foreman et al., 2003). HO• has a loosening effect on cell walls and is therefore
very important for cell elongation (Liszkay et al., 2004).
The spatial regulation of ROS production is defective in dry2 (Pose et al., 2009). Therefore,
we investigated the role of O2•− and H2O2 in root development and architecture, was investigated, by
using the ROS generator methyl viologen, commercially known as Paraquat (Pq). Pq is a redox-
active molecule that is taken up by the cell, undergoing univalent reduction and subsequently
transferring one electron to oxygen, forming the O2•−. The process regenerates oxidized Pq, that
may engage in successive rounds of redox cycling (Halliwell and Gutteridge, 1999). Even if
photoreduction in chloroplasts represents the most efficient pathway, Pq can be reduced by several
enzymes and electron transfer systems. Plants treated in the absence of light with Pq shown an
activation of the antioxidant stress response suggesting that, although to a less extend, Pq is active
in non photosynthesizing tissues (Tsang et al., 1991). The basis of this oxidative stress induction
that is unrelated to photosynthesis, it is possible that the reduction of Pq occurs by microssomal or
mitochondrial electron transfer reactions. In animal cells, Pq metabolism occurs by redox cycling, a
common mechanism with quinones and related species, in which the Pq is reduced by a
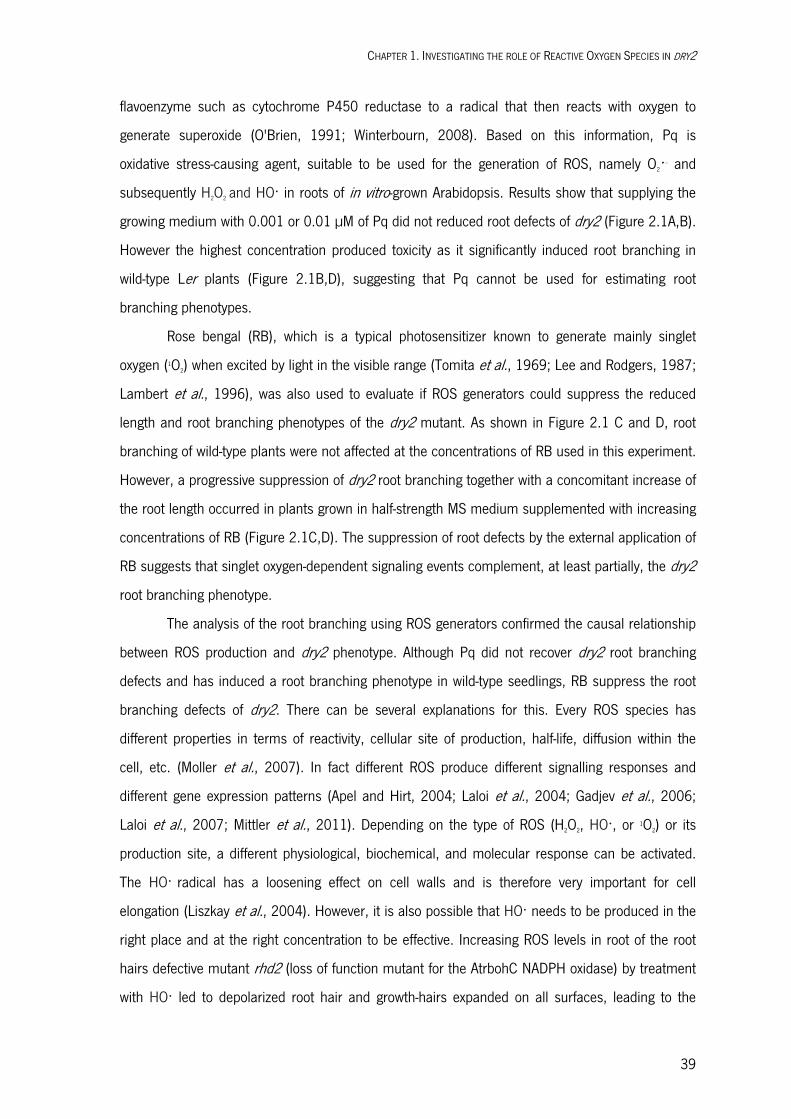
CHAPTER 1. INVESTIGATING THE ROLE OF REACTIVE OXYGEN SPECIES IN DRY2
39
flavoenzyme such as cytochrome P450 reductase to a radical that then reacts with oxygen to
generate superoxide (O'Brien, 1991; Winterbourn, 2008). Based on this information, Pq is
oxidative stress-causing agent, suitable to be used for the generation of ROS, namely O2•− and
subsequently H2O2 and HO• in roots of in vitro-grown Arabidopsis. Results show that supplying the
growing medium with 0.001 or 0.01 μM of Pq did not reduced root defects of dry2 (Figure 2.1A,B).
However the highest concentration produced toxicity as it significantly induced root branching in
wild-type Ler plants (Figure 2.1B,D), suggesting that Pq cannot be used for estimating root
branching phenotypes.
Rose bengal (RB), which is a typical photosensitizer known to generate mainly singlet
oxygen (1O2) when excited by light in the visible range (Tomita et al., 1969; Lee and Rodgers, 1987;
Lambert et al., 1996), was also used to evaluate if ROS generators could suppress the reduced
length and root branching phenotypes of the dry2 mutant. As shown in Figure 2.1 C and D, root
branching of wild-type plants were not affected at the concentrations of RB used in this experiment.
However, a progressive suppression of dry2 root branching together with a concomitant increase of
the root length occurred in plants grown in half-strength MS medium supplemented with increasing
concentrations of RB (Figure 2.1C,D). The suppression of root defects by the external application of
RB suggests that singlet oxygen-dependent signaling events complement, at least partially, the dry2
root branching phenotype.
The analysis of the root branching using ROS generators confirmed the causal relationship
between ROS production and dry2 phenotype. Although Pq did not recover dry2 root branching
defects and has induced a root branching phenotype in wild-type seedlings, RB suppress the root
branching defects of dry2. There can be several explanations for this. Every ROS species has
different properties in terms of reactivity, cellular site of production, half-life, diffusion within the
cell, etc. (Moller et al., 2007). In fact different ROS produce different signalling responses and
different gene expression patterns (Apel and Hirt, 2004; Laloi et al., 2004; Gadjev et al., 2006;
Laloi et al., 2007; Mittler et al., 2011). Depending on the type of ROS (H2O2, HO•, or 1O2) or its
production site, a different physiological, biochemical, and molecular response can be activated.
The HO• radical has a loosening effect on cell walls and is therefore very important for cell
elongation (Liszkay et al., 2004). However, it is also possible that HO• needs to be produced in the
right place and at the right concentration to be effective. Increasing ROS levels in root of the root
hairs defective mutant rhd2 (loss of function mutant for the AtrbohC NADPH oxidase) by treatment
with HO• led to depolarized root hair and growth-hairs expanded on all surfaces, leading to the
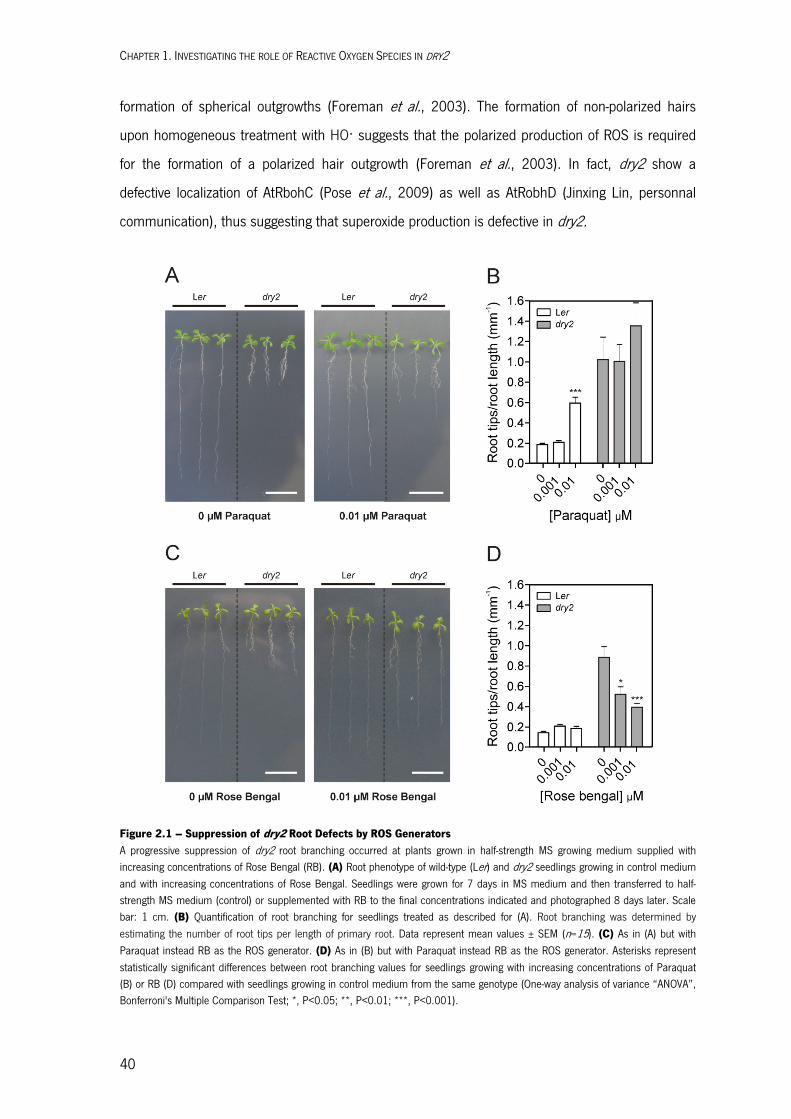
CHAPTER 1. INVESTIGATING THE ROLE OF REACTIVE OXYGEN SPECIES IN DRY2
40
formation of spherical outgrowths (Foreman et al., 2003). The formation of non-polarized hairs
upon homogeneous treatment with HO• suggests that the polarized production of ROS is required
for the formation of a polarized hair outgrowth (Foreman et al., 2003). In fact, dry2 show a
defective localization of AtRbohC (Pose et al., 2009) as well as AtRobhD (Jinxing Lin, personnal
communication), thus suggesting that superoxide production is defective in dry2.
Figure 2.1 – Suppression of dry2 Root Defects by ROS Generators A progressive suppression of dry2 root branching occurred at plants grown in half-strength MS growing medium supplied with increasing concentrations of Rose Bengal (RB). (A) Root phenotype of wild-type (Ler) and dry2 seedlings growing in control medium and with increasing concentrations of Rose Bengal. Seedlings were grown for 7 days in MS medium and then transferred to half-strength MS medium (control) or supplemented with RB to the final concentrations indicated and photographed 8 days later. Scale bar: 1 cm. (B) Quantification of root branching for seedlings treated as described for (A). Root branching was determined by estimating the number of root tips per length of primary root. Data represent mean values ± SEM (n=15). (C) As in (A) but with Paraquat instead RB as the ROS generator. (D) As in (B) but with Paraquat instead RB as the ROS generator. Asterisks represent statistically significant differences between root branching values for seedlings growing with increasing concentrations of Paraquat (B) or RB (D) compared with seedlings growing in control medium from the same genotype (One-way analysis of variance “ANOVA”, Bonferroni's Multiple Comparison Test; *, P<0.05; **, P<0.01; ***, P<0.001).
CHAPTER 1. INVESTIGATING THE ROLE OF REACTIVE OXYGEN SPECIES IN DRY2
41
In animals, 1O2 production leads to the activation of distinct signalling pathways (Robson
and Vanlerberghe, 2002; Klotz et al., 2003), some of which are selectively activated by 1O2 but not
by superoxide (Godar, 1999) or H2O2 (Zhuang et al., 2000). In plants, experimental strategies have
been described that allow the analysis of 1O2 biological activity. In the conditional fluorescent (flu)
mutant of Arabidopsis, 1O2 is selectively produced within the plastid compartment whenever the
mutant plants are returned to the light after a short period in the dark (op den Camp et al., 2003).
In the flu mutant, after the release of 1O2, drastic changes in nuclear gene expression occur that
affect approximately 5% of the total genome of Arabidopsis thaliana. Several of these genes
respond selectively to the release of 1O2 and are not affected during a treatment by Pq. Therefore, it
is possible that dry2 shows defective singlet oxygen production and hence a 1O2-dependent
signalling events.
Suppressors Recover Wild-type ROS Production
In the present study it was investigated the defective ROS production in dry2 mutant in the
Ler ecotype, dry2 suppressors dry2/sud9 and dry2/sud22 carrying second-site mutations in the
dry2 background and an introgression line with dry2 mutation in a Col ecotype (dry2 Col). Although
at an early development stage dry2/sud9 and dry2/sud22 show a slight delay in development
(Figure 2.2A), adult dry2/sud9 and dry2/sud22 shoots reach similar adult size than wild-type
plants. The introgression line dry2 Col shows similar developmental defects than the dry2 mutant in
roots and shoots (Figure 2.2) and will be detailed in next chapter of the present thesis.
A previous study shows that dry2 is defective in H2O2 production in leafs, based on based
on 3,3-diaminobenzidine (DAB) staining (Pose et al., 2009), most likely through the defective
activity of NADPH oxidases highly expressed in leaves such as RbohD, since O2•− produced by a
NADPH oxidases is further converted into H2O2 spontaneously or by the action of superoxide
dismutases (Halliwell and Gutteridge, 1999). However, since O2•− is the direct product of NADPH
oxidases, in situ superoxide production was analyzed using the nitroblue tetrazolium (NBT) staining
method (Jabs et al., 1996). In the presence of O2•−, NBT is reduced and produce a blue formazan
deposit (Fryer et al., 2002). Three-week old leaves of dry2 Col, similar to dry2 leaves, did not
accumulate O2•− at normal grown conditions. However, dry2 plants are still able to produce
superoxide in response to physical damage. When entire three week-old plants were harvested and
stained with NBT for in situ O2•− detection, no NBT specific coloration was observed. However, for
dry2 leaves that were cut prior to NBT staining, O2•− is produced in the local of physical damage

CHAPTER 1. INVESTIGATING THE ROLE OF REACTIVE OXYGEN SPECIES IN DRY2
42
(Figure 2.2B). Plants has the ability to recognise wounding damage (Vickers et al., 2009) and
NADPH oxidases are involved in wounding responses in tomato (Sagi et al., 2004). Also, AtRbohD
is required for rapid wound-induced systemic ROS generation mediating the systemic acclimation
to several abiotic stresses (Miller et al., 2009).
In situ analysis of leaf O2•− by NBT staining confirm that dry2 is defective in the production
of NADPH oxidases-derived ROS. Therefore, it is likely that in addition to root and root hairs
polarised growth, anisotropic growth of leaves also require ROS production regulated by
DRY2/SQE1-5. It is expected that plants with compromised ability to produce ROS are also
impaired in their responsiveness to leaf damage by wounding. Interestingly, results show that dry2
produce O2•− in response to physical damage. This suggests that this O2
•− is produced by a different
source other than NADPH oxidase or that the regulation of NADPH oxidases in response to this
damage-induced ROS is different, possible thought a mechanism involving jasmonates (JAs). Plant
JAs include jasmonic acid, methylJA, their isomers, biosynthetic precursors, and several derivatives
including jasmonoyl-amino acid (Liechti and Farmer, 2002) that are known to regulate plant
responses to a variety of abiotic and biotic stress factors, such as wounding (Wasternack, 2007).
JAs are known to induce ROS production when applied exogenously (Zhang and Xing, 2008), and
when produced de novo in response to leaf wounding (Orozco-Cardenas and Ryan, 1999; Soares et
al., 2009). Thus, ROS production and containment may be essential components for wound
responses (Soares et al., 2009), and jasmonates (JAs) likely play a role in regulating the ROS
production in wounded plant tissues.
To determine whether the recovery of dry2 developmental phenotypes was caused by a
defective ROS production, the accumulation of superoxide was analyzed in two different dry2
phenotypes suppressors (dry2/sud9 and dry2/sud22). These two dry2 suppressors containing
second-site mutations recovered most of the development defects of dry2. As shown in Figure
2.2B, the superoxide levels estimated by NBT staining in leaves of dry2 sud1-9 and dry2 sud1-22,
are similar to the wild-type, showing that suppression of dry2 phenotype by second-site mutations
occur with a concomitant recovery in O2•− production. Additional evidence that defective ROS
production is a direct consequence of dry2/sqe1-5 mutation is provided by the lack of superoxide
production in dry2 Col during leaf development (Figure 2.2B).

CHAPTER 1. INVESTIGATING THE ROLE OF REACTIVE OXYGEN SPECIES IN DRY2
43
Figure 2.2 – In Situ Detection of Superoxide (O2•−)
(A) Shoot morphology of three week-old Arabidopsis plants used for NBT staining in (B). Scale bar: 1 cm. (B) NBT staining for in situ superoxide ion presence. Samples shown are representative of three independent experiments (three plants per experiment). The entire three week-old plants represented in (A) were harvested and stained immediately during 1 hour. Additionally for dry2, four leafs per experiment were cut prior to NBT staining (representative leaf is boxed inside dry2 figure). Scale bar: 2 cm.
Imaging Intracellular Hydrogen Peroxide Production using HyPer
The analysis of root branching using ROS generators confirmed the causal relationship
between ROS production and dry2 phenotypic defects. Additionally, the shoot recovery of the
suppressors also correlates with the reestablishment of O2•− production to wild-type levels. Taking
together, this results support that defective production of NADPH oxidases-derived ROS in dry2,
most likely through the defective activity of NADPH RbohC in root and NADPH RbohD in shoots, is
responsible for the dry2 developmental defects. Thus, to further investigate the role of H2O2 in living
plant cells, more comprehensive analyses of H2O2 metabolism is needed. Several approaches have
been used to estimate H2O2 production in vitro (Palmer and Dittmer, 2010). The in situ detection of
O2•− and H2O2 by NBT and DAB respectively are just qualitative approaches to estimate the
accumulation of ROS. These in situ staining techniques cannot be easily used to estimate ROS
production in vivo, since the staining depend on how efficiently the chemicals penetrate into the
tissues and additional problem related with diffusion of the stain within tissues should be
considered. In order to get a deeper understanding of ROS homeostasis in plants, an adequate
method is required for the detection and quantification of these molecules in tissues and
particularly inside living cells. Recently, a newly developed molecular fluorescent indicator of
intracellular H2O2 levels, named HyPer, is available (Belousov et al., 2006). HyPer is a genetically
encoded ratiometric sensor that is highly selective for H2O2 over other ROS. HyPer consists of the
CHAPTER 1. INVESTIGATING THE ROLE OF REACTIVE OXYGEN SPECIES IN DRY2
44
bacterial H2O2-sensitive transcription factor OxyR fused to a circularly permuted yellow fluorescent
protein (YFP). Cysteine oxidation of the OxyR part induces a conformational change that increases
emission excited at 500nm (YFP500) and decreases emission excited at 420nm (YFP420). This change
is rapidly reversible within the reducing cytoplasmic environment, allowing dynamic monitoring of
intracellular H2O2 concentration. HyPer has been proved to be an effective tool in the observation of
H2O2 concentration changes in HeLa cells and zebrafish (Belousov et al., 2006; Niethammer et al.,
2009). Recently, it was demonstrated that the HyPer protein can be targeted to different
subcellular compartments of plant cells, such as the cytoplasm and peroxisomes and specifically
sense H2O2 (Costa et al., 2010).
To investigate H2O2 spatiotemporal distribution in leaving plant cells, the dry2 and it
suppressors discussed in the present study are presented as a good plant model, because of dry2
lack of H2O2 accumulation during development that is rescue with by the suppressor mutations.
Thus, stable transgenic Arabidopsis lines constitutively expressing HyPer within the cytoplasm, was
generated first Col and Ler background to subsequently generate by genetic crosses, dry2 and
suppressors line expressing the HyPer protein. The Gateway® HyPer-As entry clone is an Evrogen
commercially available vector, containing a HyPer gene variant with codon usage optimized for high
expression in Arabidopsis and Saccharomyces. The HyPer gene variant HyPer-As was cloned into a
pMDC32 vector containing a dual CaMV35S promoter to drive the constitutive ectopic gene
expression in transgenic plant cells. Stable transgenic Arabidopsis lines were transformed with the
construct to generate a constitutively expressing HyPer within the cytoplasm. Arabidopsis
independent transgenic lines were generated in Col and Ler background and homozygous lines
(10 Hm Col-0 and 4 Hm Ler lines) were isolated after three generations. These lines will be
employed for imaging experiments and a selected line stably expressing the HyPer-As sensor will
be employed for crossing experiments with dry2 and suppressor mutants. Given the NBT staining
phenotype of dry2, the dry2 HYPER-AS double mutant will allow a more comprehensive and
sensitive approach to elucidate the mechanism of ROS distribution affected in the dry2 mutant,
that is restored into to the dry2 suppressors.

CHAPTER 1. INVESTIGATING THE ROLE OF REACTIVE OXYGEN SPECIES IN DRY2
45
2.3. MATERIALS AND METHODS
Plant Material
The Arabidopsis thaliana ecotypes Landsberg erecta (Ler) and Columbia-0 (Col-0) were used as wild-type controls in the present study. Mutants used in this study have been previously described: dry2 (Pose et al., 2009); dry2/sud9 and dry2/sud22 (Pose, 2008). The dry2 Col-0 introgression line was obtained
by crossing dry2 into the Col-0 ecotype for seven generations. For more details concerning the development of the dry2 Col-0 introgression line see Material and Methods – Arabidopsis Cross-fertilization section in
Chapter 3.
Plant Manipulation and Growth Conditions
Arabidopsis standard handling procedures and conditions were employed to promote seed germination and growth. Before growing, seeds were cold treated for three days at 4ºC. Seeds surface sterilization was performed in a horizontal laminar flow chamber (BBH4 BRAUN Horizontal). Seeds were sequentially immersed in 70% (v/v) ethanol for 5 min and 20% (v/v) commercial bleach for 10 min before washing five times with sterile ultra-pure water. Seeds were ressuspended in sterile 0.25% (w/v) agarose. After being surface sterilized, seeds were sowed onto MS agar plates and grown vertically in a culture chamber at 23°C, under cool white light (photon flux density (PFD) of 60–100 μmol photon m-2 s-1) with a long-day photoperiod (16-h light/8-h dark cycle). When required, seedlings were transferred to soil after seven days of in vitro growth and watered every two days. Plants were grown in a mixture of organic substrate and vermiculite (4:1 v/v) under controlled conditions: 21-22ºC, 16-h light/8-h dark cycle with a PFD of ~150 mol photon m-2 s-1. Seeds were collected at the end of the life cycle (approximately eight
weeks), using an appropriate sieve with metallic mesh.
Root Branching Measurements
For root branching measurements, 7-day-old seedlings grown on phytagel-solidified MS medium were transferred to half-strength phytagel-solidified MS medium deprived of supplementation (control) or
supplemented with Rose Bengal (Sigma) or Paraquat (methyl viologen; Sigma) to the final concentrations of 0.001 and 0.01 μM. Root branching was determined by estimating the number of root tips per length of primary root. Results were statistically analyzed using One-way analysis of variance “ANOVA”, with Bonferroni's Multiple Comparison Test.
Detection of Reactive Oxygen Species
Plant infiltration with Nitroblue Tetrazolium (NBT) (Sigma) allowed the in situ detection of superoxide ion in leaves. The whole plant was treated with NBT staining method as described by Jabs et al. (1996), with the following modifications. Five-week old entire plants, or cut leafs, were harvested and vacuum-infiltrated (three cycles of 5 min) with 0.5 mg mL-1 NBT in 10 mM sodium phosphate buffer,
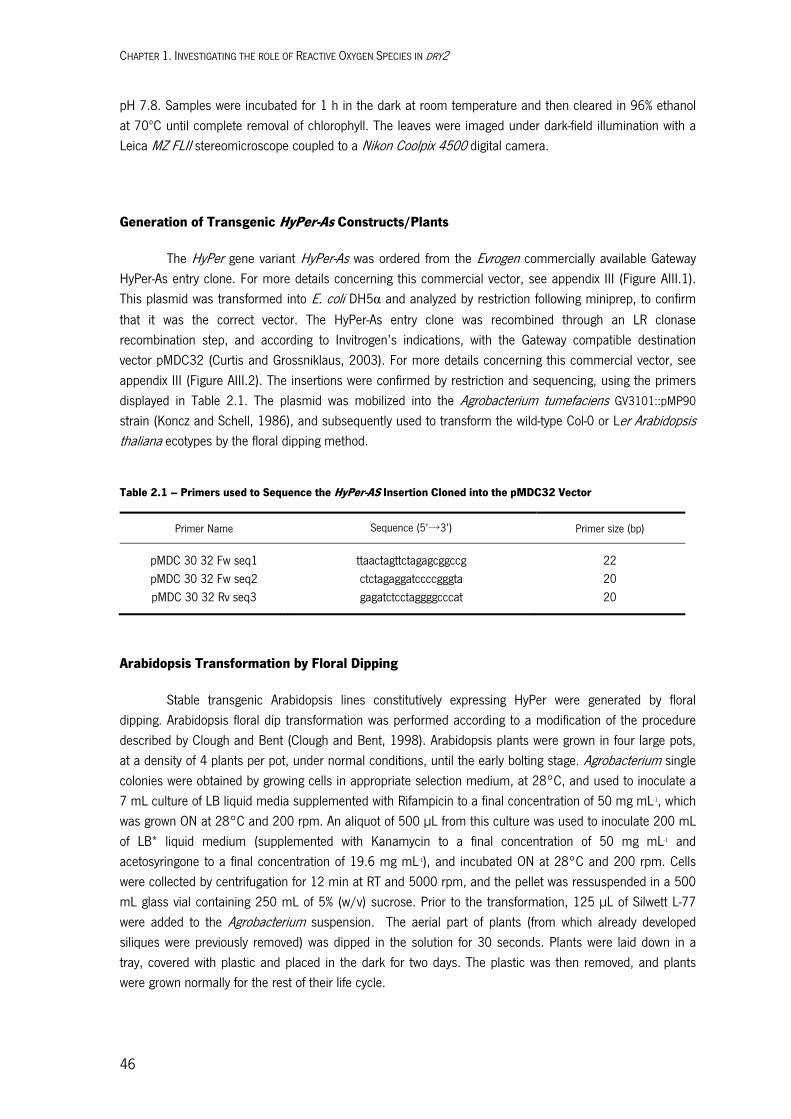
CHAPTER 1. INVESTIGATING THE ROLE OF REACTIVE OXYGEN SPECIES IN DRY2
46
pH 7.8. Samples were incubated for 1 h in the dark at room temperature and then cleared in 96% ethanol at 70ºC until complete removal of chlorophyll. The leaves were imaged under dark-field illumination with a Leica MZ FLII stereomicroscope coupled to a Nikon Coolpix 4500 digital camera.
Generation of Transgenic HyPer-As Constructs/Plants
The HyPer gene variant HyPer-As was ordered from the Evrogen commercially available Gateway HyPer-As entry clone. For more details concerning this commercial vector, see appendix III (Figure AIII.1). This plasmid was transformed into E. coli DH5α and analyzed by restriction following miniprep, to confirm
that it was the correct vector. The HyPer-As entry clone was recombined through an LR clonase recombination step, and according to Invitrogen’s indications, with the Gateway compatible destination vector pMDC32 (Curtis and Grossniklaus, 2003). For more details concerning this commercial vector, see appendix III (Figure AIII.2). The insertions were confirmed by restriction and sequencing, using the primers displayed in Table 2.1. The plasmid was mobilized into the Agrobacterium tumefaciens GV3101::pMP90
strain (Koncz and Schell, 1986), and subsequently used to transform the wild-type Col-0 or Ler Arabidopsis thaliana ecotypes by the floral dipping method.
Table 2.1 – Primers used to Sequence the HyPer-AS Insertion Cloned into the pMDC32 Vector
Primer Name Sequence (5’→3’) Primer size (bp)
pMDC 30 32 Fw seq1 ttaactagttctagagcggccg 22 pMDC 30 32 Fw seq2 ctctagaggatccccgggta 20 pMDC 30 32 Rv seq3 gagatctcctaggggcccat 20
Arabidopsis Transformation by Floral Dipping
Stable transgenic Arabidopsis lines constitutively expressing HyPer were generated by floral dipping. Arabidopsis floral dip transformation was performed according to a modification of the procedure described by Clough and Bent (Clough and Bent, 1998). Arabidopsis plants were grown in four large pots, at a density of 4 plants per pot, under normal conditions, until the early bolting stage. Agrobacterium single colonies were obtained by growing cells in appropriate selection medium, at 28°C, and used to inoculate a 7 mL culture of LB liquid media supplemented with Rifampicin to a final concentration of 50 mg mL-1, which was grown ON at 28°C and 200 rpm. An aliquot of 500 μL from this culture was used to inoculate 200 mL of LB* liquid medium (supplemented with Kanamycin to a final concentration of 50 mg mL-1 and acetosyringone to a final concentration of 19.6 mg mL-1), and incubated ON at 28°C and 200 rpm. Cells were collected by centrifugation for 12 min at RT and 5000 rpm, and the pellet was ressuspended in a 500 mL glass vial containing 250 mL of 5% (w/v) sucrose. Prior to the transformation, 125 μL of Silwett L-77 were added to the Agrobacterium suspension. The aerial part of plants (from which already developed siliques were previously removed) was dipped in the solution for 30 seconds. Plants were laid down in a tray, covered with plastic and placed in the dark for two days. The plastic was then removed, and plants were grown normally for the rest of their life cycle.

CHAPTER 1. INVESTIGATING THE ROLE OF REACTIVE OXYGEN SPECIES IN DRY2
47
Selection of Arabidopsis Transformants
After transformed plants completed the life cycle, T1 seeds were collected and grown in 0.8% (w/v) agar-solidified MS medium containing hygromycin (40 μg mL-1) and ticarcillin (250 μg mL-1) for transformant selection. Positive control (resistant) seeds were also sowed onto the plate. Positive T1 transformants (similar to control plants) were transferred to soil after 10 days to complete their life cycle. A total of 20-40 T2 seeds per T1 plant were germinated in identical selective medium. Plants presenting a 3:1 (positive:negative) ratio, indicative of only one T-DNA insert, were selected and grown on soil. Seeds were again collected (T3) and germinated in the same conditions to verify if the T2 line was homozygous (1:0 ratio) or heterozygous (3:1 ratio) for the T-DNA insertion. Homozygous plants were selected for further analysis.

Chapter 3
Identification of dry2 Suppressor Mutations
The experimental work presented in the present chapter was performed in collaboration
with Verónica G. Doblas from Instituto de Hortofruticultura Subtropical y Mediterránea,
Universidad de Málaga, Consejo Superior de Investigaciones Científicas, IHSM-UMA-CSIC,
Málaga, Spain; that equal contributed to the data obtained.
CONTENTS
3.1. INTRODUCTION 3.2. RESULTS AND DISCUSSION
Four dry2 Suppressor Mutations are Semi-dominants Map-based Cloning of the sud Mutations Four dry2 Suppressors are Independent sud1 Mutant alleles
3.3. MATERIALS AND METHODS

CHAPTER 3. IDENTIFICATION OF DRY2 SUPPRESSOR MUTATIONS
51
3.1. INTRODUCTION
Reverse genetic approaches tend to rely on prior knowledge that the gene that is being
mutated is involved in a particular process (Azevedo et al., 2011). Meanwhile, in functional
studies based on a forward genetics approaches, a mutant population is screened for a
phenotype-of-interest leading to the identification of important gene(s) involved in the process.
Map-based cloning, also called positional cloning, is the process of identifying the genetic basis of
a mutant phenotype by looking for linkage to markers whose physical location in the genome is
known. In the Map-based cloning process, no prior assumptions are needed in order to identify
genes responsible for a given phenotype. Map-based cloning in Arabidopsis can be divided in
two steps: i) to obtain a raw mapping position, and ii) to perform a fine-scale mapping that
narrows down the region containing the gene-of-interest to a few candidates (Jander et al., 2002).
As a first step in the mapping process, the mutant is crossed with a polymorphic ecotype. F2
seeds are collected from self-pollination of the F1 plants, and usually, a population of around
40-50 plants are grown for a first mapping. As plants are growing, the phenotype of the F2 plants
is determined, and plants are genotyped with molecular markers, spaced roughly apart on the
five chromosomes. Next, it is necessary to analyse a larger F2 population for fine-resolution
mapping. The ultimate goal of fine mapping is to narrow down the region containing the gene of
interest to approximately 100 kb or less. Depending on the interval there are several possibilities
to analyze the final unmapped region, but recently the use of high throughput sequencings is
become the favorite approach due to its speed and reliability.
In a previous work, a drought stress hypersensitive mutant dry2/sqe1-5 affected in the
sterol biosynthetic Squalene Epoxidase 1 (SQE1) gene was identified (Pose et al., 2009). Since
the regulatory mechanisms controlling the sterol biosynthetic pathway in plants are largely
unknown, the hypomorphic dry2/sqe1-5 mutant allele, which is fertile in contrast to the null
sqe1-3 allele, was used to perform a suppressor screening in order to identify second-site
mutations induced by EMS that abrogated the extreme drought hypersensitive phenotype of the
dry2 mutant previously described (Chapter 1). Using this strategy, several mutants (named sud
for suppressors of dry2 defects) that reverted most of the dry2 developmental phenotypes were
isolated. The identification of the mutations causing suppression of dry2 phenotypes, will allow
identifying previously uncharacterized regulatory elements able to restore the developmental
defects observed in the dry2 mutant.
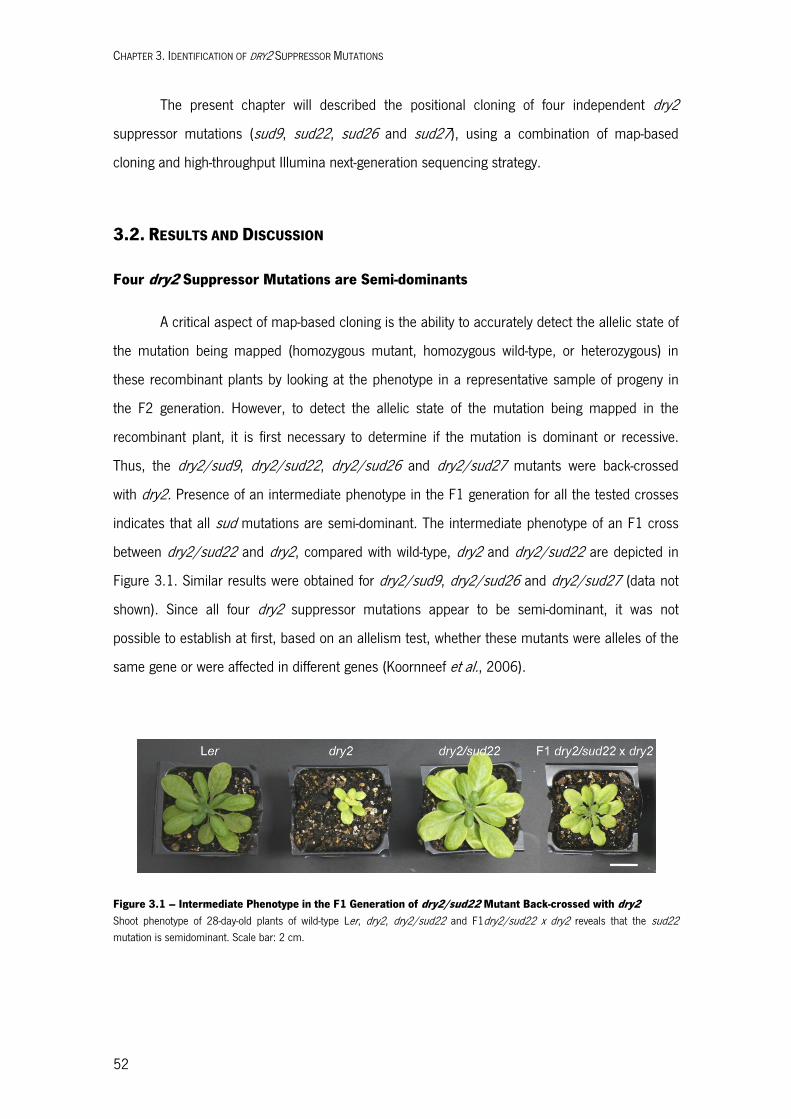
CHAPTER 3. IDENTIFICATION OF DRY2 SUPPRESSOR MUTATIONS
52
The present chapter will described the positional cloning of four independent dry2
suppressor mutations (sud9, sud22, sud26 and sud27), using a combination of map-based
cloning and high-throughput Illumina next-generation sequencing strategy.
3.2. RESULTS AND DISCUSSION
Four dry2 Suppressor Mutations are Semi-dominants
A critical aspect of map-based cloning is the ability to accurately detect the allelic state of
the mutation being mapped (homozygous mutant, homozygous wild-type, or heterozygous) in
these recombinant plants by looking at the phenotype in a representative sample of progeny in
the F2 generation. However, to detect the allelic state of the mutation being mapped in the
recombinant plant, it is first necessary to determine if the mutation is dominant or recessive.
Thus, the dry2/sud9, dry2/sud22, dry2/sud26 and dry2/sud27 mutants were back-crossed
with dry2. Presence of an intermediate phenotype in the F1 generation for all the tested crosses
indicates that all sud mutations are semi-dominant. The intermediate phenotype of an F1 cross
between dry2/sud22 and dry2, compared with wild-type, dry2 and dry2/sud22 are depicted in
Figure 3.1. Similar results were obtained for dry2/sud9, dry2/sud26 and dry2/sud27 (data not
shown). Since all four dry2 suppressor mutations appear to be semi-dominant, it was not
possible to establish at first, based on an allelism test, whether these mutants were alleles of the
same gene or were affected in different genes (Koornneef et al., 2006).
Figure 3.1 – Intermediate Phenotype in the F1 Generation of dry2/sud22 Mutant Back-crossed with dry2 Shoot phenotype of 28-day-old plants of wild-type Ler, dry2, dry2/sud22 and F1dry2/sud22 x dry2 reveals that the sud22 mutation is semidominant. Scale bar: 2 cm.
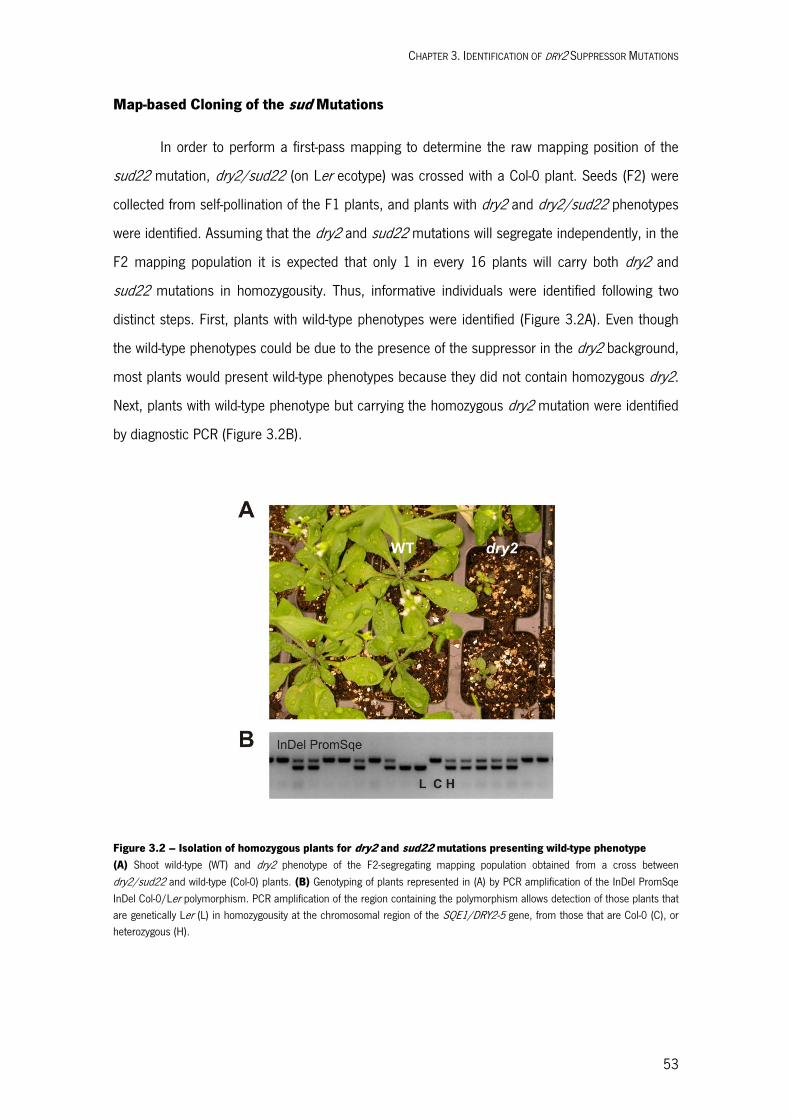
CHAPTER 3. IDENTIFICATION OF DRY2 SUPPRESSOR MUTATIONS
53
Map-based Cloning of the sud Mutations
In order to perform a first-pass mapping to determine the raw mapping position of the
sud22 mutation, dry2/sud22 (on Ler ecotype) was crossed with a Col-0 plant. Seeds (F2) were
collected from self-pollination of the F1 plants, and plants with dry2 and dry2/sud22 phenotypes
were identified. Assuming that the dry2 and sud22 mutations will segregate independently, in the
F2 mapping population it is expected that only 1 in every 16 plants will carry both dry2 and
sud22 mutations in homozygousity. Thus, informative individuals were identified following two
distinct steps. First, plants with wild-type phenotypes were identified (Figure 3.2A). Even though
the wild-type phenotypes could be due to the presence of the suppressor in the dry2 background,
most plants would present wild-type phenotypes because they did not contain homozygous dry2.
Next, plants with wild-type phenotype but carrying the homozygous dry2 mutation were identified
by diagnostic PCR (Figure 3.2B).
Figure 3.2 – Isolation of homozygous plants for dry2 and sud22 mutations presenting wild-type phenotype (A) Shoot wild-type (WT) and dry2 phenotype of the F2-segregating mapping population obtained from a cross between dry2/sud22 and wild-type (Col-0) plants. (B) Genotyping of plants represented in (A) by PCR amplification of the InDel PromSqe InDel Col-0/Ler polymorphism. PCR amplification of the region containing the polymorphism allows detection of those plants that are genetically Ler (L) in homozygousity at the chromosomal region of the SQE1/DRY2-5 gene, from those that are Col-0 (C), or heterozygous (H).

CHAPTER 3. IDENTIFICATION OF DRY2 SUPPRESSOR MUTATIONS
54
A total of 1412 plants were analysed to obtain a sud22 mapping population. From these
plants, only 66 plants were homozygous for dry2 based on PCR analysis and sud22 because
they presented wild-type phenotypes. These 66 plants of the mapping population were then used
to determine a rough map position of sud22 by analysing genetic markers in the five
chromosomes of Arabidopsis (Figure 3.3 and Appendix II). All information regarding the
molecular markers used in the map-based cloning was obtained from TAIR
(http://www.arabidopsis.org/). A genetic marker not linked to the mutation has a frequency of
25% Col homozygous, 50% heterozygous Col/Ler and 25% Ler homozygous (1 Col: 2 Col/Ler: 1
Ler) while a genetic marker linked to sud22 will present higher a frequency of Ler. Table 3.1
shows the analysis of molecular markers in the mapping population. As expected, the majority of
the markers were not linked to the mutation (1Col: 2Col/Ler: 1Ler). In addition, the expected
linkage to Ler genotype was observed to dry2. Importantly, the genetic markers F13C5, F11C18,
F26P21 and F8D20 of chromosome 4 were enriched in Ler, indicating an obvious linkage.
By analysing the recombinant plants for the genetic markers F26P21 and F8D20 it is was
possible to locate the sud22 mutation within the 1,01 Mb region delimited by these two genetic
markers (Figure 3.3).
Figure 3.3 –Diagram of the genetic markers positions used to determine the rough location of the sud22 mutation The region linked to the dry2 mutation is represented in red and the region between F13C5 and F8D20 markers that encompasses the sud22 mutation, is represented in blue.
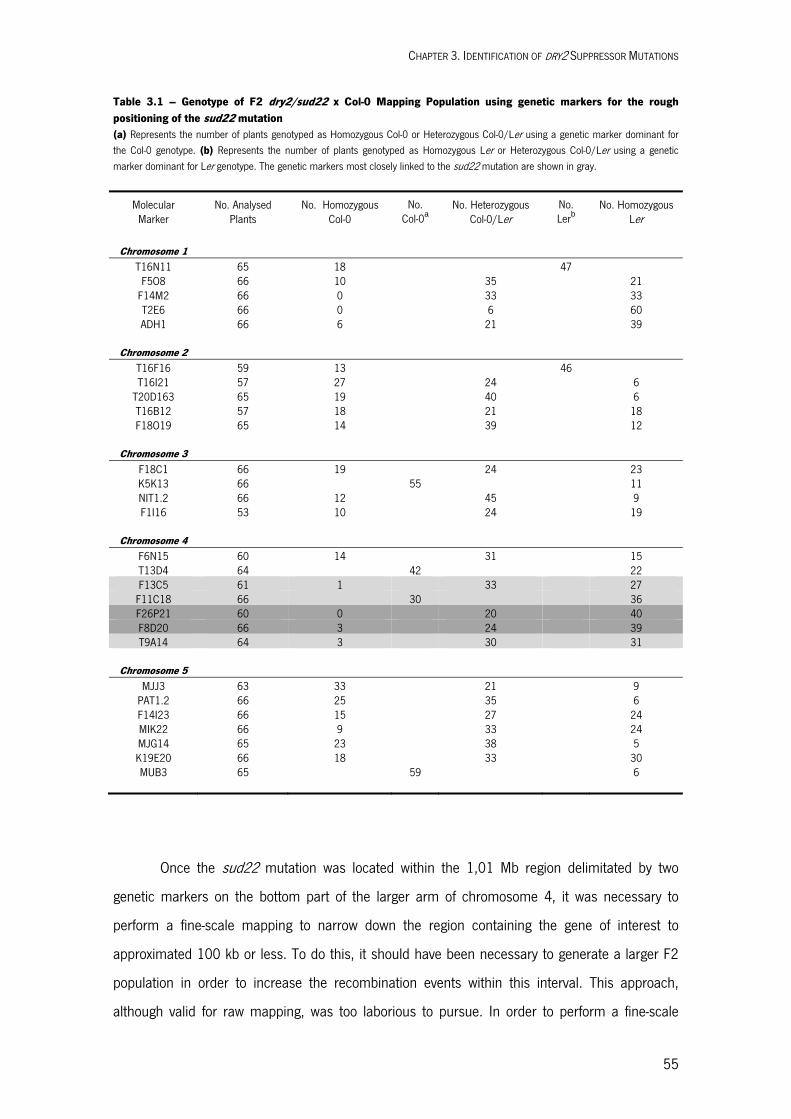
CHAPTER 3. IDENTIFICATION OF DRY2 SUPPRESSOR MUTATIONS
55
Table 3.1 – Genotype of F2 dry2/sud22 x Col-0 Mapping Population using genetic markers for the rough positioning of the sud22 mutation (a) Represents the number of plants genotyped as Homozygous Col-0 or Heterozygous Col-0/Ler using a genetic marker dominant for the Col-0 genotype. (b) Represents the number of plants genotyped as Homozygous Ler or Heterozygous Col-0/Ler using a genetic marker dominant for Ler genotype. The genetic markers most closely linked to the sud22 mutation are shown in gray.
Molecular Marker
No. Analysed Plants
No. Homozygous Col-0
No. Col-0a
No. Heterozygous Col-0/Ler
No. Lerb
No. Homozygous Ler
Chromosome 1
T16N11 65 18 47 F5O8 66 10 35 21
F14M2 66 0 33 33 T2E6 66 0 6 60 ADH1 66 6 21 39
Chromosome 2
T16F16 59 13 46 T16I21 57 27 24 6
T20D163 65 19 40 6 T16B12 57 18 21 18 F18O19 65 14 39 12
Chromosome 3
F18C1 66 19 24 23 K5K13 66 55 11 NIT1.2 66 12 45 9 F1I16 53 10 24 19
Chromosome 4
F6N15 60 14 31 15 T13D4 64 42 22 F13C5 61 1 33 27 F11C18 66 30 36 F26P21 60 0 20 40 F8D20 66 3 24 39 T9A14 64 3 30 31
Chromosome 5
MJJ3 63 33 21 9 PAT1.2 66 25 35 6 F14I23 66 15 27 24 MIK22 66 9 33 24 MJG14 65 23 38 5 K19E20 66 18 33 30 MUB3 65 59 6
Once the sud22 mutation was located within the 1,01 Mb region delimitated by two
genetic markers on the bottom part of the larger arm of chromosome 4, it was necessary to
perform a fine-scale mapping to narrow down the region containing the gene of interest to
approximated 100 kb or less. To do this, it should have been necessary to generate a larger F2
population in order to increase the recombination events within this interval. This approach,
although valid for raw mapping, was too laborious to pursue. In order to perform a fine-scale

CHAPTER 3. IDENTIFICATION OF DRY2 SUPPRESSOR MUTATIONS
56
mapping of sud22 mutation, a line that contained the introgressed dry2 mutation in Col-0
background was generated in parallel to the raw mapping. To achieve this, the dry2Ler mutant
allele was introgressed into wild-type Col-0 over seven generations to create dry2Col-0.
The dry2Col-0 line was analyzed using genetic markers to confirm that most of the genome was
Col-0 with the exception of the region flanking DRY2 (Table 3.2). The dry2Col-0 line was
phenotypically identical to the original dry2 in shoot and root growth (Figure 3.4) and also
accumulated undetectable levels of ROS (Chapter 2, Figure 2.2). This line was used to generate
a mapping population for dry2/sud22 and determine a fine position for the mutation.
Table 3.2 –dry2Col-0 Genotype for the Genetic Markers in the 5 Arabidopsis Chromosomes The genetic markers linked to SQE1/DRY2 are highlighted
Marker Genotype
Chromosome 1
T16N11 Col-0
F5O8 Col-0
F14M2 Col-0/Ler
T2E6 Ler
ADH1 Ler Chromosome 2
T16F16 Col-0
T20D163 Col-0
F18O19 Col-0 Chromosome 3
F18C1 Col-0
K5K13 Col-0
NIT1.2 Col-0 Chromosome 4
F6N15 Col-0
T13D4 Col-0
F13C5 Col-0
F11C18 Col-0
F26P21 Col-0
F8D20 Col-0
T9A14 Col-0 Chromosome 5
PAT1.2 Col-0
MJG14 Col-0
MUB3 Col-0
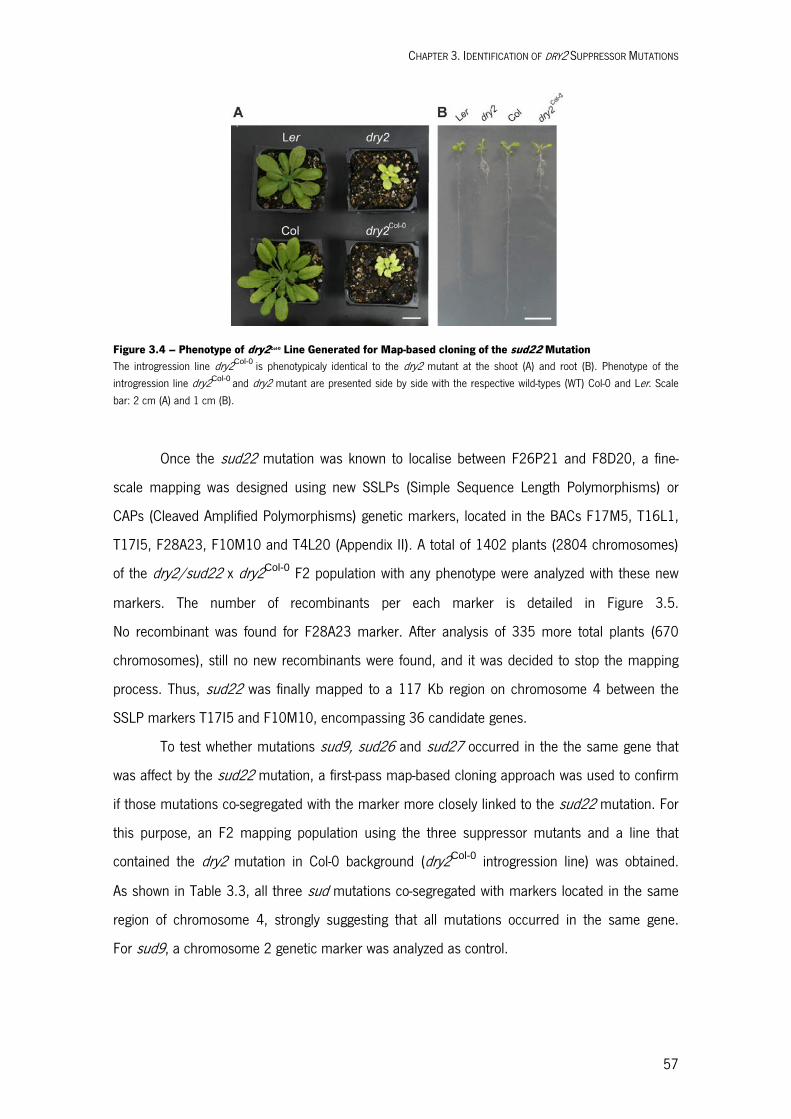
CHAPTER 3. IDENTIFICATION OF DRY2 SUPPRESSOR MUTATIONS
57
Figure 3.4 – Phenotype of dry2Col-0 Line Generated for Map-based cloning of the sud22 Mutation The introgression line dry2Col-0
is phenotypicaly identical to the dry2 mutant at the shoot (A) and root (B). Phenotype of the
introgression line dry2Col-0 and dry2 mutant are presented side by side with the respective wild-types (WT) Col-0 and Ler. Scale
bar: 2 cm (A) and 1 cm (B).
Once the sud22 mutation was known to localise between F26P21 and F8D20, a fine-
scale mapping was designed using new SSLPs (Simple Sequence Length Polymorphisms) or
CAPs (Cleaved Amplified Polymorphisms) genetic markers, located in the BACs F17M5, T16L1,
T17I5, F28A23, F10M10 and T4L20 (Appendix II). A total of 1402 plants (2804 chromosomes)
of the dry2/sud22 x dry2Col-0 F2 population with any phenotype were analyzed with these new
markers. The number of recombinants per each marker is detailed in Figure 3.5.
No recombinant was found for F28A23 marker. After analysis of 335 more total plants (670
chromosomes), still no new recombinants were found, and it was decided to stop the mapping
process. Thus, sud22 was finally mapped to a 117 Kb region on chromosome 4 between the
SSLP markers T17I5 and F10M10, encompassing 36 candidate genes.
To test whether mutations sud9, sud26 and sud27 occurred in the the same gene that
was affect by the sud22 mutation, a first-pass map-based cloning approach was used to confirm
if those mutations co-segregated with the marker more closely linked to the sud22 mutation. For
this purpose, an F2 mapping population using the three suppressor mutants and a line that
contained the dry2 mutation in Col-0 background (dry2Col-0 introgression line) was obtained.
As shown in Table 3.3, all three sud mutations co-segregated with markers located in the same
region of chromosome 4, strongly suggesting that all mutations occurred in the same gene.
For sud9, a chromosome 2 genetic marker was analyzed as control.
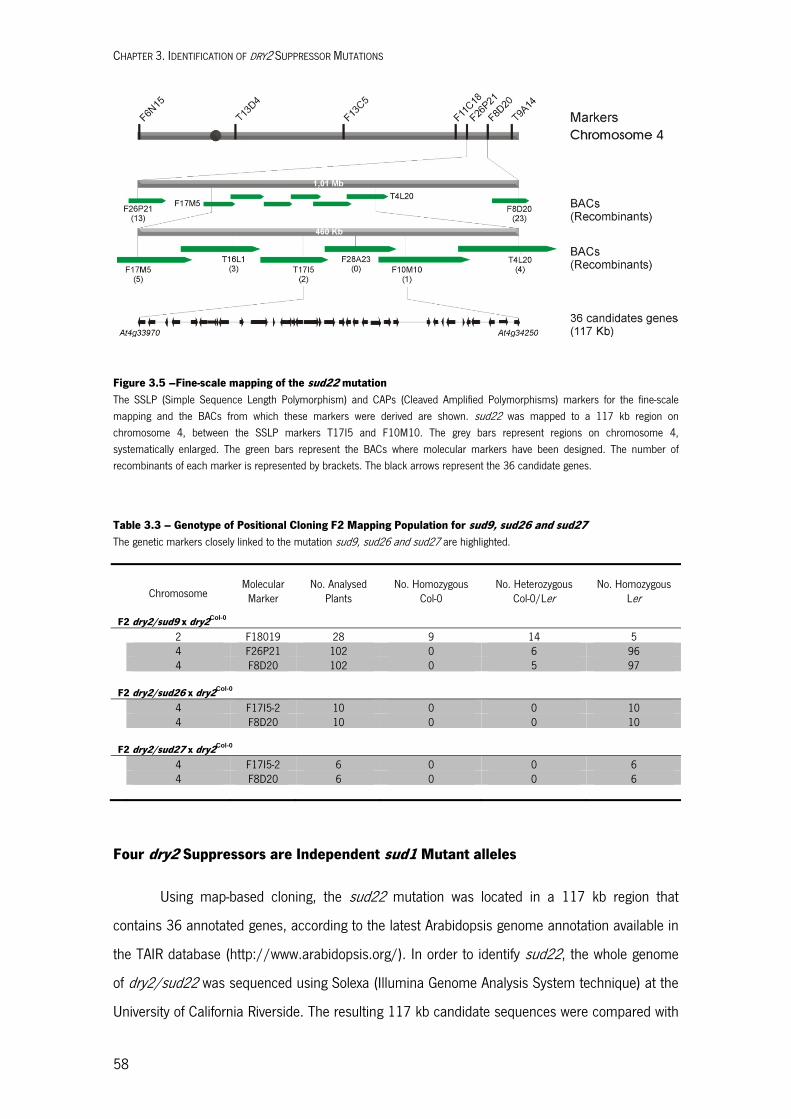
CHAPTER 3. IDENTIFICATION OF DRY2 SUPPRESSOR MUTATIONS
58
Figure 3.5 –Fine-scale mapping of the sud22 mutation The SSLP (Simple Sequence Length Polymorphism) and CAPs (Cleaved Amplified Polymorphisms) markers for the fine-scale mapping and the BACs from which these markers were derived are shown. sud22 was mapped to a 117 kb region on chromosome 4, between the SSLP markers T17I5 and F10M10. The grey bars represent regions on chromosome 4, systematically enlarged. The green bars represent the BACs where molecular markers have been designed. The number of recombinants of each marker is represented by brackets. The black arrows represent the 36 candidate genes.
Table 3.3 – Genotype of Positional Cloning F2 Mapping Population for sud9, sud26 and sud27 The genetic markers closely linked to the mutation sud9, sud26 and sud27 are highlighted.
Chromosome Molecular Marker
No. Analysed Plants
No. Homozygous Col-0
No. Heterozygous Col-0/Ler
No. Homozygous Ler
F2 dry2/sud9 x dry2Col-0 2 F18019 28 9 14 5 4 F26P21 102 0 6 96 4 F8D20 102 0 5 97 F2 dry2/sud26 x dry2Col-0 4 F17I5-2 10 0 0 10 4 F8D20 10 0 0 10 F2 dry2/sud27 x dry2Col-0 4 F17I5-2 6 0 0 6 4 F8D20 6 0 0 6
Four dry2 Suppressors are Independent sud1 Mutant alleles
Using map-based cloning, the sud22 mutation was located in a 117 kb region that
contains 36 annotated genes, according to the latest Arabidopsis genome annotation available in
the TAIR database (http://www.arabidopsis.org/). In order to identify sud22, the whole genome
of dry2/sud22 was sequenced using Solexa (Illumina Genome Analysis System technique) at the
University of California Riverside. The resulting 117 kb candidate sequences were compared with
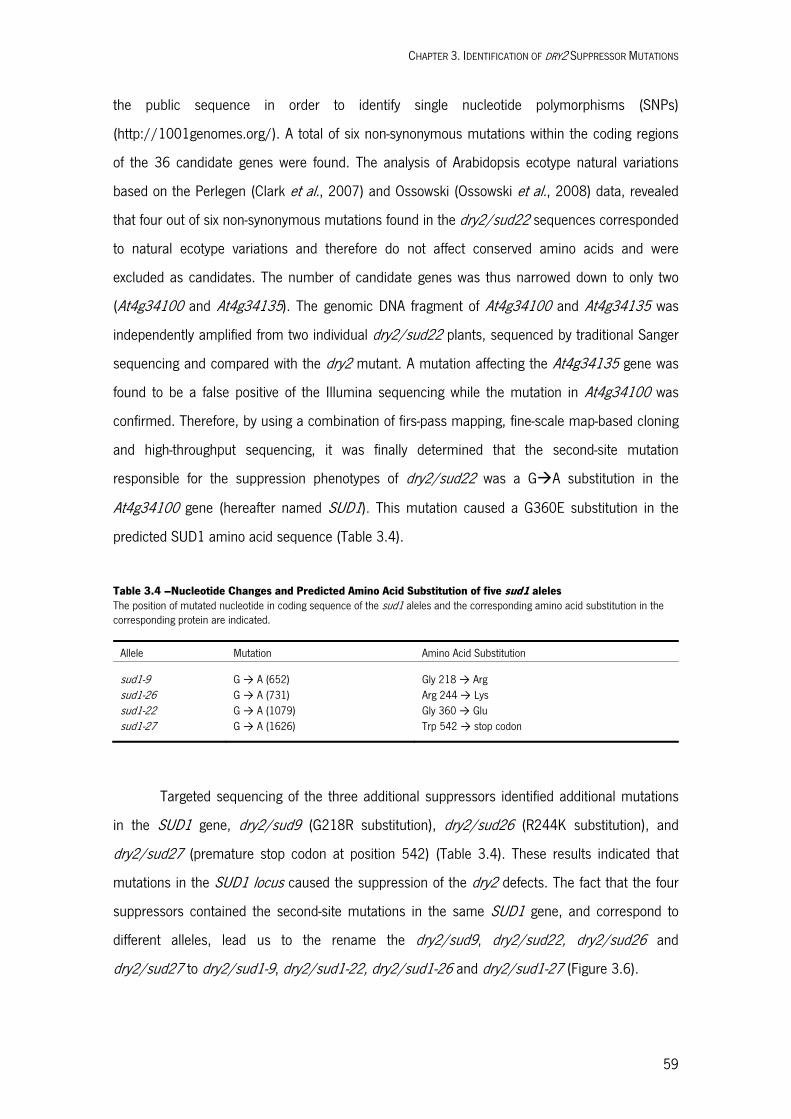
CHAPTER 3. IDENTIFICATION OF DRY2 SUPPRESSOR MUTATIONS
59
the public sequence in order to identify single nucleotide polymorphisms (SNPs)
(http://1001genomes.org/). A total of six non-synonymous mutations within the coding regions
of the 36 candidate genes were found. The analysis of Arabidopsis ecotype natural variations
based on the Perlegen (Clark et al., 2007) and Ossowski (Ossowski et al., 2008) data, revealed
that four out of six non-synonymous mutations found in the dry2/sud22 sequences corresponded
to natural ecotype variations and therefore do not affect conserved amino acids and were
excluded as candidates. The number of candidate genes was thus narrowed down to only two
(At4g34100 and At4g34135). The genomic DNA fragment of At4g34100 and At4g34135 was
independently amplified from two individual dry2/sud22 plants, sequenced by traditional Sanger
sequencing and compared with the dry2 mutant. A mutation affecting the At4g34135 gene was
found to be a false positive of the Illumina sequencing while the mutation in At4g34100 was
confirmed. Therefore, by using a combination of firs-pass mapping, fine-scale map-based cloning
and high-throughput sequencing, it was finally determined that the second-site mutation
responsible for the suppression phenotypes of dry2/sud22 was a GA substitution in the
At4g34100 gene (hereafter named SUD1). This mutation caused a G360E substitution in the
predicted SUD1 amino acid sequence (Table 3.4).
Table 3.4 –Nucleotide Changes and Predicted Amino Acid Substitution of five sud1 aleles The position of mutated nucleotide in coding sequence of the sud1 aleles and the corresponding amino acid substitution in the corresponding protein are indicated.
Allele Mutation Amino Acid Substitution
sud1-9 G → A (652) Gly 218 → Arg sud1-26 G → A (731) Arg 244 → Lys sud1-22 G → A (1079) Gly 360 → Glu sud1-27 G → A (1626) Trp 542 → stop codon
Targeted sequencing of the three additional suppressors identified additional mutations
in the SUD1 gene, dry2/sud9 (G218R substitution), dry2/sud26 (R244K substitution), and
dry2/sud27 (premature stop codon at position 542) (Table 3.4). These results indicated that
mutations in the SUD1 locus caused the suppression of the dry2 defects. The fact that the four
suppressors contained the second-site mutations in the same SUD1 gene, and correspond to
different alleles, lead us to the rename the dry2/sud9, dry2/sud22, dry2/sud26 and
dry2/sud27 to dry2/sud1-9, dry2/sud1-22, dry2/sud1-26 and dry2/sud1-27 (Figure 3.6).
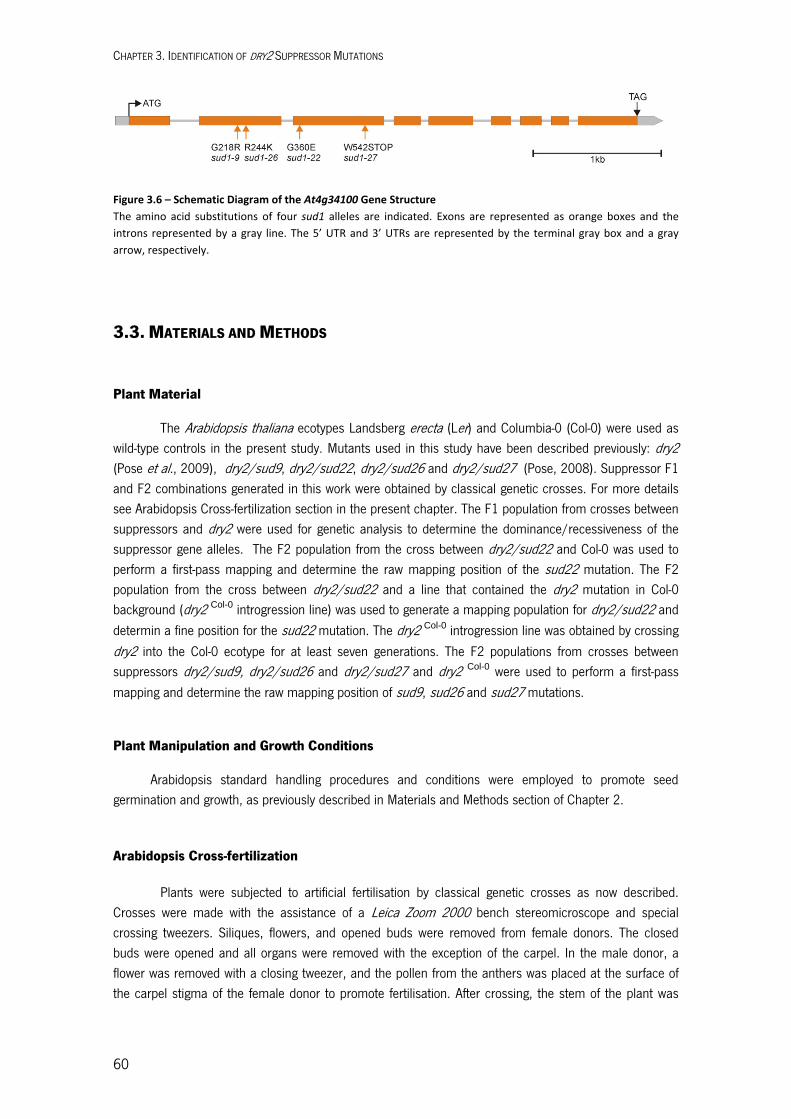
CHAPTER 3. IDENTIFICATION OF DRY2 SUPPRESSOR MUTATIONS
60
Figure 3.6 – Schematic Diagram of the At4g34100 Gene Structure
The amino acid substitutions of four sud1 alleles are indicated. Exons are represented as orange boxes and the
introns represented by a gray line. The 5’ UTR and 3’ UTRs are represented by the terminal gray box and a gray
arrow, respectively.
3.3. MATERIALS AND METHODS
Plant Material
The Arabidopsis thaliana ecotypes Landsberg erecta (Ler) and Columbia-0 (Col-0) were used as wild-type controls in the present study. Mutants used in this study have been described previously: dry2 (Pose et al., 2009), dry2/sud9, dry2/sud22, dry2/sud26 and dry2/sud27 (Pose, 2008). Suppressor F1 and F2 combinations generated in this work were obtained by classical genetic crosses. For more details see Arabidopsis Cross-fertilization section in the present chapter. The F1 population from crosses between suppressors and dry2 were used for genetic analysis to determine the dominance/recessiveness of the suppressor gene alleles. The F2 population from the cross between dry2/sud22 and Col-0 was used to perform a first-pass mapping and determine the raw mapping position of the sud22 mutation. The F2 population from the cross between dry2/sud22 and a line that contained the dry2 mutation in Col-0 background (dry2 Col-0 introgression line) was used to generate a mapping population for dry2/sud22 and
determin a fine position for the sud22 mutation. The dry2 Col-0 introgression line was obtained by crossing
dry2 into the Col-0 ecotype for at least seven generations. The F2 populations from crosses between suppressors dry2/sud9, dry2/sud26 and dry2/sud27 and dry2 Col-0 were used to perform a first-pass
mapping and determine the raw mapping position of sud9, sud26 and sud27 mutations.
Plant Manipulation and Growth Conditions
Arabidopsis standard handling procedures and conditions were employed to promote seed germination and growth, as previously described in Materials and Methods section of Chapter 2.
Arabidopsis Cross-fertilization
Plants were subjected to artificial fertilisation by classical genetic crosses as now described. Crosses were made with the assistance of a Leica Zoom 2000 bench stereomicroscope and special crossing tweezers. Siliques, flowers, and opened buds were removed from female donors. The closed buds were opened and all organs were removed with the exception of the carpel. In the male donor, a flower was removed with a closing tweezer, and the pollen from the anthers was placed at the surface of the carpel stigma of the female donor to promote fertilisation. After crossing, the stem of the plant was
CHAPTER 3. IDENTIFICATION OF DRY2 SUPPRESSOR MUTATIONS
61
signalled and formation of a viable silique was observed within two days. Fully developed seeds were later recovered.
Identification of homozygous plants for the dry2 and sud22 mutations
Homozygous plants for the dry2 and sud22 mutations were identified using two distinct steps. First, plants presenting wild-type phenotypes were identified. The wild-type phenotypes could be due to the presence of the suppressor in the dry2 background, but most plants would still present wild-type phenotypes because they either did not contain dry2 or dry2 was in heterozygous condition. Next, plants with wild-type phenotype but carrying the homozygous dry2 mutation were identified by PCR amplification of the SSLP InDel PromSqe Col-0/Ler polymorphism. PCR amplication of the region containg the InDel PromSqe Col-0/Ler polymorphism located at the DRY2/SQE1 promoter region, using the primers displayed in Table 3.5, allowed to distinguish those plants that were genetically Ler homozygous at the chromosomal region of SQE1/DRY2-5 gene, from those that were Col-0 or heterozygous. Since the dry2 mutation was in Ler background in the parental plant used for the cross between dry2/sud22 and wild-type (Col-0) plants, in the F2 segregating population those plants that were genetically Ler homozygous at the chromosomal region of the SQE1/DRY2-5 gene, are most likely homozygous for the dry2 mutation.
Table 3.5 – Primers used to Specifically Amplify the SSLP InDel PromSqe Col-0/Ler Polymorphism
Name Sequence (5’→3’) Annealing temperature (ºC)
Polimorfism type
Col-0 Amplification
product size (bp)
Ler Amplification
product size (bp)
InDel PromSqe Fw TGCTCGCTCGTACTTTTGAG 55 SSLP 628 365
InDel PromSqe Rv GAATCAAATAACGCGAGGTGA
Map-based Cloning of SUD1
The standard molecular biology methods, used in the present work, are presented in more detail in Appendix I. All information regarding the genetic markers used in the map-based cloning of SUD1 was obtained from TAIR (http://www.arabidopsis.org/). The detailed information regarding the genetic markers is presented in more detail in Appendix II.
Bioinformatic Tools Used for Identification of SUD1
The second-site mutation responsible for the suppression phenotypes of dry2 (SUD1) was identified using a combination of map-based cloning and high throughput sequencing. Using map-based cloning, the sud1-22 mutation was mapped to a 117 kb region that contained 36 annotated genes according to the TAIR database (http://www.arabidopsis.org/). The whole genome of dry2/sud22 was sequenced using Solexa (Illumina Genome Analysis System technique) at the University of California Riverside, by Dr. Abel Rosado Rey. The resulting 117 kb candidate sequences were analysed with the aid of bioinformatic tools, at the Boyce Thompson Institute for Plant Research, by Dr. Aureliano Bombarely, as following described. The sequences obtained by high throughput sequencing were pre-processed using the FastX-Toolkit (http://hannonlab.cshl.edu/fastx_toolkit/) program and aligned with the Arabidopsis

CHAPTER 3. IDENTIFICATION OF DRY2 SUPPRESSOR MUTATIONS
62
thaliana reference genome annotated in TAIR9 (http://www.arabidopsis.org/), using BWA (http://bio-bwa.sourceforge.net/) (Li and Durbin, 2009). The alignments were processed and the variations were calculated using SAMtools (http://samtools.sourceforge.net/) (Li et al., 2009). The variations corresponding to the Ler ecotype were eliminated using an informatics script to compare the coordinates of the variations from dry2/sud22 sequencing with the variations from Ler sequencing data from Prof. Joe Ecker at the 1001 genomes project (http://1001genomes.org/data_providers.html). The resulting dry2/sud22 variations, corresponding to single nucleotide polymorphisms (SNPs), were classified according to their position as exon-SNP, cds-SNP, intron-SNP and intergenic-SNP.
Chapter 4
In Silico Analysis of SUD1 Expression and Whole-genome Transcript
Profile of Wild-type, dry2, dry2/sud9, and dry2/sud22
CONTENTS
4.1. INTRODUCTION 4.2. RESULTS AND DISCUSSION
In Silico Analysis of SUD1 Expression Effect of SUD1 Inactivation on dry2 Whole-genome Transcriptional Activity
4.3. MATERIALS AND METHODS

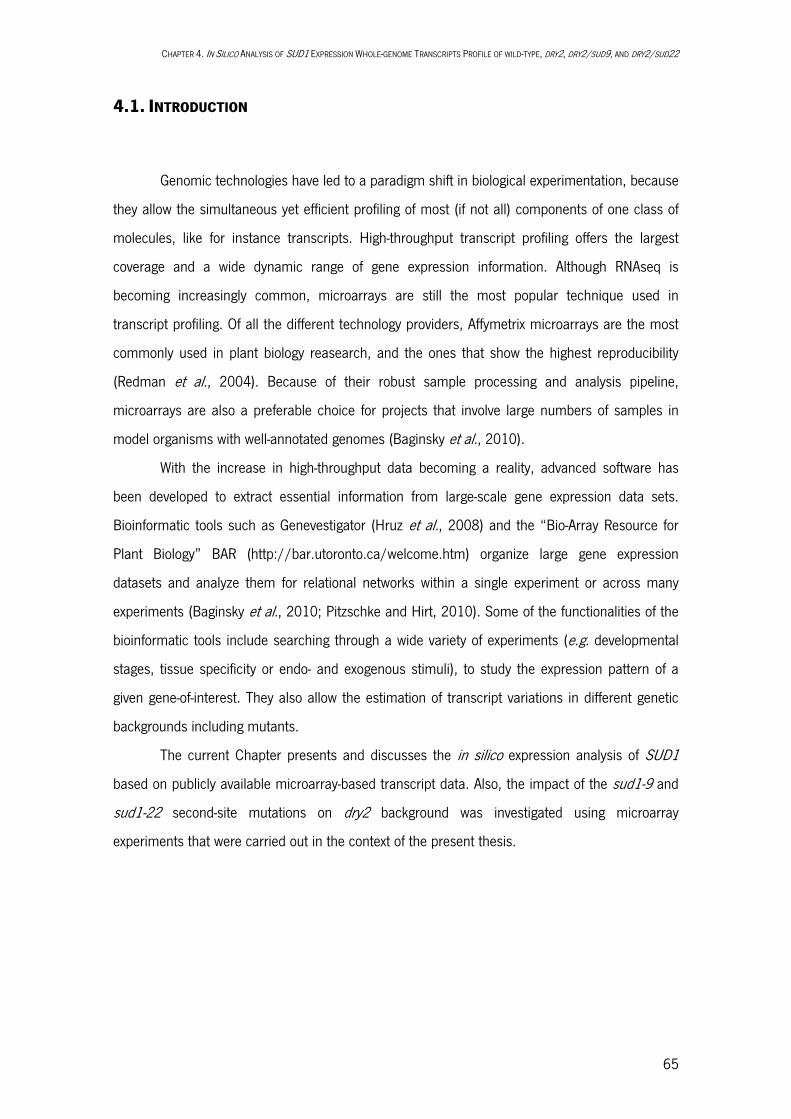
CHAPTER 4. IN SILICO ANALYSIS OF SUD1 EXPRESSION WHOLE-GENOME TRANSCRIPTS PROFILE OF WILD-TYPE, DRY2, DRY2/SUD9, AND DRY2/SUD22
65
4.1. INTRODUCTION
Genomic technologies have led to a paradigm shift in biological experimentation, because
they allow the simultaneous yet efficient profiling of most (if not all) components of one class of
molecules, like for instance transcripts. High-throughput transcript profiling offers the largest
coverage and a wide dynamic range of gene expression information. Although RNAseq is
becoming increasingly common, microarrays are still the most popular technique used in
transcript profiling. Of all the different technology providers, Affymetrix microarrays are the most
commonly used in plant biology reasearch, and the ones that show the highest reproducibility
(Redman et al., 2004). Because of their robust sample processing and analysis pipeline,
microarrays are also a preferable choice for projects that involve large numbers of samples in
model organisms with well-annotated genomes (Baginsky et al., 2010).
With the increase in high-throughput data becoming a reality, advanced software has
been developed to extract essential information from large-scale gene expression data sets.
Bioinformatic tools such as Genevestigator (Hruz et al., 2008) and the “Bio-Array Resource for
Plant Biology” BAR (http://bar.utoronto.ca/welcome.htm) organize large gene expression
datasets and analyze them for relational networks within a single experiment or across many
experiments (Baginsky et al., 2010; Pitzschke and Hirt, 2010). Some of the functionalities of the
bioinformatic tools include searching through a wide variety of experiments (e.g. developmental
stages, tissue specificity or endo- and exogenous stimuli), to study the expression pattern of a
given gene-of-interest. They also allow the estimation of transcript variations in different genetic
backgrounds including mutants.
The current Chapter presents and discusses the in silico expression analysis of SUD1
based on publicly available microarray-based transcript data. Also, the impact of the sud1-9 and
sud1-22 second-site mutations on dry2 background was investigated using microarray
experiments that were carried out in the context of the present thesis.

CHAPTER 4. IN SILICO ANALYSIS OF SUD1 EXPRESSION AND WHOLE-GENOME TRANSCRIPT PROFILE OF WILD-TYPE, DRY2, DRY2/SUD9, AND DRY2/SUD22
66
4.2. RESULTS AND DISCUSSION
In Silico Analysis of SUD1 Expression
The in silico expression pattern of SUD1 was analysed to gain new insights on the
functional role of this gene, through the use of the web-based resource Genevestigator
(https://www.genevestigator.com/gv/plant.jsp) (Hruz et al., 2008). As shown in Figure 4.1,
SUD1 is highly expressed across different developmental stages of Arabidopsis. Moreover, SUD1
is highly expressed in almost every Arabidopsis analysed tissues (Figure 4.2).
Figure 4.1 – SUD1 Expression across Different Stages of Arabidopsis Developmental Scatterplot of the Arabidopsis SUD1 expression pattern (Affymetrix Arabidopsis Genome Array ATH1; probe set: 253267_at), obtained using the Development tool in the Condition search toolset from Genevestigator 4 - Plant Biology (https://www. genevestigator.com/gv/plant.jsp) (Hruz et al., 2008). Levels of expression are scaled to the expression potential (maximum expression a probe set reaches across all experiments). Results are displayed in log2-scale. Indicated values in each developmental stage are an average over all samples that were annotated as such. Standard error of the mean is represented on the graph. Total number of samples included into a given developmental stage is indicated at the bottom of the graphs. Development is defined strictly as a time-related dimension with different lapses between precisely defined states of development, from germination to the adult plant.
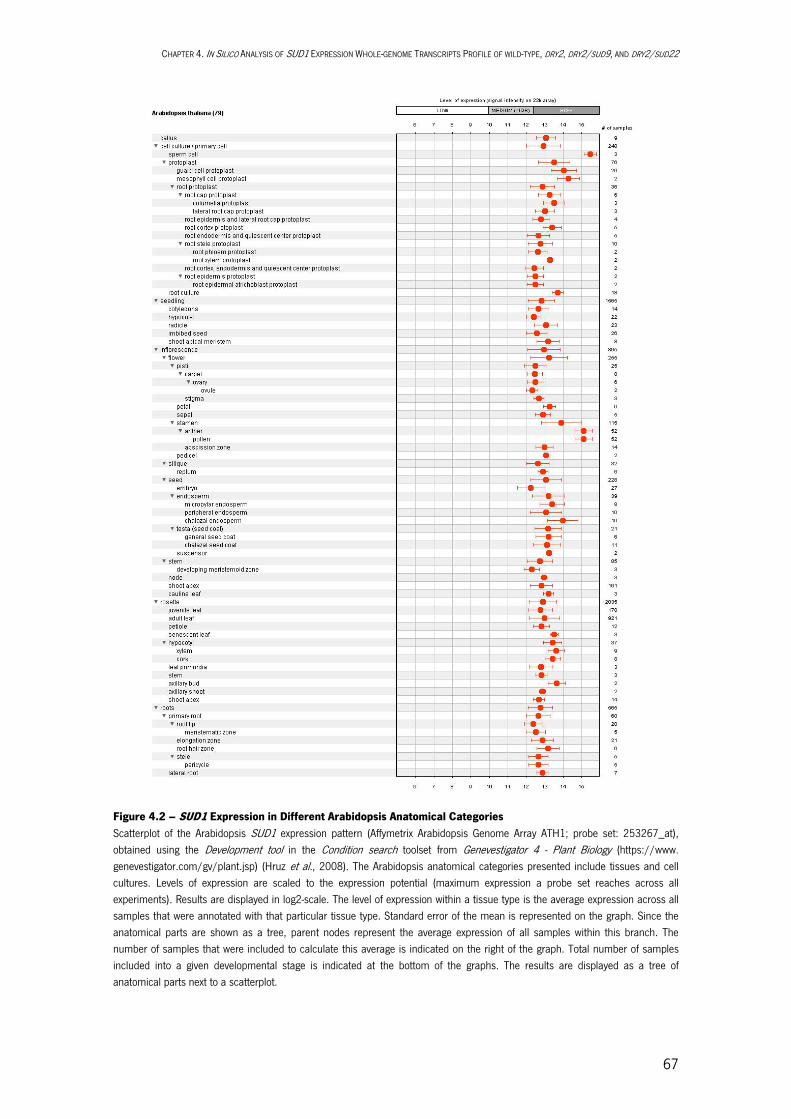
CHAPTER 4. IN SILICO ANALYSIS OF SUD1 EXPRESSION WHOLE-GENOME TRANSCRIPTS PROFILE OF WILD-TYPE, DRY2, DRY2/SUD9, AND DRY2/SUD22
67
Figure 4.2 – SUD1 Expression in Different Arabidopsis Anatomical Categories Scatterplot of the Arabidopsis SUD1 expression pattern (Affymetrix Arabidopsis Genome Array ATH1; probe set: 253267_at), obtained using the Development tool in the Condition search toolset from Genevestigator 4 - Plant Biology (https://www. genevestigator.com/gv/plant.jsp) (Hruz et al., 2008). The Arabidopsis anatomical categories presented include tissues and cell cultures. Levels of expression are scaled to the expression potential (maximum expression a probe set reaches across all experiments). Results are displayed in log2-scale. The level of expression within a tissue type is the average expression across all samples that were annotated with that particular tissue type. Standard error of the mean is represented on the graph. Since the anatomical parts are shown as a tree, parent nodes represent the average expression of all samples within this branch. The number of samples that were included to calculate this average is indicated on the right of the graph. Total number of samples included into a given developmental stage is indicated at the bottom of the graphs. The results are displayed as a tree of anatomical parts next to a scatterplot.
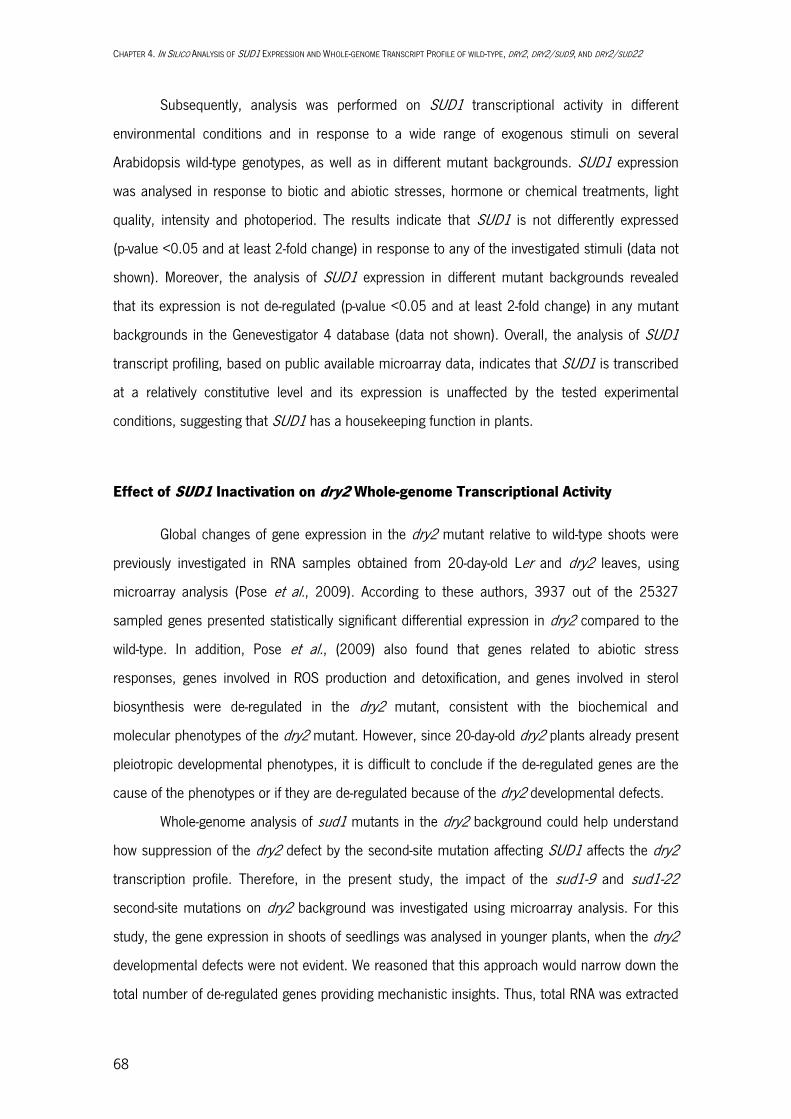
CHAPTER 4. IN SILICO ANALYSIS OF SUD1 EXPRESSION AND WHOLE-GENOME TRANSCRIPT PROFILE OF WILD-TYPE, DRY2, DRY2/SUD9, AND DRY2/SUD22
68
Subsequently, analysis was performed on SUD1 transcriptional activity in different
environmental conditions and in response to a wide range of exogenous stimuli on several
Arabidopsis wild-type genotypes, as well as in different mutant backgrounds. SUD1 expression
was analysed in response to biotic and abiotic stresses, hormone or chemical treatments, light
quality, intensity and photoperiod. The results indicate that SUD1 is not differently expressed
(p-value <0.05 and at least 2-fold change) in response to any of the investigated stimuli (data not
shown). Moreover, the analysis of SUD1 expression in different mutant backgrounds revealed
that its expression is not de-regulated (p-value <0.05 and at least 2-fold change) in any mutant
backgrounds in the Genevestigator 4 database (data not shown). Overall, the analysis of SUD1
transcript profiling, based on public available microarray data, indicates that SUD1 is transcribed
at a relatively constitutive level and its expression is unaffected by the tested experimental
conditions, suggesting that SUD1 has a housekeeping function in plants.
Effect of SUD1 Inactivation on dry2 Whole-genome Transcriptional Activity
Global changes of gene expression in the dry2 mutant relative to wild-type shoots were
previously investigated in RNA samples obtained from 20-day-old Ler and dry2 leaves, using
microarray analysis (Pose et al., 2009). According to these authors, 3937 out of the 25327
sampled genes presented statistically significant differential expression in dry2 compared to the
wild-type. In addition, Pose et al., (2009) also found that genes related to abiotic stress
responses, genes involved in ROS production and detoxification, and genes involved in sterol
biosynthesis were de-regulated in the dry2 mutant, consistent with the biochemical and
molecular phenotypes of the dry2 mutant. However, since 20-day-old dry2 plants already present
pleiotropic developmental phenotypes, it is difficult to conclude if the de-regulated genes are the
cause of the phenotypes or if they are de-regulated because of the dry2 developmental defects.
Whole-genome analysis of sud1 mutants in the dry2 background could help understand
how suppression of the dry2 defect by the second-site mutation affecting SUD1 affects the dry2
transcription profile. Therefore, in the present study, the impact of the sud1-9 and sud1-22
second-site mutations on dry2 background was investigated using microarray analysis. For this
study, the gene expression in shoots of seedlings was analysed in younger plants, when the dry2
developmental defects were not evident. We reasoned that this approach would narrow down the
total number of de-regulated genes providing mechanistic insights. Thus, total RNA was extracted

CHAPTER 4. IN SILICO ANALYSIS OF SUD1 EXPRESSION WHOLE-GENOME TRANSCRIPTS PROFILE OF WILD-TYPE, DRY2, DRY2/SUD9, AND DRY2/SUD22
69
from shoot tissue of 13-day-old Ler, dry2, dry2/sud1-9 and dry2/sud1-22 in vitro-grown
seedlings (Figure 4.3). RNA was first transcribed into cDNA and then into biotinylated
complementary RNA, that was hybridized onto Affymetrix ATH1 gene chips.
Figure 4.3 – Schematic Representation of the Microarray Analysis Experimental Design Experimental design of the microarray analysis allows comparison of the expression profiles of the analyzed plant lines, as represented by gray arrows. Three biological replicas per genotype were used for microarray analysis. Each biological replica was prepared using 2 independent extractions from shoot tissues of 13-day-old Ler, dry2, dry2/sud1-9 or dry2/sud1-22 in vitro-growing seedlings. Total RNA from 3 biological replicas was transcribed into cDNA and then biotinylated complementary RNA was hybridized onto Affymetrix ATH1 gene chips to perform gene whole-genome expression analysis.
The Arabidopsis ATH1 Genome Array contains more than 22,500 probe sets
representing approximately 24,000 gene sequences on a single array. The impact of dry2 and
sud1 mutations on dry2 background on global gene expression profile was investigated.
The average, from three replicate experiments, of the logarithmic intensity values of the more
than 22,500 probe sets present on the ATH1 microarray were plotted as dots shown in scatter
plots of dry2 vs Ler, dry2 vs dry2/sud1-9, dry2 vs dry2/sud1-22 and dry2/sud1-9 vs dry2/sud1-
22, as shown in Figure 4.4.
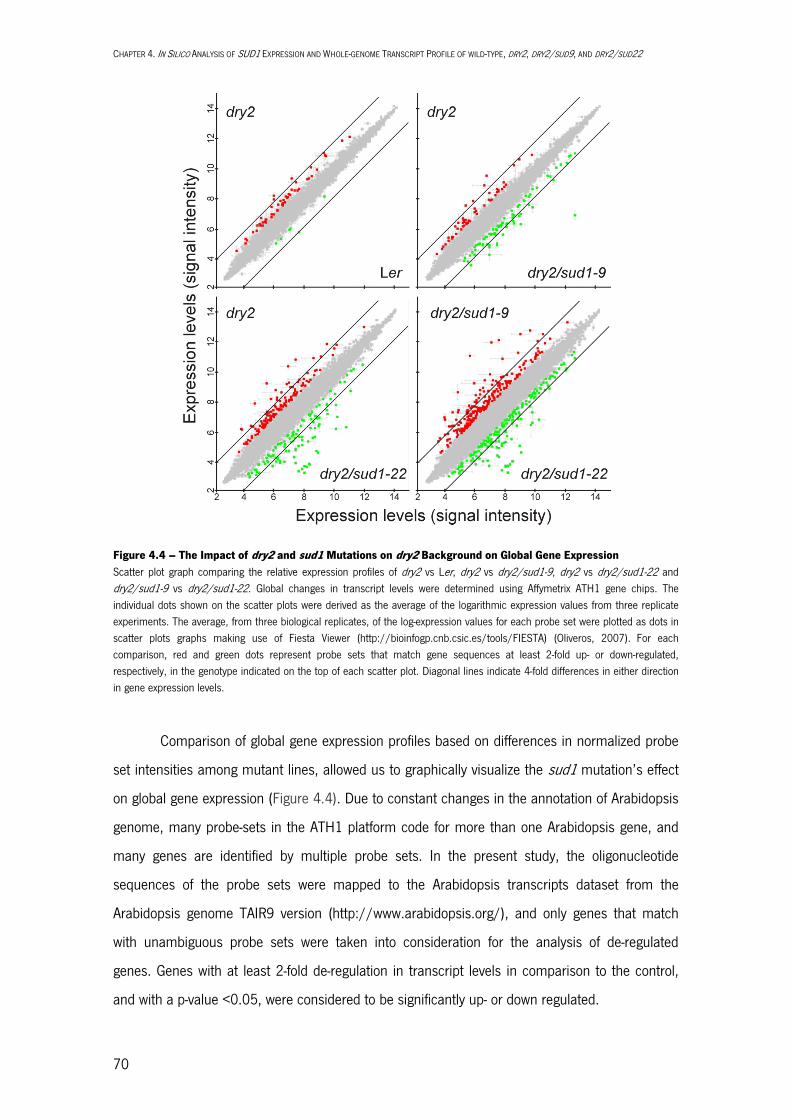
CHAPTER 4. IN SILICO ANALYSIS OF SUD1 EXPRESSION AND WHOLE-GENOME TRANSCRIPT PROFILE OF WILD-TYPE, DRY2, DRY2/SUD9, AND DRY2/SUD22
70
Figure 4.4 – The Impact of dry2 and sud1 Mutations on dry2 Background on Global Gene Expression Scatter plot graph comparing the relative expression profiles of dry2 vs Ler, dry2 vs dry2/sud1-9, dry2 vs dry2/sud1-22 and dry2/sud1-9 vs dry2/sud1-22. Global changes in transcript levels were determined using Affymetrix ATH1 gene chips. The individual dots shown on the scatter plots were derived as the average of the logarithmic expression values from three replicate experiments. The average, from three biological replicates, of the log-expression values for each probe set were plotted as dots in scatter plots graphs making use of Fiesta Viewer (http://bioinfogp.cnb.csic.es/tools/FIESTA) (Oliveros, 2007). For each comparison, red and green dots represent probe sets that match gene sequences at least 2-fold up- or down-regulated, respectively, in the genotype indicated on the top of each scatter plot. Diagonal lines indicate 4-fold differences in either direction in gene expression levels.
Comparison of global gene expression profiles based on differences in normalized probe
set intensities among mutant lines, allowed us to graphically visualize the sud1 mutation’s effect
on global gene expression (Figure 4.4). Due to constant changes in the annotation of Arabidopsis
genome, many probe-sets in the ATH1 platform code for more than one Arabidopsis gene, and
many genes are identified by multiple probe sets. In the present study, the oligonucleotide
sequences of the probe sets were mapped to the Arabidopsis transcripts dataset from the
Arabidopsis genome TAIR9 version (http://www.arabidopsis.org/), and only genes that match
with unambiguous probe sets were taken into consideration for the analysis of de-regulated
genes. Genes with at least 2-fold de-regulation in transcript levels in comparison to the control,
and with a p-value <0.05, were considered to be significantly up- or down regulated.
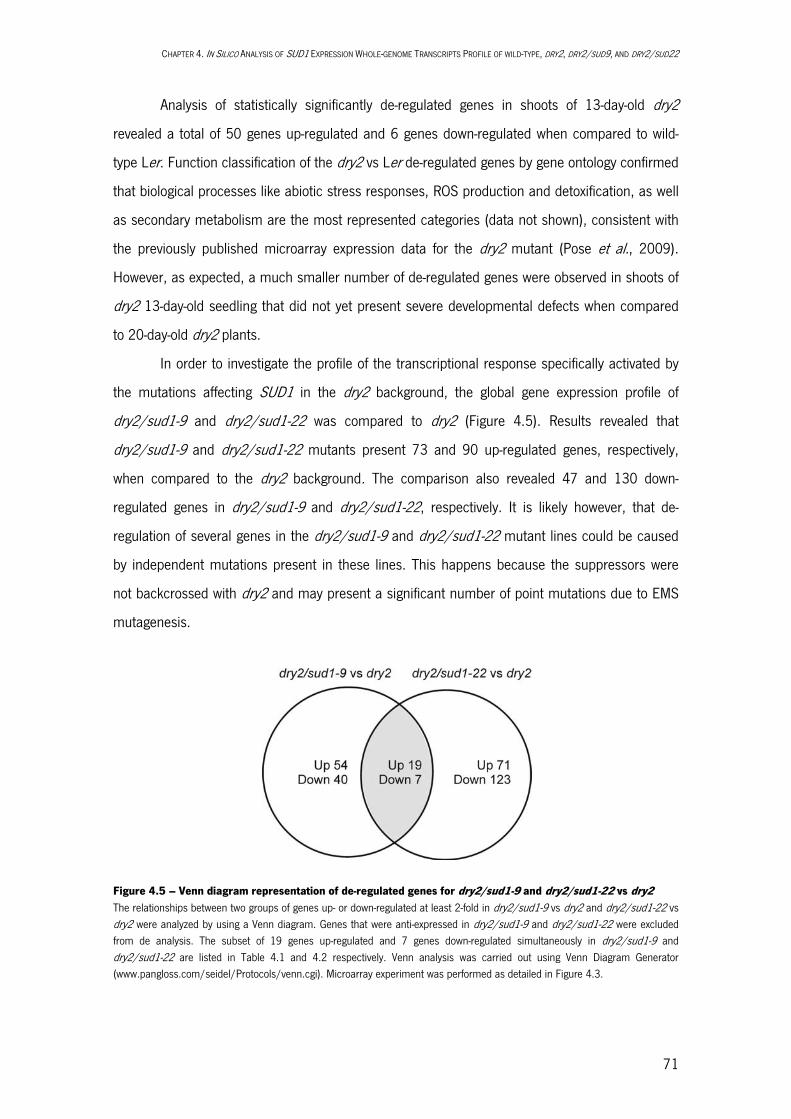
CHAPTER 4. IN SILICO ANALYSIS OF SUD1 EXPRESSION WHOLE-GENOME TRANSCRIPTS PROFILE OF WILD-TYPE, DRY2, DRY2/SUD9, AND DRY2/SUD22
71
Analysis of statistically significantly de-regulated genes in shoots of 13-day-old dry2
revealed a total of 50 genes up-regulated and 6 genes down-regulated when compared to wild-
type Ler. Function classification of the dry2 vs Ler de-regulated genes by gene ontology confirmed
that biological processes like abiotic stress responses, ROS production and detoxification, as well
as secondary metabolism are the most represented categories (data not shown), consistent with
the previously published microarray expression data for the dry2 mutant (Pose et al., 2009).
However, as expected, a much smaller number of de-regulated genes were observed in shoots of
dry2 13-day-old seedling that did not yet present severe developmental defects when compared
to 20-day-old dry2 plants.
In order to investigate the profile of the transcriptional response specifically activated by
the mutations affecting SUD1 in the dry2 background, the global gene expression profile of
dry2/sud1-9 and dry2/sud1-22 was compared to dry2 (Figure 4.5). Results revealed that
dry2/sud1-9 and dry2/sud1-22 mutants present 73 and 90 up-regulated genes, respectively,
when compared to the dry2 background. The comparison also revealed 47 and 130 down-
regulated genes in dry2/sud1-9 and dry2/sud1-22, respectively. It is likely however, that de-
regulation of several genes in the dry2/sud1-9 and dry2/sud1-22 mutant lines could be caused
by independent mutations present in these lines. This happens because the suppressors were
not backcrossed with dry2 and may present a significant number of point mutations due to EMS
mutagenesis.
Figure 4.5 – Venn diagram representation of de-regulated genes for dry2/sud1-9 and dry2/sud1-22 vs dry2 The relationships between two groups of genes up- or down-regulated at least 2-fold in dry2/sud1-9 vs dry2 and dry2/sud1-22 vs dry2 were analyzed by using a Venn diagram. Genes that were anti-expressed in dry2/sud1-9 and dry2/sud1-22 were excluded from de analysis. The subset of 19 genes up-regulated and 7 genes down-regulated simultaneously in dry2/sud1-9 and dry2/sud1-22 are listed in Table 4.1 and 4.2 respectively. Venn analysis was carried out using Venn Diagram Generator (www.pangloss.com/seidel/Protocols/venn.cgi). Microarray experiment was performed as detailed in Figure 4.3.
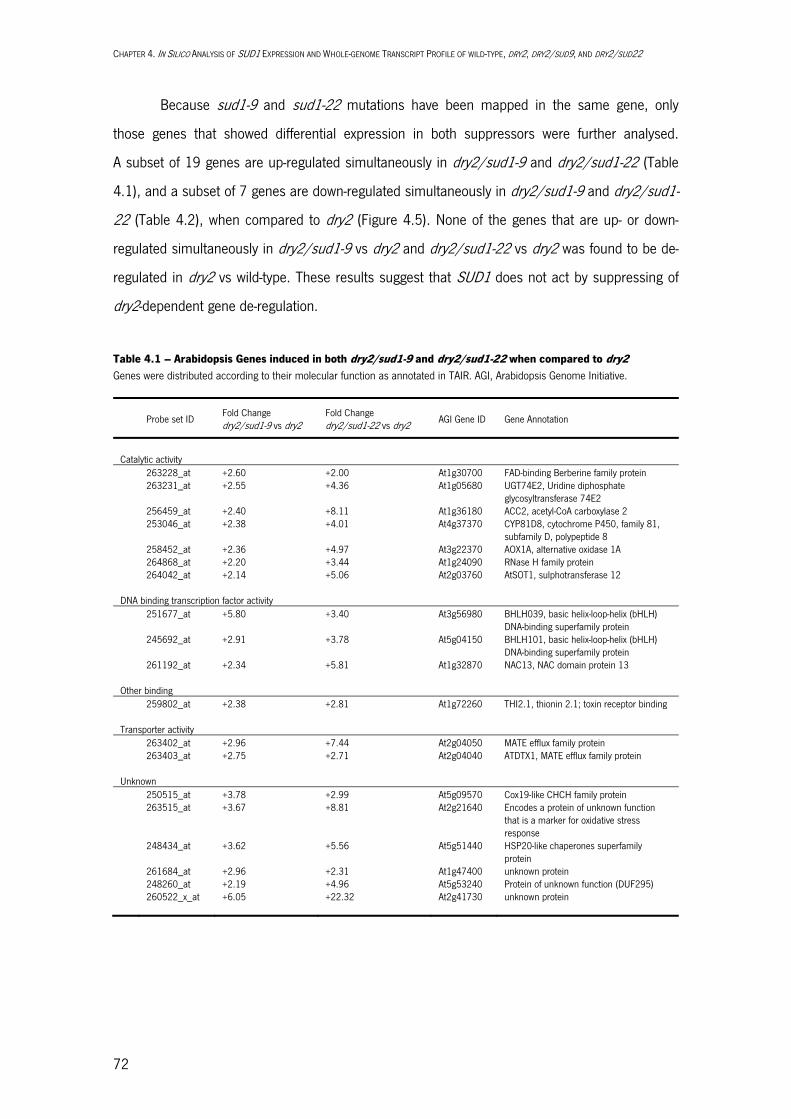
CHAPTER 4. IN SILICO ANALYSIS OF SUD1 EXPRESSION AND WHOLE-GENOME TRANSCRIPT PROFILE OF WILD-TYPE, DRY2, DRY2/SUD9, AND DRY2/SUD22
72
Because sud1-9 and sud1-22 mutations have been mapped in the same gene, only
those genes that showed differential expression in both suppressors were further analysed.
A subset of 19 genes are up-regulated simultaneously in dry2/sud1-9 and dry2/sud1-22 (Table
4.1), and a subset of 7 genes are down-regulated simultaneously in dry2/sud1-9 and dry2/sud1-
22 (Table 4.2), when compared to dry2 (Figure 4.5). None of the genes that are up- or down-
regulated simultaneously in dry2/sud1-9 vs dry2 and dry2/sud1-22 vs dry2 was found to be de-
regulated in dry2 vs wild-type. These results suggest that SUD1 does not act by suppressing of
dry2-dependent gene de-regulation.
Table 4.1 – Arabidopsis Genes induced in both dry2/sud1-9 and dry2/sud1-22 when compared to dry2 Genes were distributed according to their molecular function as annotated in TAIR. AGI, Arabidopsis Genome Initiative.
Probe set ID Fold Change dry2/sud1-9 vs dry2
Fold Change dry2/sud1-22 vs dry2
AGI Gene ID Gene Annotation
Catalytic activity 263228_at +2.60 +2.00 At1g30700 FAD-binding Berberine family protein 263231_at +2.55 +4.36 At1g05680 UGT74E2, Uridine diphosphate
glycosyltransferase 74E2 256459_at +2.40 +8.11 At1g36180 ACC2, acetyl-CoA carboxylase 2 253046_at +2.38 +4.01 At4g37370 CYP81D8, cytochrome P450, family 81,
subfamily D, polypeptide 8 258452_at +2.36 +4.97 At3g22370 AOX1A, alternative oxidase 1A 264868_at +2.20 +3.44 At1g24090 RNase H family protein 264042_at +2.14 +5.06 At2g03760 AtSOT1, sulphotransferase 12 DNA binding transcription factor activity 251677_at +5.80 +3.40 At3g56980 BHLH039, basic helix-loop-helix (bHLH)
DNA-binding superfamily protein 245692_at +2.91 +3.78 At5g04150 BHLH101, basic helix-loop-helix (bHLH)
DNA-binding superfamily protein 261192_at +2.34 +5.81 At1g32870 NAC13, NAC domain protein 13 Other binding 259802_at +2.38 +2.81 At1g72260 THI2.1, thionin 2.1; toxin receptor binding Transporter activity 263402_at +2.96 +7.44 At2g04050 MATE efflux family protein 263403_at +2.75 +2.71 At2g04040 ATDTX1, MATE efflux family protein Unknown 250515_at +3.78 +2.99 At5g09570 Cox19-like CHCH family protein 263515_at +3.67 +8.81 At2g21640 Encodes a protein of unknown function
that is a marker for oxidative stress response
248434_at +3.62 +5.56 At5g51440 HSP20-like chaperones superfamily protein
261684_at +2.96 +2.31 At1g47400 unknown protein 248260_at +2.19 +4.96 At5g53240 Protein of unknown function (DUF295) 260522_x_at +6.05 +22.32 At2g41730 unknown protein
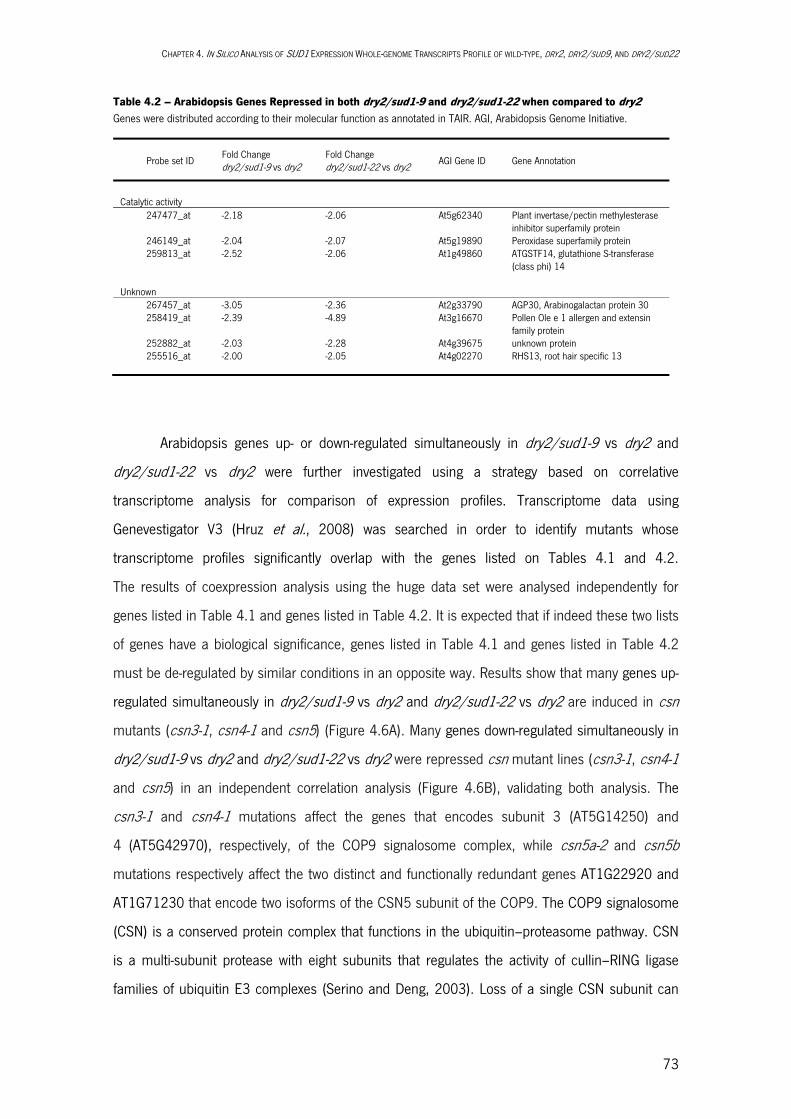
CHAPTER 4. IN SILICO ANALYSIS OF SUD1 EXPRESSION WHOLE-GENOME TRANSCRIPTS PROFILE OF WILD-TYPE, DRY2, DRY2/SUD9, AND DRY2/SUD22
73
Table 4.2 – Arabidopsis Genes Repressed in both dry2/sud1-9 and dry2/sud1-22 when compared to dry2 Genes were distributed according to their molecular function as annotated in TAIR. AGI, Arabidopsis Genome Initiative.
Probe set ID Fold Change dry2/sud1-9 vs dry2
Fold Change dry2/sud1-22 vs dry2
AGI Gene ID Gene Annotation
Catalytic activity 247477_at -2.18 -2.06 At5g62340 Plant invertase/pectin methylesterase
inhibitor superfamily protein 246149_at -2.04 -2.07 At5g19890 Peroxidase superfamily protein 259813_at -2.52 -2.06 At1g49860 ATGSTF14, glutathione S-transferase
(class phi) 14 Unknown 267457_at -3.05 -2.36 At2g33790 AGP30, Arabinogalactan protein 30 258419_at -2.39 -4.89 At3g16670 Pollen Ole e 1 allergen and extensin
family protein 252882_at -2.03 -2.28 At4g39675 unknown protein 255516_at -2.00 -2.05 At4g02270 RHS13, root hair specific 13
Arabidopsis genes up- or down-regulated simultaneously in dry2/sud1-9 vs dry2 and
dry2/sud1-22 vs dry2 were further investigated using a strategy based on correlative
transcriptome analysis for comparison of expression profiles. Transcriptome data using
Genevestigator V3 (Hruz et al., 2008) was searched in order to identify mutants whose
transcriptome profiles significantly overlap with the genes listed on Tables 4.1 and 4.2.
The results of coexpression analysis using the huge data set were analysed independently for
genes listed in Table 4.1 and genes listed in Table 4.2. It is expected that if indeed these two lists
of genes have a biological significance, genes listed in Table 4.1 and genes listed in Table 4.2
must be de-regulated by similar conditions in an opposite way. Results show that many genes up-
regulated simultaneously in dry2/sud1-9 vs dry2 and dry2/sud1-22 vs dry2 are induced in csn
mutants (csn3-1, csn4-1 and csn5) (Figure 4.6A). Many genes down-regulated simultaneously in
dry2/sud1-9 vs dry2 and dry2/sud1-22 vs dry2 were repressed csn mutant lines (csn3-1, csn4-1
and csn5) in an independent correlation analysis (Figure 4.6B), validating both analysis. The
csn3-1 and csn4-1 mutations affect the genes that encodes subunit 3 (AT5G14250) and
4 (AT5G42970), respectively, of the COP9 signalosome complex, while csn5a-2 and csn5b
mutations respectively affect the two distinct and functionally redundant genes AT1G22920 and
AT1G71230 that encode two isoforms of the CSN5 subunit of the COP9. The COP9 signalosome
(CSN) is a conserved protein complex that functions in the ubiquitin–proteasome pathway. CSN
is a multi-subunit protease with eight subunits that regulates the activity of cullin–RING ligase
families of ubiquitin E3 complexes (Serino and Deng, 2003). Loss of a single CSN subunit can

CHAPTER 4. IN SILICO ANALYSIS OF SUD1 EXPRESSION AND WHOLE-GENOME TRANSCRIPT PROFILE OF WILD-TYPE, DRY2, DRY2/SUD9, AND DRY2/SUD22
74
destabilize the entire complex resulting in a broad range of phenotypes including lethality in
strong csn alleles (Serino and Deng, 2003). Because it is highly unlikely that independent
correlation analyses of up- and down-regulated co-expressed genes identified the same csn
mutant lines by chance, this result indicate that we are in the presence of a relevant biological
association.
Figure 4.6 – Genevestigator V3 Clustering Analysis of Arabidopsis Genes Up- or Down-regulated Simultaneously in dry2/sud1-9 vs dry2 and dry2/sud1-22 vs dry2 Genes (columns) were clustered based on their expression in different mutant backgrounds (rows), using the Biclustering method (BiMax algorithm). The yellow box marks the cluster of genes, all of which are up-regulated (A) or down-regulated (B) under the indicated subset of conditions. The colour scale presented at the bottom represents the log2 ratio of fold change.
Although the correlative transcriptome analysis for comparison of expression profiles
does not establish proof of the nature of the relationship between genes, it allows us to formulate
the hypothesis that SUD1 is involved into an ubiquitin-proteosome pathway, which can
subsequently be validated experimentally. In summary, global gene expression analysis was a
valuable validation tool as starting point to study SUD1 function by formulation of novel
hypotheses about the cellular process involving SUD1.
CHAPTER 4. IN SILICO ANALYSIS OF SUD1 EXPRESSION WHOLE-GENOME TRANSCRIPTS PROFILE OF WILD-TYPE, DRY2, DRY2/SUD9, AND DRY2/SUD22
75
4.3. MATERIALS AND METHODS
Plant Material
The Arabidopsis thaliana ecotypes Landsberg erecta (Ler) was used as wild-type control in the present study. Mutants used in this study that have been previously described: dry2 (Pose et al., 2009), dry2/sud9 and dry2/sud22 (Pose, 2008).
Plant Manipulation and Growth Conditions
Arabidopsis standard handling procedures and conditions were employed to promote seed germination and growth, as previously described in the Materials and Methods section of Chapter 2.
Biological Sample preparation for Microarray Hybridization
The preparation of biological samples for microarray hybridization was performed in collaboration with Verónica G. Doblas from Instituto de Hortofruticultura Subtropical y Mediterránea, Universidad de Málaga, Málaga, Spain. The entire experiment was performed six times, providing three independent biological replicates. For each of the six experiments, all four lines, wild-type, dry2, dry2/sud1-9 and dry2/sud1-22 were grown for 13 days in vitro before the shoots of at least 30 plants per line were harvested. Total RNA was prepared separately for the six individual experiments. The RNA extraction was performed using the TRIZOL method. The RNA was further purified using an RNeasy Plant Mini Kit (Qiagen, http://www.qiagen.com). Total RNA samples from two experiments were pooled to create biological replicates. Each biological replicate consisted of equal amounts of total RNA from shoot tissues of each of the four plant lines. Total RNA (5 μg) of each biological replicate was prepared and RNA integrity was assessed by nuclecic acids electrophoretic separation with a hight sensitive EukaryoteTotal RNA Nano Assay, using an Agilent 2100 Bioanalyser (Agilent Technologies).
Microarray Hybridization and Evaluation
Affymetrix Arabidopsis ATH1 GeneChips were used (Affymetrix, Santa Clara, CA). RNA was first transcribed into cDNA, and then into biotin-labeled cRNA, that was hybridized onto Affymetrix ATH1 gene chips. Experimental procedures concerning hybridization and raw data processing, were performed by the Genomic Unit at Centro Nacional de Biotecnología, CSIC, Campus de Cantoblanco UAM C/ Darwin 3 28049 Madrid.
Microarray Bioinformatic Data Analysis
Meta-Profile Analysis of SUD1 gene expression patterns in different Arabidopsis tissues and analysis of SUD1 expression in different mutant backgrounds were carried out using Genevestigator (https://www.genevestigator.com/gv/plant.jsp) (Hruz et al., 2008).

CHAPTER 4. IN SILICO ANALYSIS OF SUD1 EXPRESSION AND WHOLE-GENOME TRANSCRIPT PROFILE OF WILD-TYPE, DRY2, DRY2/SUD9, AND DRY2/SUD22
76
Differential expression gene sorting (fold-change between logarithmic expression values of two given samples) was performed using Microsoft Office Excel (Microsoft). A cutoff value of 2-fold and a p-value <0.05 were adopted to identify genes that were differentially expressed. The logarithmic intensity levels for each ATH1 GeneChips probe were plotted using Fiesta Viewer (http://bioinfogp. cnb.csic.es/tools/FIESTA) (Oliveros, 2007). Venn analysis was carried out using Venn Diagram Generator (www.pangloss.com/seidel/Protocols/venn.cgi). GO categorization was carried out at TAIR (www.arabidopsis.org). Clustering Analysis of gene expression patterns for comparison of expression profiles was carried out using Genevestigator (https://www.genevestigator.com/gv/plant.jsp) (Hruz et al., 2008).
Chapter 5
In Silico Structural and Phylogenetic Analysis of SUD1
CONTENTS
5.1. INTRODUCTION 5.2. RESULTS AND DISCUSSION
Structural Features of SUD1 Topology Model for SUD1 Protein Identification of Essential Amino Acid Residues for SUD1 Function Phylogenetic Analysis of SUD1
5.3. MATERIALS AND METHODS

CHAPTER 5. IN SILICO STRUCTURAL AND PHYLOGENETIC ANALYSIS OF SUD1
79
5.1. INTRODUCTION
With the sequencing of the first genome of a higher plant (Arabidopsis thaliana)
(Arabidopsis Genome Initiative, 2000), plant research began determining the biological function of
thousands of annotated genes, and as a consequence, various new resources for functional
discovery have since become available (Feng and Mundy, 2006; Azevedo et al., 2011). In addition,
high-throughput and omics-based approaches in Arabidopsis have been thoroughly developed
(MASC Report, 2011), and in this post-genomic era, a huge amount of in silico genomic and
proteomic data has become available. Data mining of this information, easily acquired from
publicly available databases, is now an essential step when studying a given gene-of-interest.
With the increase in high-throughput data becoming available, intelligent software has been
developed to extract essential information from large-scale data sets. Some bioinformatics
programs can aid in many ways to elucidate the function of a gene of interest, for instance by in
silico prediction of structural features to a given gene, protein sequence alignments and
phylogenetic analysis. A combined analysis resulting from several genomic-based resources will be
presented next for SUD1.
5.2. RESULTS AND DISCUSSION
Structural Features of SUD1
The Arabidopsis SUD1 gene is predicted to encode a protein of 123 KDa. Apart from the
role assigned to SUD1 in the present work, no function has been assigned to this gene. In silico
analysis was employed to further characterize SUD1 to obtain protein functional information. The
InterProScan database (http://www.ebi.ac.uk/Tools/pfa/iprscan/) (Hunter et al., 2009) was used
to search for conserved domains. A predicted Zinc finger, RING-CH-type motif (SMART Domains
database; Accession Number: SM00744) close to the N-terminus of SUD1 was identified between
residues 67 and 115. In order to gains insight into the SUD1 activity, a blastp search in the NCBI
database was performed to identify putative SUD1 orthologs, using the predicted proteome of
Saccharomyces cerevisiae (taxid4932), Homo sapiens (taxid9606), Mus musculus (taxid10090),
Drosophila melanogaster (taxid7227) and Caenorhabditis elegans (taxid6239). SUD1-like proteins

CHAPTER 5. IN SILICO STRUCTURAL AND PHYLOGENETIC ANALYSIS OF SUD1
80
seem to be well conserved, since homologous proteins encoded in the genome of all these
phylogenetically distant species were identified. The SUD1 orthologue in yeast and human was
Doa10a and TEB4b, respectively. These proteins have been extensively studied and a great amount
of information about their function and mode-of-action is currently available (Carvalho et al., 2006;
Kreft et al., 2006; Kreft and Hochstrasser, 2011).
The Doa10 protein is a component of the Endoplasmic Reticulum Associated Protein
Degradation (ERAD) complex, involved in the quality control that degrades misfolded ER proteins
(Swanson et al., 2001). The human TEB4 protein was identified as the most likely ortholog of yeast
Doa10 (Hassink et al., 2005). Doa10 and TEB4 are multispanning membrane proteins with
cytosolic RING finger domains that present E3 ubiquitin ligase activity (Swanson et al., 2001;
Hassink et al., 2005). A structural features analysis for this two proteins was already published,
revealing that the most homologous regions in Doa10 and TEB4 proteins are the N-terminal RING-
CH domain (36% identity) and an internal block of approximately 130 residues (30% identity) that
was designated as the TEB4-Doa10 (TD) domain (Swanson et al., 2001).
In the present thesis, an amino acid alignment of SUD1 with related proteins from
Saccharomyces cerevisiae (taxid4932), Homo sapiens (taxid9606), Mus musculus (taxid10090),
Drosophila melanogaster (taxid7227) and Caenorhabditis elegans (taxid6239) was performed
using PRALINE (http://www.ibi.vu.nl/programs/pralinewww/) (Simossis and Heringa, 2005), in
order to order to gains insight into the SUD1 structural features (Figure 5.1). The PRALINE software
performs multiple alignment containing options that optimize the information for each of the
inputed sequences. Using these options, homology-extended alignment (Simossis et al., 2005),
predicted secondary structure and transmembrane structural information were included in the
analysis. Once again, the alignment of SUD1 with related proteins from human, mouse, Drosophila
and C. elegans indicates that these proteins are well conserved among these species. Analysis of
amino acid identity and similarity of the full-length sequences of SUD1 homologs (Table 5.1 and
5.2) shows that the TEB4 from H. Sapiens and its metazoan orthologs (M. musculus,
D. melanogaster and C. elegans) appear to be the most related proteins within the present
alignment. Based on amino acid identity and similarity, TEB4 it is the most related SUD1 protein.
Results also place SUD1 closer to metazoan species than the yeast Doa10. The most conserved
regions of SUD1 with Doa10 and TEB4 are the N-terminal RING-CH domains (42.9% and
a Saccharomyces cerevisiae proteins are referred to by the relevant gene symbol, non‐italic, initial letter uppercase. b As in Arabidopsis thaliana proteins, Homo sapiens proteins are referred to by the relevant gene symbol, non‐italic, uppercase
letters.
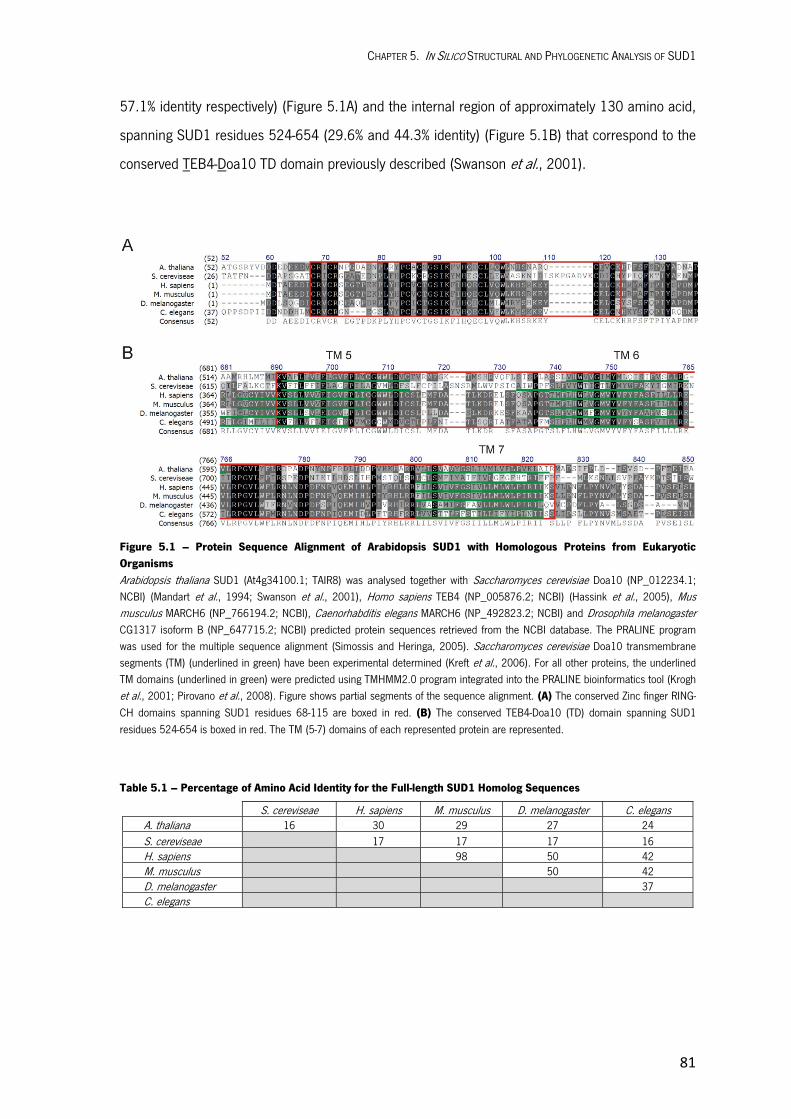
CHAPTER 5. IN SILICO STRUCTURAL AND PHYLOGENETIC ANALYSIS OF SUD1
81
57.1% identity respectively) (Figure 5.1A) and the internal region of approximately 130 amino acid,
spanning SUD1 residues 524-654 (29.6% and 44.3% identity) (Figure 5.1B) that correspond to the
conserved TEB4-Doa10 TD domain previously described (Swanson et al., 2001).
Figure 5.1 – Protein Sequence Alignment of Arabidopsis SUD1 with Homologous Proteins from Eukaryotic Organisms Arabidopsis thaliana SUD1 (At4g34100.1; TAIR8) was analysed together with Saccharomyces cerevisiae Doa10 (NP_012234.1; NCBI) (Mandart et al., 1994; Swanson et al., 2001), Homo sapiens TEB4 (NP_005876.2; NCBI) (Hassink et al., 2005), Mus musculus MARCH6 (NP_766194.2; NCBI), Caenorhabditis elegans MARCH6 (NP_492823.2; NCBI) and Drosophila melanogaster CG1317 isoform B (NP_647715.2; NCBI) predicted protein sequences retrieved from the NCBI database. The PRALINE program was used for the multiple sequence alignment (Simossis and Heringa, 2005). Saccharomyces cerevisiae Doa10 transmembrane segments (TM) (underlined in green) have been experimental determined (Kreft et al., 2006). For all other proteins, the underlined TM domains (underlined in green) were predicted using TMHMM2.0 program integrated into the PRALINE bioinformatics tool (Krogh et al., 2001; Pirovano et al., 2008). Figure shows partial segments of the sequence alignment. (A) The conserved Zinc finger RING-CH domains spanning SUD1 residues 68-115 are boxed in red. (B) The conserved TEB4-Doa10 (TD) domain spanning SUD1 residues 524-654 is boxed in red. The TM (5-7) domains of each represented protein are represented.
Table 5.1 – Percentage of Amino Acid Identity for the Full-length SUD1 Homolog Sequences
S. cereviseae H. sapiens M. musculus D. melanogaster C. elegans A. thaliana 16 30 29 27 24 S. cereviseae 17 17 17 16 H. sapiens 98 50 42 M. musculus 50 42 D. melanogaster 37 C. elegans
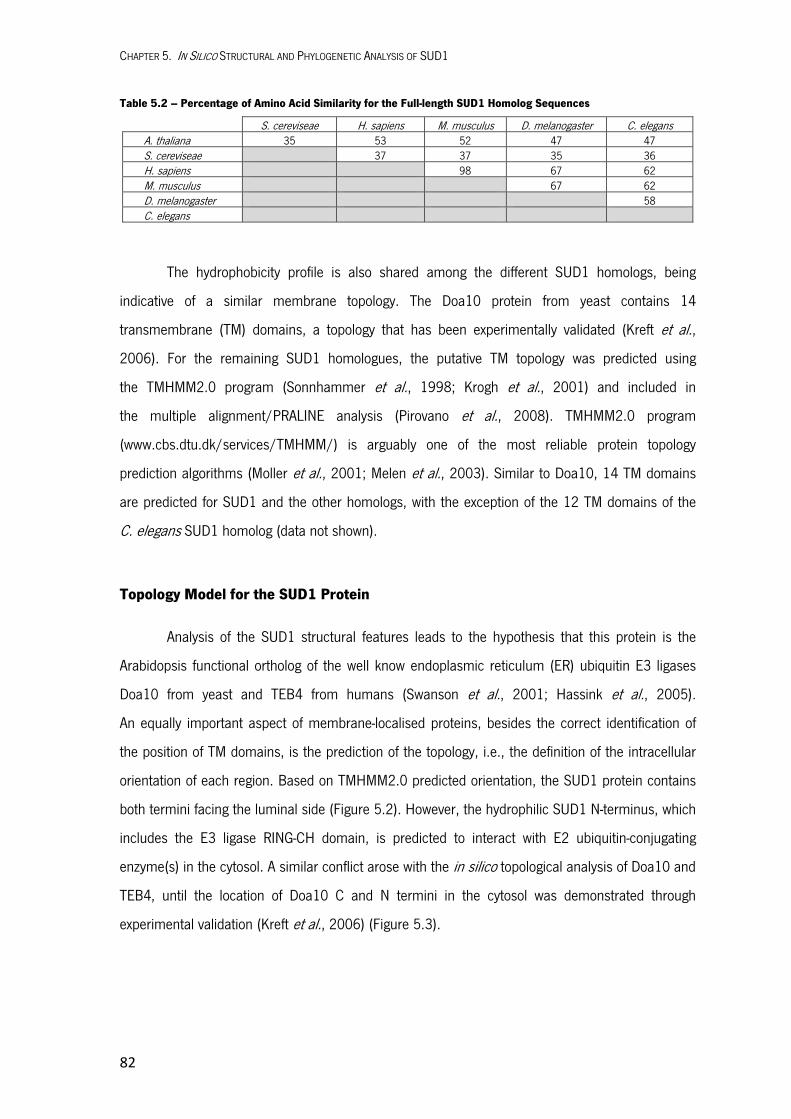
CHAPTER 5. IN SILICO STRUCTURAL AND PHYLOGENETIC ANALYSIS OF SUD1
82
Table 5.2 – Percentage of Amino Acid Similarity for the Full-length SUD1 Homolog Sequences
S. cereviseae H. sapiens M. musculus D. melanogaster C. elegans A. thaliana 35 53 52 47 47 S. cereviseae 37 37 35 36 H. sapiens 98 67 62 M. musculus 67 62 D. melanogaster 58 C. elegans
The hydrophobicity profile is also shared among the different SUD1 homologs, being
indicative of a similar membrane topology. The Doa10 protein from yeast contains 14
transmembrane (TM) domains, a topology that has been experimentally validated (Kreft et al.,
2006). For the remaining SUD1 homologues, the putative TM topology was predicted using
the TMHMM2.0 program (Sonnhammer et al., 1998; Krogh et al., 2001) and included in
the multiple alignment/PRALINE analysis (Pirovano et al., 2008). TMHMM2.0 program
(www.cbs.dtu.dk/services/TMHMM/) is arguably one of the most reliable protein topology
prediction algorithms (Moller et al., 2001; Melen et al., 2003). Similar to Doa10, 14 TM domains
are predicted for SUD1 and the other homologs, with the exception of the 12 TM domains of the
C. elegans SUD1 homolog (data not shown).
Topology Model for the SUD1 Protein
Analysis of the SUD1 structural features leads to the hypothesis that this protein is the
Arabidopsis functional ortholog of the well know endoplasmic reticulum (ER) ubiquitin E3 ligases
Doa10 from yeast and TEB4 from humans (Swanson et al., 2001; Hassink et al., 2005).
An equally important aspect of membrane-localised proteins, besides the correct identification of
the position of TM domains, is the prediction of the topology, i.e., the definition of the intracellular
orientation of each region. Based on TMHMM2.0 predicted orientation, the SUD1 protein contains
both termini facing the luminal side (Figure 5.2). However, the hydrophilic SUD1 N-terminus, which
includes the E3 ligase RING-CH domain, is predicted to interact with E2 ubiquitin-conjugating
enzyme(s) in the cytosol. A similar conflict arose with the in silico topological analysis of Doa10 and
TEB4, until the location of Doa10 C and N termini in the cytosol was demonstrated through
experimental validation (Kreft et al., 2006) (Figure 5.3).
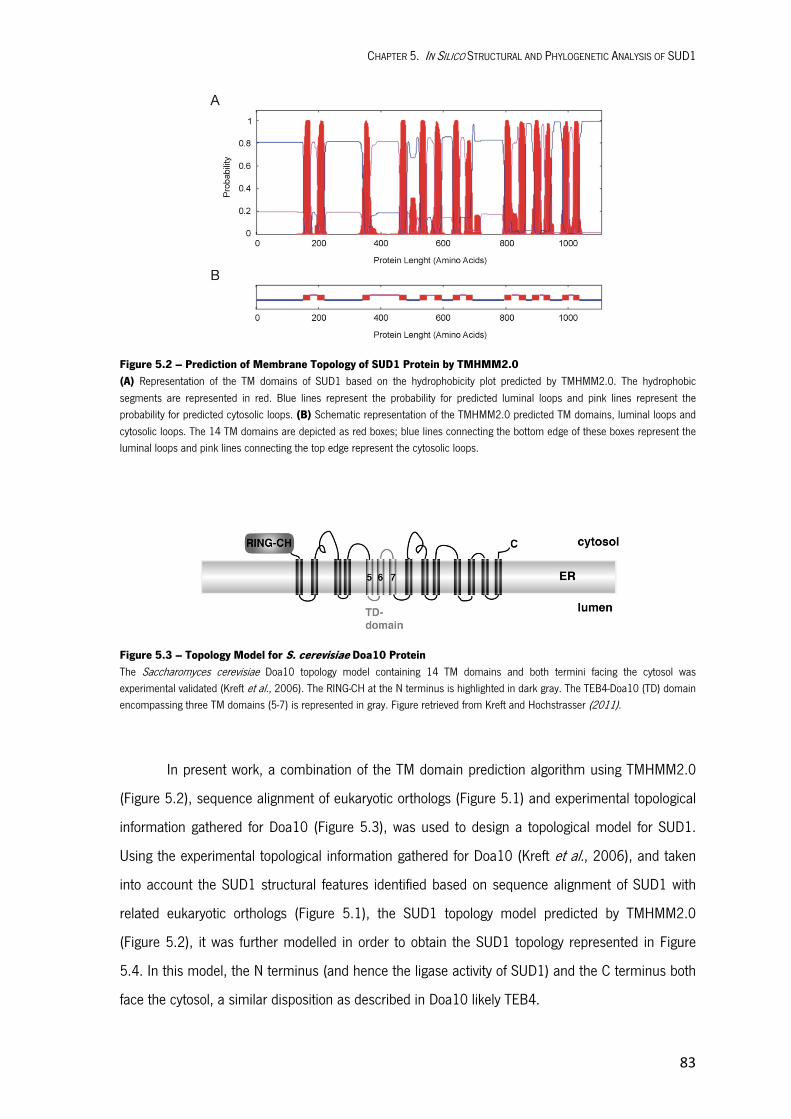
CHAPTER 5. IN SILICO STRUCTURAL AND PHYLOGENETIC ANALYSIS OF SUD1
83
Figure 5.2 – Prediction of Membrane Topology of SUD1 Protein by TMHMM2.0 (A) Representation of the TM domains of SUD1 based on the hydrophobicity plot predicted by TMHMM2.0. The hydrophobic segments are represented in red. Blue lines represent the probability for predicted luminal loops and pink lines represent the probability for predicted cytosolic loops. (B) Schematic representation of the TMHMM2.0 predicted TM domains, luminal loops and cytosolic loops. The 14 TM domains are depicted as red boxes; blue lines connecting the bottom edge of these boxes represent the luminal loops and pink lines connecting the top edge represent the cytosolic loops.
Figure 5.3 – Topology Model for S. cerevisiae Doa10 Protein The Saccharomyces cerevisiae Doa10 topology model containing 14 TM domains and both termini facing the cytosol was experimental validated (Kreft et al., 2006). The RING-CH at the N terminus is highlighted in dark gray. The TEB4-Doa10 (TD) domain encompassing three TM domains (5-7) is represented in gray. Figure retrieved from Kreft and Hochstrasser (2011).
In present work, a combination of the TM domain prediction algorithm using TMHMM2.0
(Figure 5.2), sequence alignment of eukaryotic orthologs (Figure 5.1) and experimental topological
information gathered for Doa10 (Figure 5.3), was used to design a topological model for SUD1.
Using the experimental topological information gathered for Doa10 (Kreft et al., 2006), and taken
into account the SUD1 structural features identified based on sequence alignment of SUD1 with
related eukaryotic orthologs (Figure 5.1), the SUD1 topology model predicted by TMHMM2.0
(Figure 5.2), it was further modelled in order to obtain the SUD1 topology represented in Figure
5.4. In this model, the N terminus (and hence the ligase activity of SUD1) and the C terminus both
face the cytosol, a similar disposition as described in Doa10 likely TEB4.

CHAPTER 5. IN SILICO STRUCTURAL AND PHYLOGENETIC ANALYSIS OF SUD1
84
Figure 5.4 – Topology Model for Arabidopsis SUD1 Protein and Amino Acid Mutations in the Corresponding sud1 Alleles Based on TMHMM2.0 prediction of membrane topology (Figure 5.1), A. thaliana SUD1 (At4g34100.1 protein) exhibits 14 TM domains, represented by dark-green membrane-spanning regions. Both N and C termini are suggested to be facing the cytosol, based on the experimentally validated Doa10 topology. The amino acid substitutions in a given sud1 allele are highlighted in light-green. Positions of these amino acid substitutions and the protein variants are indicated. The TMHMM2.0 predicted borders of each loop are also indicated. The RING-CH domain (residues 68-115) at the N terminus is shown in black. The conserved TD domain (residues 524-654) is highlighted in gray.
The conserved TD domain of Doa10 (Swanson et al., 2001) comprises TM5-TM7 domains,
with the cytosolic loop between TM6 and TM7 domains (cytosolic loop of TD domain) being the
most conserved Doa10 region with the exception of the RING domain (Kreft and Hochstrasser,
2011) (Figure 5.3). Based on sequence alignment (Figure 5.1B), SUD1 also contains a conserved
TD domain spanning the same three TM (5-7) domains. According to the proposed topology model
for SUD1, the most conserved stretch (SUD1 residues 597-561) is found within the cytosolic loop
of the TD domain (Figure 5.1B and Figure 5.4). Recent findings in Doa10 revels that TM5 domain
is highly sensitive to mutations reinforcing the importance of a conserved TD domain to preserve
the Doa10 function in orthologs from different organisms (Kreft and Hochstrasser, 2011). Based
on the model proposed in the present work, the second luminal loop presents the main difference
between SUD1 and Doa10. Doa10 protein presents a second luminal loop composed of only 3
residues while the second luminal loop of SUD1 is composed of 96 residues. This second luminal
loop is important in SUD1 because it was identified that sud1-22 mutant allele carries a mutation
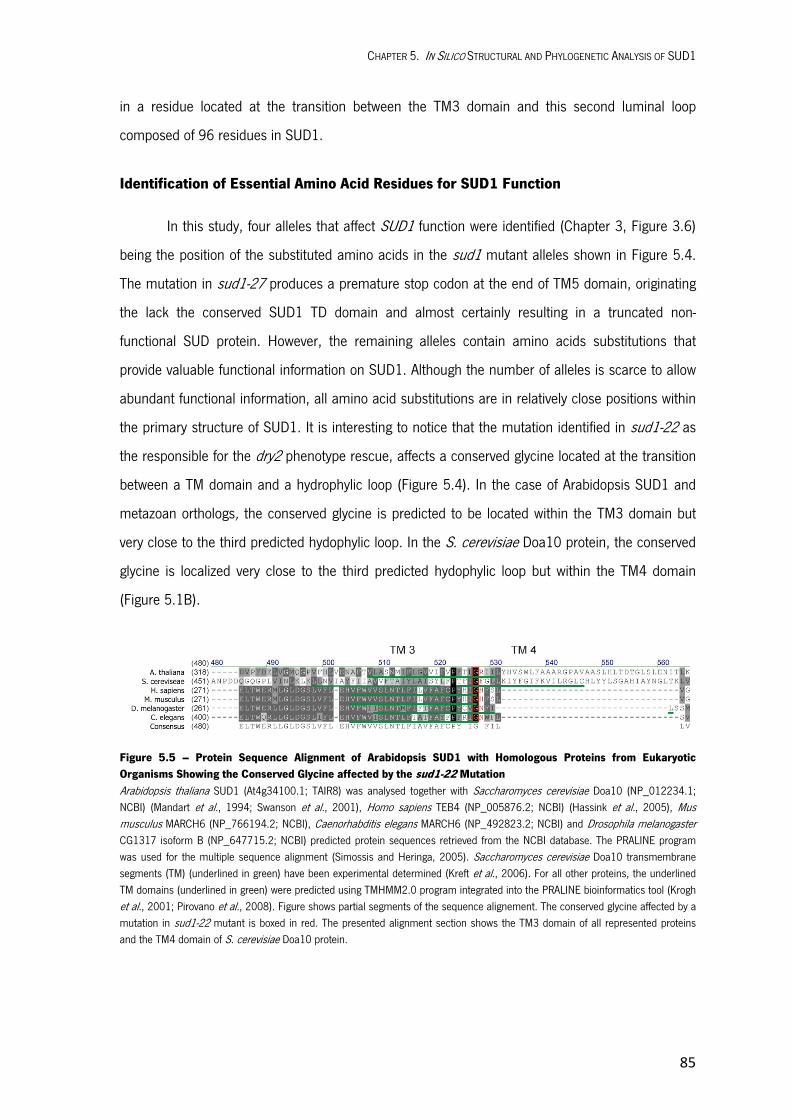
CHAPTER 5. IN SILICO STRUCTURAL AND PHYLOGENETIC ANALYSIS OF SUD1
85
in a residue located at the transition between the TM3 domain and this second luminal loop
composed of 96 residues in SUD1.
Identification of Essential Amino Acid Residues for SUD1 Function
In this study, four alleles that affect SUD1 function were identified (Chapter 3, Figure 3.6)
being the position of the substituted amino acids in the sud1 mutant alleles shown in Figure 5.4.
The mutation in sud1-27 produces a premature stop codon at the end of TM5 domain, originating
the lack the conserved SUD1 TD domain and almost certainly resulting in a truncated non-
functional SUD protein. However, the remaining alleles contain amino acids substitutions that
provide valuable functional information on SUD1. Although the number of alleles is scarce to allow
abundant functional information, all amino acid substitutions are in relatively close positions within
the primary structure of SUD1. It is interesting to notice that the mutation identified in sud1-22 as
the responsible for the dry2 phenotype rescue, affects a conserved glycine located at the transition
between a TM domain and a hydrophylic loop (Figure 5.4). In the case of Arabidopsis SUD1 and
metazoan orthologs, the conserved glycine is predicted to be located within the TM3 domain but
very close to the third predicted hydophylic loop. In the S. cerevisiae Doa10 protein, the conserved
glycine is localized very close to the third predicted hydophylic loop but within the TM4 domain
(Figure 5.1B).
Figure 5.5 – Protein Sequence Alignment of Arabidopsis SUD1 with Homologous Proteins from Eukaryotic Organisms Showing the Conserved Glycine affected by the sud1-22 Mutation Arabidopsis thaliana SUD1 (At4g34100.1; TAIR8) was analysed together with Saccharomyces cerevisiae Doa10 (NP_012234.1; NCBI) (Mandart et al., 1994; Swanson et al., 2001), Homo sapiens TEB4 (NP_005876.2; NCBI) (Hassink et al., 2005), Mus musculus MARCH6 (NP_766194.2; NCBI), Caenorhabditis elegans MARCH6 (NP_492823.2; NCBI) and Drosophila melanogaster CG1317 isoform B (NP_647715.2; NCBI) predicted protein sequences retrieved from the NCBI database. The PRALINE program was used for the multiple sequence alignment (Simossis and Heringa, 2005). Saccharomyces cerevisiae Doa10 transmembrane segments (TM) (underlined in green) have been experimental determined (Kreft et al., 2006). For all other proteins, the underlined TM domains (underlined in green) were predicted using TMHMM2.0 program integrated into the PRALINE bioinformatics tool (Krogh et al., 2001; Pirovano et al., 2008). Figure shows partial segments of the sequence alignement. The conserved glycine affected by a mutation in sud1-22 mutant is boxed in red. The presented alignment section shows the TM3 domain of all represented proteins and the TM4 domain of S. cerevisiae Doa10 protein.
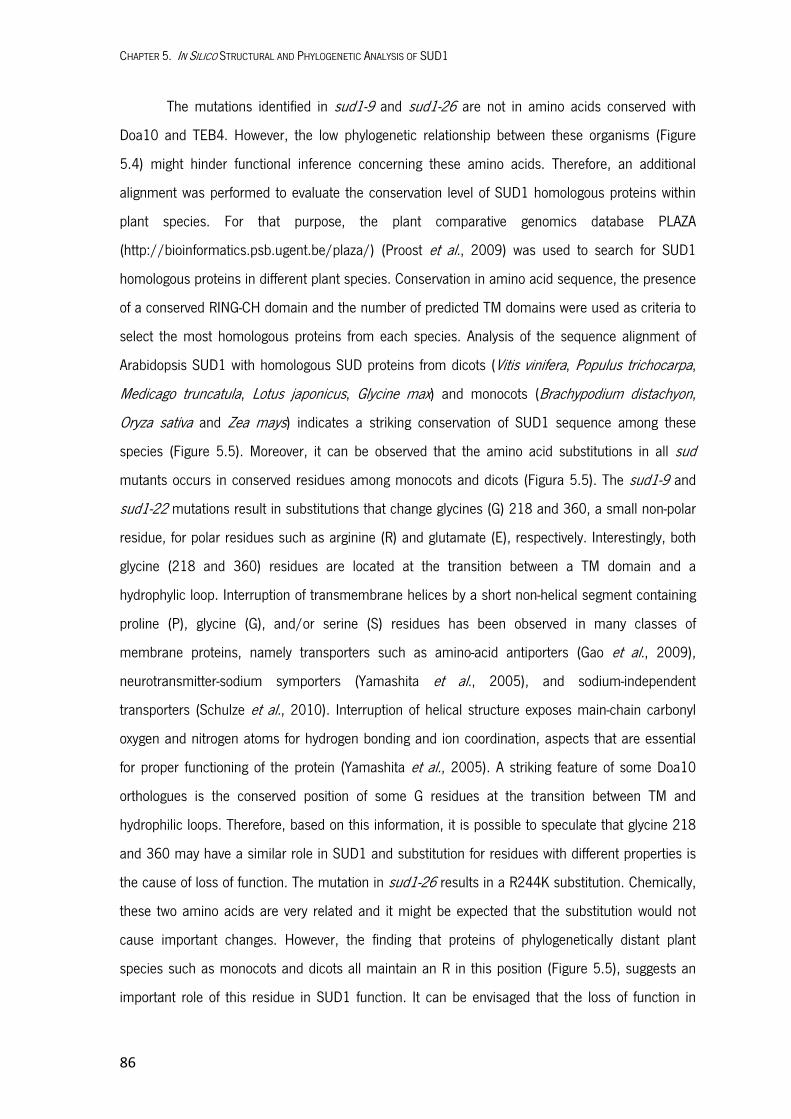
CHAPTER 5. IN SILICO STRUCTURAL AND PHYLOGENETIC ANALYSIS OF SUD1
86
The mutations identified in sud1-9 and sud1-26 are not in amino acids conserved with
Doa10 and TEB4. However, the low phylogenetic relationship between these organisms (Figure
5.4) might hinder functional inference concerning these amino acids. Therefore, an additional
alignment was performed to evaluate the conservation level of SUD1 homologous proteins within
plant species. For that purpose, the plant comparative genomics database PLAZA
(http://bioinformatics.psb.ugent.be/plaza/) (Proost et al., 2009) was used to search for SUD1
homologous proteins in different plant species. Conservation in amino acid sequence, the presence
of a conserved RING-CH domain and the number of predicted TM domains were used as criteria to
select the most homologous proteins from each species. Analysis of the sequence alignment of
Arabidopsis SUD1 with homologous SUD proteins from dicots (Vitis vinifera, Populus trichocarpa,
Medicago truncatula, Lotus japonicus, Glycine max) and monocots (Brachypodium distachyon,
Oryza sativa and Zea mays) indicates a striking conservation of SUD1 sequence among these
species (Figure 5.5). Moreover, it can be observed that the amino acid substitutions in all sud
mutants occurs in conserved residues among monocots and dicots (Figura 5.5). The sud1-9 and
sud1-22 mutations result in substitutions that change glycines (G) 218 and 360, a small non-polar
residue, for polar residues such as arginine (R) and glutamate (E), respectively. Interestingly, both
glycine (218 and 360) residues are located at the transition between a TM domain and a
hydrophylic loop. Interruption of transmembrane helices by a short non-helical segment containing
proline (P), glycine (G), and/or serine (S) residues has been observed in many classes of
membrane proteins, namely transporters such as amino-acid antiporters (Gao et al., 2009),
neurotransmitter-sodium symporters (Yamashita et al., 2005), and sodium-independent
transporters (Schulze et al., 2010). Interruption of helical structure exposes main-chain carbonyl
oxygen and nitrogen atoms for hydrogen bonding and ion coordination, aspects that are essential
for proper functioning of the protein (Yamashita et al., 2005). A striking feature of some Doa10
orthologues is the conserved position of some G residues at the transition between TM and
hydrophilic loops. Therefore, based on this information, it is possible to speculate that glycine 218
and 360 may have a similar role in SUD1 and substitution for residues with different properties is
the cause of loss of function. The mutation in sud1-26 results in a R244K substitution. Chemically,
these two amino acids are very related and it might be expected that the substitution would not
cause important changes. However, the finding that proteins of phylogenetically distant plant
species such as monocots and dicots all maintain an R in this position (Figure 5.5), suggests an
important role of this residue in SUD1 function. It can be envisaged that the loss of function in
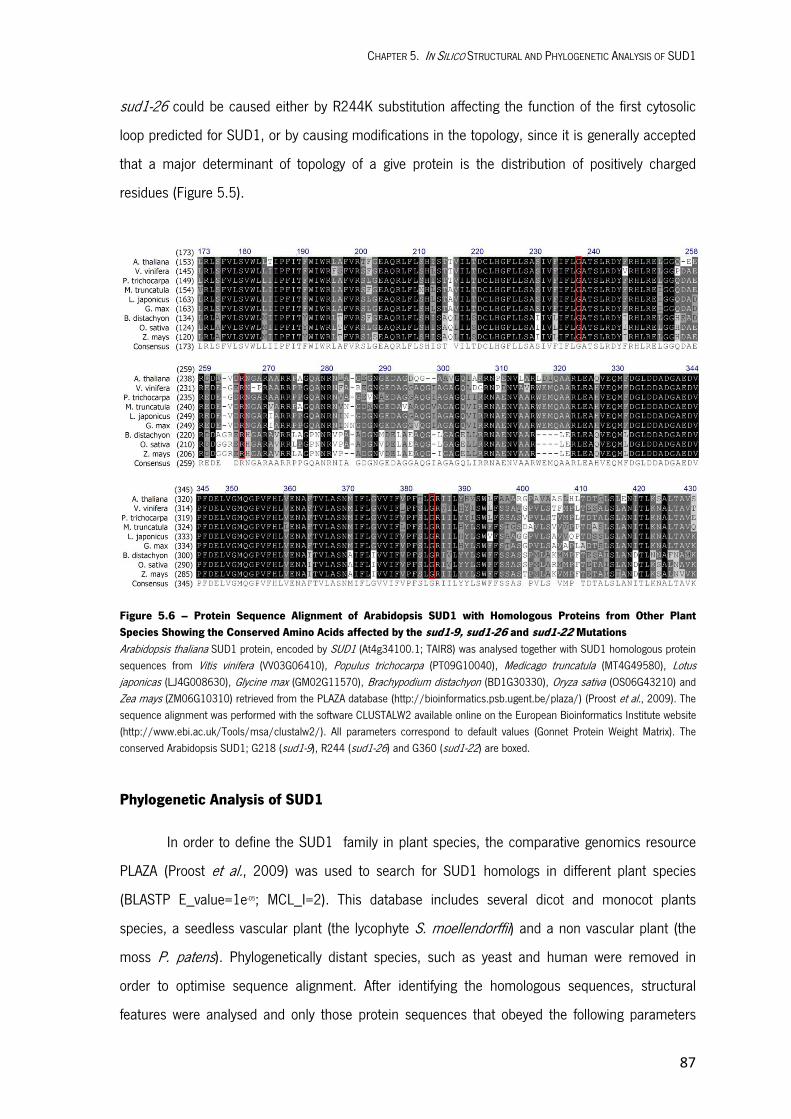
CHAPTER 5. IN SILICO STRUCTURAL AND PHYLOGENETIC ANALYSIS OF SUD1
87
sud1-26 could be caused either by R244K substitution affecting the function of the first cytosolic
loop predicted for SUD1, or by causing modifications in the topology, since it is generally accepted
that a major determinant of topology of a give protein is the distribution of positively charged
residues (Figure 5.5).
Figure 5.6 – Protein Sequence Alignment of Arabidopsis SUD1 with Homologous Proteins from Other Plant Species Showing the Conserved Amino Acids affected by the sud1-9, sud1-26 and sud1-22 Mutations Arabidopsis thaliana SUD1 protein, encoded by SUD1 (At4g34100.1; TAIR8) was analysed together with SUD1 homologous protein sequences from Vitis vinifera (VV03G06410), Populus trichocarpa (PT09G10040), Medicago truncatula (MT4G49580), Lotus japonicas (LJ4G008630), Glycine max (GM02G11570), Brachypodium distachyon (BD1G30330), Oryza sativa (OS06G43210) and Zea mays (ZM06G10310) retrieved from the PLAZA database (http://bioinformatics.psb.ugent.be/plaza/) (Proost et al., 2009). The sequence alignment was performed with the software CLUSTALW2 available online on the European Bioinformatics Institute website (http://www.ebi.ac.uk/Tools/msa/clustalw2/). All parameters correspond to default values (Gonnet Protein Weight Matrix). The conserved Arabidopsis SUD1; G218 (sud1-9), R244 (sud1-26) and G360 (sud1-22) are boxed.
Phylogenetic Analysis of SUD1
In order to define the SUD1 family in plant species, the comparative genomics resource
PLAZA (Proost et al., 2009) was used to search for SUD1 homologs in different plant species
(BLASTP E_value=1e-05; MCL_I=2). This database includes several dicot and monocot plants
species, a seedless vascular plant (the lycophyte S. moellendorffii) and a non vascular plant (the
moss P. patens). Phylogenetically distant species, such as yeast and human were removed in
order to optimise sequence alignment. After identifying the homologous sequences, structural
features were analysed and only those protein sequences that obeyed the following parameters
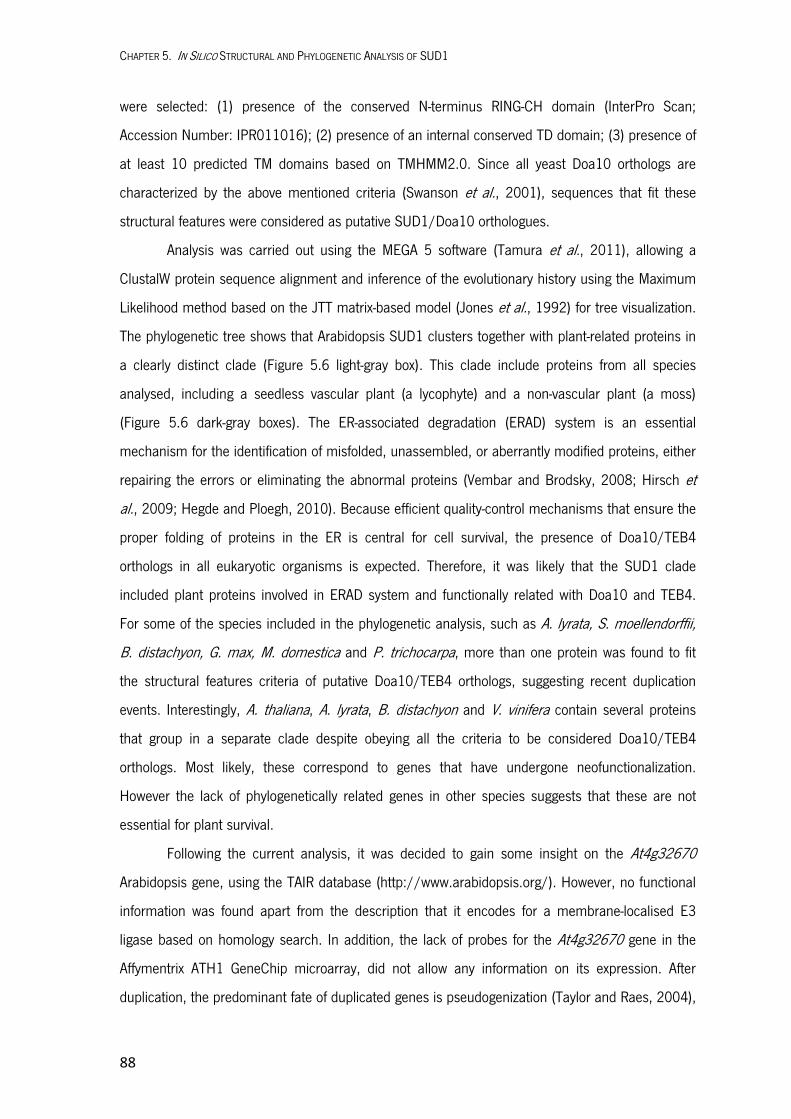
CHAPTER 5. IN SILICO STRUCTURAL AND PHYLOGENETIC ANALYSIS OF SUD1
88
were selected: (1) presence of the conserved N-terminus RING-CH domain (InterPro Scan;
Accession Number: IPR011016); (2) presence of an internal conserved TD domain; (3) presence of
at least 10 predicted TM domains based on TMHMM2.0. Since all yeast Doa10 orthologs are
characterized by the above mentioned criteria (Swanson et al., 2001), sequences that fit these
structural features were considered as putative SUD1/Doa10 orthologues.
Analysis was carried out using the MEGA 5 software (Tamura et al., 2011), allowing a
ClustalW protein sequence alignment and inference of the evolutionary history using the Maximum
Likelihood method based on the JTT matrix-based model (Jones et al., 1992) for tree visualization.
The phylogenetic tree shows that Arabidopsis SUD1 clusters together with plant-related proteins in
a clearly distinct clade (Figure 5.6 light-gray box). This clade include proteins from all species
analysed, including a seedless vascular plant (a lycophyte) and a non-vascular plant (a moss)
(Figure 5.6 dark-gray boxes). The ER-associated degradation (ERAD) system is an essential
mechanism for the identification of misfolded, unassembled, or aberrantly modified proteins, either
repairing the errors or eliminating the abnormal proteins (Vembar and Brodsky, 2008; Hirsch et
al., 2009; Hegde and Ploegh, 2010). Because efficient quality-control mechanisms that ensure the
proper folding of proteins in the ER is central for cell survival, the presence of Doa10/TEB4
orthologs in all eukaryotic organisms is expected. Therefore, it was likely that the SUD1 clade
included plant proteins involved in ERAD system and functionally related with Doa10 and TEB4.
For some of the species included in the phylogenetic analysis, such as A. lyrata, S. moellendorffii,
B. distachyon, G. max, M. domestica and P. trichocarpa, more than one protein was found to fit
the structural features criteria of putative Doa10/TEB4 orthologs, suggesting recent duplication
events. Interestingly, A. thaliana, A. lyrata, B. distachyon and V. vinifera contain several proteins
that group in a separate clade despite obeying all the criteria to be considered Doa10/TEB4
orthologs. Most likely, these correspond to genes that have undergone neofunctionalization.
However the lack of phylogenetically related genes in other species suggests that these are not
essential for plant survival.
Following the current analysis, it was decided to gain some insight on the At4g32670
Arabidopsis gene, using the TAIR database (http://www.arabidopsis.org/). However, no functional
information was found apart from the description that it encodes for a membrane-localised E3
ligase based on homology search. In addition, the lack of probes for the At4g32670 gene in the
Affymentrix ATH1 GeneChip microarray, did not allow any information on its expression. After
duplication, the predominant fate of duplicated genes is pseudogenization (Taylor and Raes, 2004),
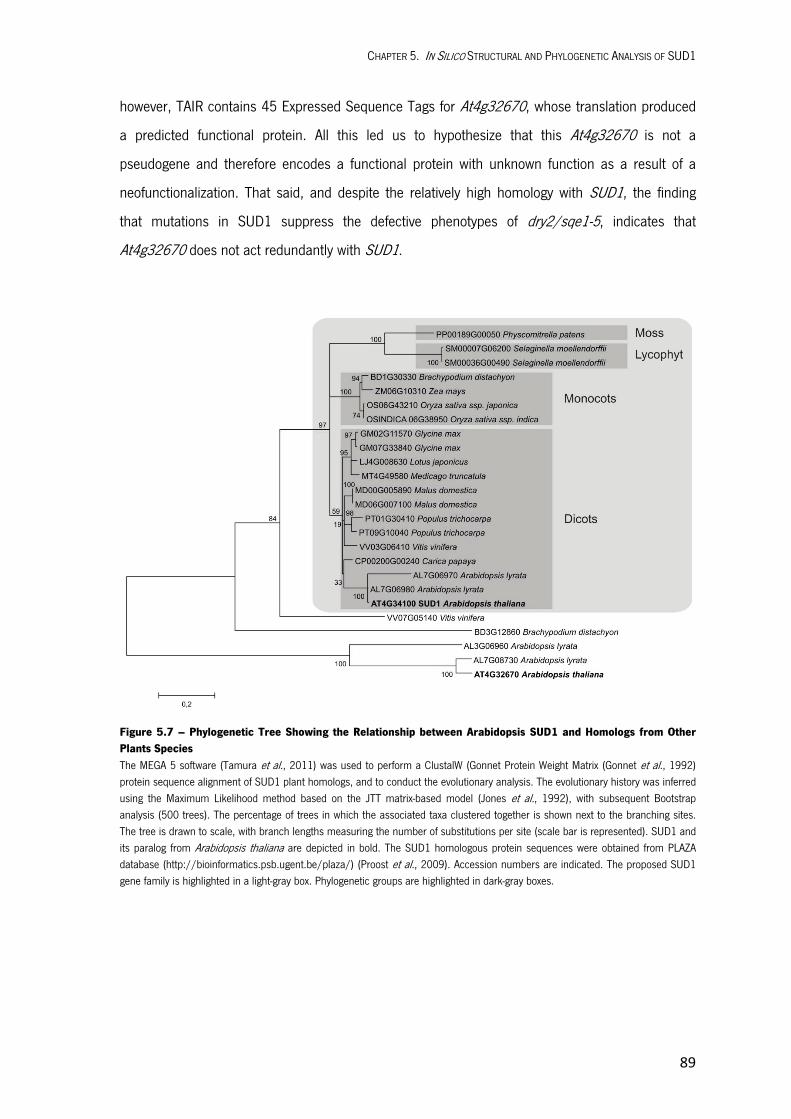
CHAPTER 5. IN SILICO STRUCTURAL AND PHYLOGENETIC ANALYSIS OF SUD1
89
however, TAIR contains 45 Expressed Sequence Tags for At4g32670, whose translation produced
a predicted functional protein. All this led us to hypothesize that this At4g32670 is not a
pseudogene and therefore encodes a functional protein with unknown function as a result of a
neofunctionalization. That said, and despite the relatively high homology with SUD1, the finding
that mutations in SUD1 suppress the defective phenotypes of dry2/sqe1-5, indicates that
At4g32670 does not act redundantly with SUD1.
Figure 5.7 – Phylogenetic Tree Showing the Relationship between Arabidopsis SUD1 and Homologs from Other Plants Species The MEGA 5 software (Tamura et al., 2011) was used to perform a ClustalW (Gonnet Protein Weight Matrix (Gonnet et al., 1992) protein sequence alignment of SUD1 plant homologs, and to conduct the evolutionary analysis. The evolutionary history was inferred using the Maximum Likelihood method based on the JTT matrix-based model (Jones et al., 1992), with subsequent Bootstrap analysis (500 trees). The percentage of trees in which the associated taxa clustered together is shown next to the branching sites. The tree is drawn to scale, with branch lengths measuring the number of substitutions per site (scale bar is represented). SUD1 and its paralog from Arabidopsis thaliana are depicted in bold. The SUD1 homologous protein sequences were obtained from PLAZA database (http://bioinformatics.psb.ugent.be/plaza/) (Proost et al., 2009). Accession numbers are indicated. The proposed SUD1 gene family is highlighted in a light-gray box. Phylogenetic groups are highlighted in dark-gray boxes.
CHAPTER 5. IN SILICO STRUCTURAL AND PHYLOGENETIC ANALYSIS OF SUD1
90
5.3. MATERIALS AND METHODS
Bioinformatic Tools Used for in Silico Structural Analysis of SUD1
The InterProScan database (http://www.ebi.ac.uk/Tools/pfa/iprscan/) (Hunter et al., 2009) was used to search for conserved domains of the SUD1 protein. The NCBI blastp tool (http://blast.ncbi.nlm.nih.gov/Blast.cgi?PAGE=Proteins) was used to identify putative SUD1 orthologs, using the predicted proteome of Saccharomyces cerevisiae (taxid4932), Homo sapiens (taxid9606), Mus musculus (taxid10090), Drosophila melanogaster (taxid7227) and Caenorhabditis elegans (taxid6239). The protein sequence alignment of Arabidopsis SUD1 with homologous proteins from phylogenetically unrelated eukaryotic organisms was performed using the multiple sequence alignment program PRofile ALIgNEment (PRALINE) (http://www.ibi.vu.nl/programs/pralinewww/) (Simossis and Heringa, 2005). The PRALINE alignment was performed using the following parameters: default BLOSUM62 residue exchange matrices; the PSI-BLAST pre-profile processing strategy for homology-extended alignment (Simossis et al., 2005); integration of secondary structure using PSIPRED (Jones, 1999), and transmembrane structure information (Pirovano et al., 2008) using TMHMM v2.0 (Krogh et al., 2001) into the alignment process. The AlignX program, part of the vectorNTI suite case, was used to visualise the alignment of the sequences previously performed using PRALINE, using the color coded according to similarities as decribed in Table 5.3.
The TMHMM2.0 program (www.cbs.dtu.dk/services/TMHMM/) was used to predict the putative TM domain topology of SUD1 based on the hydrophobicity plot (Krogh et al., 2001). The plant comparative genomics resource PLAZA database (http://bioinformatics.psb.ugent.be/plaza/) (Proost et al., 2009) was used to search for SUD1 homologous protein sequences in different plant species. The protein sequence alignment of Arabidopsis SUD1 with homologous proteins from other plant species was performed with the software CLUSTALW2, available at European Bioinformatics Institute (http://www.ebi.ac.uk/ Tools/msa/clustalw2/). All parameters corresponded to default values (Gonnet Protein Weight Matrix (Gonnet et al., 1992)).
Table 5.3 – Color Code used to Highlight Protein Sequences According to Similarities
Residues Amino Acid Letter and Background Colors
Non-similar Black letters on white background Conservative White letters on dark-gray background Block of similar Black letters on gray background Weakly similar Black letters on light-gray background Identical White letters on black background
Bioinformatic Tools Used for Phylogenetic Analysis of SUD1
The MEGA 5 software (Tamura et al., 2011) was used to perform a ClustalW (Gonnet Protein Weight Matrix) (Gonnet et al., 1992) protein sequence alignment of SUD1 plant homologs included in the phylogenetic analysis of SUD1, and to conduct the evolutionary analysis for tree visualization. The evolutionary history was inferred using the Maximum Likelihood method based on the JTT matrix-based model (Jones et al., 1992), with subsequent Bootstrap analysis (500 trees).
Chapter 6
Functional Characterization of
Arabidopsis thaliana SUD1, HRD1A and HRD1B
CONTENTS
6.1. INTRODUCTION 6.2. RESULTS AND DISCUSSION
Molecular Cloning of SUD1 in E. coli SUD1 Complementation of Yeast doa10Δ Mutation
Degradation of Yeast Doa10 Substrates in doa10-G498E Mutant Cells AtHRD1 Complementation of Yeast hrd1Δ Mutation
Investigating the Function of the Arabidopsis ERAD E3-ligases
6.3. MATERIALS AND METHODS

CHAPTER 6. FUNCTIONAL CHARACTERIZATION OF ARABIDOPSIS THALIANA SUD1, HRD1A AND HRD1B
93
6.1. INTRODUCTION
In the previous chapter, analysis of the structural features and phylogenetic relationships of
SUD1 indicated that this protein was the likely Arabidopsis ortholog of the well know endoplasmic
reticulum (ER) localized ubiquitin E3 ligases Doa10a protein from yeast (Swanson et al., 2001) and
TEB4 protein from human (Hassink et al., 2005). The Doa10 protein has been extensively studied
in yeast and is a component of the ERAD complex, involved in the quality control that degrades
misfolded ER proteins (Swanson et al., 2001; Carvalho et al., 2006; Kreft and Hochstrasser,
2011). However, ERAD is not restricted to aberrant proteins and is also employed in the feedback
regulation of normal proteins such as the HMG-coenzyme (CoA) reductase (HMGR) in yeast
(Hampton and Garza, 2009). There are two different ERAD complexes in yeast, the Hrd1 complex
and the Doa10 complex (Hampton, 2002). Numerous genetic analyses were conducted in yeast to
find the HRD genes responsible for Hmg-CoA Reductase Degradation, and only the Hrd1 ERAD
complex has been associated with regulated degradation of HMGR (Hampton et al., 1996).
In Arabidopsis thaliana, two redundant proteins were identified as the most likely orthologs of
yeast Hrd1, At3g16090 and At1g65040, which were named AtHRD1A and AtHRD1B, respectively
(Su et al., 2011).
As was detailed, most of the knowledge on ERAD came from studies in yeast and
mammalian systems (Vembar and Brodsky, 2008; Smith et al., 2011). By contrast, little is known
about the molecular components and biochemical mechanism of plant ERAD, despite the finding
that similar ERAD processes do operate in plant cells to remove misfolded proteins (Muller et al.,
2005; Yamamoto et al., 2010). As most components of ERAD are evolutionarily conserved, the
basic conclusions derived from studies performed using yeast are likely to be applicable to all
eukaryotes.
The present chapter describes the series of experiments that were conducted as an effort
to functionally characterize the likely Arabidopsis DOA10 ortholog gene SUD1, using yeast
complementation. Because SUD1 is a putative member of the ERAD pathway, the two Arabidopsis
redundant genes AtHRD1A and AtHRD1B, which are the most likely orthologs of the yeast ERAD
compoment Hrd1, were additionally included into the present study.
a While Arabidopsis thaliana proteins are referred to by the relevant gene symbol, non‐italic, uppercase letters, Saccharomyces cerevisiae proteins are referred to by the relevant gene symbol, non‐italic, initial letter uppercase.
CHAPTER 6. FUNCTIONAL CHARACTERIZATION OF ARABIDOPSIS THALIANA SUD1, HRD1A AND HRD1B
94
In order to take advantage of all the resources and know-how available from
Saccharomyces cerevisiae, the present work was performed on the “Organelle biogenesis and
homeostasis Laboratory at Center for Genomic Regulation”, under the supervision of Dr. Pedro
Carvalho in Barcelona, Spain.
6.2. RESULTS AND DISCUSSION
Molecular Cloning of SUD1 in E. coli
The coding sequence (CDS) of Arabidopsis SUD1 was initially sub-cloned into the pGEM-T
Easy vector that allows blue/white screening for recombinants and is commonly used for cloning
PCR products. The SUD1 cDNA from wild-type (Col-0) young seedlings was amplified using a
proofreading DNA polimerase and the blunt-ended PCR product was adenilated and subsequently
cloning into pGEM-T Easy vector was attempted. E. coli competent cells were transformed to allow
the selective propagation of the plasmid, thus allowing for convenient amplification and subsequent
DNA manipulation of SUD1 in vitro. Two independent E. coli transformations using different
competent cells strains (XL1-Blue and DH5α) were performed. However, the screening for
transformants containing the insert revealed no positive clones, while transformations of control
inserts cloned into the pGEM-T Easy vector produced a large number of recombinant clones.
As cloning the CDS of SUD1 into pGEM-T Easy was not successful, another approach was
employed. First, the PCR product amplified with SUD1 cDNA-specific primers (flanked by restriction
sites) from wild-type (Col-0) seedlings was sequenced confirming that the amplified fragment
corresponded to the SUD1 coding region predicted by the TAIR database (At4g34100). Second, the
amplified CDS of SUD1 was cloned using restriction sites into the pRS316 shuttle vector.
The shuttle vectors are used for gene cloning in Saccharomyces cerevisiae, but are also capable of
replication in E. coli. The transformation of E. coli competent cells with the CDS of SUD1 cloned
into the pRS316 shuttle vector produced only two positive clones that were further confirmed by
colony PCR. Similar to the pGEM-T Easy vector, transformation of the same shuttle vector
containing a control insert (positive control) produced more than 40 positive clones, confirmed by
colony PCR. The sequencing of the two positive clones indicated that a fragment of 686 bp
(nucleotides 344-1029) was excised from the CDS of SUD1. This strongly suggests that the full-
length SUD1 CDS is not stably maintained in E. coli, thus explaining the absence in cDNA libraries
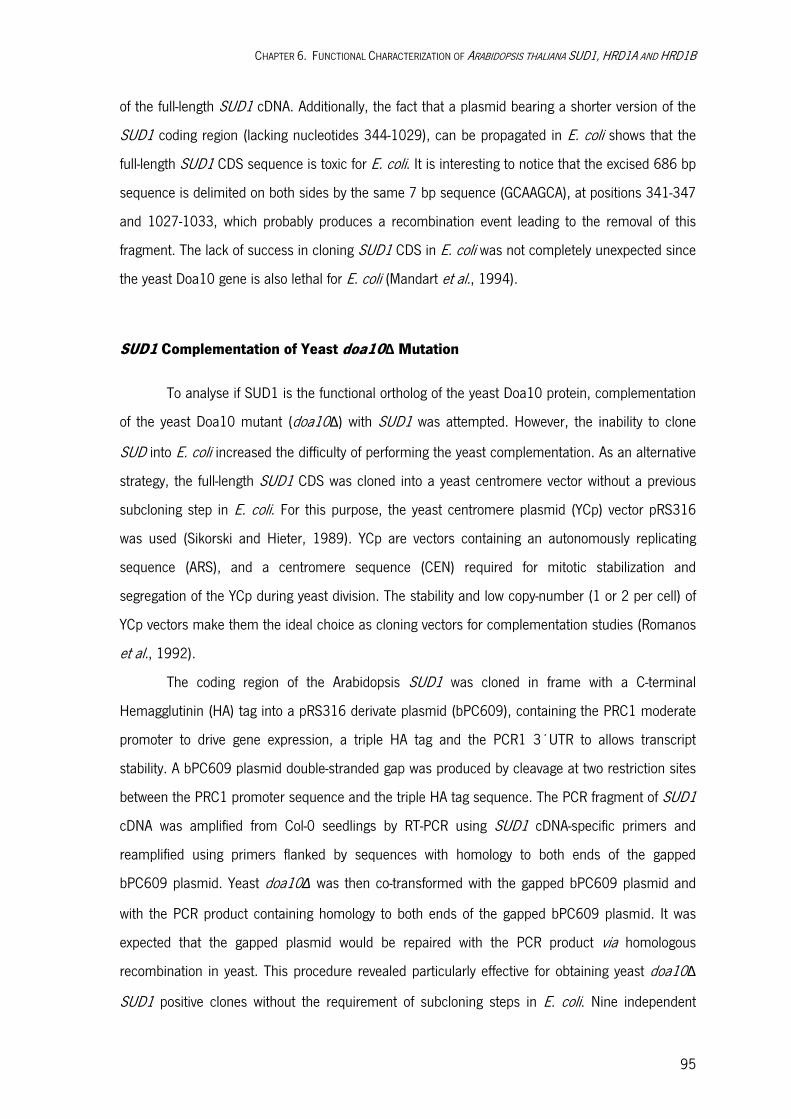
CHAPTER 6. FUNCTIONAL CHARACTERIZATION OF ARABIDOPSIS THALIANA SUD1, HRD1A AND HRD1B
95
of the full-length SUD1 cDNA. Additionally, the fact that a plasmid bearing a shorter version of the
SUD1 coding region (lacking nucleotides 344-1029), can be propagated in E. coli shows that the
full-length SUD1 CDS sequence is toxic for E. coli. It is interesting to notice that the excised 686 bp
sequence is delimited on both sides by the same 7 bp sequence (GCAAGCA), at positions 341-347
and 1027-1033, which probably produces a recombination event leading to the removal of this
fragment. The lack of success in cloning SUD1 CDS in E. coli was not completely unexpected since
the yeast Doa10 gene is also lethal for E. coli (Mandart et al., 1994).
SUD1 Complementation of Yeast doa10Δ Mutation
To analyse if SUD1 is the functional ortholog of the yeast Doa10 protein, complementation
of the yeast Doa10 mutant (doa10Δ) with SUD1 was attempted. However, the inability to clone
SUD into E. coli increased the difficulty of performing the yeast complementation. As an alternative
strategy, the full-length SUD1 CDS was cloned into a yeast centromere vector without a previous
subcloning step in E. coli. For this purpose, the yeast centromere plasmid (YCp) vector pRS316
was used (Sikorski and Hieter, 1989). YCp are vectors containing an autonomously replicating
sequence (ARS), and a centromere sequence (CEN) required for mitotic stabilization and
segregation of the YCp during yeast division. The stability and low copy-number (1 or 2 per cell) of
YCp vectors make them the ideal choice as cloning vectors for complementation studies (Romanos
et al., 1992).
The coding region of the Arabidopsis SUD1 was cloned in frame with a C-terminal
Hemagglutinin (HA) tag into a pRS316 derivate plasmid (bPC609), containing the PRC1 moderate
promoter to drive gene expression, a triple HA tag and the PCR1 3´UTR to allows transcript
stability. A bPC609 plasmid double-stranded gap was produced by cleavage at two restriction sites
between the PRC1 promoter sequence and the triple HA tag sequence. The PCR fragment of SUD1
cDNA was amplified from Col-0 seedlings by RT-PCR using SUD1 cDNA-specific primers and
reamplified using primers flanked by sequences with homology to both ends of the gapped
bPC609 plasmid. Yeast doa10Δ was then co-transformed with the gapped bPC609 plasmid and
with the PCR product containing homology to both ends of the gapped bPC609 plasmid. It was
expected that the gapped plasmid would be repaired with the PCR product via homologous
recombination in yeast. This procedure revealed particularly effective for obtaining yeast doa10Δ
SUD1 positive clones without the requirement of subcloning steps in E. coli. Nine independent
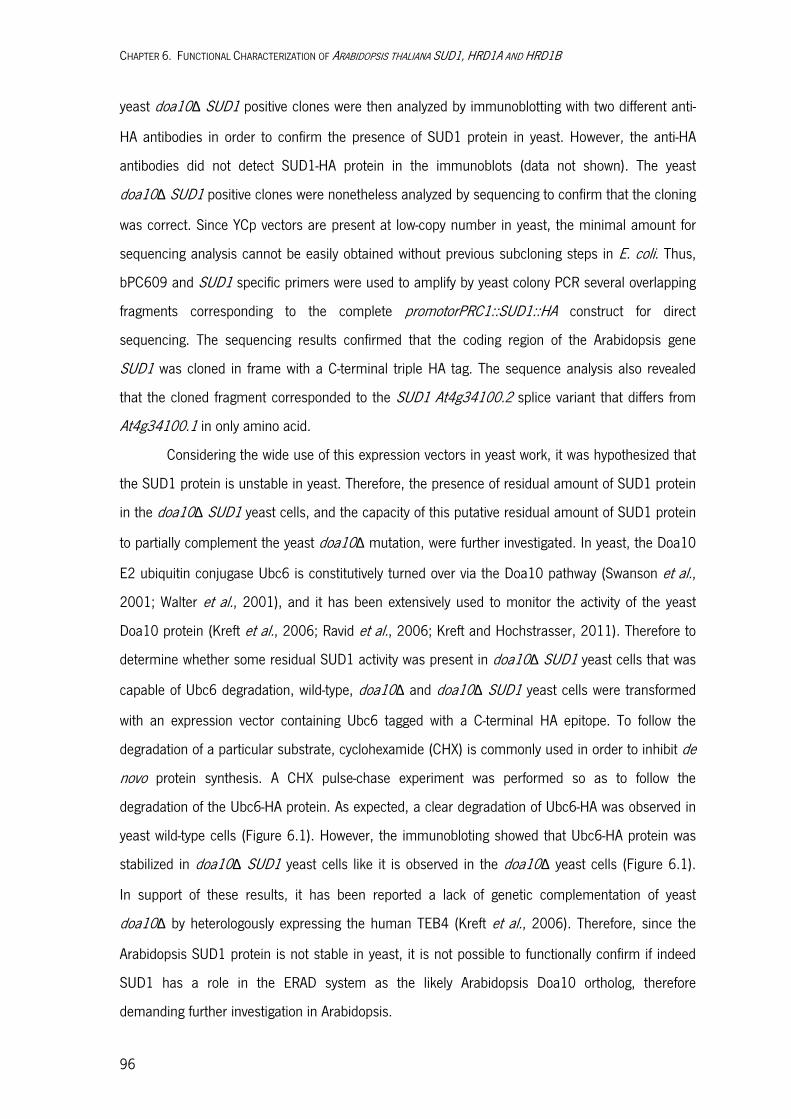
CHAPTER 6. FUNCTIONAL CHARACTERIZATION OF ARABIDOPSIS THALIANA SUD1, HRD1A AND HRD1B
96
yeast doa10Δ SUD1 positive clones were then analyzed by immunoblotting with two different anti-
HA antibodies in order to confirm the presence of SUD1 protein in yeast. However, the anti-HA
antibodies did not detect SUD1-HA protein in the immunoblots (data not shown). The yeast
doa10Δ SUD1 positive clones were nonetheless analyzed by sequencing to confirm that the cloning
was correct. Since YCp vectors are present at low-copy number in yeast, the minimal amount for
sequencing analysis cannot be easily obtained without previous subcloning steps in E. coli. Thus,
bPC609 and SUD1 specific primers were used to amplify by yeast colony PCR several overlapping
fragments corresponding to the complete promotorPRC1::SUD1::HA construct for direct
sequencing. The sequencing results confirmed that the coding region of the Arabidopsis gene
SUD1 was cloned in frame with a C-terminal triple HA tag. The sequence analysis also revealed
that the cloned fragment corresponded to the SUD1 At4g34100.2 splice variant that differs from
At4g34100.1 in only amino acid.
Considering the wide use of this expression vectors in yeast work, it was hypothesized that
the SUD1 protein is unstable in yeast. Therefore, the presence of residual amount of SUD1 protein
in the doa10Δ SUD1 yeast cells, and the capacity of this putative residual amount of SUD1 protein
to partially complement the yeast doa10Δ mutation, were further investigated. In yeast, the Doa10
E2 ubiquitin conjugase Ubc6 is constitutively turned over via the Doa10 pathway (Swanson et al.,
2001; Walter et al., 2001), and it has been extensively used to monitor the activity of the yeast
Doa10 protein (Kreft et al., 2006; Ravid et al., 2006; Kreft and Hochstrasser, 2011). Therefore to
determine whether some residual SUD1 activity was present in doa10Δ SUD1 yeast cells that was
capable of Ubc6 degradation, wild-type, doa10Δ and doa10Δ SUD1 yeast cells were transformed
with an expression vector containing Ubc6 tagged with a C-terminal HA epitope. To follow the
degradation of a particular substrate, cyclohexamide (CHX) is commonly used in order to inhibit de
novo protein synthesis. A CHX pulse-chase experiment was performed so as to follow the
degradation of the Ubc6-HA protein. As expected, a clear degradation of Ubc6-HA was observed in
yeast wild-type cells (Figure 6.1). However, the immunobloting showed that Ubc6-HA protein was
stabilized in doa10Δ SUD1 yeast cells like it is observed in the doa10Δ yeast cells (Figure 6.1).
In support of these results, it has been reported a lack of genetic complementation of yeast
doa10Δ by heterologously expressing the human TEB4 (Kreft et al., 2006). Therefore, since the
Arabidopsis SUD1 protein is not stable in yeast, it is not possible to functionally confirm if indeed
SUD1 has a role in the ERAD system as the likely Arabidopsis Doa10 ortholog, therefore
demanding further investigation in Arabidopsis.
CHAPTER 6. FUNCTIONAL CHARACTERIZATION OF ARABIDOPSIS THALIANA SUD1, HRD1A AND HRD1B
97
Figure 6.1 – SUD1 Complementation of the Yeast doa10Δ Mutation
The content of the yeast Doa10 substrate Ubc6-HA was analyzed by immunoblotting in transformed wild-type, Doa10Δ and Doa10Δ
SUD1 yeast cells expressing the Ubc6-HA gene, following inhibition of translation with cycloheximide (CHX). Equal amounts of total protein extracts from exponentially growing cells treated with CHX were separated by SDS/PAGE and analyzed by immunoblotting, with anti-HA antibody for Ubc6-HA detection and anti-Tub1 for yeast Tub1 detection (loading control). Weights from a protein molecular weight ladder are represented.
Degradation of Yeast Doa10 Substrates in doa10-G498E Mutant Cells
In the present thesis, it was described how second-site mutations in the dry2 background
of Arabidopsis plants suppress the drought hypersensitivity phenotype observed in the dry2
mutant. The positional-cloning of this dry2 suppressor mutations lead to the identification of SUD1
that encodes the Arabidopsis ortholog of the yeast Doa10 protein known to be involved in the ERAD
system. The present study already referred four mutant alleles that affect SUD1 function. The sud1-
22 suppressor has a point mutation in the 3rd exon of SUD1, resulting in a glycine by glutamate
substitution (G360E). This suppression is the only one caused by a substitution of a clearly
conserved amino acid residue in yeast Doa10 (corresponding to Gly498 in Doa10), and also in
others orthologs from phylogenetically unrelated eukaryotic organisms (Chapter 5, Figure 5.5). This
conservation suggests an essential role of this residue for function in this class of proteins.
The yeast ubiquitin E3 ligase Doa10 has an unusually broad substrate range, being
capable of recognizing aberrant proteins subjected to quality control and synthetic degron-fusion
substrates, membrane proteins, and soluble proteins of the cytoplasm and nucleus (Deng and
Hochstrasser, 2006; Ravid et al., 2006). As previously indicated, the E2 ubiquitin conjugase Ubc6
that binds to the ER membrane via a C-terminal transmembrane anchor is a paradigm, being
constitutively turned over via the Doa10 pathway (Sommer and Jentsch, 1993; Swanson et al.,
2001; Walter et al., 2001). Another well studied membrane substrate of Doa10 is Ste6–166
(Ste6*), a mutant form of the pheromone transporter that is missing the last 42 residues of its
cytosolically disposed C-terminal domain (Loayza et al., 1998; Huyer et al., 2004; Vashist and Ng,

CHAPTER 6. FUNCTIONAL CHARACTERIZATION OF ARABIDOPSIS THALIANA SUD1, HRD1A AND HRD1B
98
2004). Besides the well known naturally derived subtrates of the yeast Doa10 pathway, synthetic
degron-fusion substrates have been successfully engineered as “reporter” substrates for Doa10-
mediated degradation, like the membrane synthetic protein Pca1-Sec12TM-DHFR-HA and the
cytoplasmic synthetic protein MN-Matα-eK-HA (Pedro Carvalho, personal communication).
To investigate if G498 is an essential amino acid residue for Doa10 function, as previously
reported for the SUD1 suppressor, the degradation of Doa10 membrane and cytoplasmic
“reporter” substrates in yeast doa10-G498E mutant cells was investigated. Since the full-length
Doa10 gene is not stably maintained in E. coli, a pRS305 plasmid containing only part of the yeast
DOA10 coding sequence (from ORF nucleotide 814 till the last ORF codon excluding the stop
codon) in frame with a C-terminal MYC epitode was used for oligonucleotide-directed mutagenesis
to replace the Gly498 by Glu within the Doa10 protein.
The yeast Doa10-MYC and doa10-G498E mutant cells were transformed with a vector
containing one of various Doa10 pathway “reporter” substrates (Pca1-Sec12TM-DHFR, Ste6*,
Ubc6 and MN-Matα-eK) fused to a triple HA tag. Then, a CHX pulse-chase experiment was
performed to follow the degradation of the Doa10 pathway “reporter” substrates. The degradation
of Doa10 membrane or cytoplasmic “reporter” substrates in doa10-G498E mutant cells was
analysed by immunoblotting with anti-HA antibodies (Figure 6.2). In the yeast doa10Δ mutant, all
the three tested degradation “reporter” substrates remained stable over time. As expected, the
expression of the yeast Doa10-MYC from the chromosomal DOA10 locus resulted in clear
degradation of both membrane (Pca1-Sec12TM-DHFR, Ste6* and Ubc6) and soluble (MN-Matα-eK)
“reporter” substrates, indicating complementation of the mutant phenotype. However, the
expression of the doa10-G498E mutant allele from the chromosomal DOA10 locus did not stabilize
yeast Doa10 membrane or cytoplasmic “reporter” substrates as would be expected if the Doa10-
G498E substitution was compromising the function of yeast Doa10. From these data, it is possible
to conclude that the Doa10-G498E protein is still functional and able to work with the Ubc6 E2 to
target Doa10 substrates for degradation, suggesting important functional differences between
Doa10 and SUD1.
CHAPTER 6. FUNCTIONAL CHARACTERIZATION OF ARABIDOPSIS THALIANA SUD1, HRD1A AND HRD1B
99
Figure 6.2 – Degradation of Doa10 membrane or cytoplasmic “reporter” substrates in doa10-G498E mutant cells (A) The content of the yeast Doa10 membrane substrate Pca1-Sec12TM-DHFR-HA was analyzed by immunoblotting in transformed yeast cells expressing the indicated genes following inhibition of translation with cycloheximide (CHX). The Doa10-MYC and doa10-G498E alleles were expressed from the yeast chromosomal DOA10 locus. Yeast doa10Δ cells were used as a negative control.
Pca1-Sec12TM-DHFR-HA was expressed from a yeast centromere plasmid (YCp). Equal amounts of total protein extracts from exponentially growing cells treated with CHX were separated by SDS/PAGE and analyzed by immunoblotting with anti-HA antibody. Arrows indicate the Pca1-Sec12TM-DHFR-HA protein immunoblotting bands. Asterisks indicate three cross-reacting yeast proteins, labelled “nonspecific”, that were used as internal protein loading controls. (B) As in (A) but with expression of the yeast Doa10 membrane substrate Ste6*-HA from an YCp. (C) As in (A) but with expression of the yeast Doa10 membrane substrate Ubc6-HA from an YCp in the presence of endogenous Ubc6. (D) As in (A) but with expression of the yeast Doa10 cytoplasmic substrate MN-Matα-eK-HA from an YCp.
AtHRD1 Complementation of Yeast hrd1Δ Mutation
Because SUD1 is a putative member of the ERAD pathway, the two Arabidopsis redundant
genes AtHRD1A and AtHRD1B, which are the most likely orthologs of the yeast ERAD component
Hrd1, were additionally included into the present study. To test if AtHRD1A and AtHRD1B are the
functional orthologs of the yeast Hrd1 protein, a yeast complementation experiment was
performed. The YCp pRS316 vector was used to clone and express both the yeast HRD1/AtHRD1
genes and the ERAD-L pathway substrate CPY*. The coding region of the Arabidopsis thaliana
genes HRD1A (At3g16090.1) and HRD1B (At1g65040.2) were cloned in frame with a C-terminal
triple HA tag into a pRS316 vector containing the PRC1 moderate promoter (to drive the
expression) and the PCR1 3´UTR (to allow transcript stability). The resulting plasmids bearing

CHAPTER 6. FUNCTIONAL CHARACTERIZATION OF ARABIDOPSIS THALIANA SUD1, HRD1A AND HRD1B
100
AtHRD1A or AtHRD1B, and also the plasmid containing the yeast HRD1 coding sequence and an
empty pRS316 vector, were individually co-transformed with a mutated version of carboxypeptidase
Y (CPY*) tagged with a C-terminal FLAG epitope-expressing vector into the yeast hrd1Δ mutant
cells. The missfolded luminal ER protein CPY* (Finger et al., 1993) in known to be a substrate of
the ERAD-L pathway, dependent on Hrd1 protein for its degradation in yeast, and has been
extensively used to monitor the activity of the Hrd1 protein (Ng et al., 2000; Carvalho et al., 2006;
Carvalho et al., 2010).
In order to confirm that the CPY*-FLAG transgene is expressed; several independent yeast
clones for each co-transformation were analyzed by immunoblotting with anti-FLAG specific
antibodies. The CPY*-FLAG protein can be detected by immunoblotting in all the analysed clones
demonstrating that CPY*-FLAG is being expressed (Figure 6.3). Two independent transformants for
hrd1Δ AtHRD1A (1.1, 1.2) and hrd1Δ AtHRD1B (2.1, 2.2), together with the controls hrd1Δ yeast
Hrd1 (3.1) and hrd1Δ empty vector (7.1), were used for the complementation assay.
Figure 6.3 – Yeast colony screening for CPY*-FLAG expression The content of the yeast Hrd1 substrate CPY*-FLAG was analyzed by immunoblotting in different transformed yeast hrd1Δ cells with
clones expressing the indicated genes. Approximate amounts of yeast cells growing on plate were collected to obtain total protein extracts. Proteins were separated by SDS/PAGE and analyzed by immunoblot with anti-FLAG antibody for CPY*-FLAG detection. Asterisk indicates a cross-reacting yeast protein, labelled “nonspecific”. The cross reacting band cannot serve as internal protein loading control since non-equal amounts of total protein extracts were used. Estimated molecular weight of the bands are indicated.
A CHX pulse-chase experiment was performed in order to follow the degradation of the
ERAD-L pathway substrate CPY*-FLAG (Figure 6.4). In the mutant yeast hrd1Δ transformed with
the empty vector, CPY* remained stable over time. As expected, the expression of the yeast Hrd1
resulted in a degradation of the CPY* indicating complementation of the mutant phenotype.
However the expression of the Arabidopsis HRD1A and HRD1B orthologs did not increase the
degradation of the CPY*-FLAG protein as we would expect if complementation indeed occured. The
apparently slight decrease in CPY*-FLAG protein levels observed after 90 minutes of CHX
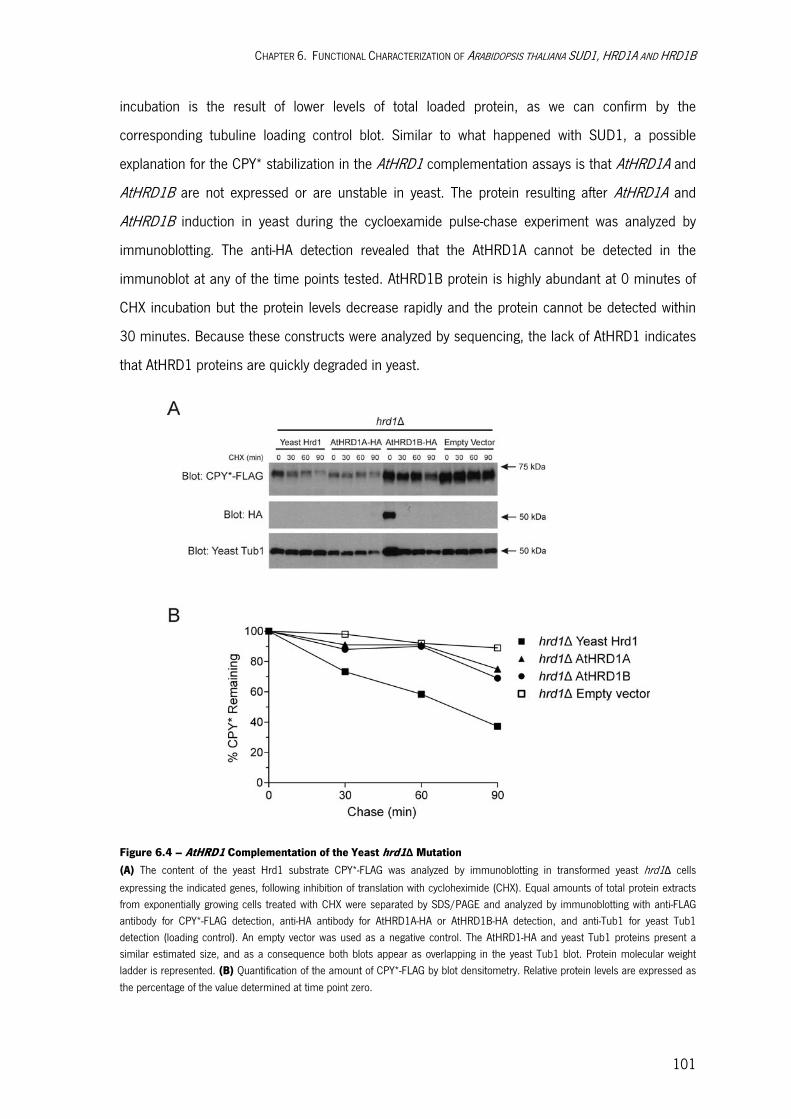
CHAPTER 6. FUNCTIONAL CHARACTERIZATION OF ARABIDOPSIS THALIANA SUD1, HRD1A AND HRD1B
101
incubation is the result of lower levels of total loaded protein, as we can confirm by the
corresponding tubuline loading control blot. Similar to what happened with SUD1, a possible
explanation for the CPY* stabilization in the AtHRD1 complementation assays is that AtHRD1A and
AtHRD1B are not expressed or are unstable in yeast. The protein resulting after AtHRD1A and
AtHRD1B induction in yeast during the cycloexamide pulse-chase experiment was analyzed by
immunoblotting. The anti-HA detection revealed that the AtHRD1A cannot be detected in the
immunoblot at any of the time points tested. AtHRD1B protein is highly abundant at 0 minutes of
CHX incubation but the protein levels decrease rapidly and the protein cannot be detected within
30 minutes. Because these constructs were analyzed by sequencing, the lack of AtHRD1 indicates
that AtHRD1 proteins are quickly degraded in yeast.
Figure 6.4 – AtHRD1 Complementation of the Yeast hrd1Δ Mutation
(A) The content of the yeast Hrd1 substrate CPY*-FLAG was analyzed by immunoblotting in transformed yeast hrd1Δ cells
expressing the indicated genes, following inhibition of translation with cycloheximide (CHX). Equal amounts of total protein extracts from exponentially growing cells treated with CHX were separated by SDS/PAGE and analyzed by immunoblotting with anti-FLAG antibody for CPY*-FLAG detection, anti-HA antibody for AtHRD1A-HA or AtHRD1B-HA detection, and anti-Tub1 for yeast Tub1 detection (loading control). An empty vector was used as a negative control. The AtHRD1-HA and yeast Tub1 proteins present a similar estimated size, and as a consequence both blots appear as overlapping in the yeast Tub1 blot. Protein molecular weight ladder is represented. (B) Quantification of the amount of CPY*-FLAG by blot densitometry. Relative protein levels are expressed as the percentage of the value determined at time point zero.
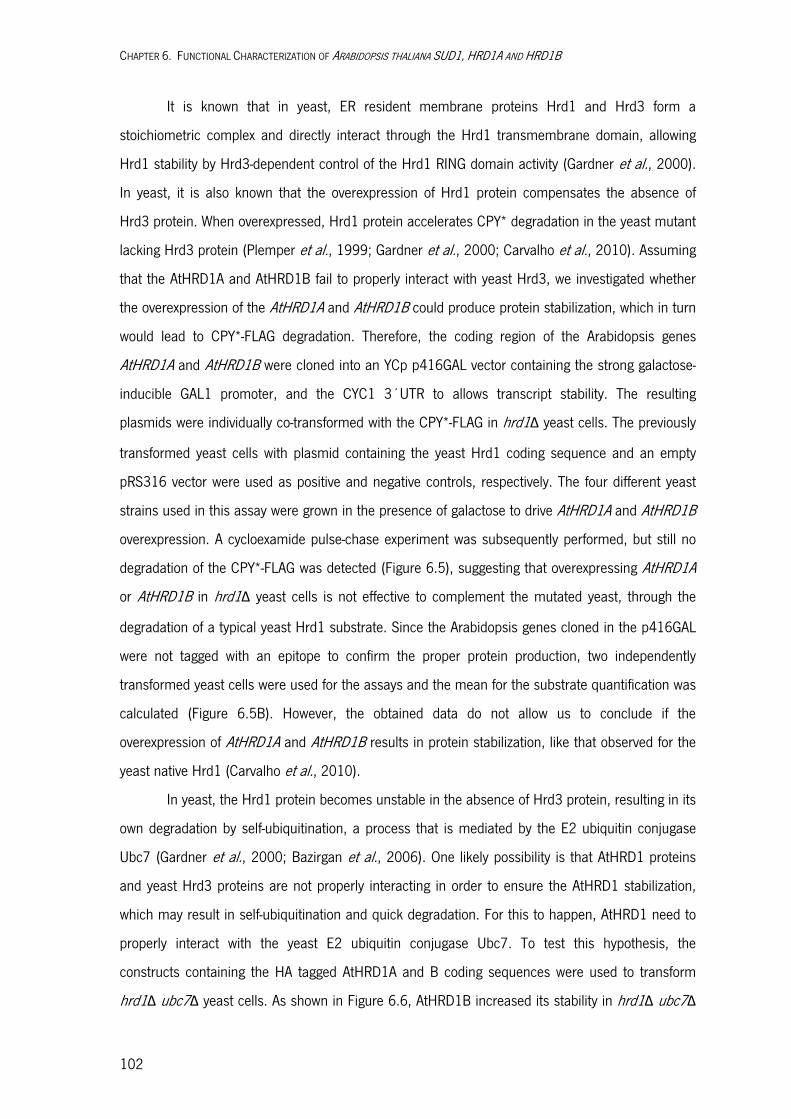
CHAPTER 6. FUNCTIONAL CHARACTERIZATION OF ARABIDOPSIS THALIANA SUD1, HRD1A AND HRD1B
102
It is known that in yeast, ER resident membrane proteins Hrd1 and Hrd3 form a
stoichiometric complex and directly interact through the Hrd1 transmembrane domain, allowing
Hrd1 stability by Hrd3-dependent control of the Hrd1 RING domain activity (Gardner et al., 2000).
In yeast, it is also known that the overexpression of Hrd1 protein compensates the absence of
Hrd3 protein. When overexpressed, Hrd1 protein accelerates CPY* degradation in the yeast mutant
lacking Hrd3 protein (Plemper et al., 1999; Gardner et al., 2000; Carvalho et al., 2010). Assuming
that the AtHRD1A and AtHRD1B fail to properly interact with yeast Hrd3, we investigated whether
the overexpression of the AtHRD1A and AtHRD1B could produce protein stabilization, which in turn
would lead to CPY*-FLAG degradation. Therefore, the coding region of the Arabidopsis genes
AtHRD1A and AtHRD1B were cloned into an YCp p416GAL vector containing the strong galactose-
inducible GAL1 promoter, and the CYC1 3´UTR to allows transcript stability. The resulting
plasmids were individually co-transformed with the CPY*-FLAG in hrd1Δ yeast cells. The previously
transformed yeast cells with plasmid containing the yeast Hrd1 coding sequence and an empty
pRS316 vector were used as positive and negative controls, respectively. The four different yeast
strains used in this assay were grown in the presence of galactose to drive AtHRD1A and AtHRD1B
overexpression. A cycloexamide pulse-chase experiment was subsequently performed, but still no
degradation of the CPY*-FLAG was detected (Figure 6.5), suggesting that overexpressing AtHRD1A
or AtHRD1B in hrd1Δ yeast cells is not effective to complement the mutated yeast, through the
degradation of a typical yeast Hrd1 substrate. Since the Arabidopsis genes cloned in the p416GAL
were not tagged with an epitope to confirm the proper protein production, two independently
transformed yeast cells were used for the assays and the mean for the substrate quantification was
calculated (Figure 6.5B). However, the obtained data do not allow us to conclude if the
overexpression of AtHRD1A and AtHRD1B results in protein stabilization, like that observed for the
yeast native Hrd1 (Carvalho et al., 2010).
In yeast, the Hrd1 protein becomes unstable in the absence of Hrd3 protein, resulting in its
own degradation by self-ubiquitination, a process that is mediated by the E2 ubiquitin conjugase
Ubc7 (Gardner et al., 2000; Bazirgan et al., 2006). One likely possibility is that AtHRD1 proteins
and yeast Hrd3 proteins are not properly interacting in order to ensure the AtHRD1 stabilization,
which may result in self-ubiquitination and quick degradation. For this to happen, AtHRD1 need to
properly interact with the yeast E2 ubiquitin conjugase Ubc7. To test this hypothesis, the
constructs containing the HA tagged AtHRD1A and B coding sequences were used to transform
hrd1Δ ubc7Δ yeast cells. As shown in Figure 6.6, AtHRD1B increased its stability in hrd1Δ ubc7Δ
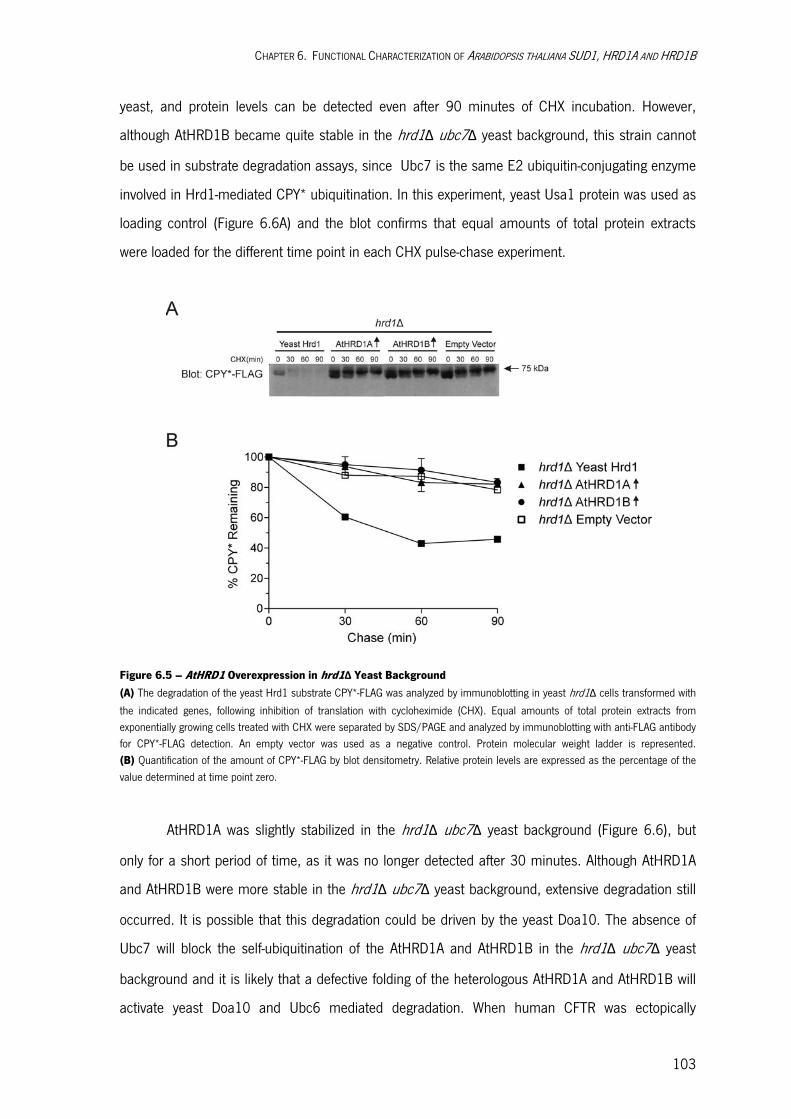
CHAPTER 6. FUNCTIONAL CHARACTERIZATION OF ARABIDOPSIS THALIANA SUD1, HRD1A AND HRD1B
103
yeast, and protein levels can be detected even after 90 minutes of CHX incubation. However,
although AtHRD1B became quite stable in the hrd1Δ ubc7Δ yeast background, this strain cannot
be used in substrate degradation assays, since Ubc7 is the same E2 ubiquitin-conjugating enzyme
involved in Hrd1-mediated CPY* ubiquitination. In this experiment, yeast Usa1 protein was used as
loading control (Figure 6.6A) and the blot confirms that equal amounts of total protein extracts
were loaded for the different time point in each CHX pulse-chase experiment.
Figure 6.5 – AtHRD1 Overexpression in hrd1Δ Yeast Background
(A) The degradation of the yeast Hrd1 substrate CPY*-FLAG was analyzed by immunoblotting in yeast hrd1Δ cells transformed with
the indicated genes, following inhibition of translation with cycloheximide (CHX). Equal amounts of total protein extracts from exponentially growing cells treated with CHX were separated by SDS/PAGE and analyzed by immunoblotting with anti-FLAG antibody for CPY*-FLAG detection. An empty vector was used as a negative control. Protein molecular weight ladder is represented. (B) Quantification of the amount of CPY*-FLAG by blot densitometry. Relative protein levels are expressed as the percentage of the value determined at time point zero.
AtHRD1A was slightly stabilized in the hrd1Δ ubc7Δ yeast background (Figure 6.6), but
only for a short period of time, as it was no longer detected after 30 minutes. Although AtHRD1A
and AtHRD1B were more stable in the hrd1Δ ubc7Δ yeast background, extensive degradation still
occurred. It is possible that this degradation could be driven by the yeast Doa10. The absence of
Ubc7 will block the self-ubiquitination of the AtHRD1A and AtHRD1B in the hrd1Δ ubc7Δ yeast
background and it is likely that a defective folding of the heterologous AtHRD1A and AtHRD1B will
activate yeast Doa10 and Ubc6 mediated degradation. When human CFTR was ectopically
CHAPTER 6. FUNCTIONAL CHARACTERIZATION OF ARABIDOPSIS THALIANA SUD1, HRD1A AND HRD1B
104
expressed in yeast, its degradation depended on both Hrd1p and Doa10. This was illustrated by
the strong effect of deleting both E3s, whereas deleting either of them separately gave only modest
effects on the degradation of CFTR (Gnann et al., 2004). Furthermore, in yeast the accumulation of
ubiquitinated proteins in the ER membrane that was caused by a temperature-sensitive mutation in
Npl4p mutation could be suppressed by deleting both Doa10 and Hrd1 (Hitchcock et al., 2003).
These data suggest that Hrd1p and Doa10p are able to complement each other in the degradation
of a single substrate. However, this possible compensatory regulation between AtHRD1 and Doa10
in yeast has yet to be investigated in Arabidopsis in order to determine whether SUD1 is involved in
the regulation of AtHRD1 levels.
Figure 6.6 – AtHRD1 Stabilization in hrd1Δ ubc7Δ Yeast Background
(A) The stabilization of the AtHRD1A and AtHRD1B was analyzed by immunoblotting in yeast hrd1Δ and yeast hrd1Δ ubc7Δ,
following inhibition of translation with cycloheximide (CHX). Equal amounts of total protein extracts from exponentially growing cells treated with CHX were separated by SDS/PAGE and analyzed by immunoblotting with anti-HA antibody for AtHRD1A-HA or AtHRD1B-HA detection, and anti-Usa1 for yeast Usa1 detection (loading control). An empty vector was used as a negative control. Protein molecular weight ladder is represented. (B) Quantification of the amount of AtHRD1A and AtHRD1B by blot densitometry. Relative protein levels are expressed as the percentage of the value determined at time point zero.
CHAPTER 6. FUNCTIONAL CHARACTERIZATION OF ARABIDOPSIS THALIANA SUD1, HRD1A AND HRD1B
105
Investigating the Function of the Arabidopsis ERAD E3-ligases
In this chapter, yeasts were used as a functional tool to investigate the function of the
Arabidopsis ERAD E3-ligases. The function of AtHRD1A and AtHRD1B has been partially
demonstrated, since these proteins are stabilized in the absence of Ubc7, indicating a biochemical
interaction among these components. However, at the same time the absence of Ubc7 that is
required for Hrd1 function makes it impossible to analyze AtHRD1 function with a bona fide
substrate. There are studies confirming that this ERAD pathway is functional in Arabidopsis
(Yamamoto et al., 2010; Liu et al., 2011; Su et al., 2011)105. In contrast to the Hrd pathway,
there is no information about the function of this pathway in Arabidopsis, with the exception of that
referred in this thesis. Data obtained in this work indicates that production of stable SUD1 protein
in yeast is not possible, making further experimentation unviable. However, relevant insights were
provided on Doa10 and SUD1 function in a comparative manner, by showing that the G360E
mutation in Arabidopsis causes loss-of-function in this protein, while Doa10 G498E has no effect in
protein activity. This indicates that despite their relatively high conservation throughout evolution
(Chapter 5, Figure 5.5), Doa10 and SUD1 have functionally diverged, this likely causing the
impossibility of using yeast complementation for Arabidopsis E3 ERAD gene studies.
6.3. MATERIALS AND METHODS
Plant Material
The Arabidopsis thaliana ecotype Columbia-0 (Col-0) was used for the total RNA extraction to obtain cDNA from wild-type seedlings. The standard molecular biology methods, used in the present work, are presented in more detail in Appendix I.
Plant Manipulation and Growth Conditions
Arabidopsis standard handling procedures and conditions were employed to promote seed germination and growth, as previously described in the Materials and Methods section of Chapter 2.
Yeast Strains and Plasmids
Yeast strains used in the present work were generously provided by Dr. Pedro Carvalho at Center for Genomic Regulation, Barcelona, Spain. The yeast Saccharomyces cerevisiae used in the present work
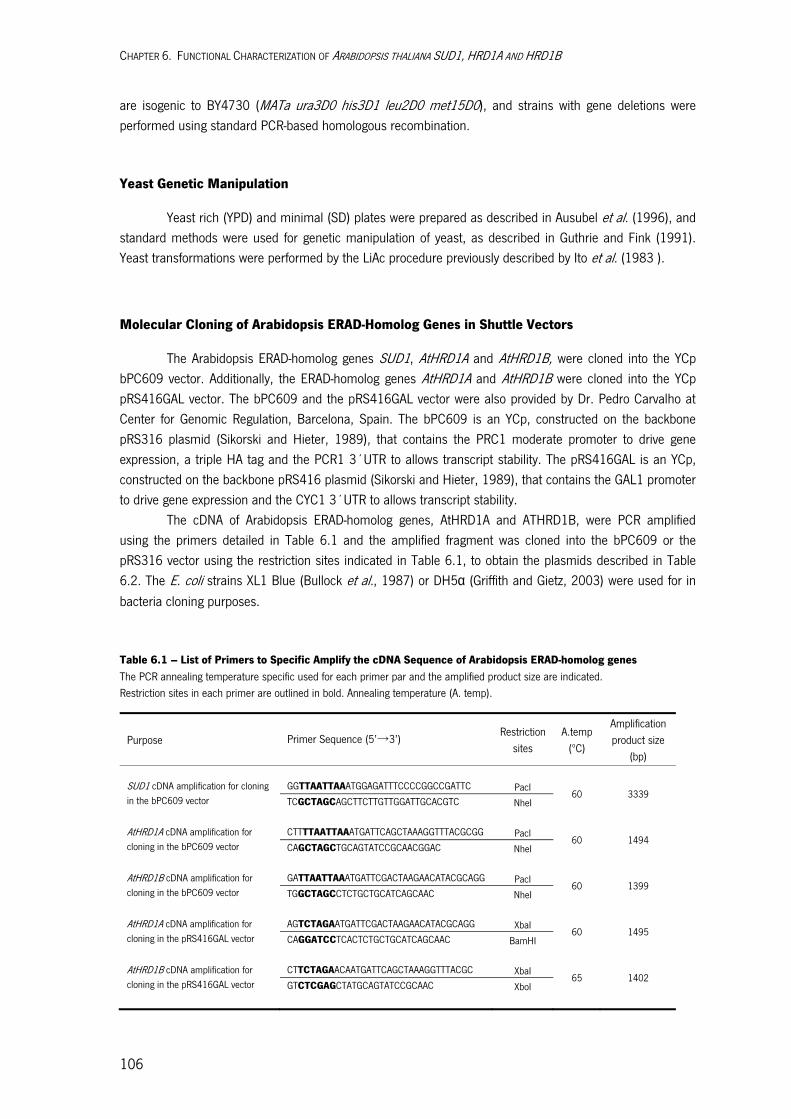
CHAPTER 6. FUNCTIONAL CHARACTERIZATION OF ARABIDOPSIS THALIANA SUD1, HRD1A AND HRD1B
106
are isogenic to BY4730 (MATa ura3D0 his3D1 leu2D0 met15D0), and strains with gene deletions were performed using standard PCR-based homologous recombination.
Yeast Genetic Manipulation
Yeast rich (YPD) and minimal (SD) plates were prepared as described in Ausubel et al. (1996), and standard methods were used for genetic manipulation of yeast, as described in Guthrie and Fink (1991). Yeast transformations were performed by the LiAc procedure previously described by Ito et al. (1983 ).
Molecular Cloning of Arabidopsis ERAD-Homolog Genes in Shuttle Vectors
The Arabidopsis ERAD-homolog genes SUD1, AtHRD1A and AtHRD1B, were cloned into the YCp bPC609 vector. Additionally, the ERAD-homolog genes AtHRD1A and AtHRD1B were cloned into the YCp pRS416GAL vector. The bPC609 and the pRS416GAL vector were also provided by Dr. Pedro Carvalho at Center for Genomic Regulation, Barcelona, Spain. The bPC609 is an YCp, constructed on the backbone pRS316 plasmid (Sikorski and Hieter, 1989), that contains the PRC1 moderate promoter to drive gene expression, a triple HA tag and the PCR1 3´UTR to allows transcript stability. The pRS416GAL is an YCp, constructed on the backbone pRS416 plasmid (Sikorski and Hieter, 1989), that contains the GAL1 promoter to drive gene expression and the CYC1 3´UTR to allows transcript stability.
The cDNA of Arabidopsis ERAD-homolog genes, AtHRD1A and ATHRD1B, were PCR amplified using the primers detailed in Table 6.1 and the amplified fragment was cloned into the bPC609 or the pRS316 vector using the restriction sites indicated in Table 6.1, to obtain the plasmids described in Table 6.2. The E. coli strains XL1 Blue (Bullock et al., 1987) or DH5α (Griffith and Gietz, 2003) were used for in
bacteria cloning purposes.
Table 6.1 – List of Primers to Specific Amplify the cDNA Sequence of Arabidopsis ERAD-homolog genes The PCR annealing temperature specific used for each primer par and the amplified product size are indicated. Restriction sites in each primer are outlined in bold. Annealing temperature (A. temp).
Purpose Primer Sequence (5’→3’) Restriction
sites A.temp
(ºC)
Amplification product size
(bp) SUD1 cDNA amplification for cloning in the bPC609 vector
GGTTAATTAAATGGAGATTTCCCCGGCCGATTC PacI 60 3339
TCGCTAGCAGCTTCTTGTTGGATTGCACGTC NheI AtHRD1A cDNA amplification for cloning in the bPC609 vector
CTTTTAATTAAATGATTCAGCTAAAGGTTTACGCGG PacI 60 1494
CAGCTAGCTGCAGTATCCGCAACGGAC NheI AtHRD1B cDNA amplification for cloning in the bPC609 vector
GATTAATTAAATGATTCGACTAAGAACATACGCAGG PacI 60 1399
TGGCTAGCCTCTGCTGCATCAGCAAC NheI AtHRD1A cDNA amplification for cloning in the pRS416GAL vector
AGTCTAGAATGATTCGACTAAGAACATACGCAGG XbaI 60 1495
CAGGATCCTCACTCTGCTGCATCAGCAAC BamHI AtHRD1B cDNA amplification for cloning in the pRS416GAL vector
CTTCTAGAACAATGATTCAGCTAAAGGTTTACGC XbaI 65 1402
GTCTCGAGCTATGCAGTATCCGCAAC XboI
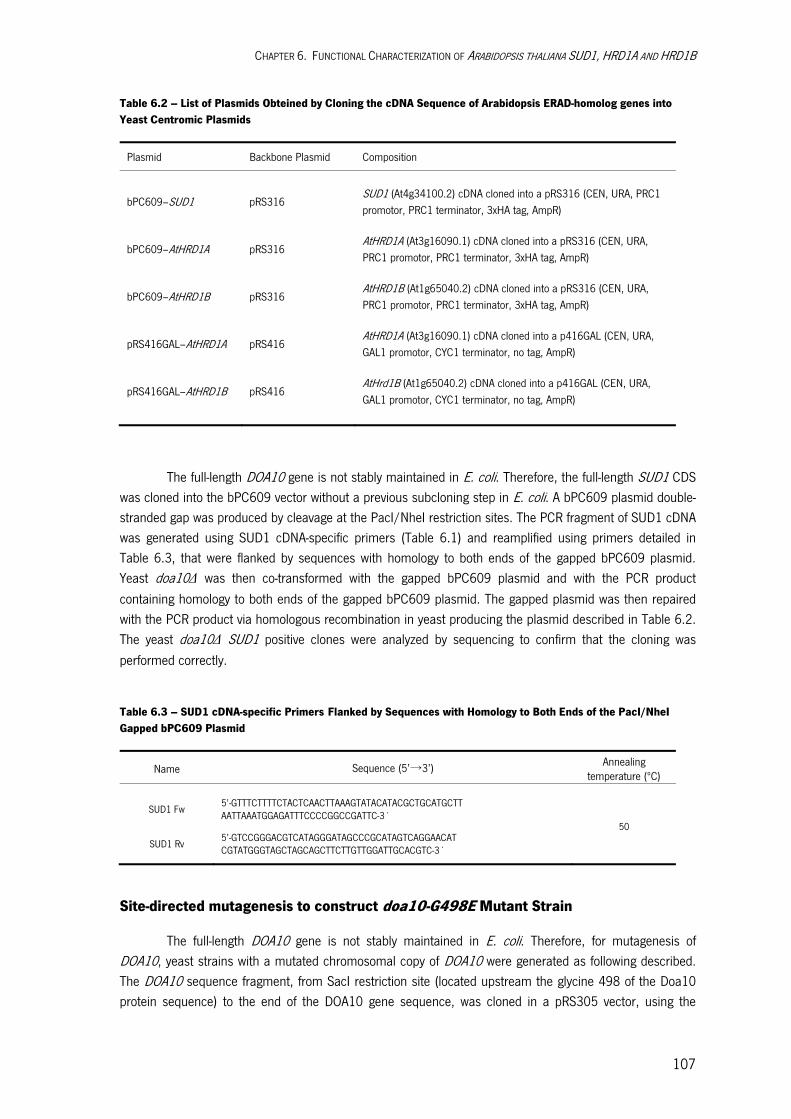
CHAPTER 6. FUNCTIONAL CHARACTERIZATION OF ARABIDOPSIS THALIANA SUD1, HRD1A AND HRD1B
107
Table 6.2 – List of Plasmids Obteined by Cloning the cDNA Sequence of Arabidopsis ERAD-homolog genes into Yeast Centromic Plasmids
Plasmid Backbone Plasmid Composition
bPC609–SUD1 pRS316 SUD1 (At4g34100.2) cDNA cloned into a pRS316 (CEN, URA, PRC1 promotor, PRC1 terminator, 3xHA tag, AmpR)
bPC609–AtHRD1A pRS316 AtHRD1A (At3g16090.1) cDNA cloned into a pRS316 (CEN, URA, PRC1 promotor, PRC1 terminator, 3xHA tag, AmpR)
bPC609–AtHRD1B pRS316 AtHRD1B (At1g65040.2) cDNA cloned into a pRS316 (CEN, URA, PRC1 promotor, PRC1 terminator, 3xHA tag, AmpR)
pRS416GAL–AtHRD1A pRS416 AtHRD1A (At3g16090.1) cDNA cloned into a p416GAL (CEN, URA, GAL1 promotor, CYC1 terminator, no tag, AmpR)
pRS416GAL–AtHRD1B pRS416 AtHrd1B (At1g65040.2) cDNA cloned into a p416GAL (CEN, URA, GAL1 promotor, CYC1 terminator, no tag, AmpR)
The full-length DOA10 gene is not stably maintained in E. coli. Therefore, the full-length SUD1 CDS
was cloned into the bPC609 vector without a previous subcloning step in E. coli. A bPC609 plasmid double-stranded gap was produced by cleavage at the PacI/NheI restriction sites. The PCR fragment of SUD1 cDNA was generated using SUD1 cDNA-specific primers (Table 6.1) and reamplified using primers detailed in Table 6.3, that were flanked by sequences with homology to both ends of the gapped bPC609 plasmid. Yeast doa10Δ was then co-transformed with the gapped bPC609 plasmid and with the PCR product
containing homology to both ends of the gapped bPC609 plasmid. The gapped plasmid was then repaired with the PCR product via homologous recombination in yeast producing the plasmid described in Table 6.2. The yeast doa10Δ SUD1 positive clones were analyzed by sequencing to confirm that the cloning was
performed correctly.
Table 6.3 – SUD1 cDNA-specific Primers Flanked by Sequences with Homology to Both Ends of the PacI/NheI Gapped bPC609 Plasmid
Name Sequence (5’→3’) Annealing temperature (ºC)
SUD1 Fw
5’-GTTTCTTTTCTACTCAACTTAAAGTATACATACGCTGCATGCTT AATTAAATGGAGATTTCCCCGGCCGATTC-3´
50
SUD1 Rv 5’-GTCCGGGACGTCATAGGGATAGCCCGCATAGTCAGGAACAT CGTATGGGTAGCTAGCAGCTTCTTGTTGGATTGCACGTC-3´
Site-directed mutagenesis to construct doa10-G498E Mutant Strain
The full-length DOA10 gene is not stably maintained in E. coli. Therefore, for mutagenesis of DOA10, yeast strains with a mutated chromosomal copy of DOA10 were generated as following described. The DOA10 sequence fragment, from SacI restriction site (located upstream the glycine 498 of the Doa10 protein sequence) to the end of the DOA10 gene sequence, was cloned in a pRS305 vector, using the
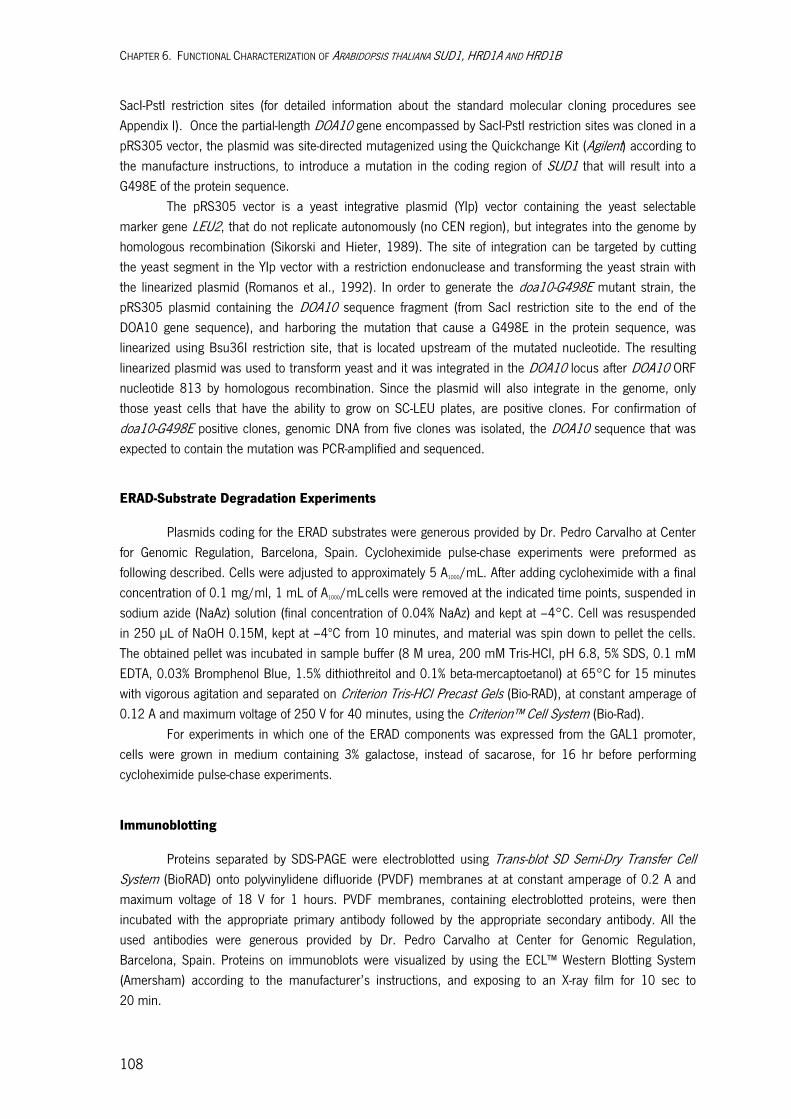
CHAPTER 6. FUNCTIONAL CHARACTERIZATION OF ARABIDOPSIS THALIANA SUD1, HRD1A AND HRD1B
108
SacI-PstI restriction sites (for detailed information about the standard molecular cloning procedures see Appendix I). Once the partial-length DOA10 gene encompassed by SacI-PstI restriction sites was cloned in a pRS305 vector, the plasmid was site-directed mutagenized using the Quickchange Kit (Agilent) according to the manufacture instructions, to introduce a mutation in the coding region of SUD1 that will result into a G498E of the protein sequence.
The pRS305 vector is a yeast integrative plasmid (YIp) vector containing the yeast selectable marker gene LEU2, that do not replicate autonomously (no CEN region), but integrates into the genome by homologous recombination (Sikorski and Hieter, 1989). The site of integration can be targeted by cutting the yeast segment in the YIp vector with a restriction endonuclease and transforming the yeast strain with the linearized plasmid (Romanos et al., 1992). In order to generate the doa10-G498E mutant strain, the pRS305 plasmid containing the DOA10 sequence fragment (from SacI restriction site to the end of the DOA10 gene sequence), and harboring the mutation that cause a G498E in the protein sequence, was linearized using Bsu36I restriction site, that is located upstream of the mutated nucleotide. The resulting linearized plasmid was used to transform yeast and it was integrated in the DOA10 locus after DOA10 ORF nucleotide 813 by homologous recombination. Since the plasmid will also integrate in the genome, only those yeast cells that have the ability to grow on SC-LEU plates, are positive clones. For confirmation of doa10-G498E positive clones, genomic DNA from five clones was isolated, the DOA10 sequence that was expected to contain the mutation was PCR-amplified and sequenced.
ERAD-Substrate Degradation Experiments
Plasmids coding for the ERAD substrates were generous provided by Dr. Pedro Carvalho at Center for Genomic Regulation, Barcelona, Spain. Cycloheximide pulse-chase experiments were preformed as following described. Cells were adjusted to approximately 5 A1000/mL. After adding cycloheximide with a final concentration of 0.1 mg/ml, 1 mL of A1000/mL cells were removed at the indicated time points, suspended in sodium azide (NaAz) solution (final concentration of 0.04% NaAz) and kept at –4°C. Cell was resuspended in 250 μL of NaOH 0.15M, kept at –4ºC from 10 minutes, and material was spin down to pellet the cells. The obtained pellet was incubated in sample buffer (8 M urea, 200 mM Tris-HCl, pH 6.8, 5% SDS, 0.1 mM EDTA, 0.03% Bromphenol Blue, 1.5% dithiothreitol and 0.1% beta-mercaptoetanol) at 65°C for 15 minutes with vigorous agitation and separated on Criterion Tris-HCl Precast Gels (Bio-RAD), at constant amperage of 0.12 A and maximum voltage of 250 V for 40 minutes, using the Criterion™ Cell System (Bio-Rad).
For experiments in which one of the ERAD components was expressed from the GAL1 promoter, cells were grown in medium containing 3% galactose, instead of sacarose, for 16 hr before performing cycloheximide pulse-chase experiments.
Immunoblotting
Proteins separated by SDS-PAGE were electroblotted using Trans-blot SD Semi-Dry Transfer Cell System (BioRAD) onto polyvinylidene difluoride (PVDF) membranes at at constant amperage of 0.2 A and maximum voltage of 18 V for 1 hours. PVDF membranes, containing electroblotted proteins, were then incubated with the appropriate primary antibody followed by the appropriate secondary antibody. All the used antibodies were generous provided by Dr. Pedro Carvalho at Center for Genomic Regulation, Barcelona, Spain. Proteins on immunoblots were visualized by using the ECL™ Western Blotting System (Amersham) according to the manufacturer’s instructions, and exposing to an X-ray film for 10 sec to 20 min.
Chapter 7
Investigating the Use of Grafting in the Study of Long-distance Isoprenoid-derived Signalling in dry2
CONTENTS
7.1. INTRODUCTION 7.2. RESULTS
Grafting analysis of long-distance signalling in dry2 Rejection of Wild-type and dry2/sud1-9 Scions by dry2 Rootstocks Wild-type Rootstocks Do Not Complement dig4 Mutant Shoot Defects
7.3. DISCUSSION The Nature of the Long-distance Signal Impaired in dry2
7.4. MATERIALS AND METHODS


INVESTIGATING USE OF GRAFTING IN THE STUDY OF LONG-DISTANCE ISOPRENOID-DERIVED SIGNALLING IN DRY2
111
7.1. INTRODUCTION
In plants, the main mevalonate (MVA)-derived isoprenoid end products are sterols, which
are integral components of the membrane and are involved in plant growth and developmental
processes, the steroid hormone class of brassinosteroids, dolichol that is involved in protein
glycosylation, and the prenyl groups used for protein prenylation and cytokinin biosynthesis
(Benveniste, 2004; Phillips et al., 2006; Schaller, 2010). A number of studies have shown the
importance of a correct sterol composition in plants because of their roles in embryonic pattern
formation (Jang et al., 2000), cell division, elongation and polarity (Schrick et al., 2000; Willemsen
et al., 2003; Men et al., 2008), vascular patterning (Carland et al., 2002), and Reactive Oxygen
Species (ROS) production (Pose and Botella, 2009; Pose et al., 2009). Still, little is known about
the mechanisms and downstream targets by which isoprenoids in general, and sterols in particular,
influence these processes (Clouse, 2002; Boutte and Grebe, 2009).
In plants, the squalene epoxidases (SQEs) catalyze the conversion of squalene, the
precursor of essential MVA-derived isoprenoids such as sterols, brassinosteroids, and cyclic
triterpenoids, to 2,3-oxidosqualene (Rasbery et al., 2007; Pose et al., 2009; Schaller, 2010).
Arabidopsis contains six putative SQE isoforms identified based on sequence homology, being
SQE1, which is annotated as drought hypersensitive 2/squalene epoxidase 1 (DRY2/SQE1), the
main functionally characterized enzyme (Rasbery et al., 2007; Pose et al., 2009). In Arabidopsis,
DRY2/SQE1 function is required for cell elongation, root epidermal cell polarity, polar root-hair tip
growth, and the stomata response to drought stress, as demonstrated by the identification of the
extremely drought sensitive mutant dry2 (Pose et al., 2009). Moreover, genetic, molecular, and
biochemical analyses of the hypomorphic dry2 allele allowed the identification and characterization
of physiological processes regulated by products of the MVA pathway that otherwise would be
concealed. For instance, previous studies using dry2 suggest that the root developmental
phenotypes observed in dry2 cannot be explained simply by depletion of bulk sterols but rather by
alterations in the ROS signaling pathway and the increase of 3-hydroxy-3-methylglutaryl coenzyme
A reductase (HMGR) activity (Pose et al., 2009). Thus, a different and comprehensive approach is
required to investigate the putative role of an MVA product in plant long-distance signalling.
To investigate a putative long-distance MVA signal involved in plant development, the
present study concerned Arabidopsis micro-grafting studies. Among the diffent types of grafting
unions, two plants can be connected between the scion (the shoot of one of the plants) and the

INVESTIGATING USE OF GRAFTING IN THE STUDY OF LONG-DISTANCE ISOPRENOID-DERIVED SIGNALLING IN DRY2
112
rootstock (the root from the other plant). With this grafting technique, native sterol biosynthesis
genes expressed under normal regulatory mechanisms can be used, typically in one grafting
partner, while the other partner carries a mutation. Thus, signal source and site of action (shoot or
root) can be readily deduced (Turnbull et al., 2002). It is important to precise that in Arabidopsis
seedling grafts, the rootstock comprises not only root tissues but also a section of the hypocotyl.
This hypocotyl section needs to be preserved in de rootstock in order for the graft union to be
performed, and therefore should be consider as a rootstock source tissue.
7.2. RESULTS
Grafting analysis of long-distance signalling in dry2
Based on the previous mass spectral analysis of sterols from Ler, dry2 and dry2/sud9, we
hypothesized that dry2 is not affected in bulk sterols but in an isoprenoid-derived signalling
components (Chapter 1, Table 1.1) (Pose, 2008). Previous chemical analyses also indicated that
dry2 was mainly affected in roots but not in shoots (Pose et al., 2009). In order to investigate long-
distance signalling and the root-to-shoot relationship, Arabidopsis seedling grafting unions were
preformed between: (1) dry2 scion and Ler rootstock, (2) dry2 scion and dry2 rootstock, and (3)
Ler scion and Ler rootstock (Figure 7.1A). As expected, after recovering, control grafted seedlings
(dry2 scion onto dry2 rootstock and Ler scion onto Ler rootstock) resumed the typical development
of dry2 and Ler plants, respectively. Interestingly, dry2 shoots presented an apparent wild-type
phenotype when grafted onto Ler rootstock (Figure 7.1A).
To confirm the scion and rootstock genotypes, genomic DNA samples from shoot and root
tissues of the grafted plants were sequenced. The sequencing results confirmed that dry2 tissues
carried the expected point mutation (G→A nucleotide substitution) in the 4th exon of the At1g58440
gene (Figure 7.1Ac), which is annotated as DRY2/SQE1, resulting in the substitution of a
conserved glycine by an arginine and therefore causing the dry2 phenotypes.
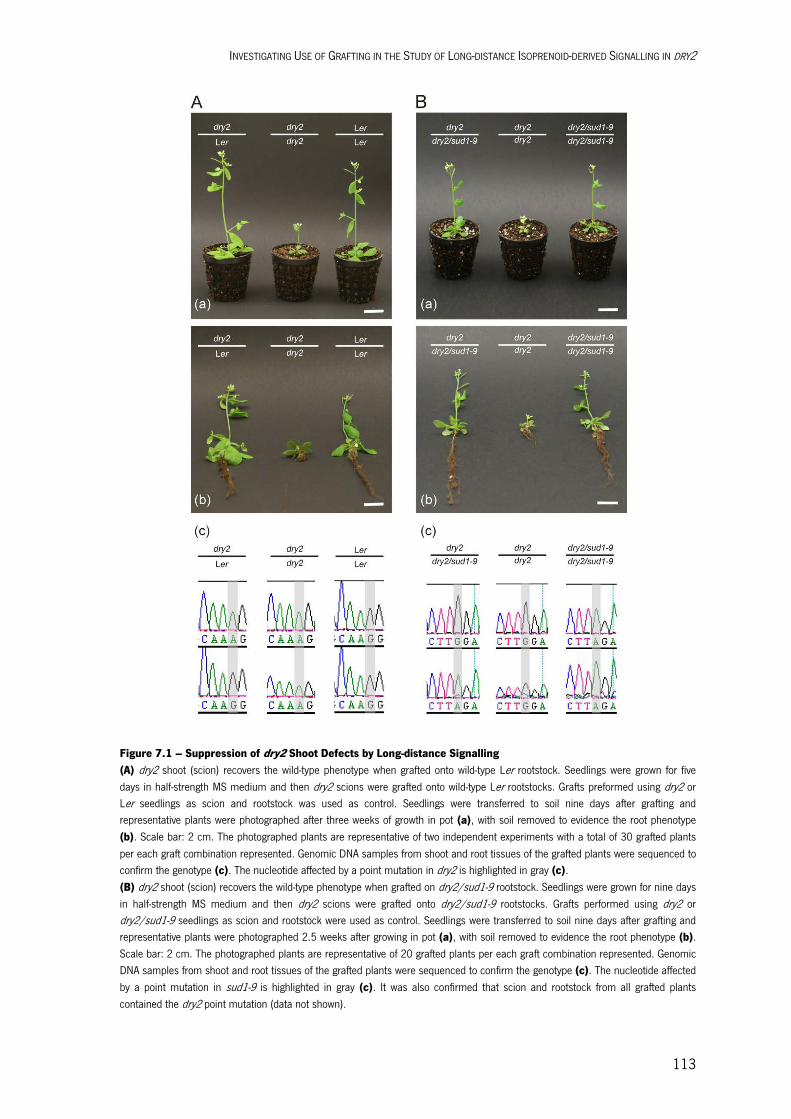
INVESTIGATING USE OF GRAFTING IN THE STUDY OF LONG-DISTANCE ISOPRENOID-DERIVED SIGNALLING IN DRY2
113
Figure 7.1 – Suppression of dry2 Shoot Defects by Long-distance Signalling (A) dry2 shoot (scion) recovers the wild-type phenotype when grafted onto wild-type Ler rootstock. Seedlings were grown for five days in half-strength MS medium and then dry2 scions were grafted onto wild-type Ler rootstocks. Grafts preformed using dry2 or Ler seedlings as scion and rootstock was used as control. Seedlings were transferred to soil nine days after grafting and representative plants were photographed after three weeks of growth in pot (a), with soil removed to evidence the root phenotype (b). Scale bar: 2 cm. The photographed plants are representative of two independent experiments with a total of 30 grafted plants per each graft combination represented. Genomic DNA samples from shoot and root tissues of the grafted plants were sequenced to confirm the genotype (c). The nucleotide affected by a point mutation in dry2 is highlighted in gray (c). (B) dry2 shoot (scion) recovers the wild-type phenotype when grafted on dry2/sud1-9 rootstock. Seedlings were grown for nine days in half-strength MS medium and then dry2 scions were grafted onto dry2/sud1-9 rootstocks. Grafts performed using dry2 or dry2/sud1-9 seedlings as scion and rootstock were used as control. Seedlings were transferred to soil nine days after grafting and representative plants were photographed 2.5 weeks after growing in pot (a), with soil removed to evidence the root phenotype (b). Scale bar: 2 cm. The photographed plants are representative of 20 grafted plants per each graft combination represented. Genomic DNA samples from shoot and root tissues of the grafted plants were sequenced to confirm the genotype (c). The nucleotide affected by a point mutation in sud1-9 is highlighted in gray (c). It was also confirmed that scion and rootstock from all grafted plants contained the dry2 point mutation (data not shown).
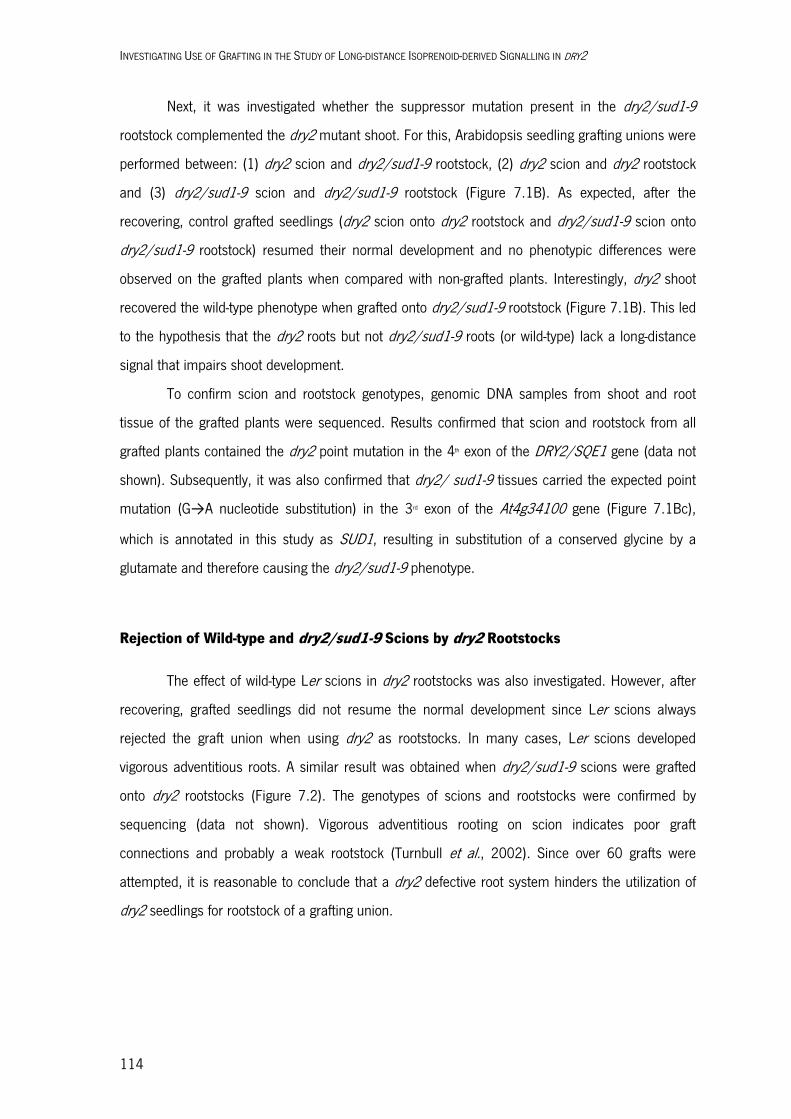
INVESTIGATING USE OF GRAFTING IN THE STUDY OF LONG-DISTANCE ISOPRENOID-DERIVED SIGNALLING IN DRY2
114
Next, it was investigated whether the suppressor mutation present in the dry2/sud1-9
rootstock complemented the dry2 mutant shoot. For this, Arabidopsis seedling grafting unions were
performed between: (1) dry2 scion and dry2/sud1-9 rootstock, (2) dry2 scion and dry2 rootstock
and (3) dry2/sud1-9 scion and dry2/sud1-9 rootstock (Figure 7.1B). As expected, after the
recovering, control grafted seedlings (dry2 scion onto dry2 rootstock and dry2/sud1-9 scion onto
dry2/sud1-9 rootstock) resumed their normal development and no phenotypic differences were
observed on the grafted plants when compared with non-grafted plants. Interestingly, dry2 shoot
recovered the wild-type phenotype when grafted onto dry2/sud1-9 rootstock (Figure 7.1B). This led
to the hypothesis that the dry2 roots but not dry2/sud1-9 roots (or wild-type) lack a long-distance
signal that impairs shoot development.
To confirm scion and rootstock genotypes, genomic DNA samples from shoot and root
tissue of the grafted plants were sequenced. Results confirmed that scion and rootstock from all
grafted plants contained the dry2 point mutation in the 4th exon of the DRY2/SQE1 gene (data not
shown). Subsequently, it was also confirmed that dry2/ sud1-9 tissues carried the expected point
mutation (G→A nucleotide substitution) in the 3rd exon of the At4g34100 gene (Figure 7.1Bc),
which is annotated in this study as SUD1, resulting in substitution of a conserved glycine by a
glutamate and therefore causing the dry2/sud1-9 phenotype.
Rejection of Wild-type and dry2/sud1-9 Scions by dry2 Rootstocks
The effect of wild-type Ler scions in dry2 rootstocks was also investigated. However, after
recovering, grafted seedlings did not resume the normal development since Ler scions always
rejected the graft union when using dry2 as rootstocks. In many cases, Ler scions developed
vigorous adventitious roots. A similar result was obtained when dry2/sud1-9 scions were grafted
onto dry2 rootstocks (Figure 7.2). The genotypes of scions and rootstocks were confirmed by
sequencing (data not shown). Vigorous adventitious rooting on scion indicates poor graft
connections and probably a weak rootstock (Turnbull et al., 2002). Since over 60 grafts were
attempted, it is reasonable to conclude that a dry2 defective root system hinders the utilization of
dry2 seedlings for rootstock of a grafting union.
INVESTIGATING USE OF GRAFTING IN THE STUDY OF LONG-DISTANCE ISOPRENOID-DERIVED SIGNALLING IN DRY2
115
Figure 7.2 – Rejection of dry2 Rootstock by dry2/sud1-9 Scion Seedlings were grown for nine days in half-strength MS medium and then dry2/sud1-9 scions were grafted onto dry2 rootstocks. Grafts performed using dry2 or dry2/sud1-9 seedlings as scion and rootstock were used as control (not shown). Seedlings were transferred to soil nine days after grafting and representative plants were photographed eight days later. Arrows indicate location of graft union. The dry2/sud1-9 scion developed vigorous adventitious roots from the shallow angled V shape created by the cutting preformed to produce the scion. Scale bar: 0.5 cm. The photographed scion and rootstock are representative of a total of 60 grafted plants. Genomic DNA samples from shoot and root tissues of the grafted seedlings were sequenced to confirm the genotypes.
Wild-type Rootstocks Do Not Complement dig4 Mutant Shoot Defects
Additional information could be obtained by extending grafting experiments to other mutant
lines of enzymes of the sterol pathway, thus helping to narrow down the number of candidates for
the currently unrecognized long-distance signal impaired in the dry2 mutant. However, most of
these mutants are lethal due to multiple developmental defects and cannot be used for grafting
experiments (Diener et al., 2000; Jang et al., 2000; Schrick et al., 2000; Carland et al., 2002;
Schrick et al., 2002; Souter et al., 2002; Willemsen et al., 2003; Kim et al., 2005; Babiychuk et
al., 2008; Men et al., 2008).
The dig4 mutant was identified in a screening for Arabidopsis mutants that showed altered
ABA responses (Liming Xiong, unpublished). The dig4 mutant exhibited reduced responsiveness to
ABA in closing stomata and had increased transpirational water loss. ABA is known to activate
NADPH oxidase to produce H2O2 in guard cells, triggering stomatal closure. However, dig4 guard
cells were impaired in ABA-induced H2O2 production. Nonetheless, they were able to respond
normally to H2O2 in closing stomata, suggesting that the signaling pathway downstream of NADPH
oxidase was unaffected in the mutant. These phenotypes are actually similar to those exhibited by
dry2. DIG4 encoded a ∆24-sterol-isomerase/reductase and was allelic to DW ARF1, previously
shown to catalyze the biosynthesis of membrane sterols (Klahre et al., 1998; Choe et al., 1999).
This study suggests that sterols may be important regulators of NADPH oxidase and thus may
affect certain reactive oxygen species-dependent signaling in plants.
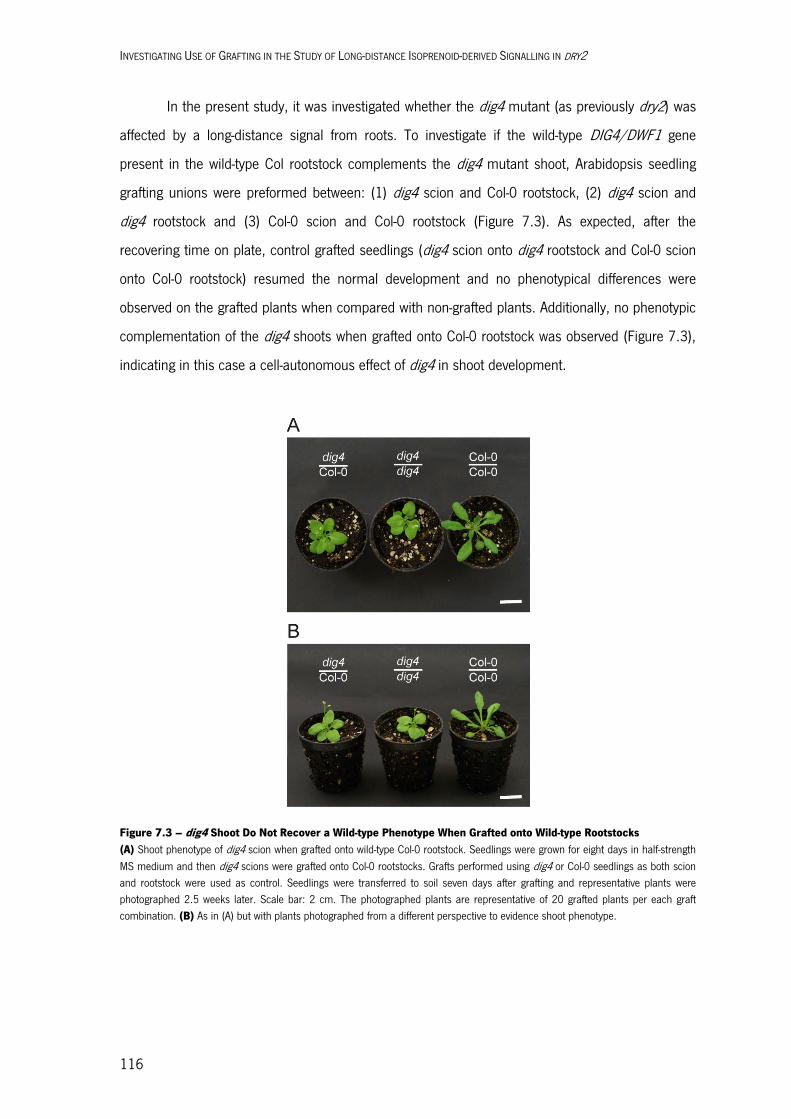
INVESTIGATING USE OF GRAFTING IN THE STUDY OF LONG-DISTANCE ISOPRENOID-DERIVED SIGNALLING IN DRY2
116
In the present study, it was investigated whether the dig4 mutant (as previously dry2) was
affected by a long-distance signal from roots. To investigate if the wild-type DIG4/DWF1 gene
present in the wild-type Col rootstock complements the dig4 mutant shoot, Arabidopsis seedling
grafting unions were preformed between: (1) dig4 scion and Col-0 rootstock, (2) dig4 scion and
dig4 rootstock and (3) Col-0 scion and Col-0 rootstock (Figure 7.3). As expected, after the
recovering time on plate, control grafted seedlings (dig4 scion onto dig4 rootstock and Col-0 scion
onto Col-0 rootstock) resumed the normal development and no phenotypical differences were
observed on the grafted plants when compared with non-grafted plants. Additionally, no phenotypic
complementation of the dig4 shoots when grafted onto Col-0 rootstock was observed (Figure 7.3),
indicating in this case a cell-autonomous effect of dig4 in shoot development.
Figure 7.3 – dig4 Shoot Do Not Recover a Wild-type Phenotype When Grafted onto Wild-type Rootstocks (A) Shoot phenotype of dig4 scion when grafted onto wild-type Col-0 rootstock. Seedlings were grown for eight days in half-strength MS medium and then dig4 scions were grafted onto Col-0 rootstocks. Grafts performed using dig4 or Col-0 seedlings as both scion and rootstock were used as control. Seedlings were transferred to soil seven days after grafting and representative plants were photographed 2.5 weeks later. Scale bar: 2 cm. The photographed plants are representative of 20 grafted plants per each graft combination. (B) As in (A) but with plants photographed from a different perspective to evidence shoot phenotype.
INVESTIGATING USE OF GRAFTING IN THE STUDY OF LONG-DISTANCE ISOPRENOID-DERIVED SIGNALLING IN DRY2
117
7.3. DISCUSSION
The most straight-forward result from the current grafting experiments was that a dry2
scion can resume an apparent normal growth in a wild-type rootstock. This suggests that dry2
shoots are mostly wild-type and the translocation of a signal produced in dry2 roots is causing the
developmental defects of dry2 shoots. However, when grafted onto dry2 rootstock, wild-type shoots
form vigorous adventitious rooting on scion indicating poor graft connections. Because we have
been unable to generate viable plants using wild-type as scion and dry2 as rootstock despite many
attempts, results suggest that dry2 defective root system is weak rootstock that penalizes shoot
growth and does not allow a viable plant to be produced by grafting a wild-type shoot onto a dry2
root. The finding that a dry2/sud1-9 rootstock behaves as a wild-type provides further support to
the hypothesis that a signaling molecule accumulates in dry2 roots that is absence in both wild-
type and dry2/sud1-9 roots. The observed phenotypes can be explain by other possibilities that are
not mutually exclusive: (1) that a dry2 defective root system architecture is unable to ensure the
necessary nutrient uptake into a wild-type shoot; (2) the presence of a root mobile signal that can
restore normal development of the dry2 mutant shoot.
The Nature of the Long-distance Signal Impaired in dry2
It is likely that the accumulation of pathway(s) intermediate(s), or derivative(s), upstream of
DRY2/SQE1 is the signal causing the dry2 dramatic phenotypes. These signal most likely results
from the reduction of DRY2/SQE1 and the concomitant feed-back upregulation of HMGR activity.
This is inferred by the findings that inhibition of HMGR with atorvastatin partially recovered dry2
root defects and that exogenous application of MVA caused dry2/sud1-9 and dry2/sud1-22 (but
not wild-type) to phenocopy dry2 (Doblas, Amorim-Silva et al. Submitted). Additionally, as
previously reported, the reduced activity of the dry2 allele produced an important squalene
accumulation and a 2- to 3-fold increase in HMGR activity, the rate-limiting enzyme of the MVA
pathway, in roots but not in shoots. Interestingly, both squalene content and HMGR activity
returned to near wild-type levels in dry2/sud1-9 roots, which suggested that the observed up-
regulation of HMGR activity could be responsible for the dry2 phenotypes (Doblas, Amorim-Silva et
al. Submitted). However, it is unlikely that squalene is the signalling molecule because plants are
able to deal with excess squalene, either endogenously produced or exogenously added, by storing
it as remobilizable cytosolic lipid droplets without obvious phenotypic defects (Wentzinger et al.,
INVESTIGATING USE OF GRAFTING IN THE STUDY OF LONG-DISTANCE ISOPRENOID-DERIVED SIGNALLING IN DRY2
118
2002; Bouvier-Nave et al., 2010). Interestingly, non-sterol MVA-derived compounds upstream of
squalene have been related to the regulation of HMGR protein in response to changes in the levels
of certain pathway products in mammals, yeast, and plants. Degradation of mammalian HMGR is
accelerated by the addition of farnesol (Correll et al., 1994; Meigs et al., 1996), geranylgeraniol,
and its precursor GGPP (Raikkonen et al., 2010). GGPP is also known to regulate the degradation
of HMGR2 protein in yeast (Garza et al., 2009). Surprisingly, the effect of farnesol on plant HMGR
activity seems to be different than in mammals. The addition of farnesol to tobacco BY-2 cells at
concentrations below those causing acute toxicity had a drastic stimulatory effect on HMGR activity
paralleled by activation of HMGR transcription and translation (Hemmerlin and Bach, 2000). Thus,
it can be speculated that enhanced FPP-derived farnesol levels in the dry2 background could play a
role in both the observed activation of HMGR and the development of the dry2 phenotypes,
although the regulatory mechanism controlling HMGR activity in Arabidopsis and tobacco cells
would operate at different levels. Although it was shown that squalene accumulates at high levels in
dry2, and this accumulation is almost completely abolished in the suppressors, western blots
analysis did not reveal differences in HMGR protein content between wild-type, dry2, dry2/sud1-9
and dry2/sud1-22 shoots and roots (Doblas, Amorim-Silva et al. Submitted). These results are
consistent with previous observations showing that a pharmacological block of Arabidopsis
squalene epoxidase activity with terbinafine leads to posttranslational up-regulation of HMGR
activity (Nieto et al., 2009) and, more importantly, exclude the possibility that SUD1 may have a
direct effect on HMGR degradation resulting in differences in protein levels.
7.4. MATERIALS AND METHODS
Plant Material
The Arabidopsis thaliana ecotypes Landsberg erecta (Ler) and Columbia-0 (Col-0) were used as wild-type controls in the present study. Mutants used in this study that have been previously described: dry2 (Pose et al., 2009) and dry2/sud9 (Pose, 2008). The dig4 mutant was kindly supplied by Dr. Liming Xiong from the Plant Stress Genomics Research Center of the King Abdullah University of Science and Technology Thuwal, Kingdom of Saudi Arabia.
INVESTIGATING USE OF GRAFTING IN THE STUDY OF LONG-DISTANCE ISOPRENOID-DERIVED SIGNALLING IN DRY2
119
Arabidopsis Grafting
Arabidopsis seeds were germinated in solid 0.5x MS medium containing 0.6% (w/v) phytagel (Sigma). Seedlings were grown vertically for 4 days and then transferred to a 0.22 μm sterile filter (Millipore) previously placed in contact with the medium. Seedlings were grown under long-day photoperiod and standard conditions. Three days later, seedlings were grafted in a flow chamber with the aid of a VWR stereomicroscope, a sterile razor blade (to cut), and a sterile tweezer (to move plants). The type of grafting was a wedge graft (Y shape) as described in Turnbull et al. (2002; 2010). Afterwards, plates were wet with sterile u.p. water, sealed with Parafilm and grown vertically for another seven days without moving the plates. Selected grafts were put in soil with a high content of water and covered with plastic to maintain a high humidity content. Three days later, the plastic cover was punctured to allow plants a slow but efficient adaption to normal humidity conditions. After 3 days, the plastic was completely removed, and 3-4 days later plants started to be watered every two days. A total of 20-30 plants were grafted per each graft combination.
Sequencing Analysis to Confirm Successful Grafting Unions
Shoot and root tissues were collected for each grafted plant and DNA extraction was performed to confirm successful grafting unions by sequencing analysis. Distinct methods were used to obtain genomic DNA from Shoot and root tissues of grafted plants. The Fast Genomic Extraction method was used to isolate genomic DNA from shoot tissue (Appendix I, section 1.1.1) and genomic DNA from root tissue was isolated using the ZR Plant/Seed DNA Kit (Zymo Research). Successful grafting unions were confirmed by PCR amplification and sequencing of the regions that contain the dry2 and sud1-9 mutations. PCR amplification and sequencing of the region containg the dry2 mutation, using the primers displayed in Table 7.1, allowed to distinguish those plant tissues that were genetically dry2 from those that were genetically Ler. PCR amplification and sequencing of the region containing the sud1-9 mutation, using the primers displayed in Table 7.2, allowed to distinguish those plant tissues that were genetically sud1-9 from those that were genetically Ler. Standard molecular biology methods, used in the present work, are presented in more detail in Appendix I.
Table 7.1 – Primers Used to Specifically Amplify and Sequence the Region Containg the dry2 Mutation
Name Sequence (5’→3’) Annealing temperature (ºC)
Polymorphism Amplification
product size (bp)
At1g58440 F-Sec ATTGTTCTCGGTTGGGTGAG 58
Substitution of glycine (Ler) by an arginine (dry2)
432 At1g58440 R-Sec ATTGTTCTCGGTTGGGTGAG
Table 7.2 – Primers Used to Specifically Amplify and Sequence the Region Containg the sud1-9 Mutation
Name Sequence (5’→3’) Annealing temperature (ºC)
Polymorphism Amplification
product size (bp)
At4g34100 – 2F TTCTGCGGTTGAGTTTTGTG
60 Substitution of glycine (Ler)
by an arginine (sud1-9) 1132
At4g34100 – 2R TTCCAACAGTCAGTGGCTCA


Chapter 8 Concluding Remarks and Future Perspectives
CONTENTS
8.1. CONCLUDING REMARKS A Genetic Approach to Identify Regulators of the MVA Biosynthetic Pathway
8.2. CONCLUDING REMARKS AND FUTURE PERSPECTIVES Regulation of HMGR Activity by SUD1 Looking for the Identification of a New MVA-derived Signal Putatively Involved into Plant Long-distance Signalling

CHAPTER 8. CONCLUDING REMARKS AND FUTURE PERSPECTIVES
123
8.1. CONCLUDING REMARKS
A Genetic Approach to Identify Regulators of the MVA Biosynthetic Pathway
Mutations in the sterol biosynthetic DRY2/SQE1 gene produce, in addition to extreme
drought hypersensitivity, multiple developmental defects. In contrast to null alleles of SQE1 such as
SQE1-3, the hypomorphic DRY2/SQE1-5 allele is fully fertile, being a useful tool to further
investigations. As a way to find new components regulating lipid biosynthesis or signalling in plants
a genetic screening for suppressors of dry2 was performed (Pose, 2008). In the present study,
detailed phenotypic, bioinformatic and genetic analyses of several of these suppressors was
performed. Here, it is shown that all mutations affect the At4g34100 gene that likely encodes the
E3 ubiquitin ligase ortholog to the yeast Doa10 and mammalian TEB4 proteins involved in the
ERAD-C pathway. By using biochemical and molecular approaches, it was revealed that the
mechanism by which mutations in SUD1 recovers the defects of dry2 is through reverting the
activity of HMGR to wild-type levels (Doblas, Amorim-Silva et al., submitted).
8.2. CONCLUDING REMARKS AND FUTURE PERSPECTIVES
Regulation of HMGR Activity by SUD1
Most of the information of ERAD comes from yeast and mammals (Carvalho et al., 2006;
Vembar and Brodsky, 2008; Carvalho et al., 2010; Smith et al., 2011). The HRD pathway is
involved in the degradation of misfolded ER-luminal and intramembrane domains. The finding that
feedback regulation of sterol synthesis in mammalian cells uses the ERAD machinery (Hampton,
2002) illustrates co-option of the basic quality control mechanism for regulatory processes and
reveals potential functions in cell-to-cell signalling. In the last few years several reports are shedding
light into the role of ERAD in plants. Thus, the ERAD-HRD pathway has been described to be
important in the regulation of MLO and BRI proteins and has been defined as important for plant
responses to environmental stress (Muller et al., 2005; Liu et al., 2011; Su et al., 2011; Cui et al.,
2012).
CHAPTER 8. CONCLUDING REMARKS AND FUTURE PERSPECTIVES
124
In yeast, proteins with misfolded cytosolic domains are degraded rapidly and require the
ubiquitin ligase Doa10 protein (Swanson et al., 2001). Doa10 has broad substrate specificity,
encompassing membrane proteins as well as soluble cytosolic and nuclear proteins and even
exhibits some functional overlap with Hrd1 (Hitchcock et al., 2003; Gnann et al., 2004). However,
Doa10 or TEB4 have not a reported role in HMGR regulation. In plants, several evidences indicated
that SUD1 positively regulates HMGR activity in the presence of a likely isoprenoid or isoprenoid-
derived molecule (Doblas, Amorim-Silva et al., submitted). Though, SUD1 does not exert its
function through controlling HMGR protein levels (Doblas, Amorim-Silva et al., submitted). Because
SUD1 encodes an E3 ubiquitin ligase the most likely explanation is that a negative regulator of
HMGR is being degraded in a SUD1-dependent way in dry2. Loss of SUD1 function would impair
the degradation of this negative regulator, leading to recovery of HMGR activity to wild-type levels. It
has been proposed that the major changes in HMGR activity in plants would be determined at the
transcriptional level, whereas the post-translational control would allow a finer and faster
adjustment (Chappell, 1995). Whereas transcriptional modulation of HMGR has been
demonstrated in many plant systems, evidence of regulatory mechanisms controlling HMGR
activity at the post-translational level is much less known. Metabolic perturbation by enhancing or
depleting the flux through the sterol pathway in Arabidopsis causes compensatory response in
HMGR activity, without changes in transcript or protein levels (Nieto et al., 2009). Recently, it has
been shown that inactivation of the Arabidopsis WD protein PRL1 leads to reduced HMGR activity
with no changes in transcript and protein levels (Flores-Pérez et al., 2010). It has been suggested
that this effect could be related to the ability of PRL1 to interact and to inhibit the activity of the
Arabidopsis SNF1-related protein kinases (SnRK1) AKIN10 and AKIN11 (Bhalerao et al., 1999),
presumably targeting them for ubiquitination and proteasomal degradation (Lee et al., 2008). Plant
SnRK1 phosphorylates and inactivates HMGR (Dale et al., 1995; Sugden et al., 1999). Therefore,
the loss of PRL1 function would result in increased SnRK1 activity and subsequently increased
phosphorylation and decreased activity of HMGR. It has also been described that activity level of
HMGR is negatively regulated by PP2A-mediated dephosphorylation (Leivar et al., 2011). As a
result, the negative regulators of Arabidopsis HMGR activity SnRK1 and PP2A are likely candidates
mediating SUD1 regulation of HMGR activity. An alternative possibility is that SUD1 produce the
direct monoubiquitination of HMGR, therefore increasing its activity, as reported for other proteins
(Schnell and Hicke, 2003). Although this possibility seems unlikely, because for this to occur
HMGR and SUD1 must be in the same compartment and HMGR localizes in vesicule-like structures

CHAPTER 8. CONCLUDING REMARKS AND FUTURE PERSPECTIVES
125
(Leivar et al., 2005), it cannot be completely ruled out because these spherical structures are most
likely derived from the ER (Leivar et al., 2005) which would enable HMGR and SUD1 to directly
interact. Although there is not available data for the subcellular localization of SUD1, other ERAD
components, such HRD3 and UBC32, have been shown to have ER localization (Liu et al., 2011;
Cui et al., 2012). Moreover, UBC32 has been shown to interact with the SUD1 homolog
At4g32670 using luciferase complementation imaging assays (Cui et al., 2012), suggesting that
SUD1 will be also located in the ER.
Overall, by using a genetic, physiological, biochemical and molecular approaches it was
shown that the E3 ubiquitin ligase SUD1 is a regulator of HMGR activity. Future research should
help to clarify the mechanistic basis for the ERAD regulation of HMGR activity and what signals are
implicated in this regulation.
Looking for the Identification of a New MVA-derived Signal Putatively Involved into
Plant Long-distance Signalling
An important feature of dry2 mutation is the strong effect on ROS production. In dry2
mutant, not only root hairs have an ectopic ROS production, but also the shoots show a significant
lack of ROS, causing phenotypic defects in anisotropic growth and stomatal function (Pose, 2008).
The results here presented show that ROS production are similar to wild-type in the dry2
suppressors, indicating that the MVA-derived signal that accumulates in dry2 is responsible for ROS
regulation. The suppression of dry2 root defects by the external application of ROS generators
suggests that ROS-dependent signalling events are impaired in dry2. Given that, it is expected that
the dry2 HYPER-AS double mutant will allow a more comprehensive and sensitive approach to
elucidate the mechanism of ROS distribution, that is impaired in the dry2 mutant and restored into
to the dry2 suppressors. Additionally, the grafting results here presented show that Arabidopsis
DYR2/SQE1 gene, present in root or hypocotyls tissue, regulate a currently unrecognized signal
capable of acting over long distances to regulate shoot development. Thus, implicates the
DYR2/SQE1 gene in regulation of transmissible signals involved in developmental and physiological
processes. Additionally, it is demonstrated that this long-distance signal, lacking in dry2 mutant, is
restored in dry2 mutant background by the sud1-9 second-site mutation. Additional biochemical
studies will allow confirming if dry2 rootstock sud1-9 scion grafted plants recover ROS production
in shoots. However, further studies will be needed to uncover the nature of the long-distance
signalling impaired in dry2.


Chapter 9 Bibliographic References


CHAPTER 9. BIBLIOGRAPHIC REFERENCES
129
BIBLIOGRAPHIC REFERENCES
Ahuja, I., de Vos, R.C., Bones, A.M., and Hall, R.D. (2010). Plant molecular stress responses face climate change. Trends Plant Sci 15, 664-674.
Alonso, J.M., and Ecker, J.R. (2006). Moving forward in reverse: genetic technologies to enable genome-wide phenomic screens in Arabidopsis. Nat Rev Genet 7, 524-536.
Apel, K., and Hirt, H. (2004). Reactive oxygen species: metabolism, oxidative stress, and signal transduction. Annu Rev Plant Biol 55, 373-399.
Asada, K. (2006). Production and scavenging of reactive oxygen species in chloroplasts and their functions. Plant Physiol 141, 391-396.
Ausubel, F.M., Brent, R., Kingston, R.E., Moore, D.D., Seidman, J.G., Smith, J.A., and Struhl, K. (1996). Current Protocols in Molecular Biology. (New York: Grenn Publishing Associates and Wiley InterScience).
Azevedo, H., Silva-Correia, J., Oliveira, J., Laranjeira, S., Barbeta, C., Amorim-Silva, V., Botella, M.A., Lino-Neto, T., and Tavares, R.M. (2011). A strategy for the identification of new abiotic stress determinants in Arabidopsis using web-based data mining and reverse genetics. OMICS 15, 935-947.
Babiychuk, E., Bouvier-Nave, P., Compagnon, V., Suzuki, M., Muranaka, T., Van Montagu, M., Kushnir, S., and Schaller, H. (2008). Allelic mutant series reveal distinct functions for Arabidopsis cycloartenol synthase 1 in cell viability and plastid biogenesis. Proc Natl Acad Sci U S A 105, 3163-3168.
Baginsky, S., Hennig, L., Zimmermann, P., and Gruissem, W. (2010). Gene expression analysis, proteomics, and network discovery. Plant Physiol 152, 402-410.
Bazirgan, O.A., Garza, R.M., and Hampton, R.Y. (2006). Determinants of RING-E2 fidelity for Hrd1p, a membrane-anchored ubiquitin ligase. J Biol Chem 281, 38989-39001.
Beato, M., Herrlich, P., and Schutz, G. (1995). Steroid hormone receptors: many actors in search of a plot. Cell 83, 851-857.
Belousov, V.V., Fradkov, A.F., Lukyanov, K.A., Staroverov, D.B., Shakhbazov, K.S., Terskikh, A.V., and Lukyanov, S. (2006). Genetically encoded fluorescent indicator for intracellular
hydrogen peroxide. Nat Methods 3, 281-286.
Bensinger, S.J., Bradley, M.N., Joseph, S.B., Zelcer, N., Janssen, E.M., Hausner, M.A., Shih, R., Parks, J.S., Edwards, P.A., Jamieson, B.D., and Tontonoz, P. (2008). LXR signaling couples sterol metabolism to proliferation in the acquired immune response. Cell 134, 97-111.
Benveniste, P. (2002). Sterol Metabolism. The Arabidopsis Book, e0004.
Benveniste, P. (2004). Biosynthesis and accumulation of sterols. Annu Rev Plant Biol 55, 429-457.
Bhalerao, R.P., Salchert, K., Bakó, L., Ökrész, L., Szabados, L., Muranaka, T., Machida, Y., Schell, J., and Koncz, C. (1999). Regulatory interaction of PRL1 WD protein with Arabidopsis SNF1-like protein kinases. Proc Natl Acad Sci U S A 96, 5322-5327.
CHAPTER 9. BIBLIOGRAPHIC REFERENCES
130
Bienert, G.P., Schjoerring, J.K., and Jahn, T.P. (2006). Membrane transport of hydrogen peroxide. Biochim Biophys Acta 1758, 994-1003.
Bienert, G.P., Moller, A.L., Kristiansen, K.A., Schulz, A., Moller, I.M., Schjoerring, J.K., and Jahn, T.P. (2007). Specific aquaporins facilitate the diffusion of hydrogen peroxide across membranes. J Biol Chem 282, 1183-1192.
Bischoff, F., Vahlkamp, L., Molendijk, A., and Palme, K. (2000). Localization of AtROP4 and AtROP6 and interaction with the guanine nucleotide dissociation inhibitor AtRhoGDI1 from Arabidopsis. Plant Mol Biol 42, 515-530.
Borsani, O., Cuartero, J., Valpuesta, V., and Botella, M.A. (2002). Tomato tos1 mutation identifies
a gene essential for osmotic tolerance and abscisic acid sensitivity. Plant J 32, 905-914.
Boutte, Y., and Grebe, M. (2009). Cellular processes relying on sterol function in plants. Curr Opin Plant Biol 12, 705-713.
Bouvier-Nave, P., Berna, A., Noiriel, A., Compagnon, V., Carlsson, A.S., Banas, A., Stymne, S., and Schaller, H. (2010). Involvement of the phospholipid sterol acyltransferase1 in plant sterol
homeostasis and leaf senescence. Plant Physiol 152, 107-119.
Bowler, C., Slooten, L., Vandenbranden, S., De Rycke, R., Botterman, J., Sybesma, C., Van Montagu, M., and Inze, D. (1991). Manganese superoxide dismutase can reduce cellular damage mediated by oxygen radicals in transgenic plants. EMBO J 10, 1723-1732.
Boyer, J.S. (1982). Plant productivity and environment. Science 218, 443-448.
Buchanan, B.B., Gruissem, W., and Jones, R.L. (2000). Biochemistry & molecular biology of plants. (Rockville, Md.: American Society of Plant Physiologists).
Bullock, W.O., Fernandez, J.M., and Short, J.M. (1987). XL1-Blue: A high efficiency plasmid transforming recA Escherichia coli strain with beta-galactosidase selection. Biotechniques Vol. 5, pp. 376-379.
Campos, N., and Boronat, A. (1995). Targeting and topology in the membrane of plant 3-hydroxy-3-
methylglutaryl coenzyme A reductase. Plant Cell 7, 2163-2174.
Carland, F.M., Fujioka, S., Takatsuto, S., Yoshida, S., and Nelson, T. (2002). The identification of CVP1 reveals a role for sterols in vascular patterning. Plant Cell 14, 2045-2058.
Carol, R.J., and Dolan, L. (2006). The role of reactive oxygen species in cell growth: lessons from root
hairs. J Exp Bot 57, 1829-1834.
Carol, R.J., Takeda, S., Linstead, P., Durrant, M.C., Kakesova, H., Derbyshire, P., Drea, S., Zarsky, V., and Dolan, L. (2005). A RhoGDP dissociation inhibitor spatially regulates growth in root hair cells. Nature 438, 1013-1016.
Carvalho, P., Goder, V., and Rapoport, T.A. (2006). Distinct ubiquitin-ligase complexes define
convergent pathways for the degradation of ER proteins. Cell 126, 361-373.
Carvalho, P., Stanley, A.M., and Rapoport, T.A. (2010). Retrotranslocation of a misfolded luminal ER protein by the ubiquitin-ligase Hrd1p. Cell 143, 579-591.
Chappell, J. (1995). The Biochemistry and Molecular Biology of Isoprenoid Metabolism. Plant Physiol 107, 1-6.
CHAPTER 9. BIBLIOGRAPHIC REFERENCES
131
Chau, V., Tobias, J.W., Bachmair, A., Marriott, D., Ecker, D.J., Gonda, D.K., and Varshavsky, A. (1989). A multiubiquitin chain is confined to specific lysine in a targeted short-lived protein. Science 243, 1576-1583.
Choe, S., Dilkes, B.P., Gregory, B.D., Ross, A.S., Yuan, H., Noguchi, T., Fujioka, S., Takatsuto, S., Tanaka, A., Yoshida, S., Tax, F.E., and Feldmann, K.A. (1999). The Arabidopsis dwarf1 mutant is defective in the conversion of 24-methylenecholesterol to campesterol in brassinosteroid biosynthesis. Plant Physiol 119, 897-907.
Clark, R.M., Schweikert, G., Toomajian, C., Ossowski, S., Zeller, G., Shinn, P., Warthmann, N., Hu, T.T., Fu, G., Hinds, D.A., Chen, H., Frazer, K.A., Huson, D.H., Scholkopf, B., Nordborg, M., Ratsch, G., Ecker, J.R., and Weigel, D. (2007). Common sequence polymorphisms shaping genetic diversity in Arabidopsis thaliana. Science 317, 338-342.
Clough, S.J., and Bent, A.F. (1998). Floral dip: a simplified method for Agrobacterium-mediated transformation of Arabidopsis thaliana. Plant J 16, 735-743.
Clouse, S.D. (2002). Arabidopsis mutants reveal multiple roles for sterols in plant development. Plant Cell 14, 1995-2000.
Correll, C.C., Ng, L., and Edwards, P.A. (1994). Identification of farnesol as the non-sterol derivative of mevalonic acid required for the accelerated degradation of 3-hydroxy-3-methylglutaryl-coenzyme A reductase. J Biol Chem 269, 17390-17393.
Costa, A., Drago, I., Behera, S., Zottini, M., Pizzo, P., Schroeder, J.I., Pozzan, T., and Lo Schiavo, F. (2010). H2O2 in plant peroxisomes: an in vivo analysis uncovers a Ca(2+)-dependent scavenging system. Plant J 62, 760-772.
Cui, F., Liu, L., Zhao, Q., Zhang, Z., Li, Q., Lin, B., Wu, Y., Tang, S., and Xie, Q. (2012). Arabidopsis Ubiquitin Conjugase UBC32 Is an ERAD Component That Functions in Brassinosteroid-Mediated Salt Stress Tolerance. Plant Cell.
Curtis, M.D., and Grossniklaus, U. (2003). A gateway cloning vector set for high-throughput functional analysis of genes in planta. Plant Physiol 133, 462-469.
Dale, S., Arró, M., Becerra, B., Morrice, N.G., Boronat, A., Hardie, D.G., and Ferrer, A. (1995).
Bacterial Expression of the Catalytic Domain of 3–Hydroxy-3–Methylglutaryl-CoA Reductase (Isoform HMGR1) from Arabidopsis thaliana, and Its Inactivation by Phosphorylation at Ser577 by Brassica oleracea 3-Hydroxy-3-Methylglutaryl-CoA Reductase Kinase. European Journal of Biochemistry 233, 506-513.
DeBose-Boyd, R.A. (2008). Feedback regulation of cholesterol synthesis: sterol-accelerated ubiquitination and degradation of HMG CoA reductase. Cell Res 18, 609-621.
del Rio, L.A., Sandalio, L.M., Corpas, F.J., Palma, J.M., and Barroso, J.B. (2006). Reactive
oxygen species and reactive nitrogen species in peroxisomes. Production, scavenging, and role in cell signaling. Plant Physiol 141, 330-335.
Deng, M., and Hochstrasser, M. (2006). Spatially regulated ubiquitin ligation by an ER/nuclear membrane ligase. Nature 443, 827-831.
Deshaies, R.J., and Joazeiro, C.A. (2009). RING domain E3 ubiquitin ligases. Annu Rev Biochem 78, 399-434.
CHAPTER 9. BIBLIOGRAPHIC REFERENCES
132
Diebold, B.A., and Bokoch, G.M. (2001). Molecular basis for Rac2 regulation of phagocyte NADPH oxidase. Nat Immunol 2, 211-215.
Diekmann, D., Abo, A., Johnston, C., Segal, A.W., and Hall, A. (1994). Interaction of Rac with
p67phox and regulation of phagocytic NADPH oxidase activity. Science 265, 531-533.
Diener, A.C., Li, H., Zhou, W., Whoriskey, W.J., Nes, W.D., and Fink, G.R. (2000). Sterol methyltransferase 1 controls the level of cholesterol in plants. Plant Cell 12, 853-870.
Edwards, P.A., and Ericsson, J. (1999). Sterols and isoprenoids: signaling molecules derived from the
cholesterol biosynthetic pathway. Annu Rev Biochem 68, 157-185.
Enjuto, M., Balcells, L., Campos, N., Caelles, C., Arro, M., and Boronat, A. (1994). Arabidopsis thaliana contains two differentially expressed 3-hydroxy-3-methylglutaryl-CoA reductase genes, which encode microsomal forms of the enzyme. Proc Natl Acad Sci U S A 91, 927-931.
Eun, S.O., and Lee, Y. (1997). Actin filaments of guard cells are reorganized in response to light and
abscisic acid. Plant Physiol 115, 1491-1498.
Farese, R.V., Jr., and Herz, J. (1998). Cholesterol metabolism and embryogenesis. Trends Genet 14, 115-120.
Feng, C.-P., and Mundy, J. (2006). Gene Discovery and Functional Analyses in the Model Plant Arabidopsis. Journal of Integrative Plant Biology 48, 5-14.
Finger, A., Knop, M., and Wolf, D.H. (1993). Analysis of two mutated vacuolar proteins reveals a degradation pathway in the endoplasmic reticulum or a related compartment of yeast. Eur J Biochem 218, 565-574.
Flores-Pérez, Ú., Pérez-Gil, J., Closa, M., Wright, L.P., Botella-Pavía, P., Phillips, M.A., Ferrer, A., Gershenzon, J., and Rodríguez-Concepción, M. (2010). PLEIOTROPIC REGULATORY LOCUS 1 (PRL1) Integrates the Regulation of Sugar Responses with Isoprenoid Metabolism in Arabidopsis. Molecular Plant 3, 101-112.
Foreman, J., Demidchik, V., Bothwell, J.H., Mylona, P., Miedema, H., Torres, M.A., Linstead, P., Costa, S., Brownlee, C., Jones, J.D., Davies, J.M., and Dolan, L. (2003). Reactive oxygen species produced by NADPH oxidase regulate plant cell growth. Nature 422, 442-446.
Fry, S.C. (1998). Oxidative scission of plant cell wall polysaccharides by ascorbate-induced hydroxyl radicals. Biochem J 332 ( Pt 2), 507-515.
Fryer, M.J., Oxborough, K., Mullineaux, P.M., and Baker, N.R. (2002). Imaging of photo-oxidative stress responses in leaves. J Exp Bot 53, 1249-1254.
Gadjev, I., Vanderauwera, S., Gechev, T.S., Laloi, C., Minkov, I.N., Shulaev, V., Apel, K., Inze, D., Mittler, R., and Van Breusegem, F. (2006). Transcriptomic footprints disclose specificity of reactive oxygen species signaling in Arabidopsis. Plant Physiol 141, 436-445.
Gao, X., Lu, F., Zhou, L., Dang, S., Sun, L., Li, X., Wang, J., and Shi, Y. (2009). Structure and mechanism of an amino acid antiporter. Science 324, 1565-1568.
Gapper, C., and Dolan, L. (2006). Control of plant development by reactive oxygen species. Plant Physiol 141, 341-345.
CHAPTER 9. BIBLIOGRAPHIC REFERENCES
133
Gardner, R.G., Swarbrick, G.M., Bays, N.W., Cronin, S.R., Wilhovsky, S., Seelig, L., Kim, C., and Hampton, R.Y. (2000). Endoplasmic reticulum degradation requires lumen to cytosol signaling. Transmembrane control of Hrd1p by Hrd3p. J Cell Biol 151, 69-82.
Garza, R.M., Tran, P.N., and Hampton, R.Y. (2009). Geranylgeranyl pyrophosphate is a potent regulator of HRD-dependent 3-Hydroxy-3-methylglutaryl-CoA reductase degradation in yeast. J Biol Chem 284, 35368-35380.
Gendron, J.M., and Wang, Z.Y. (2007). Multiple mechanisms modulate brassinosteroid signaling. Curr Opin Plant Biol 10, 436-441.
Gnann, A., Riordan, J.R., and Wolf, D.H. (2004). Cystic fibrosis transmembrane conductance regulator
degradation depends on the lectins Htm1p/EDEM and the Cdc48 protein complex in yeast. Mol Biol Cell 15, 4125-4135.
Godar, D.E. (1999). UVA1 radiation triggers two different final apoptotic pathways. J Invest Dermatol 112, 3-12.
Goldstein, J.L., and Brown, M.S. (1990). Regulation of the mevalonate pathway. Nature 343, 425-430.
Gondet, L., Bronner, R., and Benveniste, P. (1994). Regulation of Sterol Content in Membranes by Subcellular Compartmentation of Steryl-Esters Accumulating in a Sterol-Overproducing Tobacco Mutant. Plant Physiol 105, 509-518.
Gonnet, G.H., Cohen, M.A., and Benner, S.A. (1992). Exhaustive matching of the entire protein sequence database. Science 256, 1443-1445.
Griffith, M., and Gietz, R.D. (2003). Escherichia coli endA deletion strain for use in two-hybrid shuttle
vector selection. Biotechniques 35, 272-274, 276, 278.
Guthrie, C., and Fink, G.R. (1991). Guide to Yeast Genetics and Molecular Biology. (San Diego: Academic Press).
Haglund, K., Di Fiore, P.P., and Dikic, I. (2003). Distinct monoubiquitin signals in receptor endocytosis. Trends Biochem Sci 28, 598-603.
Halliwell, B., and Gutteridge, J.M.C. (1999). Free radicals in biology and medicine. (Oxford, New York: Clarendon Press; Oxford University Press).
Hampton, R.Y. (2002). ER-associated degradation in protein quality control and cellular regulation. Curr Opin Cell Biol 14, 476-482.
Hampton, R.Y., and Garza, R.M. (2009). Protein quality control as a strategy for cellular regulation:
lessons from ubiquitin-mediated regulation of the sterol pathway. Chem Rev 109, 1561-1574.
Hampton, R.Y., Gardner, R.G., and Rine, J. (1996). Role of 26S proteasome and HRD genes in the degradation of 3-hydroxy-3-methylglutaryl-CoA reductase, an integral endoplasmic reticulum membrane protein. Mol Biol Cell 7, 2029-2044.
Harker, M., Holmberg, N., Clayton, J.C., Gibbard, C.L., Wallace, A.D., Rawlins, S., Hellyer, S.A., Lanot, A., and Safford, R. (2003). Enhancement of seed phytosterol levels by expression
of an N-terminal truncated Hevea brasiliensis (rubber tree) 3-hydroxy-3-methylglutaryl-CoA reductase. Plant Biotechnol J 1, 113-121.
CHAPTER 9. BIBLIOGRAPHIC REFERENCES
134
Hartmann, M.-A. (1998). Plant sterols and the membrane environment. Trends in plant science 3, 170-175.
Hassink, G., Kikkert, M., van Voorden, S., Lee, S.J., Spaapen, R., van Laar, T., Coleman, C.S., Bartee, E., Fruh, K., Chau, V., and Wiertz, E. (2005). TEB4 is a C4HC3 RING finger-
containing ubiquitin ligase of the endoplasmic reticulum. Biochem J 388, 647-655.
He, J.X., Fujioka, S., Li, T.C., Kang, S.G., Seto, H., Takatsuto, S., Yoshida, S., and Jang, J.C. (2003). Sterols regulate development and gene expression in Arabidopsis. Plant Physiol 131, 1258-1269.
Hegde, R.S., and Ploegh, H.L. (2010). Quality and quantity control at the endoplasmic reticulum. Curr Opin Cell Biol 22, 437-446.
Hemmerlin, A., and Bach, T.J. (2000). Farnesol-induced cell death and stimulation of 3-hydroxy-3-methylglutaryl-coenzyme A reductase activity in tobacco cv bright yellow-2 cells. Plant Physiol 123, 1257-1268.
Hershko, A., and Ciechanover, A. (1998). The ubiquitin system. Annu Rev Biochem 67, 425-479.
Hetherington, A.M., and Woodward, F.I. (2003). The role of stomata in sensing and driving
environmental change. Nature 424, 901-908.
Hicke, L., Schubert, H.L., and Hill, C.P. (2005). Ubiquitin-binding domains. Nat Rev Mol Cell Biol 6, 610-621.
Hirsch, C., Gauss, R., Horn, S.C., Neuber, O., and Sommer, T. (2009). The ubiquitylation machinery of the endoplasmic reticulum. Nature 458, 453-460.
Hitchcock, A.L., Auld, K., Gygi, S.P., and Silver, P.A. (2003). A subset of membrane-associated
proteins is ubiquitinated in response to mutations in the endoplasmic reticulum degradation machinery. Proc Natl Acad Sci U S A 100, 12735-12740.
Horton, R.F. (1971). Stomatal opening: the role of abscisic acid. Canadian Journal of Botany 49, 583-585.
Hruz, T., Laule, O., Szabo, G., Wessendorp, F., Bleuler, S., Oertle, L., Widmayer, P., Gruissem, W., and Zimmermann, P. (2008). Genevestigator v3: a reference expression database for the
meta-analysis of transcriptomes. Adv Bioinformatics 2008, 420747.
Hunter, S., Apweiler, R., Attwood, T.K., Bairoch, A., Bateman, A., Binns, D., Bork, P., Das, U., Daugherty, L., Duquenne, L., Finn, R.D., Gough, J., Haft, D., Hulo, N., Kahn, D., Kelly, E., Laugraud, A., Letunic, I., Lonsdale, D., Lopez, R., Madera, M., Maslen, J., McAnulla, C., McDowall, J., Mistry, J., Mitchell, A., Mulder, N., Natale, D., Orengo, C., Quinn, A.F., Selengut, J.D., Sigrist, C.J., Thimma, M., Thomas, P.D., Valentin, F., Wilson, D., Wu, C.H., and Yeats, C. (2009). InterPro: the integrative protein signature database. Nucleic Acids Res 37, D211-215.
Huyer, G., Piluek, W.F., Fansler, Z., Kreft, S.G., Hochstrasser, M., Brodsky, J.L., and Michaelis, S. (2004). Distinct machinery is required in Saccharomyces cerevisiae for the
endoplasmic reticulum-associated degradation of a multispanning membrane protein and a soluble luminal protein. J Biol Chem 279, 38369-38378.
CHAPTER 9. BIBLIOGRAPHIC REFERENCES
135
Hwang, J.U., and Lee, Y. (2001). Abscisic acid-induced actin reorganization in guard cells of dayflower is mediated by cytosolic calcium levels and by protein kinase and protein phosphatase activities. Plant Physiol 125, 2120-2128.
Ismail, N., and Ng, D.T.W. (2006). Have you HRD? Understanding ERAD Is DOAble! Cell 126, 237-239.
Ito, H., Fukuda, Y., Murata, K., and Kimura, A. (1983 ). Transformation of intact ells treated with alkali cations. J. Bacteriol. 153, 163-168.
Jabs, T., Dietrich, R.A., and Dangl, J.L. (1996). Initiation of runaway cell death in an Arabidopsis mutant by extracellular superoxide. Science 273, 1853-1856.
Jander, G., Norris, S.R., Rounsley, S.D., Bush, D.F., Levin, I.M., and Last, R.L. (2002). Arabidopsis map-based cloning in the post-genome era. Plant Physiol 129, 440-450.
Jang, J.C., Fujioka, S., Tasaka, M., Seto, H., Takatsuto, S., Ishii, A., Aida, M., Yoshida, S., and Sheen, J. (2000). A critical role of sterols in embryonic patterning and meristem programming revealed by the fackel mutants of Arabidopsis thaliana. Genes Dev 14, 1485-1497.
Jarosch, E., Taxis, C., Volkwein, C., Bordallo, J., Finley, D., Wolf, D.H., and Sommer, T. (2002). Protein dislocation from the ER requires polyubiquitination and the AAA-ATPase Cdc48. Nat Cell Biol 4, 134-139.
Jones, D.T. (1999). Protein secondary structure prediction based on position-specific scoring matrices. Journal of Molecular Biology 292, 195-202.
Jones, D.T., Taylor, W.R., and Thornton, J.M. (1992). The Rapid Generation of Mutation Data Matrices from Protein Sequences. Comput Appl Biosci 8, 275-282.
Jones, M.A., Shen, J.J., Fu, Y., Li, H., Yang, Z., and Grierson, C.S. (2002). The Arabidopsis Rop2 GTPase is a positive regulator of both root hair initiation and tip growth. Plant Cell 14, 763-776.
Kamauchi, S., Nakatani, H., Nakano, C., and Urade, R. (2005). Gene expression in response to endoplasmic reticulum stress in Arabidopsis thaliana. FEBS J 272, 3461-3476.
Keller, T., Damude, H.G., Werner, D., Doerner, P., Dixon, R.A., and Lamb, C. (1998). A plant homolog of the neutrophil NADPH oxidase gp91phox subunit gene encodes a plasma membrane protein with Ca2+ binding motifs. Plant Cell 10, 255-266.
Kim, H.B., Schaller, H., Goh, C.H., Kwon, M., Choe, S., An, C.S., Durst, F., Feldmann, K.A., and Feyereisen, R. (2005). Arabidopsis cyp51 mutant shows postembryonic seedling lethality associated with lack of membrane integrity. Plant Physiol 138, 2033-2047.
Kirst, M.E., Meyer, D.J., Gibbon, B.C., Jung, R., and Boston, R.S. (2005). Identification and characterization of endoplasmic reticulum-associated degradation proteins differentially affected by endoplasmic reticulum stress. Plant Physiol 138, 218-231.
Klahre, U., Noguchi, T., Fujioka, S., Takatsuto, S., Yokota, T., Nomura, T., Yoshida, S., and Chua, N.H. (1998). The Arabidopsis DIMINUTO/DWARF1 gene encodes a protein involved in steroid synthesis. Plant Cell 10, 1677-1690.
Klotz, L.O., Kroncke, K.D., and Sies, H. (2003). Singlet oxygen-induced signaling effects in mammalian cells. Photochem Photobiol Sci 2, 88-94.

CHAPTER 9. BIBLIOGRAPHIC REFERENCES
136
Knop, M., Finger, A., Braun, T., Hellmuth, K., and Wolf, D.H. (1996). Der1, a novel protein specifically required for endoplasmic reticulum degradation in yeast. EMBO J 15, 753-763.
Koiwa, H., Bressan, R.A., and Hasegawa, P.M. (2006). Identification of plant stress-responsive
determinants in Arabidopsis by large-scale forward genetic screens. J Exp Bot 57, 1119-1128.
Koncz, C., and Schell, J. (1986). The promoter of TL-DNA gene 5 controls the tissue-specific expression of chimaeric genes carried by a novel type of Agrobacterium binary vector Molecular and General Genetics MGG 204, 383-396.
Koornneef, M., Alonso-Blanco, C., and Stam, P. (2006). Genetic analysis. Methods Mol Biol 323, 65-77.
Kostova, Z., Tsai, Y.C., and Weissman, A.M. (2007). Ubiquitin ligases, critical mediators of endoplasmic reticulum-associated degradation. Semin Cell Dev Biol 18, 770-779.
Kreft, S.G., and Hochstrasser, M. (2011). An unusual transmembrane helix in the endoplasmic reticulum ubiquitin ligase Doa10 modulates degradation of its cognate E2 enzyme. J Biol Chem 286, 20163-20174.
Kreft, S.G., Wang, L., and Hochstrasser, M. (2006). Membrane topology of the yeast endoplasmic reticulum-localized ubiquitin ligase Doa10 and comparison with its human ortholog TEB4 (MARCH-VI). J Biol Chem 281, 4646-4653.
Krogh, A., Larsson, B., von Heijne, G., and Sonnhammer, E.L. (2001). Predicting transmembrane protein topology with a hidden Markov model: application to complete genomes. J Mol Biol 305, 567-580.
Kwak, J.M., Nguyen, V., and Schroeder, J.I. (2006). The role of reactive oxygen species in hormonal responses. Plant Physiol 141, 323-329.
Kwak, J.M., Mori, I.C., Pei, Z.M., Leonhardt, N., Torres, M.A., Dangl, J.L., Bloom, R.E., Bodde, S., Jones, J.D., and Schroeder, J.I. (2003). NADPH oxidase AtrbohD and AtrbohF genes function in ROS-dependent ABA signaling in Arabidopsis. EMBO J 22, 2623-2633.
Laloi, C., Apel, K., and Danon, A. (2004). Reactive oxygen signalling: the latest news. Curr Opin Plant Biol 7, 323-328.
Laloi, C., Stachowiak, M., Pers-Kamczyc, E., Warzych, E., Murgia, I., and Apel, K. (2007). Cross-talk between singlet oxygen- and hydrogen peroxide-dependent signaling of stress responses in Arabidopsis thaliana. Proc Natl Acad Sci U S A 104, 672-677.
Lambert, C.R., Stiel, H., Leupold, D., Lynch, M.C., and Kochevar, I.E. (1996). Intensity-dependent enzyme photosensitization using 532 nm nanosecond laser pulses. Photochem Photobiol 63, 154-160.
Laranjeira, S. (2011). Stress-related genes in Arabidopsis thaliana: Investigating the role of squalene epoxidases in sterol biosynthesis and EGY3 as a putative plastidial heat stress determinant. Ph.D Thesis, Universidade do Minho, Braga, Portugal), pp. 256.
Lee, J.H., Terzaghi, W., Gusmaroli, G., Charron, J.B., Yoon, H.J., Chen, H., He, Y.J., Xiong, Y., and Deng, X.W. (2008). Characterization of Arabidopsis and rice DWD proteins and their roles as
substrate receptors for CUL4-RING E3 ubiquitin ligases. Plant Cell 20, 152-167.
CHAPTER 9. BIBLIOGRAPHIC REFERENCES
137
Lee, K.P., Kim, C., Landgraf, F., and Apel, K. (2007). EXECUTER1- and EXECUTER2-dependent transfer of stress-related signals from the plastid to the nucleus of Arabidopsis thaliana. Proc Natl Acad Sci U S A 104, 10270-10275.
Lee, P.C., and Rodgers, M.A. (1987). Laser flash photokinetic studies of rose bengal sensitized photodynamic interactions of nucleotides and DNA. Photochem Photobiol 45, 79-86.
Leivar, P., Antolin-Llovera, M., Ferrero, S., Closa, M., Arro, M., Ferrer, A., Boronat, A., and Campos, N. (2011). Multilevel control of Arabidopsis 3-hydroxy-3-methylglutaryl coenzyme A reductase by protein phosphatase 2A. Plant Cell 23, 1494-1511.
Leivar, P., Gonzalez, V.M., Castel, S., Trelease, R.N., Lopez-Iglesias, C., Arro, M., Boronat, A., Campos, N., Ferrer, A., and Fernandez-Busquets, X. (2005). Subcellular localization of Arabidopsis 3-hydroxy-3-methylglutaryl-coenzyme A reductase. Plant Physiol 137, 57-69.
Lemaux, P.G. (2008). Genetically Engineered Plants and Foods: A Scientist's Analysis of the Issues (Part I). Annu Rev Plant Biol 59, 771-812.
Lemaux, P.G. (2009). Genetically engineered plants and foods: a scientist's analysis of the issues (part II).
Annu Rev Plant Biol 60, 511-559.
Li, H., and Durbin, R. (2009). Fast and accurate short read alignment with Burrows–Wheeler transform. Bioinformatics 25, 1754-1760.
Li, H., Handsaker, B., Wysoker, A., Fennell, T., Ruan, J., Homer, N., Marth, G., Abecasis, G., Durbin, R., and Subgroup, G.P.D.P. (2009). The Sequence Alignment/Map format and
SAMtools. Bioinformatics 25, 2078-2079.
Li, S., Assmann, S.M., and Albert, R. (2006). Predicting essential components of signal transduction networks: a dynamic model of guard cell abscisic acid signaling. PLoS Biol 4, e312.
Liechti, R., and Farmer, E.E. (2002). The jasmonate pathway. Science 296, 1649-1650.
Liszkay, A., van der Zalm, E., and Schopfer, P. (2004). Production of reactive oxygen intermediates (O(2)(.-), H(2)O(2), and (.)OH) by maize roots and their role in wall loosening and elongation growth. Plant Physiol 136, 3114-3123; discussion 3001.
Liu, L., Cui, F., Li, Q., Yin, B., Zhang, H., Lin, B., Wu, Y., Xia, R., Tang, S., and Xie, Q. (2011). The endoplasmic reticulum-associated degradation is necessary for plant salt tolerance. Cell Res 21, 957-969.
Loayza, D., Tam, A., Schmidt, W.K., and Michaelis, S. (1998). Ste6p mutants defective in exit from the endoplasmic reticulum (ER) reveal aspects of an ER quality control pathway in Saccharomyces cerevisiae. Mol Biol Cell 9, 2767-2784.
Lumbreras, V., Campos, N., and Boronat, A. (1995). The use of an alternative promoter in the Arabidopsis thaliana HMG1 gene generates an mRNA that encodes a novel 3-hydroxy-3-methylglutaryl coenzyme A reductase isoform with an extended N-terminal region. The Plant Journal 8, 541-549.
Ma, Q.Q., Wang, W., Li, Y.H., Li, D.Q., and Zou, Q. (2006). Alleviation of photoinhibition in drought-stressed wheat (Triticum aestivum) by foliar-applied glycinebetaine. J Plant Physiol 163, 165-175.

CHAPTER 9. BIBLIOGRAPHIC REFERENCES
138
Mandart, E., Dufour, M.E., and Lacroute, F. (1994). Inactivation of SSM4, a new Saccharomyces cerevisiae gene, suppresses mRNA instability due to rna14 mutations. Mol Gen Genet 245, 323-333.
Manzano, D., Fernandez-Busquets, X., Schaller, H., Gonzalez, V., Boronat, A., Arro, M., and Ferrer, A. (2004). The metabolic imbalance underlying lesion formation in Arabidopsis thaliana overexpressing farnesyl diphosphate synthase (isoform 1S) leads to oxidative stress and is triggered by the developmental decline of endogenous HMGR activity. Planta 219, 982-992.
Marino, D., Dunand, C., Puppo, A., and Pauly, N. (2012). A burst of plant NADPH oxidases. Trends in plant science 17, 9-15.
Martinez, I.M., and Chrispeels, M.J. (2003). Genomic analysis of the unfolded protein response in Arabidopsis shows its connection to important cellular processes. Plant Cell 15, 561-576.
MASC Report. (2011). The Multinational Coordinated Arabidopsis thaliana Functional Genomics Project. In Annual Report.
McAinsh, B.H.M.R.C.A.M. (1990). Abscisic acid-induced elevation of guard cell cytosolic Ca2+ precedes stomatal closure. Nature 343, 186-188.
Meigs, T.E., Roseman, D.S., and Simoni, R.D. (1996). Regulation of 3-hydroxy-3-methylglutaryl-coenzyme A reductase degradation by the nonsterol mevalonate metabolite farnesol in vivo. J Biol Chem 271, 7916-7922.
Melen, K., Krogh, A., and von Heijne, G. (2003). Reliability measures for membrane protein topology prediction algorithms. J Mol Biol 327, 735-744.
Men, S., Boutte, Y., Ikeda, Y., Li, X., Palme, K., Stierhof, Y.D., Hartmann, M.A., Moritz, T., and Grebe, M. (2008). Sterol-dependent endocytosis mediates post-cytokinetic acquisition of PIN2 auxin efflux carrier polarity. Nat Cell Biol 10, 237-244.
Miller, G., Schlauch, K., Tam, R., Cortes, D., Torres, M.A., Shulaev, V., Dangl, J.L., and Mittler, R. (2009). The plant NADPH oxidase RBOHD mediates rapid systemic signaling in response to diverse stimuli. Sci Signal 2, ra45.
Mittler, R. (2002). Oxidative stress, antioxidants and stress tolerance. Trends Plant Sci 7, 405-410.
Mittler, R. (2006). Abiotic stress, the field environment and stress combination. Trends Plant Sci 11, 15-19.
Mittler, R., and Blumwald, E. (2010). Genetic engineering for modern agriculture: challenges and perspectives. Annu Rev Plant Biol 61, 443-462.
Mittler, R., Vanderauwera, S., Gollery, M., and Van Breusegem, F. (2004). Reactive oxygen gene network of plants. Trends Plant Sci 9, 490-498.
Mittler, R., Vanderauwera, S., Suzuki, N., Miller, G., Tognetti, V.B., Vandepoele, K., Gollery, M., Shulaev, V., and Van Breusegem, F. (2011). ROS signaling: the new wave? Trends Plant Sci 16, 300-309.
Molendijk, A.J., Bischoff, F., Rajendrakumar, C.S., Friml, J., Braun, M., Gilroy, S., and Palme, K. (2001). Arabidopsis thaliana Rop GTPases are localized to tips of root hairs and control polar growth. EMBO J 20, 2779-2788.
CHAPTER 9. BIBLIOGRAPHIC REFERENCES
139
Moller, I.M. (2001). PLANT MITOCHONDRIA AND OXIDATIVE STRESS: Electron Transport, NADPH Turnover, and Metabolism of Reactive Oxygen Species. Annu Rev Plant Physiol Plant Mol Biol 52, 561-591.
Moller, I.M., Jensen, P.E., and Hansson, A. (2007). Oxidative modifications to cellular components in plants. Annu Rev Plant Biol 58, 459-481.
Moller, S., Croning, M.D., and Apweiler, R. (2001). Evaluation of methods for the prediction of membrane spanning regions. Bioinformatics 17, 646-653.
Moon, J., Parry, G., and Estelle, M. (2004). The ubiquitin-proteasome pathway and plant development.
Plant Cell 16, 3181-3195.
Mori, I.C., and Schroeder, J.I. (2004). Reactive oxygen species activation of plant Ca2+ channels. A signaling mechanism in polar growth, hormone transduction, stress signaling, and hypothetically mechanotransduction. Plant Physiol 135, 702-708.
Mukhopadhyay, D., and Riezman, H. (2007). Proteasome-independent functions of ubiquitin in
endocytosis and signaling. Science 315, 201-205.
Muller, J., Piffanelli, P., Devoto, A., Miklis, M., Elliott, C., Ortmann, B., Schulze-Lefert, P., and Panstruga, R. (2005). Conserved ERAD-like quality control of a plant polytopic membrane protein. Plant Cell 17, 149-163.
Ng, D.T., Spear, E.D., and Walter, P. (2000). The unfolded protein response regulates multiple aspects
of secretory and membrane protein biogenesis and endoplasmic reticulum quality control. J Cell Biol 150, 77-88.
Niethammer, P., Grabher, C., Look, A.T., and Mitchison, T.J. (2009). A tissue-scale gradient of hydrogen peroxide mediates rapid wound detection in zebrafish. Nature 459, 996-999.
Nieto, B., Fores, O., Arro, M., and Ferrer, A. (2009). Arabidopsis 3-hydroxy-3-methylglutaryl-CoA
reductase is regulated at the post-translational level in response to alterations of the sphingolipid and the sterol biosynthetic pathways. Phytochemistry 70, 53-59.
Noctor, G., and Foyer, C.H. (1998). ASCORBATE AND GLUTATHIONE: Keeping Active Oxygen Under Control. Annu Rev Plant Physiol Plant Mol Biol 49, 249-279.
O'Brien, M., Chantha, S.C., Rahier, A., and Matton, D.P. (2005). Lipid signaling in plants. Cloning
and expression analysis of the obtusifoliol 14alpha-demethylase from Solanum chacoense Bitt., a pollination- and fertilization-induced gene with both obtusifoliol and lanosterol demethylase activity. Plant Physiol 139, 734-749.
O'Brien, P.J. (1991). Molecular mechanisms of quinone cytotoxicity. Chem Biol Interact 80, 1-41.
Ohyama, K., Suzuki, M., Masuda, K., Yoshida, S., and Muranaka, T. (2007). Chemical phenotypes of the hmg1 and hmg2 mutants of Arabidopsis demonstrate the in-planta role of HMG-CoA reductase in triterpene biosynthesis. Chem Pharm Bull (Tokyo) 55, 1518-1521.
Oliveros, J.C. (2007). FIESTA Viewer: Gene Expression data handling made easy.

CHAPTER 9. BIBLIOGRAPHIC REFERENCES
140
op den Camp, R.G., Przybyla, D., Ochsenbein, C., Laloi, C., Kim, C., Danon, A., Wagner, D., Hideg, E., Gobel, C., Feussner, I., Nater, M., and Apel, K. (2003). Rapid induction of distinct stress responses after the release of singlet oxygen in Arabidopsis. Plant Cell 15, 2320-2332.
Orozco-Cardenas, M., and Ryan, C.A. (1999). Hydrogen peroxide is generated systemically in plant leaves by wounding and systemin via the octadecanoid pathway. Proc Natl Acad Sci U S A 96, 6553-6557.
Ossowski, S., Schneeberger, K., Clark, R.M., Lanz, C., Warthmann, N., and Weigel, D. (2008). Sequencing of natural strains of Arabidopsis thaliana with short reads. Genome Res 18, 2024-2033.
Palmer, A.E., and Dittmer, P.J. (2010). SNAP-shots of hydrogen peroxide in cells. Chem Biol 17, 318-319.
Pei, Z.M., Murata, Y., Benning, G., Thomine, S., Klusener, B., Allen, G.J., Grill, E., and Schroeder, J.I. (2000). Calcium channels activated by hydrogen peroxide mediate abscisic acid signalling in guard cells. Nature 406, 731-734.
Phillips, D.R., Rasbery, J.M., Bartel, B., and Matsuda, S.P. (2006). Biosynthetic diversity in plant
triterpene cyclization. Curr Opin Plant Biol 9, 305-314.
Pignocchi, C., and Foyer, C.H. (2003). Apoplastic ascorbate metabolism and its role in the regulation of cell signalling. Curr Opin Plant Biol 6, 379-389.
Pirovano, W., Feenstra, K.A., and Heringa, J. (2008). PRALINETM: a strategy for improved multiple alignment of transmembrane proteins. Bioinformatics 24, 492-497.
Pitzschke, A., and Hirt, H. (2010). Bioinformatic and systems biology tools to generate testable models of signaling pathways and their targets. Plant Physiol 152, 460-469.
Plemper, R.K., Bordallo, J., Deak, P.M., Taxis, C., Hitt, R., and Wolf, D.H. (1999). Genetic interactions of Hrd3p and Der3p/Hrd1p with Sec61p suggest a retro-translocation complex mediating protein transport for ER degradation. J Cell Sci 112 ( Pt 22), 4123-4134.
Pose, D. (2008). La caracterización del mutante de Arabidopsis thaliana dry2/sqe1 revela un papel señalizador de los esteroles en el desarrollo de la planta y en la regulación de las especies reactivas de oxígeno. Ph. D thesis. University of Málaga, Spain, pp. 229.
Pose, D., and Botella, M.A. (2009). Analysis of the arabidopsis dry2/sqe1-5 mutant suggests a role for sterols in signaling. Plant Signal Behav 4, 873-874.
Pose, D., Castanedo, I., Borsani, O., Nieto, B., Rosado, A., Taconnat, L., Ferrer, A., Dolan, L., Valpuesta, V., and Botella, M.A. (2009). Identification of the Arabidopsis dry2/sqe1-5 mutant
reveals a central role for sterols in drought tolerance and regulation of reactive oxygen species. Plant J 59, 63-76.
Pospisil, P., Arato, A., Krieger-Liszkay, A., and Rutherford, A.W. (2004). Hydroxyl radical generation by photosystem II. Biochemistry 43, 6783-6792.

CHAPTER 9. BIBLIOGRAPHIC REFERENCES
141
Proost, S., Van Bel, M., Sterck, L., Billiau, K., Van Parys, T., Van de Peer, Y., and Vandepoele, K. (2009). PLAZA: a comparative genomics resource to study gene and genome evolution in plants. Plant Cell 21, 3718-3731.
Raikkonen, J., Monkkonen, H., Auriola, S., and Monkkonen, J. (2010). Mevalonate pathway intermediates downregulate zoledronic acid-induced isopentenyl pyrophosphate and ATP analog formation in human breast cancer cells. Biochem Pharmacol 79, 777-783.
Rasbery, J.M., Shan, H., LeClair, R.J., Norman, M., Matsuda, S.P., and Bartel, B. (2007). Arabidopsis thaliana squalene epoxidase 1 is essential for root and seed development. J Biol Chem 282, 17002-17013.
Ravid, T., Kreft, S.G., and Hochstrasser, M. (2006). Membrane and soluble substrates of the Doa10 ubiquitin ligase are degraded by distinct pathways. EMBO J 25, 533-543.
Redman, J.C., Haas, B.J., Tanimoto, G., and Town, C.D. (2004). Development and evaluation of an Arabidopsis whole genome Affymetrix probe array. Plant J 38, 545-561.
Robson, C.A., and Vanlerberghe, G.C. (2002). Transgenic plant cells lacking mitochondrial alternative
oxidase have increased susceptibility to mitochondria-dependent and -independent pathways of programmed cell death. Plant Physiol 129, 1908-1920.
Rodríguez-Concepción, M., Campos, N., Ferrer, A., and Boronat, A. (2011). Biosynthesis of isoprenoid precursors in Arabidopsis. In Isoprenoid Synthesis and Function in Plants and Microorganisms: New Concepts and Experimental Approaches (T.J. Bach, M. Rohmer, and J. Gerhenzon, eds (New York: Springer), in press.).
Rodriguez, A.A., Grunberg, K.A., and Taleisnik, E.L. (2002). Reactive oxygen species in the
elongation zone of maize leaves are necessary for leaf extension. Plant Physiol 129, 1627-1632.
Romanos, M.A., Scorer, C.A., and Clare, J.J. (1992). Foreign gene expression in yeast: a review. Yeast 8, 423-488.
Rouhier, N., and Jacquot, J.P. (2002). Plant peroxiredoxins: alternative hydroperoxide scavenging enzymes. Photosynth Res 74, 259-268.
Sagi, M., and Fluhr, R. (2001). Superoxide production by plant homologues of the gp91(phox) NADPH oxidase. Modulation of activity by calcium and by tobacco mosaic virus infection. Plant Physiol 126, 1281-1290.
Sagi, M., and Fluhr, R. (2006). Production of reactive oxygen species by plant NADPH oxidases. Plant Physiol 141, 336-340.
Sagi, M., Davydov, O., Orazova, S., Yesbergenova, Z., Ophir, R., Stratmann, J.W., and Fluhr, R. (2004). Plant respiratory burst oxidase homologs impinge on wound responsiveness and development in Lycopersicon esculentum. Plant Cell 16, 616-628.
Santner, A., and Estelle, M. (2010). The ubiquitin-proteasome system regulates plant hormone signaling. Plant J 61, 1029-1040.
CHAPTER 9. BIBLIOGRAPHIC REFERENCES
142
Schafer, U.A., Reed, D.W., Hunter, D.G., Yao, K., Weninger, A.M., Tsang, E.W., Reaney, M.J., MacKenzie, S.L., and Covello, P.S. (1999). An example of intron junctional sliding in the gene families encoding squalene monooxygenase homologues in Arabidopsis thaliana and Brassica napus. Plant Mol Biol 39, 721-728.
Schaller, H. (2003). The role of sterols in plant growth and development. Prog Lipid Res 42, 163-175.
Schaller, H. (2004). New aspects of sterol biosynthesis in growth and development of higher plants. Plant Physiol Biochem 42, 465-476.
Schaller, H. (2010). Sterol and steroid biosynthesis and metabolism in plants and microorganisms In Comprehensive Natural Products II Chemistry and Biology, L.L. Mander, H.-W. (eds), ed (Oxford: Elsevier), pp. 755-787.
Schaller, H., Gondet, L., Maillot-Vernier, P., and Benveniste, P. (1994). Sterol overproduction is the biochemical basis of resistance to a triazole in calli from a tobacco mutant. Planta 194, 295-305.
Schaller, H., Grausem, B., Benveniste, P., Chye, M.L., Tan, C.T., Song, Y.H., and Chua, N.H. (1995). Expression of the Hevea brasiliensis (H.B.K.) Mull. Arg. 3-Hydroxy-3-Methylglutaryl-Coenzyme A Reductase 1 in Tobacco Results in Sterol Overproduction. Plant Physiol 109, 761-770.
Schnell, J.D., and Hicke, L. (2003). Non-traditional Functions of Ubiquitin and Ubiquitin-binding Proteins.
Journal of Biological Chemistry 278, 35857-35860.
Schopfer, P., Liszkay, A., Bechtold, M., Frahry, G., and Wagner, A. (2002). Evidence that hydroxyl radicals mediate auxin-induced extension growth. Planta 214, 821-828.
Schrick, K., Nguyen, D., Karlowski, W.M., and Mayer, K.F. (2004). START lipid/sterol-binding
domains are amplified in plants and are predominantly associated with homeodomain transcription factors. Genome Biol 5, R41.
Schrick, K., Mayer, U., Martin, G., Bellini, C., Kuhnt, C., Schmidt, J., and Jurgens, G. (2002). Interactions between sterol biosynthesis genes in embryonic development of Arabidopsis. Plant J 31, 61-73.
Schrick, K., Mayer, U., Horrichs, A., Kuhnt, C., Bellini, C., Dangl, J., Schmidt, J., and Jurgens, G. (2000). FACKEL is a sterol C-14 reductase required for organized cell division and expansion in
Arabidopsis embryogenesis. Genes Dev 14, 1471-1484.
Schroeder, J.I., Kwak, J.M., and Allen, G.J. (2001). Guard cell abscisic acid signalling and engineering drought hardiness in plants. Nature 410, 327-330.
Schubert, U., Anton, L.C., Gibbs, J., Norbury, C.C., Yewdell, J.W., and Bennink, J.R. (2000). Rapid degradation of a large fraction of newly synthesized proteins by proteasomes. Nature 404, 770-774.
Schulze, S., Koster, S., Geldmacher, U., Terwisscha van Scheltinga, A.C., and Kuhlbrandt, W. (2010). Structural basis of Na(+)-independent and cooperative substrate/product antiport in CaiT. Nature 467, 233-236.
Segal, A.W., and Abo, A. (1993). The biochemical basis of the NADPH oxidase of phagocytes. Trends Biochem Sci 18, 43-47.
CHAPTER 9. BIBLIOGRAPHIC REFERENCES
143
Serino, G., and Deng, X.W. (2003). The COP9 signalosome: regulating plant development through the control of proteolysis. Annu Rev Plant Biol 54, 165-182.
Sikorski, R.S., and Hieter, P. (1989). A system of shuttle vectors and yeast host strains designed for
efficient manipulation of DNA in Saccharomyces cerevisiae. Genetics 122, 19-27.
Simossis, V.A., and Heringa, J. (2005). PRALINE: a multiple sequence alignment toolbox that integrates homology-extended and secondary structure information. Nucleic Acids Res 33, W289-294.
Simossis, V.A., Kleinjung, J., and Heringa, J. (2005). Homology-extended sequence alignment.
Nucleic Acids Res 33, 816-824.
Smalle, J., and Vierstra, R.D. (2004). The ubiquitin 26S proteasome proteolytic pathway. Annu Rev Plant Biol 55, 555-590.
Smith, M.H., Ploegh, H.L., and Weissman, J.S. (2011). Road to ruin: targeting proteins for
degradation in the endoplasmic reticulum. Science 334, 1086-1090.
Soares, N.C., Francisco, R., Vielba, J.M., Ricardo, C.P., and Jackson, P.A. (2009). Associating wound-related changes in the apoplast proteome of Medicago with early steps in the ROS signal-transduction pathway. J Proteome Res 8, 2298-2309.
Sommer, T., and Jentsch, S. (1993). A protein translocation defect linked to ubiquitin conjugation at the
endoplasmic reticulum. Nature 365, 176-179.
Sonnhammer, E.L., von Heijne, G., and Krogh, A. (1998). A hidden Markov model for predicting transmembrane helices in protein sequences. Proc Int Conf Intell Syst Mol Biol 6, 175-182.
Souter, M., Topping, J., Pullen, M., Friml, J., Palme, K., Hackett, R., Grierson, D., and Lindsey, K. (2002). hydra Mutants of Arabidopsis are defective in sterol profiles and auxin and ethylene signaling. Plant Cell 14, 1017-1031.
Stermer, B.A., Bianchini, G.M., and Korth, K.L. (1994). Regulation of HMG-CoA reductase activity in plants. J Lipid Res 35, 1133-1140.
Su, W., Liu, Y., Xia, Y., Hong, Z., and Li, J. (2011). Conserved endoplasmic reticulum-associated degradation system to eliminate mutated receptor-like kinases in Arabidopsis. Proc Natl Acad Sci U S A 108, 870-875.
Sugden, C., Crawford, R.M., Halford, N.G., and Hardie, D.G. (1999). Regulation of spinach SNF1-related (SnRK1) kinases by protein kinases and phosphatases is associated with phosphorylation of the T loop and is regulated by 5′-AMP. The Plant Journal 19, 433-439.
Suzuki, H., Achnine, L., Xu, R., Matsuda, S.P., and Dixon, R.A. (2002). A genomics approach to the early stages of triterpene saponin biosynthesis in Medicago truncatula. Plant J 32, 1033-1048.
Suzuki, M., Nakagawa, S., Kamide, Y., Kobayashi, K., Ohyama, K., Hashinokuchi, H., Kiuchi, R., Saito, K., Muranaka, T., and Nagata, N. (2009). Complete blockage of the mevalonate pathway results in male gametophyte lethality. J Exp Bot 60, 2055-2064.
Suzuki, M., Kamide, Y., Nagata, N., Seki, H., Ohyama, K., Kato, H., Masuda, K., Sato, S., Kato, T., Tabata, S., Yoshida, S., and Muranaka, T. (2004). Loss of function of 3-hydroxy-3-methylglutaryl coenzyme A reductase 1 (HMG1) in Arabidopsis leads to dwarfing, early senescence and male sterility, and reduced sterol levels. Plant J 37, 750-761.

CHAPTER 9. BIBLIOGRAPHIC REFERENCES
144
Swanson, R., Locher, M., and Hochstrasser, M. (2001). A conserved ubiquitin ligase of the nuclear envelope/endoplasmic reticulum that functions in both ER-associated and Matalpha2 repressor degradation. Genes Dev 15, 2660-2674.
Swanson, S., and Gilroy, S. (2010). ROS in plant development. Physiol Plant 138, 384-392.
Takeda, S., Gapper, C., Kaya, H., Bell, E., Kuchitsu, K., and Dolan, L. (2008). Local positive feedback regulation determines cell shape in root hair cells. Science 319, 1241-1244.
Tamura, K., Peterson, D., Peterson, N., Stecher, G., Nei, M., and Kumar, S. (2011). MEGA5: Molecular Evolutionary Genetics Analysis Using Maximum Likelihood, Evolutionary Distance, and Maximum Parsimony Methods. Mol Biol Evol 28, 2731-2739.
Taylor, J.S., and Raes, J. (2004). Duplication and divergence: the evolution of new genes and old ideas. Annu Rev Genet 38, 615-643.
Thrower, J.S., Hoffman, L., Rechsteiner, M., and Pickart, C.M. (2000). Recognition of the polyubiquitin proteolytic signal. EMBO J 19, 94-102.
Tomita, M., Irie, M., and Ukita, T. (1969). Sensitized photooxidation of histidine and its derivatives. Products and mechanism of the reaction. Biochemistry 8, 5149-5160.
Torres, M.A., and Dangl, J.L. (2005). Functions of the respiratory burst oxidase in biotic interactions, abiotic stress and development. Curr Opin Plant Biol 8, 397-403.
Torres, M.A., Onouchi, H., Hamada, S., Machida, C., Hammond-Kosack, K.E., and Jones, J.D. (1998). Six Arabidopsis thaliana homologues of the human respiratory burst oxidase (gp91phox). Plant J 14, 365-370.
Travers, K.J., Patil, C.K., Wodicka, L., Lockhart, D.J., Weissman, J.S., and Walter, P. (2000). Functional and genomic analyses reveal an essential coordination between the unfolded protein response and ER-associated degradation. Cell 101, 249-258.
Tsang, E.W., Bowler, C., Herouart, D., Van Camp, W., Villarroel, R., Genetello, C., Van Montagu, M., and Inze, D. (1991). Differential regulation of superoxide dismutases in plants
exposed to environmental stress. Plant Cell 3, 783-792.
Tucker, D.J., and Mansfield, T.A. (1971). A simple bioassay for detecting “antitranspirant” activity of naturally occurring compounds such as abscisic acid. Planta 98, 157-163.
Turnbull, C.G. (2010). Grafting as a Research Tool. In Plant Developmental Biology - Methods in Molecular Biology, e. L. Hennig and C. Köhler, ed (New York: Humana Press - Springer Protocols), pp. 11-26.
Turnbull, C.G., Booker, J.P., and Leyser, H.M. (2002). Micrografting techniques for testing long-distance signalling in Arabidopsis. Plant J 32, 255-262.
Vashist, S., and Ng, D.T. (2004). Misfolded proteins are sorted by a sequential checkpoint mechanism of ER quality control. J Cell Biol 165, 41-52.
Vembar, S.S., and Brodsky, J.L. (2008). One step at a time: endoplasmic reticulum-associated degradation. Nat Rev Mol Cell Biol 9, 944-957.
CHAPTER 9. BIBLIOGRAPHIC REFERENCES
145
Vernoud, V., Horton, A.C., Yang, Z., and Nielsen, E. (2003). Analysis of the small GTPase gene superfamily of Arabidopsis. Plant Physiol 131, 1191-1208.
Vert, G., Nemhauser, J.L., Geldner, N., Hong, F., and Chory, J. (2005). Molecular mechanisms of
steroid hormone signaling in plants. Annu Rev Cell Dev Biol 21, 177-201.
Vickers, C.E., Gershenzon, J., Lerdau, M.T., and Loreto, F. (2009). A unified mechanism of action for volatile isoprenoids in plant abiotic stress. Nat Chem Biol 5, 283-291.
Vierstra, R.D. (2003). The ubiquitin/26S proteasome pathway, the complex last chapter in the life of
many plant proteins. Trends Plant Sci 8, 135-142.
Vierstra, R.D. (2009). The ubiquitin-26S proteasome system at the nexus of plant biology. Nat Rev Mol Cell Biol 10, 385-397.
Vinocur, B., and Altman, A. (2005). Recent advances in engineering plant tolerance to abiotic stress:
achievements and limitations. Curr Opin Biotechnol 16, 123-132.
Wagner, D., Przybyla, D., Op den Camp, R., Kim, C., Landgraf, F., Lee, K.P., Wursch, M., Laloi, C., Nater, M., Hideg, E., and Apel, K. (2004). The genetic basis of singlet oxygen-induced stress responses of Arabidopsis thaliana. Science 306, 1183-1185.
Walter, J., Urban, J., Volkwein, C., and Sommer, T. (2001). Sec61p-independent degradation of the
tail-anchored ER membrane protein Ubc6p. EMBO J 20, 3124-3131.
Wasternack, C. (2007). Jasmonates: an update on biosynthesis, signal transduction and action in plant stress response, growth and development. Ann Bot 100, 681-697.
Wentzinger, L.F., Bach, T.J., and Hartmann, M.A. (2002). Inhibition of squalene synthase and squalene epoxidase in tobacco cells triggers an up-regulation of 3-hydroxy-3-methylglutaryl coenzyme a reductase. Plant Physiol 130, 334-346.
Wilkinson, K.D. (2005). The discovery of ubiquitin-dependent proteolysis. Proc Natl Acad Sci U S A 102, 15280-15282.
Willemsen, V., Friml, J., Grebe, M., van den Toorn, A., Palme, K., and Scheres, B. (2003). Cell polarity and PIN protein positioning in Arabidopsis require STEROL METHYLTRANSFERASE1 function. Plant Cell 15, 612-625.
Winterbourn, C.C. (2008). Reconciling the chemistry and biology of reactive oxygen species. Nat Chem Biol 4, 278-286.
Wong, H.L., Pinontoan, R., Hayashi, K., Tabata, R., Yaeno, T., Hasegawa, K., Kojima, C., Yoshioka, H., Iba, K., Kawasaki, T., and Shimamoto, K. (2007). Regulation of rice NADPH oxidase by binding of Rac GTPase to its N-terminal extension. Plant Cell 19, 4022-4034.
Wymer, C.L., Bibikova, T.N., and Gilroy, S. (1997). Cytoplasmic free calcium distributions during the
development of root hairs of Arabidopsis thaliana. Plant J 12, 427-439.
Xiao, S., Dai, L., Liu, F., Wang, Z., Peng, W., and Xie, D. (2004). COS1: an Arabidopsis coronatine insensitive1 suppressor essential for regulation of jasmonate-mediated plant defense and senescence. Plant Cell 16, 1132-1142.

CHAPTER 9. BIBLIOGRAPHIC REFERENCES
146
Yamamoto, M., Kawanabe, M., Hayashi, Y., Endo, T., and Nishikawa, S. (2010). A vacuolar carboxypeptidase mutant of Arabidopsis thaliana is degraded by the ERAD pathway independently of its N-glycan. Biochem Biophys Res Commun 393, 384-389.
Yamashita, A., Singh, S.K., Kawate, T., Jin, Y., and Gouaux, E. (2005). Crystal structure of a bacterial homologue of Na+/Cl--dependent neurotransmitter transporters. Nature 437, 215-223.
Yang, Z. (2002). Small GTPases: versatile signaling switches in plants. Plant Cell 14 Suppl, S375-388.
Zhang, L., and Xing, D. (2008). Methyl jasmonate induces production of reactive oxygen species and alterations in mitochondrial dynamics that precede photosynthetic dysfunction and subsequent cell death. Plant Cell Physiol 49, 1092-1111.
Zhang, Z., Lenk, A., Andersson, M.X., Gjetting, T., Pedersen, C., Nielsen, M.E., Newman, M.A., Hou, B.H., Somerville, S.C., and Thordal-Christensen, H. (2008). A lesion-mimic syntaxin double mutant in Arabidopsis reveals novel complexity of pathogen defense signaling. Mol Plant 1, 510-527.
Zhu, J.K. (2002). Salt and drought stress signal transduction in plants. Annu Rev Plant Biol 53, 247-273.
Zhuang, S., Demirs, J.T., and Kochevar, I.E. (2000). p38 mitogen-activated protein kinase mediates
bid cleavage, mitochondrial dysfunction, and caspase-3 activation during apoptosis induced by singlet oxygen but not by hydrogen peroxide. J Biol Chem 275, 25939-25948.

Appendixes
APPENDIX I – STANDARD MOLECULAR BIOLOGY METHODS
APPENDIX II – OLIGONUCLEOTIDES USED FOR MAP-BASED CLONING
APPENDIX III – VECTORS Maps

APPENDIX
149
APPENDIX I – STANDARD MOLECULAR BIOLOGY METHODS
1. NUCLEIC ACID METHODS
1.1. DNA Methods
1.1.1. Oligonucleotide Design and Preparation
Oligonucleotides (primers) were designed with different softwares, namely OLIGO Primer Analysis Software v6.0 (http://oligo.net/) or the Primer3 online application (http://frodo.wi.mit.edu/primer3/) (Rozen and Skaletsky, 2000), with automatic estimation of the GC content, melting temperature, and primer-dimer/hairpin formation. Primer design generally took into consideration the following principles for each pair: optimal Tms, correct primer length, avoidance of primer-dimmer and hairpin structures, optimisation of GC content (40-60%), presence of a GC clamp, estimation of optimal annealing temperature (Griffin and Griffin, 1994). Primers stocks were prepared by adding ddH20 to a final concentration of 100 μM according to the manufacturer’s indication. Working aliquots were subsequently produced at 10 μM, for
PCR amplification or sequencing purposes.
1.1.2. Plant Genomic DNA Isolation
Different methods were used to obtain genomic DNA from A. thaliana tissues, depending on the nature of the tissue sample and the degree of purity needed: CTAB-based method, Fast DNA extraction method and ZR Plant/Seed DNA Kit (Zymo Research).
CTAB method. Leaf tissue was harvested from each plant to obtain high integrity and high purity genomic
DNA with the CTAB extraction method (Doyle and Doyle, 1987). After having been harvested, the tissue was grinded with liquid nitrogen and subsequently added 700 μL of CTAB buffer, vortexed and incubated for 25 min at 65ºC. Samples were centrifuged for 5 min at room temperature and 12000 g. The aqueous phase was recovered, precipitated with 1:1 vol of cold (-20ºC) isopropanol and centrifuged for 20 min at room temperature and 12000 g. The pellet was washed with 300 μL of 70% (v/v) ethanol and centrifuged for 5 min at room temperature and 12000 g. The pellet was then dried for 10 min at 37ºC, solubilised in 30 μL of 0.1x TE containing RNAse A (100 μg mL-1), and incubated for 20 min at 37ºC. Genomic DNA was kept for 24 h at 4ºC to allow complete dissolution of the pellet and stored at -20ºC.
CTAB buffer: 2% (w/v) CTAB; 1.4 M NaCl; 0.1 M Tris-HCl (pH 8.0); 0.02 M EDTA (pH 8.0); add 0.1% (v/v) β-mercaptoethanol before use.
TE: 10 mM Tris-HCl (pH 8.0); 1 mM EDTA.
APPENDIX
150
Fast DNA extraction method. Leaf tissue was harvested from each plant to perform a rapid DNA extraction (Edwards et al., 1991). After having been harvested, the tissue was transferred to a microtube and 400 μL of extraction buffer were added prior to grinding the tissue with polypropylene pestles. Microtubes were centrifuged for 5 min at room temperature and 14000 rpm, and the supernatant was transferred to a new microtube containing 300 μL of isopropanol. After another centrifugation for 5 min and 14000 rpm, the DNA-containing pellet was rinsed with 500 μL of 70% (v/v) ethanol, and spinned down for 2 min. The pellet was air-dried and ressuspended in 50-100 μL of ultra-pure water.
Extraction buffer: 200 mM Tris-HCl pH 7.5; 250 mM NaCl; 25 mM EDTA; 0.5% (w/v) SDS.
Root DNA extraction. Genomic DNA from root tissue was isolated using the ZR Plant/Seed DNA Kit (Zymo Research).
1.1.3. Plasmid Isolation
Plasmid isolation was performed using the Wizard Plus SV Minipreps DNA Purification System (Promega) or Quiagen Plasmid (Quiagen) commercial kits, according to the manufacturer’s instructions.
1.1.4. DNA Fragment Purification
DNA purification from agarose gels, PCR amplifications or endonuclease digestions was performed using the Wizard SV Gel and PCR Clean-Up System (Promega) or the QIAprep Spin Miniprep Kit (Quiagen) commercial kits, according to the manufacturer’s instructions.
1.1.5. DNA Precipitation
DNA was added 1/10 volumes of 3 M NaAc pH 5.2 and 2 volumes of ice-cold absolute ethanol, and placed at -20ºC for at least 1 hr. Following centrifugation during 5 min at high speeds (~13,000 rpm) at room temperature, the pellet was allowed to air-dry, prior to ressuspension in 15 μL ultra pure water.
1.1.6. DNA Digestion with Endonucleases
DNA digestion with restriction endonucleases was performed according to the procedures described by Sambrook and Russell (2001), and considering the manufacturer’s instructions. Reactions were performed in a total volume of 20-50 μL for 30 min to ON periods at 37°C. For plasmid linearization, reactions were added 1 µl of Shrimp Alkaline Phosphatase (SAP) (Fermentas) to promote dephosphorylation
of the 5'-phosphorylated ends of DNA, thus preventing re-ligation of the linearized plasmid DNA during cloning experiments. Endonucleases were heat inactivated according to their specification, or the reaction was purified as described in 1.1.6.
APPENDIX
151
1.1.7. Amplification of DNA Fragments by Polymerase Chain Reaction (PCR)
Typically, PCR reactions were prepared in a 50 µl volume as follows: DNA template (50 ng), Taq
polymerase (1 U, 0.5 μl), 10x buffer (5 μl), 2.5 mM dNTPs (2 μl), 2 mM MgCl2 (4 µl from a 25 mM stock),
primer (3 μl from a 10 μM stock) and ddH2O (up to 50 μl). The PCR reaction was carried out by
sequentially performingdenaturation (45 sec), annealing (45 sec) and extension (according to the size of the expectable fragments and the polimerase specifications) steps for each cycle of amplification. In a typical reaction, the DNA was denatured at 95°C, primers annealed at 50-70°C (annealing temperature determined experimentally by a PCR annealing gradient), and extension was carried out at 72°C or 68ºC (according to manufacturer’s specifications). Traditionally, 30-40 amplification cycles were needed. An initial denaturation and final extension steps (10 min each) were also included. For plant diagnostic PCR, DNA was extracted by the Fast DNA extraction method (see section 1.1.2) and 1 μL of precipitated genomic DNA was ressuspended in 50 μL of ultra pure water to be used as template. For E. coli colony PCR and yeast colony PCR, one colony was used as template.
1.1.8. DNA Sequencing
Plasmid inserts were sequenced by STAB VIDA, Secugen or GATC Biotech services, using universal or purposefully designed primers.
1.1.9. Gateway Cloning
LR recombination reaction between attL (entry clone) and attR (destination vector) recombination sites was carried out to obtain the attB expression clones in the pMDC32 vector. The reaction was performed in a total volume of 10 μL in 0.2 mL microtubes containing: 50 fmol of a Gateway destination vector (pMDC32), 50 fmol of an attL-entry clone (HyPer-As), 2 μL of LR Clonase II (Invitrogen) and TE buffer (pH 8). Equal molarity was obtained as in the BP reaction. The mix was incubated for 18 h at 25ºC. Subsequently, 1 μL of Proteinase K (LR clonase II kit, Invitrogen) was added and the reaction incubated for 10 min at 37ºC. An aliquot of 5 μL was used to transform E. coli XL1-Blue/DH5α competent cells. Cells
were then plated onto LB agarised medium containing hygromycin (50 μg mL-1). Colonies were used in a colony PCR with specific primers for the destination vectors, and positives ones were selected in kanamycin (50 μg mL-1) prior to plasmid isolation and sequencing.
1.1.10. Subcloning of PCR Fragments into pGEM-T Easy
DNA fragments were subcloned into the pGEM-T Easy vector (Promega) following the manufacturer’s instructions. Ligation of PCR products to pGEM-T Easy was performed by incubating 50 ng of pGEM-T Easy vector with purified PCR product (in a molar ratio of 1:3), 5 μL of 2x Rapid Ligation Buffer,
1 μL T4 DNA ligase, in a final volume of 10 μL, for 1 h at room temperature. Subcloning of PCR fragments
obtained with a proofreading polymerase included an adenylation step prior to the ligation reaction, allowing for the generation of the A-tail necessary for ligation to the T-overhangs of the pGEM-T vector. The DNA was adenylated by incubation with 0.25 μL of non-proofreading Taq polymerase, 1 μL of 10x Taq Polymerase
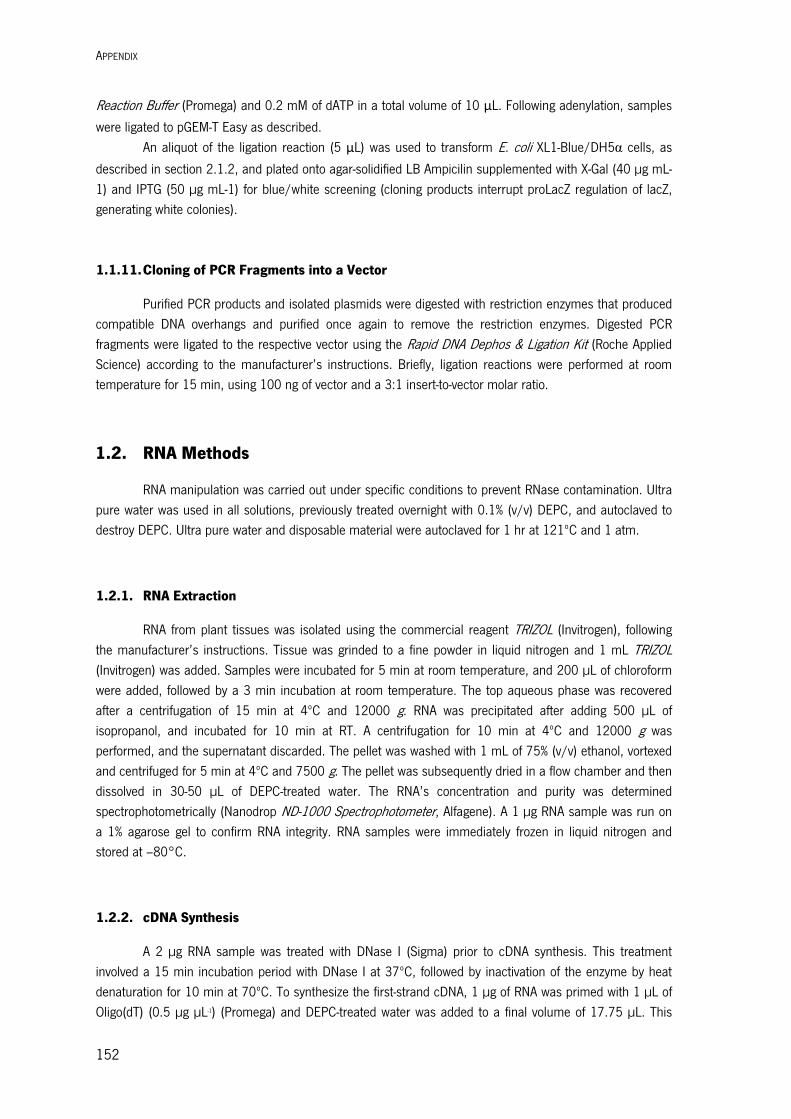
APPENDIX
152
Reaction Buffer (Promega) and 0.2 mM of dATP in a total volume of 10 μL. Following adenylation, samples
were ligated to pGEM-T Easy as described. An aliquot of the ligation reaction (5 μL) was used to transform E. coli XL1-Blue/DH5α cells, as
described in section 2.1.2, and plated onto agar-solidified LB Ampicilin supplemented with X-Gal (40 μg mL-1) and IPTG (50 μg mL-1) for blue/white screening (cloning products interrupt proLacZ regulation of lacZ, generating white colonies).
1.1.11. Cloning of PCR Fragments into a Vector
Purified PCR products and isolated plasmids were digested with restriction enzymes that produced compatible DNA overhangs and purified once again to remove the restriction enzymes. Digested PCR fragments were ligated to the respective vector using the Rapid DNA Dephos & Ligation Kit (Roche Applied Science) according to the manufacturer’s instructions. Briefly, ligation reactions were performed at room temperature for 15 min, using 100 ng of vector and a 3:1 insert-to-vector molar ratio.
1.2. RNA Methods
RNA manipulation was carried out under specific conditions to prevent RNase contamination. Ultra pure water was used in all solutions, previously treated overnight with 0.1% (v/v) DEPC, and autoclaved to destroy DEPC. Ultra pure water and disposable material were autoclaved for 1 hr at 121ºC and 1 atm.
1.2.1. RNA Extraction
RNA from plant tissues was isolated using the commercial reagent TRIZOL (Invitrogen), following the manufacturer’s instructions. Tissue was grinded to a fine powder in liquid nitrogen and 1 mL TRIZOL (Invitrogen) was added. Samples were incubated for 5 min at room temperature, and 200 μL of chloroform were added, followed by a 3 min incubation at room temperature. The top aqueous phase was recovered after a centrifugation of 15 min at 4ºC and 12000 g. RNA was precipitated after adding 500 μL of isopropanol, and incubated for 10 min at RT. A centrifugation for 10 min at 4ºC and 12000 g was performed, and the supernatant discarded. The pellet was washed with 1 mL of 75% (v/v) ethanol, vortexed and centrifuged for 5 min at 4ºC and 7500 g. The pellet was subsequently dried in a flow chamber and then dissolved in 30-50 μL of DEPC-treated water. The RNA’s concentration and purity was determined spectrophotometrically (Nanodrop ND-1000 Spectrophotometer, Alfagene). A 1 μg RNA sample was run on a 1% agarose gel to confirm RNA integrity. RNA samples were immediately frozen in liquid nitrogen and stored at –80°C.
1.2.2. cDNA Synthesis
A 2 μg RNA sample was treated with DNase I (Sigma) prior to cDNA synthesis. This treatment involved a 15 min incubation period with DNase I at 37ºC, followed by inactivation of the enzyme by heat denaturation for 10 min at 70ºC. To synthesize the first-strand cDNA, 1 μg of RNA was primed with 1 μL of Oligo(dT) (0.5 μg μL-1) (Promega) and DEPC-treated water was added to a final volume of 17.75 μL. This

APPENDIX
153
mixture was heated for 5 min at 70ºC and cooled quickly on ice for 5 min. Reverse transcription was promoted using the enzyme M-MLV RT (Moloney murine leukemia virus reverse transcriptase). A mixture of 1 μL of M-MLV RT (H-) (Promega) and its 5x buffer were added to 1.25 μL of dNTP mix (10mM) (Promega), and transferred to the first mixture containing the RNA. Reverse transcriptase reaction was carried for 60 min at 50ºC, followed by 15 min at 70ºC, and the cDNA was stored at -20ºC.
1.3. Quantification of Nucleic Acids
Nucleic acid quantification was performed spectrophotometrically in a Nanodrop Spectrophotometer ND-1000 (Alfagene), a micro-volume UV-Vis spectrophotometer for nucleic acid and protein quantitation. A minimum volume of 1.5 μL per sample was used. Nucleic concentration was determined considering that 1 A260 = 50 ng DNA μL-1 and 1 A260 = 40 ng RNA μL-1. To determine the purity of
the nucleic acid samples, A260/ A230, and A260/ A280 ratios were also estimated (Sambrook and Russell, 2001). Relative quantification of DNA nucleic acids for ligation reactions was estimated by the relative fluorescent intensity of the DNA intercalating staining agent, using nucleic acid electrophoretic separation.
1.4. Nuclecic Acids Electrophoretic Separation
DNA fragments were resolved by electrophoretic separation using a horizontal gel apparatus. Gels were made by melting 0.8-1.2% (w/v) agarose in 0.5x TAE. TAE (0.5x) was also used as running buffer. DNA was stained by adding 1 μL of ethidium bromide (1 mg mL-1) to the melted agarose gel. DNA samples, except those from PCR with GoTaq Green buffer were mixed with 0.20 vol. of loading buffer (6x MassRuler DNA Loading Dye; Fermentas). MassRuler DNA Ladder Mix (an 80-10,000 bp molecular weight standard; Fermentas) and λ DNA digested with PstI were used as molecular weight markers. Alternatively, DNA
staining was carried out with the fluorescent intercalating agent GelRed (Biotium). GelRed was used after the gel run, so the gel was incubated for 25 min in 0.5x TAE solution to a final 0.2x GelRed concentration. Gel was visualised under UV light.
50x TAE buffer: 2 M Tris; 0.95 M acetic acid; 50 mM EDTANa2 pH 8.0 6X MassRuler DNA Loading Dye: 10 mM Tris-HCL (pH 7.6); 0.03% bromophenol blue; 60% (v/v) glycerol; 60 mM EDTA. Loading buffer: 30% (w/v) glycerol; 0.1 M EDTA; 0.25% (w/v) bromophenol blue.
2. TRANSFORMATION OF BACTERIA
2.1. Transformation of E. coli Cells
The protocol for preparation and transformation of E. coli competent cells was based on Inoue et al. (1990).

APPENDIX
154
2.1.1. E. coli Competent Cells Preparation
E. coli competent cells were obtained by inoculating 250 mL of SOB medium with a single colony of E. coli strains. Cells were grown at 18ºC with vigorous shaking (200-250 rpm) until A600 was of 0.6 (2-3 days). The medium was cooled on ice for 10 min and cells were collected by centrifugation for 10 min at 4ºC and 2500 g. The pellet was ressuspended in 80 mL of ice-cold TB buffer, and incubated on ice for 10 min. Cells were centrifuged for 10 min at 4ºC and 2500 g, and gently ressuspended in 20 mL of ice-cold TB buffer with 7% (v/v) DMSO. Cells were subsequently incubated for 10 min on ice and 100 μl were aliquoted into microtubes. Competent cells were immediately placed in liquid nitrogen and stored at -80ºC.
TB: 10 mM Pipes; 15 mM CaCl2; 250 mM KCl; 55 mM MnCl2. Mix all components except MnCl2 and adjust pH to 6.7 with KOH. Dissolve MnCl2 and sterilize the solution using a 0.45 μm filter.
2.1.2. E. coli Transformation
E. coli cell transformation was initiated by slightly thawing competent cells on ice. The DNA sample (1-20 μL) was added to 100 μL of cells by gentle mixing, and the mixture was incubated for 30 min at 4ºC. Cells were then heat-shocked for 90 sec at 42ºC, followed by incubation on ice for 1 min. After addition of 1 mL of SOC (or LB) liquid medium, cells were incubated for 1 hr at 37ºC with vigorous shaking (200-250 rpm), spinned down for during a few sec ( at 10000 g and the pellet ressuspended in 100 μL of the supernatant. Finally, cells were transferred to agarised LB medium plates containing appropriate antibiotics, and grown overnight at 37ºC.
2.2. Transformation of Agrobacterium Cells
2.2.1. Preparation of Electrocompetent Cells
Agrobacterium cells (GV3101::pMP90 strain) were inoculated in agarised LB medium, from a -80ºC glycerol stock, and grown for 2 days at 28ºC. A colony was then ressuspended in 5 mL LB liquid medium and grown ON at 28ºC and 200 rpm. Cells were harvested by centrifugation for 1 min at 13000 rpm and ressuspended in 1 mL of 300 mM sucrose per microtube. The pellet was ressuspended in 100 μL of 300 mM sucrose. Aliquots of 100 μL of competent cells were used for vector electroporation.
2.2.2. Electroporation Method
Transformation of Agrobacterium by electroporation was performed by mixing 100 μL of electrocompetent cells with 100 ng of the vector. After careful mix, an electric pulse was given in an electroporator Gene Pulser II (BIO-RAD), which was set to 2.5 kV and 400 Ω, with a capacitance of 25 μF. Subsequently, 1 mL of LB liquid medium was added to cell suspension, shaken, incubated in a microtube for 1 h at 28ºC and 200 rpm, and plated onto appropriate selection medium and grown for 48 h at 28ºC.
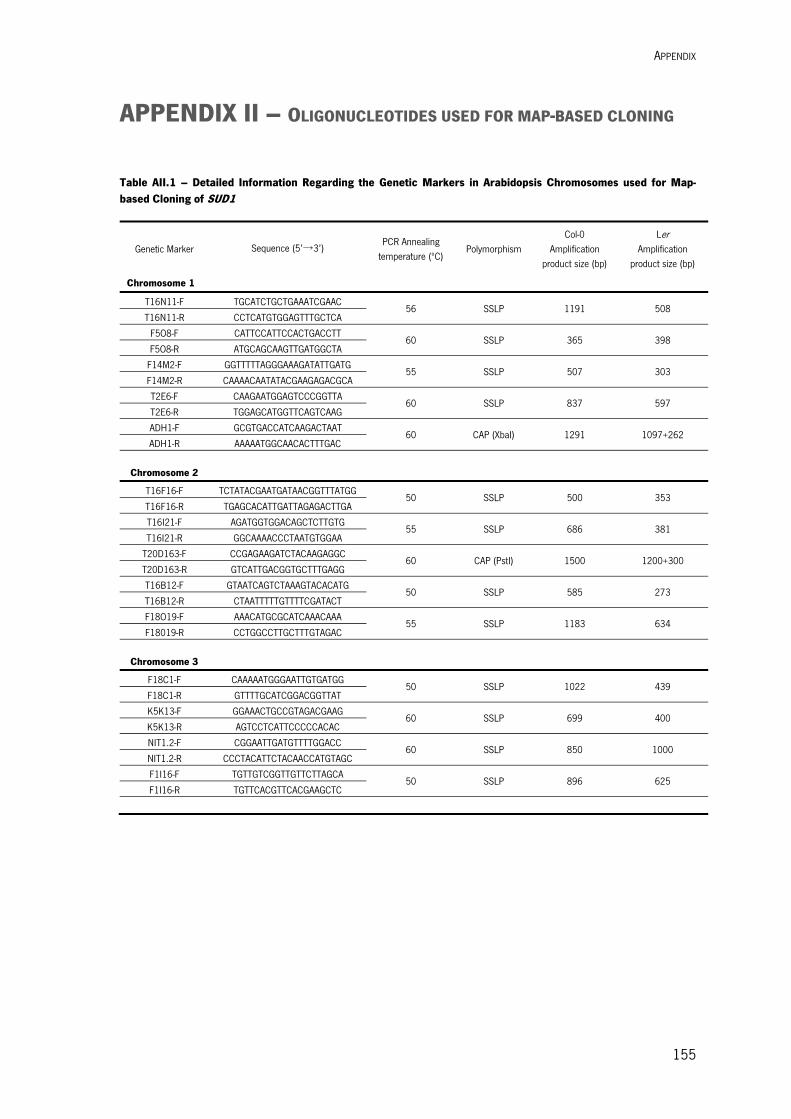
APPENDIX
155
APPENDIX II – OLIGONUCLEOTIDES USED FOR MAP-BASED CLONING
Table AII.1 – Detailed Information Regarding the Genetic Markers in Arabidopsis Chromosomes used for Map-based Cloning of SUD1
Genetic Marker Sequence (5’→3’) PCR Annealing
temperature (ºC) Polymorphism
Col-0 Amplification
product size (bp)
Ler Amplification
product size (bp)
Chromosome 1
T16N11-F TGCATCTGCTGAAATCGAAC 56 SSLP 1191 508
T16N11-R CCTCATGTGGAGTTTGCTCA
F5O8-F CATTCCATTCCACTGACCTT 60 SSLP 365 398
F5O8-R ATGCAGCAAGTTGATGGCTA
F14M2-F GGTTTTTAGGGAAAGATATTGATG 55 SSLP 507 303
F14M2-R CAAAACAATATACGAAGAGACGCA
T2E6-F CAAGAATGGAGTCCCGGTTA 60 SSLP 837 597
T2E6-R TGGAGCATGGTTCAGTCAAG
ADH1-F GCGTGACCATCAAGACTAAT 60 CAP (XbaI) 1291 1097+262
ADH1-R AAAAATGGCAACACTTTGAC
Chromosome 2
T16F16-F TCTATACGAATGATAACGGTTTATGG 50 SSLP 500 353
T16F16-R TGAGCACATTGATTAGAGACTTGA
T16I21-F AGATGGTGGACAGCTCTTGTG 55 SSLP 686 381
T16I21-R GGCAAAACCCTAATGTGGAA
T20D163-F CCGAGAAGATCTACAAGAGGC 60 CAP (PstI) 1500 1200+300
T20D163-R GTCATTGACGGTGCTTTGAGG
T16B12-F GTAATCAGTCTAAAGTACACATG 50 SSLP 585 273
T16B12-R CTAATTTTTGTTTTCGATACT
F18O19-F AAACATGCGCATCAAACAAA 55 SSLP 1183 634
F18019-R CCTGGCCTTGCTTTGTAGAC
Chromosome 3
F18C1-F CAAAAATGGGAATTGTGATGG 50 SSLP 1022 439
F18C1-R GTTTTGCATCGGACGGTTAT
K5K13-F GGAAACTGCCGTAGACGAAG 60 SSLP 699 400
K5K13-R AGTCCTCATTCCCCCACAC
NIT1.2-F CGGAATTGATGTTTTGGACC 60 SSLP 850 1000
NIT1.2-R CCCTACATTCTACAACCATGTAGC
F1I16-F TGTTGTCGGTTGTTCTTAGCA 50 SSLP 896 625
F1I16-R TGTTCACGTTCACGAAGCTC
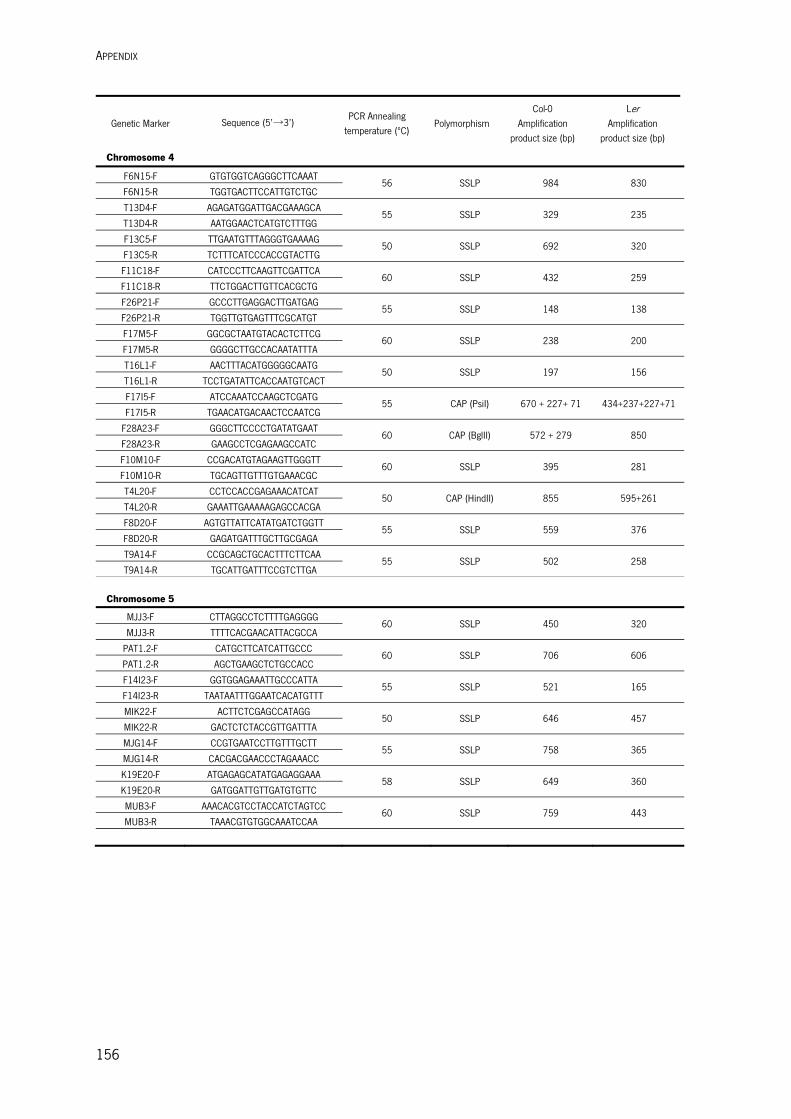
APPENDIX
156
Genetic Marker Sequence (5’→3’) PCR Annealing
temperature (ºC) Polymorphism
Col-0 Amplification
product size (bp)
Ler Amplification
product size (bp)
Chromosome 4
F6N15-F GTGTGGTCAGGGCTTCAAAT 56 SSLP 984 830
F6N15-R TGGTGACTTCCATTGTCTGC
T13D4-F AGAGATGGATTGACGAAAGCA 55 SSLP 329 235
T13D4-R AATGGAACTCATGTCTTTGG
F13C5-F TTGAATGTTTAGGGTGAAAAG 50 SSLP 692 320
F13C5-R TCTTTCATCCCACCGTACTTG
F11C18-F CATCCCTTCAAGTTCGATTCA 60 SSLP 432 259
F11C18-R TTCTGGACTTGTTCACGCTG
F26P21-F GCCCTTGAGGACTTGATGAG 55 SSLP 148 138
F26P21-R TGGTTGTGAGTTTCGCATGT
F17M5-F GGCGCTAATGTACACTCTTCG 60 SSLP 238 200
F17M5-R GGGGCTTGCCACAATATTTA
T16L1-F AACTTTACATGGGGGCAATG 50 SSLP 197 156
T16L1-R TCCTGATATTCACCAATGTCACT
F17I5-F ATCCAAATCCAAGCTCGATG 55 CAP (PsiI) 670 + 227+ 71 434+237+227+71
F17I5-R TGAACATGACAACTCCAATCG
F28A23-F GGGCTTCCCCTGATATGAAT 60 CAP (BglII) 572 + 279 850
F28A23-R GAAGCCTCGAGAAGCCATC
F10M10-F CCGACATGTAGAAGTTGGGTT 60 SSLP 395 281
F10M10-R TGCAGTTGTTTGTGAAACGC
T4L20-F CCTCCACCGAGAAACATCAT 50 CAP (HindII) 855 595+261
T4L20-R GAAATTGAAAAAGAGCCACGA
F8D20-F AGTGTTATTCATATGATCTGGTT 55 SSLP 559 376
F8D20-R GAGATGATTTGCTTGCGAGA
T9A14-F CCGCAGCTGCACTTTCTTCAA 55 SSLP 502 258
T9A14-R TGCATTGATTTCCGTCTTGA Chromosome 5
MJJ3-F CTTAGGCCTCTTTTGAGGGG 60 SSLP 450 320
MJJ3-R TTTTCACGAACATTACGCCA
PAT1.2-F CATGCTTCATCATTGCCC 60 SSLP 706 606
PAT1.2-R AGCTGAAGCTCTGCCACC
F14I23-F GGTGGAGAAATTGCCCATTA 55 SSLP 521 165
F14I23-R TAATAATTTGGAATCACATGTTT
MIK22-F ACTTCTCGAGCCATAGG 50 SSLP 646 457
MIK22-R GACTCTCTACCGTTGATTTA
MJG14-F CCGTGAATCCTTGTTTGCTT 55 SSLP 758 365
MJG14-R CACGACGAACCCTAGAAACC
K19E20-F ATGAGAGCATATGAGAGGAAA 58 SSLP 649 360
K19E20-R GATGGATTGTTGATGTGTTC
MUB3-F AAACACGTCCTACCATCTAGTCC 60 SSLP 759 443
MUB3-R TAAACGTGTGGCAAATCCAA
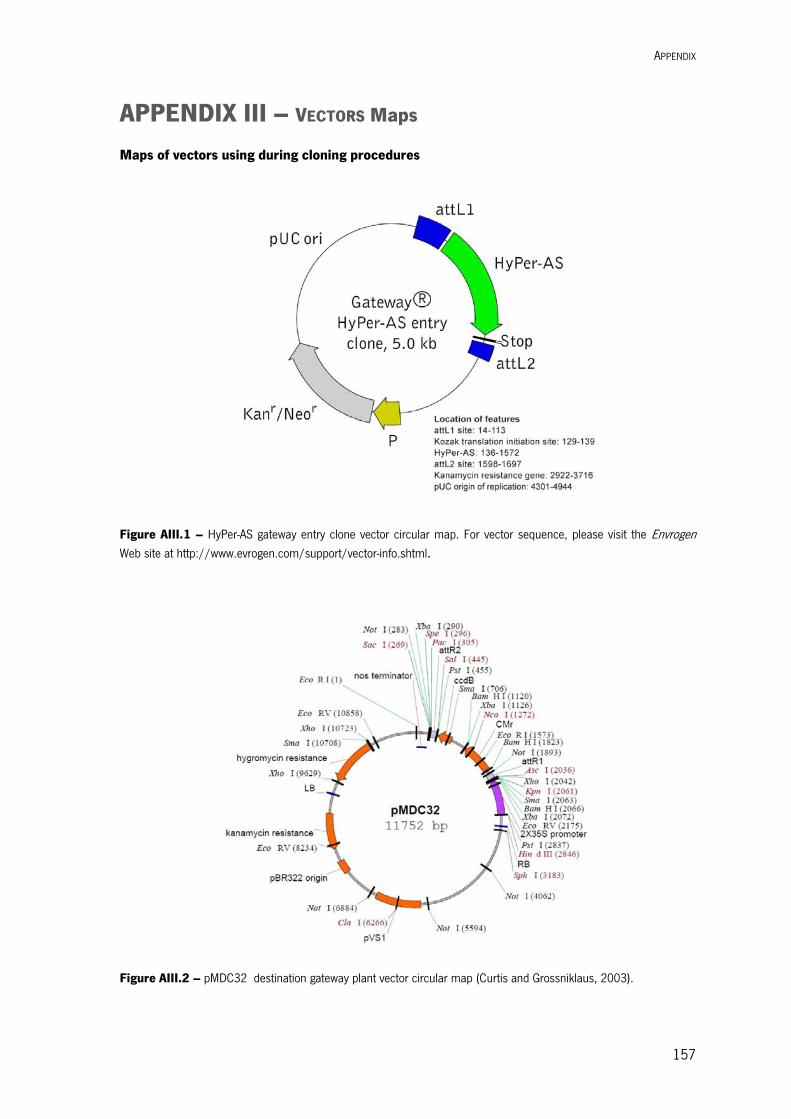
APPENDIX
157
APPENDIX III – VECTORS Maps
Maps of vectors using during cloning procedures
Figure AIII.1 – HyPer-AS gateway entry clone vector circular map. For vector sequence, please visit the Envrogen
Web site at http://www.evrogen.com/support/vector-info.shtml.
Figure AIII.2 – pMDC32 destination gateway plant vector circular map (Curtis and Grossniklaus, 2003).
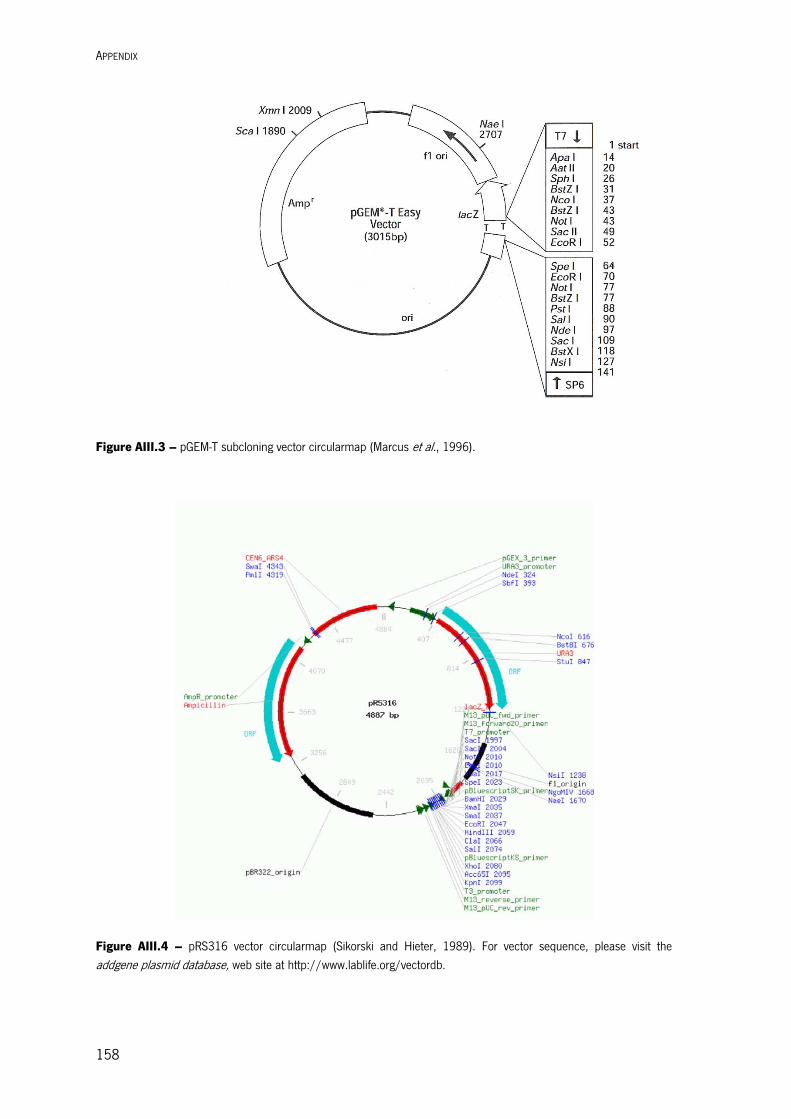
APPENDIX
158
Figure AIII.3 – pGEM-T subcloning vector circularmap (Marcus et al., 1996).
Figure AIII.4 – pRS316 vector circularmap (Sikorski and Hieter, 1989). For vector sequence, please visit the addgene plasmid database, web site at http://www.lablife.org/vectordb.
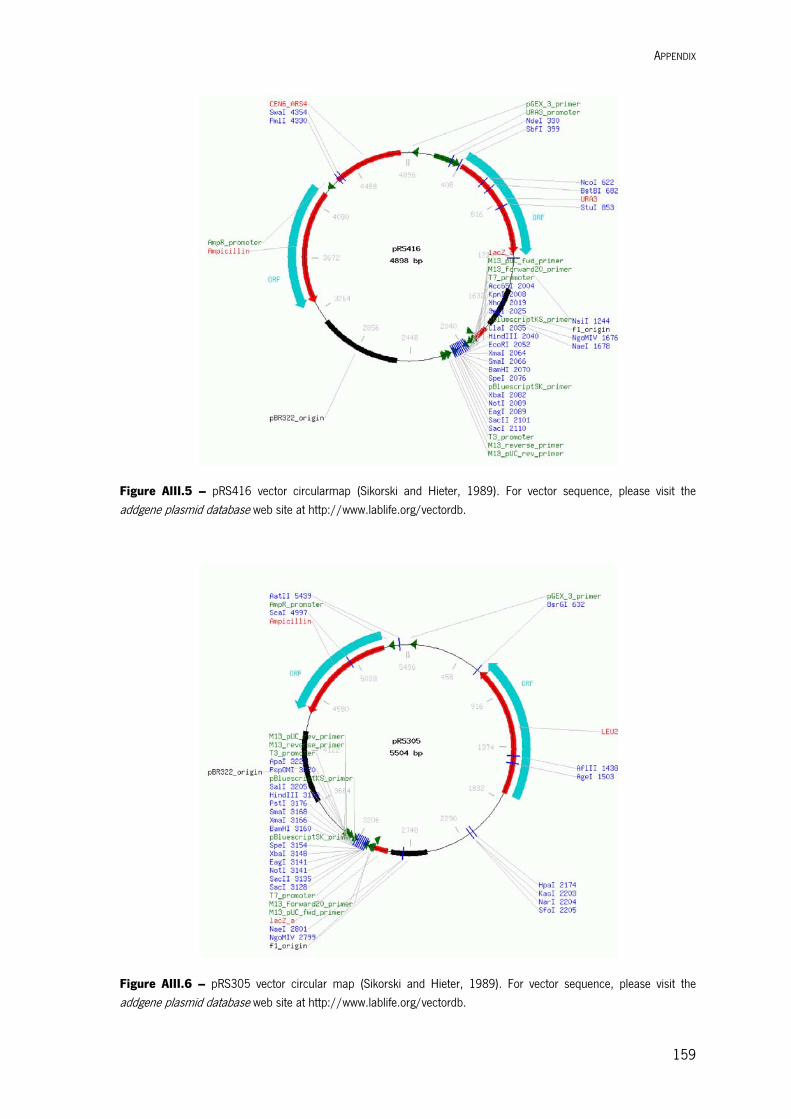
APPENDIX
159
Figure AIII.5 – pRS416 vector circularmap (Sikorski and Hieter, 1989). For vector sequence, please visit the addgene plasmid database web site at http://www.lablife.org/vectordb.
Figure AIII.6 – pRS305 vector circular map (Sikorski and Hieter, 1989). For vector sequence, please visit the addgene plasmid database web site at http://www.lablife.org/vectordb.

APPENDIX
160
APPENDIXES BIBLIOGRAPHIC REFERENCES
Curtis, M.D., and Grossniklaus, U. (2003). A gateway cloning vector set for high-throughput functional
analysis of genes in planta. Plant Physiol 133, 462-469. Doyle, J.J., and Doyle, J.L. (1987). A rapid DNA isolation procedure for small quantities of fresh leaf
tissue. Phytochemical Bulletin 19, 11-15. Edwards, K., Johnstone, C., and Thompson, C. (1991). A simple and rapid method for the
preparation of plant genomic DNA for PCR analysis. Nucleic Acids Res 19, 1349. Griffin, H.G., and Griffin, A.M. (1994). PCR Technology: Current Innovations. (CRC Press). Inoue, H., Nojima, H., and Okayama, H. (1990). High efficiency transformation of Escherichia coli with
plasmids. Gene 96, 23-28.
Marcus, L., Hartnett, J., and Storts, D.R. (1996). The pGEM®-T and pGEM®-T Easy Vector Systems.
In Promega Notes Magazine, pp. 36-38. Rozen, S., and Skaletsky, H. (2000). Primer3 on the WWW for general users and for biologist
programmers. Methods Mol Biol 132, 365-386. Sambrook, J., and Russell, D.W. (2001). Molecular Cloning: A laboratory manual. (Cold Spring
Harbour, New York: Cold Spring Harbour Laboratory Press, ). Sikorski, R.S., and Hieter, P. (1989). A system of shuttle vectors and yeast host strains designed for
efficient manipulation of DNA in Saccharomyces cerevisiae. Genetics 122, 19-27.