Embed Size (px)
Citation preview
Active aging: prevalence and gender and age differences in a population-based study
Envelhecimento ativo: prevalência e diferenças de gênero e idade em estudo de base populacional
Envejecimiento activo: prevalencia y diferencias de género y edad en estudio de base poblacional
Neuciani Ferreira da Silva Sousa 1
Margareth Guimarães Lima 2
Chester Luiz Galvão Cesar 3
Marilisa Berti de Azevedo Barros 2
Abstract
The aim of this study was to analyze prevalence rates and gender and age dif-ferences in indicators of active aging in elders participating in the Campinas Municipal Health Survey in Campinas, São Paulo State, Brazil (2014-2015). We estimated prevalence rates for participation by the elderly in twelve activities pertaining to four dimensions and calculated the prevalence ratios with Poisson regression. The study population consisted of 986 elderly. The results showed that 40.2% of the elderly participated in sociocultural activi-ties, 25.3% were physically active in their leisure time, 21.7% used the Inter-net, 22.1% performed paid work, and only 2.6% were taking courses. In the so-cial dimension, the only gender difference was in religious practice, which was less prevalent in men (PR = 0.67). In the dimension of physical activity, men were more active at work (PR = 2.10), in commuting (PR = 1.61), and in their leisure time (PR = 1.44). There was no gender difference in the intellectual dimension, and men were more active in paid work (PR = 1.78). The analyses by age brackets showed that in men, only physical activity at work and paid work presented lower prevalence in the group 80 years and older. Among the oldest elderly women, lower prevalence rates were seen in six activities, which suggests a possible differential effect of advanced age between the sexes. The results show important rates of participation by elderly in some indicators of active aging, besides challenges in activities that are performed rarely and gender differences in participation.
Aging; Health Status Disparities; Gender and Health; Aged
CorrespondenceN. F. S. SousaRua 217, Quadra 44, no 5, Setor 2, Cuiabá, MT 78088-225, [email protected]
1 Instituto de Saúde Coletiva, Universidade Federal de Mato Grosso, Cuiabá, Brasil.2 Faculdade de Ciências Médicas, Universidade Estadual de Campinas, Campinas, Brasil.3 Faculdade de Saúde Pública, Universidade de São Paulo, São Paulo, Brasil.
doi: 10.1590/0102-311X00173317
Cad. Saúde Pública 2018; 34(11):e00173317
ARTIGOARTICLE
This article is published in Open Access under the Creative Commons Attribution license, which allows use, distribution, and reproduction in any medium, without restrictions, as long as the original work is correctly cited.

Sousa NFS et al.2
Cad. Saúde Pública 2018; 34(J):e00173317
Introduction
Population aging is one of the most significant phenomena of the 21st century 1. The annual growth rate of the global elderly population is approximately 3%, and it is estimated that this population will reach 2.1 billion by 2050. There are currently 962 million individuals 60 years or older in the world, representing 13% of the total population. By 2050, all regions of the world except Africa will have at least one-fourth of their populations in this age bracket 2. In Brazil, 13% of the population is over 60 years of age 2, with the proportion expected to reach 29.3% by 2050 3.
A phenomenon that accompanies population aging is the feminization of old age, i.e., a higher proportion of women than men in the elderly population, especially in the more advanced ages. In 2012, for every 100 women 60 years or older in the world, there were only 84 men, and for every 100 women 80 years or older there were only 61 men 1. Despite variations between regions of the world, women comprise more than half of the elderly population in all of them 4. However, although women tend to live longer, they experience worse quality of life than men, especially due to gender relations that structure the entire life cycle and influence access to resources and opportunities, generating continuous and cumulative impacts on social and economic life 1,5.
Women experience less protection, security, and wellbeing in old age due to various factors, featuring the higher likelihood of working in the informal sector, lower income and schooling, and more chronic and disabling diseases 1,4,6. A major concern for men is the need to promote a culture of self-care. In addition, when elderly men retire and stop working their social support network shrinks, making them more socially vulnerable 1,7.
Given the gender differences in life-course social roles, experiences, and opportunities, a gender approach is essential for implementing active aging policies, currently acknowledged as a key strategy for responding to the revolution in population aging 8,9. The concept of active aging adopted by the World Health Organization (WHO) applies to both societies and individuals. In societies, life-course health opportunities, participation, security, and learning should be optimized through proactive poli-cies, which are necessary for maintaining active living. At the individual level, elderly people should be able to enjoy the opportunities provided according to their needs, capacities, and preferences. In the WHO approach, active aging is a multidimensional concept, including not only economic participa-tion by the elderly, but also unpaid forms of participation such as formal and informal social, cultural, and leisure-time activities or those requiring physical or mental effort 8,9. The WHO thus implic-itly acknowledges the different contributions that various groups of elderly can make to society 10. Nevertheless, little attention has been given to gender implications and other demographic and socioeconomic aspects in studies on active aging, either in the global scenario 10,11 or in the Brazilian context 12, thus leaving an entire agenda open for current research 13. The current study thus aimed to analyze the prevalence of indicators of active aging in the elderly population in a city in Southeast Brazil, as well as gender and age differences in these indicators.
Method
This was a cross-sectional population-based study using data from the Campinas Municipal Health Survey (ISA-CAMP) in Campinas, São Paulo State, Brazil, for 2014-2015. The survey aimed to ana-lyze social patterns, trends, and disparities in multiple health dimensions using home interviews. ISA-CAMP collected data from three subpopulations – adolescents, adults, and elderly – correspond-ing to the age groups 10-19 years, 20-59 years, and 60 years and older, residing in permanent private households in the urban area of Campinas. The current study only analyzed individuals 60 years or older.
A sample of the population was selected using a complex sampling design, starting by dividing the population in five strata corresponding to the five health districts in Campinas: east, northwest, north, southeast, and south. A two-stage cluster selection was then performed with the census tracts and households. Fourteen census tracts were selected in each stratum, totaling 70 units. To obtain the sample, estimated at one thousand elderly individuals, and considering a 20% non-response rate, 3,157 households were sampled. This number of interviews was planned to guarantee estimates of
ACTIVE AGING: PREVALENCE AND GENDER AND AGE DIFFERENCES 3
Cad. Saúde Pública 2018; 34(J):e00173317
0.50 with an error of up to five percentage points, 95% confidence interval (95%CI), and a design effect of 2. All the elderly present in each selected household were interviewed. We opted not to randomly select individuals in each sampled household because the accuracy is similar when interviewing all the elders in the household and is less costly than the design in which only one person is picked per household 14.
Data in ISA-CAMP 2014-2015 were collected with a pre-coded questionnaire containing mostly closed questions and organized in 13 thematic blocks. Data were collected by trained interviewers using a direct interview with the individual, optimized with the use of a tablet. Interviewers had received prior training to discuss the expected approach during the interviews and the details for each question in the study instrument, as well as to allow proper handling of the tablet and a full grasp of the content. All the instructions were provided in a manual.
As for the study variables, active aging was approached according to the definition established by the WHO 8 for the term “active”, which relates to participation in activities with multiple dimen-sions (social, physical, cultural, intellectual, economic, civic, and political). Thus, among the ques-tions available in the questionnaire, we selected those belonging to four of these dimensions 8,9, as described below: (1) Social dimension: the elderly were asked about their participation in four domains: (a) family circle – whether they routinely received or made visits to friends and family; (b) sociocultural activities – whether they participated in activities like movies, theater, community centers, bingos, dances, and others; (c) groups or associations – volunteer work or participation in some association or sporting, cultural, charitable, political, or religious group; (d) religious practice – attendance at a place of wor-ship once a week or more. (2) Dimension of physical activity: estimated from questions from the International Physical Activity Questionnaire (IPAQ) – long version 15, which estimates the time spent per week in moderate and/or vigorous physical activities in the domains of work, commuting, household activities, and leisure. To classify the level of physical activity in each of these domains, a physical activity score was constructed in minutes per week. The score was the sum of the minutes spent in moderate activities plus the min-utes spent in vigorous activities (with the latter multiplied by two). This strategy aimed to represent the different intensities of each activity, as recommended by the WHO 16. A score greater than 150 minutes per week was defined as the cutoff to classify individuals as active in each domain. (3) Intellectual dimension: estimated on the basis of two variables: (a) Internet use and (b) regular attendance at courses in literacy training, basic education, or higher education or courses in comput-ers, languages, dance, and arts.(4) Work dimension: based on participation in the following domains: (a) paid work (estimated with the question: “Do you currently do any paid work or help anyone in your family with their work?”); (b) retirees that work (elderly that are already retired but still do some form of work).
The study population was characterized by the following demographic and socioeconomic vari-ables: sex (female or male); age bracket (60-69, 70-79, 80 and older); race/color (white, black/brown, other); conjugal status (married/in stable union, separated/divorced, widow/widower, single); reli-gion (none, Protestant, Catholic, other); and schooling in years (0-4, 5-10, 11 or more).
For gender, the prevalence rates were analyzed for each domain of active aging, and the prevalence rates for active aging were stratified by age brackets. The proportions were compared with the Pear-son chi-square test, setting statistical significance at p < 0.05, and using adjusted prevalence ratios and the respective 95%CI, calculated with Poisson regression.
The final weight for each individual in the sample was calculated by multiplying the design weight by the non-response weight and by the post-stratification adjustment weight. The gender and age distributions were also considered, based on the population projection by the São Paulo Data Analysis System (SEADE). The effect of the complex sampling design was considered in all the analyses, using the survey module from Stata 14.0 (https://www.stata.com).
The ISA-CAMP study was approved by the Institutional Review Board of the School of Medicine, State University of Campinas, case review n. 409.714, September 30, 2013.
Sousa NFS et al.4
Cad. Saúde Pública 2018; 34(J):e00173317
Results
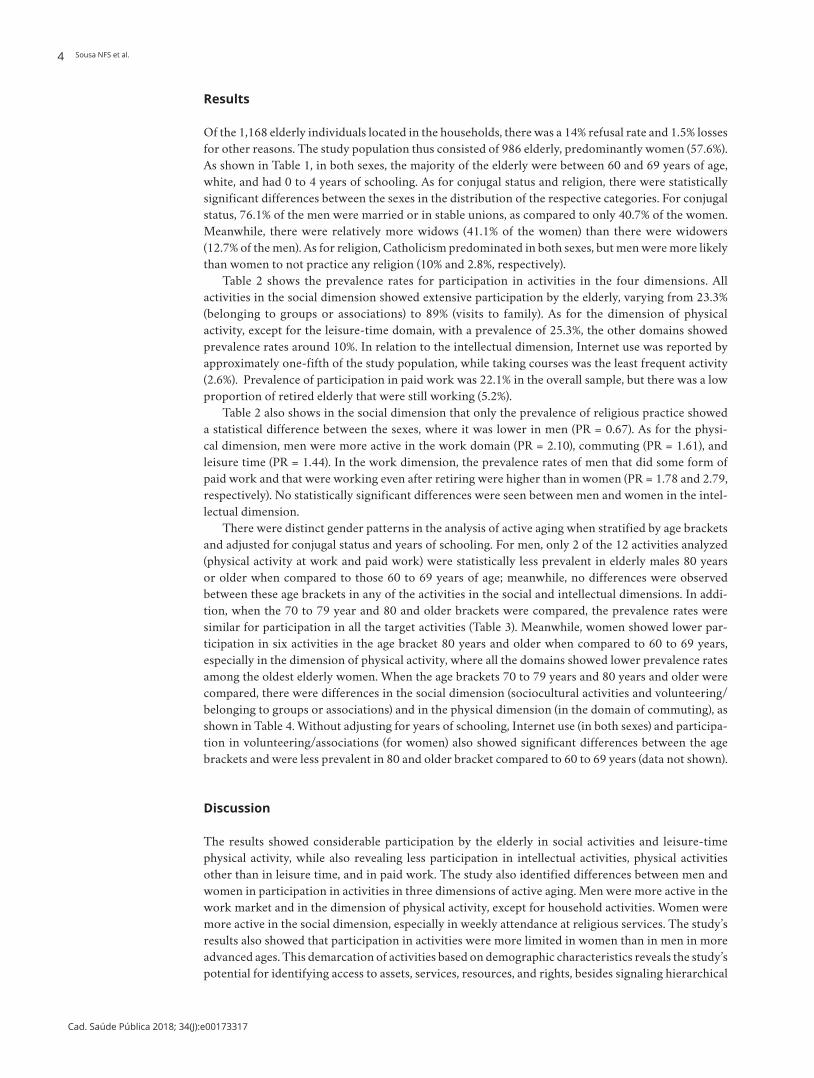
Of the 1,168 elderly individuals located in the households, there was a 14% refusal rate and 1.5% losses for other reasons. The study population thus consisted of 986 elderly, predominantly women (57.6%). As shown in Table 1, in both sexes, the majority of the elderly were between 60 and 69 years of age, white, and had 0 to 4 years of schooling. As for conjugal status and religion, there were statistically significant differences between the sexes in the distribution of the respective categories. For conjugal status, 76.1% of the men were married or in stable unions, as compared to only 40.7% of the women. Meanwhile, there were relatively more widows (41.1% of the women) than there were widowers (12.7% of the men). As for religion, Catholicism predominated in both sexes, but men were more likely than women to not practice any religion (10% and 2.8%, respectively).
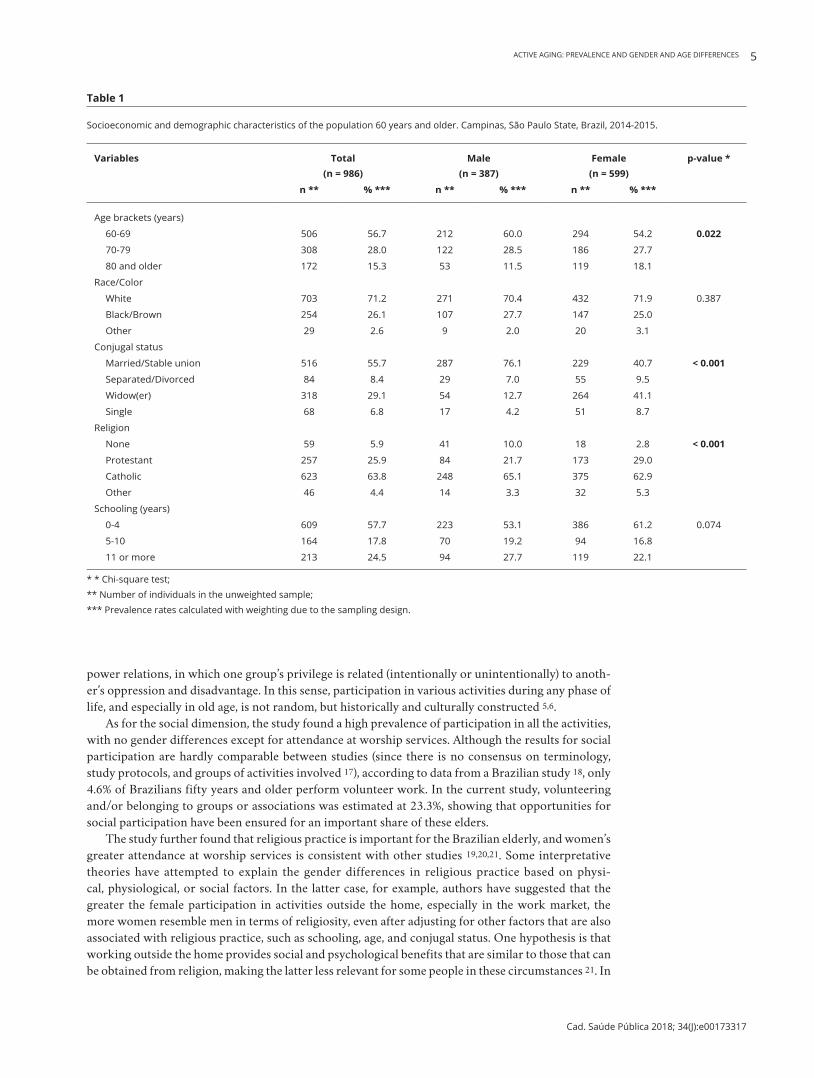
Table 2 shows the prevalence rates for participation in activities in the four dimensions. All activities in the social dimension showed extensive participation by the elderly, varying from 23.3% (belonging to groups or associations) to 89% (visits to family). As for the dimension of physical activity, except for the leisure-time domain, with a prevalence of 25.3%, the other domains showed prevalence rates around 10%. In relation to the intellectual dimension, Internet use was reported by approximately one-fifth of the study population, while taking courses was the least frequent activity (2.6%). Prevalence of participation in paid work was 22.1% in the overall sample, but there was a low proportion of retired elderly that were still working (5.2%).
Table 2 also shows in the social dimension that only the prevalence of religious practice showed a statistical difference between the sexes, where it was lower in men (PR = 0.67). As for the physi-cal dimension, men were more active in the work domain (PR = 2.10), commuting (PR = 1.61), and leisure time (PR = 1.44). In the work dimension, the prevalence rates of men that did some form of paid work and that were working even after retiring were higher than in women (PR = 1.78 and 2.79, respectively). No statistically significant differences were seen between men and women in the intel-lectual dimension.
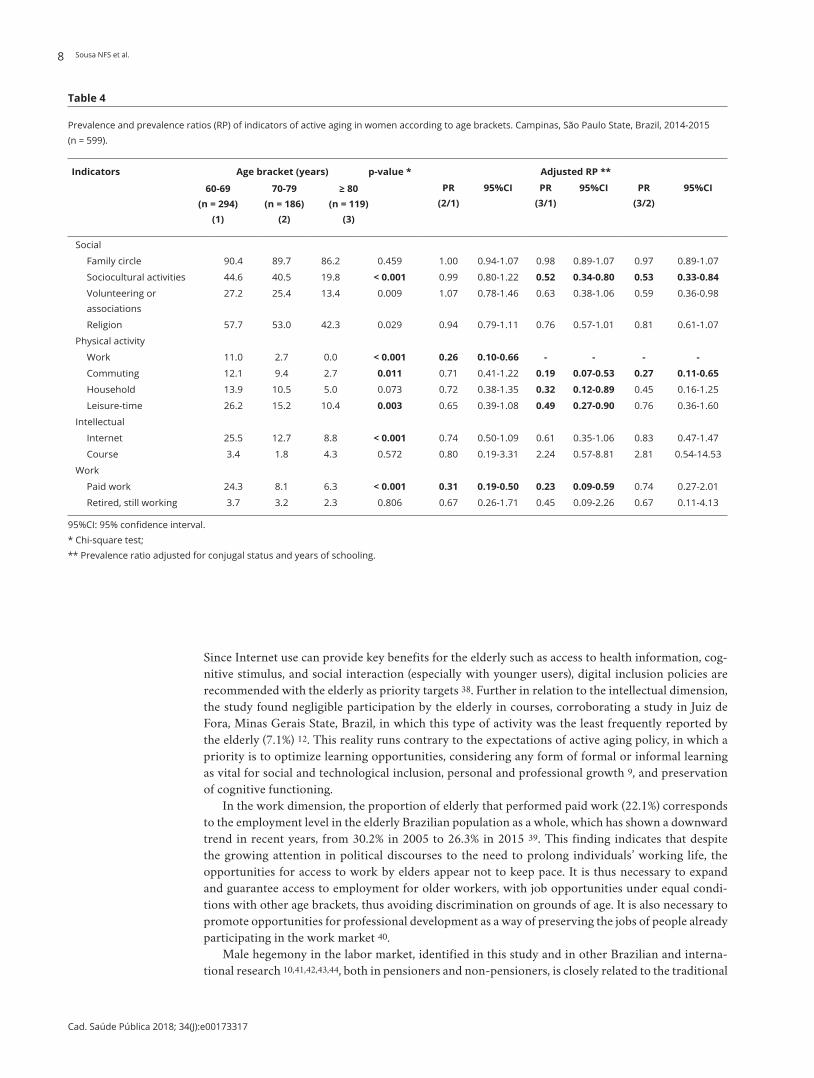
There were distinct gender patterns in the analysis of active aging when stratified by age brackets and adjusted for conjugal status and years of schooling. For men, only 2 of the 12 activities analyzed (physical activity at work and paid work) were statistically less prevalent in elderly males 80 years or older when compared to those 60 to 69 years of age; meanwhile, no differences were observed between these age brackets in any of the activities in the social and intellectual dimensions. In addi-tion, when the 70 to 79 year and 80 and older brackets were compared, the prevalence rates were similar for participation in all the target activities (Table 3). Meanwhile, women showed lower par-ticipation in six activities in the age bracket 80 years and older when compared to 60 to 69 years, especially in the dimension of physical activity, where all the domains showed lower prevalence rates among the oldest elderly women. When the age brackets 70 to 79 years and 80 years and older were compared, there were differences in the social dimension (sociocultural activities and volunteering/belonging to groups or associations) and in the physical dimension (in the domain of commuting), as shown in Table 4. Without adjusting for years of schooling, Internet use (in both sexes) and participa-tion in volunteering/associations (for women) also showed significant differences between the age brackets and were less prevalent in 80 and older bracket compared to 60 to 69 years (data not shown).
Discussion
The results showed considerable participation by the elderly in social activities and leisure-time physical activity, while also revealing less participation in intellectual activities, physical activities other than in leisure time, and in paid work. The study also identified differences between men and women in participation in activities in three dimensions of active aging. Men were more active in the work market and in the dimension of physical activity, except for household activities. Women were more active in the social dimension, especially in weekly attendance at religious services. The study’s results also showed that participation in activities were more limited in women than in men in more advanced ages. This demarcation of activities based on demographic characteristics reveals the study’s potential for identifying access to assets, services, resources, and rights, besides signaling hierarchical
ACTIVE AGING: PREVALENCE AND GENDER AND AGE DIFFERENCES 5
Cad. Saúde Pública 2018; 34(J):e00173317
Table 1
Socioeconomic and demographic characteristics of the population 60 years and older. Campinas, São Paulo State, Brazil, 2014-2015.
Variables Total (n = 986)
Male (n = 387)
Female (n = 599)
p-value *
n ** % *** n ** % *** n ** % ***
Age brackets (years)
60-69 506 56.7 212 60.0 294 54.2 0.022
70-79 308 28.0 122 28.5 186 27.7
80 and older 172 15.3 53 11.5 119 18.1
Race/Color
White 703 71.2 271 70.4 432 71.9 0.387
Black/Brown 254 26.1 107 27.7 147 25.0
Other 29 2.6 9 2.0 20 3.1
Conjugal status
Married/Stable union 516 55.7 287 76.1 229 40.7 < 0.001
Separated/Divorced 84 8.4 29 7.0 55 9.5
Widow(er) 318 29.1 54 12.7 264 41.1
Single 68 6.8 17 4.2 51 8.7
Religion
None 59 5.9 41 10.0 18 2.8 < 0.001
Protestant 257 25.9 84 21.7 173 29.0
Catholic 623 63.8 248 65.1 375 62.9
Other 46 4.4 14 3.3 32 5.3
Schooling (years)
0-4 609 57.7 223 53.1 386 61.2 0.074
5-10 164 17.8 70 19.2 94 16.8
11 or more 213 24.5 94 27.7 119 22.1
* * Chi-square test; ** Number of individuals in the unweighted sample; *** Prevalence rates calculated with weighting due to the sampling design.
power relations, in which one group’s privilege is related (intentionally or unintentionally) to anoth-er’s oppression and disadvantage. In this sense, participation in various activities during any phase of life, and especially in old age, is not random, but historically and culturally constructed 5,6.
As for the social dimension, the study found a high prevalence of participation in all the activities, with no gender differences except for attendance at worship services. Although the results for social participation are hardly comparable between studies (since there is no consensus on terminology, study protocols, and groups of activities involved 17), according to data from a Brazilian study 18, only 4.6% of Brazilians fifty years and older perform volunteer work. In the current study, volunteering and/or belonging to groups or associations was estimated at 23.3%, showing that opportunities for social participation have been ensured for an important share of these elders.
The study further found that religious practice is important for the Brazilian elderly, and women’s greater attendance at worship services is consistent with other studies 19,20,21. Some interpretative theories have attempted to explain the gender differences in religious practice based on physi-cal, physiological, or social factors. In the latter case, for example, authors have suggested that the greater the female participation in activities outside the home, especially in the work market, the more women resemble men in terms of religiosity, even after adjusting for other factors that are also associated with religious practice, such as schooling, age, and conjugal status. One hypothesis is that working outside the home provides social and psychological benefits that are similar to those that can be obtained from religion, making the latter less relevant for some people in these circumstances 21. In
Sousa NFS et al.6
Cad. Saúde Pública 2018; 34(J):e00173317
Table 2
Prevalence and prevalence ratios (PR) of indicators of active aging according to gender. Campinas, São Paulo State, Brazil, 2014-2015.
Indicators Sex (%) p-value * Adjusted PR **,*** 95%CI Adjusted PR **,# 95%CI
Total Women (n = 599)
Men (n = 387)
Social
Family circle 89.0 89.4 88.4 0.647 0.98 0.94-1.04 0.98 0.93-1.03
Sociocultural activities 40.2 39.0 41.8 0.412 1.05 0.88-1.24 0.98 0.82-1.17
Volunteering/Associations 23.3 24.2 22.1 0.523 0.89 0.67-1.19 0.80 0.59-1.10
Religion 47.1 53.6 38.2 < 0.001 0.70 0.60-0.82 0.67 0.57-0.78
Physical activity
Work 9.9 6.7 14.3 < 0.001 1.97 1.41-2.77 2.10 1.45-3.03
Commuting 10.9 9.7 12.5 0.1906 1.27 0.84-1.91 1.61 1.02-2.52
Household 11.4 11.3 11.4 0.9624 0.98 0.68-1.43 1.03 0.74-1.44
Leisure 25.3 20.3 32.1 < 0.001 1.52 1.18-1.97 1.44 1.09-1.90
Intellectual
Internet use 21.7 18.9 25.6 0.022 1.27 0.98-1.65 0.91 0.73-1.13
Courses 2.6 3.1 1.9 0.387 0.61 0.20-1.85 0.48 0.15-1.52
Work
Paid work 22.1 16.5 29.6 < 0.001 1.66 1.31-2.11 1.78 1.40-2.25
Retired, still working 5.2 3.3 7.8 < 0.001 2.25 1.37-3.67 2.79 1.81-4.30
95%CI: 95% confidence interval. * Chi-square test; ** Reference category: female gender; *** Age-adjusted prevalence ratio; # Prevalence ratio adjusted for age, conjugal status, and years of schooling.
our study, even after adjusting for age, schooling, and conjugal status, women remained more active in attendance at religious services, strengthening the consensus that gender difference in religion prob-ably stems from a complex combination of multiple factors, in which culture, religious tradition, and workforce participation play a modulating role 21.
The current study analyzed physical activity in four domains: leisure, work, household, and com-muting. The analysis of physical activity according to these domains is relevant: although the benefits of regular weeklong physical activity are well-known, particularly in the context of leisure time, there is growing recognition of the need to encourage integrating physical activity into daily lifestyle in order for individuals to achieve the recommended levels 16. However, the effects of each domain of physical activity on health may differ (it is more common to observe the pronounced beneficial effects of leisure-time physical activity on health when compared to physical activity in other domains 22). The current study showed low prevalence of physical activity at work, at home, and during commut-ing when compared to the leisure-time domain. For physical activity in leisure time, the observed prevalence was similar to that in Brazil’s state capitals (22.3%) 23, but more than double the rate in 2008 in a study in the same population 24 and also considerably higher than the national estimate of the elderly that are physically active in leisure time, namely 13.6% 25.
The literature has consistently reported higher rates of leisure-time physical activity in men 24,26, corroborating the current study’s findings. The prevalence rates in the current study, both for men and women, are also similar to those seen in Brazil’s state capitals (29.4% and 18%, respectively) 23. Some authors have suggested that this difference may be due to a genetic predisposition to be more or less physically active 27, but any such predisposition is purportedly mediated by a series of biological, psychological, social, and environmental factors that accumulate over time and affect the later stages of life 28. Consistent with this perspective, evidence indicates that leisure-time physical activity in

ACTIVE AGING: PREVALENCE AND GENDER AND AGE DIFFERENCES 7
Cad. Saúde Pública 2018; 34(J):e00173317
Table 3
Prevalence and prevalence ratios (PR) of indicators of active aging in men according to age brackets. Campinas, São Paulo State, Brazil. 2014-2015 (n = 387).
Indicators Age bracket (years) p-value * RP ajustada **
60-69 (n = 212)
(1)
70-79 (n = 122)
(2)
≥ 80 (n = 53)
(3)
PR (2/1)
95%CI PR (3/1)
95%CI PR (3/2)
95%CI
Social
Family circle 89.6 86.1 88.0 0.642 0.97 0.86-1.09 0.99 0.88-1.13 1.03 0.93-1.14
Sociocultural activities 43.8 37.9 41.1 0.608 1.00 0.74-1.37 1.15 0.73-1.81 1.15 0.74-1.79
Volunteering or associations
21.8 23.7 19.5 0.835 1.20 0.75-1.92 1.01 0.47-2.16 0.84 0.44-1.59
Religion 37.6 42.3 31.0 0.427 1.13 0.82-1.55 0.89 0.55-1.43 0.79 0.49-1.28
Physical activity
Work 20.2 4.3 8.2 < 0.001 0.19 0.07-0.49 0.31 0.11-0.83 1.66 0.48-5.78
Commuting 11.2 14.5 14.5 0.671 1.04 0.52-2.08 0.84 0.35-1.98 0.81 0.34-1.90
Household 12.4 9.8 10.4 0.783 0.86 0.39-1.89 0.90 0.32-2.48 1.05 0.31-3.54
Leisure-time 36.0 27.0 24.4 0.122 0.82 0.56-1.21 0.76 0.30-1.34 0.92 0.55-1.56
Intellectual
Internet 33.7 13.7 12.4 < 0.001 0.63 0.39-1.02 0.70 0.41-1.20 1.10 0.59-2.04
Courses 1.9 1.2 3.7 0.597 1.07 0.16-7.06 3.03 0.45-20.48 2.84 0.38-21.29
Work
Paid work 42.4 10.8 8.9 < 0.001 0.27 0.16-0.45 0.22 0.08-0.64 0.83 0.30-2.35
Retired, still working 9.3 6.2 3.6 0.342 0.72 0.37-1.41 0.42 0.06-2.80 0.58 0.09-3.58
95%CI: 95% confidence interval. * Chi-square test; ** Prevalence ratio adjusted for conjugal status and years of schooling.
childhood and youth, plus life-course gender expectations, are the most important determinants of leisure-time physical activity in old age 29,30,31,32.
In the other domains of physical activity, we observed gender differences in physical activity at work and during commuting, both of which were more prevalent in men. As for physical activity at work, a systematic review showed that men, ethnic minorities, lower-income individuals, and blue-collar workers have higher levels of physical activity at work 33. According to the review, this kind of physical activity can be a marker of both gender and social inequalities, and it should thus be analyzed with caution. Both the physical work activities performed by different categories of workers (execu-tives, blue-collar workers, farm workers, and large landholding farmers, among others) and the moti-vations and objectives of the work activities themselves are unequal and sometimes involuntary 34. Another systematic review 26 also found that men are more active in commuting than women. Note however that active commuting can involve unfavorable conditions such as exposure to air pollution and hazardous streets and sidewalks, a point that requires greater attention from studies on the spe-cific effects of each domain of physical activity on health 22.
In the intellectual dimension, the results highlighted the low prevalence of Internet use in both men and women, corroborating findings from other Brazilian studies 35,36. Although Internet use by elderly Brazilians has increased (from 12.6% in 2013 to 17.4% in 2015), 60 and older is still the age bracket with the least Internet access in the country 35,36. The Brazilian reality differs from that of the United States, for example, where 67% of elderly report being connected to the Internet, ranging from 82% for elderly Americans 65 to 69 years of age to 44% for those 80 years or older 37. Notably, Internet use by the oldest Americans (octogenarians and older) is already higher than in the youngest Brazilian elders in the current study, which underscores the challenge of digital inclusion in Brazil.
Sousa NFS et al.8
Cad. Saúde Pública 2018; 34(J):e00173317
Table 4
Prevalence and prevalence ratios (RP) of indicators of active aging in women according to age brackets. Campinas, São Paulo State, Brazil, 2014-2015 (n = 599).
Indicators Age bracket (years)
60-69 (n = 294)
(1)
70-79 (n = 186)
(2)
≥ 80 (n = 119)
(3)
p-value * Adjusted RP **
PR (2/1)
95%CI PR (3/1)
95%CI PR (3/2)
95%CI
Social
Family circle 90.4 89.7 86.2 0.459 1.00 0.94-1.07 0.98 0.89-1.07 0.97 0.89-1.07
Sociocultural activities 44.6 40.5 19.8 < 0.001 0.99 0.80-1.22 0.52 0.34-0.80 0.53 0.33-0.84
Volunteering or associations
27.2 25.4 13.4 0.009 1.07 0.78-1.46 0.63 0.38-1.06 0.59 0.36-0.98
Religion 57.7 53.0 42.3 0.029 0.94 0.79-1.11 0.76 0.57-1.01 0.81 0.61-1.07
Physical activity
Work 11.0 2.7 0.0 < 0.001 0.26 0.10-0.66 - - - -
Commuting 12.1 9.4 2.7 0.011 0.71 0.41-1.22 0.19 0.07-0.53 0.27 0.11-0.65
Household 13.9 10.5 5.0 0.073 0.72 0.38-1.35 0.32 0.12-0.89 0.45 0.16-1.25
Leisure-time 26.2 15.2 10.4 0.003 0.65 0.39-1.08 0.49 0.27-0.90 0.76 0.36-1.60
Intellectual
Internet 25.5 12.7 8.8 < 0.001 0.74 0.50-1.09 0.61 0.35-1.06 0.83 0.47-1.47
Course 3.4 1.8 4.3 0.572 0.80 0.19-3.31 2.24 0.57-8.81 2.81 0.54-14.53
Work
Paid work 24.3 8.1 6.3 < 0.001 0.31 0.19-0.50 0.23 0.09-0.59 0.74 0.27-2.01
Retired, still working 3.7 3.2 2.3 0.806 0.67 0.26-1.71 0.45 0.09-2.26 0.67 0.11-4.13
95%CI: 95% confidence interval. * Chi-square test; ** Prevalence ratio adjusted for conjugal status and years of schooling.
Since Internet use can provide key benefits for the elderly such as access to health information, cog-nitive stimulus, and social interaction (especially with younger users), digital inclusion policies are recommended with the elderly as priority targets 38. Further in relation to the intellectual dimension, the study found negligible participation by the elderly in courses, corroborating a study in Juiz de Fora, Minas Gerais State, Brazil, in which this type of activity was the least frequently reported by the elderly (7.1%) 12. This reality runs contrary to the expectations of active aging policy, in which a priority is to optimize learning opportunities, considering any form of formal or informal learning as vital for social and technological inclusion, personal and professional growth 9, and preservation of cognitive functioning.
In the work dimension, the proportion of elderly that performed paid work (22.1%) corresponds to the employment level in the elderly Brazilian population as a whole, which has shown a downward trend in recent years, from 30.2% in 2005 to 26.3% in 2015 39. This finding indicates that despite the growing attention in political discourses to the need to prolong individuals’ working life, the opportunities for access to work by elders appear not to keep pace. It is thus necessary to expand and guarantee access to employment for older workers, with job opportunities under equal condi-tions with other age brackets, thus avoiding discrimination on grounds of age. It is also necessary to promote opportunities for professional development as a way of preserving the jobs of people already participating in the work market 40.
Male hegemony in the labor market, identified in this study and in other Brazilian and interna-tional research 10,41,42,43,44, both in pensioners and non-pensioners, is closely related to the traditional
ACTIVE AGING: PREVALENCE AND GENDER AND AGE DIFFERENCES 9
Cad. Saúde Pública 2018; 34(J):e00173317
family support model, in which men are the primary breadwinners, while women are left in charge of unpaid family care, resulting in their own economic dependence on men 45. Gender disparity in the prevalence of paid work can also be explained by the countries’ levels of economic and educational development 44 and by more intrinsic gender factors such as women’s career interruptions to dedicate their time and work to motherhood or care for dependent relatives (which can hinder women’s rein-sertion in the work market), besides the difference in legal retirement age between men and women 10,46. Although women retire earlier than men, retirement for women apparently translates in practice as definitive exclusion from the work market 47. Thus, studies have shown that more retired men return to the labor market when compared to retired women 43,48.
As for observed gender differences in indicators of active aging according to age brackets, at more advanced ages, women participated less in activities than men. Among the oldest elderly men, partici-pation was only lower in two activities. Meanwhile, the oldest women showed lower participation in six activities. For certain activities such as work, the proportion can be expected to decrease with advanc-ing age in both men and women 44. For other activities however, especially those that promote social interaction and preservation of physical and cognitive functions, this reduction is not desirable 17. What is actually expected is an adaptation to such activities in order to respect individual needs, capacities, and preferences, which can change in each phase of old age 9. The observed differences between men and women in active aging according to age thus merit closer attention. Since this was a cross-sectional study, it is not possible to speak of “decline” or “reduction” in activities with advanc-ing age. The reference is actually to individuals from different birth cohorts, i.e., it is possible that the oldest elderly did not “stop doing” certain activities, but rather had never taken them up in the first place. Profound social transformations that began in the early 20th century, such as women’s continu-ous emancipation and changes in family composition 42 have led to increasingly lower impact from traditional gender conventions with each passing generation, contributing to a gradual increase in women’s participation in society throughout the life cycle and in a wide range of domains. Such trans-formations may be the source of the sharp differences in women when comparing those 60 versus 80 years of age, as seen in this study. Therefore, one can expect that with each new generation there will be smaller differences in the way people age, especially for women.
The study used indicators that provide an overview of the current experience with active aging, thereby helping expand knowledge on this issue. However, some limitations were identified, such as the lack of information on the actual frequency of sociocultural activities and participation in groups or associations, the reasons for (and frequency) of Internet use, and satisfaction from work. Such details are useful for understanding active aging, since activities can have different effects on health and well-being, depending on the context. Survival bias was considered as another study limitation, based on the logical error of studying elderly that survived early mortality, the latter being more common in persons with greater life-course risk exposure. Such a bias would thus tend to reduce the size of associations between study variables 49. Meanwhile, the study strengths were the sample size (which allowed estimating most of the indicators of active aging with good precision in the target strata), high data quality, and the use of indicators that have received less attention in the elderly population, based on a multidimensional approach to active aging.
Final remarks
The study’s results reveal positive aspects of active aging among the elderly in the sample, such as important participation in the social dimension and in leisure-time physical activity, with prevalence rates exceeding the national estimates for Brazil. The study further contributed to identifying activi-ties with less participation by elderly Brazilians, such as taking courses, Internet use, and paid work, which are still challenges for active aging. The study also showed that participation in various activi-ties in old age is intrinsically related to traditional gender roles that may be consolidated throughout the life course and are taken for granted by the time one reaches old age. In turn, this condition at least partly shapes differential access by men and women to resources, goods, and services that optimize participation in certain life domains. Finally, the study found that differences in active aging between men and women increase when ones analyzes the indicators according to age brackets. Men 80 years
Sousa NFS et al.10
Cad. Saúde Pública 2018; 34(J):e00173317
and older, when compared to those 60 to 69 years of age, only decreased their participation in physical activity at work and in paid work. Meanwhile, women 80 years and older showed lower participation in sociocultural activities, in all domains of physical activity, and in work market participation when compared to younger elderly women. These findings highlight the need for strategies to promote active aging that are adapted and appropriate for men and women in different age groups in order avoid the persistence and aggravation of gender inequalities.
Contributors
N. F. S. Sousa participated in the study conception, data analysis and interpretation, and writing of the manuscript. M. G. Lima participated in the data analysis and interpretation and critical revision of the manuscript. C. L. G. Cesar participated in the critical revision of the manuscript. M. B. A. Barros participated in the study conception, data analysis and interpretation, critical revision of the manu-script, and approval of the final version for publica-tion. All authors have approved the final version for publication of the article.
Acknowledgments
The authors wish to thank the São Paulo State Research Foundation (FAPESP) for funding the ISA-CAMP survey (n. 2012/23324-3), the Brazil-ian Ministry of Health (Health Surveillance Depart-ment) and the Campinas Municipal Health Depart-ment for additional funding of ISA-CAMP (n. 02-P-28749/2013), the Brazilian Graduate Studies Coor-dinating Board (Capes) for the PhD scholarship for N. F. S. Sousa, and the Brazilian National Research Council (CNPq) for the research scholarship for M. B. A. Barros.
References
1. United Nations Population Fund; HelpAge In-ternational. Ageing in the twenty-first century: a celebration and a challenge. New York: Uni-ted Nations Population Fund/London: HelpA-ge International; 2012.
2. United Nations. World population prospects: key findings and advance tables. The 2017 re-vision. New York: United Nations; 2017.
3. United Nations. World population prospects: key findings and advance tables. The 2015 re-vision. New York: United Nations; 2015.
4. United Nations. The World’s women 2010. Trends and statistics. New York: United Na-tions; 2010.
5. Calasanti T. Feminist gerontology and old men. J Gerontol B Psychol Sci Soc Sci 2004; 59:S305-14.
6. Cobos FM, Almendro JME. Envejecimiento activo y desigualdades de género. Aten Prim 2008; 40:305-9.
7. World Health Organization. Men ageing and health. Geneva: World Health Organization; 2001.
8. World Health Organization. Active ageing: a policy framework. Geneva: World Health Or-ganization; 2002.
9. Centro Internacional de Longevidade Brasil. Envelhecimento ativo: um marco político em resposta à revolução da longevidade. Rio de Janeiro: Centro Internacional de Longevidade Brasil; 2015.
10. Ilinca S, Rodrigues R, Schmidt A, Zolyomi E. Gender and social class inequalities in active ageing: policy meets theory. Vienna: European Centre for Social Welfare Policy and Research; 2016.
11. Timonen V. Beyond successful and active ageing: a theory of model ageing. Bristol: Bris-tol University Press; 2016.
12. Ribeiro PCC, Neri AL, Cupertino APFB, Yas-suda MS. Variabilidade no envelhecimento ati-vo segundo gênero, idade e saúde. Psicol Estud 2009; 14:501-9.
13. Paz A, Doron I, Tur-Sinai A. Gender, aging, and the economics of “active aging”: setting a new research agenda. J Women Aging 2017; 3:1-20.
ACTIVE AGING: PREVALENCE AND GENDER AND AGE DIFFERENCES 11
Cad. Saúde Pública 2018; 34(J):e00173317
14. Alves MCGP, Escuder MML, Claro RM, Silva NN. Sorteio intradomiciliar em inquéritos de saúde. Rev Saúde Pública 2014; 48:86-93.
15. Matsudo S, Araújo T, Matsudo V, Andrade D, Andrade E, Oliveira LC, et al. Questionário in-ternacional de atividade física (IPAQ): estudo de validade e reprodutibilidade no Brasil. Rev Bras Ativ Fís Saúde 2001; 6:5-18.
16. World Health Organization. Global recom-mendations on physical activity for health. Ge-neva: World Health Organization; 2010.
17. Dias EG, Duarte YAO, Lebrão ML. Efeitos longitudinais das atividades avançadas de vi-da diária em idosos: implicações para a rea-bilitação gerontológica. Mundo Saúde 2010; 34:258-67.
18. Instituto Brasileiro de Geografia e Estatística. Pesquisa Nacional por Amostra de Domicílios contínua 2016: outras formas de trabalho. Rio de Janeiro: Instituto Brasileiro de Geografia e Estatística; 2017.
19. Moreira-Almeida A, Pinsky I, Zaleski M, La-ranjeira R. Envolvimento religioso e fatores sociodemográficos: resultados de um levanta-mento nacional no Brasil. Rev Psiquiatr Clín (São Paulo) 2010; 37:12-5.
20. Pew Research Center. America’s changing reli-gious landscape. Washington DC: Pew Resear-ch Center; 2015.
21. Pew Research Center. The gender gap in reli-gion around the World. Washington DC: Pew Research Center; 2016.
22. Abu-Omar K, Rütten A. Relation of leisure ti-me, occupational, domestic, and commuting physical activity to health indicators in Euro-pe. Prev Med 2008; 47:319-23.
23. Departamento de Vigilância de Doenças e Agravos não Transmissíveis e Promoção da Saúde, Secretaria de Vigilância em Saúde, Mi-nistério da Saúde. Vigitel Brasil 2016: vigilân-cia de fatores de risco e proteção para doenças crônicas por inquérito telefônico: estimativas sobre frequência e distribuição sociodemográ-fica de fatores de risco e proteção para doenças crônicas nas capitais dos 26 estados brasileiros e no Distrito Federal em 2016. Brasília: Minis-tério da Saúde; 2017.
24. Francisco PMSB, Segri NJ, Barros MBA, Mal-ta DC. Desigualdades sociodemográficas nos fatores de risco e proteção para doenças crôni-cas não transmissíveis: inquérito telefônico em Campinas, São Paulo. Epidemiol Serv Saúde 2015; 24:7-18.
25. Malta DC, Andrade SSCA, Stopa SR, Pereira CA, Szwarcwald CL, Silva Júnior JB, et al. Esti-los de vida da população brasileira: resultados da Pesquisa Nacional de Saúde, 2013. Epide-miol Serv Saúde 2015; 24:217-26.
26. Notthoff N, Reisch P, Gerstorf D. Individual characteristics and physical activity in older adults: a systematic review. Gerontology 2017; 63:443-59.
27. Moore-Harrison T, Lightfoot JT. Driven to be inactive? The genetics of physical activity. Prog Mol Biol Transl Sci 2010; 94:271-90.
28. Bailey R, Wellard I, Dismore H. Girls’ parti-cipation in physical activities and sports: be-nefits, patterns, influences and ways forward. Geneva: World Health Organization; 2004. (Technical Report).
29. Schutzer KA, Graves BS. Barriers and moti-vations to exercise in older adults. Prev Med 2004; 39:1056-61.
30. Allender S, Cowburn G, Foster C. Unders-tanding participation in sport and physical activity among children and adults: a review of qualitative studies. Health Educ Res 2006; 21:826-35.
31. Hirvensalo M, Lintunen T. Life-course pers-pective for physical activity and sports partici-pation. Eur Rev Aging Phys Act 2011; 8:13-22.
32. Salles-Costa R, Heilborn ML, Werneck GL, Faerstein E, Lopes CS. Gênero e prática de ati-vidade física de lazer. Cad Saúde Pública 2003; 19 Suppl 2:S325-33.
33. Smith L, McCourt O, Sawyer A, Ucci M, Mar-mot A, Wardle J, et al. A review of occupational physical activity and sedentary behaviour cor-relates. Occup Med (Lond) 2016; 66:185-92.
34. Waissmann W. Desigualdade social e atividade física. In: Bagrichevsky M, Palma A, Estevão A, organizadores. A saúde em debate na educação física. Blumenau: Edibes; 2003. p. 53-78.
35. Instituto Brasileiro de Geografia e Estatística. Pesquisa Nacional por Amostra de Domicílios: síntese de indicadores 2013. 2a Ed. Rio de Ja-neiro: Instituto Brasileiro de Geografia e Esta-tística; 2015.
36. Instituto Brasileiro de Geografia e Estatística. Pesquisa nacional por amostra de domicílios: acesso à internet e à televisão e posse de tele-fone móvel celular para uso pessoal 2015. Rio de Janeiro: Instituto Brasileiro de Geografia e Estatística; 2016.
37. Pew Research Center. Tech adoption climbs among older adults. Washington DC: Pew Re-search Center; 2017.
38. Miranda LM, Farias SF. As contribuições da internet para o idoso: uma revisão de literatu-ra. Interface Comun Saúde Educ 2009; 13:383-94.
39. Instituto Brasileiro de Geografia e Estatísti-ca. Síntese de indicadores sociais: uma análise das condições de vida da população brasileira 2016. Rio de Janeiro: Instituto Brasileiro de Geografia e Estatística; 2016.
40. Ghosheh N. Age discrimination and older workers: theory and legislation in comparative context. Geneva: International Labour Office; 2008.
41. Soares C, Saboia AL. Tempo, trabalho e afaze-res domésticos: um estudo com base nos dados da Pesquisa Nacional por Amostra de Domi-cílios de 2001 a 2005. Rio de Janeiro: Coor-denação de População e Indicadores Sociais, Instituto Brasileiro de Geografia e Estatística; 2007. (Texto para Discussão. Diretoria de Pes-quisas, 21).

Sousa NFS et al.12
Cad. Saúde Pública 2018; 34(J):e00173317
42. Alves JED, Corrêa S. Igualdade e desigualdade de gênero no Brasil: um panorama preliminar, 15 anos depois de Cairo. In: Brasil, 15 anos após a Conferência de Cairo. Campinas: As-sociação Brasileira de Estudos Populacionais/Fundo de População das Nações Unidas; 2009.
43. Camarano AA. O idoso brasileiro no mercado de trabalho. Rio de Janeiro: Instituto de Pes-quisa Econômica Aplicada; 2001. (Texto para Discussão, 830).
44. He W, Goodkind D, Kowal P. An aging world: 2015. U.S. Census Bureau. International Popu-lation Reports P95/16-1. Washington DC: U.S. Government Publishing Office; 2016.
45. Giullari S, Lewis J. The adult worker model fa-mily, gender equality and care: the search for new policy principles and the possibilities and problems of a capabilities approach. Geneva: United Nations Research Institute for Social Development; 2005. (Paper, 19).
46. Camarano AA, Pasinato MT. Envelhecimento e pobreza e proteção social na América Latina. Rio de Janeiro: Instituto de Pesquisa Econô-mica Aplicada; 2007. (Texto para Discussão, 1292).
47. Camarano AA, Kanso S, Fernandes D. Saída do mercado de trabalho: qual é a idade? In: Bole-tim Mercado de Trabalho: conjuntura e análise no 51. Brasília: Instituto de Pesquisa Econômi-ca Aplicada/Ministério do Trabalho e Empre-go; 2012. p. 19-28.
48. Wajnman S, Oliveira AM, Oliveira EL. Os ido-sos no mercado de trabalho: tendências e con-sequências. In: Camarano AA, organizadora. Os novos idosos brasileiros: muito além dos 60? Rio de Janeiro: Instituto de Pesquisa Eco-nômica Aplicada; 2004. p. 453-79.
49. Lima-Costa MF, Barreto SM. Tipos de estu-dos epidemiológicos: conceitos básicos e apli-cações na área do envelhecimento. Epidemiol Serv Saúde 2003; 12:189-201.
ACTIVE AGING: PREVALENCE AND GENDER AND AGE DIFFERENCES 13
Cad. Saúde Pública 2018; 34(J):e00173317
Resumo
O objetivo deste estudo foi analisar as prevalências e as diferenças de gênero e idade em indicadores de envelhecimento ativo entre idosos participan-tes do Inquérito de Saúde do Município de Campinas, São Paulo, Brasil, 2014-2015. Es-timaram-se as prevalências de participação dos idosos em doze atividades relativas a quatro di-mensões, e as razões de prevalência foram calcu-ladas pela regressão de Poisson. A população de estudo foi composta por 986 idosos. Os resultados revelaram que 40,2% dos idosos participavam de atividades socioculturais, 25,3% eram fisicamente ativos no lazer, 21,7% usavam a Internet, 22,1% exerciam trabalho remunerado e apenas 2,6% rea-lizavam cursos. Quanto à dimensão social, só hou-ve diferença entre os sexos na frequência aos cultos religiosos, sendo menos prevalente entre os homens (RP = 0,67). Na dimensão da atividade física, os homens eram mais ativos no trabalho (RP = 2,10), no deslocamento (RP = 1,61) e no lazer (RP = 1,44). Na dimensão intelectual, não houve diferença en-tre os sexos e, em relação ao trabalho remunera-do, os homens eram mais ativos (RP = 1,78). As análises segundo faixas etárias evidenciaram que, entre os homens, apenas a prática de atividade fí-sica no trabalho e o exercício de trabalho remune-rado apresentaram menor prevalência no grupo de 80 anos e mais. Entre as mulheres mais longevas, foram identificadas menores prevalências em seis atividades, o que sinaliza possível efeito diverso do avanço da idade entre os sexos. Os resultados reve-lam expressiva participação dos idosos em alguns dos indicadores do envelhecimento ativo e os desa-fios no que concerne às atividades pouco realiza-das e às diferenças de participação entre os sexos.
Envelhecimento; Disparidades nos Níveis de Saúde; Gênero e Saúde; Idoso
Resumen
El objetivo de este estudio fue analizar las tasas de prevalencia y las diferencias de género y edad en los indicadores de envejecimiento activo en adultos mayores que participan en la Encuesta de Sa-lud del Municipio de Campinas, estado de São Paulo, Brasil (2014-2015). Estimamos las tasas de prevalencia para la participación de los ancianos en doce actividades relacionadas con cuatro di-mensiones y calculamos las tasas de prevalencia con la regresión de Poisson. La población de estu-dio consistió en 986 ancianos. Los resultados mos-traron que el 40,2% de los adultos mayores par-ticipaban en actividades socioculturales, el 25,3% era físicamente activo en su tiempo libre, el 21,7% utilizaba Internet, el 22,1% realizaba trabajo re-munerado y solo el 2,6% asistía a cursos. En la di-mensión social, la única diferencia de género esta-ba en la práctica religiosa, que era menos frecuente en los hombres (RP = 0,67). En la dimensión de la actividad física, los hombres eran más activos en el trabajo (PR = 2,10), en los desplazamientos diarios (PR = 1,61) y en su tiempo libre (PR = 1,44). No hubo diferencia de género en la dimensión intelec-tual, y los hombres eran más activos en el trabajo remunerado, (PR = 1,78). Los análisis por grupos de edad mostraron que en los hombres, solo la acti-vidad física en el trabajo y el trabajo remunerado presentaron una prevalencia más baja en el grupo de 80 años y más. Entre las mujeres ancianas de mayor edad, se observaron tasas de prevalencia más bajas en seis actividades, lo que sugiere un po-sible efecto diferencial de la edad avanzada entre los sexos. Los resultados muestran tasas importan-tes de participación de personas mayores en algu-nos indicadores de envejecimiento activo, además de desafíos en actividades que se realizan con poca frecuencia y diferencias de género en la participa-ción.
Envejecimento; Disparidades en el Estado de Salud; Género y Salud; Anciano
Submitted on 03/Oct/2017Final version resubmitted on 08/Mar/2018Approved on 06/Apr/2018
ERRATUMERRATUM
Sousa NFS, Lima MG, Cesar CLG, Barros MBA. Active aging: prevalence and gender and age differences in a population-based study. Cad Saúde Pública 2018; 34(11):e00173317.
doi: 10.1590/0102-311XER173317
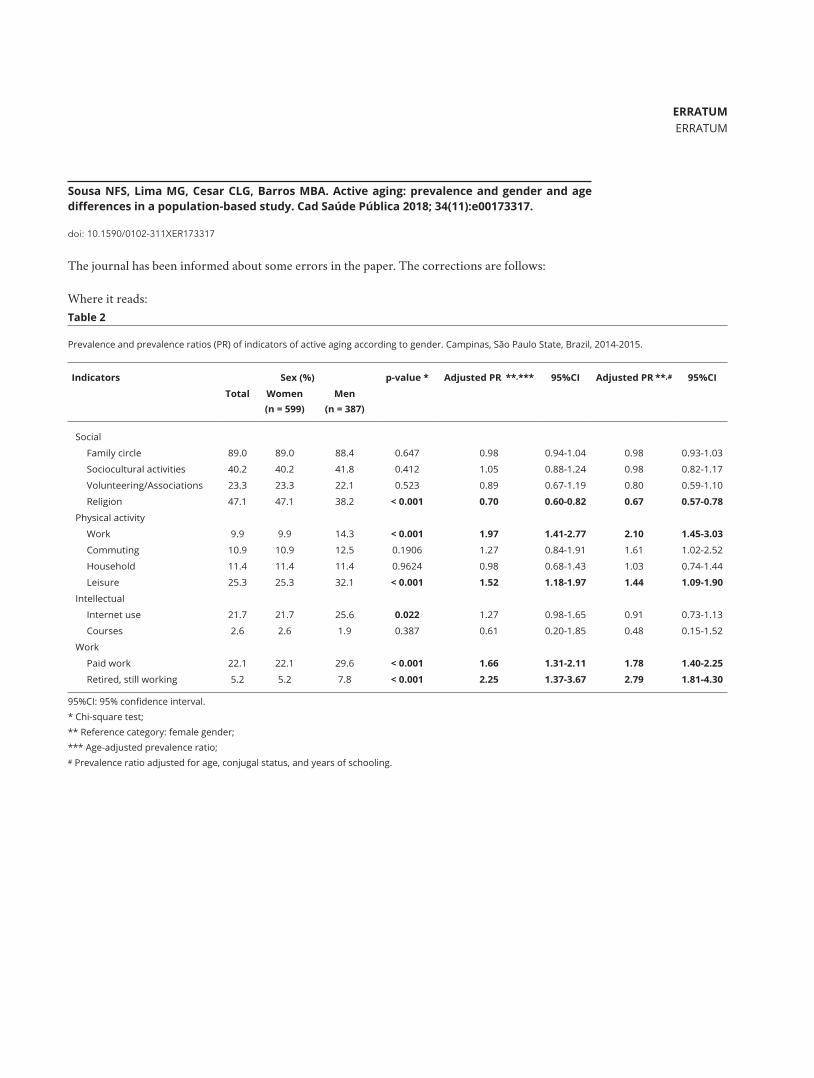
The journal has been informed about some errors in the paper. The corrections are follows:
Where it reads:
Table 2
Prevalence and prevalence ratios (PR) of indicators of active aging according to gender. Campinas, São Paulo State, Brazil, 2014-2015.
Indicators Sex (%) p-value * Adjusted PR **,*** 95%CI Adjusted PR **,# 95%CI
Total Women (n = 599)
Men (n = 387)
Social
Family circle 89.0 89.0 88.4 0.647 0.98 0.94-1.04 0.98 0.93-1.03
Sociocultural activities 40.2 40.2 41.8 0.412 1.05 0.88-1.24 0.98 0.82-1.17
Volunteering/Associations 23.3 23.3 22.1 0.523 0.89 0.67-1.19 0.80 0.59-1.10
Religion 47.1 47.1 38.2 < 0.001 0.70 0.60-0.82 0.67 0.57-0.78
Physical activity
Work 9.9 9.9 14.3 < 0.001 1.97 1.41-2.77 2.10 1.45-3.03
Commuting 10.9 10.9 12.5 0.1906 1.27 0.84-1.91 1.61 1.02-2.52
Household 11.4 11.4 11.4 0.9624 0.98 0.68-1.43 1.03 0.74-1.44
Leisure 25.3 25.3 32.1 < 0.001 1.52 1.18-1.97 1.44 1.09-1.90
Intellectual
Internet use 21.7 21.7 25.6 0.022 1.27 0.98-1.65 0.91 0.73-1.13
Courses 2.6 2.6 1.9 0.387 0.61 0.20-1.85 0.48 0.15-1.52
Work
Paid work 22.1 22.1 29.6 < 0.001 1.66 1.31-2.11 1.78 1.40-2.25
Retired, still working 5.2 5.2 7.8 < 0.001 2.25 1.37-3.67 2.79 1.81-4.30
95%CI: 95% confidence interval. * Chi-square test; ** Reference category: female gender; *** Age-adjusted prevalence ratio; # Prevalence ratio adjusted for age, conjugal status, and years of schooling.
Submitted on 20/Dec/2018Approved on 07/Jan/2019Published on Feb/2019
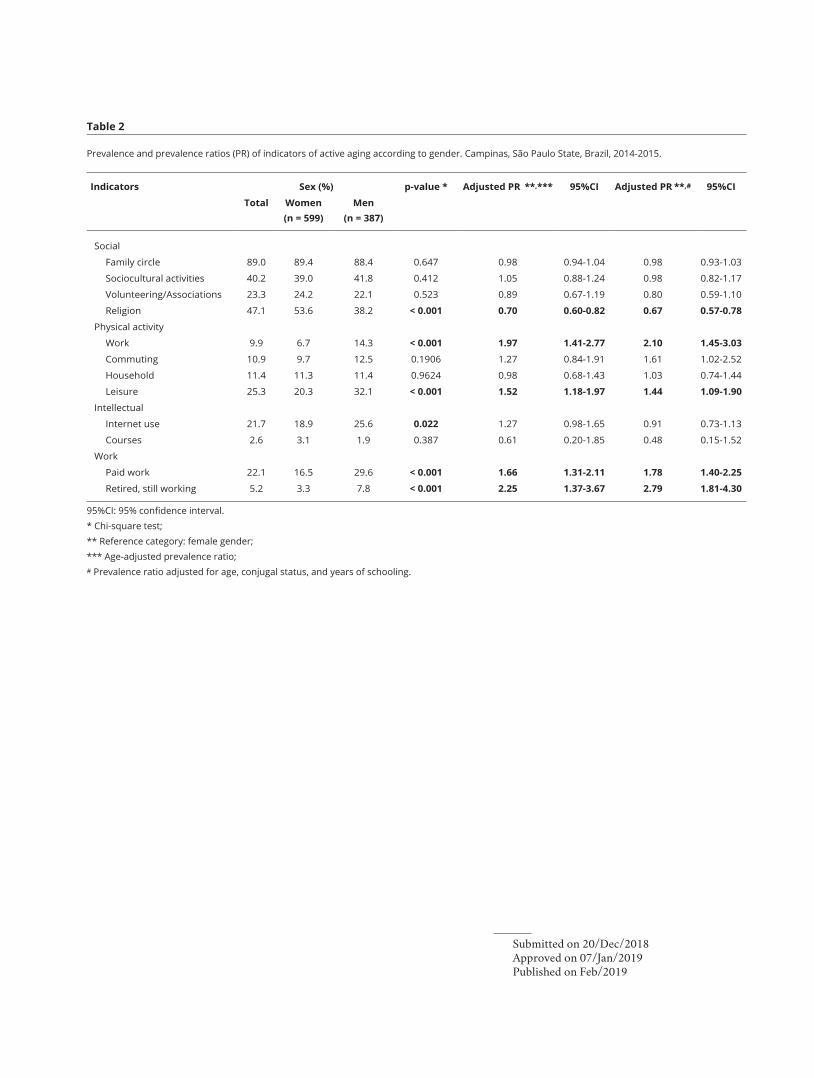
Table 2
Prevalence and prevalence ratios (PR) of indicators of active aging according to gender. Campinas, São Paulo State, Brazil, 2014-2015.
Indicators Sex (%) p-value * Adjusted PR **,*** 95%CI Adjusted PR **,# 95%CI
Total Women (n = 599)
Men (n = 387)
Social
Family circle 89.0 89.4 88.4 0.647 0.98 0.94-1.04 0.98 0.93-1.03
Sociocultural activities 40.2 39.0 41.8 0.412 1.05 0.88-1.24 0.98 0.82-1.17
Volunteering/Associations 23.3 24.2 22.1 0.523 0.89 0.67-1.19 0.80 0.59-1.10
Religion 47.1 53.6 38.2 < 0.001 0.70 0.60-0.82 0.67 0.57-0.78
Physical activity
Work 9.9 6.7 14.3 < 0.001 1.97 1.41-2.77 2.10 1.45-3.03
Commuting 10.9 9.7 12.5 0.1906 1.27 0.84-1.91 1.61 1.02-2.52
Household 11.4 11.3 11.4 0.9624 0.98 0.68-1.43 1.03 0.74-1.44
Leisure 25.3 20.3 32.1 < 0.001 1.52 1.18-1.97 1.44 1.09-1.90
Intellectual
Internet use 21.7 18.9 25.6 0.022 1.27 0.98-1.65 0.91 0.73-1.13
Courses 2.6 3.1 1.9 0.387 0.61 0.20-1.85 0.48 0.15-1.52
Work
Paid work 22.1 16.5 29.6 < 0.001 1.66 1.31-2.11 1.78 1.40-2.25
Retired, still working 5.2 3.3 7.8 < 0.001 2.25 1.37-3.67 2.79 1.81-4.30
95%CI: 95% confidence interval. * Chi-square test; ** Reference category: female gender; *** Age-adjusted prevalence ratio; # Prevalence ratio adjusted for age, conjugal status, and years of schooling.


![CALCIFICAÇÕES PULPARES - CARACTERÍSTICAS CLÍNICAS ...2017.1] Calcificações...relatively common in human dental pulps associated with the physiological process of natural aging](https://img.document.onl/doc/110x75/5e7cfd6a9ca9134748117b74/calcificaes-pulpares-caractersticas-clnicas-20171-calcificaes.jpg)