Embed Size (px)
Citation preview
8/4/2019 BALEEIRO & SERRA UFT
http://slidepdf.com/reader/full/baleeiro-serra-uft 1/17
MARCO ANTÔNIO BALEEIRO ALVES1
Phone: (0xx63) 3232-8230; (0xx63) 84371188; Fax: (0xx63) 3232-8004
E-mail: [email protected]
JUAN CARLOS VALDÉS SERRA1
Phone: (0xx63) 3232-8230; (0xx63) 81112649; Fax: (0xx63) 3232-8004
E-mail: [email protected]
Corresponding author:
Quadra 109 norte AV NS 15 ALCNO 14. Bloco 2, sala 22, Bairro: Plano Diretor Norte. CEP
77001-090. Palmas-TO. Brasil.1 Universidade Federal do Tocantins. Campus Universitário de Palmas. Master's degree in
Agroenergy.
ATT. MARCO ANTÔNIO BALEEIRO ALVES1
8/4/2019 BALEEIRO & SERRA UFT
http://slidepdf.com/reader/full/baleeiro-serra-uft 2/17
2
SUMMARY
In this paper a study was done on the ethanolysis monitoring of the Jatropha curcas oil by keeping
the oil/ethanol molar ratio stable at 1:12 and altering the concentration of the catalyst (KOH) from
0,5; to 1,0; 1,5 and 2,0% and at temperatures of 30, 50 and 70°C. A low cost methodology for the
determination of the conversion into ethyl esthers by oxidation of glycerol with periodic acid was
evaluated. The results were consistent with the literature, since higher concentrations of the alkali
resulted in lower yields, probably due to formation of saponification reactions in larger extent. A
linear and nonlinear regression study and an analysis of variance for statistical evaluation of the
method employed were performed. The best results were consistent with the literature, being 50° Cfor best temperature, 1% (w/v) KOH and reaction time of 60 minutes. Considering that each batch
was performed in a single step reaction only, the maximum conversion into ethyl esters (77.99%)
was considered satisfactory.
Keywords: biofuels; sources renewables; jatropha curcas.
8/4/2019 BALEEIRO & SERRA UFT
http://slidepdf.com/reader/full/baleeiro-serra-uft 3/17
3
PRODUCTION MONITORING OF ETHANOL BIODIESEL BY OXIDATION OF JATHROPA
OIL WITH PERIODIC ACID
1. INTRODUCTION
Among the renewable energy alternatives with biomass as feedstock, biodiesel has received
prominence mainly due to the direction given to policies of social-economic growth in Brazil. The
production and consumption of this biofuel has since long received government incentives in
several European countries like Germany, France and Italy. In Brazil, the decree No. 702 of
October 30, 2002, by the Ministry of Science and Technology encourages the development of
scientific and technological research related to biodiesel. The decree of 23 December 2003
instituted the Interministerial Executive Committee in charge of the implementation of actionsdirected towards the production and use of biodiesel as an alternative source of energy. And last,
Law No. 11,097 of January 13, 2005 was enacted providing for the introduction of biodiesel into
the Brazilian energy matrix. Resolution No. 42, November 24, 2004, deals with the insertion of this
new fuel into the Brazilian energy matrix (TECBIO 2008). As described by Knothe et al. (2006),
the main objective of the transesterification reaction is to reduce the high viscosity of crude
vegetable oils. However, many aspects need to be clarified mainly with the aim of improving the
biodiesel production process, reduce costs, increase efficiency and improve the quality.
To achieve these results, a closer study of all involved transesterification reaction parameters
with regard to the types of catalysts used and involved chemical mechanisms is required and the
quality control and production process monitoring need yet to be evaluated.
Since many years the use of chromatographic methods for the determination of glycerol,
mono-, di-and triglycerides in biodiesel, such as is the case of Planck and Lorbeer (1995), has been
common. However, studies using non-chromatographic methods are scarcer, the first having been
published by Bradford et al (1942) who used potentiometric titration. According to Mittelbach
(1996), two important non-chromatographic free glycerol determination methods in vegetable oils
and derivatives have been described in related literature. The first is the official AOCS, method. (Ch
14-56 (1989)). Thereby the glycerol content is determined through oxidation by periodic acid and
thiosulfate titration resulting in formic acid. This same method was also used by Falate et al (2007)
in a study to validate a new biodiesel quality control technique and found that in commercial
soybean oil and biodiesel samples, the percentage of total determined glycerol content was 11.4%
and 0.2% respectively. This method, however, has been scarcely studied for biodiesel samples,
8/4/2019 BALEEIRO & SERRA UFT
http://slidepdf.com/reader/full/baleeiro-serra-uft 4/17
4
since it loses in accuracy to the chromatographic methods. The second is a spectrophotometric
determination method based on enzymatic reactions, used commercially in the form of analysis kits,
specifically developed for biodiesel samples (Baila & HUEBER of 1991). A similar
spectrophotometric method with some modifications, also based on periodic acid oxidation of
glycerol, was described by Bondioli & Bella (2005).In the present study, we monitored the Jatropha curcas oil biodiesel production process
using potassium hydroxide as catalyst, changing the concentration of the alkali from 0.5, 1.0, 1.5 to
2.0% (w/v) and the reaction temperature from 30, 50 to 70 ° C. The Oil/ethanol molar ratio was
kept constant at 1:12, the system was kept under constant stirring, and a reaction time of 90 minutes
monitored, using only one reaction step for each batch.
MATERIALS AND METHODS
MATERIALS
Semi-degummed Jatropha curcas vegetable oil, kindly provided by Biotins Energia
S.A.(Paraíso, TO, Brasil), was used . Based on the chemical composition of the oil, an average
molecular weight of 896 g / mol. was assumed. The Jatropha curcas oil presented an iodine content
of 8.306 g/100 g, acidity index of 4.49 mgKOH / g, saponification index 182 mgKOH / g and a
peroxide content of 9.76 mEq of O2/kg. All used reactants were of analytical purity. The absolute
ethanol (99.8%) was purchased from Synth (Diadema, SP, Brazil), the sodium hydroxide (99.5%)
catalyst used was purchased from Vetec Quimica Fina (Rio de Janeiro, RJ, Brazil).
TRANSESTERIFICATION REACTION MONITORING.
In this study, the combined glycerol content was quantified using the iodimetric technique,
and thence the conversion to ethyl esters as a function of time, temperature and concentration of the
alkali was estimated. Each sample was previously saponified to release the glycerol, present in the
form of glyceride, and then the medium was acidified for its complete neutralization.
The glycerol, extracted in the aqueous phase, was then oxidized with excess of periodic acid
(H5IO6 or HIO4). The remaining periodic acid was titrated with a standard solution of sodium
thiosulfate. With this we can see from equation 1 that molecules that have vicinal hydroxyls, as is
8/4/2019 BALEEIRO & SERRA UFT
http://slidepdf.com/reader/full/baleeiro-serra-uft 5/17
5
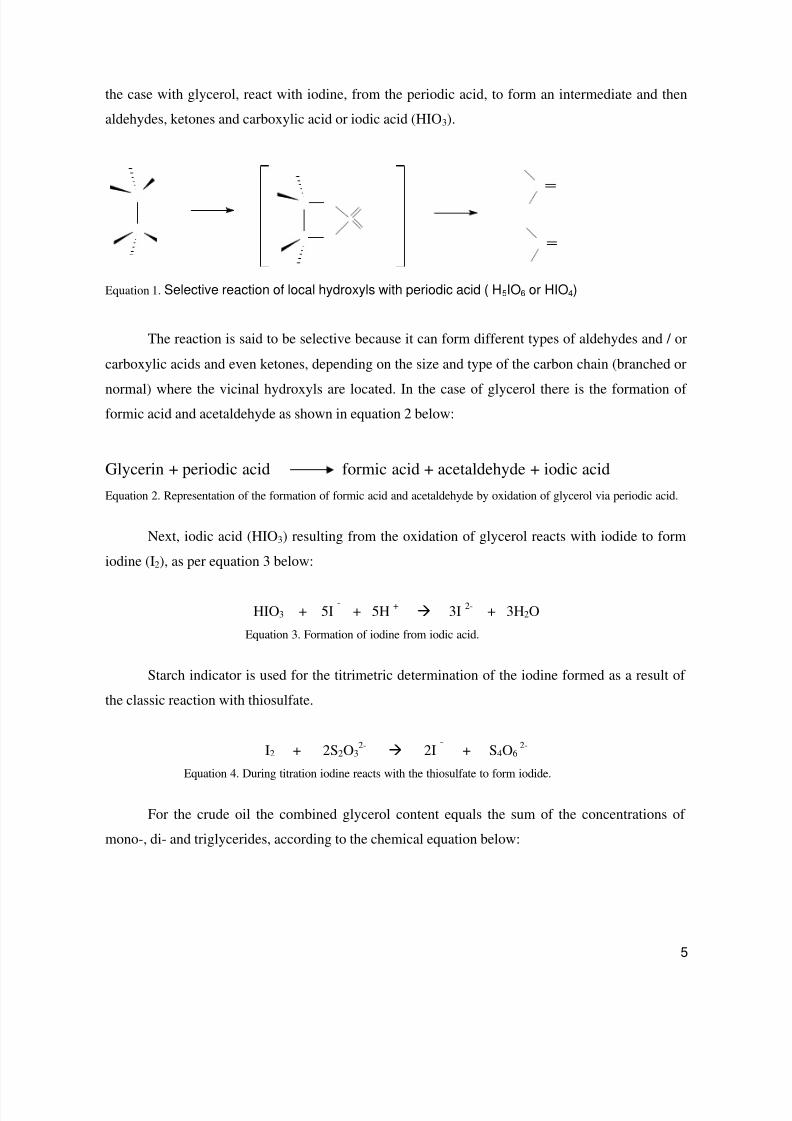
the case with glycerol, react with iodine, from the periodic acid, to form an intermediate and then
aldehydes, ketones and carboxylic acid or iodic acid (HIO3).
Equation 1. Selective reaction of local hydroxyls with periodic acid ( H5IO6 or HIO4)
The reaction is said to be selective because it can form different types of aldehydes and / or
carboxylic acids and even ketones, depending on the size and type of the carbon chain (branched or
normal) where the vicinal hydroxyls are located. In the case of glycerol there is the formation of formic acid and acetaldehyde as shown in equation 2 below:
Glycerin + periodic acid formic acid + acetaldehyde + iodic acid
Equation 2. Representation of the formation of formic acid and acetaldehyde by oxidation of glycerol via periodic acid.
Next, iodic acid (HIO3) resulting from the oxidation of glycerol reacts with iodide to form
iodine (I2), as per equation 3 below:
HIO3 + 5I ¯ + 5H + 3I 2- + 3H2O
Equation 3. Formation of iodine from iodic acid.
Starch indicator is used for the titrimetric determination of the iodine formed as a result of
the classic reaction with thiosulfate.
I2 + 2S2O32- 2I ¯ + S4O6
2-
Equation 4. During titration iodine reacts with the thiosulfate to form iodide.
For the crude oil the combined glycerol content equals the sum of the concentrations of
mono-, di- and triglycerides, according to the chemical equation below:
8/4/2019 BALEEIRO & SERRA UFT
http://slidepdf.com/reader/full/baleeiro-serra-uft 6/17
6
GC raw oil = MG + DG (5)
According to Knothe et al (2006) DG and MG concentrations are low and do not
significantly affect the concentration of esters formed during the course of the reaction. As to the
concentration of triglycerides, it is quite high during the first minutes and then decreasesconsiderably, thus:
GC biodiesel = MG + DG (decreases with time) (6)
As for the iodimetric method, despite it not having the required sensitivity to determine the
levels of triglycerides (TG), it is known that this decrease in the levels of MG, DG and TG as a
function of time results from the transformation of these into ethyl esters, thus while the
concentration of MG, DG and TG decreases, inversely the concentration of ethyl esters increasesproportionately. This being so it is possible to estimate the conversion of ethyl esters formed during
the course of the reaction using the following formula:
(GCraw oil - GC bio) x 10 = R’CO2R (%) (7)
Where the difference between the combined glycerol before and after the conversion
provides an estimated value for the biodiesel (ethyl esters) yield.
RESULTS AND DISCUSSIONS
The experimental data was obtained from monitoring the transesterification reaction, using
the AOCS method, Ca 14-56, for determination of the combined glycerol, quantified at the end of
each batch, after neutralization with hydrochloric acid. The conversion values (%) were calculated
using equation 3, where the values were converted and estimated for the content of ethyl esters.
Table 1 below shows the experimental results for three temperatures tested: 30, 50 and
70°C, varying the content of KOH catalyst from 0.5, 1.0, 1.5 to 2.0% (w/v) in a reaction time of 60
minutes. This reaction time is justified since it is considered usual for biodiesel plants, representing
a satisfactory period for the execution of a batch (Knothe et al., 2006).
8/4/2019 BALEEIRO & SERRA UFT
http://slidepdf.com/reader/full/baleeiro-serra-uft 7/17
7
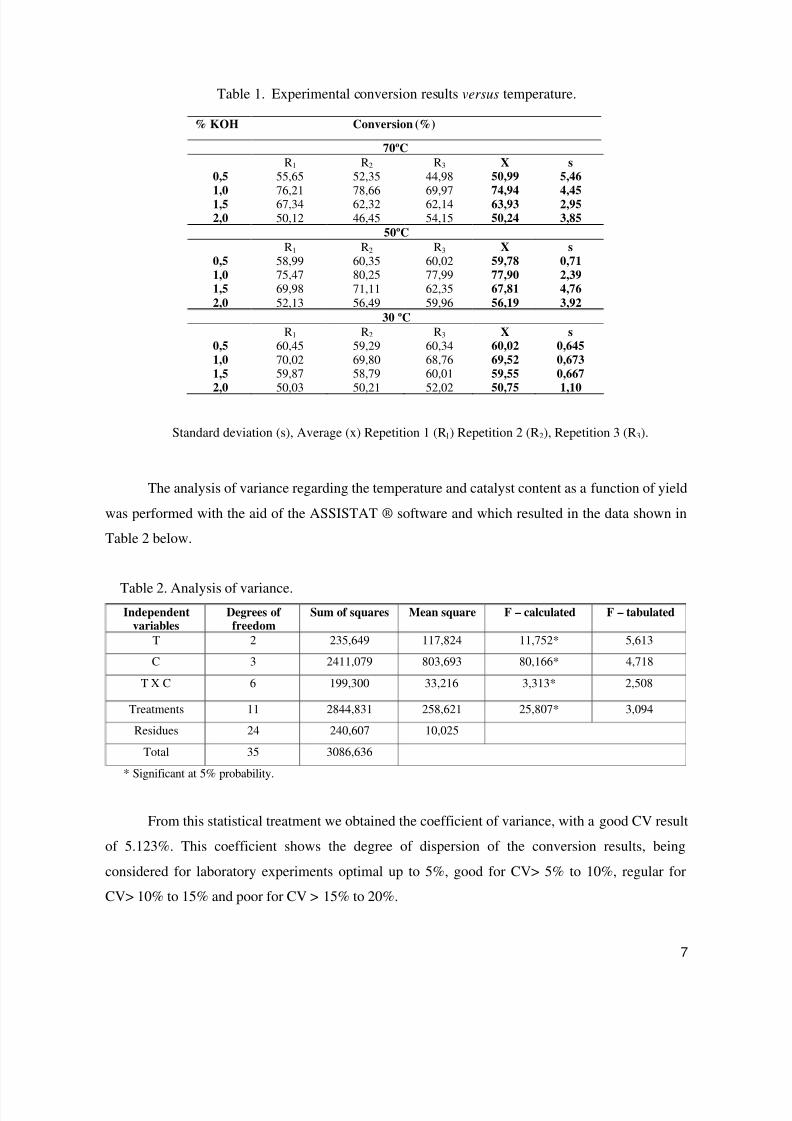
Table 1. Experimental conversion results versus temperature.
% KOH Conversion (%)
70ºC R1 R2 R3 X s
0,5 55,65 52,35 44,98 50,99 5,46
1,0 76,21 78,66 69,97 74,94 4,451,5 67,34 62,32 62,14 63,93 2,952,0 50,12 46,45 54,15 50,24 3,85
50ºC R1 R2 R3 X s
0,5 58,99 60,35 60,02 59,78 0,711,0 75,47 80,25 77,99 77,90 2,391,5 69,98 71,11 62,35 67,81 4,762,0 52,13 56,49 59,96 56,19 3,92
30 ºC R1 R2 R3 X s
0,5 60,45 59,29 60,34 60,02 0,6451,0 70,02 69,80 68,76 69,52 0,6731,5 59,87 58,79 60,01 59,55 0,667
2,0 50,03 50,21 52,02 50,75 1,10
Standard deviation (s), Average (x) Repetition 1 (R1) Repetition 2 (R2), Repetition 3 (R3).
The analysis of variance regarding the temperature and catalyst content as a function of yield
was performed with the aid of the ASSISTAT ® software and which resulted in the data shown in
Table 2 below.
Table 2. Analysis of variance.Independent
variablesDegrees of freedom
Sum of squares Mean square F – calculated F – tabulated
T 2 235,649 117,824 11,752* 5,613
C 3 2411,079 803,693 80,166* 4,718
T X C 6 199,300 33,216 3,313* 2,508
Treatments 11 2844,831 258,621 25,807* 3,094
Residues 24 240,607 10,025
Total 35 3086,636
* Significant at 5% probability.
From this statistical treatment we obtained the coefficient of variance, with a good CV result
of 5.123%. This coefficient shows the degree of dispersion of the conversion results, being
considered for laboratory experiments optimal up to 5%, good for CV> 5% to 10%, regular for
CV> 10% to 15% and poor for CV > 15% to 20%.
8/4/2019 BALEEIRO & SERRA UFT
http://slidepdf.com/reader/full/baleeiro-serra-uft 8/17
8
Comparing the differences between the averages it is possible to conclude that the
experimental results obtained meet the differences according to the test of Tukey at a level of
significance of 5%. From Table 2 we can see that the tabulated F is less than the calculated F for all
analyzed parameters, therefore it is possible to affirm that there exists a correlation between the
independent variables and the responses of the experiment. We can also see that the catalyst has ahigher calculated F-value and therefore a stronger influence on the experimental results when
compared to the temperature.
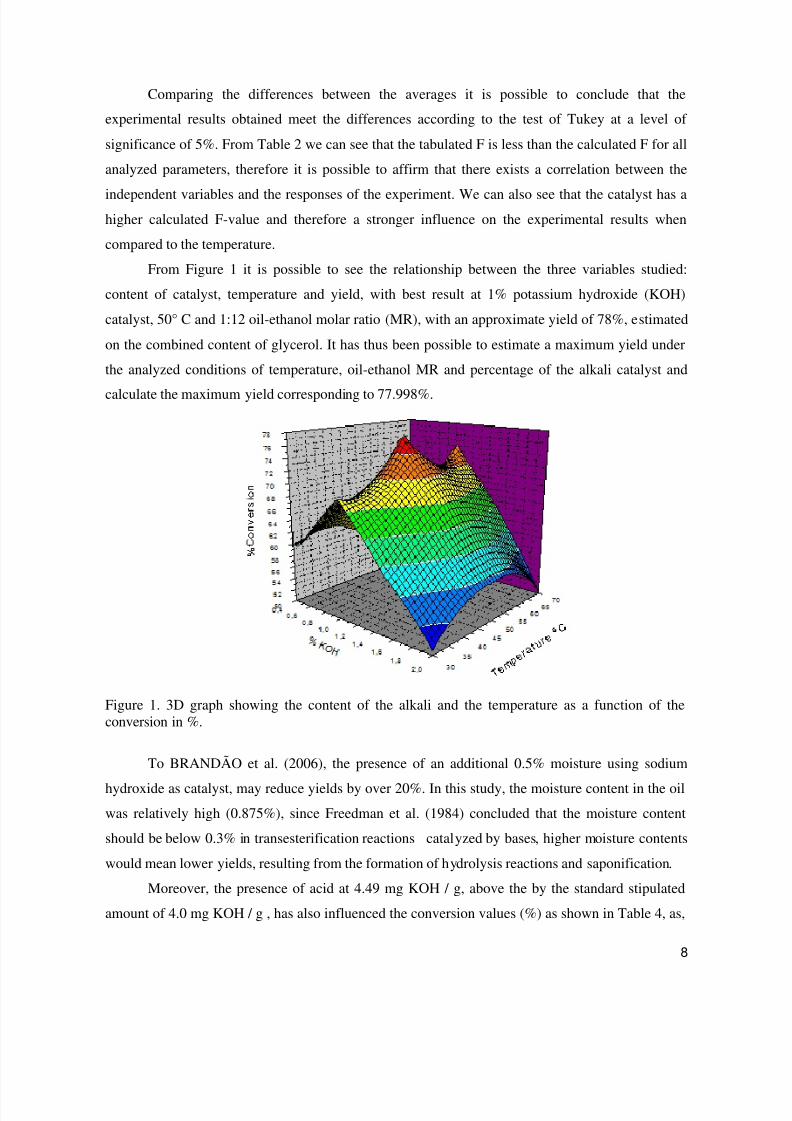
From Figure 1 it is possible to see the relationship between the three variables studied:
content of catalyst, temperature and yield, with best result at 1% potassium hydroxide (KOH)
catalyst, 50° C and 1:12 oil-ethanol molar ratio (MR), with an approximate yield of 78%, estimated
on the combined content of glycerol. It has thus been possible to estimate a maximum yield under
the analyzed conditions of temperature, oil-ethanol MR and percentage of the alkali catalyst and
calculate the maximum yield corresponding to 77.998%.
Figure 1. 3D graph showing the content of the alkali and the temperature as a function of theconversion in %.
To BRANDÃO et al. (2006), the presence of an additional 0.5% moisture using sodium
hydroxide as catalyst, may reduce yields by over 20%. In this study, the moisture content in the oilwas relatively high (0.875%), since Freedman et al. (1984) concluded that the moisture content
should be below 0.3% in transesterification reactions catalyzed by bases, higher moisture contents
would mean lower yields, resulting from the formation of hydrolysis reactions and saponification.
Moreover, the presence of acid at 4.49 mg KOH / g, above the by the standard stipulated
amount of 4.0 mg KOH / g , has also influenced the conversion values (%) as shown in Table 4, as,
8/4/2019 BALEEIRO & SERRA UFT
http://slidepdf.com/reader/full/baleeiro-serra-uft 9/17
9
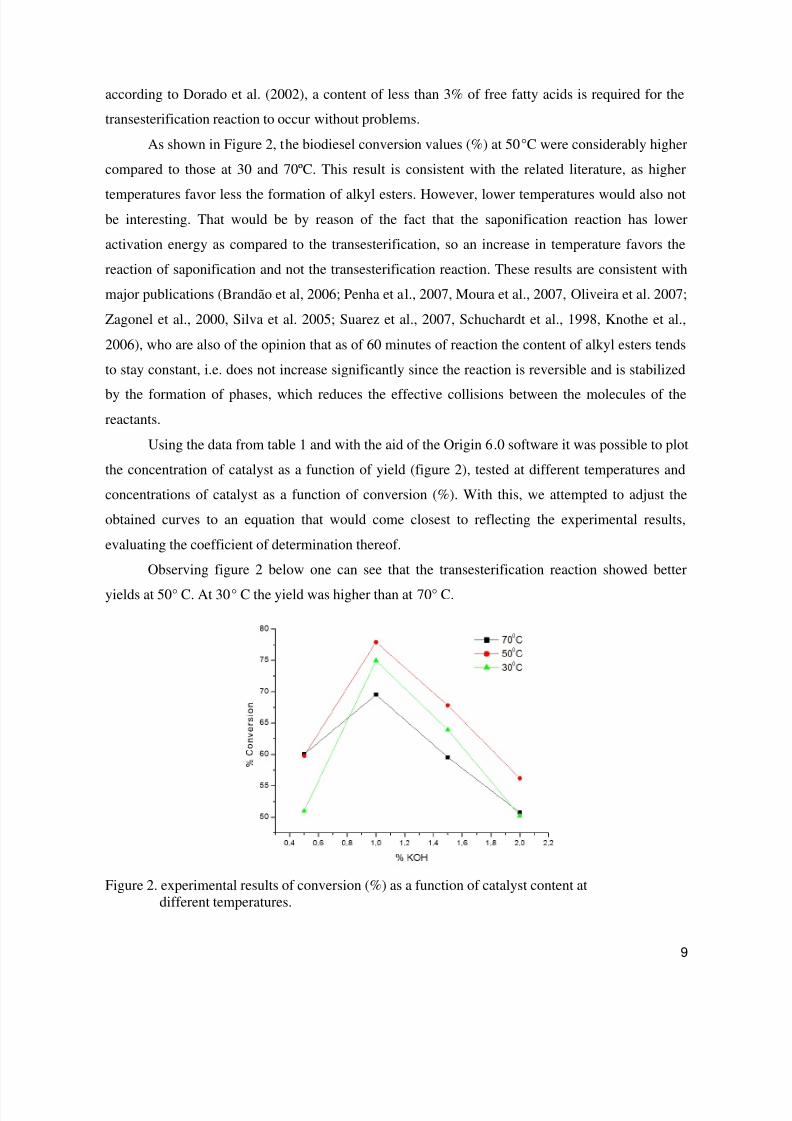
according to Dorado et al. (2002), a content of less than 3% of free fatty acids is required for the
transesterification reaction to occur without problems.
As shown in Figure 2, the biodiesel conversion values (%) at 50°C were considerably higher
compared to those at 30 and 70ºC. This result is consistent with the related literature, as higher
temperatures favor less the formation of alkyl esters. However, lower temperatures would also notbe interesting. That would be by reason of the fact that the saponification reaction has lower
activation energy as compared to the transesterification, so an increase in temperature favors the
reaction of saponification and not the transesterification reaction. These results are consistent with
major publications (Brandão et al, 2006; Penha et al., 2007, Moura et al., 2007, Oliveira et al. 2007;
Zagonel et al., 2000, Silva et al. 2005; Suarez et al., 2007, Schuchardt et al., 1998, Knothe et al.,
2006), who are also of the opinion that as of 60 minutes of reaction the content of alkyl esters tends
to stay constant, i.e. does not increase significantly since the reaction is reversible and is stabilized
by the formation of phases, which reduces the effective collisions between the molecules of thereactants.
Using the data from table 1 and with the aid of the Origin 6.0 software it was possible to plot
the concentration of catalyst as a function of yield (figure 2), tested at different temperatures and
concentrations of catalyst as a function of conversion (%). With this, we attempted to adjust the
obtained curves to an equation that would come closest to reflecting the experimental results,
evaluating the coefficient of determination thereof.
Observing figure 2 below one can see that the transesterification reaction showed better
yields at 50° C. At 30° C the yield was higher than at 70° C.
Figure 2. experimental results of conversion (%) as a function of catalyst content atdifferent temperatures.
8/4/2019 BALEEIRO & SERRA UFT
http://slidepdf.com/reader/full/baleeiro-serra-uft 10/17
10
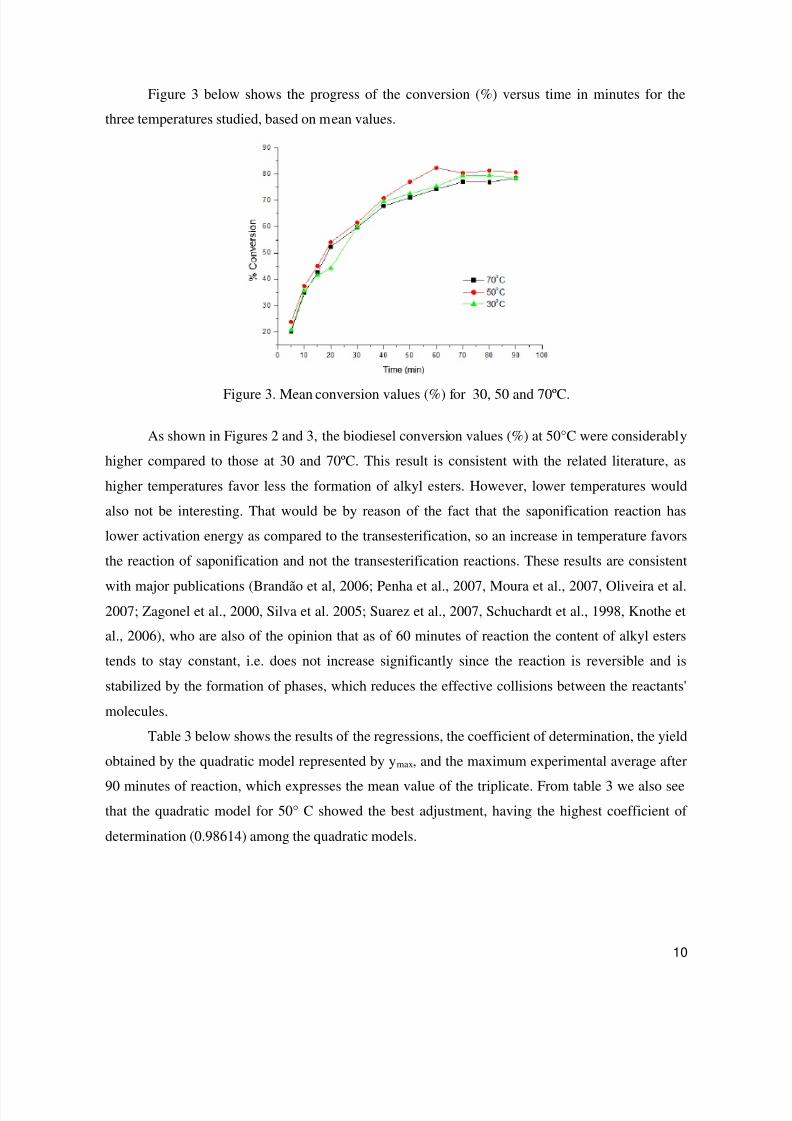
Figure 3 below shows the progress of the conversion (%) versus time in minutes for the
three temperatures studied, based on mean values.
Figure 3. Mean conversion values (%) for 30, 50 and 70ºC.
As shown in Figures 2 and 3, the biodiesel conversion values (%) at 50°C were considerably
higher compared to those at 30 and 70ºC. This result is consistent with the related literature, as
higher temperatures favor less the formation of alkyl esters. However, lower temperatures would
also not be interesting. That would be by reason of the fact that the saponification reaction has
lower activation energy as compared to the transesterification, so an increase in temperature favors
the reaction of saponification and not the transesterification reactions. These results are consistent
with major publications (Brandão et al, 2006; Penha et al., 2007, Moura et al., 2007, Oliveira et al.2007; Zagonel et al., 2000, Silva et al. 2005; Suarez et al., 2007, Schuchardt et al., 1998, Knothe et
al., 2006), who are also of the opinion that as of 60 minutes of reaction the content of alkyl esters
tends to stay constant, i.e. does not increase significantly since the reaction is reversible and is
stabilized by the formation of phases, which reduces the effective collisions between the reactants'
molecules.
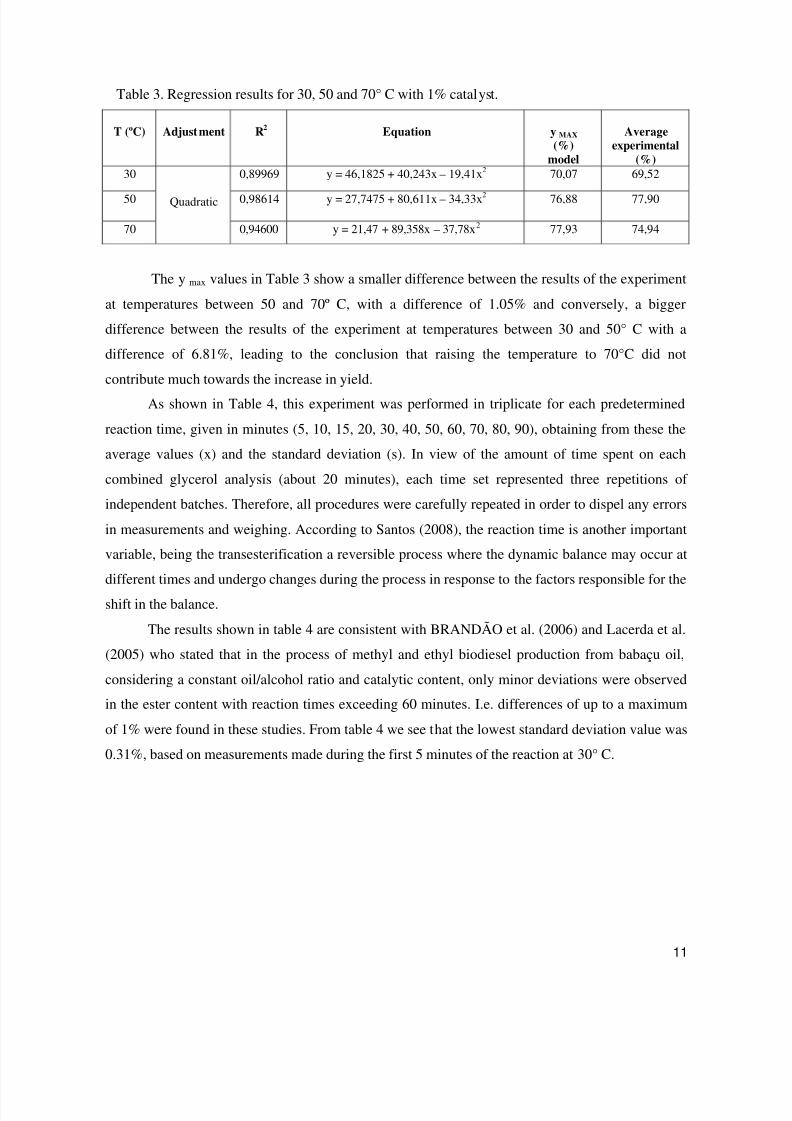
Table 3 below shows the results of the regressions, the coefficient of determination, the yield
obtained by the quadratic model represented by ymax, and the maximum experimental average after
90 minutes of reaction, which expresses the mean value of the triplicate. From table 3 we also seethat the quadratic model for 50° C showed the best adjustment, having the highest coefficient of
determination (0.98614) among the quadratic models.
8/4/2019 BALEEIRO & SERRA UFT
http://slidepdf.com/reader/full/baleeiro-serra-uft 11/17
11
Table 3. Regression results for 30, 50 and 70° C with 1% catalyst.
T (ºC) Adjustment R2 Equation y MAX
(%)model
Averageexperimental
(%)
30 0,89969 y = 46,1825 + 40,243x – 19,41x2 70,07 69,52
50 0,98614 y = 27,7475 + 80,611x – 34,33x2 76,88 77,90
70
Quadratic
0,94600 y = 21,47 + 89,358x – 37,78x2 77,93 74,94
The y max values in Table 3 show a smaller difference between the results of the experiment
at temperatures between 50 and 70º C, with a difference of 1.05% and conversely, a bigger
difference between the results of the experiment at temperatures between 30 and 50° C with a
difference of 6.81%, leading to the conclusion that raising the temperature to 70°C did not
contribute much towards the increase in yield.
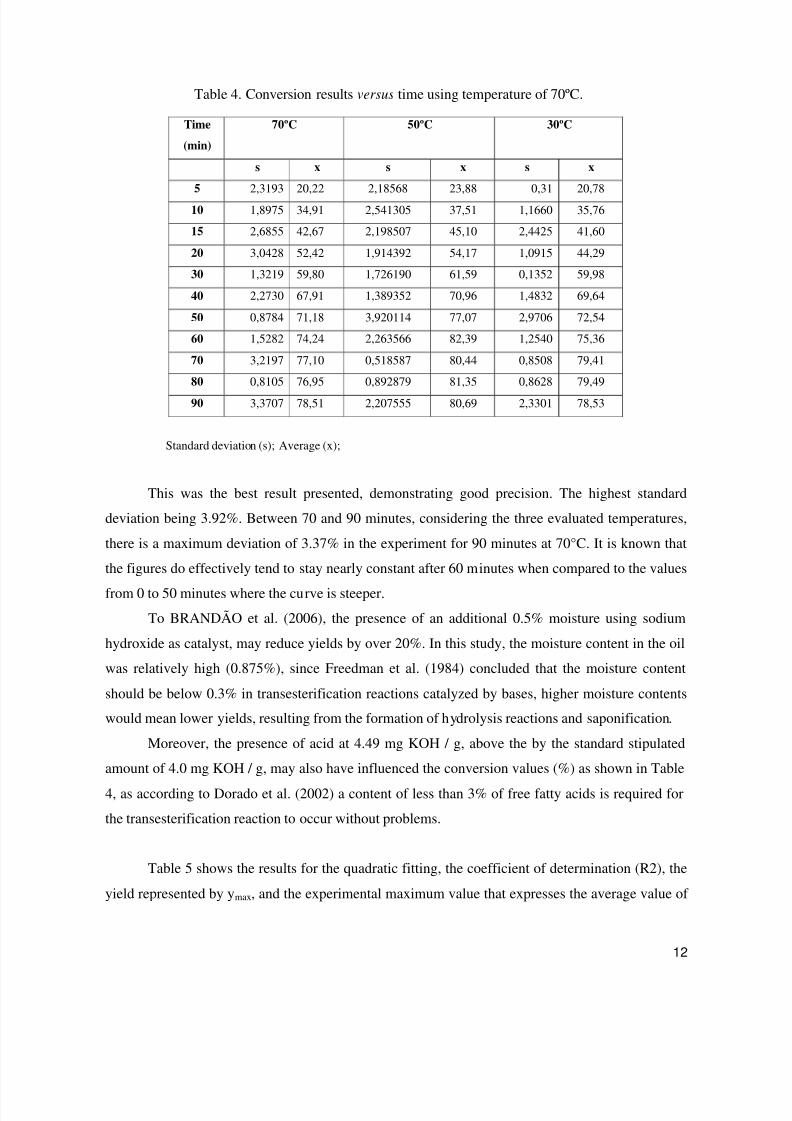
As shown in Table 4, this experiment was performed in triplicate for each predetermined
reaction time, given in minutes (5, 10, 15, 20, 30, 40, 50, 60, 70, 80, 90), obtaining from these the
average values (x) and the standard deviation (s). In view of the amount of time spent on each
combined glycerol analysis (about 20 minutes), each time set represented three repetitions of
independent batches. Therefore, all procedures were carefully repeated in order to dispel any errors
in measurements and weighing. According to Santos (2008), the reaction time is another important
variable, being the transesterification a reversible process where the dynamic balance may occur at
different times and undergo changes during the process in response to the factors responsible for the
shift in the balance.
The results shown in table 4 are consistent with BRANDÃO et al. (2006) and Lacerda et al.
(2005) who stated that in the process of methyl and ethyl biodiesel production from babaçu oil,
considering a constant oil/alcohol ratio and catalytic content, only minor deviations were observed
in the ester content with reaction times exceeding 60 minutes. I.e. differences of up to a maximum
of 1% were found in these studies. From table 4 we see that the lowest standard deviation value was
0.31%, based on measurements made during the first 5 minutes of the reaction at 30° C.
8/4/2019 BALEEIRO & SERRA UFT
http://slidepdf.com/reader/full/baleeiro-serra-uft 12/17
12
Table 4. Conversion results versus time using temperature of 70ºC.
Time
(min)
70ºC 50ºC 30ºC
s x s x s x
5 2,3193 20,22 2,18568 23,88 0,31 20,78
10 1,8975 34,91 2,541305 37,51 1,1660 35,76
15 2,6855 42,67 2,198507 45,10 2,4425 41,60
20 3,0428 52,42 1,914392 54,17 1,0915 44,29
30 1,3219 59,80 1,726190 61,59 0,1352 59,98
40 2,2730 67,91 1,389352 70,96 1,4832 69,64
50 0,8784 71,18 3,920114 77,07 2,9706 72,54
60 1,5282 74,24 2,263566 82,39 1,2540 75,36
70 3,2197 77,10 0,518587 80,44 0,8508 79,41
80 0,8105 76,95 0,892879 81,35 0,8628 79,49
90 3,3707 78,51 2,207555 80,69 2,3301 78,53
Standard deviation (s); Average (x);
This was the best result presented, demonstrating good precision. The highest standard
deviation being 3.92%. Between 70 and 90 minutes, considering the three evaluated temperatures,
there is a maximum deviation of 3.37% in the experiment for 90 minutes at 70°C. It is known that
the figures do effectively tend to stay nearly constant after 60 minutes when compared to the values
from 0 to 50 minutes where the curve is steeper.
To BRANDÃO et al. (2006), the presence of an additional 0.5% moisture using sodium
hydroxide as catalyst, may reduce yields by over 20%. In this study, the moisture content in the oil
was relatively high (0.875%), since Freedman et al. (1984) concluded that the moisture content
should be below 0.3% in transesterification reactions catalyzed by bases, higher moisture contents
would mean lower yields, resulting from the formation of hydrolysis reactions and saponification.
Moreover, the presence of acid at 4.49 mg KOH / g, above the by the standard stipulated
amount of 4.0 mg KOH / g, may also have influenced the conversion values (%) as shown in Table
4, as according to Dorado et al. (2002) a content of less than 3% of free fatty acids is required for
the transesterification reaction to occur without problems.
Table 5 shows the results for the quadratic fitting, the coefficient of determination (R2), the
yield represented by ymax, and the experimental maximum value that expresses the average value of
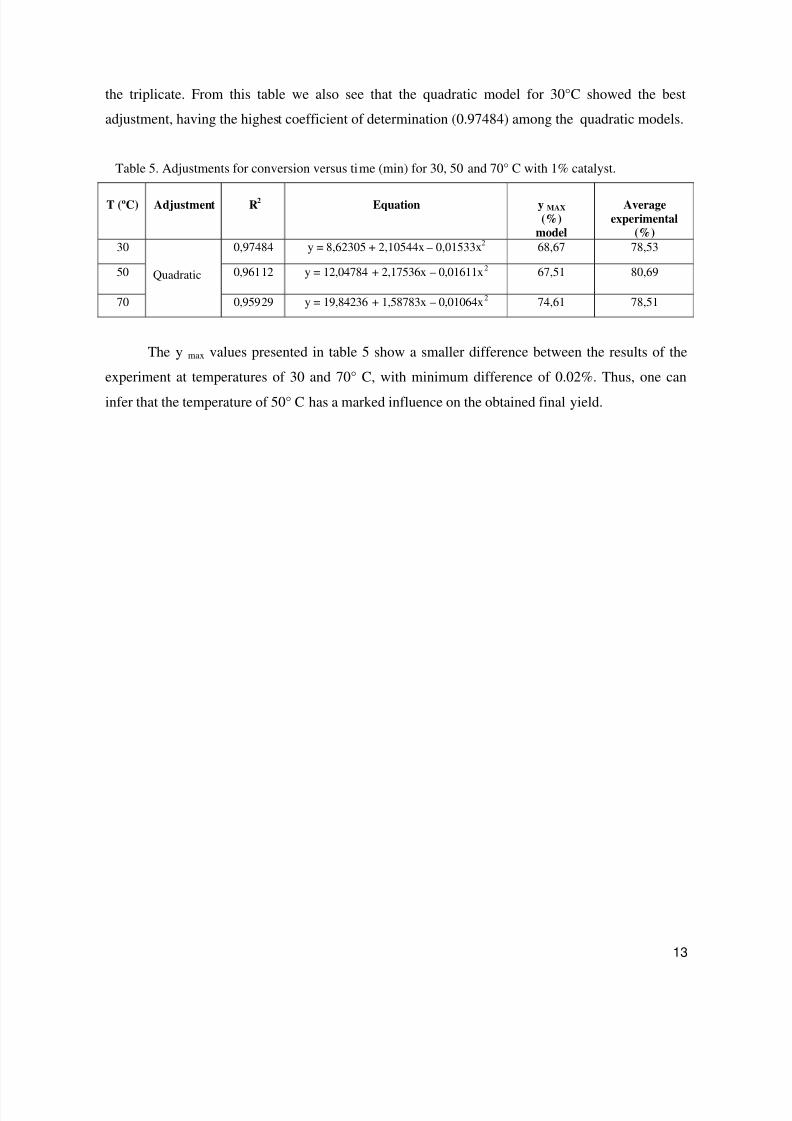
8/4/2019 BALEEIRO & SERRA UFT
http://slidepdf.com/reader/full/baleeiro-serra-uft 13/17
13
the triplicate. From this table we also see that the quadratic model for 30°C showed the best
adjustment, having the highest coefficient of determination (0.97484) among the quadratic models.
Table 5. Adjustments for conversion versus time (min) for 30, 50 and 70° C with 1% catalyst.
T (ºC) Adjustment R2 Equation y MAX
(%)model
Averageexperimental
(%)
30 0,97484 y = 8,62305 + 2,10544x – 0,01533x2 68,67 78,53
50 0,96112 y = 12,04784 + 2,17536x – 0,01611x2 67,51 80,69
70
Quadratic
0,95929 y = 19,84236 + 1,58783x – 0,01064x2 74,61 78,51
The y max values presented in table 5 show a smaller difference between the results of the
experiment at temperatures of 30 and 70° C, with minimum difference of 0.02%. Thus, one can
infer that the temperature of 50° C has a marked influence on the obtained final yield.
8/4/2019 BALEEIRO & SERRA UFT
http://slidepdf.com/reader/full/baleeiro-serra-uft 14/17
14
CONCLUSIONS
The quality assessment of jatropha oil for use in the transesterification reaction showed
satisfactory results, despite presenting an acidity index slightly higher than the established limit. As
stated earlier, it is observed in the literature that all the physical-chemical characteristics are quietvariable and depend on many factors such as crop management, soil and climatic conditions,
altitude, rainfall and others that may substantially alter the chemical composition of the Jatropha
curcas oil.
The present study has shown the viability of the combined glycerol determination
methodology through periodic acid oxidation to evaluate the conversion of triglycerides into alkyl
esters. Being a low cost and easy to perform method, it could, in the near future, be adapted for
biodiesel quality assessment at gas stations in the form of test kits.
The statistical analysis showed that both factors: catalyst and temperature had a markedeffect on the conversion (%) into ethyl esters. Therefore, the best biodiesel production results
obtained with the studied process using potassium hydroxide as catalyst, were: at 50° C, 1% KOH,
with molar oil:ethanol ratio of 1:12 and reaction time of 60 minutes, under which the experimental
maximum yield obtained was 77.9033%.
The non-linear regression equations were important to better understand the behavior of the
transesterification reaction and the definition of mathematical models closer to actual behavior.
With them it is possible to determine the estimated yield, controlling the physical and chemical
parameters of the studied process.
However, it should be noted that the good results shown in Tables 3 and 5 are not
necessarily linked to the good yields achieved at the respective temperatures, but to the adjustment
of the points of the mathematical model with the experimental data obtained. However, the method
used has shown to be adequate for the evaluation of the temperature and catalyst content factors as a
function of yield, since it presents a satisfactory experimental outline of the ethyl biodiesel
production process from Jatropha and proved to be viable for future applications where lower
chemical analysis operating costs would be required.
8/4/2019 BALEEIRO & SERRA UFT
http://slidepdf.com/reader/full/baleeiro-serra-uft 15/17
15
AKNOWLEDGEMENTS
The authors thank the Brazilian Government which through the Ministry of Science and
Technology - MCT has given support to projects related to the subject of bioenergy at the Federal
University of Tocantins.
DEFINITIONS
AO molar ratio oil / ethanol mol / mol
C catalyst content w/v
CV% coefficient of variance
DG diglyceride
R’CO2R (%) content of ethyl esters (biodiesel)F statistical factor (F test)
G glycerol
GC bio biodiesel combined glycerol
GC raw oil raw oil combined glycerol
MG monoglyceride
ROH alcohol
R2 coefficient of determination
TG Triglycerides
T temperature
8/4/2019 BALEEIRO & SERRA UFT
http://slidepdf.com/reader/full/baleeiro-serra-uft 16/17
16
BIBLIOGRAPHY
BAILER, J.; HUEBER, K. Determination of saponifiable glycerol in biodiesel. Fraenius J.Anal. Chem., v. 340, n. 186. (1991).
BONDIOLI, P. & BELLA, L. D. An alternative spectrophotometric method for thedetermination of free glycerol in biodiesel. Eur. J. Sc. Technol., v. 107, p. 153-157, 2005.
BRADFORD, P.; POHLE, W. D.; GUNTHER, J. K.; MEHLENBACHER, V. C. Determination of glycerol by oxidation with periodic acid. J. A. Oil Chem. Society V. 19, n. 11. (1942).
BRANDÃO, K. S. R.; SILVA, F.; LOUZEIRO, H. C.; SOUZA, A. G.; CONCEIÇÃO, M. M.;MOURA, K. R. M. Otimização do Processo de Produção de Biodiesel Metílico e Etílico deBabaçu. I Congresso da Rede Brasileira de Tecnologia de Biodiesel. Artigos técnico-científicos.2006.
DORADO, M. P. et al., Optimization of Alkali-Catalyzed Transesterification of Brassica
Carinata Oil for Biodiesel Production, Energy & Fuels , 18, 77-83, 2004.
FALATE, R.; NIKE, K.; NETO. P. R. C. Alternative technique for biodiesel quality controlusing an optical fiber long-period grating sensor. Quim. Nova, v. 30, n. 7, 1677-1680, (2007).
FREEDMAN, B., PRYDE, E. H., MOUNTS, T. L., Variables affecting the yields of fatty estersfrom transesterification vegetable oils, Journal of American Oil Chemist Society, v. 61, n.10, p.1638-1643, 1984.
KNOTHE, G.; GERPEN, J. V., KRHAL, J.; RAMOS, L. P. Manual de biodiesel. 1. ed. SãoPaulo: Edgard Blucher, 2006. 340 p.
LACERDA, F. B.; SILVA, F. C.; MELO, C. K.; BRANDÃO, K. S. R.; CARDIAS,H. T. C. Otimização das condições reacionais do processo de produção debiodiesel etílico a partir do óleo de babaçu (Orbignya martiana). EncontroNacional dos estudantes de Química, São Luís, 2005.
MITTELBACH, M.; Diesel fuel derived from vegetable oils,VI: Specifications and qualitycontrol of biodiesel. Bioresour. Technol. v. 56, n. 7. 1996.
MOURA, K. R. M.; BRANDÃO, K. S. R.; MACIEL, A. P.; SILVA, F. C.; SOUZA, A. G.Otimização da produção de biodiesel metílico de sebo bovino usando a metodologia desuperfície de resposta. II Congresso da Rede Brasileira de Tecnologia de Biodiesel. Artigos
técnico-científicos, 2007.OLIVEIRA, K.; MOTA, P. S., CORRÊA, N. C., FRANÇA. L., MACHADO, N. Estudo cinético
da reação de transesterificação do óleo de palma neutralizado. II Congresso da Rede Brasileirade Tecnologia de Biodiesel. Artigos técnico-científicos. 2007.
PENHA, M. C. S.; SILVA, M. D. P. et al. Caracterização físico química da semente e óleo de
Pinhão Manso ( Jatropha curcas) cultivado no MaranhãoII Congresso da Rede Brasileira de Tecnologia de Biodiesel. Artigos técnicos e científicos. 2007.
8/4/2019 BALEEIRO & SERRA UFT
http://slidepdf.com/reader/full/baleeiro-serra-uft 17/17
17
PLANCK, C. & LORBEER E. Simultaneous determination of glycerol, and mono-, di-
and triglycerides in vegetable oil methyl esters by capillary gas chromatography, Journal of Chromatography, v. 697, p. 461-468, 1995.
SCHUCHARDT, U.; SERCHELI, R.; VARGAS R. M. Transesterification of vegetable oils: a
review. Journal Brazilian Chemical Society , São Paulo v. 9, n.1 199 - 210, 1998.
SILVA, C. L. M. Obtenção de ésteres etílicos a partir da transesterificação do óleo de andirobacom etanol. Dissertação de Mestrado. Unicamp. Mestrado em Química: área de QuímicaInorgânica. 78 p. 2005.
TECBIO. Biodiesel: uma aventura tecnológica em um país engraçado. Elaborado por ExpeditoJosé de Sá Parente. Disponível em: <http://www.tecbio.com.br/artigos/Livro-Biodiesel.pdf>.Acesso em: 12 jan. 2007.
ZAGONEL, G. F. Obtenção e caracterização de biocombustíveis a partir da transesterificaçãoetílica em meio alcalino. Dissertação (Mestrado em Química Orgânica), Universidade Federal do
Paraná. Curitiba, 2000.