Embed Size (px)
Citation preview

8/2/2019 BHP vs. Rio Tinto
http://slidepdf.com/reader/full/bhp-vs-rio-tinto 1/54
3/18/12
BHP BillitonFinancial Analysis as of March 14th 2012
8/2/2019 BHP vs. Rio Tinto
http://slidepdf.com/reader/full/bhp-vs-rio-tinto 2/54
3/18/12
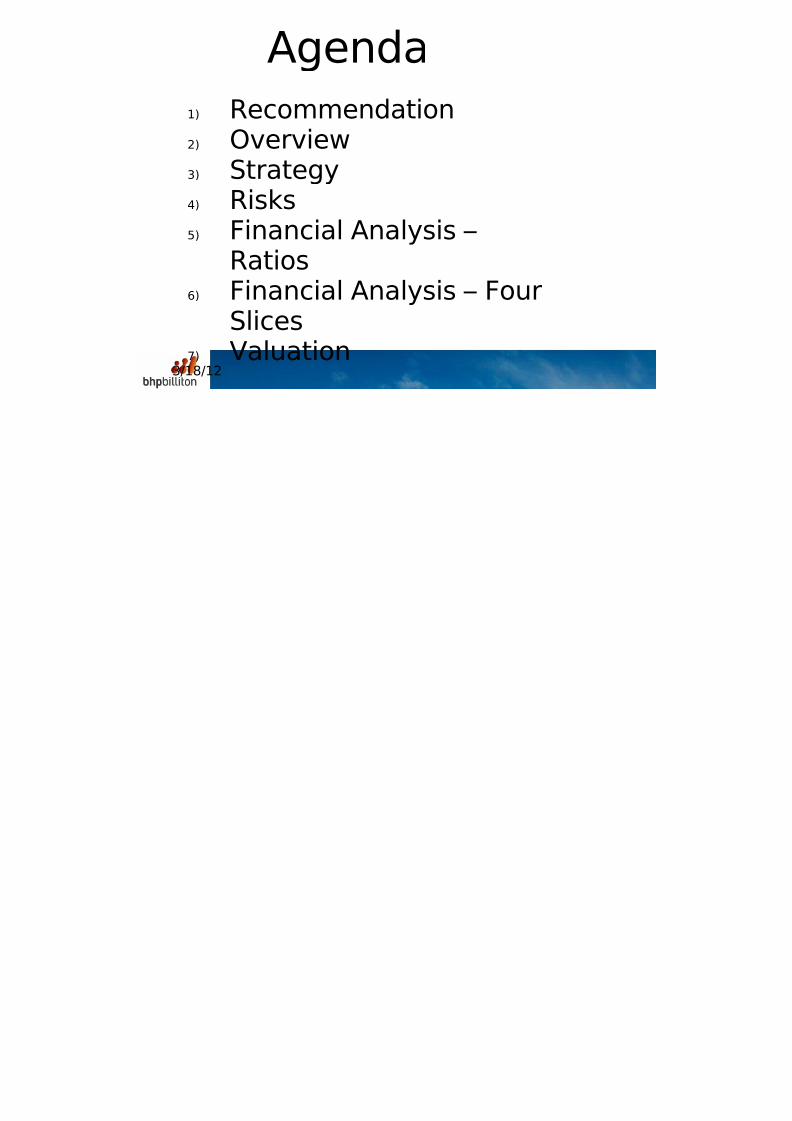
Agenda
1) Recommendation2) Overview3)
Strategy4) Risks5) Financial Analysis –
Ratios6) Financial Analysis – Four
Slices7)
Valuation

8/2/2019 BHP vs. Rio Tinto
http://slidepdf.com/reader/full/bhp-vs-rio-tinto 3/54
3/18/12
Recommendation• Buy!
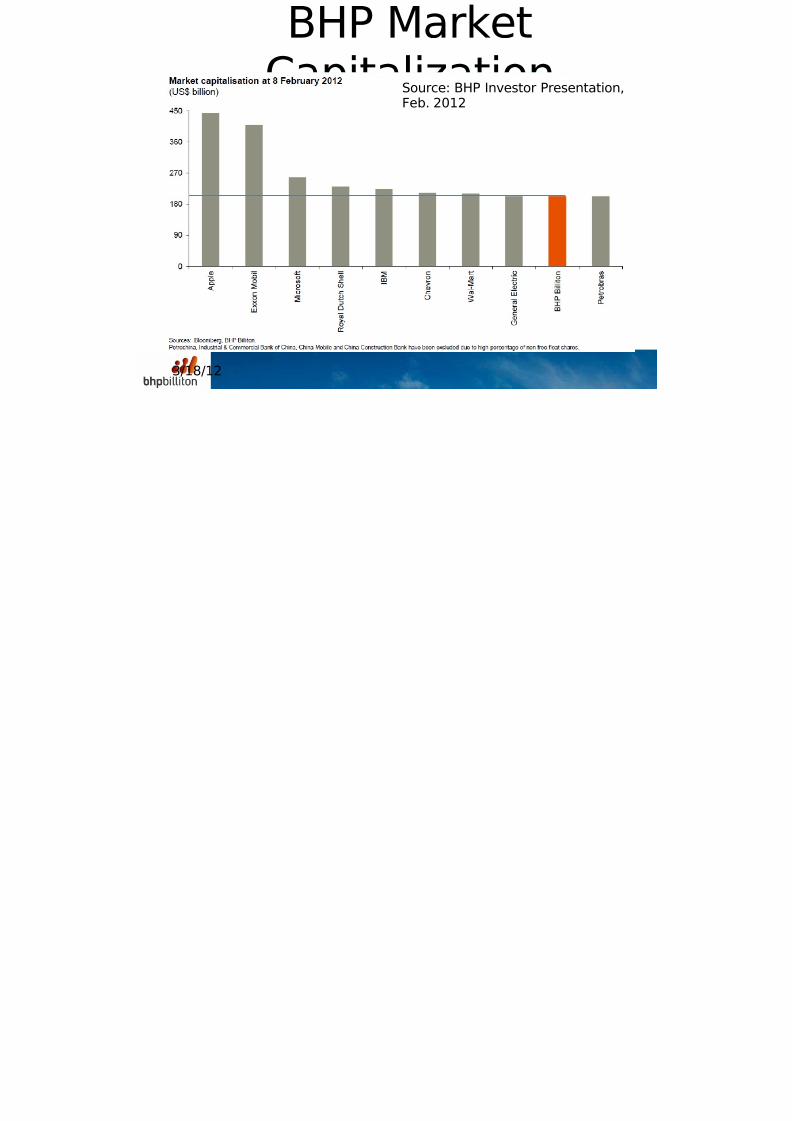
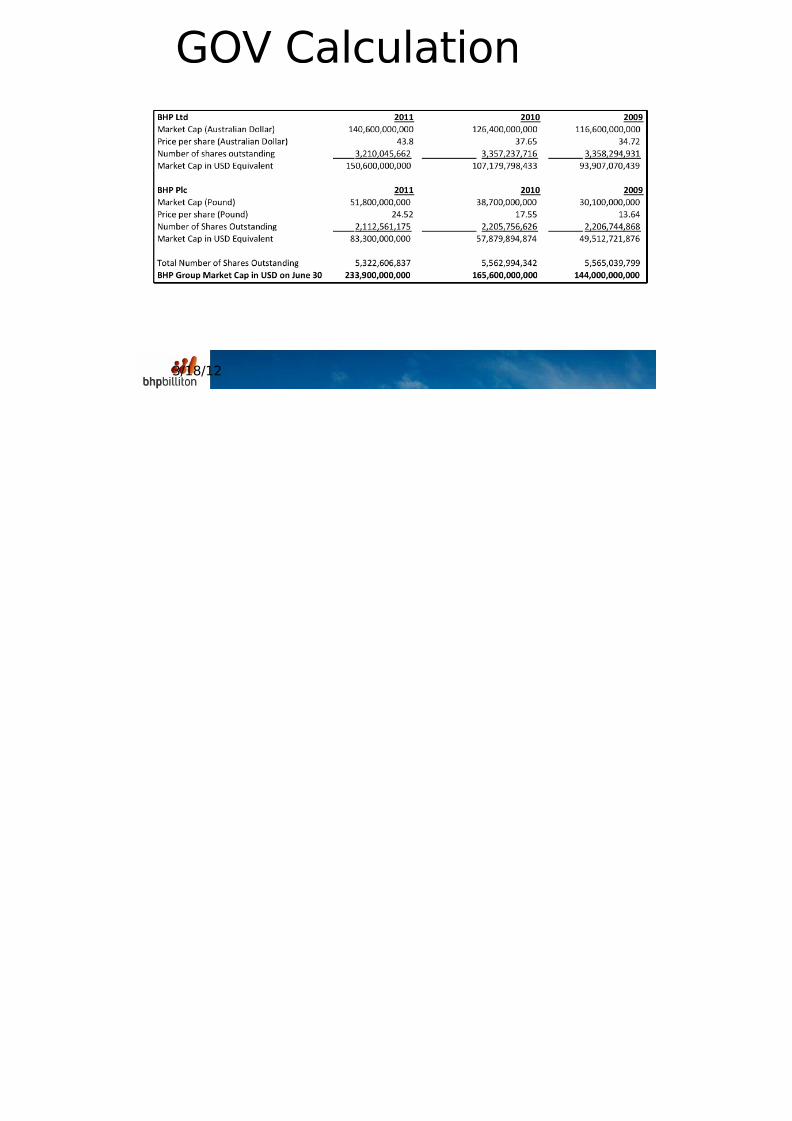
• 2011 Group Market Cap: US $234B
•
Group Segment DCF Valuation: US$236B
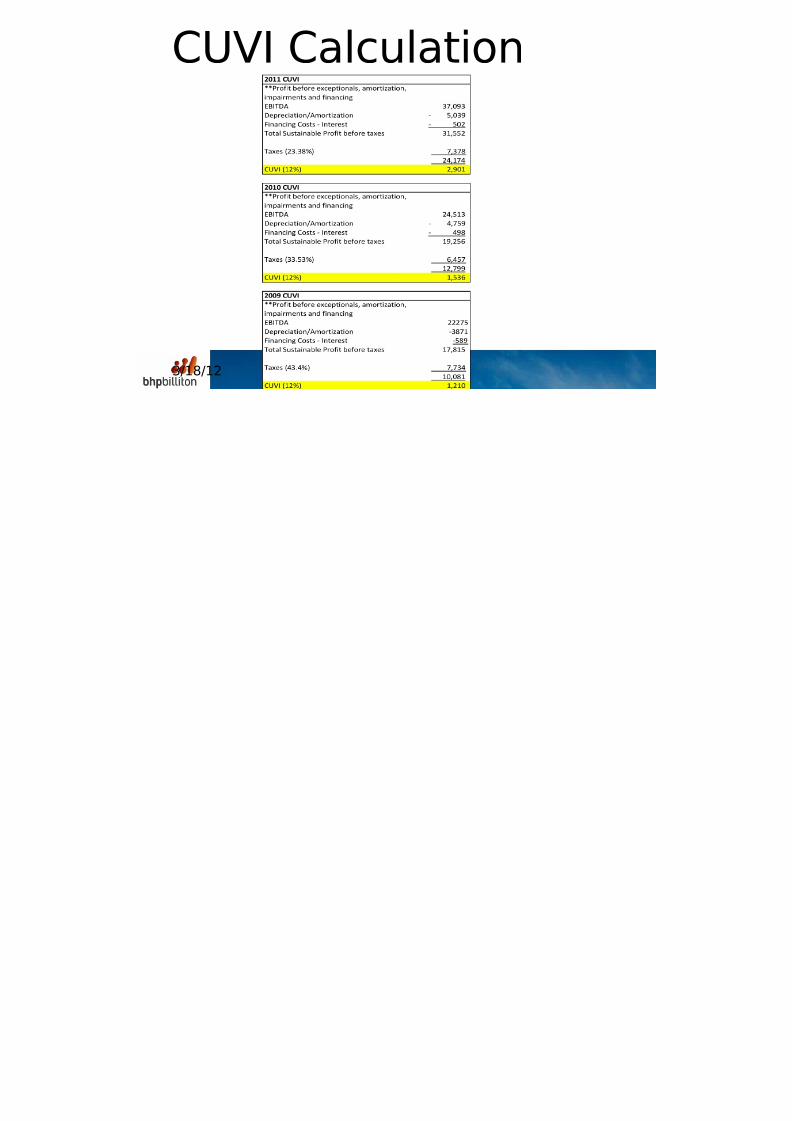
• CUVI: US $2.9B
• GOV: US $174B
8/2/2019 BHP vs. Rio Tinto
http://slidepdf.com/reader/full/bhp-vs-rio-tinto 4/54
3/18/12
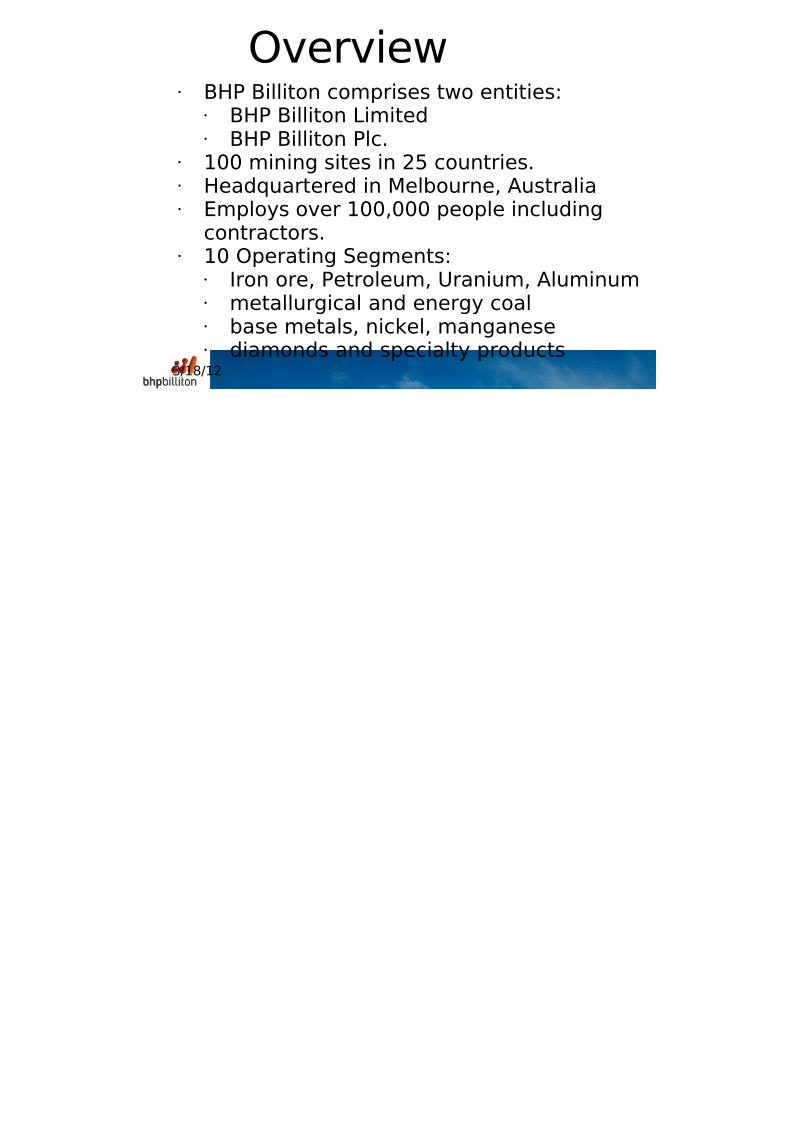
Overview•
BHP Billiton comprises two entities:• BHP Billiton Limited• BHP Billiton Plc.
• 100 mining sites in 25 countries.• Headquartered in Melbourne, Australia• Employs over 100,000 people including
contractors.• 10 Operating Segments:
• Iron ore, Petroleum, Uranium, Aluminum• metallurgical and energy coal• base metals, nickel, manganese• diamonds and specialty products

8/2/2019 BHP vs. Rio Tinto
http://slidepdf.com/reader/full/bhp-vs-rio-tinto 5/54
Click to edit Master subtitle style
3/18/12
BHP Billiton Overview

8/2/2019 BHP vs. Rio Tinto
http://slidepdf.com/reader/full/bhp-vs-rio-tinto 6/54
3/18/12
Key Dates• 2001 Australian Broken Hill Proprietary (BHP) merges with
the UK’s Billiton. Billiton CEO becomes Group CEO, butresigns 6 months later
• 2003 The company begins a $5 billion investment in oilextraction
• 2005 R&D Alliance with Chinese Academy of Science (CAS)
• 2008 BHP Billiton attempts to buy Rio Tinto. Board Rejects
• 2009 BHP and Rio Tinto form 50:50 Joint Venture in Australia(Iron Ore)
• 2011 Acquisition of Chesapeake Energy Corporation’s USA
8/2/2019 BHP vs. Rio Tinto
http://slidepdf.com/reader/full/bhp-vs-rio-tinto 7/54
3/18/12
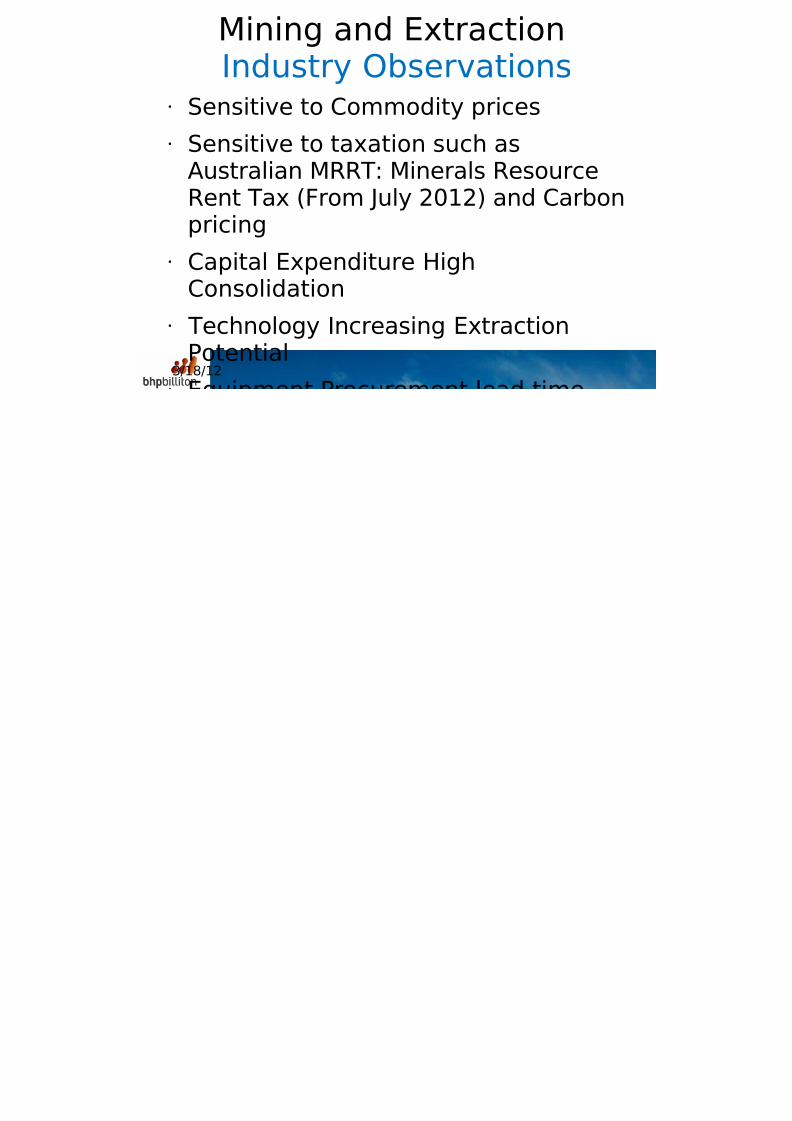
Mining and ExtractionIndustry Observations
• Sensitive to Commodity prices
• Sensitive to taxation such as
Australian MRRT: Minerals ResourceRent Tax (From July 2012) and Carbonpricing
•
Capital Expenditure HighConsolidation
• Technology Increasing Extraction
Potential
8/2/2019 BHP vs. Rio Tinto
http://slidepdf.com/reader/full/bhp-vs-rio-tinto 8/54
Click to edit Master subtitle style
3/18/12
Strategy

8/2/2019 BHP vs. Rio Tinto
http://slidepdf.com/reader/full/bhp-vs-rio-tinto 9/54
3/18/12
People• Group CEO Marius Kloppers
• Employees: 100,000 Including
Contractors• 2010: Net Profit per employee:
$130,000
8/2/2019 BHP vs. Rio Tinto
http://slidepdf.com/reader/full/bhp-vs-rio-tinto 10/54
3/18/12
Elements of BHP’s Strategy
• Unprecedented Demand growth dueto Industrialization and Urbanizationof Developing World
• Geographic and IndustryDiversification
•
Largest source of Profits from IronOre and Petroleum

8/2/2019 BHP vs. Rio Tinto
http://slidepdf.com/reader/full/bhp-vs-rio-tinto 11/54
3/18/12
Elements of BHP’s Strategy
• Heavily investment in Iron Ore and LNGproduction.
•
Gained technical expertise in oil drillingfrom recent Acquisition of Petrohawk($12.1 B Cash)
•
Similar Drilling Procedure for gas andoil. Drill for gas near oil deposits – Win-Win
8/2/2019 BHP vs. Rio Tinto
http://slidepdf.com/reader/full/bhp-vs-rio-tinto 12/54
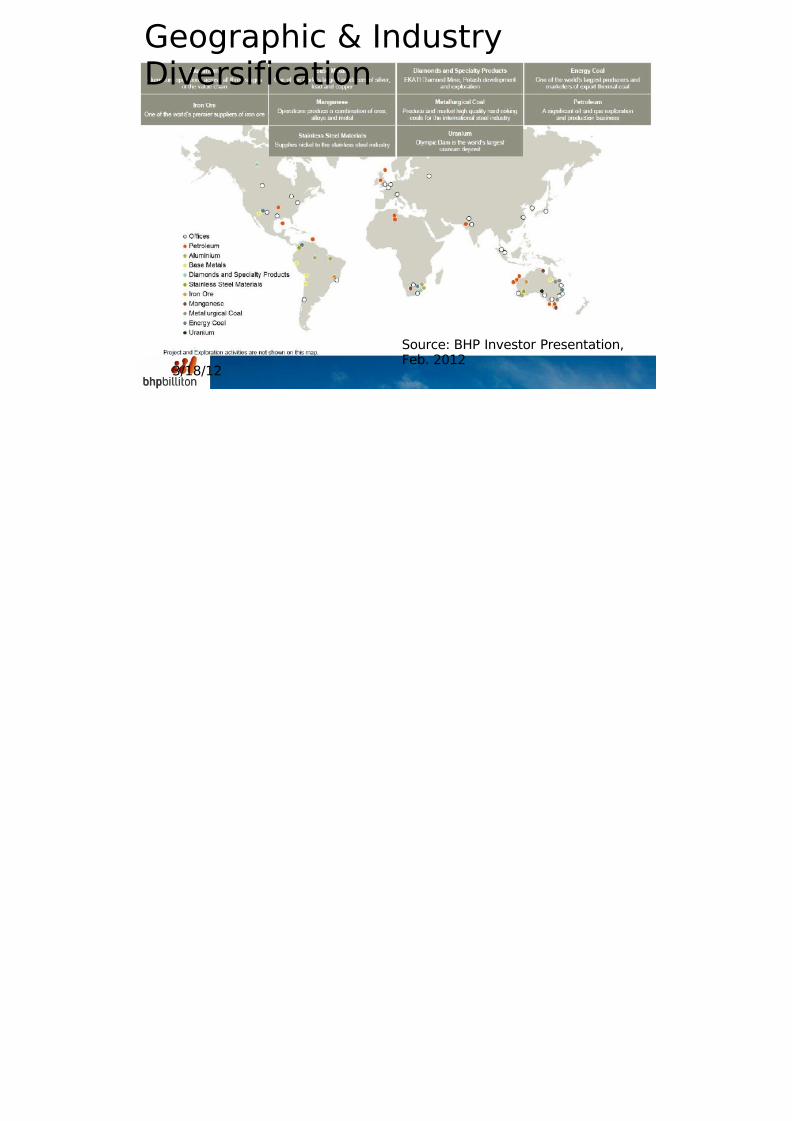
3/18/12 Source: BHP Investor Presentation,
Feb. 2012
Geographic & IndustryDiversification

8/2/2019 BHP vs. Rio Tinto
http://slidepdf.com/reader/full/bhp-vs-rio-tinto 13/54
3/18/12 Source: BHP Investor Presentation,
Feb. 2012
EBIT, EBIT Margin
8/2/2019 BHP vs. Rio Tinto
http://slidepdf.com/reader/full/bhp-vs-rio-tinto 14/54
3/18/12
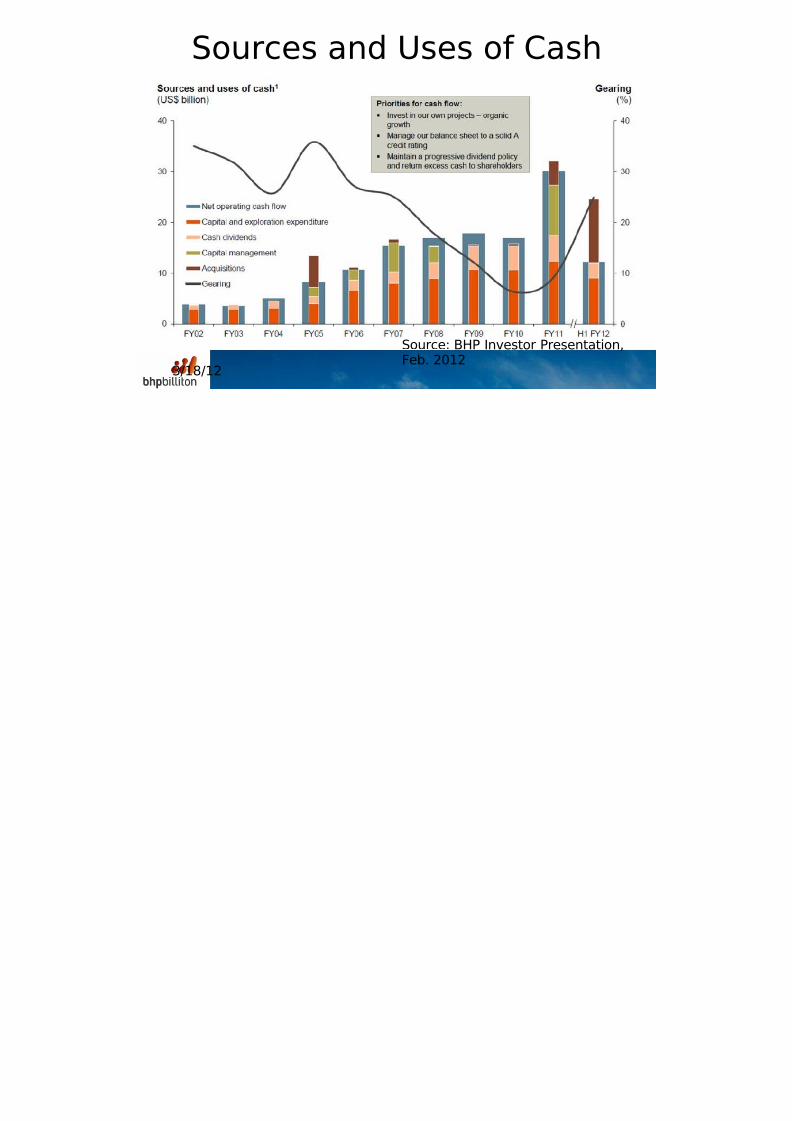
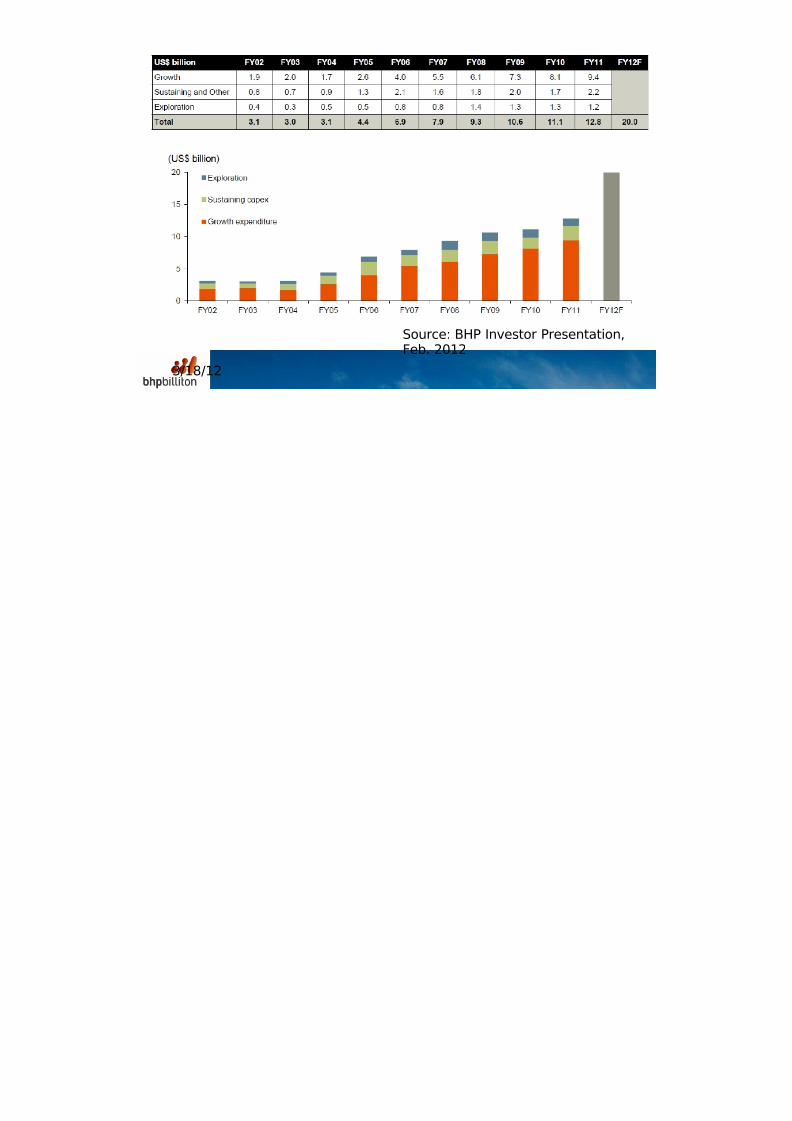
Sources and Uses of Cash
Source: BHP Investor Presentation,
Feb. 2012
8/2/2019 BHP vs. Rio Tinto
http://slidepdf.com/reader/full/bhp-vs-rio-tinto 15/54
3/18/12
Risk Analysis: SWOT• Strengths
– Balance Sheet and Cash Position
–
Centralized Marketing Engine
• Weaknesses – High Copper Extraction Costs
– Low Margin on Aluminum
• Opportunities – Demand growth due to Urbanization and

8/2/2019 BHP vs. Rio Tinto
http://slidepdf.com/reader/full/bhp-vs-rio-tinto 16/54
Click to edit Master subtitle style
3/18/12
Competitor
Analysis:Rio Tinto

8/2/2019 BHP vs. Rio Tinto
http://slidepdf.com/reader/full/bhp-vs-rio-tinto 17/54
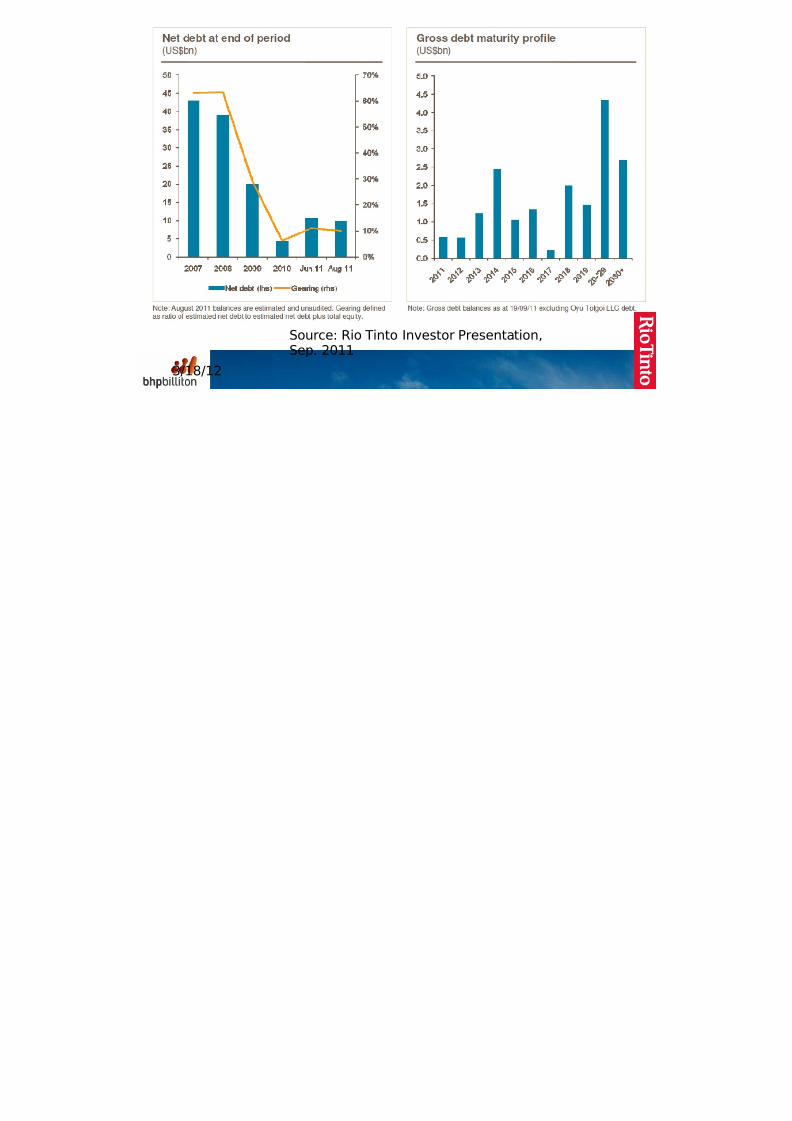
3/18/12 Source: Rio Tinto Investor Presentation, Sep. 2011
8/2/2019 BHP vs. Rio Tinto
http://slidepdf.com/reader/full/bhp-vs-rio-tinto 18/54
3/18/12
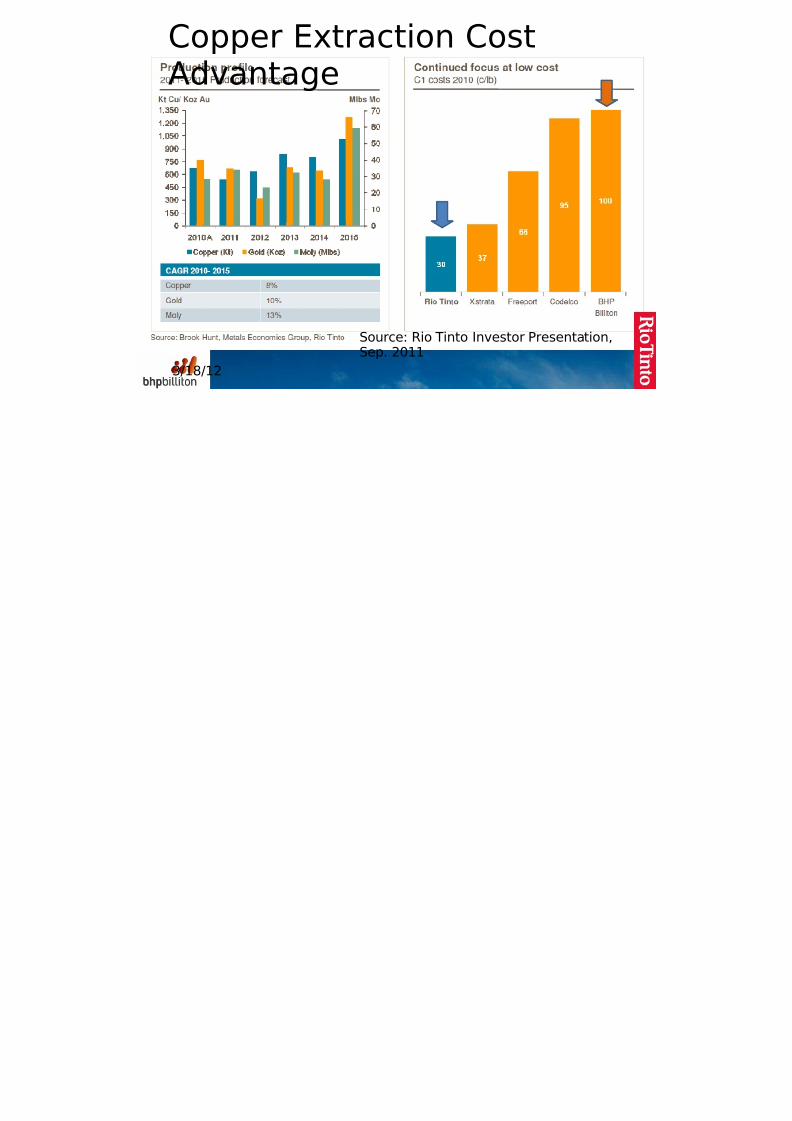
Copper Extraction CostAdvantage
Source: Rio Tinto Investor Presentation, Sep. 2011
8/2/2019 BHP vs. Rio Tinto
http://slidepdf.com/reader/full/bhp-vs-rio-tinto 19/54
3/18/12
Rio Tinto’s People• Chairman Jan du Plessis
• Group CEO Tom Albanese: No Bonusthis year
• Group CFO Guy Elliot
• Copper CEO Andrew Harding
• Energy CEO Doug Ritchie
• Employees: Fewer than BHP Billiton(77,000)
•
8/2/2019 BHP vs. Rio Tinto
http://slidepdf.com/reader/full/bhp-vs-rio-tinto 20/54
3/18/12
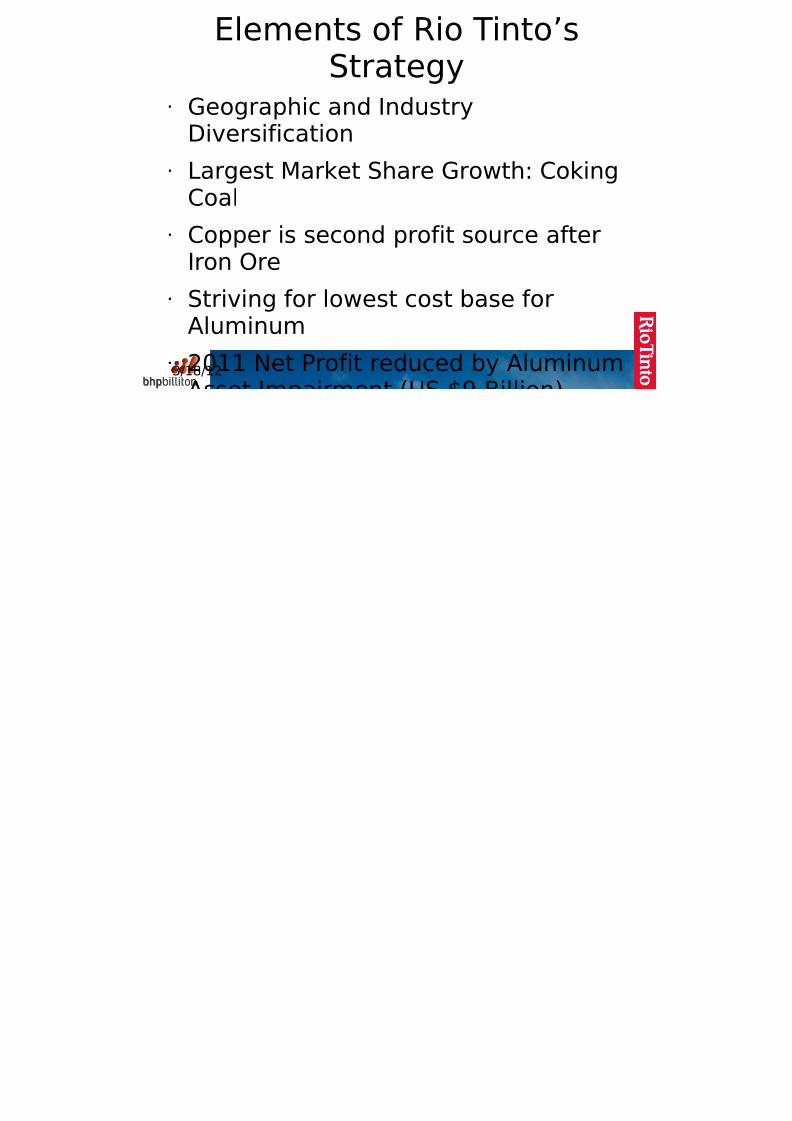
Elements of Rio Tinto’sStrategy
• Geographic and IndustryDiversification
• Largest Market Share Growth: CokingCoal
• Copper is second profit source afterIron Ore
• Striving for lowest cost base forAluminum
•
2011 Net Profit reduced by Aluminum
8/2/2019 BHP vs. Rio Tinto
http://slidepdf.com/reader/full/bhp-vs-rio-tinto 21/54
3/18/12
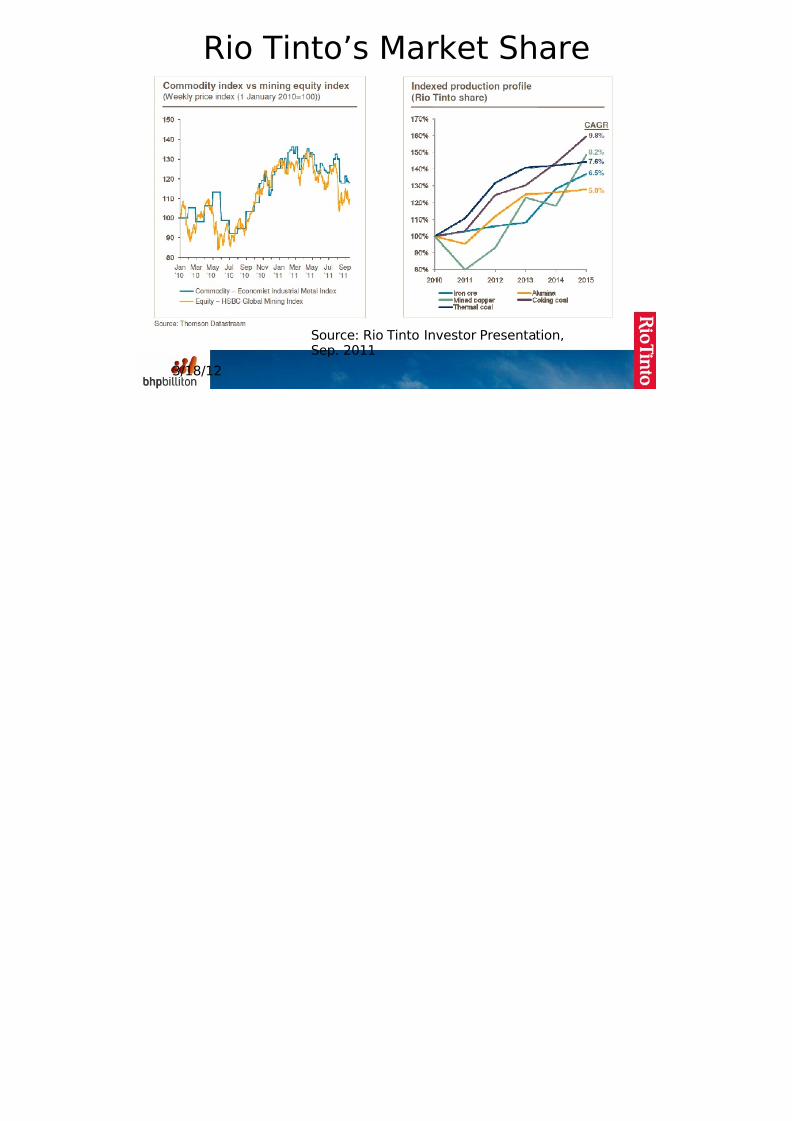
Rio Tinto’s Market Share
Source: Rio Tinto Investor Presentation, Sep. 2011

8/2/2019 BHP vs. Rio Tinto
http://slidepdf.com/reader/full/bhp-vs-rio-tinto 22/54
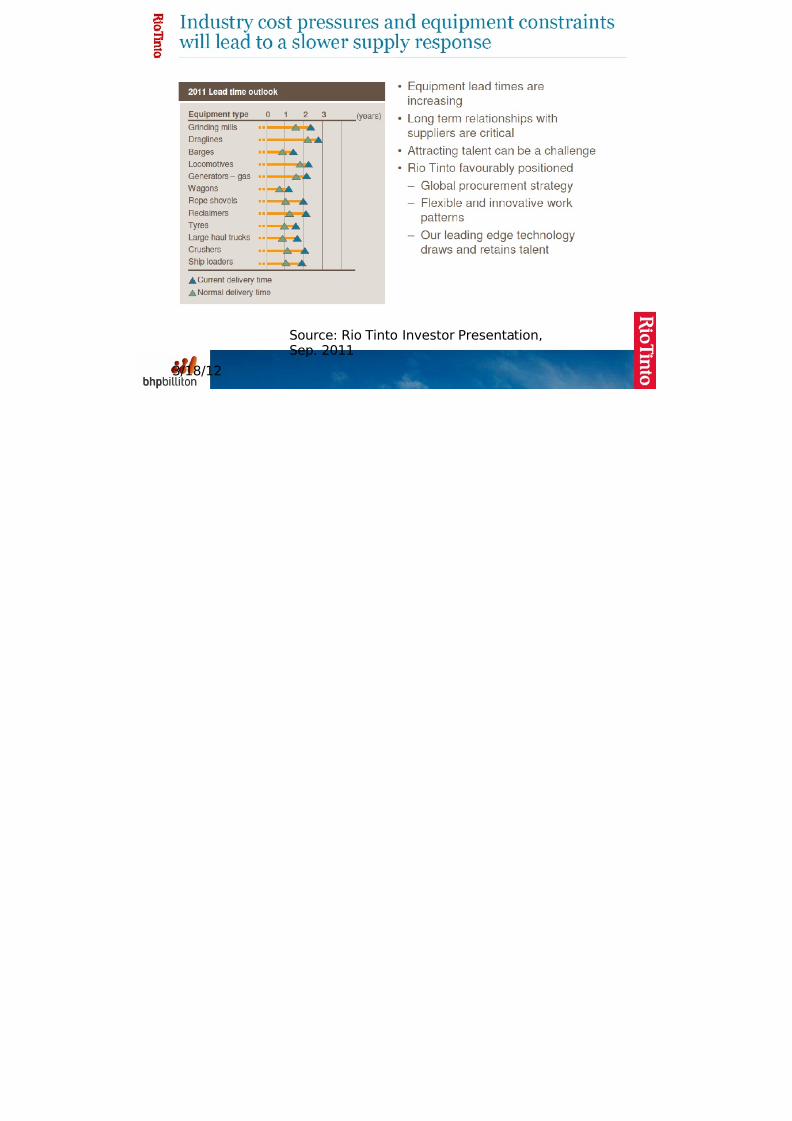
3/18/12 Source: Rio Tinto Investor Presentation,
Fi i l A l i
8/2/2019 BHP vs. Rio Tinto
http://slidepdf.com/reader/full/bhp-vs-rio-tinto 23/54
Click to edit Master subtitle style
3/18/12
Financial Analysis

8/2/2019 BHP vs. Rio Tinto
http://slidepdf.com/reader/full/bhp-vs-rio-tinto 24/54
3/18/12
Rio Tinto
0
2
4
6
8
10
12
Units: Millions USD

8/2/2019 BHP vs. Rio Tinto
http://slidepdf.com/reader/full/bhp-vs-rio-tinto 25/54
3/18/12
BHP Billiton
0
2
4
6
8
10
12
Units: Millions USD
8/2/2019 BHP vs. Rio Tinto
http://slidepdf.com/reader/full/bhp-vs-rio-tinto 26/54
3/18/12
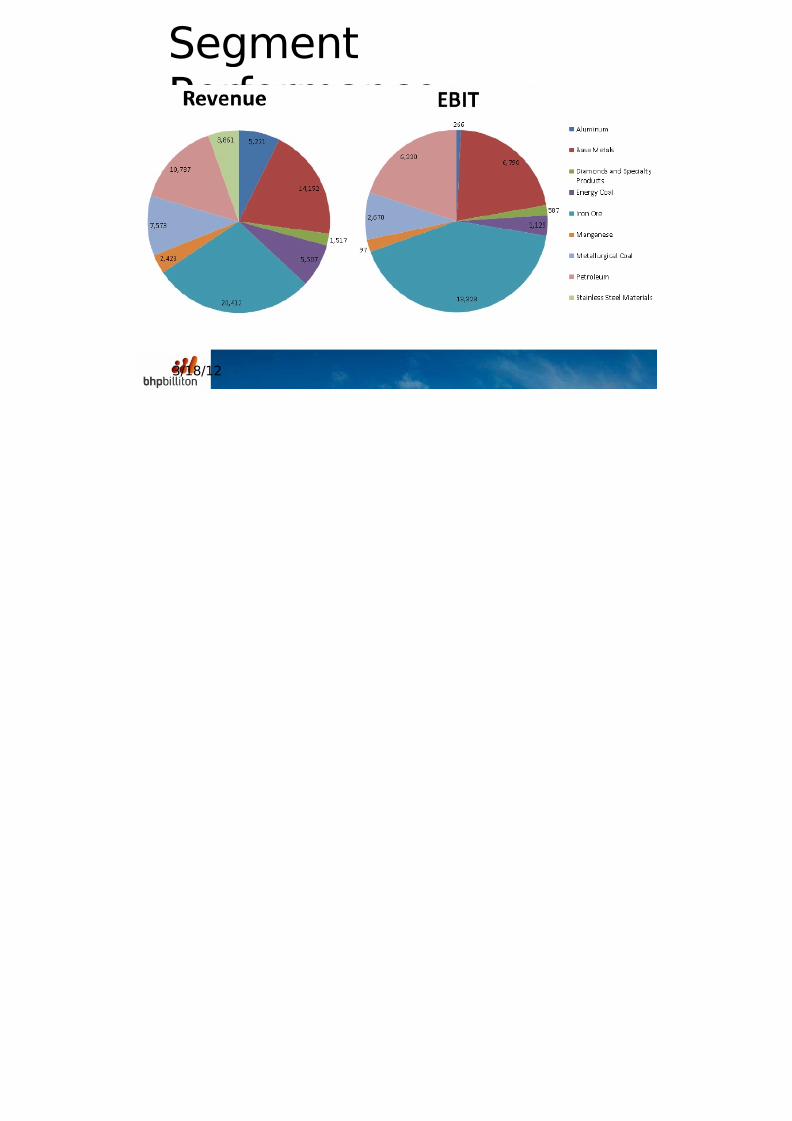
Segment
Performance
C dit P i
8/2/2019 BHP vs. Rio Tinto
http://slidepdf.com/reader/full/bhp-vs-rio-tinto 27/54
3/18/12
Commodity Price
Risk• High for input costs
• Relatively low for outputs
•
Geographical Diversificationmitigates this
8/2/2019 BHP vs. Rio Tinto
http://slidepdf.com/reader/full/bhp-vs-rio-tinto 28/54
3/18/12
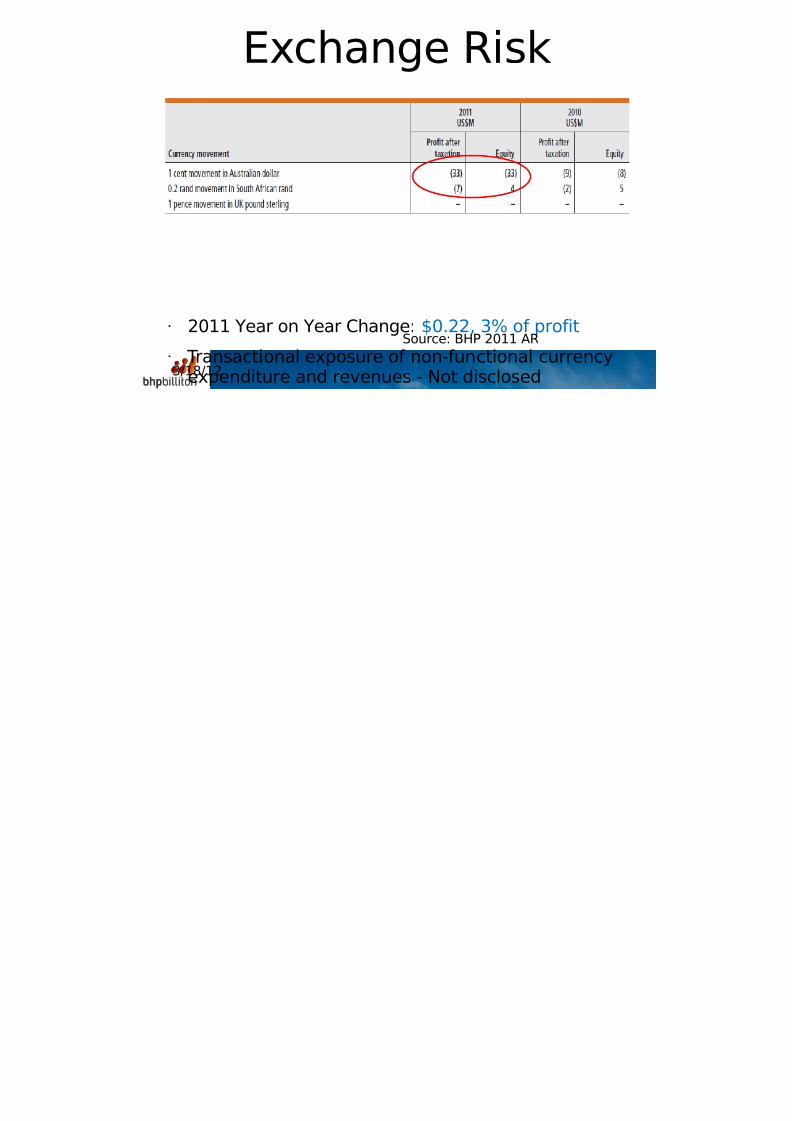
Exchange Risk
• 2011 Year on Year Change: $0.22, 3% of profit
• Transactional exposure of non-functional currencyexpenditure and revenues - Not disclosed
Source: BHP 2011 AR
8/2/2019 BHP vs. Rio Tinto
http://slidepdf.com/reader/full/bhp-vs-rio-tinto 29/54
3/18/12
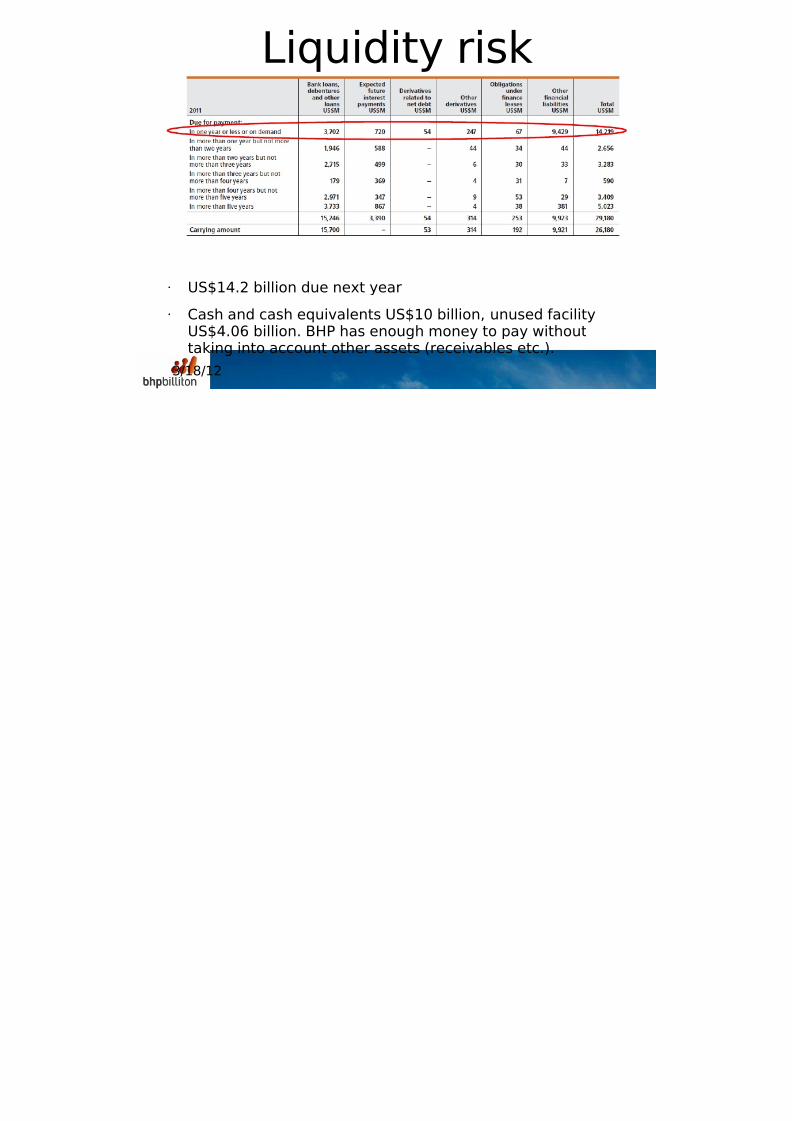
Liquidity risk
• US$14.2 billion due next year
• Cash and cash equivalents US$10 billion, unused facilityUS$4.06 billion. BHP has enough money to pay withouttaking into account other assets (receivables etc.).

8/2/2019 BHP vs. Rio Tinto
http://slidepdf.com/reader/full/bhp-vs-rio-tinto 30/54
3/18/12
Credit Risk• Managed by maintaining procedures converting the application for
credit approvals, granting and renewal of counterparty limits anddaily monitoring of exposures against these limits.
• No significant concentration.
• Balance of allowance account for impairment - 2% of gross amount
•
Past-due but not impaired receivables - 6% of gross amount- mostless than 30 days
• But other information such as counterparties ratings and
geographical analysis not disclosed (unknowns!).
B siness Segment
8/2/2019 BHP vs. Rio Tinto
http://slidepdf.com/reader/full/bhp-vs-rio-tinto 31/54
3/18/12
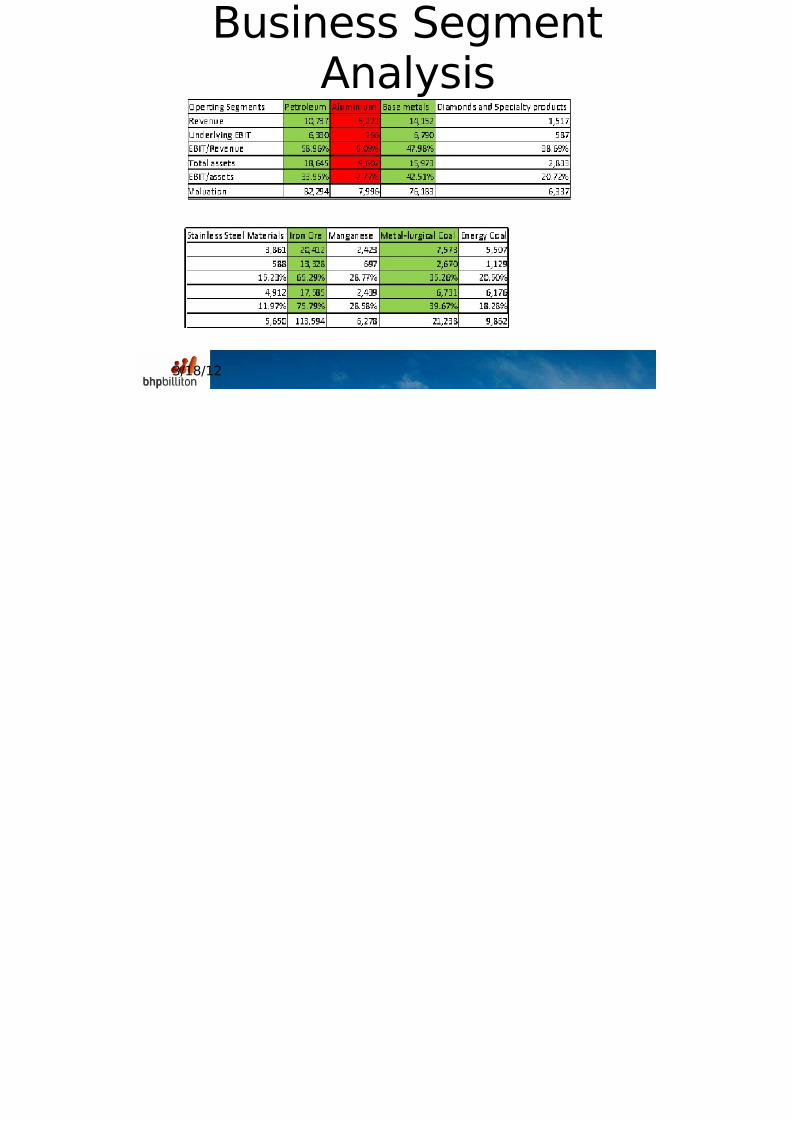
Business Segment
Analysis
scoun e as ow
8/2/2019 BHP vs. Rio Tinto
http://slidepdf.com/reader/full/bhp-vs-rio-tinto 32/54
3/18/12
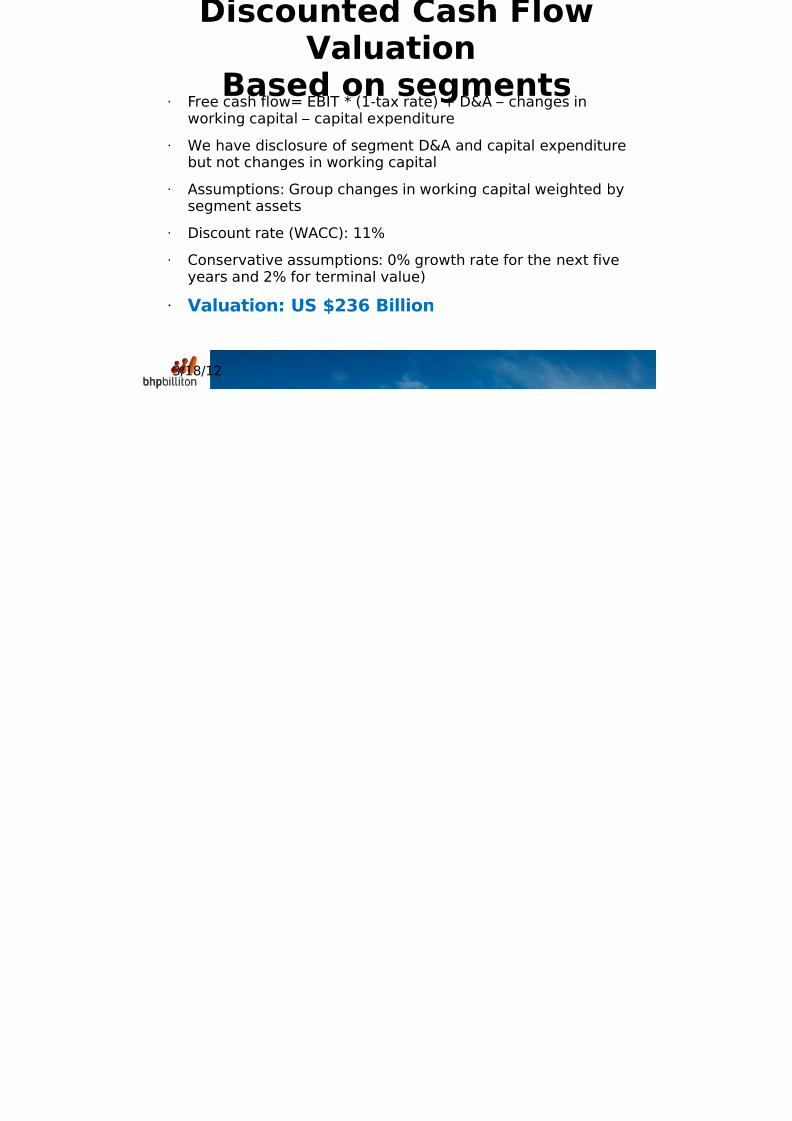
scoun e as owValuation
Based on segments• Free cash flow= EBIT * (1-tax rate) + D&A – changes inworking capital – capital expenditure
• We have disclosure of segment D&A and capital expenditurebut not changes in working capital
• Assumptions: Group changes in working capital weighted bysegment assets
• Discount rate (WACC): 11%
• Conservative assumptions: 0% growth rate for the next five
years and 2% for terminal value)
• Valuation: US $236 Billion
PP&E
8/2/2019 BHP vs. Rio Tinto
http://slidepdf.com/reader/full/bhp-vs-rio-tinto 33/54
3/18/12
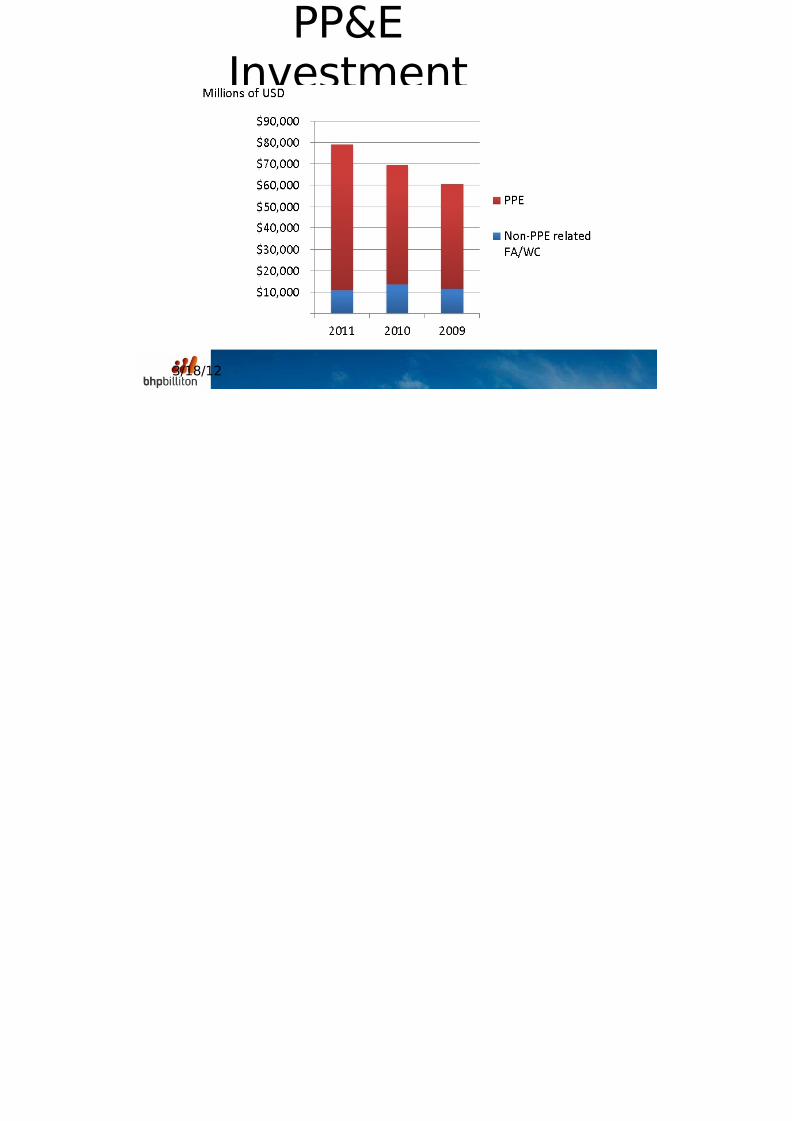
PP&E
Investment
Four Slices
8/2/2019 BHP vs. Rio Tinto
http://slidepdf.com/reader/full/bhp-vs-rio-tinto 34/54
3/18/12
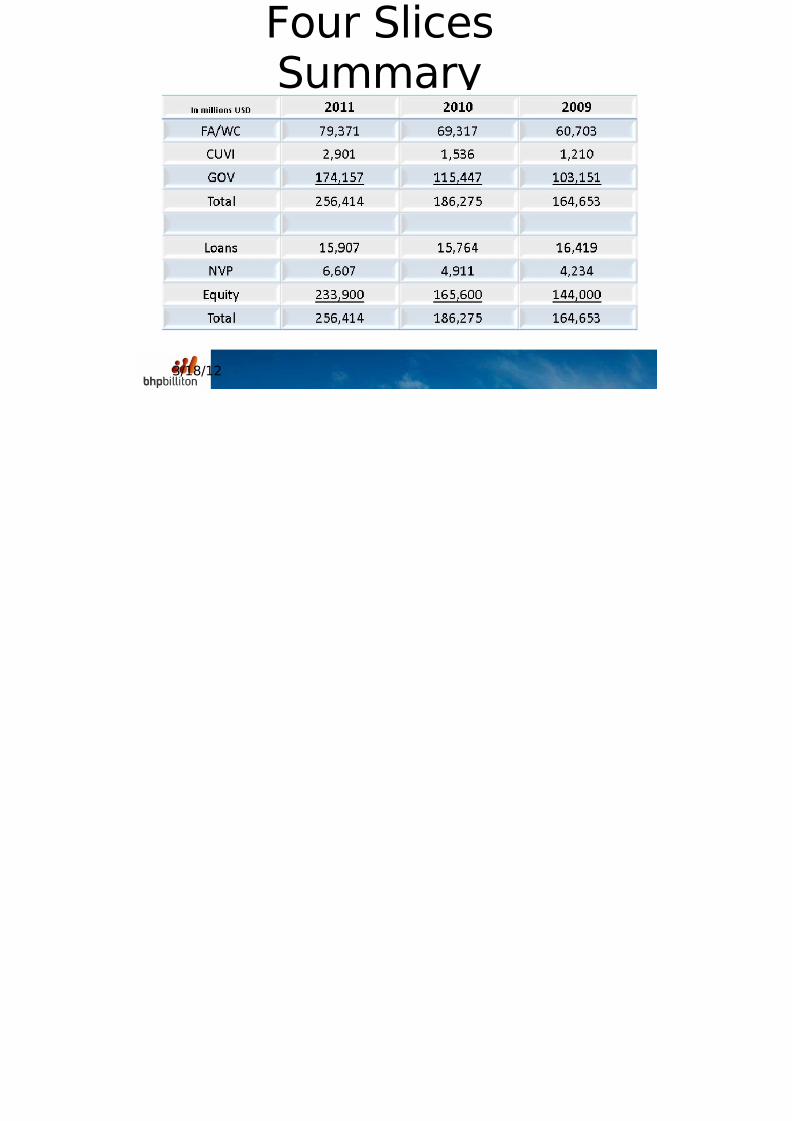
Four Slices
Summary
Four Slices Valuation

8/2/2019 BHP vs. Rio Tinto
http://slidepdf.com/reader/full/bhp-vs-rio-tinto 35/54
3/18/12
Four Slices Valuation –
Buy!
0
2
4
6
8
10
12
8/2/2019 BHP vs. Rio Tinto
http://slidepdf.com/reader/full/bhp-vs-rio-tinto 36/54
Click to edit Master subtitle style
3/18/12
Thank You

8/2/2019 BHP vs. Rio Tinto
http://slidepdf.com/reader/full/bhp-vs-rio-tinto 37/54
Click to edit Master subtitle style
3/18/12
Appendix SectionSelected Strategic Data
BHP Market
8/2/2019 BHP vs. Rio Tinto
http://slidepdf.com/reader/full/bhp-vs-rio-tinto 38/54
3/18/12
BHP Market
CapitalizationSource: BHP Investor Presentation, Feb. 2012
8/2/2019 BHP vs. Rio Tinto
http://slidepdf.com/reader/full/bhp-vs-rio-tinto 39/54
3/18/12 Source: BHP Investor Presentation, Feb. 2012

8/2/2019 BHP vs. Rio Tinto
http://slidepdf.com/reader/full/bhp-vs-rio-tinto 40/54
3/18/12 Source: Rio Tinto Investor Presentation, Sep. 2011
8/2/2019 BHP vs. Rio Tinto
http://slidepdf.com/reader/full/bhp-vs-rio-tinto 41/54
3/18/12 Source: Rio Tinto Investor Presentation, Sep. 2011

8/2/2019 BHP vs. Rio Tinto
http://slidepdf.com/reader/full/bhp-vs-rio-tinto 42/54
3/18/12 Source: Rio Tinto Investor Presentation, Sep. 2011
Btoe= Billion Ton of Oil Equivalent, Mtoe=Million Ton of OilEquivalent
8/2/2019 BHP vs. Rio Tinto
http://slidepdf.com/reader/full/bhp-vs-rio-tinto 43/54
3/18/12
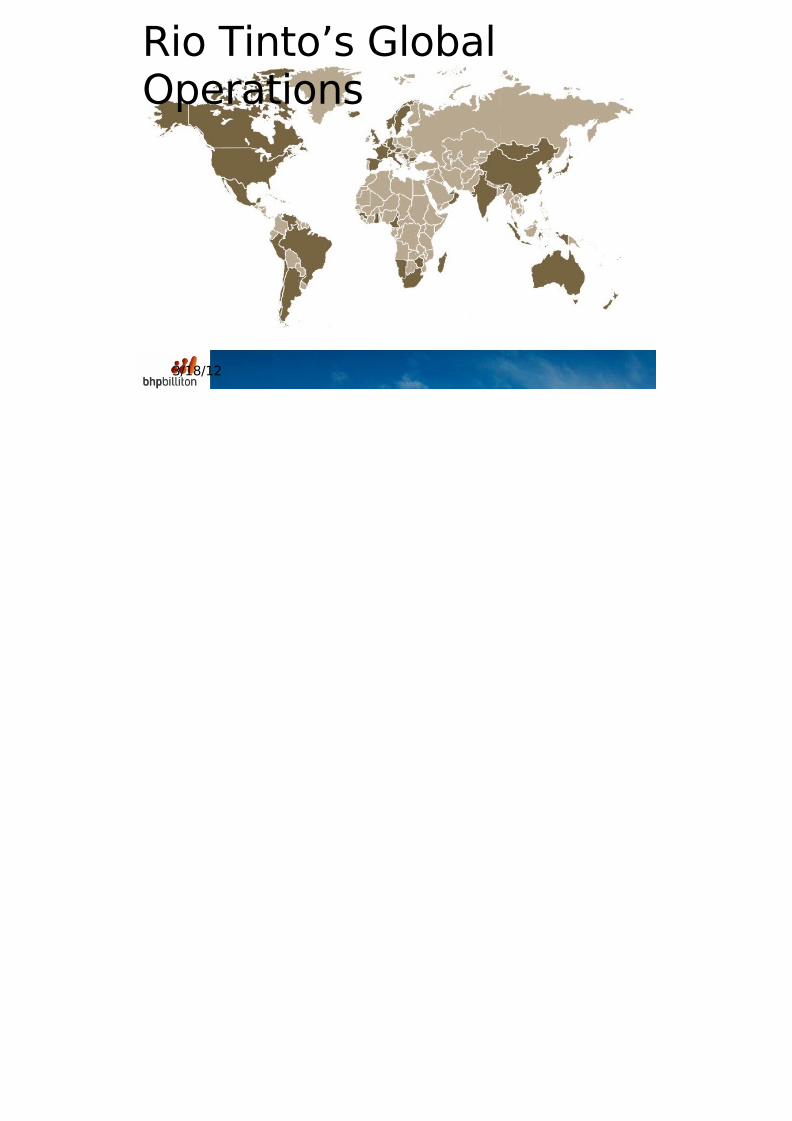
Rio Tinto’s Global
Operations

8/2/2019 BHP vs. Rio Tinto
http://slidepdf.com/reader/full/bhp-vs-rio-tinto 44/54
3/18/12 Source: Rio Tinto Investor Presentation, Sep. 2011

8/2/2019 BHP vs. Rio Tinto
http://slidepdf.com/reader/full/bhp-vs-rio-tinto 45/54
3/18/12 Source: Rio Tinto Investor Website (2012)
8/2/2019 BHP vs. Rio Tinto
http://slidepdf.com/reader/full/bhp-vs-rio-tinto 46/54
3/18/12 Source: Rio Tinto Investor Presentation, Sep. 2011

8/2/2019 BHP vs. Rio Tinto
http://slidepdf.com/reader/full/bhp-vs-rio-tinto 47/54
Click to edit Master subtitle style
3/18/12
Appendix Section
Selected Financial Data
Non current Assets
8/2/2019 BHP vs. Rio Tinto
http://slidepdf.com/reader/full/bhp-vs-rio-tinto 48/54
3/18/12
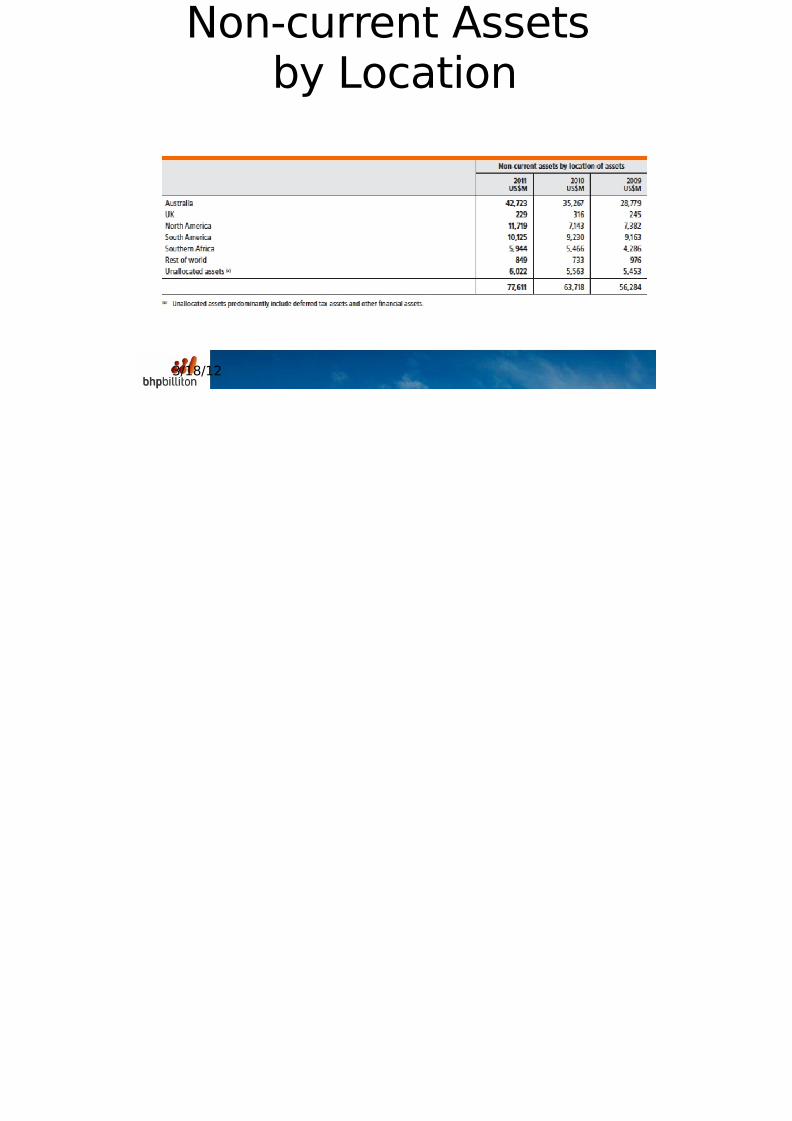
Non-current Assets
by Location
2011 Summary

8/2/2019 BHP vs. Rio Tinto
http://slidepdf.com/reader/full/bhp-vs-rio-tinto 49/54
3/18/12
2011 Summary
Calculation
2010 Summary
8/2/2019 BHP vs. Rio Tinto
http://slidepdf.com/reader/full/bhp-vs-rio-tinto 50/54
3/18/12
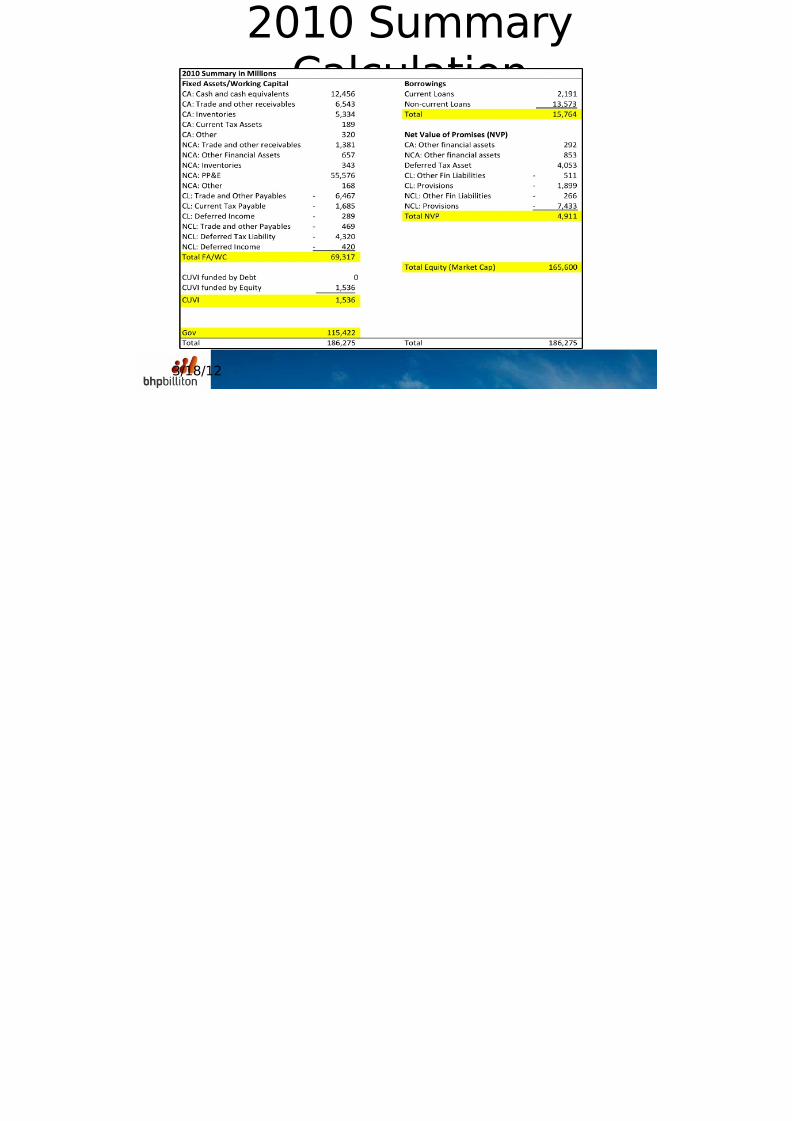
2010 Summary
Calculation
2009 Summary
8/2/2019 BHP vs. Rio Tinto
http://slidepdf.com/reader/full/bhp-vs-rio-tinto 51/54
3/18/12
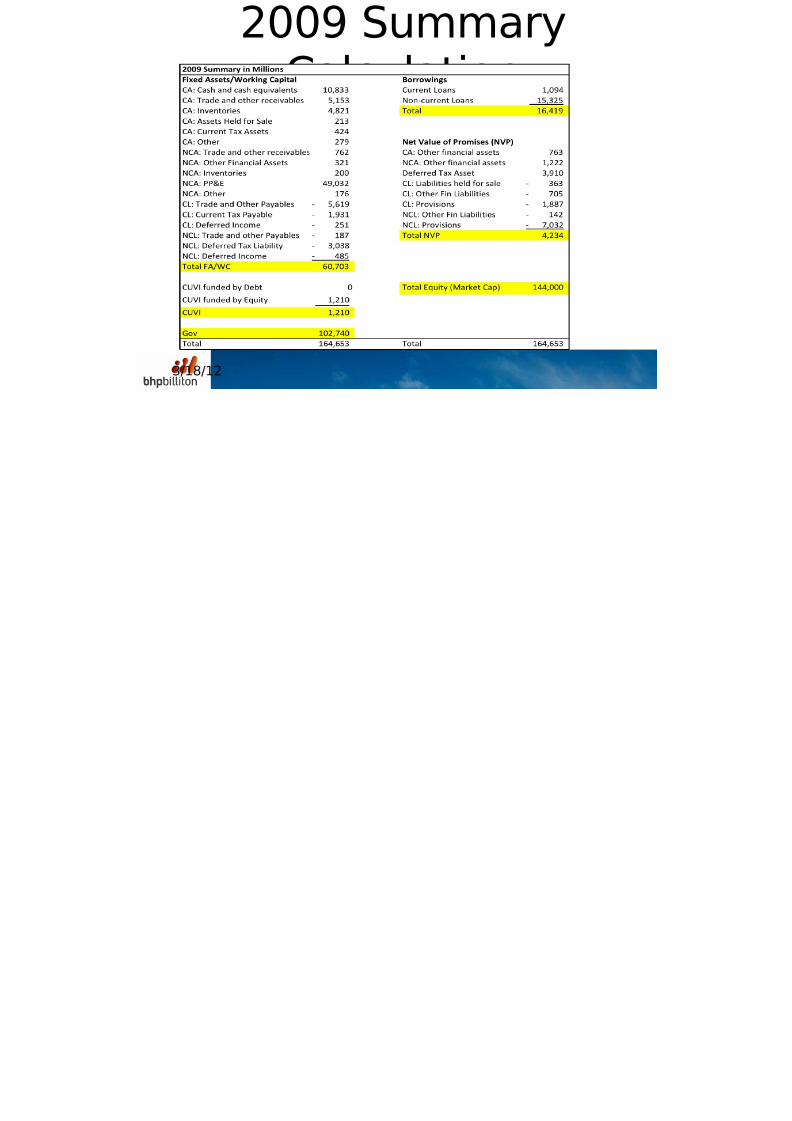
2009 Summary
Calculation
8/2/2019 BHP vs. Rio Tinto
http://slidepdf.com/reader/full/bhp-vs-rio-tinto 52/54
3/18/12
CUVI Calculation
8/2/2019 BHP vs. Rio Tinto
http://slidepdf.com/reader/full/bhp-vs-rio-tinto 53/54
3/18/12
GOV Calculation
8/2/2019 BHP vs. Rio Tinto
http://slidepdf.com/reader/full/bhp-vs-rio-tinto 54/54
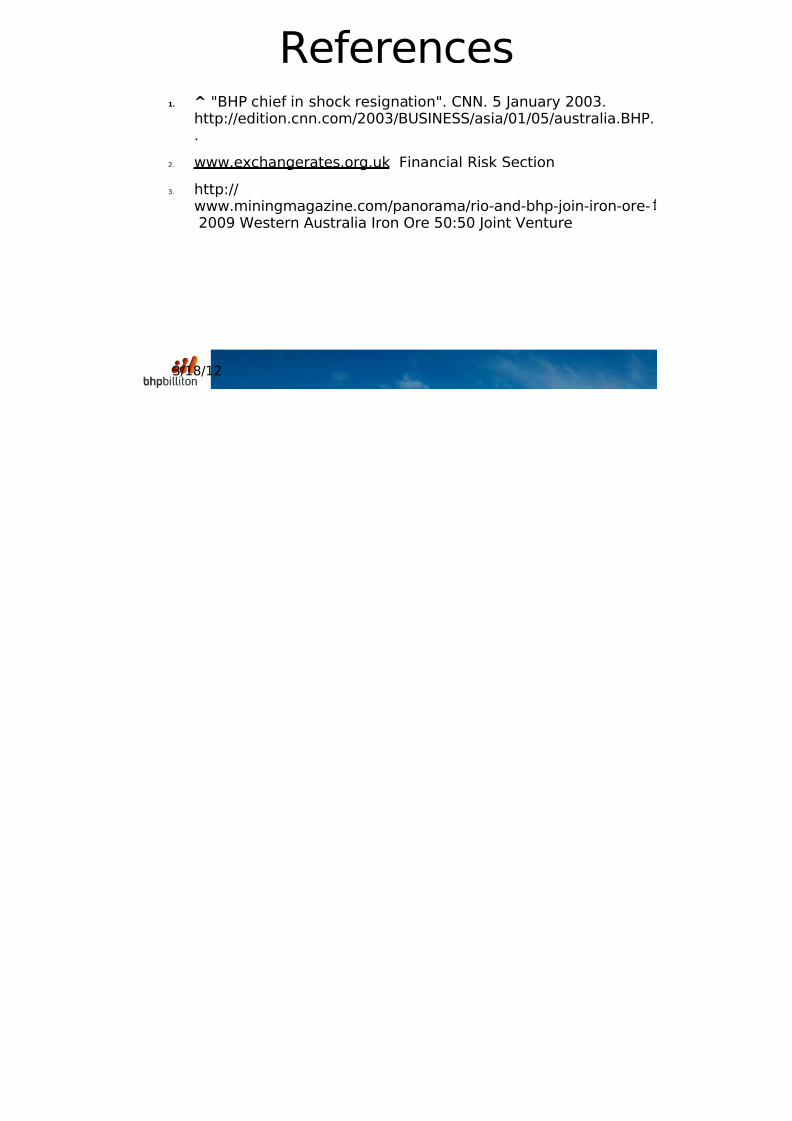
References1. ^ "BHP chief in shock resignation". CNN. 5 January 2003.
http://edition.cnn.com/2003/BUSINESS/asia/01/05/australia.BHP..
2. www.exchangerates.org.uk Financial Risk Section
3. http://www.miningmagazine.com/panorama/rio-and-bhp-join-iron-ore-2009 Western Australia Iron Ore 50:50 Joint Venture