Embed Size (px)
Citation preview

UNIVERSIDADE FEDERAL DO PARÁ
INSTITUTO DE TECNOLOGIA
PROGRAMA DE PÓS-GRADUAÇÃO EM CIÊNCIA E TECNOLOGIA DE ALIMENTOS
(PPGCTA)
LETÍCIA ROCHA GUIDI
DESENVOLVIMENTO DE MÉTODOS POR CL-EM/EM E OCORRÊNCIA
DE ANTIMICROBIANOS EM PEIXES DE AQUICULTURA
BELÉM-PA 2016

UNIVERSIDADE FEDERAL DO PARÁ
INSTITUTO DE TECNOLOGIA
PROGRAMA DE PÓS-GRADUAÇÃO EM CIÊNCIA E TECNOLOGIA DE ALIMENTOS
(PPGCTA)
LETÍCIA ROCHA GUIDI
DESENVOLVIMENTO DE MÉTODOS POR CL-EM/EM E OCORRÊNCIA
DE ANTIMICROBIANOS EM PEIXES DE AQUICULTURA
Tese apresentada ao Programa de Pós-graduação em Ciência e Tecnologia de Alimentos da Universidade Federal do Pará, para obtenção do grau de Doutor em Ciência e Tecnologia de Alimentos. Orientadora: Profª. Drª. Luiza Helena Meller da Silva Co-orientadora: Profª. Drª. Maria Beatriz Abreu Gloria
BELÉM-PA 2016

Dedico este trabalho aos meus pais, Ricardo e Heloisa.

“Posso ter defeitos, viver ansioso e ficar irritado algumas vezes, Mas não esqueço de que minha vida
É a maior empresa do mundo… E que posso evitar que ela vá à falência.
Ser feliz é reconhecer que vale a pena viver Apesar de todos os desafios, incompreensões e períodos de crise.
Ser feliz é deixar de ser vítima dos problemas e Se tornar um autor da própria história…
É atravessar desertos fora de si, mas ser capaz de encontrar Um oásis no recôndito da sua alma…
É agradecer a Deus a cada manhã pelo milagre da vida. Ser feliz é não ter medo dos próprios sentimentos.
É saber falar de si mesmo. É ter coragem para ouvir um “Não”!!!
É ter segurança para receber uma crítica, Mesmo que injusta…
Pedras no caminho?
Guardo todas, um dia vou construir um castelo…”
Fernando Pessoa – Pedras no Caminho

AGRADECIMENTOS
À Deus, pela saúde, força e por sempre guiar os meus caminhos. Aos meu pais (Ricardo e Heloísa), pelo amor, exemplo, paciência, incentivo e suporte em todos os momentos. Às minhas irmãs, Clarissa e Cláudia, pelo carinho, amizade e conselhos. À Professora Drª. Luiza Helena Meller da Silva, pelo acolhimento, confiança e orientação. À Professora Drª. Maria Beatriz Abreu Glória, pelas oportunidades, pelo exemplo de profissional e orientação durante a realização deste trabalho. Agradeço o apoio, o incentivo constante e a confiança depositada. Ao Professor Dr. Christian Fernandes, pela amizade, auxílio e orientação na condução do trabalho e pelo exemplo de profissional dedicado e humano. À amiga Patrícia Tette, por ter ajudado a tornar a caminhada mais leve e valiosa. Por dividir comigo muitos momentos bons e alguns ruins. Pela amizade, pela ajuda, pelo apoio, pelos ensinamentos e pelo aprendizado conjunto. A todos os amigos do LBqA/UFMG, pela ótima convivência e amizade e por tornarem mais prazeroso o percurso. À Andréa Melo Garcia de Oliveira do LANAGRO/MG pela oportunidade de realizar a parte experimetal deste trabalho no Laboratório de Resíduos de Medicamentos. Ao Flávio Alves Santos do LANAGRO/MG pelo auxílio constante no desenvolvimento deste trabalho e também por sua solicitude e amizade. A todos os amigos do Laboratório de Resíduos de Medicamentos do LANAGRO/MG pela amizade, auxílio e ótima convivência. Ao Professor Dr. Carlos Augusto Gomes Leal, pela ajuda na obtenção das amostras. À amiga Carina Lemos pela acolhida em Belém, auxílio na coleta das amostras e amizade. A todos os amigos e familiares que me apoiaram e torceram por mim. A todos os professores que contribuíram para a minha formação. A todos que, de alguma maneira, contribuíram para realização deste trabalho. À Coordenação de Aperfeiçoamento de Pessoal de Nível Superior (CAPES). Muito obrigada!

4
SUMÁRIO
1. A AQUICULTURA NO BRASIL ............................................................................... 17
1.1. O uso de antimicrobianos na piscicultura .......................................................... 20 2. ANTIMICROBIANOS ................................................................................................ 23
2.1. Aspectos toxicológicos ....................................................................................... 24 2.2. Aminoglicosídeos ............................................................................................... 25
2.3. Anfenicóis ........................................................................................................... 27 2.4. Beta-lactâmicos .................................................................................................. 28
2.5. Macrolídeos ........................................................................................................ 30 2.6. Quinolonas ......................................................................................................... 31 2.7. Tetraciclinas ....................................................................................................... 34
3. OCORRÊNCIA DE RESÍDUOS DE ANTIMICROBIANOS EM PEIXE ..................... 37 4. CONTROLE DE RESÍDUOS E CONTAMINANTES EM ALIMENTOS ...................... 39
4.1. Controle de resíduos de antimicrobianos no Brasil ........................................... 40
4.2. Controle de resíduos de antimicrobianos na União Europeia ............................ 42
5. MÉTODOS DE ANÁLISE DE ANTIMICROBIANOS EM ALIMENTOS ..................... 43 5.1. Preparo de amostra ........................................................................................... 43
5.2. Técnicas de separação e determinação de antimicrobianos em alimentos....... 44
ABSTRACT ................................................................................................................... 51 1. INTRODUCTION ....................................................................................................... 52
2. CHARACTERISTICS AND ANTIMICROBIAL ACTIVITY OF CHLORAMPHENICOL ..................................................................................................................................... .53 3. TOXICOLOGICAL ASPECTS AND CURRENT LEGISLATION ................................ 54 4. LC-MS/MS METHODS FOR THE ANALYSIS OF CHLORAMPHENICOLS IN FOODS ...................................................................................................................................... 55
5. OCCURRENCE OF CHLORAMPHENICOL IN FOOD .............................................. 59 6. CONCLUSION ........................................................................................................... 61
ABSTRACT ................................................................................................................... 64
LISTA DE TABELAS ...................................................................................................... 7
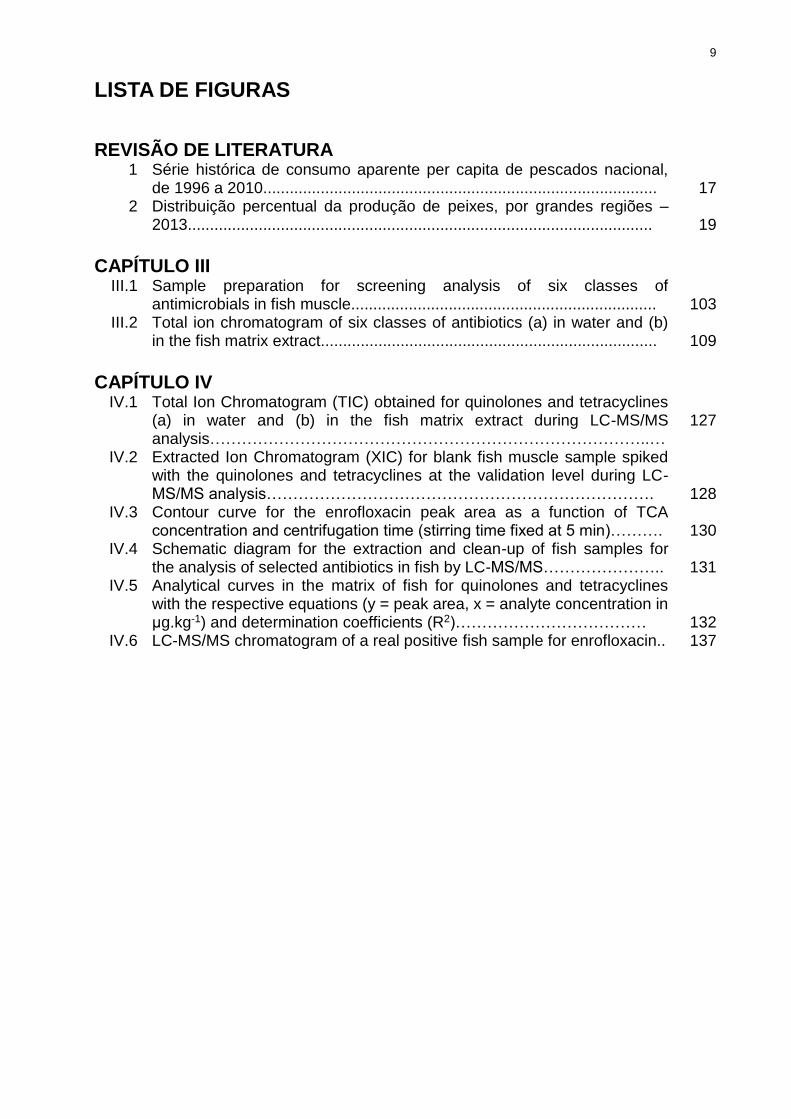
LISTA DE FIGURAS ....................................................................................................... 9
LISTA DE SIGLAS E ABREVIATURAS ....................................................................... 10
RESUMO........................................................................................................................12
ABSTRACT ................................................................................................................... 13
INTRODUÇÃO GERAL ................................................................................................. 14
REVISÃO DE LITERATURA ......................................................................................... 17
OBJETIVOS .................................................................................................................. 48
PARTE EXPERIMENTAL ............................................................................................. 49
CAPÍTULO I - LC-MS/MS DETERMINATION OF CHLORAMPHENICOL IN FOOD OF
ANIMAL ORIGIN IN BRAZIL ....................................................................... 50
CAPÍTULO II - ADVANCES ON THE CHROMATOGRAPHIC DETERMINATION OF
AMPHENICOLS IN FOOD ........................................................................... 63

5
1. INTRODUCTION ....................................................................................................... 65 2. CHARACTERISTICS OF AMPHENICOLS AND SOME METABOLITES .................. 66
3. METHODS FOR THE ANALYSIS OF AMPHENICOLS IN FOOD MATRICES ......... 72 3.1. Sample preparation ............................................................................................ 72
3.1.1. Liquid-liquid extraction................................................................................. 72 3.1.2. Solid-phase extraction ................................................................................. 74
3.1.3. Miniaturized approaches ............................................................................. 78 3.2. Separation and detection techniques ................................................................. 78
3.2.1. Gas chromatography ................................................................................... 79 3.2.2. Liquid chromatography ................................................................................ 83
4. OCCURRENCE OF AMPHENICOLS IN FOOD ........................................................ 91
5. CONCLUSIONS AND PERSPECTIVES ................................................................... 94
ABSTRACT ................................................................................................................... 97 1. INTRODUCTION ....................................................................................................... 98 2. EXPERIMENTAL ..................................................................................................... 101
2.1. Material ............................................................................................................. 101 2.1.1. Chemicals and reagents............................................................................ 101
2.1.2. Samples .................................................................................................... 102 2.2. LC-MS/MS analysis .......................................................................................... 102
2.3. Sample preparation .......................................................................................... 103 2.4. Validation of the method ................................................................................... 104
2.4.1. Threshold value ......................................................................................... 104
2.4.2. Cut-off factor ............................................................................................. 104 2.4.3. Detection capability ................................................................................... 105
2.4.4. Limit of detection (LOD) ............................................................................ 105 2.4.5. Sensitivity and specificity ........................................................................... 105
3. RESULTS AND DISCUSSION ................................................................................ 106 3.1. Optimization of the LC-MS/MS procedure ........................................................ 106
3.2. Screening method validation ............................................................................ 110 3.3. Screening of farm fish samples ....................................................................... 112
4. CONCLUSIONS ...................................................................................................... 114
ABSTRACT ................................................................................................................. 115 1. INTRODUCTION ..................................................................................................... 116
2. EXPERIMENTAL ..................................................................................................... 118 2.1. Material ............................................................................................................. 118
2.1.1. Chemicals and regents.............................................................................. 118 2.1.2. Samples .................................................................................................... 119
2.2. LC-MS/MS analysis .......................................................................................... 119 2.3. Optimization of the sample preparation step .................................................... 120 2.4. Maximum residue limit and validation level ...................................................... 122 2.5. Validation of the method ................................................................................... 122
2.5.1. Calibration curves ..................................................................................... 122 2.5.2. Recovery, accuracy and precision ............................................................ 123 2.5.3. Specificity .................................................................................................. 124
CAPÍTULO III - A SIMPLE, FAST AND SENSITIVE SCREENING LC-ESI-MS/MS
METHOD FOR ANTIBIOTICS IN FISH ........................................................ 96
CAPÍTULO IV - MULTI-RESIDUE QUANTITATIVE METHOD FOR QUINOLONES
AND TETRACYCLINES IN FISH BY LC-MSMS ....................................... 115

6
2.5.4. Decision limit (CCα) and detection capability (CCβ).................................. 124 2.5.5. Limit of quantification (LOQ) ...................................................................... 124
3. RESULTS AND DISCUSSION ................................................................................ 125 3.1. Optimization of the LC-MS/MS procedure ........................................................ 125 3.2. Optimization of the sample preparation step .................................................... 129 3.3. Method validation ............................................................................................. 132
3.3.1. Analytical curves, accuracy, repeatability, reproducibility .......................... 132 3.3.2. Specificity .................................................................................................. 135 3.3.3. Decision limit (CCα) and detection capability (CCβ).................................. 135
3.4. Analysis of real samples ................................................................................... 136 4. CONCLUSIONS ...................................................................................................... 138
CONCLUSÕES INTEGRADAS ................................................................................... 139
REFERÊNCIAS BIBLIOGRÁFICAS ........................................................................... 141
PRODUÇÃO CIENTÍFICA ........................................................................................... 169
ANEXOS………………………………………………………………………………………171

7
LISTA DE TABELAS
REVISÃO DE LITERATURA
1 Antibióticos proibidos para uso em animais destinados ao consumo humano....................................................................................................
22
2 Antibióticos indisponíveis para uso com fins veterinários......................... 22 3 Antibióticos usados na aquicultura em alguns países............................. 23 4 Principais agentes antimicrobianos utilizados em aquicultura e a sua
importância na medicina humana.............................................................
23 5 Informações químicas de alguns aminoglicosídeos.................................. 26 6 Informações químicas dos anfenicóis....................................................... 28 7 Informações químicas de alguns beta-lactâmicos.................................... 29 8 Informações químicas de alguns macrolídeos.......................................... 30 9 Informações químicas de algumas quinolonas......................................... 32
10 Informações químicas de algumas tetraciclinas....................................... 34 11 Informações químicas de algumas sulfonamidas..................................... 36 12 Limites Máximos de Resíduos (LMRs) estabelecidos para
antimicrobianos em músculo de peixe pelo MAPA através do PNCRC de pescado e os LMRs estabelecidos por outros órgãos internacionais...........................................................................................
41
CAPÍTULO I
I.1 Characteristics of chloramphenicol........................................................... 53 I.2 Methods for the extraction and separation of chloramphenicol in food of
animal origin in Brazil by LC-MS/MS.........................................................
57 I.3 Occurrence of chloramphenicol in food of animal origin by LC-MS/MS in
Brazil........................................................................................................
60
CAPÍTULO II
II.1 Some physico-chemical characteristics of amphenicols and some metabolites...............................................................................................
67
II.2 Minimum Required Performance Limits (MRPLs) and Maximum Residue Limits (MRLs) values for amphenicols in food of animal origin established by the European Union, USA, Canada and Brazil........................................................................................................
70 II.3 Sample preparation using liquid-liquid extraction (LLE) for the
determination of amphenicols and some metabolites in food (2002-2015)........................................................................................................
73 II.4 Sample preparation using solid-phase extraction (SPE) for the
determination of amphenicols and some metabolites in food (2002-2015)……………………………………………………………………………
75 II.5 Sample preparation using liquid-liquid (LLE) and solid-phase extraction
(SPE) for the determination of amphenicols and some metabolites in food (2002-2015)……………………………………………………………...
77 II.6 Gas chromatographic methods for the separation and detection of
amphenicols and some metabolites in food (2002-2015)……………………………………………………………………………
81 II.7 Liquid chromatographic methods for the separation and detection of
amphenicols and some metabolites in food (2002-

8
2015)…………………………………………………………………………… 85 II.8 Prevalence and levels of amphenicols and some metabolites in different
food matrices from 2002 to 2016…………………………………………….
92
CAPÍTULO III
III.1 Antibiotics included in the study and respective Maximum Residue Limit (MRL), screening target concentration and concentrations of stock solutions...................................................................................................
100 III.2 Optimized spectrometric conditions - precursor ion, confirmation
transition (C) and quantification transitions (Q), declustering potential (DP), entrance potential (EP), collision energy (CE), collision cell exit potential (CXP) and retention time windows (RTW) - for each analyte in the screening method...............................................................................
107 III.3 Limit of detection (LOD), detection capability (CCβ), sensitivity (sens.)
and the comparison of cut-off factor and threshold value (Fm/Tv) for each antibiotic residue in the validated screening method........................
111
CAPÍTULO IV
IV.1 Maximum residue levels (MRL) of quinolones and tetracyclines in fish established by different regulatory agencies………………………………..
117
IV.2 Coded and experimental values used in the Central Composite Rotational Design (CCRD) during optimization of the extraction procedure for antibiotics analysis by LC-MS/MS…………………………...
121 IV.3 Coded values and responses in peak area of enrofloxacin (ENR) and
oxytetracycline (OXY) for each assay of the Central Composite Rotational Design……………………………………………………………..
121 IV.4 Maximum residue levels (MRL), validation levels (VL) and range of
calibration curves concentration levels of each antibiotic of the quantification method during the validation step of the analysis of antibiotics in fish by LC-MS/MS………………………………………………
123 IV.5 Range of retention times and optimized spectrometric conditions -
precursor ion (Q1), confirmation (Q) and quantification transitions (C), declustering potential (DP), entrance potential (EP), collision energy (CE) and collision cell exit potential (CXP) - for each analyte of the quantification method during analysis of antibiotics by LC-MS/MS………
125 IV.6 Recovery ranges and mean recovery of the antibiotics quinolones and
tetracyclines during analysis of antibiotics in fish by LC-MS/MS………….
131 IV.7 Limit of quantification (LOQ), mean concentration, coefficients of
variation of repeatability (CVr) and reproducibility (CVR) and accuracy results for the antibiotics in fish by LC-MS/MS……………………………...
134 IV.8 Decision limit (CCα) and detection capability (CCβ) results for the
antibiotics in fish by LC-MS/MS………………………………………………
136
9
LISTA DE FIGURAS
REVISÃO DE LITERATURA
1 Série histórica de consumo aparente per capita de pescados nacional, de 1996 a 2010.........................................................................................
17
2 Distribuição percentual da produção de peixes, por grandes regiões – 2013.........................................................................................................
19
CAPÍTULO III
III.1 Sample preparation for screening analysis of six classes of antimicrobials in fish muscle.....................................................................
103
III.2 Total ion chromatogram of six classes of antibiotics (a) in water and (b) in the fish matrix extract............................................................................
109
CAPÍTULO IV
IV.1 Total Ion Chromatogram (TIC) obtained for quinolones and tetracyclines (a) in water and (b) in the fish matrix extract during LC-MS/MS analysis………………………………………………………………………..…
127
IV.2 Extracted Ion Chromatogram (XIC) for blank fish muscle sample spiked with the quinolones and tetracyclines at the validation level during LC-MS/MS analysis……………………………………………………………….
128 IV.3 Contour curve for the enrofloxacin peak area as a function of TCA
concentration and centrifugation time (stirring time fixed at 5 min)……….
130 IV.4 Schematic diagram for the extraction and clean-up of fish samples for
the analysis of selected antibiotics in fish by LC-MS/MS…………………..
131 IV.5 Analytical curves in the matrix of fish for quinolones and tetracyclines
with the respective equations (y = peak area, x = analyte concentration in μg.kg-1) and determination coefficients (R2)………………………………
132 IV.6 LC-MS/MS chromatogram of a real positive fish sample for enrofloxacin.. 137

10
LISTA DE SIGLAS E ABREVIATURAS
ADI - Acceptable daily intake AOAC - Association of Official Analytical Chemists ANOVA - Análise de variância ANVISA - Agência Nacional de Vigilância Sanitária APPI - Atmospheric pressure photoionization BPA - Boas Práticas Agropecuárias BPF - Boas Práticas de Fabricação CAP - Chloramphenicol CAP-Glu - Chloramphenicol glucuronide CCα - Decision limit CCβ - Detection capability CE - Collision energy CG - Cromatografia gasosa CL - Cromatografia líquida CLAE - Cromatografia líquida de alta eficiência CRL - Community Reference Laboratories CVM - Center for Veterinary Medicine CXP - Collision cell exit potential DAD - Diode array detector DHA - Ácido docosaexaenoico DLLME - Dispersive liquid-liquid microextraction DMFS - Dispersão da matriz em fase sólida DP - Declustering potential d-SPE - Dispersive solid-phase extraction ECD - Electron capture detector EIC - Extracted ion chromatogram ELISA - Enzyme-linked immunosorbent assay EM - Espectrometria de massas EMBRAPA - Empresa Brasileira de Pesquisa Agropecuária EMEA - Agência Europeia de Medicina EP - Entrance potential EPA - Ácido eicosapentaenóico ESI - Electrospray ionization EU - European Union FAO - Food and Agriculture Organization Fm - Fator de corte FDA - Food and Drug Administration FF - Florfenicol FFA - Florfenicol amine FLD - Fluorescence detector GC - Gas chromatography HFBA - Ácido heptafluorobutírico HPLC - High performance liquid chromatography HRMS - High resolution mass spectrometry IBGE - Instituto Brasileiro de Geografia e Estatística IUPAC - International Union of Pure and Applied Chemistry JECFA - Joint WHO/FAO Expert Committee on Food Additives LC - Liquid chromatography LD - Limite de detecção

11
LLE - Liquid-liquid extraction LMR - Limite máximo de resíduos LOD - Limit of detection LOQ - Limit of quantification MAPA - Ministério da Agricultura, Pecuária e Abastecimento MEPS - Microextraction by packed sorbent MIP - Molecularly imprinted polymer MPA - Ministério da Pesca e Aquicultura MRL - Maximum residue limits MRM - Multiple reaction monitoring MRPL - Minimum required performance limits MS - Mass spectrometry MS/MS - Tandem mass spectrometry MSPD - Matrix solid phase dispersion N - Number of samples n.a. - not applicable NCI - Electron-capture negative chemical ionization NI - Negative Ionization NOEL - No observed effect level OMS - Organização Mundial de Saúde PABA - Ácido para-aminobenzóico PNCRBC - Programa Nacional de Controle de Resíduos Biológicos em Carne PNCRC - Programa Nacional de Controle de Resíduos e Contaminantes PNCRCP - Programa Nacional de Controle de Resíduos e Contaminantes em Pescado PVDF - Fluoreto de polivinilideno QuEChERS - Quick, Easy, Cheap, Effective, Ruged and Safe SIF - Serviço de Inspeção Federal SLE - Solid-liquid extraction SPE - Solid-phase extraction SPR - Surface plasmon resonance STC - Screening target concentration TAP - Thiamphenicol TCA - Trichloroacetic acid TIC - Total Ion Chromatogram TOF - Time of flight Tv - Threshold value UE - União Europeia UHPLC - Ultra high pressure liquid chromatography UPLC - Ultra performance liquid chromatography UV - Ultraviolet detector VWD - Variable wavelength detector

12
RESUMO
RESUMO
O consumo de peixes no Brasil vem aumentando nos últimos anos,
especialmente devido à divulgação de que a sua ingestão pode trazer inúmeros
benefícios à saúde e também devido ao seu alto valor nutricional (proteínas de alto
valor biológico, teor elevado de ácidos graxos ômega-3). A qualidade, a inocuidade e a
segurança de peixes cultivados para alimentação humana constituem, portanto, tema
de saúde pública e devem ser monitoradas. No Brasil, há uma carência de informações
no que diz respeito ao uso de antimicrobianos destinados à aquicultura. Apesar de
apenas dois antibióticos serem permitidos para uso em aquicultura no Brasil, existe
uma grande diversidade de antibióticos que podem ser utilizados ilegalmente ou que
podem chegar aos peixes devido a contaminações do meio ambiente, principalmente
dos recursos hídricos. Este trabalho teve como objetivo geral desenvolver métodos de
análise multirresíduos de antimicrobianos em músculo de peixe e avaliar a qualidade
dos peixes cultivados nos Estados de Minas Gerais e do Pará no que diz respeito à
presença destes resíduos. Além disso, foi realizada uma extensa revisão da literatura
com relação aos métodos existentes de análise e à ocorrência de cloranfenicol
(antibiótico banido) e anfenicóis em alimentos. Foi validado um método de screening
por CL-EM/EM para análise de 40 antibióticos de seis classes diferentes
(aminoglicosídeos, beta-lactâmicos, macrolídeos, quinolonas, sulfonamidas e
tetraciclinas) em músculo de peixe. Apenas 15% das amostras (n=29) foram positivas
para enrofloxacina. Um método quantitativo por CL-EM/EM de análise de quinolonas e
tetraciclinas em músculo de peixe também foi otimizado e validado. A precisão, em
termos de desvio padrão relativo, foi abaixo de 20% para todos os analitos e as
recuperações variaram de 89,3% a 103,7%. CCα variou de 17,87 a 323,20 μg.kg-1 e
CCβ variou de 20,75 a 346,40 µg.kg-1. No geral, as amostras de peixe analisadas
apresentaram qualidade adequada quanto à presença de resíduos de antibióticos.
Todas as 29 amostras positivas para enrofloxacina continham teores abaixo do Limite
Máximo de Resíduo permitido pela legislação brasileira (100 µg.kg-1).
Palavras-chave: antibióticos, piscicultura, screening, quantitativo, multirresíduos, CL-
EM/EM.

13
ABSTRACT
ABSTRACT
The consumption of fish has increased in recent years in Brazil, especially due to
the announcement that their intake can bring numerous health benefits and also due to
its high nutritional value (high biological value protein, high content of omega-3 fatty
acids). The quality, safety and security of farmed fish for human consumption are
therefore a public health issue and must be monitored. In Brazil, there is a lack of
information regarding the use of antimicrobials in aquaculture. Although only two
antibiotics are allowed for use in aquaculture in Brazil, there is a wide variety of
antibiotics that may be used illegally or can reach the fish due to environmental
contaminations, mainly of water. The objective of this study was to develop multiresidue
methods of analysis of antibiotics in fish muscle and to evaluate the quality of fish from
Minas Gerais and Pará with respect to the presence of antibiotic residues. In addition,
an extensive literature review was conducted with respect to existing methods of
analysis and the occurrence of chloramphenicol (banned antibiotic) and amphenicols in
food. A LC-MS/MS screening method was validated for the analysis of 40 antibiotics of
six different classes (aminoglycosides, beta-lactams, macrolides, quinolones,
sulfonamides and tetracyclines) in fish muscle. Only 15% of the samples (n=29) were
positive for enrofloxacin. A quantitative LC-MS/MS method of analysis of quinolones
and tetracyclines in fish muscle was also optimized and validated. The precision, in
terms of the relative standard deviation, was under 20% for all of the compounds, and
the recoveries were between 89.3% and 103.7%. CCα varied from 17.87 to 323.20
μg.kg-1 and CCβ varied from 20.75 to 346.40 µg.kg-1. In general, real samples showed
good quality relative to the presence of antibiotic residues. All 29 positive samples for
enrofloxacin contained levels below the Maximum Residue Limit allowed by Brazilian
legislation (100 µg.kg-1).
Keywords: antibiotics, pisciculture, screening, quantitate, multiresidues, LC-MS/MS.

14
INTRODUÇÃO GERAL
INTRODUÇÃO GERAL
O peixe é um alimento que se destaca nutricionalmente devido ao fato de ser
fonte abundante de proteína de alto valor biológico, à presença de vitaminas (A, D, E e
complexo B) e minerais (cálcio, fósforo e ferro) e, principalmente, por ser fonte dos
ácidos graxos essenciais ômega-3 eicosapentaenoico (EPA) e docosaexaenoico
(DHA). Estudos têm demonstrado que o consumo frequente de alimentos ricos em
ácidos graxos ômega-3, presentes principalmente nos peixes, está associado a
redução dos riscos de doenças cardiovasculares, de alguns tipos de câncer, bem como
no tratamento de doenças inflamatórias como a artrite inflamatória (BAYLISS, 1996;
SARTORI & AMANCIO, 2012; FAO, 2015a).
A aquicultura vem se impondo mundialmente como atividade pecuária, sendo
um dos sistemas de produção de alimentos que mais cresce no mundo. A piscicultura
de água doce tem se mostrado promissora, principalmente no que diz respeito ao
cultivo de tilápias (WAGNER et al., 2004). O Brasil apresenta um grande potencial
natural para desenvolvimento da aquicultura. Além de mão-de-obra abundante e
crescente demanda por pescado, possui um território vasto, com mais de 2/3 ocupando
a região tropical, bacias hidrográficas privilegiadas e ricas, onde se destaca a bacia
amazônica responsável por 20% da água doce do mundo (PASCHOAL, 2007). O país
possui produção promissora de espécies exóticas como a tilápia (Oreochromis
niloticus) e nativas como o pacu (Piaractus mesapotamicus) e o tambaqui (Colossoma
macropomum) (QUESADA, 2012). Segundo dados da FAO (2015b), a aquicultura no
Brasil tem também se destacado nas exportações, com recente aumento para peixes
frescos, principalmente na forma de filés. Além disso, houve uma valorização do preço
de pescado exportado pelo Brasil, gerado diretamente pelas crescentes exportações de
preparações e conservas, filé de peixe, lagosta, polvo e de atuns e afins (SEAP, 2015).
A aquicultura, assim como todo sistema intensivo de produção animal, se
constitui em um ambiente que favorece a disseminação de doenças infecciosas, devido
à elevada densidade populacional e por ser em um ambiente aquático, o que favorece
a proliferação de micro-organismos. Eventuais alterações físico-químicas bruscas no
ambiente aquático e/ou práticas de manejo inadequadas afetam diretamente o estado
de saúde dos peixes. Além disto, várias bactérias patogênicas afligem a aquicultura,
dentre elas, destaca-se: Flavobacterium columnare, Aeromonas sp., Vibrio spp.,

15
INTRODUÇÃO GERAL
Streptococcus iniae, Streptococcus agalactiae, Edwardsiella tarda, Francisella sp.,
Pseudomonas fluorescens, Piscirickettsia salmonis, Plesiomonas shiguelloides, as
quais têm sido apontadas como os principais fatores limitadores da produtividade
(QUESADA, 2012).
Por isso, o uso de antibióticos na produção animal, inclusive na aquicultura, é
uma prática comum para prevenir e tratar doenças infecciosas e se faz necessário para
a garantia da exploração econômica viável da atividade. Entretanto, o uso inadequado
dessas substâncias pode levar ao aparecimento de resistência microbiana em
humanos, animais e também trazer impactos ao meio ambiente com a seleção de
bactérias mais resistentes a essas substâncias (GASTALHO et al., 2014).
Os antimicrobianos licenciados para uso em peixes no mundo, com algumas
exceções são: tetraciclina, oxitetraciclina, ácido oxolínico, flumequina, amoxicilina,
florfenicol, entre outros, sendo os dois primeiros os mais utilizados (WHO, 1998; FAO,
2005; EC, 2010a; CODEX, 2014; BRASIL, 2015). Em alguns países existem normas
quanto ao uso desses antibióticos na piscicultura, porém, nem sempre efetivamente
aplicadas; já em outros países, não existe sequer uma regulamentação (PASCHOAL,
2007). O cloranfenicol teve seu uso proibido em animais destinados à produção de
alimentos em diversos países devido aos sérios efeitos adversos que pode causar ao
homem (GUIDI et al., 2015). O florfenicol é um anfenicol eficaz no tratamento contra
bactérias em peixes e não apresenta os efeitos adversos do cloranfenicol, sendo, junto
à oxitetraciclina, um dos únicos antibióticos liberados para uso em aquicultura no Brasil
(SADEGHI & JAHANI, 2013; SINDAM, 2016). As quinolonas fazem parte de um grupo
de antimicrobianos de amplo uso nas medicinas humana e veterinária e existem
suspeitas de que estejam sendo utilizados de forma indevida na aquicultura.
Para exportar peixes para a União Europeia são exigidos certificados de testes
laboratoriais com a finalidade de constatar os níveis de metais pesados, antibióticos e
histamina aos exportadores de peixe fresco, substâncias estas relacionadas à
segurança do consumidor (SEAP, 2015). A necessidade de atender a essas exigências
sanitárias e de outros importantes mercados internacionais e assim evitar embargos à
exportação, além da preocupação também a nível nacional, determinou a
implementação do Plano Nacional de Controle de Resíduos e Contaminantes em
Pescado (PNCRC) pelo Ministério da Agricultura, Pecuária e Abastecimento (MAPA),
como uma política de proteção à saúde do consumidor no que diz respeito à presença
de resíduos nos produtos da pesca.

16
INTRODUÇÃO GERAL
Sendo assim, o monitoramento de resíduos de antimicrobianos em alimentos é
muito importante e visa, principalmente, a proteção do consumidor. Desta forma,
importantes órgãos como o Codex Alimentarius, Food and Drug Administration (FDA)
dos Estados Unidos, o MAPA e outros órgãos tem estabelecido Limites Máximos de
Resíduos (LMR) em diversos alimentos de origem animal. É importante ressaltar que
resíduos abaixo do valor do LMR são considerados como seguros. Além do ponto de
vista sanitário, preocupações do ponto de vista econômico são constantes, pois
sanções econômicas e barreiras alfandegárias podem inviabilizar a comercialização de
alimentos entre países (MOREIRA, 2012). Para atender a essas demandas, é
importante que sejam desenvolvidos métodos analíticos exatos, precisos e que tenham
sensibilidade para possibilitar a determinação de baixos níveis de resíduos de
antimicrobianos em peixe (em geral, µg.kg-1). A cromatografia líquida acoplada à
espectrometria de massas sequencial (CL-EM/EM) é uma excelente técnica para essa
finalidade, tendo sido aplicada por vários pesquisadores na análise de antimicrobianos
em alimentos (LOPES et al., 2011; SISMOTTO et al., 2014; DASENAKI & THOMAIDIS,
2015; FREITAS et al., 2015; JANK et al., 2015; MONTEIRO et al., 2015; REZK et al.,
2015; MARTINS et al., 2016; MORETTI et al., 2016).
Além disso, os laboratórios de rotina precisam fornecer resultados rápidos e
confiáveis para um grande número de amostras. Para esse fim, os métodos de triagem
são uma boa alternativa, já que são mais rápidos na emissão de laudos, pois os
resultados se baseiam na resposta conforme (concentração do analito menor que o
LMR) ou não conforme (concentração do analito maior que o LMR). Através da
determinação do fator de corte, pode-se avaliar se a amostra contém ou não o analito
em concentração superior ao LMR, ou seja, os métodos de triagem são
semiquantitativos. Como na grande maioria das vezes as amostras são conformes, os
laudos podem ser emitidos com maior rapidez. Diante do exposto, é importante
desenvolver métodos analíticos que sejam adequados para determinação de resíduos
de antimicrobianos em alimentos, bem como a necessidade de monitoramento do
pescado cultivado em pisciculturas do Brasil, como nos estados de Minas Gerais e do
Pará. Esses resultados poderão servir de apoio para avaliação da qualidade dos peixes
produzidos nesses Estados e como fonte para futuras ações públicas de
conscientização sobre o uso dessas substâncias.

17
REVISÃO DE LITERATURA
REVISÃO DE LITERATURA
1. A AQUICULTURA NO BRASIL
A produção e o consumo de peixes e outros pescados pela população brasileira
tem oscilado ao longo dos anos. A Figura 1 mostra a série histórica de estimativa
realizada pelo Instituto Brasileiro de Geografia e Estatística (IBGE). Observa-se um
consumo relativamente estável até 2005, quando o mesmo passa a crescer e atinge
9,8 kg/pessoa no ano de 2010 (MPA, 2010; OLIVEIRA, 2013). Esse aumento no
consumo de pescado, tanto marinho quanto continental, pode estar relacionado às
mudanças no hábito alimentar das populações e aos benefícios à saúde que o mesmo
apresenta (MV&Z, 2012).
Figura 1. Série histórica de consumo aparente per capita de pescados nacional, de
1996 a 2010. Fonte: MPA (2010).
A produção total de pescado nacional em 2011 foi de 1.431.974,4 toneladas,
representando um aumento de aproximadamente 13,2% em relação a 2010. A pesca
extrativa marinha foi a principal fonte de produção de pescado nacional, sendo
responsável por 38,7% do total, seguida pela aquicultura continental (38,0%), pesca
extrativa continental (17,4%) e aquicultura marinha (~6%) (MPA, 2011).
7,67,2
6,76,2
6,7 6,8 6,86,5 6,7 6,7
7,37,7
8,49
9,8
0
1
2
3
4
5
6
7
8
9
10
199619971998199920002001200220032004200520062007200820092010
Kg/h
abitante
Série histórica (em anos)

18
REVISÃO DE LITERATURA
Segundo o Ministério da Pesca e Aquicultura (MPA, 2015), a aquicultura é “o
cultivo de organismos cujo ciclo de vida, em condições naturais, se desenvolve total ou
parcialmente em meio aquático, equiparada à atividade agropecuária”. Dentre as
modalidades da aquicultura temos a piscicultura, que compreende a criação de peixes
em água doce ou marinha (MPA, 2015). As espécies mais comuns na atividade
aquícola por região do Brasil são: norte (tambaqui, pirarucu, pirapitinga e outras);
nordeste (tilápia e camarão marinho); centro-oeste (tambaqui, pacu e pintado); sudeste
(tilápia, pacu e pintado); sul (carpas, tilápia, jundiá, ostras e mexilhões (EMBRAPA,
2015).
O Brasil apresenta um grande potencial para o desenvolvimento da aquicultura
por possuir 8.400 quilômetros de costa marítima e 5,5 milhões de hectares em
reservatórios de água doce. Além da disponibilidade de recursos hídricos, possui
também clima favorável, disponibilidade de mão de obra e crescente demanda do
mercado interno, o que faz com que a aquicultura esteja presente em todos os estados
brasileiros (EMBRAPA, 2015).
A aquicultura é considerada pela Organização das Nações Unidas para
Alimentação e Agricultura (FAO) a maneira mais rápida de produzir proteína animal, o
que a torna indispensável para o combate à fome e suprimentos de alimentos em todo
o mundo (EMBRAPA, 2015). Segundo a Organização Mundial de Saúde (OMS), o
pescado é a proteína animal mais saudável e consumida no mundo. Os brasileiros
ultrapassaram o consumo mínimo de pescado recomendado pela OMS, que é de 12
quilos por habitante ao ano. No Brasil, o consumo chega a 14,50 quilos por
habitante/ano, de acordo com o levantamento feito em 2013 (MPA, 2015).
Segundo o Boletim Estatístico da Pesca e Aquicultura do MPA, no ano de 2011
a produção total da aquicultura nacional foi de 628.704,3 toneladas, representando
31,1% a mais em relação à produção de 2010. Quando se compara a produção atual
com o montante produzido em 2009 (415.649,0 toneladas), houve um aumento de
51,2% na produção durante o triênio 2009-2011, evidenciando o crescimento do setor
no país. A maior parcela da produção aquícola é oriunda da aquicultura continental, na
qual se destaca a piscicultura continental representando 86,6% da produção total
nacional. A produção aquícola de origem marinha, por sua vez, apesar de ter sofrido
uma redução na participação da produção aquícola total nacional em relação aos anos
anteriores (18,8% em 2009 contra 13,4% em 2011), vem se recuperando após uma
queda da produção verificada na primeira metade da década de 2000 (MPA, 2011).

19
REVISÃO DE LITERATURA
Ainda de acordo com o MPA foram produzidas em 2011 no Brasil 544.490
toneladas de peixes em água doce, sendo a tilápia (Oreochromis niloticus) a espécie
mais produzida, com 253.824 toneladas. As regiões Sul, Sudeste e Nordeste são as
responsáveis pela maior produção desta espécie. Os peixes redondos, mais
conhecidos como tambaquis (Colossoma macropomus), pacus (Piaractus
mesopotamicus), pirapitingas (Piaractus brachypomus) e seus híbridos são o segundo
grupo de peixes mais cultivado no Brasil. Em 2011, a produção deste grupo chegou a
206.776 toneladas e seu cultivo está mais concentrado nas regiões Centro Oeste e
Norte (MPA, 2011; PORTAL DO AGRONEGÓCIO, 2015).
Segundo dados do Instituto Brasileiro de Geografia e Estatística (IBGE), a
produção total da piscicultura brasileira, em 2013, foi de 392.493 toneladas. A Região
Centro-Oeste foi a principal produtora, com 105.010 toneladas de peixes (Figura 2). Em
seguida, ficaram as Regiões Sul (88.063 toneladas, Nordeste (76.393 toneladas), Norte
(72.969 toneladas) e Sudeste (50.058 toneladas) (IBGE, 2013).
Figura 2. Distribuição percentual da produção de peixes, por grandes regiões – 2013.
Fonte: IBGE (2013).
No ranking nacional da produção de peixes no ano de 2013, as cinco primeiras
posições foram ocupadas por um representante de cada grande região, estando o
estado de Mato Grosso na liderança, com 19,3% da despesca nacional, seguido do
Paraná (13%), Ceará (7,8%), São Paulo (6,8%) e Rondônia (6,4%). Os estados de
Minas Gerais (4%) e do Pará (1,3%) ficaram na 10ª e 19ª posições, respectivamente. A

20
REVISÃO DE LITERATURA
espécie mais criada foi a tilápia (43,1% da produção de peixes no Brasil), seguida pelo
tambaqui (22,6%) e pelo grupo tambacu e tambatinga (15,4%) (IBGE, 2013).
O crescimento da demanda nacional e também mundial pelo consumo de peixe,
associado ao esgotamento de produção em áreas na Europa e nos Estados Unidos,
tem feito a procura pelo alimento ser maior que a oferta. Apesar da grande capacidade
produtiva brasileira, 30% dos pescados consumidos vêm de fora, especialmente da
China e do Vietnã (EM, 2015).
1.1. O uso de antimicrobianos na piscicultura
Uma das principais ferramentas no controle e erradicação das enfermidades
infecciosas de origem bacteriana em animais de produção é o uso de antimicrobianos
(MARTIN & MORAGA, 1996).
Os antimicrobianos são empregados em medicina veterinária, na maioria das
vezes, para fins de tratamento, controle e prevenção. Porém, apesar de proibido no
Brasil e em vários outros países, alguns são usados com finalidade de ganho de peso.
Cerca de metade dos antibióticos empregados na produção animal são de uso
exclusivo em medicina veterinária e somente podem ser administrados depois de
aprovados por órgãos oficiais. Para aprovação de novos medicamentos veterinários
são feitos estudos quanto à dose, duração e carência do tratamento na espécie de
interesse (GRANJA, 2004).
Uma grande preocupação para o desenvolvimento da piscicultura é o
aparecimento de doenças infecciosas no sistema aquático, já que o controle
microbiano nesses ambientes é complexo devido à dificuldade na coleta dos resíduos
excretados pelos animais. Outra dificuldade se deve aos resíduos de ração que se
dissolvem ou permanecem em suspensão na água, contribuindo para um aumento da
matéria orgânica, diminuindo a qualidade da água e facilitando o desenvolvimento de
micro-organismos. Além disso, existe uma maior concentração de animais por unidade
de espaço quando comparados ao ambiente natural. Portanto, a aquicultura exige
cuidados com o ambiente de criação e o manejo dos animais para evitar potenciais
riscos e perdas na produção (TAVARES-DIAS et al., 2001; PASCHOAL, 2007;
ORLANDO, 2013).
O uso de substâncias antimicrobianas como medida terapêutica e/ou preventiva
dentro de um sistema de produção é uma das principais estratégias para o controle
deste problema. Mesmo com o desenvolvimento de medidas de prevenção de doenças

21
REVISÃO DE LITERATURA
através de melhorias no manejo e nas condições ambientais, o sistema intensivo de
produção animal ainda depende do uso de antimicrobianos, sendo especialmente
comum durante períodos em que os animais estão mais sujeitos a condições de
estresse, como por exemplo, mudanças na dieta, transporte, entre outros (PASCHOAL,
2007).
As vias mais comuns de administração dos antimicrobianos na aquicultura são
através do uso de ração contendo as substâncias (oral) e da adição direta dos
antimicrobianos à água (terapia de imersão), sendo a via oral a mais rentável e, por
isso a mais utilizada, misturando-se a dose apropriada do antimicrobiano à ração. A
terapia de imersão é mais utilizada quando a maioria dos peixes não está comendo ou
em casos de tratamento de infecções de pele, quando quantidades mais elevadas da
droga são necessárias para atingir o resultado desejado, em comparação com os
tratamentos orais (SAMANIDOU & EVAGGELOPOULOU, 2007; MONTEIRO, 2014).
Caso não seja respeitado o período de carência após a administração dos
antimicrobianos, podem ser encontrados resíduos dos mesmos em produtos da
aquicultura destinados à alimentação humana, podendo acarretar em riscos à saúde
dos seres humanos, como reações alérgicas, toxicidade, alterações da microbiota
intestinal e seleção de bactérias resistentes aos antimicrobianos (GIKAS et al., 2004;
MONTEIRO, 2014). Além disso, a ocorrência de resíduos de antimicrobianos em
peixes pode ser um problema para a exportação, o que acarretaria em perdas
econômicas para o Brasil.
Dentre os antibióticos mais utilizados mundialmente na aquicultura encontram-se
a tetraciclina, a oxitetraciclina, a flumequina, o ácido oxolínico e o florfenicol. No Brasil
apenas o florfenicol e a oxitetraciclina são licenciados pelo MAPA para uso na
aquicultura. Apesar disso, a utilização de antimicrobianos de forma inadequada e o uso
de medicamentos proibidos são uma realidade em diversos sistemas de produção
animal. Um exemplo é a enrofloxacina, uma fluoroquinolona desenvolvida para uso
exclusivo em medicina veterinária, que possui amplo espectro de ação contra uma
extensa classe de bactérias, incluindo aquelas resistentes à β-lactâmicos e
sulfonamidas. Sabe-se que a enrofloxacina é largamente utilizada na piscicultura para
o tratamento de doenças bacterianas em peixes, apesar de sua aplicação ser
considerada ilegal, pois a mesma ainda não possui uso regulamentado no Brasil para
organismos aquáticos (MOREIRA, 2012).
Diversos antibióticos foram banidos em vários países para uso em animais
destinados ao consumo humano (Tabela 1). De acordo com a Agência Europeia de

22
REVISÃO DE LITERATURA
Medicina (EMEA, 2000), alguns antibióticos não estão mais disponíveis para uso
veterinário, como indicado na Tabela 2.
Tabela 1. Antibióticos proibidos para uso em animais destinados ao consumo humano
Antibiótico País Razão
Espectinomicina Estados Unidos Desenvolve resistência bacteriana Enrofloxacina Estados Unidos Desenvolve resistência bacteriana (quinolona) Cloranfenicol Argentina, Canadá, União
Europeia, Japão, Estados Unidos, Brasil
Induz anemia aplástica em humanos
Rifampicina Sem registro nos Estados Unidos ou Canadá para uso em animais
Tumorgenicidade e teratogenicidade em animais experimentais
Fonte: Adaptado de FAO (2005).
Tabela 2. Antibióticos indisponíveis para uso com fins veterinários
Antibiótico Indicação Espécie Alternativas
Cefuroxima Tratamento de mastites clínicas, tratamento de infecções subclínicas
Bovino Existem inúmeros medicamentos para tratamento de mastite
Cloranfenicol Tratamento de infecções bacterianas (amplo espectro)
Bovinos, suínos e aves
Tianfenicol, Florfenicol, Amoxicilina
Sulfato de Polimixina B
Tratamento de mastite clínica causada por bactérias Gram (–)
Bovinos Existem inúmeros medicamentos disponíveis para tratamento de mastite desta natureza
Nistatina Tratamento de Candidíase Aves Natamicina
Fonte: Adaptado de FAO (2005).
A Tabela 3 apresenta os antibióticos utilizados na aquicultura em diversos
países. Entre os agentes antimicrobianos comumente utilizados, vários são
classificados pela Organização Mundial da Saúde (OMS) como criticamente
importantes para utilização em medicina humana e, por isso, o uso destes
medicamentos em animais destinados à produção de alimentos deve ser controlado ou
evitado a fim de prevenir a disseminação de resistência a antimicrobianos (Tabela 4).

23
REVISÃO DE LITERATURA
Tabela 3. Antibióticos usados na aquicultura em alguns países
País Antibiótico Indicação
Reino Unido Oxitetraciclina, ácido oxolínico, amoxicilina, cotrimazina (trimetoprima-sulfadiazina)
Não mencionada
Noruega Benzilpenicilina + diidroestreptomicina, florfenicol, flumequina, ácido oxolínico, oxitetraciclina, cotrimazina
Não mencionada
Estados Unidos (aprovados pelo FDA)
Sulfadimetoxina e ormetoprima
Controle de furunculose (Aeromonas salmonicida) em salmonídeos. Controle de septicemia entérica (Edwadsiellla icttaluri) em peixe-gato
Estados Unidos (aprovados pelo FDA)
Oxitetraciclina Controle de furunculoses, septicemia hemorrágica bacterial e Pseudomonas em salmonídeos Controle de septicemia hemorrágica bacteriana em peixe-gato
México Enrofloxacina, oxitetraciclina Não mencionada Brasil Oxitetraciclina, florfenicol Não mencionada
Fonte: Adaptado de FAO (2005).
Tabela 4. Principais agentes antimicrobianos utilizados em aquicultura e a sua
importância na medicina humana
Agente antimicrobiano (classe de antibiótico)
Importância da classe (medicina humana)
Amoxicilina (penicilinas) Elevada
Ampicilina (penicilinas) Elevada
Cloranfenicol (anfenicóis) Importante
Florfenicol (anfenicóis) Importante
Eritromicina (macrolídeos) Elevada
Estreptomicina, neomicina (aminoglicosídeos) Elevada
Furazolidona (nitrofuranos) Importante
Nitrofurantoína (nitrofuranos) Importante
Ácido oxolínico (quinolonas) Elevada
Enrofloxacina (fluoroquinolonas) Elevada
Flumequina (fluoroquinolonas) Elevada
Oxitetraciclina, clortetraciclina, tetraciclina (tetraciclinas) Muito importante
Sulfonamidas Importante
Fonte: Adaptado de GASTALHO et al. (2014).
2. ANTIMICROBIANOS
Segundo ZELENY et al. (2006), “medicamento veterinário é qualquer substância
aplicada ou administrada a qualquer animal produtor de alimentos, com fins
terapêuticos, profiláticos ou de diagnóstico, ou para modificar as funções fisiológicas,
de comportamento ou como promotor de crescimento”.

24
REVISÃO DE LITERATURA
Os antibióticos surgiram na década de 50 e contribuíram de forma importante
para a redução do número de pessoas que sofriam ou morriam de enfermidades
causadas por infecções bacterianas, pois são substâncias que inibem o crescimento de
bactérias e de micro-organismos, interferindo em funções metabólicas essenciais
(GRANJA, 2004). Devido à eficácia na prática terapêutica humana foram também
introduzidos no tratamento veterinário (GUSTAFSON, 1991).
Os antimicrobianos são uma das melhores ferramentas no controle e
erradicação das enfermidades infecciosas de origem bacteriana em animais de
produção (MARTIN & MORAGA, 1996). Dentre as vias de administração aos animais,
as principais são: intramuscular, intravenosa, subcutânea, oral e infusões intramamária
e intrauterina (MITCHELL et al., 1998; MCEVOY et al., 2000).
Quase metade dos antibióticos empregados na produção animal são de uso
exclusivo em medicina veterinária e devem ser aprovados por órgãos oficiais antes de
serem usados. Essa aprovação depende da apresentação de resultados de estudos
quanto à dose, duração e carência do tratamento na espécie de interesse (GRANJA,
2004).
Devido às práticas veterinárias e à criação intensiva é praticamente inevitável o
surgimento de doenças nos animais criados para produção de alimentos, podendo
trazer potenciais perdas econômicas. Por isso, a grande maioria desses animais
recebe algum tipo de medicação para o tratamento de doenças infecciosas.
Paralelamente à introdução de antibióticos na prática veterinária, vários pesquisadores
começaram a investigar os efeitos adversos que a presença desses fármacos nos
produtos destinados ao consumo humano poderia provocar (FAGHIHI, 1990;
QUESADA, 2012).
2.1. Aspectos toxicológicos
O uso indiscriminado de drogas veterinárias, especialmente de antibióticos, em
animais destinados à produção de alimentos representa um perigo potencial para a
saúde humana, podendo levar a um aumento da resistência bacteriana e ao
aparecimento de reações alérgicas aos antibióticos (GIKAS et al., 2004).
O aumento da resistência bacteriana pela ação de antibióticos se dá de forma
indireta, ou seja, estes, na verdade, selecionam os micro-organismos previamente
resistentes da microbiota. Limites Máximos de Resíduos são fixados para os
antibióticos com base em estudos toxicológicos. Entretanto, mesmo abaixo do LMR,

25
REVISÃO DE LITERATURA
estes resíduos podem ainda ter atuação sobre as bactérias, podendo modificar a
microbiota intestinal dos consumidores, fato esse que pode levar à uma redução do
LMR estabelecido (FRANCO et al., 1990; WHITE et al., 1993; MITCHELL et al., 1998).
O consumo de alimentos contendo resíduos de antibióticos pode também, em
casos mais sérios, levar a quadros patológicos como a anemia aplástica causada por
cloranfenicol, que é um antibiótico de uso proibido em animais para produção de
alimentos. Além disso, esses resíduos podem também causar efeitos de sensibilização
em consumidores (MILHAUD & PERSON, 1981; COSTA, 1996; MARTIN & MORAGA,
1996). Diversos países, entre eles os Estados Unidos, o Canadá, o Brasil e a União
Europeia, proibiram ou restringiram o emprego de cloranfenicol em animais destinados
ao consumo humano, principalmente devido ao fato de que a frequência da aparição
dos sintomas de anemia aplástica não é dose-dependente, ou seja, qualquer dose
ingerida da substância pode levar ao aparecimento da doença, além de a mesma se
manifestar especialmente em indivíduos expostos à droga em mais de uma ocasião
(STTEPANI, 1984; BRITO, 2000).
O uso de antibióticos em animais destinados ao consumo humano está a cada
dia sendo mais controlado e monitorado por meio do controle das matérias-primas, dos
intermediários, dos princípios ativos das drogas e também pelo controle dos resíduos
que as drogas veterinárias podem deixar nos alimentos. Diversos países estão exigindo
um programa de monitoramento de resíduos eficiente de seus exportadores e a
comprovação, através de análises laboratoriais, de que os produtos estejam livres de
contaminação por resíduos de antibióticos, entre outras substâncias. Caso não sejam
atendidas as exigências, poderão surgir barreiras não tarifárias ao comércio dos
produtos (GRANJA, 2004).
2.2. Aminoglicosídeos
Aminoglicosídeos (AG) são moléculas hidrofílicas constituídas por dois ou mais
aminoaçúcares unidos por ligação glicosídica à hexose ou aminociclitol (Tabela 5).
Estes inibem o crescimento de algumas bactérias gram-positvas e diversas gram-
negativas aeróbicas e são substâncias de caráter básico, catiônicas e fortemente
polares, sendo insolúveis em lipídeos (SANTOS, 2014; ARSAND, 2015).
A estreptomicina foi o primeiro AG descoberto, em 1944, durante a pesquisa de
compostos solúveis em água e ativos estáveis contra bactérias gram-negativas a partir

26
REVISÃO DE LITERATURA
de culturas de Streptomyces griseus e representou um grande avanço na medicina, já
que esses compostos apresentavam atividade anti-tuberculose (MEJÍA, 2013).
Tabela 5. Informações químicas de alguns aminoglicosídeos
Analito, fórmula molecular e
massa molar
Formula estrutural
Amicacina
C22H43N5O13
585,53 g.mol-1
Apramicina
C21H41N5O11
539,58 g.mol-1
Canamicina
C18H36N4O11
484,50 g.mol-1
Diidroestreptomicina
C21H41N7O12
583,59 g.mol-1
Espectinomicina
C14H24N2O7
332,35 g.mol-1
Estreptomicina
C21H39N7O12
581,57 g.mol-1
Gentamicina
C21H43N5O7
477,60 g.mol-1
Higromicina
C20H37N3O13
527,53 g.mol-1
Neomicina
C23H46N6O13
614,64 g.mol-1
Paramomicina
C23H47N5O18S
615,63 g.mol-1
Tobramicina
C18H37N5O9
467,52 g.mol-1

27
REVISÃO DE LITERATURA
Os aminoglicosídeos são amplamente usados em animais de produção para o
tratamento de infecções bacterianas ou promoção do crescimento, sendo suas doses
terapêuticas próximas às tóxicas. Isto se deve ao baixo custo de produção, boa
estabilidade química, baixo índice de reações alérgicas e, também, ao fato de ser uma
das poucas classes de antimicrobianos que ainda possuem atividade contra a grande
maioria das estirpes de resistência múltipla. O principal uso é na terapia de infecções,
tais como a septicemia, infecções do trato respiratório e urinário, meningites em recém-
nascidos, infecções oculares e infecção intra-abdominal causadas por bacilos
aeróbicos gram-negativos (MEJÍA, 2013; SANTOS, 2014).
Os aminoglicosídeos mais usados em medicina veterinária são neomicina,
gentamicina e estreptomicina. A apramicina e a diidroestreptomicina são de uso
apenas veterinário, enquanto os demais aminoglicosídeos também são utilizados em
humanos (ARSAND, 2015). Devido aos efeitos adversos como nefrotoxicidade e
ototoxicidade e possibilidade de bloqueio neuromuscular, o uso de AG em animais
destinados à produção de alimentos é limitado (MEJÍA, 2013).
2.3. Anfenicóis
O cloranfenicol (CAP) é um antibiótico de largo espectro da classe dos
anfenicóis com excelentes propriedades antibacteriana e farmacocinética (OLIVEIRA et
al., 2007). Ele foi isolado em 1947 de Streptomyces venezuelae e tem sido utilizado
desde 1950 para combater infecções em humanos (GIKAS et al., 2004). O CAP pode
também ser produzido por síntese química (BOTSOUGLOU & FLETOURIS, 2001).
O tianfenicol (TAP) e o florfenicol (FF) são análogos ao cloranfenicol, diferindo
pela presença de um grupo metilsulfônico no anel benzênico, enquanto o cloranfenicol
apresenta um grupo nitroso (Tabela 6). Em relação à estrutura química, o florfenicol é
derivado da molécula do tianfenicol e possui um maior espectro de ação devido à
substituição do grupo hidroxila do carbono 3 por um átomo de flúor e pela substituição
do grupo para-nitro por um radical metilsulfônico, o que faz com que diminua a
possibilidade do aparecimento de anemia aplástica. A presença de um átomo de flúor
na molécula do florfenicol impede a acetilação mediada pela enzima, fazendo com que
cepas bacterianas resistentes ao cloranfenicol e ao tianfenicol se tornem sensíveis ao
florfenicol (HIRD & KNIFTON, 1986). A alteração na estrutura química do tianfenicol e
florfenicol diminui a possibilidade do aparecimento de anemia aplástica (CUNHA,
2009).

28
REVISÃO DE LITERATURA
Tabela 6. Informações químicas dos anfenicóis
Analito, fórmula molecular e massa molar
Formula estrutural
Florfenicol C12H14Cl2FNO4S 358,21 g.mol-1
Cloranfenicol C11H12Cl2N2O5 323,13 g.mol-1
Tianfenicol C12H15Cl2NO5S 356,22 g.mol-1
Os anfenicóis são antibióticos bacteriostáticos e, por isso, inibem a síntese
proteica dos micro-organismos sensíveis. Eles se ligam à subunidade 50S e interferem
na formação do peptídeo ao bloquearem a enzima peptidiltransferase e impedirem o
alongamento da cadeia polipeptídica (SPINOSA et al., 1999). O cloranfenicol atua
principalmente sobre a medula óssea afetando o sistema hematopoiético. Os efeitos
podem ser dose-dependentes - anemia, eucopenia e trombocitopenia – ou uma
resposta idiossincrática manifestada pela anemia aplástica, levando muitas vezes à
pancitopenia fatal. Um efeito adverso que pode ser causado pelos anfenicóis é a
chamada síndrome do bebê cinzento em recém-nascidos, especialmente em
prematuros, quando expostos à quantidade excessiva dos medicamentos. Os sintomas
são acidose metabólica, respiração irregular e rápida e fezes líquidas de coloração
esverdeada nas primeiras 24 horas (JECFA, 1999, CUNHA, 2009).
2.4. Beta-lactâmicos
Beta-lactâmicos (Tabela 7) são antibióticos que possuem em sua estrutura um
anel azetidiona de quatro membros. Várias classes de compostos são consideradas
como beta-lactâmicos, como as monobactamas, as cefalosporinas e as penicilinas. As
monobactamas possuem o anel azetidiona sozinho e exibem atividade antibiótica. Já
as penicilinas e as cefalosporinas possuem, ligado a este anel, um anel adicional de
cinco membros e um anel de seis membros, respectivamente (MOREIRA, 2012). Eles
possuem amplo espectro de atividade antibacteriana e eficácia clínica (GUIMARÃES et
al., 2010). Os beta-lactâmicos foram os primeiros derivados de produtos naturais
utilizados no tratamento terapêutico de infecções bacterianas, como é o caso da

29
REVISÃO DE LITERATURA
penicilina, que ainda hoje, após várias décadas de sua descoberta, ainda contém os
agentes mais comumente utilizados (GUIMARÃES et al., 2010).
O mecanismo de ação se dá através da inibição irreversível da enzima
transpeptidase, que catalisa a reação de transpeptidação entre as cadeias de
peptideoglicana da parede celular bacteriana. A transpeptidase age levando à
formação de ligações cruzadas entre as cadeias peptídicas da estrutura
peptideoglicana, que conferem à parede celular uma estrutura rígida importante para a
proteção da célula bacteriana contra as variações osmóticas do meio (GUIMARÃES et
al, 2010; MOREIRA, 2012).
Tabela 7. Informações químicas de alguns beta-lactâmicos
Analito, fórmula molecular e
massa molar
Formula estrutural
Ampicilina
C16H19N3O4S
349,42 g.mol-1
Benzatina
C16H20N2
240,34 g.mol-1
Cefazolina
C14H14N8O4S3
454,50 g.mol-1
Cloxacilina
C19H18ClN3O5S
435,88 g.mol-1
Naficilina
C21H22N2O5S
414,48 g.mol-1
Oxacilina
C19H19N3O5S
401,44 g.mol-1
Penicilina G
C16H18N2O4S
334,40 g.mol-1
Penicilina V
C16H18N2O5S
350,39 g.mol-1

30
REVISÃO DE LITERATURA
2.5. Macrolídeos
Os macrolídeos (Tabela 8) são a segunda classe antibacteriana mais importante
usada no tratamento humano depois dos beta-lactâmicos, utilizados principalmente em
pacientes que são alérgicos às penicilinas (MINETTO, 2013).
Tabela 8. Informações químicas de alguns macrolídeos
Analito, fórmula molecular e
massa molar
Formula estrutural
Clindamicina
C18H33ClN2O5S
424,98 g.mol-1
Eritromicina
C37H67NO13
733,92 g.mol-1
Espiramicina
C43H74N2O14
843,05 g.mol-1
Lincomicina
C18H34N2O6S
406,54 g.mol-1
Tilmicosina
C46H80N2O13
869,15 g.mol-1
Tilosina
C46H77NO17
916,10 g.mol-1
Virginiamicina
C43H49N7O10
823,90 g.mol-1
Eles são moléculas lipofílicas compostas por anel de lactona com 14, 15 ou 16
carbonos, ao qual se ligam um ou mais desoxi-glicóis. Em geral, os macrolídeos
apresentam pKa entre 7,1 e 9,9 e alguns são sensíveis a baixo pH e sofrem
degradação em condições ácidas. Os macrolídeos são produzidos por várias cepas de

31
REVISÃO DE LITERATURA
Streptomyces e utilizados na prática veterinária contra bactérias gram-positivas, mas
também em seres humanos contra várias doenças infecciosas (MOREIRA, 2012;
SISMOTTO et al., 2013).
Esta classe de antibióticos possui ação bactericida ou bacteriostática,
dependendo da concentração, da fase e do tipo de micro-organismos e se ligam de
forma reversível à porção 50S do ribossomo, inibindo a síntese proteica e atuando
sobre a translocação (MOREIRA, 2012).
A eritromicina é um dos macrolídeos mais importantes e é produzida por uma
cepa do Streptomyces erythaeus através de fermentação. A tilosina é produzida pelo
Streptomyces fradiae e é ativa contra algumas bactérias Gram-positivas, Gram-
negativas e micoplasmas Gram-positivos, com uso exclusivamente na medicina
veterinária. Já a tilmicosina é um macrolídeo semissintético derivado da tilosina e
apresenta espectro de ação similar a esta (SISMOTTO et al., 2013).
2.6. Quinolonas
Quinolonas e fluoroquinolonas (Tabela 9) são substâncias antibacterianas
sintéticas pertencentes a um grupo de antibióticos derivados do ácido nalidíxico. Os
compostos foram inicialmente aplicados no tratamento de infecções do trato urinário,
mas agora tem uma aplicação de amplo espectro para o tratamento de doenças
humanas e veterinárias (MARKMAN et al., 2005; MOREIRA, 2012).
As quinolonas inibem a duplicação e a transcrição do DNA, fazendo com que a
síntese proteica não aconteça, tendo, portanto, efeito bactericida (MOREIRA, 2012). De
uma forma geral, as quinolonas são classificadas em quatro gerações. As quinolonas
originais como, por exemplo, ácido nalidíxico, ácido oxolínico, ácido pipemídico e
cinoxacina são de primeira geração. Estas possuem baixa biodisponibilidade oral,
distribuição limitada nos tecidos e limitado espectro de ação, restringindo-se a
Escherichia coli e alguns organismos gram-negativos (CARRILLO, 2008).

32
REVISÃO DE LITERATURA
Tabela 9. Informações químicas de algumas quinolonas
Analito, fórmula molecular e
massa molar
Formula estrutural
Ácido nalidíxico
C12H12N2O3
232,24 g.mol-1
Ácido oxolínico
C13H11NO5
261,23 g.mol-1
Ciprofloxacina
C17H18FN3O3
331,35 g.mol-1
Danofloxacina
C19H20FN3O3
357,37 g.mol-1
Difloxacina
C21H19F2N3O3
399,39 g.mol-1
Enrofloxacina
C19H22FN3O3
359,40 g.mol-1
Flumequina
C14H12FNO3
261,26 g.mol-1
Marbofloxacina
C17H19FN4O4
362,37 g.mol-1
Norfloxacina
C16H18FN3O3
319,33 g.mol-1
Sarafloxacina
C20H17F2N3O3
385,36 g.mol-1

33
REVISÃO DE LITERATURA
A segunda geração de quinolonas apresenta um aumento da atividade
antibacteriana contra Enterobacteriaceae e bactérias gram-negativas e gram-positivas.
As fluoroquinolonas (FQs) derivam das quinolonas de 1ª geração e a adição de um
átomo de flúor na posição 6 e do grupo piperazil na posição 7 nas fluoroquinolonas
aumenta a potência e o espectro antimicrobiano com relação às quinolonas de 1ª
geração; inclusive para bactérias resistentes (CENTENO, 2010). São quinolonas de
segunda geração: norfloxacina (NOR), ciprofloxacina (CIP), enrofloxacina (ENR),
danofloxacina, difloxacina e marbofloxacina, entre outras (CARRILLO, 2008).
A NOR foi a primeira FQ que surgiu e também a primeira a ser utilizada como
antibiótico em medicina humana. Ela é utilizada em tratamentos de doenças
respiratórias, biliares e infecções do trato urinário e apresenta boa distribuição nos
tecidos e boa disponibilidade após administração. A enrofloxacina é a FQ mais utilizada
em medicina veterinária e surgiu no mercado em 1988. Ela possui grande atividade
antibacteriana e bactericida contra bactérias patogênicas encontradas em animais e
abrange a maioria dos gram-negativos e muitos gram-positivos. Além disso, a
enrofloxacina apresenta uma boa capacidade de penetração em fluidos e tecidos e tem
sido utilizada em medicina veterinária em cães, gatos, bovinos, suínos e aves. A
ciprofloxacina é um dos principais metabólitos da enrofloxacina e é amplamente usada
na medicina humana, sendo proibido o seu uso em animais. Ela foi introduzida no
mercado em 1987 e possui amplo espectro de atividade antibacteriana, boa
biodisponibilidade após administração e boa distribuição nos tecidos (GOMES, 2013).
A terceira geração de quinolonas mantém as características favoráveis da
segunda geração, entretanto há um aumento da atividade contra bactérias gram-
positivas, anaeróbias e micobactérias. As quinolonas deste grupo apresentam
excelente biodisponibilidade oral, tempo de semivida prolongado e menor toxicidade
sobre o sistema nervoso central. Levofloxacina, grepafloxacina e sparfloxacina são
exemplos de quinolonas de terceira geração (CARRILLO, 2008).
A quarta geração de quinolonas mantém o bom espectro de ação contra
bactérias gram-negativas, gram-positivas e melhora a sua ação contra os anaeróbios.
Dentre as quinolonas de quarta geração temos trovafloxacina, moxifloxacina e
gatifloxacina, entre outras (GOMES, 2013).

34
REVISÃO DE LITERATURA
2.7. Tetraciclinas
As tetraciclinas (Tabela 10) são antibióticos de amplo espectro de ação, baixa
toxicidade e baixo custo produzidos por diversas espécies de Streptomyces spp, sendo
também algumas semissintéticas. Na maioria dos casos, podem ser administradas por
via oral. Estas têm sido utilizadas indiscriminadamente, o que tem levado ao
aparecimento de resistência em um grupo variado de bactérias, principalmente às
tetraciclinas de primeira geração, descobertas no período compreendido entre 1950 e
1970. O uso indiscriminado tem provocado restrições na utilidade clínica destes
compostos, mas ainda são bastante úteis na clínica médica e têm sido usadas no
tratamento de diversos tipos de infecções. As tetraciclinas são também muito utilizadas
no tratamento de infecções e na promoção do crescimento em animais, inclusive nos
produtores de alimentos (PEREIRA-MAIA et al., 2010).
Tabela 10. Informações químicas de algumas tetraciclinas
Analito, fórmula molecular e massa molar
Formula estrutural
Clortetraciclina C22H23N2ClO8
478,88 g.mol-1
Doxiciclina C22H24N2O8
444,40 g.mol-1
Oxitetraciclina C22H24N2O9
460,43 g.mol-1
Tetraciclina C22H24N2O8
478,88 g.mol-1

35
REVISÃO DE LITERATURA
O mecanismo de ação das tetraciclinas ocorre através da ligação a um sítio na
subunidade 30S do ribossomo bacteriano, que impede a ligação do aminoacil-t-RNA no
sítio A do ribossomo, a adição de aminoácidos e, consequentemente, impedindo a
síntese proteica (PEREIRA-MAIA et al., 2010; MEDLEY, 2012).
Tetraciclinas são considerados fármacos seguros por não apresentarem efeitos
colaterais severos. Geralmente, os efeitos colaterais mais comuns são náuseas,
vômitos e diarreia. Como as tetraciclinas são depositadas nos ossos e dentes durante a
calcificação, seu uso pode levar a uma descoloração dos dentes e a uma inibição do
crescimento ósseo em crianças, fato que restringe a administração dessas drogas a
mulheres grávidas e crianças em fase de crescimento (PEREIRA-MAIA et al., 2010).
2.8. Sulfonamidas
As sulfonamidas (Tabela 11), também conhecidas como sulfas, foram testadas
pela primeira vez nos anos 1930 como fármacos antibacterianos e fazem parte de um
importante grupo de antimicrobianos sintéticos, que têm sido usados efetivamente no
combate às infecções bacterianas e também na prática veterinária para promover o
crescimento animal. Embora estes compostos possam ser utilizados na medicina
humana contra uma grande variedade de micro-organismos, seu principal uso é
destinado ao tratamento de infecções do trato urinário. O sulfametoxazol, em
associação com o trimetoprima, é utilizado para o tratamento de pacientes com
infecções no trato urinário e também para pacientes portadores do vírus HIV que
apresentam infecções por Pneumocystis carinii (GUIMARÃES et al., 2010).
O termo sulfonamida é utilizado para referir-se aos derivados do para-
aminobenzeno-sulfonamida (sulfanilamida). As sulfas são análogos estruturais e
antagonistas competitivos do ácido para-aminobenzoico (PABA) e impedem a sua
utilização pelas bactérias na síntese do ácido fólico ou vitamina B9. Mais
especificamente, as sulfonamidas são inibidores competitivos da di-hidropteroato-
sintetase, a enzima bacteriana responsável pela incorporação do PABA no ácido di-
hidropteroico, precursor imediato do ácido fólico. Os micro-organismos sensíveis são
aqueles que precisam sintetizar seu próprio ácido fólico; as bactérias capazes de
utilizar o folato pré-formado não são afetadas (SANTOS et al., 2011).

36
REVISÃO DE LITERATURA
Tabela 11. Informações químicas de algumas sulfonamidas
Analito, fórmula molecular e massa
molar
Formula estrutural
Sulfacetamida
C8H10N2O3S
214,24 g.mol-1
Sulfaclorpiridazina
C10H9ClN4O2S
284,74 g.mol-1
Sulfadiazina
C10H10N4O2S
250,28 g.mol-1
Sulfadimetoxina
C12H14N4O4S
310,33 g.mol-1
Sulfadoxina
C12H14N4O4S
310,33 g.mol-1
Sulfafenazol
C15H14N4O2S
314,36 g.mol-1
Sulfaguanidina
C7H10N4O2S
214,24 g.mol-1
Sulfamerazina
C11H12N4O2S
264,31 g.mol-1
Sulfametazina
C12H14N4O2S
278,32 g.mol-1
Sulfametizol
C9H10N4O2S
270,33 g.mol-1
Sulfametoxazol
C10H11N3O3S
253,31 g.mol-1

37
REVISÃO DE LITERATURA
Tabela 11. (continuação...)
Analito, fórmula molecular e massa
molar
Formula estrutural
Sulfametoxipiridazina
C11H12N4O3S
280,32 g.mol-1
Sulfanilamida
C6H8N2O2S
172,21 g.mol-1
Sulfaquinoxalina
C14H12N4O2S
300,37 g.mol-1
Sulfisoxazol
C11H13N3O3S
267,30 g.mol-1
Sulfatiazol
C9H9N3O2S2
255,32 g.mol-1
As sulfonamidas são amplamente usadas para fins profiláticos e terapêuticos em
animais produtores de alimento, podendo também atuar como substâncias promotoras
do crescimento. Entretanto, elas possuem caráter carcinogênico e podem levar ao
desenvolvimento de resistência aos antibióticos nos seres humanos. Portanto, resíduos
destes compostos em alimentos são motivo de preocupação para as autoridades
sanitárias (MOREIRA, 2012).
3. OCORRÊNCIA DE RESÍDUOS DE ANTIMICROBIANOS EM PEIXE
O uso indiscriminado e incorreto de antimicrobianos para tratamento de animais,
bem como o não cumprimento do período de carência são motivos pelos quais pode-se
encontrar resíduos de antimicrobianos em alimentos de origem animal.
Internacionalmente, existem alguns estudos sobre a ocorrência de resíduos de
antimicrobianos em peixes, principalmente na Grécia e na Espanha. DASENAKI &
THOMAIDIS (2015) encontraram duas quinolonas - flumequina (4,6 µg.kg-1) e
enrofloxacina (4,8 µg.kg-1) em amostras de dourado e robalo da Grécia. Já
EVAGGELOPOULOU & SAMANIDOU (2013a e 2013b) analisaram 20 amostras de

38
REVISÃO DE LITERATURA
dourado do mercado da Grécia quanto à presença de ampicilina, penicilina G,
penicilina V, oxacilina, cloxacilina, dicloxacilina, tianfenicol, florfenicol e cloranfenicol e
10 amostras de salmão quanto à presença de resíduos de sete quinolonas
(ciprofloxacina, danofloxacina, enrofloxacina, sarafloxacina, ácido oxolínico, ácido
nalidíxico e flumequina) e não encontraram nenhuma amostra positiva.
Vários trabalhos analisaram resíduos de antimicrobianos em peixes da Espanha.
BERRADA et al. (2008) analisaram 6 amostras de truta e dourado quanto à presença
de macrolídeos e três amostras de dourado foram positivas para eritromicina A (58-87
µg.kg-1). COSTI et al. (2010) analisaram peixes de aquicultura (salmão, truta, robalo,
dourado entre outros) quanto à presença de flumequina e de ácido oxolínico e não
encontraram amostras positivas para flumequina; apenas uma amostra foi positiva para
ácido oxolínico (37 ± 2 µg.kg-1). DORIVAL-GARCÍA et al. (2015) analisaram oito
amostras de peixe quanto à presença de 17 quinolonas. Apenas seis dos antibióticos
estudados não foram encontrados nas amostras. Os antibióticos encontrados em
maiores concentrações em todas as amostras foram ciprofloxacina (836 ng.g-1),
ofloxacina (719 ng.g-1) e enrofloxacina (674 ng.g-1). Já RAMBLA-ALEGRE et al. (2010)
analisaram a ocorrência de quinolonas em vários tipos de peixe e não encontraram
nenhuma amostra positiva. No estudo de MENDOZA et al. (2012) foram analisadas 107
amostras de bagres. Dezesseis amostras foram positivas no método microbiológico de
detecção de antibióticos e analisadas por CL-EM/EM. Os antibióticos que
predominaram nas amostras positivas foram as tetraciclinas (especialmente tetraciclina
– 3,9 a 80,8 µg.kg-1 – e oxitetraciclina – 6,4 a 8,2 µg.kg-1). Foram encontradas três
sulfonamidas nas amostras positivas, sendo a sulfadimetoxina a predominante. Todos
os antibióticos estavam em concentrações abaixo do LMR estabelecido pela União
Europeia.
No Brasil, poucos estudos de ocorrência de antimicrobianos em peixes
brasileiros foram encontrados na literatura e, com exceção de um trabalho, todos
analisaram peixes oriundos do Estado de São Paulo, Brasil. Portanto, não existem
informações acerca da ocorrência de antimicrobianos em peixes dos Estados de Minas
Gerais e do Pará.
ORLANDO (2013) analisou 26 amostras de tilápia do estado de São Paulo e
encontrou apenas uma amostra com resíduos de oxitetraciclina numa concentração de
42 ± 8,4 ng.g-1. SISMOTTO et al. (2014) analisaram 20 amostras de tilápia do mercado
do Estado de São Paulo quanto à presença de resíduos de macrolídeos e não
encontraram amostras com níveis detectáveis dos antibióticos. QUESADA (2012)

39
REVISÃO DE LITERATURA
analisou 31 amostras de peixes frescos (pacu e tilápia) do Estado de São Paulo quanto
à presença de fluoroquinolonas e nenhuma delas apresentou resultado positivo.
MONTEIRO et al. (2015) analisaram 12 antibióticos (cloranfenicol, florfenicol,
oxitetraciclina, tetraciclina, clortetraciclina, sulfadimetoxina, sulfatiazol, sulfametazina,
enrofloxacina, ciprofloxacina, norfloxacina e sarafloxacina) em 36 amostras de tilápia
do Estado de São Paulo. Oxitetraciclina, tetraciclina e florfenicol foram encontrados nas
amostras. Oxitetraciclina foi a molécula mais detectada (9 amostras; 15,6 – 1231.8
µg.kg-1) e algumas amostras apresentaram concentração acima do LMR da União
Europeia (EMEA, 2013), 100 µg.kg-1, e também acima do valor de referência adotado
pelo governo brasileiro (BRASIL, 2015), 200 µg.kg-1. Tetraciclina e florfenicol foram
detectados em três amostras (521,2 - 528,0 µg.kg-1) em valores abaixo de LMR fixado
pelos governos europeu e brasileiro (BRASIL, 2015; EMEA, 2015). BARRETO et al.
(2012) analisaram 21 amostras de peixes obtidas do Serviço de Inspeção Federal e
não encontraram resíduos de cloranfenicol em nenhuma das amostras.
Anualmente, o MAPA publica os resultados do Plano Nacional de Controle de
Resíduos e Contaminantes (PNCRC) em alimentos de origem animal. Do ano de 2006
até o ano de 2014, 100% das amostras de peixe (geralmente de 60 a 75 amostras) de
cultivo, analisadas de diversas regiões do Brasil, estavam em conformidade com a
legislação vigente para os contaminantes analisados (ácido oxolínico; difloxacina;
flumequina; ácido nalidíxico; sarafloxacina; ciprofloxacina; enrofloxacina; florfenicol;
cloranfenicol; tianfenicol, sulfadimetoxina; sulfatiazol; sulfametazina; clortetraciclina;
oxitetraciclina; tetraciclina). Isso demonstra que os produtores estão respeitando os
períodos de carência para os antibióticos em peixes de cultivo, mas ainda assim podem
existir antibióticos não previstos na análise realizada pelo MAPA que estejam sendo
usados de forma ilegal na aquicultura.
4. CONTROLE DE RESÍDUOS E CONTAMINANTES EM ALIMENTOS
O controle de resíduos de antimicrobianos em alimentos destinados ao consumo
humano é extremamente importante para garantia da segurança alimentar. Por isso,
importantes órgãos internacionais têm estabelecido legislações relacionadas ao
controle destes resíduos, como por exemplo a União Europeia (EC, 2010a) e o Codex
Alimentarius (CODEX, 2015).

40
REVISÃO DE LITERATURA
4.1. Controle de resíduos de antimicrobianos no Brasil
Em 1979 foi criado no Brasil o Programa Nacional de Controle de Resíduos
Biológicos em Carne - o PNCRBC (Portaria Ministerial número 86 de 26/01/1979) pelo
MAPA, que tinha como finalidade sistematizar o controle de resíduos em produtos
cárneos. O programa visava a obtenção de informações sobre a ocorrência dos
diversos resíduos em animais abatidos em estabelecimentos sob Inspeção Federal e a
distribuição das ocorrências por região de origem dos animais (PORFÍRIO, 1994).
Este programa inicial foi ampliado e, em 1986, o Plano Nacional de Controle de
Resíduos em Produtos de Origem Animal foi instituído para controlar os resíduos de
compostos usados na agropecuária e os poluentes ambientais em carne (BRASIL,
1986), leite, mel, pescado e seus derivados (BRASIL, 1999).
O Plano Nacional de Controle de Resíduos em Contaminantes (PNCRC) tem
como função básica, o controle e a vigilância de resíduos de contaminantes em
alimentos de origem animal e suas ações estão direcionadas para conhecer e evitar a
violação dos níveis de segurança ou dos LMRs de substâncias autorizadas, bem como
a ocorrência de quaisquer níveis de resíduos de compostos químicos de uso proibido
no país. Para isto, são colhidas amostras de animais abatidos e vivos, de derivados
industrializados e/ou beneficiados, destinados a alimentação humana, provenientes dos
estabelecimentos sob Inspeção Federal (SIF). Atualmente, o que rege o PNCRC é a
Instrução Normativa SDA nº 13, de 15 de julho de 2015 (BRASIL, 2015), que aprovou
os Programas de Controle de Resíduos e Contaminantes em carnes, leite, mel, ovos e
pescado para o exercício de 2015. Em 2016 não foi publicado um novo escopo do
PNCRC.
O Programa Nacional de Controle de Resíduos e Contaminantes em Pescado
(PNCRCP) objetiva garantir a integridade e a segurança do pescado no território
nacional, em relação à contaminação por resíduos de substâncias nocivas destes
alimentos, oriundos da aplicação de drogas veterinárias e contaminantes ambientais.
O PNCRC/Animal é um programa de inspeção e fiscalização oficial, baseado em
análise de risco, que objetiva verificar e avaliar as boas práticas agropecuárias (BPA),
as boas práticas de fabricação (BPF) e os autocontroles implementados ao longo das
etapas das cadeias agroalimentares. Além disso, verifica também os fatores de
qualidade e de segurança higiênico-sanitárias dos produtos de origem animal, seus
subprodutos e derivados de valor econômico nacionais ou importados, por meio do
gerenciamento e controle dos perigos e riscos químicos e microbiológicos que
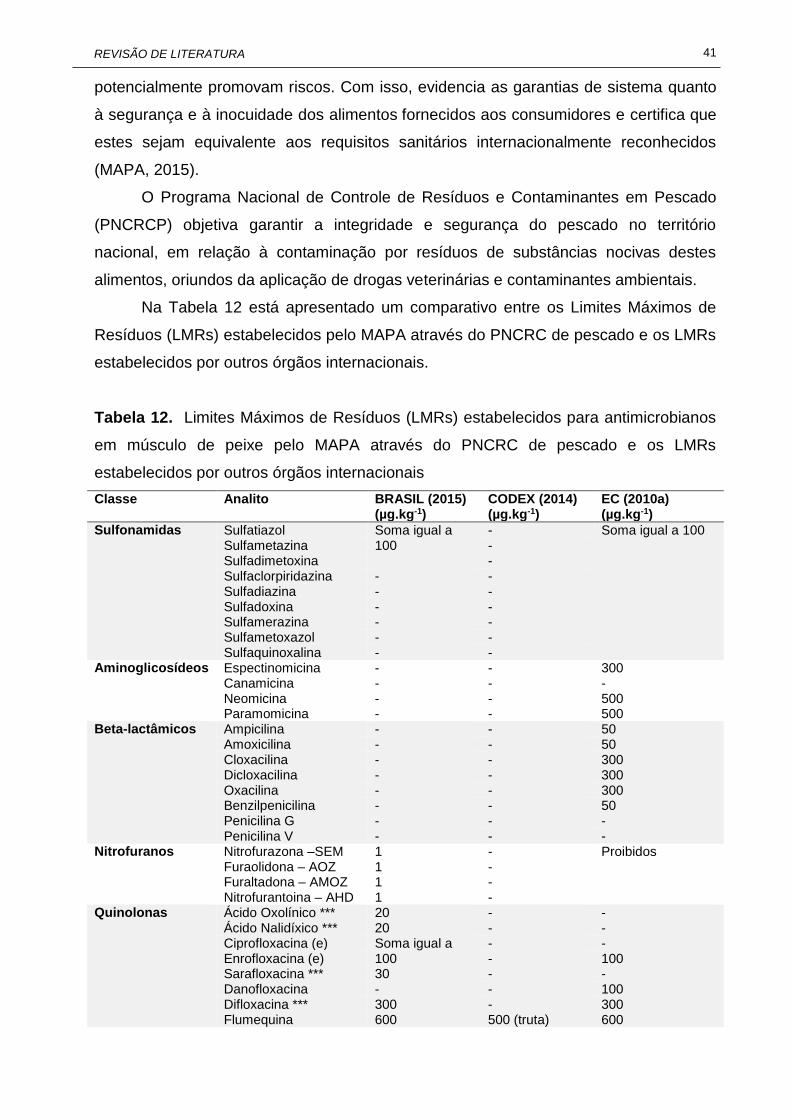
41
REVISÃO DE LITERATURA
potencialmente promovam riscos. Com isso, evidencia as garantias de sistema quanto
à segurança e à inocuidade dos alimentos fornecidos aos consumidores e certifica que
estes sejam equivalente aos requisitos sanitários internacionalmente reconhecidos
(MAPA, 2015).
O Programa Nacional de Controle de Resíduos e Contaminantes em Pescado
(PNCRCP) objetiva garantir a integridade e segurança do pescado no território
nacional, em relação à contaminação por resíduos de substâncias nocivas destes
alimentos, oriundos da aplicação de drogas veterinárias e contaminantes ambientais.
Na Tabela 12 está apresentado um comparativo entre os Limites Máximos de
Resíduos (LMRs) estabelecidos pelo MAPA através do PNCRC de pescado e os LMRs
estabelecidos por outros órgãos internacionais.
Tabela 12. Limites Máximos de Resíduos (LMRs) estabelecidos para antimicrobianos
em músculo de peixe pelo MAPA através do PNCRC de pescado e os LMRs
estabelecidos por outros órgãos internacionais
Classe Analito BRASIL (2015) (µg.kg-1)
CODEX (2014) (µg.kg-1)
EC (2010a) (µg.kg-1)
Sulfonamidas Sulfatiazol Soma igual a 100
- Soma igual a 100 Sulfametazina - Sulfadimetoxina - Sulfaclorpiridazina - - Sulfadiazina - - Sulfadoxina - - Sulfamerazina - - Sulfametoxazol - - Sulfaquinoxalina - -
Aminoglicosídeos Espectinomicina - - 300 Canamicina - - - Neomicina - - 500 Paramomicina - - 500
Beta-lactâmicos Ampicilina - - 50 Amoxicilina - - 50 Cloxacilina - - 300 Dicloxacilina - - 300 Oxacilina - - 300 Benzilpenicilina - - 50 Penicilina G - - - Penicilina V - - -
Nitrofuranos Nitrofurazona –SEM 1 - Proibidos Furaolidona – AOZ 1 - Furaltadona – AMOZ 1 - Nitrofurantoina – AHD 1 -
Quinolonas Ácido Oxolínico *** 20 - - Ácido Nalidíxico *** 20 - - Ciprofloxacina (e) Soma igual a
100 - -
Enrofloxacina (e) - 100 Sarafloxacina *** 30 - - Danofloxacina - - 100 Difloxacina *** 300 - 300 Flumequina 600 500 (truta) 600

42
REVISÃO DE LITERATURA
Tabela 12. (continuação...) Classe Analito BRASIL (2015)
(µg.kg-1) CODEX (2014) (µg.kg-1)
EC (2010a) (µg.kg-1)
Macrolídeos Eritromicina - - 200 Lincomicina - - 100 Tilmicosina - - 50 Tilosina - - 100
Anfenicóis Cloranfenicol 0,30 - Proibido Tianfenicol 50 - 50 Florfenicol 1000 - 1000 (peixe de
barbatana) Tetraciclinas Oxitetraciclina (a) Soma igual a
200 Soma igual a 200
100 Clortetraciclina (a) 100 Tetraciclina (a) -
Outros Colistina - - 150 Trimetoprima - - 50
Legenda: ‘-‘: não mencionado.
4.2. Controle de resíduos de antimicrobianos na União Europeia
O Regulamento EEC 2377/90 (EC, 1999) foi publicado em 1990 com o intuito de
constituir um processo comum para o estabelecimento de LMR de antimicrobianos em
alimentos de origem animal. Neste regulamento foram estabelecidas quatro classes
para as substâncias farmacologicamente ativas, com base na avaliação científica da
sua segurança: anexo I - substâncias para as quais se encontrava estabelecido um
LMR); anexo II - substâncias para as quais não era necessário estabelecer um LMR;
anexo III - substâncias para as quais foi estabelecido um LMR provisório; e o anexo IV -
substâncias para as quais não foi possível estabelecer um LMR devido ao fato de os
resíduos das substâncias constituírem um risco para a saúde humana, independente
do valor do limite (MOREIRA, 2012).
Na diretiva 96/23/CE (EC, 1996) foram publicadas as medidas de controle a
serem aplicadas a certas substâncias e aos resíduos em animais vivos e respectivos
produtos. Apenas em 2002 foi publicada a Diretiva 2002/657/CE (EC, 2002) que dá
execução ao disposto na Diretiva 96/23/CE relativo ao desempenho de métodos
analíticos e a interpretação de resultados (MOREIRA, 2012).
Em 2010, a União Europeia publicou o Regulamento 37/2010 cuja finalidade foi
integrar as substâncias farmacologicamente ativas e sua respectiva classificação no
que diz respeito ao Limite Máximo de Resíduo nos alimentos de origem animal. Além
disso foi adicionada a informação sobre a classificação terapêutica. Por motivos de
facilidade de utilização, todas as substâncias farmacologicamente ativas foram
ordenadas alfabeticamente em uma lista, num anexo único, em dois quadros
separados: um para as substâncias permitidas, enumeradas nos anexos I, II e III do

43
REVISÃO DE LITERATURA
Regulamento (CEE) no. 2377/90, e outro para as substâncias proibidas, constantes no
anexo IV (EC, 2010a; MOREIRA, 2012).
O último banco de dados publicado pela comissão do Codex Alimentarius em
sua 38º Sessão dispõe sobre os Limites Máximos de Resíduos (LMR) e as
recomendações de gerenciamento de riscos para diversos medicamentos veterinários
em alimentos (CODEX, 2015).
5. MÉTODOS DE ANÁLISE DE ANTIMICROBIANOS EM ALIMENTOS
Diferentes métodos analíticos foram desenvolvidos para a determinação de
resíduos de antimicrobianos em alimentos. Geralmente são necessários dois passos
principais durante a análise: o preparo da amostra (que pode incluir a extração, a
purificação e a concentração) seguido da etapa de separação e de detecção dos
analitos de interesse (GUIDI et al., 2017).
5.1. Preparo de amostra
Em alimentos, as concentrações de resíduos e contaminantes são geralmente
baixas e a matriz complexa para que as análises dessas substâncias sejam realizadas
sem uma etapa prévia de preparo da amostra. Na maior parte das vezes, os
componentes da matriz interferem negativamente na resposta analítica, gerando
resultados pouco precisos. A fim de minimizar esse problema, o preparo da amostra
tem como principal objetivo promover o fracionamento e a concentração da mesma,
com todos os analitos de interesse, deixando-os o mais livre possível das interferências
provenientes dos componentes da matriz, que certamente estarão no extrato. As
etapas mais comuns de preparo da amostra são a extração, a purificação e a pré-
concentração, obtendo os analitos em um meio mais apropriado e em concentrações
adequadas para a análise no sistema CL-EM/EM. Deve-se ter cuidado durante a
realização dessas etapas, pois qualquer perda ocorrida nessa fase não poderá ser
recuperada posteriormente.
Os procedimentos analíticos mais comumente utilizados são: a extração líquido-
líquido (LLE, do inglês, liquid-liquid extraction) e a extração sólido-líquido (SLE, do
inglês, solid-liquid extraction). Eles possuem diversas limitações, tais como: exigem
muito trabalho, são demorados, onerosos em termos de materiais e volumes de

44
REVISÃO DE LITERATURA
solventes e muitas vezes não podem ser concluídos antes que os produtos sejam
colocados no mercado (CACHO et al., 2003).
Visando contornar essas limitações e melhorar a eficiência dos métodos de
extração, vários procedimentos de extração e de purificação (clean up) têm sido
desenvolvidos para o preparo de amostras de alimentos. Entre eles, pode-se citar:
extração em fase sólida (SPE, do inglês, solid phase extraction) (YANG et al., 2011),
extração em fase sólida dispersiva (d-SPE, do inglês, dispersive solid phase extraction)
(DAGNAC et al., 2009), dispersão da matriz em fase sólida (MSPD, do inglês, matrix
solid phase dispersion) (DÓREA & LOPES, 2004), microextração por sorvente
empacotado (MEPS, do inglês, micro-extraction by packed sorbent) (ABDEL-REHIM,
2010), microextração líquido-líquido dispersiva (DLLME, do inglês, dispersive liquid-
liquid micro-extraction) (CHEN et al., 2009) e extração QuEChERS (do inglês, Quick,
Easy, Cheap, Effective, Ruged and Safe) (WILKOWSKA & BIZIUK, 2011) cujo
codinome significa ‘Rápido, Fácil, Barato, Efetivo, Robusto e Seguro’.
A escolha do melhor procedimento deve levar em consideração a praticidade, o
custo e a toxicidade dos solventes. Em análises de rotina, um processamento rápido de
numerosas amostras é desejado. Para isto é necessário o desenvolvimento de
métodos eficientes, rápidos e ambientalmente corretos.
5.2. Técnicas de separação e determinação de antimicrobianos em alimentos
Devido à complexidade das matrizes de alimentos (mistura de água, proteínas,
lipídios, carboidratos, vitaminas e minerais), além do preparo intensivo da amostra, é
necessário o acoplamento de técnicas analíticas para obtenção de maior seletividade e
detectabilidade.
A cromatografia é um método físico-químico de separação fundamentado na
migração diferencial dos componentes de uma mistura, que ocorre devido a diferentes
interações, entre duas fases imiscíveis, a fase estacionária e a fase móvel. Ela é uma
técnica com vasta gama de aplicações por permitir uma variedade de combinações
entre fases móveis e estacionárias (DEGANI et al., 1998).
Existem vários sistemas de detecção que podem ser acoplados à cromatografia.
Dentre eles, o acoplamento a um espectrômetro de massas une as vantagens da
cromatografia (alta seletividade e eficiência de separação) com as vantagens da
espectrometria de massas, que é capaz de detectar e identificar com elevada
sensibilidade uma substância através da medição da razão massa/carga (m/z) dos íons

45
REVISÃO DE LITERATURA
que são gerados pela quebra da molécula e da caracterização química do composto
(CHIARADIA et al., 2008).
A espectrometria de massas sequencial, técnica EM/EM, possibilita a obtenção
de uma grande quantidade de informação estrutural acerca do analito, garantindo sua
identificação com maior exatidão do que quando ela é feita apenas com base no tempo
de retenção dos compostos analisados, como ocorre nas outras técnicas de detecção
cromatográficas. Por esse motivo, esta técnica, em conjunto com a cromatografia, é
bastante utilizada na detecção de compostos presentes em baixas concentrações em
matrizes complexas, como é o caso dos alimentos. Devido ao fato de ser uma técnica
altamente seletiva, que minimiza os efeitos da interferência de componentes da matriz
sobre o sinal obtido, exige uma etapa de preparo da amostra mais simples, eliminando,
muitas vezes, a necessidade de realizar várias etapas de purificação da amostra
(CHIARADIA et al., 2008).
Pela aplicação da técnica CL-EM/EM é possível realizar análises de
multirresíduos em uma única corrida sem comprometer a qualidade da resposta de
cada analito à cromatografia. Isto só é alcançado porque o sistema de detecção de
massas monitora individualmente cada transição m/z, gerando para cada transição
monitorada seu próprio cromatograma que pode ser extraído do cromatograma total
com o auxílio do software de controle do sistema e tratamento de dados (OLIVEIRA,
2011).
Desta forma, o emprego da técnica CL-EM/EM fornece informações referentes
ao tempo de retenção de cada composto, a obtenção de duas ou mais transições que
permitem quantificar e confirmar o analito e elevada detectabilidade que permitem
alcançar níveis de confiabilidade em concordância com os LMR estabelecidos
(MARTINS JÚNIOR et al., 2006). Podem ser encontrados diversos trabalhos na
literatura que utilizam CL-EM/EM para separação e detecção de antimicrobianos em
alimentos.
Um método para identificação e quantificação de macrolídeos (eritromicina,
josamicina, tilmicosina, tilosina, espiramicina e neoespiramicina) em filé de tilápia, por
cromatografia líquida acoplada a um espectrômetro de massas do tipo quadrupolo
tempo-de-voo, foi desenvolvido por SISMOTTO et al. (2014). O preparo da amostra foi
simples, precipitando as proteínas e extraindo os analitos com etanol, retirando a
gordura com hexano e concentrando o extrato por evaporação do solvente. Os limites
de quantificação foram, pelo menos, 45% menores que os Limites Máximos de
Resíduos. A separação cromatográfica ocorreu em uma coluna de fase reversa C18

46
REVISÃO DE LITERATURA
XTerra1 MS (150 x 2,1 mm, 5 µm, Waters, USA) a 25 °C. As fases móveis foram água
e metanol adicionados de ácido acético. Os parâmetros espectrométricos dos
macrolídeos foram otimizados para cada um dos analitos.
Um método multirresíduo simples e sensível foi desenvolvido por DASENAKI &
THOMAIDIS (2015) para análise de 115 drogas veterinárias, pertencentes a mais de 20
classes diferentes, em várias matrizes de origem animal, inclusive peixe. O método
envolveu um passo de extração sólido-líquido com 0,1% de ácido fórmico em solução
aquosa de EDTA 0,1% (p/v)-acetonitrila-metanol (1:1:1, v/v) com um passo adicional de
agitação ultrassônica. A precipitação dos lipídeos e proteínas foi promovida
submetendo os extratos a temperaturas baixas (-23 °C) por 12 horas. Uma etapa
posterior de purificação com hexano foi realizada para extração completa dos lipídeos.
O extrato foi injetado em um sistema de cromatografia líquida acoplada a um
espectrômetro de massas sequencial com ionização electrospray (CL-ESI-EM/EM). A
coluna cromatográfica utilizada foi Atlantis T3C18 (100 x 2,1 mm, 3 µm, Waters) com
um fluxo de 100 mL/min. Foram realizadas duas corridas, uma em modo negativo e
outra em modo positivo de ionização no modo MRM (monitorização de reação
múltipla). A fase móvel para o modo de detecção positivo foi água com 0,01% (v/v) de
ácido fórmico (solvente A) e metanol (solvente B), enquanto no modo de detecção
negativo foi utilizada água modificada (1 mM de formato de amônio (A), metanol (B) e
acetonitrila (C). Os parâmetros espectrométricos foram otimizados e apresentados no
trabalho. A recuperação dos analitos variou de 31,8% (ácido tolfenâmico) a 114%
(carbamazepina) em peixe, com valores de desvio padrão relativo entre 1,7% e 15%.
Os limites de quantificação variaram de 0,03 µg.kg-1 (flunixina) a 6,7 µg.kg-1
(hidroclorotiazida).
Um método rápido, sensível e específico por CL-EM/EM foi desenvolvido e
validado para a quantificação simultânea de quatro antimicrobianos comumente
utilizados na aquicultura - ciprofloxacina, trimetoprima, sulfadimetoxina e florfenicol –
em músculo de peixes. A amostra foi preparada através de extração líquido-líquido
simples seguida de uma purificação (clean-up) com n-hexano. Os extratos purificados
foram injetados no cromatógrafo líquido e a separação dos analitos foi realizada em
uma coluna C18 de fase reversa Poroshell 120 CE (50 x 3 mm, 2,7 µm, Agilent) usando
uma fase móvel isocrática constituída por ácido fórmico a 0,1% em água: ácido fórmico
a 0,1% em metanol (20:80 v/v) a um fluxo de 0,4 mL/min. A temperatura da coluna foi
mantida a 25 °C. O espectrômetro de massas foi operado no modo de ionização
positiva para ciprofloxacina, trimetoprima e sulfadimetoxina e no modo de ionização

47
REVISÃO DE LITERATURA
negativa para florfenicol, com ionização por electrospray (ESI). A detecção dos íons foi
feita no modo MRM. O limite de quantificação obtido foi de 0,5 ng.g-1 para
sulfadimetoxina e 1 ng.g-1 para ciprofloxacina, trimetoprima e florfenicol. O desvio
padrão relativo foi de 14,3%, 15,8%, 6,7% e 9,4% no limite de quantificação para
ciprofloxacina, trimetoprima e sulfadimetoxina e florfenicol, respectivamente, enquanto
que as precisões, expressas como a porcentagem de recuperação, foram de 92,3%,
91,6%, 94,1% e 93,7% para os quatro analitos no limite de quantificação (REZK et al.,
2015).
DASENAKI & THOMAIDIS (2010) desenvolveram um método para analisar
rapidamente dezessete sulfonamidas e cinco tetraciclinas em músculo de peixe em
uma única corrida, utilizando cromatografia líquida de ultra-alto desempenho (UHPLC)
com detecção por espectrometria de massas. A separação foi realizada em coluna
Zorbax Eclipse Plus C18 (2,1 x 50 mm, 1,8 µm, Agilent). A fase móvel consistiu de
água contendo 0,1% de ácido fórmico (v/v) (solvente A) e acetonitrila (solvente B). O
gradiente utilizado foi 0-12 minutos de gradiente linear de 5 a 50% de B; 12-13 minutos
de 50 para 5% de B, 13-21 minutos mantidos os 5% de B para que a coluna se
reequilibrasse antes da próxima injeção. O volume de injeção foi fixado em 10 µL. O
espectrômetro de massas operou em modo positivo. O limite de detecção variou de
5,65 a 24,0 µg.kg-1 para as sulfonamidas e de 10,3 a 25,8 µg.kg-1 para as tetraciclinas.
O limite de quantificação variou de 17,1 a 72,7 µg.kg-1 para as sulfonamidas e de 31,3
a 78,1 µg.kg-1 para as tetraciclinas. O desvio padrão relativo de repetibilidade variou de
3,5% a 16% para as sulfonamidas e de 5,7% a 15% para as tetraciclinas.

48
OBJETIVOS
OBJETIVOS
Este trabalho teve como objetivo geral desenvolver métodos multirresíduos de
análise de antimicrobianos em músculo de peixe e avaliar a qualidade dos peixes
cultivados nos estados brasileiros de Minas Gerais e do Pará no que diz respeito à
presença de resíduos de antimicrobianos.
Os objetivos específicos foram:
i. fazer uma revisão detalhada sobre a determinação de cloranfenicol em
alimentos de origem animal brasileiros por CL-EM/EM;
ii. fazer uma revisão detalhada sobre os avanços na determinação cromatográfica
de anfenicóis em alimentos;
iii. desenvolver e validar um método de triagem para a determinação multirresíduos
de antimicrobianos das classes aminoglicosídeos, beta-lactâmicos, macrolídeos,
quinolonas, sulfonamidas e tetraciclinas em músculo de peixe empregando CL-
EM/EM;
iv. desenvolver e validar um método analítico quantitativo para a determinação
multirresíduos de quinolonas (difloxacina, norfloxacina, ciprofloxacina,
danofloxacina, marbofloxacina, enrofloxacina, sarafloxacina, ácido oxolínico,
ácido nalidíxico, flumequina) e tetraciclinas (clortetraciclina, doxiciclina,
oxitetraciclina e tetraciclina) em músculo de peixe;
v. realizar as análises de triagem e confirmatória de amostras de peixes de
piscicultura dos Estados de Minas Gerais e do Pará quanto à presença de
antimicrobianos.

49
PARTE EXPERIMENTAL
PARTE EXPERIMENTAL
Para atender aos objetivos deste trabalho, o conteúdo foi dividido em capítulos
escritos na forma de artigo científico, os quais estão apresentados a seguir.

50
CAPÍTULO I
CAPÍTULO I - LC-MS/MS DETERMINATION OF
CHLORAMPHENICOL IN FOOD OF ANIMAL ORIGIN IN
BRAZIL
Artigo publicado:
GUIDI, L.R.; SILVA, L.H.M.; FERNANDES, C.; ENGESETH, N.J.; GLORIA, M.B.A. LC-
MS/MS determination of chloramphenicol in food of animal origin in Brazil. Scientia
Chromatographica, v. 7, n. 4, p. 1-9, 2015.

51
CAPÍTULO I
ABSTRACT
Chloramphenicol is a highly efficient antibiotic with broad spectrum activity. It has been
banned from food producing animals because of serious adverse effects to human
health. Nevertheless, it is still being used in some countries because of its high efficacy
and relatively low price. There is currently a minimally required performance limit
(MRPL) defined at 0.3 µg.kg-1. This is the reason why chloramphenicol has often been
analyzed by highly efficient and sensitive single residue methods. The objective of this
review is to provide the state-of-art scientific knowledge on chloramphenicol, the LC-
MS/MS methods used for its analysis and its occurrence in foods of animal origin in
Brazil.
Keywords: antibiotic, milk, fish, honey, liquid chromatography, mass spectrometry.

52
CAPÍTULO I
1. INTRODUCTION
Antibiotics are widely used in intensive agriculture. They can be a therapeutic
agent in the treatment of animal diseases, a prophylactic agent to avoid or prevent
sickness, and also a feed additive to promote growth and increase feed efficiencies.
However, their widespread use in food producing animals can be a potential hazard to
human health due to the possibility of causing bacterial resistance and potential allergic
reactions to the antibiotic. Special concern has been raised with regard to
chloramphenicol, which, besides the inherent problems with antibiotics, it can cause
fatal health problems, among them, bone marrow aplasia, aplastic anemia and gray
baby syndrome. Due to the potential harmful effects to human health, the use of
chloramphenicol has been prohibited for the treatment of food-producing animals in
several countries (SAMSONOVA et al., 2012; JECFA, 2014; HANEKAMP & BAST,
2015).
However, the use of chloramphenicol to treat food-producing animals remains a
possibility due to its high efficiency, broad spectrum of activity, prompt availability and
low cost. The occurrence of chloramphenicol in foods can be the result of authorized
use but lack of compliance with the withdrawal time period, unauthorized use and also
unintentional or cross-contamination (GENTILI et al., 2005; HANEKAMP & BAST,
2015). Therefore, there is a need to constantly evaluate the occurrence of this antibiotic
in food.
The control of chloramphenicol in foods can be performed by screening or
confirmatory procedures. Screening methods only provide semi-quantitative analysis
and can give rise to false positives, but they are used due to simplicity in sample
preparation, sensitivity, speed and low cost. On the other hand, confirmatory methods,
such as those employing liquid chromatography (LC) coupled to mass spectrometry
(MS) are the approaches of choice for determination of antibiotics, because they allow
definitive identification, quantitative determination at very high level of specificity and
sensitivity (GENTILI et al., 2005; BERENDSEN, 2010). The objective of this review is to
provide updated information on the occurrence and concentrations of chloramphenicol
in food in Brazil determined by LC-MS/MS.

53
CAPÍTULO I
2. CHARACTERISTICS AND ANTIMICROBIAL ACTIVITY OF
CHLORAMPHENICOL
Chloramphenicol is a naturally occurring, broad-spectrum antibiotic with excellent
antibacterial and pharmacokinetic properties. Its formula, structure, chemical names
and numbers as well as physico-chemical and spectral characteristics are described in
Table 1. Chloramphenicol was isolated in 1947 from Streptomyces venezuelae, a soil
bacterium, but it has been synthetically produced for a long time. Different trade names
are available and there are three common forms for systemic therapy: a free base form,
chloramphenicol palmitate and chloramphenicol succinate. Other formulations are also
available for topical use (SAMSONOVA et al., 2012; SPLENDORE et al., 2013).
Table 1. Characteristics of chloramphenicol
Parameter Characteristics
CAS number 56-75-7 EC number 200-287-4 IUPAC name 2,2-dichloro-N-[(1R,2R)-1,3-dihydroxy-1-(4-nitrophenyl)propan-2-
yl] acetamide Names Chloramphenicol; chlornitromycin; chloromycetin; levomycetin;
chlorocid; globenicol Molecular formula C11H12Cl2N2O5 Structure
Molar mass (g/mol) 323.12938 Melting point (°C) 150.5-151.5 pka 11.03 Log P 1.103 Physical description White to greyish-white or yellowish-white fine crystalline powder or
fine crystals, needles or elongated plates Taste Bitter to taste Spectral properties: Specific optical rotation: +18.6˚ at 20 ˚C (ethanol); -25.5˚ at 25 ˚C
(ethyl acetate). IR: u 5174; UV: 385 nm; Mass: 236
Solubility Very soluble in methanol, ethanol, butanol, ethyl acetate, acetone, chloroform; Water solubility - 2500 mg.L-1 (at 25 °C)
Stability Neutral and acid solutions are stable on heating; In solution, chloramphenicol undergoes a number of degradative changes related to pH, temperature, photolysis and microbiological effects
CAS (2015); PUBCHEM (2015).
Chloramphenicol has a wide spectrum of antimicrobial activity. It is effective
against Gram-positive and Gram-negative cocci and bacilli (including anaerobes),
Rickettsia, Mycoplasma, Chlamydia, among others. It is usually bacteriostatic, but at

54
CAPÍTULO I
higher concentrations it can be bactericidal. It acts by diffusing through the bacteria cell
wall, binding to the bacterial 50S ribosomal subunit and inhibiting protein synthesis and
cell proliferation (JECFA, 2014; CAS, 2015; PUBCHEM, 2015). It was widely used as a
human antibiotic and also as a veterinary drug. Nowadays, its use in human medicine
has been restricted to ophthalmic and some serious infections (Salmonella typhi and
other forms of salmonellosis, staphylococcal brain diseases and life threatening
infections of the central nervous system and respiratory tract). The veterinary use of
chloramphenicol includes administration to pets, farm and aquaculture animals. In
therapy and prophylaxis, the main infectious diseases treated with chloramphenicol are
enteric and pulmonary infections, skin and organ abscesses and mastitis. It is also used
in infections caused by anaerobic bacteria or those that are resistant to other
antimicrobial agents (JECFA, 2014; HANEKAMP & BAST, 2015).
3. TOXICOLOGICAL ASPECTS AND CURRENT LEGISLATION
The widespread use of antibiotics in food-producing animals can be a potential
hazard for human health. However, the indiscriminate use of chloramphenicol can lead
to bacterial resistance, allergic reactions, disruption of the balance of the
gastrointestinal microbial flora, and hemotoxic effects, such as aplastic anemia, bone
marrow depression and gray baby syndrome. Since it undergoes biotransformation to
the inactive metabolite chloramphenicol glucuronide in the liver, individuals with
subnormal liver function and infants are also at risk. Aplastic anemia is an irreversible
side effect that is not dose-related; this side effect is probably the result of the reduction
of its p-nitro group to the highly toxic nitroso metabolite. It is a rare but often fatal
condition with no treatment. Another side effect is bone-marrow depression,
suppressing bone marrow and its production of red and white blood cells and platelets.
This effect is reversible if the treatment is discontinued. Also, infants, especially
premature babies, when exposed to high levels of chloramphenicol, can develop the
‘gray baby syndrome’. This probably occurs because the liver enzymes of an infant are
not fully developed, and any chloramphenicol received across the placenta or in breast
milk remains intact in the body, inducing hypotension, hypothermia, flaccidity,
cardiovascular collapse, cyanosis and death within hours. There are also indications
that chloramphenicol is genotoxic in vivo and could cause cancer. Although the

55
CAPÍTULO I
evidence is considered limited, chloramphenicol has been categorized by the
International Agency for Research on Cancer (IARC) as probably carcinogenic in
humans, classified as group 2A (IARC, 1990; JECFA, 2014).
Based upon scientific reports about chloramphenicol, an acceptable daily intake
(ADI) has never been allocated and a maximum residue limit (MRL) has not been
assigned (JECFA, 2014). Chloramphenicol was banned for use in food-producing
animals in the European Union and in many other countries including Brazil as a means
to eliminate it from the food production chain and related goods (BRASIl, 2003; EC,
2010a). A zero tolerance provision was established and a minimum required
performance limit (MRPL), which is the concentration that laboratories should be able to
detect and confirm, of 0.3 µg.kg-1 for chloramphenicol was set by the European
Commission and adopted by several countries for analytical methods to be used in
testing for chloramphenicol in products of animal origin (EC, 2010a; BRASIL, 2015;
CANADA, 2015; USDA, 2015).
To warrant national public health safety and to maintain competitiveness in
international trade, food producers have to ensure that the products traded are in
compliance with the safety and quality criteria required by consumers. Among actions
undertaken by Brazil to warrant safety and quality control, the Ministry of Agriculture,
Livestock and Food Supply of Brazil created a food safety program called National
Residue Control Plan (NRCP). It has the purpose of generating reliable analytical
results, monitoring residues and contaminants involved in food production, including
antibiotics (MAURICIO et al., 2009). The Brazilian Agency of Sanitary Surveillance
(ANVISA) from the Ministry of Health also created a National Program for the analysis
of veterinary drug residues in food available for consumers (ANVISA, 2009). Therefore,
it is of great importance to have sensitive methods for the determination and
confirmation of residues and contaminants in foods.
4. LC-MS/MS METHODS FOR THE ANALYSIS OF
CHLORAMPHENICOLS IN FOODS
Several methods are available for the determination of chloramphenicol in foods,
both for screening or quantification purposes. Screening methods are cost-effective and
have a high sample throughput (FERREIRA et al., 2012; SAMSONOVA et al., 2012).

56
CAPÍTULO I
However, the effective control of chloramphenicol in foods requires very sensitive and
reliable analytical methods to comply with the stringent requirement established for a
banned compound. Due to the chemical properties of chloramphenicol, quantitative
methods using gas chromatography with mass spectrometry (GC-MS) require
transformation of chloramphenicol into a stable volatile compound, which lengthens
analysis time and may not be reproducible at trace levels (GENTILI et al., 2005; PAN et
al., 2006). Many of the reported liquid chromatography/ultraviolet (LC-UV) methods did
not reach the required sensitivity and selectivity to meet the current MRPL. The power
of a mass spectrometer as a chromatographic detector results from its capacity to
determine, by means of the molecular weight, the precursor ion and its fragments,
which provide structural information. The combination of liquid chromatography with
tandem mass spectrometry (LC-MS/MS) allows definite identification and quantification
of trace chloramphenicol in complex food matrices due to the specificity and sensitivity
associated with this technique (ORTELLI et al., 2004; GENTILI et al., 2005;
KAUFMANN & BUTCHER, 2005; BERENDSEN, 2010). In this context, only methods
and results for chloramphenicol based on LC-MS/MS will be described.
According to Table 2, several studies were undertaken on the analysis of
chloramphenicol in foods by LC-MS/MS. In most of them, analysis was carried out in the
multiple reaction monitoring (MRM) mode via electrospray ionization operated in the
negative mode. Deuterated chloramphenicol (d5-chloramphenicol) was used as the
internal standard. The transitions used for chloramphenicol quantification and
confirmation varied among studies. However, the [M-H]- ion and at least two product
ions are monitored. For example, GUIDI et al. (2012b) used m/z 320.9 152.1 and m/z
320.9256.9 for chloramphenicol in fish analysis. The monitored ion for the internal
standard was m/z 326.015157.0. Matrix-matched calibration curves were used. In
most of the studies, the method was validated according to the criteria established by
the EC Commission Decision 657/2002 (EC, 2002).
LC separation of chloramphenicol was obtained by reverse phase C18 columns
from different brands (Table 2). Columns dimensions varied from 50 to 150 mm length,
2 to 3 mm internal diameter and 2 to 5 µm particle size. Different mobile phases were
used in gradient elution, among them methanol:water, acetonitrile:water,
acetonitrile:water acidified with formic acid, and ammonium acetate:methanol. In every
method, except for one, the limits of detection and quantification were below 0.3 µg.kg-1,
which is the MRPL established for chloramphenicol. Moreover, high sensitivity was
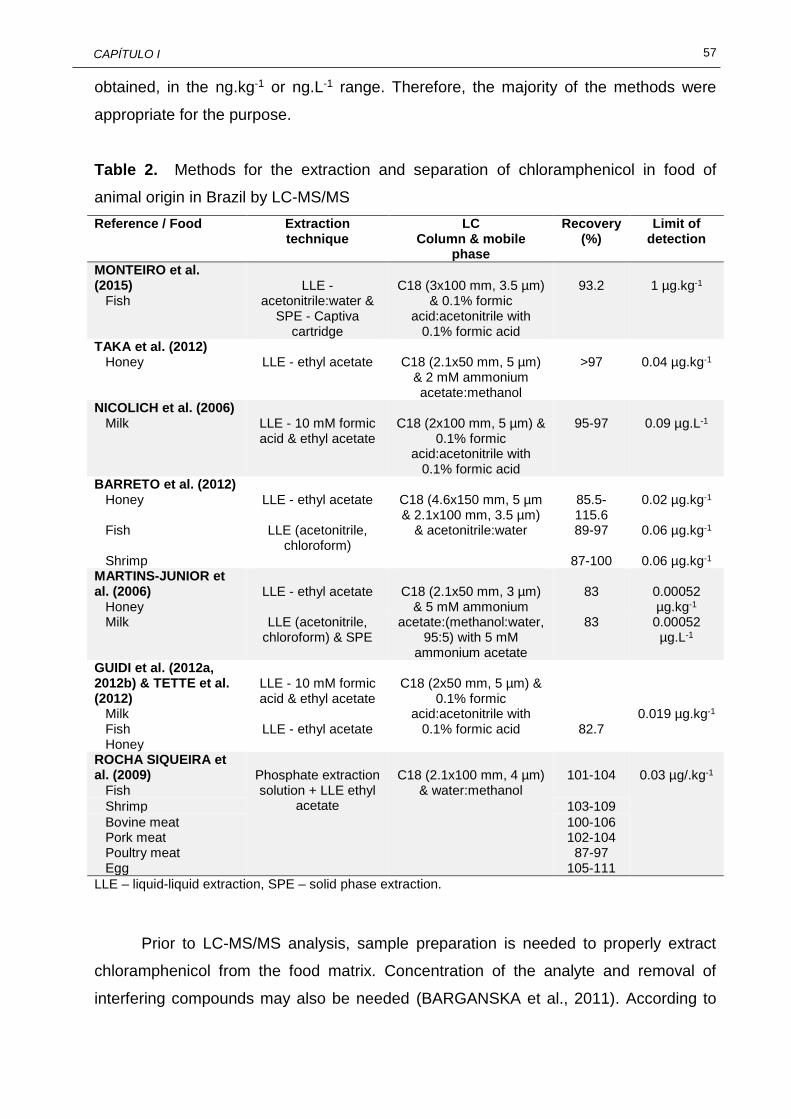
57
CAPÍTULO I
obtained, in the ng.kg-1 or ng.L-1 range. Therefore, the majority of the methods were
appropriate for the purpose.
Table 2. Methods for the extraction and separation of chloramphenicol in food of
animal origin in Brazil by LC-MS/MS
Reference / Food Extraction technique
LC Column & mobile
phase
Recovery (%)
Limit of detection
MONTEIRO et al. (2015) Fish
LLE -
acetonitrile:water & SPE - Captiva
cartridge
C18 (3x100 mm, 3.5 µm)
& 0.1% formic acid:acetonitrile with
0.1% formic acid
93.2
1 µg.kg-1
TAKA et al. (2012) Honey
LLE - ethyl acetate
C18 (2.1x50 mm, 5 µm)
& 2 mM ammonium acetate:methanol
>97
0.04 µg.kg-1
NICOLICH et al. (2006) Milk
LLE - 10 mM formic acid & ethyl acetate
C18 (2x100 mm, 5 µm) &
0.1% formic acid:acetonitrile with
0.1% formic acid
95-97
0.09 µg.L-1
BARRETO et al. (2012) Honey
LLE - ethyl acetate
C18 (4.6x150 mm, 5 µm & 2.1x100 mm, 3.5 µm)
& acetonitrile:water
85.5-115.6
0.02 µg.kg-1
Fish LLE (acetonitrile, chloroform)
89-97 0.06 µg.kg-1
Shrimp 87-100 0.06 µg.kg-1 MARTINS-JUNIOR et al. (2006) Honey
LLE - ethyl acetate
C18 (2.1x50 mm, 3 µm)
& 5 mM ammonium acetate:(methanol:water,
95:5) with 5 mM ammonium acetate
83
0.00052 µg.kg-1
Milk LLE (acetonitrile, chloroform) & SPE
83 0.00052 µg.L-1
GUIDI et al. (2012a, 2012b) & TETTE et al. (2012) Milk
LLE - 10 mM formic acid & ethyl acetate
C18 (2x50 mm, 5 µm) &
0.1% formic acid:acetonitrile with
0.1% formic acid
0.019 µg.kg-1 Fish LLE - ethyl acetate 82.7 Honey ROCHA SIQUEIRA et al. (2009) Fish
Phosphate extraction solution + LLE ethyl
acetate
C18 (2.1x100 mm, 4 µm)
& water:methanol
101-104
0.03 µg/.kg-1
Shrimp 103-109
Bovine meat Pork meat Poultry meat Egg
100-106 102-104
87-97 105-111
LLE – liquid-liquid extraction, SPE – solid phase extraction.
Prior to LC-MS/MS analysis, sample preparation is needed to properly extract
chloramphenicol from the food matrix. Concentration of the analyte and removal of
interfering compounds may also be needed (BARGANSKA et al., 2011). According to

58
CAPÍTULO I
Table 2, sample preparation for chloramphenicol analysis involved mostly liquid-liquid
extraction (LLE), even though solid-phase extraction (SPE) was also used in a few
studies. Representative and homogeneous samples were extracted for chloramphenicol
by LLE. In most of the methods, a simple extraction procedure using ethyl acetate
provided good recoveries of chloramphenicol from honey, milk and fish samples. The
sample was spiked with the internal standard, vortexed for a few seconds and allowed
to equilibrate. The extracting solvent was added and sample was mixed (several
minutes), centrifuged, the supernatant was transferred and the sediment was extracted
once more. The supernatants were mixed and evaporated to dryness under nitrogen
flow and they were dissolved in the mobile phase, vortexed for a few seconds, allowed
to equilibrate and injected into the LC.
In the extraction of chloramphenicol from honey, dissolution of the sample in
water (1:1, w/v) was needed prior to a simple LLE procedure with ethyl acetate
(MARTINS-JÚNIOR et al., 2006; BARRETO et al., 2012; TAKA et al., 2012; TETTE et
al., 2012). During extraction of chloramphenicol from milk, NICOLICH et al. (2006) and
GUIDI et al. (2012a) added water acidified with 10 mM formic acid prior to LLE with
ethyl acetate. However, MARTINS-JÚNIOR et al. (2006) proposed two sequential LLE
procedures, the first with acetonitrile and the second using chloroform. The supernatant
was dried under nitrogen flow, dissolved into methanol, water and Na2HPO4 and
submitted to SPE using a SupelcleanTM ENVITM Chrom P (Supelco, Bellefonte, PA,
USA). By using this more sophisticated procedure, a detection limit in the ng.kg-1 range
was obtained.
Different procedures were used for the extraction of chloramphenicol from fish.
GUIDI et al. (2012b) used a simple LLE procedure with ethyl acetate and obtained good
recoveries. BARRETO et al. (2012) used two LLE procedures, the first with acetonitrile
and the second with chloroform, achieving similar results for fish and shrimp samples,
improving recoveries. MONTEIRO et al. (2015) used a more sophisticated procedure
involving LLE with acetonitrile:water, followed by ultrafiltration (SPE) using a Captiva
cartridge to remove protein and particulate matter; however, these researchers focused
on multiresidue analysis of 12 drugs of different antimicrobial classes. Such a detailed
procedure would not be necessary for a single antibiotic analysis. ROCHA SIQUEIRA et
al. (2009) proposed a method based on the extraction of chloramphenicol using a
phosphate extraction solution (containing NaCl, KCl, Na2HPO4 and KH2PO4) and
ultrasound bath for 15 minutes prior to LLE with ethyl acetate. They validated this
method for fish, shrimp and also for meat (bovine, pork and poultry) and egg.

59
CAPÍTULO I
Several sophisticated and complex sample preparation techniques have been
used in the analysis of chloramphenicol, by using different sorbants (Oasis, molecularly
imprinted polymers and multi-walled carbon nanotubes) or techniques, like QuEChERS
(VERZEGNASSI et al., 2003; PAN et al., 2006; LU et al., 2010; SHI et al., 2010;
SNIEGOCKI et al., 2015). However, efficient extraction of chloramphenicol from food
matrices for LC-MS/MS analysis can be undertaken by a simple LLE procedure. The
use of additional steps may not be necessary. Furthermore, they can be time-
consuming, require larger quantities of chemical reagents, involve extensive manual
procedures, and use cleanup columns (SPE) that increases the analysis time and cost.
5. OCCURRENCE OF CHLORAMPHENICOL IN FOOD
Even though the use of chloramphenicol in food producing animals was banned
several years ago, it was detected in some foods of animal origin, as indicated in Table
3. Four studies focused on honey (total of 43 samples) and indicated that samples from
different regions of Brazil, from different beekeepers, floral sources and colors did not
contain chloramphenicol (IARC, 1990; MARTINS-JÚNIOR et al., 2006; NICOLICH et al.,
2006; TETTE et al., 2012). Eighty six samples of fish were analyzed in four different
studies, and tilapia was the main type of fish analyzed. Chloramphenicol was only
detected in one sample at levels below the MRPL (IARC, 1990; EC, 2002; ROCHA
SIQUEIRA et al, 2009; TAKA et al., 2012). No chloramphenicol was found in shrimp (14
samples) (ROCHA SIQUEIRA et al, 2009). Samples of meat (556 from bovine, pork and
poultry) and eggs (60) were also analyzed and none of them contained chloramphenicol
(ROCHA SIQUEIRA et al, 2009).
Milk was the food product with the highest occurrence of chloramphenicol.
Among studies undertaken, only the one by NICOLICH et al. (2006) failed to detect
chloramphenicol in the 41 milk samples which were positive by ELISA. However, the
samples had been stored for a long period of time prior to analysis, which could have
affected the results. MARTINS-JÚNIOR et al. (2006) observed 42% occurrence of
chloramphenicol in pasteurized and dried milk (total of 7 samples) at levels varying from
0.0047 to 0.0061 µg.kg-1. GUIDI et al. (2012a) found similar prevalence (41%), at levels
ranging from 0.10 to 13.9 µg.kg-1 in samples obtained from dairy farms. Indeed, it is

60
CAPÍTULO I
more likely to find antibiotics in farm samples prior to their dilution by the mixture with
milk from other farms.
Table 3. Occurrence of chloramphenicol in food of animal origin by LC-MS/MS in Brazil Food Samples
analyzed (% Positive)
Concentration in positive samples
Reference
Honey Different beekeepers and floral
5 (0%)
nd
BARRETO et al. (2012)
Brands from SP market 4 (0%) nd MARTINS-JÚNIOR et al. (2006)
Different regions, floral & colors 22 (0%) nd TAKA et al. (2012) Samples from MG market 12 (0%) nd TETTE et al. (2012) Milk Milk (brands from market) Dried milk (brands from market)
4 (25%)
3 (66.6%)
4.73 ng.L-1
5.9 – 6.10 ng.L-1
MARTINS-JÚNIOR et al.
(2006) Suspect (Elisa) milk 41 (0%) nd NICOLICH et al. (2006) Farm samples (raw) 49 (41%)
0.10 – 13.9 μg.kg-1 GUIDI et al. (2012a)
Fish Nile tilapia (4 farms)
36 (0%)
nd
MONTEIRO et al. (2015)
Aquaculture fish (Pintado, tilapia, matricha, saint peter, tambaqui, tambacu)
13 (7.7%) 0.063 µg.kg-1 GUIDI et al. (2012b)
Sarotherodon niloticus (farms) 21 (0%) nd BARRETO et al. (2012) Fish 16 (0%) nd ROCHA SIQUEIRA et al.
(2009) Other foods Bovine meat Pork meat Poultry meat Shrimp Egg
149 (0%) 199 (0%) 208 (0%) 14 (0%) 60 (0%)
nd nd nd nd nd
ROCHA SIQUEIRA et al.
(2009)
nd – not detected.
The NRCP has also been generating results for chloramphenicol and other
residues in different foods of animal origin. Among the many different samples analyzed
every year, only a few positive samples for chloramphenicol have been found, among
them poultry meat (1 out of 76 samples from 2014, containing 0.39 µg.kg-1) and fish (1
out of 77 samples, containing 75.6 µg.kg-1) (PNCR, 2015). NRCP results for milk were
negative for chloramphenicol in 120 samples of milk analyzed in 2009 and 2010.
Results from PamVet (ANVISA, 2009) on chloramphenicol in milk also indicated no
detectable levels in dried milk (139 samples) and 0.6% occurrence in UHT milk (464
samples) at levels ranging from 0.3 and 0.8 µg.kg-1.
Even though the number of samples analyzed was very limited, the outcome is
good considering the low percentage of foods of animal origin containing detectable
levels of chloramphenicol. However, the illegal utilization of chloramphenicol to treat
food-producing animals remains a possibility, either by administration of prohibited

61
CAPÍTULO I
antibiotics, or failure to respect the proper withdrawal periods. The problem is more
visible with milk due to its role in infant and overall human nutrition and its widespread
consumption. Furthermore, chloramphenicol in milk can be transfered to dairy products,
specially those rich in fat (TIAN, 2011; FERREIRA et al., 2012; SNIEGOCKI et al.,
2015). Therefore, it is important to ensure milk quality. Brazil has a quality control
program aimed at milk from individual dairy farms. Antibiotic analysis of these milk
samples should be performed to be able to detect the source of contamination and to
implement educational programs to warrant milk quality.
It is also important to consider that there could be other sources of food
contamination with chloramphenicol. Its use as a human medicinal antimicrobial can
result in its release into the environment through waste streams by which food products
may be contaminated during production. For instance, chloramphenicol has been
detected in the aquatic environment such as effluents of sewage treatment plant and in
surface water. Another source of this as well as other antimicrobials could be the natural
occurrence in soil by bacteria (e.g., Actinomycetes), which can result in a large biomass
per hectare in topsoil and subsequent uptake by crops and transfer of plants to feed
(PENG et al., 2006; WATKINSON et al., 2009; HANEKAMP & BAST, 2015;
SNIEGOCKI et al., 2015).
6. CONCLUSION
Several methods have been developed for the analysis of chloramphenicol in
food by LC-MS/MS. Extraction of chloramphenicol from food can be undertaken by
simple LLE procedures without requiring any sophisticated clean-up technique. The
methods were validated according to the criteria of Commission Decision 2002/657/EC
and were found appropriate for the analysis of chloramphenicol with limits of detection
way below the MRPL of 0.3 µg.kg-1. However, a very limited number of samples have
been analyzed using this method, which became common in the last 10 years. Most of
the studies performed focused on honey, milk and fish followed by shrimp, meats and
egg. Chloramphenicol was detected in raw milk samples at levels above the MRPL and
in trace amounts in fish. Even though chloramphenicol has been banned for use in food-
producing animals for many years, it is still being detected. Therefore, monitoring and

62
CAPÍTULO I
educational programs are needed to warrant safety of consumers and international
trade.

63
CAPÍTULO II
CAPÍTULO II - ADVANCES ON THE CHROMATOGRAPHIC
DETERMINATION OF AMPHENICOLS IN FOOD
Artigo publicado:
GUIDI, L.R.; TETTE, P.A.S.; FERNANDES, C.; SILVA, L.H.M.; GLORIA, M.B.A.
Advances on the chromatographic determination of amphenicols in food. Talanta, v.162,
p. 324-338, 2017.

64
CAPÍTULO II
ABSTRACT
Antibiotics are widely used in veterinary medicine to treat and prevent diseases and
their residues can remain in food of animal origin causing adverse effects to human
health. Amphenicols (chloramphenicol, thiamphenicol, and florfenicol) may be found in
foodstuffs, although the use of chloramphenicol has been prohibited in many countries
due to its high toxicity. Since these antibiotics are usually present at trace levels in food,
sensitive and selective techniques are required to detect them. This paper reviews
analytical methods used since 2002 for the quantitative analysis of amphenicols in food.
Sample preparation and separation/detection techniques are described and compared.
The advantages and disadvantages of these procedures are discussed. Furthermore,
the worldwide legislation and occurrence of these antibiotics in food matrices as well as
future trends are also presented.
Keywords: chloramphenicol; thiamphenicol; florfenicol; antibiotic; quantitative methods;
legislation; occurrence.

65
CAPÍTULO II
1. INTRODUCTION
Antibiotics are widely used for therapeutic and prophylactic purposes in human
and veterinary medicine and also to promote growth and increase feed efficiencies in
food producing animals (EC, 2010a). However, abused use of antibiotics and their
presence in food of animal origin are of concern due to development of resistance of
target pathogens against antibiotics, induced allergic reactions in some hypersensitive
individuals, potential compromise of the human intestinal and immune systems (GIKAS
et al., 2004; BLASCO & PICÓ, 2007; VORA & RAIKWAR, 2013; JECFA, 2014).
There is a diverse range of chemical substances with antimicrobial activity.
Among them, amphenicols, including chloramphenicol, thiamphenicol and florfenicol,
are readily available broad-spectrum antibiotics. Chloramphenicol was widely used in
the past in both human and veterinary medicine. However, due to serious adverse
effects to human health, it was banned from food producing animals and a zero
tolerance policy became effective (ALECHAGA et al., 2012; TAO et al., 2014; GUIDI et
al., 2015). Analogues of chloramphenicol – thiamphenicol and florfenicol – have been
developed and seem to be viable substitutes because they still have broad spectrum of
activity but do not cause the same adverse health effects brought about by
chloramphenicol (KOWALSKI et al., 2008). They have been widely used not only for
therapeutic and prophylactic purposes in veterinary medicine, but also to enhance feed
efficiency and to promote animal growth, especially in aquaculture. Excessive use of
amphenicols, or any antibiotics, in aquaculture, however, can contaminate water and
threaten water environmental security (XUE et al., 2015). Furthermore, high levels in
food of animal origin should be avoided to warrant food safety and international trade.
According to the literature, chloramphenicol can still be found in several food
matrices, suggesting its continued use (VERZEGNASSI et al., 2003; SANTOS et al.,
2005; MARTINS-JÚNIOR et al., 2006; SHERIDAN et al., 2008; LU et al., 2010; WANG
et al., 2011; SAMSONOVA et al., 2012; WU et al., 2012; GUIDI et al., 2015). Besides,
there is little information available regarding the occurrence of its analogues in foods of
animal origin and environment. Therefore, sensitive and reliable methods for the
analysis of amphenicols are needed.
The analysis of antibiotics in food is not a simple task. They must be detected at
extremely low part-per-billion levels. Furthermore, foods of animal origin are usually
complex matrices. Multi-analyte methods encompassing a whole class of antibiotic are

66
CAPÍTULO II
desired; however, they require non-selective sample preparation and, therefore, are
more prone to matrix effects which can compromise detection limits, quantitative and
selectivity aspects, as well as equipment maintenance (BLASCO & PICÓ, 2007;
BERENDSEN et al., 2010). The effective control of antimicrobials in foods requires the
combination of cost-effective and high sample throughput screening methods followed
by confirmation and quantification using more sophisticated methods. SAMSONOVA et
al. (2012) published an extensive review on screening methods for the detection of
amphenicols in foods. However, there is no recent overview on confirmatory and
quantitative methods for amphenicols determination in foodstuffs.
Different analytical methods have been developed for the quantification of
amphenicols in food. Two main steps are required: sample preparation followed by
separation and detection. During sample preparation it is important to properly extract
and concentrate the analytes and also to remove as many interfering compounds as
possible. Extraction and concentration of amphenicols from food can be accomplished
by solid-phase (SPE) and/or liquid-liquid (LLE) extraction. Miniaturized approaches
have also been used, aiming reduced use of solvents and reagents, and waste
generation (ANTHEMIDIS& IOANNOU, 2009; BARRETO et al., 2012). Many different
analytical techniques have been developed for the separation and detection of
amphenicols in food; however, gas chromatography (GC) coupled to electron capture
(ECD) or mass spectrometry (MS) detectors and liquid chromatography (LC) coupled to
ultraviolet, MS or MS/MS detector, are the most widely used.
In this context, this review presents the state of art, developments and
achievements since 2002 and the future trends on methods for the analysis of
amphenicols in several food matrices.
2. CHARACTERISTICS OF AMPHENICOLS AND SOME METABOLITES
Amphenicols are a class of broad spectrum and highly efficient antibiotics with a
phenylpropanoid structure. Although of natural origin, they have been produced by
chemical synthesis. The physico-chemical and other relevant characteristics of
amphenicols and some of their metabolites (CAS, 2015; VSBD, 2016) are summarized
in Table 1.

67
CAPÍTULO II
Table 1. Some physico-chemical characteristics of amphenicols and some metabolites
Analyte Chloramphenicol Thiamphenicol Florfenicol Florfenicol amine
Chloramphenicol-glucuronide
CAS number 56-75-7
15318-45-3
73231-34-2
76639-93-5
39751-33-2
EC number 200-287-4 239-355-3 - - - IUPAC name 2,2-dichloro-N-[(1R,2R)-1,3-
dihydroxy-1-(4-nitrophenyl) propan-2-yl]acetamide
2,2-dichloro-N-[(1R,2R)-1,3-dihydroxy-1-(4-methylsulfonylphenyl)propan-2-yl]acetamide
2,2-dichloro-N-[(1R,2S)-3-fluoro-1-hydroxy-1-(4-methylsulfonylphenyl)propan-2-yl]acetamide
(1R,2S)-2-amino-3-fluoro-1-(4-methylsulfonylphenyl)propan-1-ol, Sch 40458
(2S,3S,4S,5R,6R)-6-[(2R,3R)-2-[(2,2-dichloroacetyl)amino]-3-hydroxy-3-(4-nitrophenyl)propoxy]-3,4,5-trihydroxyoxane-2-carboxylic acid
Names Chlornitromycin; chloromycetin; levomycetin; chlorocid; globenicol
Thiocymetin, neomyson, thiocymetin, dextrosulphenidol
Aquaflor, nuflor, fluorothiamphenicol
Methyl triclosan, (2R,3R)-2-[(dichloroacetyl)amino]-3-hydroxy-3-(4-nitrophenyl)propyl |A-d-glucopyranosiduronic acid, Chloramphenicol 3-O-|A-D-Glucuronide
Molecular formula
C11H12Cl2N2O5
C12H15Cl2NO5S
C12H14Cl2FNO4S
C10H14FNO3S
C17H20Cl2N2O11
Molar mass (g/mol)
323.13
356.22
358.21
247.29
499.25
Melting point (°C)
150.5-151.5
165.3
153-154
152 °C
170-174
Pka 11.03 11.05 10.73 10.90 2.81 Log P 1.103 -0.24 1.175 -0.398 - Structure
Physical description
White to greyish-white or yellowish-white fine crystalline powder or fine crystals or needles
White or yellowish-white crystalline powder or crystals
White crystalline powder
White crystalline powder Off-white solid

68
CAPÍTULO II
Table 1. (continuation…)
Analyte Chloramphenicol Thiamphenicol Florfenicol Florfenicol amine
Chloramphenicol-glucuronide
Solubility High in ethyl acetate, acetone, ethanol, butanol, methanol, chloroform; Water solubility - 2500 mg.L-
1 (20 °C)
Slight in ethanol, acetone, acetonitrile, methanol; Barely in ether, ethyl acetate, chloroform; Water solubility – 5 mg.L-
1 (20 °C)
Water solubility – 1320 mg.L-1 (20 °C)
Water solubility – 2300 mg.L-1 (25 °C) slight in unbuffered water (pH 9.77) – 2400 mg.L-1 (25 °C) very soluble pH from 1 to 7; Soluble in organic solvents
Soluble in methanol; miscible with water
Stability Neutral and acid solutions are stable on heating; Solution undergoes degradation related to pH, temperature, photolysis and microbial activity
Stable at normal temperature and pressure
Stable at normal temperature and pressure
Stable at normal temperature and pressure
Stable at normal temperature and pressure
CAS (2015); VSDB (2016).

69
CAPÍTULO II
Amphenicols are efficient antibiotics against Gram-positive and Gram-negative
bacteria. They are especially effective against anaerobic microorganisms. They act by
inhibiting protein synthesis, by binding to ribosomal subunits of susceptible bacteria,
leading to the inhibition of peptidyl transferase, preventing the transfer of amino acids to
growing peptide chains and subsequent protein formation (KOWALSKI et al., 2008;
JECFA, 2014).
Chloramphenicol was the first amphenicol available. It was originally isolated
from Streptomyces venezuelae, a soil bacterium, but it is now synthetically produced. It
was widely used in 1950 to fight infections in human and veterinary medicine (GIKAS et
al., 2004; GUIDI et al., 2015). Although it is a very efficient antibiotic, with excellent
antibacterial activity and pharmacokinetics properties, its use was banned from food
producing animals in several countries due to serious adverse effects to human health
(WONGTAVATCHAI et al., 2004; GUIDI et al., 2015; HANEKAMP & BAST, 2015).
Today, its use in human medicine is restricted to ophthalmic and a few serious
infections (salmonellosis, staphylococcal brain diseases and life threatening infections
of the nervous system and respiratory tract). The veterinary use includes treatment of
enteric and pulmonary infections, skin and organ abscesses and mastitis (JECFA, 2014,
GUIDI et al., 2015; HANEKAMP & BAST, 2015).
Chloramphenicol is eliminated intact or it can be biotransformed in the liver into
the inactive metabolite chloramphenicol glucuronide (WONGTAVATCHAI et al., 2004;
EMEA, 2009). However, the indiscriminate use of chloramphenicol can lead to inherent
effects from antimicrobials, such as, bacterial resistance; allergic reactions; disruption of
the intestinal microbial flora; and also hemotoxic effects, including aplastic anemia,
bone marrow depression and ‘gray baby syndrome’. Bone-marrow depression occurs in
humans when daily doses are higher than 4 g, and this effect is reversible if the
treatment is discontinued. Another serious and not dose-related side effect is aplastic
anemia. Infants, especially premature babies, when exposed to high levels of
chloramphenicol, can develop ‘gray baby syndrome’. It probably occurs because
neonates have a poor hepatic biotransformation of chloramphenicol
(WONGTAVATCHAI et al., 2004; GUIDI et al., 2015). There are also indications that
chloramphenicol is genotoxic in vivo and could cause cancer. Although the evidence is
considered limited, it has been classified as group 2A by the International Agency for
Research on Cancer – IARC (IARC, 1990). Based on the information available, no
Acceptable Daily Intake (ADI) is established for chloramphenicol and a minimum
required performance limit (MRPL), which corresponds to the ‘minimum content that
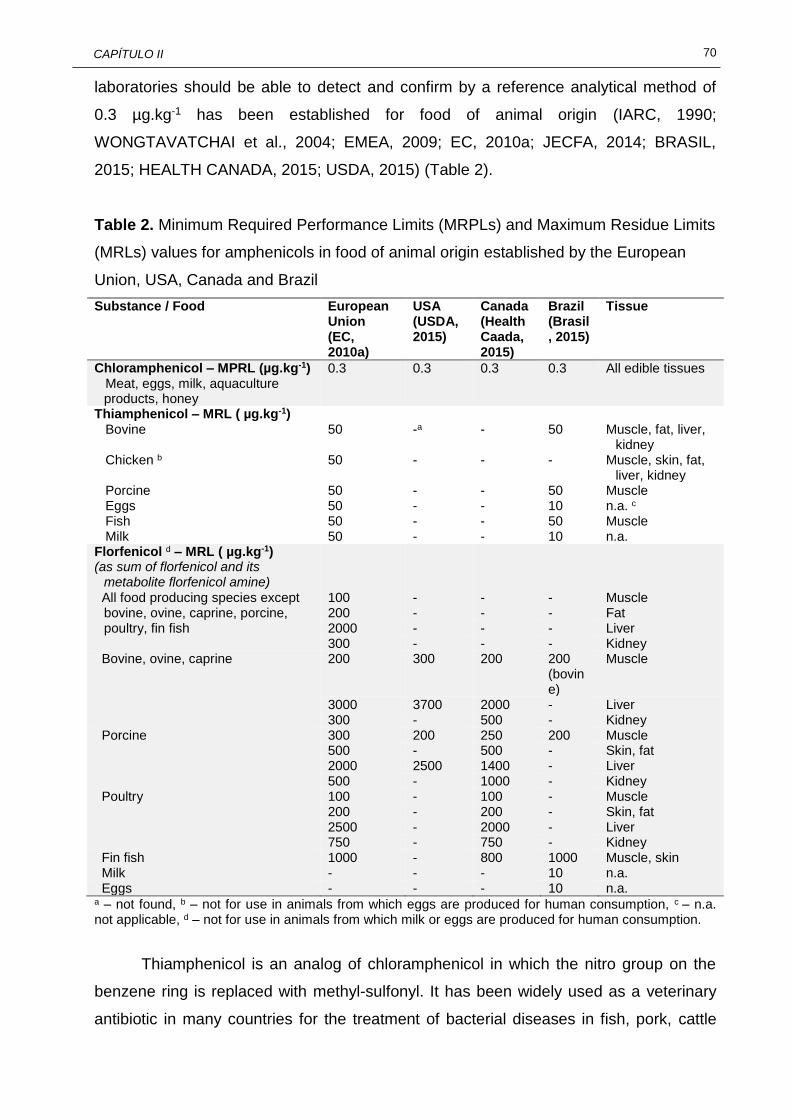
70
CAPÍTULO II
laboratories should be able to detect and confirm by a reference analytical method of
0.3 µg.kg-1 has been established for food of animal origin (IARC, 1990;
WONGTAVATCHAI et al., 2004; EMEA, 2009; EC, 2010a; JECFA, 2014; BRASIL,
2015; HEALTH CANADA, 2015; USDA, 2015) (Table 2).
Table 2. Minimum Required Performance Limits (MRPLs) and Maximum Residue Limits
(MRLs) values for amphenicols in food of animal origin established by the European
Union, USA, Canada and Brazil
Substance / Food European Union (EC, 2010a)
USA (USDA, 2015)
Canada (Health Caada, 2015)
Brazil (Brasil, 2015)
Tissue
Chloramphenicol – MPRL (µg.kg-1) Meat, eggs, milk, aquaculture
products, honey
0.3 0.3 0.3 0.3 All edible tissues
Thiamphenicol – MRL ( µg.kg-1) Bovine
50
-a
-
50
Muscle, fat, liver,
kidney Chicken b 50 - - - Muscle, skin, fat,
liver, kidney Porcine 50 - - 50 Muscle Eggs 50 - - 10 n.a. c Fish 50 - - 50 Muscle Milk 50 - - 10 n.a. Florfenicol d – MRL ( µg.kg-1)
(as sum of florfenicol and its metabolite florfenicol amine)
All food producing species except bovine, ovine, caprine, porcine, poultry, fin fish
100
-
-
-
Muscle
200 - - - Fat 2000 - - - Liver 300 - - - Kidney
Bovine, ovine, caprine 200 300 200 200 (bovine)
Muscle
3000 3700 2000 - Liver 300 - 500 - Kidney
Porcine 300 200 250 200 Muscle 500 - 500 - Skin, fat 2000 2500 1400 - Liver 500 - 1000 - Kidney
Poultry 100 - 100 - Muscle 200 - 200 - Skin, fat 2500 - 2000 - Liver 750 - 750 - Kidney
Fin fish 1000 - 800 1000 Muscle, skin Milk - - - 10 n.a. Eggs - - - 10 n.a. a – not found, b – not for use in animals from which eggs are produced for human consumption, c – n.a. not applicable, d – not for use in animals from which milk or eggs are produced for human consumption.
Thiamphenicol is an analog of chloramphenicol in which the nitro group on the
benzene ring is replaced with methyl-sulfonyl. It has been widely used as a veterinary
antibiotic in many countries for the treatment of bacterial diseases in fish, pork, cattle

71
CAPÍTULO II
and poultry. It is also available, in some countries, for human use, especially for the
treatment of pulmonary, prostate and venereal infections and pelvic inflammatory
diseases. Thiamphenicol is not readily metabolized in cattle, poultry, sheep, or man,
and it is excreted unchanged. In pigs and rats, it can also be excreted as thiamphenicol
glucoronate (LI et al., 2012; VORA & RAIKWAR, 2013; XIAO et al., 2015; YAO et al.,
2015).
Florfenicol is a fluorinated derivative of thiamphenicol, and has a fluorine atom,
instead of the hydroxyl group at C-3 (KOWALSKI et al., 2008; XIAO et al., 2015).
Besides being a broad spectrum antibiotic, it also has activity against some
chloramphenicol and thiamphenicol resistant bacterial strains. It has been widely used
in aquaculture and in the control of bovine respiratory and interdigital phlegmon
diseases (EMEA, 2009). Florfenicol is partly transformed into several metabolites,
among them, florfenicol amine which is the largest and the longest live metabolite,
reason why it has been considered a marker for florfenicol use. Florfenicol amine is the
4-methylsulphonophenylpropylamine parent compound formed by hydrolyzing the
dichloroacetamide of florfenicol (XIE et al., 2011).
The main advantage of thiamphenicol and florfenicol over chloramphenicol is that
they are not associated with the same adverse effects caused by chloramphenicol,
probably due to the absence of the nitro group. ADI values were allocated for both of
them (5 and 0-10 µg.kg-1 bw, respectively) (JECFA, 2014). To ensure the safety of food
for consumers, Maximum Residue Limits (MRLs) have been established for
thiamphenicol and for the sum of florfenicol and its metabolite florfenicol amine. As
indicated in Table 2, different MRLs have been established by different countries,
varying from 10 to 50 µg.kg-1 for thiamphenciol and from 10 to 3000 µg.kg-1 for the sum
florfenicol and florfenicol amine, depending on the sample tissue and also on the
legislation of a specific country (EC, 2010a; Brasil, 2015; Health Canada, 2015; USDA,
2015). In addition, instead of establishing standardized methods, the EU has set
requirements concerning performance of analytical methods and interpretation of results
(EC, 2010a). This freedom of choice for analytical approaches has transformed
antibacterial-residue analysis of food into a clear example of the benefits achievable by
recent-developed analytical techniques (BLASCO & PICÓ, 2007).

72
CAPÍTULO II
3. METHODS FOR THE ANALYSIS OF AMPHENICOLS IN FOOD
MATRICES
In general, the determination of amphenicols in food comprises two main steps.
The first one is sample preparation and it may include extraction, purification and
concentration. It will depend on the type of food sample and also on the method chosen
for analysis. Afterwards, the extract is submitted to analyte separation and
quantification. It is important to warrant that the sample is representative of the original
food and that it is homogeneous.
3.1. Sample preparation
Recent trends in analytical chemistry aim to simplify sample preparation
procedures and minimize the use of organic solvents (ANTHEMIDIS & IOANNOU,
2009). During sample preparation, the analytes of interest must be extracted from a
large amount of other components from the complex food matrices. Clean-up and
concentration steps may also be necessary to eliminate interferences and when the
analyte is too diluted in the extract. Sometimes, extraction and clean-up can be
accomplished in only one step, depending on the sample preparation technique
employed. Analyte losses at this stage can compromise analysis outcome. Thus,
sample preparation is a very important step within the entire analytical process. The
most widely used approaches are liquid-liquid extraction and/or solid-phase extraction;
however miniaturized approaches are becoming popular as they are environmental
friendly.
3.1.1. Liquid-liquid extraction
Liquid-liquid extraction (LLE), either alone or followed by solid-phase extraction
(SPE), is widely used for amphenicols’ analysis. Ethyl acetate is the most commonly
used LLE solvent (Table 3) for the extraction of amphenicols individually or as a mixture
(CHOU et al., 2009; BARRETO et al., 2012; TAKA et al., 2012; GUIDI et al., 2015). It
can also be associated with formic acid (NICOLICH et al., 2006; GUIDI et al., 2015), or
phosphate solution (ROCHA SIQUEIRA et al., 2009). When defatting is required,
hexane (CERKVENIK, 2002; DING et al., 2005; CHOU et al., 2009; DOUNY et al.,
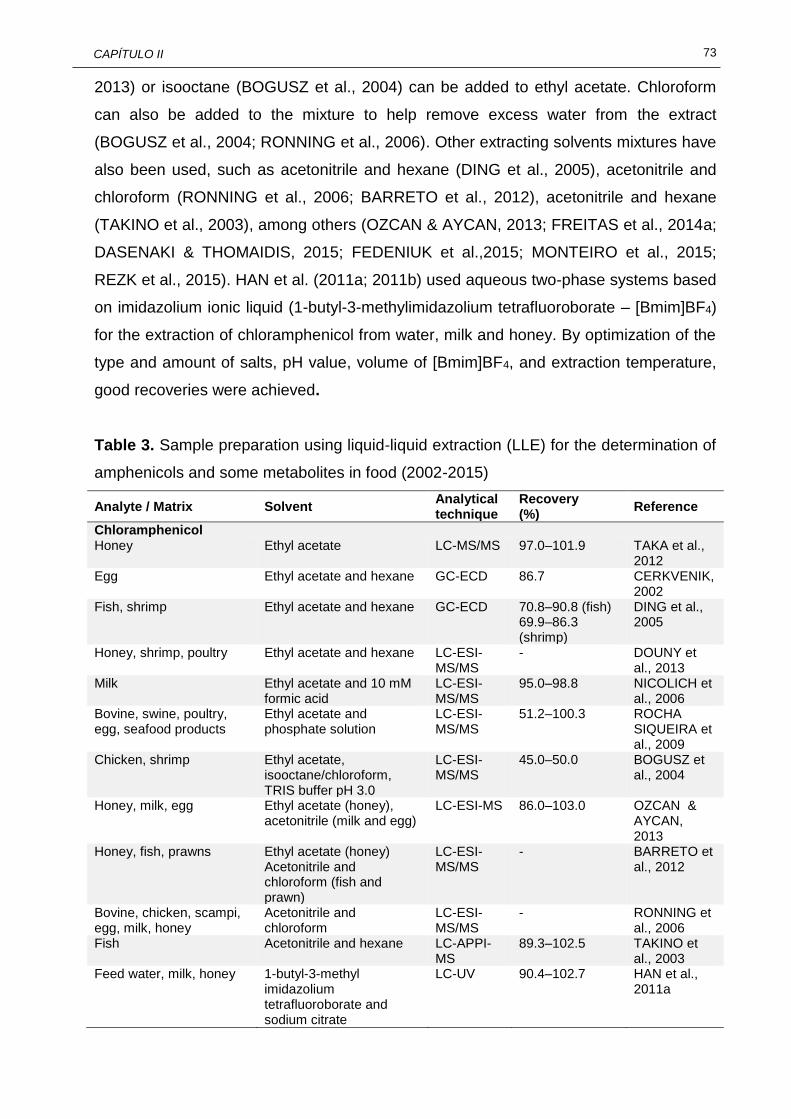
73
CAPÍTULO II
2013) or isooctane (BOGUSZ et al., 2004) can be added to ethyl acetate. Chloroform
can also be added to the mixture to help remove excess water from the extract
(BOGUSZ et al., 2004; RONNING et al., 2006). Other extracting solvents mixtures have
also been used, such as acetonitrile and hexane (DING et al., 2005), acetonitrile and
chloroform (RONNING et al., 2006; BARRETO et al., 2012), acetonitrile and hexane
(TAKINO et al., 2003), among others (OZCAN & AYCAN, 2013; FREITAS et al., 2014a;
DASENAKI & THOMAIDIS, 2015; FEDENIUK et al.,2015; MONTEIRO et al., 2015;
REZK et al., 2015). HAN et al. (2011a; 2011b) used aqueous two-phase systems based
on imidazolium ionic liquid (1-butyl-3-methylimidazolium tetrafluoroborate – [Bmim]BF4)
for the extraction of chloramphenicol from water, milk and honey. By optimization of the
type and amount of salts, pH value, volume of [Bmim]BF4, and extraction temperature,
good recoveries were achieved.
Table 3. Sample preparation using liquid-liquid extraction (LLE) for the determination of
amphenicols and some metabolites in food (2002-2015)
Analyte / Matrix Solvent Analytical technique
Recovery (%)
Reference
Chloramphenicol Honey Ethyl acetate LC-MS/MS 97.0–101.9 TAKA et al.,
2012 Egg Ethyl acetate and hexane GC-ECD 86.7 CERKVENIK,
2002 Fish, shrimp Ethyl acetate and hexane GC-ECD 70.8–90.8 (fish)
69.9–86.3 (shrimp)
DING et al., 2005
Honey, shrimp, poultry Ethyl acetate and hexane LC-ESI-MS/MS
- DOUNY et al., 2013
Milk Ethyl acetate and 10 mM formic acid
LC-ESI-MS/MS
95.0–98.8 NICOLICH et al., 2006
Bovine, swine, poultry, egg, seafood products
Ethyl acetate and phosphate solution
LC-ESI-MS/MS
51.2–100.3 ROCHA SIQUEIRA et al., 2009
Chicken, shrimp Ethyl acetate, isooctane/chloroform, TRIS buffer pH 3.0
LC-ESI-MS/MS
45.0–50.0 BOGUSZ et al., 2004
Honey, milk, egg
Ethyl acetate (honey), acetonitrile (milk and egg)
LC-ESI-MS 86.0–103.0 OZCAN & AYCAN, 2013
Honey, fish, prawns Ethyl acetate (honey) Acetonitrile and chloroform (fish and prawn)
LC-ESI-MS/MS
- BARRETO et al., 2012
Bovine, chicken, scampi, egg, milk, honey
Acetonitrile and chloroform
LC-ESI-MS/MS
- RONNING et al., 2006
Fish Acetonitrile and hexane LC-APPI-MS
89.3–102.5 TAKINO et al., 2003
Feed water, milk, honey 1-butyl-3-methyl imidazolium tetrafluoroborate and sodium citrate
LC-UV 90.4–102.7 HAN et al., 2011a

74
CAPÍTULO II
Table 3. (continuation…)
Analyte / Matrix Solvent Analytical technique
Recovery (%)
Reference
Bovine Acetonitrile and EDTA hexane
UHPLC-ESI-MS/MS
105.0 FREITAS et al., 2014a
Florfenicol Fish 1% formic acid aqueous
solution, acetonitrile and methanol
HPLC-ESI-MS/MS
96.9–104.3 REZK et al., 2015
Florfenicol amine Bovine, equine, porcine (kidney, liver, muscle)
6 N hydrochloric acid LC-MS/MS 60.0–65.0 FEDENIUK et al., 2015
Chloramphenicol and Florfenicol Fish 0.1 M Na2EDTA and
acetonitrile: water (0.1% formic acid, 70:30 v/v)
LC-ESI-MS/MS
83.8–110.1 MONTEIRO et al., 2015
Thiamphenicol and Florfenicol Pork (meat, liver, kidney), beef (meat, liver), chicken, fish
Ethyl acetate and n-hexane
LC-ESI-MS/MS
72.5–97.6 CHOU et al., 2009
Chloramphenicol, Thiamphenicol and Florfenicol Milk powder, butter, fish tissue, eggs
0.1% formic acid (v/v) and 0.1% EDTA (w/v), methanol and acetonitrile
LC-ESI-MS/MS
Butter (81.5–84.9) Egg (59.7–65.2) Fish (78.7–86.6) Milk (57.1–67.8)
DASENAKI & THOMAIDIS, 2015
a – not found; APPI – Atmospheric pressure photoionization; CAP – Chloramphenicol; CCβ – Detection capability; ECD – Electron capture detector; EDTA – ethylenediamine-tetraacetic acid; ESI – Electrospray ionization; FF – Florfenicol; FFA – Florfenicol amine; GC – Gas chromatography; LC – Liquid chromatography; LOQ – Limit of quantification; MS – Mass spectrometry; MS/MS – Tandem mass spectrometry; SPR – Surface plasmon resonance; TAP – Thiamphenicol; UHPLC – ultra high performance liquid chromatography; UV – ultraviolet detector.
3.1.2. Solid-phase extraction
Solid-phase extraction (SPE) has also been extensively used as sample
preparation technique for amphenicols analysis in foodstuffs, either by itself or
associated with LLE.
Simple SPE has been used by mixing the sample with the sorbent or by direct
application of liquid samples to the sorbent. Octadecylsilane (C18) and Oasis HLB
(poly(divinylbenzene-co-N-vinylpyrrolidone)copolymer) are the most commonly used
SPE sorbents (Table 4). The first has been used to extract chloramphenicol from milk
(RAMOS et al., 2003), honey (BOGUSZ et al., 2004) and chicken (TAJIK et al., 2010)
and also chloramphenicol and its metabolite from honey (BOGUSZ et al., 2004). Oasis
HLB has been used for individual (ISHII et al., 2006; SHERIDAN et al., 2008) or multi
amphenicols (ALECHAGA et al., 2012; AZZOUZ & BALLESTEROS, 2015). Both
sorbents can provide satisfactory recoveries. EXtrelut®NT has also been used to extract

75
CAPÍTULO II
chloramphenicol from honey, milk and bovine meat (CERKVENIK, 2002; KAUFMANN &
BUTCHER, 2005).
Table 4. Sample preparation using solid-phase extraction (SPE) for the determination of
amphenicols and some metabolites in food (2002-2015)
Analyte / Matrix Sorbent Analytical technique
Recovery (%)
Reference
Chloramphenicol Milk Sep Pak C18 LC-UV 78.9 RAMOS et al.,
2003 Chicken (liver, kidney, muscle)
C18 LC-UV 87.5 (liver), 79.3 (kidney), 63.2 (muscle)
TAJIK et al., 2010
Honey Extrelut NT UHPLC-ESI-MS/MS
95.0–108.0 KAUFMANN & BUTCHER, 2005
Honey Oasis HLB LC-ESI-MS/MS 92.5±8.8 (ISHII et al., 2006
Honey Oasis HLB LC-ESI-MS/MS 78.0 SHERIDAN et al., 2008
Milk, shrimp MIP LC-UV 90.2–99.9 (milk), 84.9–89.0 (shrimp)
SHI et al., 2007
Honey MIP LC-Q-TOF-MS 92.3–99.1 SHI et al., 2010 Milk MIP Square-wave
voltammetry 67.0–101.0 MENA et al.,
2003 Egg, honey, milk Multi-walled
carbon nanotubes LC-ESI-MS/MS 95.8–102.3 LU et al., 2010
Florfenicol Chicken, fish MIP LC-UV 88.9 (fish),
93.5 (chicken) SADEGHI & JAHANI, 2013
Chloramphenicol and metabolite Honey Bond Elut C18
LRC LC-ESI-MS/MS 60.0–69.0 BOGUSZ et al.,
2004 Chloramphenicol, Thiamphenicol and Florfenicol Egg, honey Oasis HLB GC-MS 89.0–101.0 AZZOUZ &
BALLESTEROS, 2015
Chloramphenicol, Thiamphenicol, Florfenicol and Florfenicol amine Honey Oasis HLB UHPLC-ESI-
MS/MS 52.0–95.0 ALECHAGA et
al., 2012 a – not found; GC – gas chromatography; LC – liquid chromatography; MIP – Molecularly imprinted polymer; MS – mass spectrometry; MS/MS – Tandem mass spectrometry; TAP – thiamphenicol; TOF – time of flight; UHPLC – ultra high pressure liquid chromatography; UV – ultraviolet.
Alternative sorbent materials have been used to improve recovery and selectivity,
especially for individual amphenicols. LU et al. (2010) described the use of multi-walled
carbon nanotubes (MWCN) as sorbent for the determination of chloramphenicol in egg,
honey, and milk by LC-MS/MS. MWCN have attracted attention due to the high specific
area and hydrophobic characteristic of its surface, which improves recoveries (95.8 to
102.3%). Molecularly imprinted polymers (MIPs) have also been successfully used as
sorbent (MENA et al., 2003; SHI et al., 2007; SHI et al., 2010; SADEGHI & JAHANI,

76
CAPÍTULO II
2013). MIPs are highly cross-linked synthetic polymers designed to allow improved
selectivity towards a certain structure or to a very closely related structure. Due to their
characteristics, MIPs can selectively extract amphenicols from different matrices. SHI et
al. (SHI et al., 2007; SHI et al., 2010) described the determination of chloramphenicol in
honey using MIP as a SPE sorbent (MISPE) compared to both LLE and SPE with C18
sorbent and liquid chromatography coupled to Q-TOF MS. Recoveries obtained with
LLE and SPE were about 80% whereas MISPE improved recoveries (92.3 to 99.1%).
Florfenicol was also extracted from chicken, fish and honey samples using MIP as
sorbent (SADEGHI & JAHANI, 2013). Based on these studies, the use of MWCN and
MIP has been limited to the extraction of a single amphenicols from different food
matrices.
The combination of LLE and SPE is also a common procedure in the analysis of
amphenicols as described in Table 5 for chloramphenicol in honey, milk, egg, meats
and feed (CERKVENIK, 2002; MOTTIER et al., 2003; VERZEGNASSI et al., 2003;
RAMOS et al., 2003; GUY et al., 2004; FORTI et al., 2005; GALLO et al., 2005;
CERKVENIK-FAJS, 2006; ISHII et al., 2006; POLZER et al., 2006; VINAS et al., 2006;
TIAN, 2011; MORAGUES et al., 2012; WU et al., 2012; KAUFMANN et al., 2015),
florfenicol in honey and feed (HAYES et al., 2009; SADEGHI & JAHANI, 2013) and the
amphenicols and florfenicol amine in muscle and liver tissues (SHEN et al., 2009;
ALECHAGA et al., 2012). Generally, the solvents and sorbents are similar to those used
on LLE and SPE methods. Usually, the use of a second technique during sample
preparation (LLE or SPE) is introduced to obtain extracts with less interference. As
examples, ALECHAGA et al. (2012) and SHEN et al. (2009) used SPE after LLE since
the latter was not able to completely purify the samples for multi amphenicols analysis.

77
CAPÍTULO II
Table 5. Sample preparation using liquid-liquid (LLE) and solid-phase extraction (SPE)
for the determination of amphenicols and some metabolites in food (2002-2015)
Analyte / Matrix LLE SPE Recovery (%) Reference
Chloramphenicol Chicken Ethyl acetate Silica Sep
Pak 86.8 RAMOS et al.,
2003 Animal feed Ethyl acetate Discovery
DSC-18Lt SPE
92.4–98.5 VINAS et al., 2006
Porcine, bovine, ovine, caprine, equine, rabbit, broiler feed
Ethyl acetate Bond Elut C18
82.0 MORAGUES et al., 2012
Fish Ethyl acetate Graphene 92.3–103.4 WU et al., 2012 Milk, honey, egg, fish Ethyl acetate Oasis HLB 98–102 (milk),
97–102 (honey), 101–120 (egg), 101–108 (fish)
KAUFMANN et al., 2015
Shrimp, crayfish, prawn
Ethyl acetate and hexane C18 95.0 POLZER et al., 2006
Bovine, milk Ethyl acetate and hexane Extrelut NT 20
88.9 (bovine muscle), 102.2 (milk)
CERKVENIK, 2002
Chicken, turkey, pork, beef, seafood (shrimp, fish flour)
Ethyl acetate and diethyl ether (75:25 v/v)
Silica 60.0±5.0 MOTTIER et al., 2003
Bovine milk Acetonitrile SampliQ C18
74.0–87.0 TIAN, 2011
Honey Acetonitrile:dichloromethane (4:1 v/v)
Oasis HLB - VERZEGNASSI et al., 2003
Milk Trichloroacetic acid 10% (v/v)
Oasis HLB 30.0±4.0 GUY et al., 2004
Honey Dichloromethane:acetone (1:1 v/v)
C18 98.8 FORTI et al., 2005
Milk Acetonitrile AAG afinitty 78.4 GALLO et al., 2005
Muscle Water and hexane Extrelut NT - CERKVENIK-FAJS, 2006
Royal jelly 1% Metaphosphoric acid:methanol (4:6)
Oasis HLB 95.1±7.0 ISHII et al., 2006
Florfenicol Honey Ethyl acetate MIP 96.2 SADEGHI &
JAHANI, 2013 Swine feed Acetonitrile:water (1:1 v/v) ENVI-Carb 99.7 HAYES et al.,
2009 Chloramphenicol, Thiamphenicol, Florfenicol and Florfenicol amine Poultry, pork (muscle, liver)
Ethyl acetate:ammonium hydroxide (98:2 v/v) and hexane
Oasis HLB 78.5–105.5 SHEN et al., 2009
Prawns, pork, chicken, fish
Acetonitrile and 0.1% acetic acid
Oasis HLB 59.0–90.0 ALECHAGA et al., 2012
a – not found.

78
CAPÍTULO II
3.1.3. Miniaturized approaches
Miniaturized approaches have also been used for extraction and clean-up of
amphenicols in food and these techniques allow minimized sample size and solvents
volumes, making them environmentally friendly. HUANG et al. (2006) described the use
of a monolithic capillary microextraction procedure for extraction of chloramphenicol
from honey, milk and eggs. The device was composed of an extraction pinhead, a
syringe barrel, and replacement of the metallic needle of the pinhead with a poly (MAA-
EGDMA) monolith capillary column. Improved recoveries were obtained compared to
conventional approaches. Dispersive liquid-liquid microextraction was applied in the
analysis of chloramphenicol and thiamphenicol in honey samples. The main advantages
of the method were high enrichment factor, high recoveries and reduced extraction
solvent volume to µL level (CHEN et al., 2008; CHEN et al., 2009). In another approach,
CHEN and LI (2013) developed a method for the analysis of chloramphenicol in honey
by means of magnetic molecularly imprinted polymer extraction which provided good
recoveries ranging from 84.3 to 90.9%. LI et al. (2012) also used molecularly imprinted
polymer for the analysis of thiamphenicol in milk and honey; however, solid-phase
microextraction was the sample preparation technique. Improved recoveries were
achieved (92.9 to 99.3%).
SNIEGOCKI et al. (2015) used QuEChERS (Quick, Easy, Cheap, Effective,
Rugged and Safe) for the extraction of chloramphenicol from milk and dairy products,
and obtained good recoveries (97.8 to 102.8%). According to the authors, the main
advantage of QuEChERS is that it allows extraction and clean-up in simple steps for all
matrices, without additional need for purification of the extracts. Recently, LIU et al.
(2016) applied a modified QuEChERS for the analysis of chloramphenicol,
thiamphenicol and florfenicol in milk and honey, achieving good recoveries.
3.2. Separation and detection techniques
Due to the high complexity of food matrices and low concentration of
amphenicols in food, analytical techniques with high selectivity and sensitivity are
needed. Several different analytical techniques are available. However, irrespective of
the selected method, adequate limits of detection must be achieved to comply with
stringent requirements established for chloramphenicol, which has been banned from
food producing animals (LEON et al., 2012; GUIDI et al., 2015).

79
CAPÍTULO II
The most widely used analytical methods for the analysis of amphenicols in food
are gas chromatography and high performance liquid chromatography. However, other
techniques have also been described in the literature, among them, capillary
electrophoresis (KOWALSKI, 2007; KOWALSKI et al., 2008; ZHANG et al., 2008),
micellar electrokinetic chromatography (KOWALSKI et al., 2011), molecular imprinted
polymers with voltammetric detection (MENA et al., 2003), thin layer chromatography
(RAMIREZ et al., 2003), high-throughput suspension array technology (SU et al., 2011)
and other less common ones (HUANG et al., 2009; KARA et al., 2013; KOR & ZAREI,
2014; TAN et al., 2015).
Tables 6 and 7 present the methods for separation and detection of amphenicols
in food by gas chromatography and liquid chromatography, respectively. The majority of
the methods were validated to demonstrate fitness for the purpose. When validation
followed Commission Decision 2002/657/EC (EC, 2002), the sensitivity of the method
was reported as decision limit (CCα) and the detection capability (CCβ). However, when
other validation protocols were used, the limit of detection (LOD) and the limit of
quantification (LOQ) were calculated. This is the reason why these tables present all
four of these important parameters to assess the sensitivity of the methods. In the
majority of the methods, especially when mass spectrometry is involved, isotope labeled
standards is used. Matrix matched calibration curves can also be used to compensate
for matrix effects that could influence analytical response (EC, 2002;
HEWAVITHARANA, 2011; GUIDI et al., 2015).
3.2.1. Gas chromatography
A summary of gas chromatographic procedures described in the literature from
2002 to 2015 for the analysis of amphenicols in food is presented in Table 6. Gas
chromatography (GC) has been used to analyze mainly chloramphenicol in different
foodstuffs, such as seafood, animal tissues, honey and milk (DING et al., 2005;
SANCHEZ-BRUNETE et al., 2005; SANTOS et al., 2005; SHEN et al., 2005;
CERKVENIK-FAJS, 2006; POLZER et al., 2006; ZHANG et al., 2006; SNIEGOCKI et
al., 2007; REJTHAROVA & REJTHAR, 2009; SILVA et al., 2010). It has also been used
to analyze a mixture of the three amphenicols (LI et al., 2006; AZZOUZ &
BALLESTEROS, 2015) and a mixture of the three amphenicols plus florfenicol amine
(SHEN et al., 2009).
80
CAPÍTULO II
Since amphenicols are polar, non-volatile and thermolabile molecules, prior to
GC analysis, they must be transformed into stable volatile compounds. The most widely
used derivatization reagents were N,O-bis(trimethylsilyl)trifluoroacetamide (BSTFA) and
trimethylchlorosilane (TMCS) (99:1, v/v) (RAMIREZ et al., 2003; DING et al., 2005;
ZHANG et al., 2008; SHI et al., 2010; SU et al., 2011; LEON et al., 2012; AZZOUZ &
BALLESTEROS, 2015; SNIEGOCKI et al., 2015) and hexamethyldisilazane (HMDS)
and trimethylchlorosilane (TMCS) and pyridine (3:1:9; v/v/v and 2:1:10, v/v/v)
(SANCHEZ-BRUNETE et al., 2005; SANTOS et al., 2005; SHEN et al., 2009; SILVA et
al., 2010). According to SHEN & JIANG (2005), the sensitivity of BSTFA derivatized
products increased with increasing reaction time. However, almost 240 min was
required to reach a maximum. When 1% of TMCS was added to BSTFA, the
derivatization reaction was completed in 40 min with high sensitivity. Therefore,
derivatization was better accomplished at 70 °C for 40 min by using BSTFA + TMCS
(99:1) as derivatization agent. It should be highlighted that derivatization is an extra step
in sample preparation and can lengthen analysis time, what can affect reproducibility at
trace levels (GUIDI et al., 2015).
Gas chromatography has been used for the analysis of chloramphenicol with
electron capture – EC (DING et al.,2005; SHEN & JIANG, 2005; CERKVENIK-FAJS,
2006; ZHANG et al., 2006; SILVA et al., 2010) or mass spectrometry – MS detectors
(SANTOS et al., 2005; SANCHEZ-BRUNETE et al., 2005; POLZER et al., 2006;
SNIEGOCKI et al., 2007; REJTHAROVA & REJTHAR, 2009). MS detectors have also
been used for a mixture of amphenicols using MS detectors (LI et al., 2006; SHEN et
al., 2009; AZZOUZ & BALLESTEROS, 2015).
Phenyl methylsiloxane (5%) was the most commonly used stationary phase in
columns which varied from 30 to 125 m length, 0.20 to 0.32 mm internal diameter and
0.25 to 0.50 µm particle size. The sensitivity of the methods was adequate for the
analysis of amphenicols using both mass spectrometry (MS) and electron capture (EC)
detectors, achieving limits of quantification of 0.0012-0.0014 (chloramphenicol) and of
0.0014 µg.kg-1 (thiamphenicol, florfenicol and florfenicol amine) in eggs and honey in
poultry and porcine muscle and liver).

81
CAPÍTULO II
Table 6. Gas chromatographic methods for the separation and detection of amphenicols and some metabolites in food (2002-2015)
Analyte / Matrix Detection Column LOD (µg.kg-1)
LOQ (µg.kg-1)
CCα (µg.kg-1)
CCβ (µg.kg-1)
Reference
Chloramphenicol Seafood, meat, honey ECD 5% diphenyl 95%
dimethylpolysiloxane (30 m x 0.25 mm, 0.25 µm)
- 0.1 - - SHEN & JIANG, 2005
Muscle tissue ECD 5% phenyl methylsiloxane (50 m x 0.2 mm, 0.33 µm)
- - 0.07 0.12 CERKVENIK-FAJS, 2006
Goat milk ECD 100% dimethylpolysiloxane (60 m x 0.25 mm, 0.25 µm)
0.030 0.10 - - SILVA et al., 2010
Fish, shrimp µ-ECD 5% phenyl methylsiloxane (30 m x 0.32 mm, 0.50 µm)
0.04 0.1 -a - DING et al., 2005
Chicken (muscle, liver) µ-ECD 5% phenyl methyl silicone (30 m x 0.32 mm, 0.50 µm)
0.2–2.0 0.05 (muscle), 0.1 (liver)
- - ZHANG et al., 2006
Honey MS 5% phenyl polysiloxane (30 m x 0.25 mm, 0.25 µm)
0.05 0.2 - - SANCHEZ-BRUNETE et al., 2005
Rainbow trout MS Permabond OV (125 m x 0.25 mm, 0.25 µm)
- - - - SANTOS et al., 2005
Crustaceans MS 5% phenyl 95% dimethylpolysiloxane (30 m x 0.25 mm, 0.25 µm)
- - 0.07 - POLZER et al., 2006
Milk, honey MS 100% dimethylpolysiloxane (30 m x 0.25 mm, 0.25 µm)
- - 0.06–0.2 (honey), 0.03–0.08 (milk)
0.1–0.3 (honey), 0.05–0.1 (milk)
REJTHAROVA & REJTHAR, 2009
Milk MS/MS 100% dimethylpolysiloxane (30 m x 0.25 mm, 0.25 µm)
- - 0.083 0.14 SNIEGOCKI et al., 2007
Chloramphenicol, Thiamphenicol and Florfenicol Pork, poultry, aquatic products
MS Phenyl arylene polymer (5% phenyl methylpolysiloxane) (30 m x 0.25 mm, 0.25 µm)
0.03 (CAP), 0.2 (FF, TAP)
- - - LI et al., 2006
Egg, honey MS 95% polydimethylsiloxane (30 m x 0.25 mm, 0.25 µm)
0.0004 (CAP egg), 0.0005 (CAP honey), 0.0005 (TAP), 0.0005 (FF)
0.0012 (CAP egg), 0.0014 (CAP honey), 0.0014 (TAP), 0.0014 (FF)
- - AZZOUZ & BALLESTEROS, 2015

82
CAPÍTULO II
Table 6. (continuation…)
Analyte / Matrix Detection Column LOD (µg.kg-1)
LOQ (µg.kg-1)
CCα (µg.kg-1)
CCβ (µg.kg-1)
Reference
Chloramphenicol, Thiamphenicol, Florfenicol and Florfenicol amine Poultry, pork (muscle, liver)
MS 5% phenyl methylpolysiloxane (30 m x 0.25 mm, 0.25 µm)
0.1 (CAP) 0.5 (TAP, FF, FFA)
0.25 (CAP) 2.0 (TAP, FF, FFA)
- - SHEN et al., 2009
a – not found; CAP – chloramphenicol; CCα – decision limit; CCβ – capacity of detection; ECD – electron capture detector; FF – florfenicol; LOD – limit of detection;
LOQ – limit of quantification ; MS – mass spectrometry; MS/MS – tandem mass spectrometry; TAP – thiamphenicol.

83
CAPÍTULO II
SNIEGOCKI et al. (2007) analyzed chloramphenicol in milk using a 100%
dimethylpolysiloxane (300 x 0.25 mm i.d., 0.25 µm) stationary phase and a tandem
mass spectrometry detector (MS/MS), finding values for decision limit (CCα) and
detection capability (CCβ) of 0.083 and 0.14 µg.kg-1 , respectively. The authors
compared the efficiency of this method with a LC-MS/MS procedure and observed
similar sensitivity however, the latter provided better validation parameters (recovery,
repeatability, and uncertainty) and it was less time consuming. Based on these results,
it is possible to analyze chloramphenicol individually or all amphenicols and the
metabolite florfenicol amine simultaneously by GC or liquid chromatography and obtain
reliable results.
3.2.2. Liquid chromatography
As indicated in Table 7, high performance liquid chromatography (HPLC)
associated with mass spectrometry (MS) was the most widely used technique for the
analysis of amphenicols in foods from 2002 until 2015. Indeed, LC coupled with MS
detection is getting expanded use in quality control laboratories due to the possibility of
simultaneously analysis of multiple residues in a sample in a relatively short time.
In the majority of the studies for the analysis of both single and multi-amphenciols
by HPLC, the most widely used column was C18 and it provided suitable retention and
separation of amphenicols. However, other types of columns were also used for
chloramphenicol, among them, C12 (GALLO et al., 2005), amide-C16 (VINAS et al.,
2006), and methylcellulose-immobilized reversed-phase (KAWANO et al., 2015). A
phenyl column was used to separate thiamphenicol and florfenicol (CHOU et al., 2009).
And all amphenicols were separated by means of a C8 column (SNIEGOCKI et al.,
2007; EVAGGELOPOULOU & SAMANIDOU, 2013). Most of the HPLC methods used
gradient elution with mobile phases comprising of water and acetonitrile (GUY et al.,
2004; CHEN et al., 2005; LUO et al., 2010; RODZIEWICZ & ZAWADZKA, 2007;
BARRETO et al., 2012; WU et al., 2012 KAWANO et al., 2015; ZHANG et al., 2008) or
methanol and water (HUANG et al., 2006; SHI et al., 2007; CHEN et al., 2009; ROCHA
SIQUEIRA et al., 2009; HAN et al., 2011b; SADEGHI & JAHANI, 2013; PAN et al.,
2015; LU et al., 2016). Such mobile phases were acidified in some studies with formic
acid (NICOLICH et al., 2006; RONNING et al., 2006; CHOU et al., 2009; LU et al.,
2010; FERNANDEZ-TORRES et al., 2011; TIAN, 2011; LU et al., 2012; FREITAS et al.,
2014a; GUIDI et al., 2015; MONTEIRO et al., 2015; REZK et al., 2015; WANG et al.,

84
CAPÍTULO II
2016), acetic acid (SANTOS et al., 2005; QUON et al., 2006; SHERIDAN et al., 2008;
CRONLY et al., 2010; CHEN & LI, 2013) or buffer solutions (BOGUSZ et al., 2004;
ASHWIN et al., 2005; FORTI et al., 2005; GALLO et al., 2005; ISHII et al., 2006;
MARTINS-JÚNIOR et al., 2006; PAN et al., 2006; VINAS et al., 2006; MAMANI et al.,
2009; WANG et al., 2011; TAO et al., 2014; KAUFMANN et al., 2015; SAMANIDOU et
al., 2015) to improve separation from interferences. Propanol (FEDENIUK et al., 2015;
REZK et al., 2015) and triethylamine (XIE et al., 2011) were also used as a mobile
phase components. However, good separation and sensitivity of all three amphenicols
and florfenicol amine was achieved by simply using acetonitrile and water as mobile
phase (ZHANG et al., 2008).
Only in a few studies, ultra-high performance liquid chromatography (UHPLC)
was used. It provided the most comprehensive method for the analysis of the three
amphenicols (chloramphenicol, thiamphenicol and florfenicol) along with the major
florfenicol metabolite – florfenicol amine (ALECHAGA et al., 2012). Separation was
obtained by means of a phenyl–hexyl column and methanol and acetate buffer pH 5.0
as mobile phases in gradient elution. It was used in chicken, pork, fish, prawns and
honey and achieved complete separation of all analytes in less than 2 minutes. The
other UHPLC method reported (ZHAN et al., 2013) was able to separate
chloramphenicol, thiamphenicol and florfenicol from 220 veterinary drug residues and
other contaminants in infant formulas in less than 4 minutes, providing fast analysis.
Furthermore it is environmental friendly as it uses less amounts of solvents.
Several detectors have also been used in the analysis of amphenicols by HPLC
in food. The most widely used was mass spectrometry detectors (MS), however, other
detectors were also used, including ultraviolet detector (UV) (SHI et al., 2007; CHEN et
al., 2009; HAN et al., 2011b; SADEGHI & JAHANI, 2013; LU et al., 2016), diode array
detector - DAD (VINAS et al., 2006; MAMANI et al., 2009; EVAGGELOPOULOU &
SAMANIDOU, 2013; SAMANIDOU et al., 2015), and fluorescence detector - FLD (XIE
et al., 2011). However, most of the detection systems, except for MS, were not sensitive
enough to evaluate compliance of samples to legislation regarding chloramphenicol
(MPRL values established by current legislation). Therefore, the most recommended
approach for the analysis of chloramphenicol in food matrices is liquid chromatography
coupled to tandem mass spectrometry detection (MS/MS) with electrospray ionization
(ESI).

85
CAPÍTULO II
Table 7. Liquid chromatographic methods for the separation and detection of amphenicols and some metabolites in food (2002-2015)
Analyte / Matrix
Detection Column Mobile Phase LOD (µg.kg-1) LOQ (µg.kg-1) CCα (µg.kg-1) CCβ (µg.kg-1) Reference
Chloramphenicol Milk, Shrimp UV C18 (250 x 4.6
mm, 5 µm) A: methanol, B: water (40:60, v/v)
- - - - SHI et al., 2007
Milk, honey UV C18 (250 x 4.6 mm, 5 μm)
A: water, B: methanol (55:45, v/v)
0.1 µg.L-1 0.3 µg.L-1 - - HAN et al., 2011a
Shrimp UV C18 (250 x 4.6 mm, 5 µm)
A: water, B: methanol 0.8 1.0 - LU et al., 2016
Milk DAD C18 A: 0.075 M sodium acetate, 0.035 M calcium chloride, 0.025 M NaEDTA, pH 7, B: methanol:acetonitrile (75:25, v/v)
20 µg.L-1 60 µg.L-1 - - MAMANI et al., 2009
Bran, soya, calf, cow, bull
DAD Amide C16 (150 x 4.6 mm, 5 µm)
A: acetonitrile, B: 10 mM monopotassium phosphate, pH 5 (20/80, v/v)
0.7 - - - VINAS et al., 2006
Milk, honey, egg, fish
HRMS C18 (50 x 2.1 mm, 1.7 µm)
A: 10 mM ammonium acetate
- methanol (8:2, vv) + 0.37 mL ammonium hydroxide (25%), B: methanol
0.05 - 0.01 (milk), 0.01 (honey), 0.02 (egg), 0.01 (fish)
0.01 (milk), 0.02 (honey), 0.03 (egg), 0.02 (fish)
KAUFMANN et al., 2015
Honey, milk, eggs
ESI-MS C18 (150 x 2.1 mm, 3.5 µm)
A: methanol-water (10:90, v/v), B: Methanol
0.02 (honey), 0.04 (milk, egg)
0.07 (honey), 0.14 (milk, egg)
- - HUANG et al., 2006
Honey ESI-MS C18 (100 & 250 x 4.6 mm, 5 µm)
A: methanol, B: 0.2% ammonium acetate (45:55, v/v)
- - 0.002 0.006 PAN et al., 2006
Seafood ESI-MS/MS
C18 (150 x 2.1 mm, 3.5 µm)
A: 2% NH4OH, B: acetonitrile (60:40, v/v)
- 0.02 - - GIKAS et al., 2004
Milk powders ESI-MS/MS
C18 (150 x 2.1 mm, 3.5 µm)
A: water, B: acetonitrile - - 0.02 0.03 GUY et al., 2004
Honey ESI-MS/MS
C18 (7.5 x 4.6 mm, 3 µm)
A: methanol, B: ammonium acetate, (60:40, v/v)
- - 0.07 0.10 FORTI et al., 2005

86
CAPÍTULO II
Table 7. (continuation…)
Analyte / Matrix
Detection Column Mobile Phase LOD (µg.kg-1) LOQ (µg.kg-1) CCα (µg.kg-1) CCβ (µg.kg-1) Reference
Honey, kidney ESI-MS/MS
C18 (50 x 2.1 mm, 1.7 µm)
A: 1 mL ammonia (25%) in 1 L 10% acetonitrile, B: 1 mL ammonia (25%) in 1 L acetonitrile
0.02 – 0.04 - 0.007–0.019 0.013–0.023 KAUFMANN & BUTCHER, 2005
Rainbow trout ESI-MS/MS
C18 (150 x 2.1 mm, 5 µm, C8 pre-column
A: water- acetic acid (1000:1 v/v), B: water-acetonitrile-acetic acid (1:9:0.001)
- - 0.267 0.454 SANTOS et al., 2005
Honey MS/MS C18 (150 x 2.0 mm, 3.5 µm)
A: 0.1% acetic acid, B: acetonitrile
0.16 0.21 - - QUON et al., 2006
Honey, royal jelly
ESI-MS/MS
C18 A: 10 mM ammonium acetate, B: Acetonitrile
- 0.3 (honey), 1.5 (royal jelly)
- - ISHII et al., 2006
Milk, honey ESI-MS/MS
C18 (50.0 x 2.1 mm, 3 μm)
A: 5.0 mM ammonium acetate, B: methanol/water (95:5, v/v)+ 5 mM ammonium acetate
0.00052 0.00185 - - MARTINS-JÚNIOR et al., 2006
Meat, seafood, egg, honey, milk, plasma, urine
ESI-MS/MS
C18 (55 x 4.0 mm, 3 µm)
A: 0.15% formic acid in water, B: methanol
- - 0.02 0.04 RONNING et al., 2006
Honey ESI- MS/MS
C18 (150 x 2.0 mm, 5 µm)
A: water, B: acetonitrile, (80:20, v/v)
- - 0.1 0.14 RODZIEWICZ & ZAWADZKA, 2007
Milk ESI-MS/MS
C8 (150 x 2.0 mm, 3 µm)
A: 5 mM ammonium formate, B: acetonitrile
- - 0.11 0.15 SNIEGOCKI et al., 2007
Honey ESI- MS/MS
C18 (150 x 2.1 mm, 3.5 μm)
A: 0.15% acetic acid, B: 0.15% acetic acid in methanol
0.2 0.6 - - SHERIDAN et al., 2008
Poultry, egg, shrimp, fish, swine, bovine
ESI-MS/MS
C18 (100 x 2.1 mm, 4 µm)
A: water, B: methanol 0.03 0.1 - NI ROCHA SIQUEIRA et al., 2009
Milk, honey ESI-MS/MS
C18 (100 x 2.0 mm, 1.8 μm)
A: 0.1% acetic acid, B: acetonitrile with 0.1% acetic acid
- - 0.07 µg.L-1 (milk), 0.08 (honey)
0.11 µg.L-1 (milk), 0.13 (honey)
CRONLY et al., 2010

87
CAPÍTULO II
Table 7. (continuation…)
Analyte / Matrix
Detection Column Mobile Phase LOD (µg.kg-1) LOQ (µg.kg-1) CCα (µg.kg-1) CCβ (µg.kg-1) Reference
Egg, honey, milk ESI-MS/MS
C18 (50 x 2.1 mm, 2.7 μm)
A: 0.1% formic acid, B: acetonitrile
0.003 – 0.004 0.008 – 0.012 0.006 – 0.009 0.008 – 0.011 LU et al., 2010
Milk ESI-MS/MS
C18 (150 x 2.1 mm, 5 µm)
A: 0.2% formic acid, B: methanol
0.3 1.5 - - TIAN, 2011
Milk ESI-MS/MS
C18 (150 x 2.1 mm i.d., 1.8 μm)
A: 5 mM ammonium acetate, B: methanol (60:40, v/v)
0.05 0.2 0.07 0.11 WANG et al., 2011
Honey, fish, prawns
ESI-MS/MS
C18 (150 x 4.6 mm, 5 µm), C18 (100 x 2.1 mm, 3.5 µm)
A: acetonitrile, B: water 0.02 0.06 0.04–0.05 0.06–0.09 BARRETO et al., 2012
Soft-shelled turtle
ESI-MS/MS
C18 (50 x 2.1 mm, 2.7 µm)
A: 0.1% formic acid, B: acetonitrile
0.075 0.250 - - LU et al., 2012
Honey MS/MS C18 (50 x 2.0 mm, 5 µm)
A: 2mM ammonium acetate, B: methanol
0.04 0.11 0.08 0.12 TAKA et al., 2012
Fish ESI-MS/MS
C18 (150 x 2.1 mm, 5 µm)
A: acetonitrile, B: water (30:70, v/v)
0.036 0.12 - - WU et al., 2012
Honey ESI-MS/MS
C18 (250 x 4.6 mm, 5 µm)
A: 0.3% acetic acid, B: acetonitrile (50:50, v/v)
0.047 0.156 - - CHEN & LI, 2013
Honey, shrimp, poultry
ESI-MS C18 (150 x 2.1 mm, 3 - 3.5 μm)
A: methanol, B: 0.1 % ammonium hydroxide
- - 0.03–0.07 0.04–0.08 DOUNY et al., 2013
Bovine ESI-MS/MS
C18 (100 x 2.1 mm, 1.8 μm)
A: formic acid 0.1% (v/v), B: acetonitrile
- - 0.07 0.10 FREITAS et al., 2014a
Milk ESI-MS/MS
C8 (75 x 2.1 mm, 2.6 µm)
A: 5% isopropanol in 0.1% acetic acid, B: 5% isopropanol in ethanol
- - 0.06–0.10 0.08–0.15 SNIEGOCKI et al., 2015
Milk ESI-MS/MS
C12 (250 x 3.0 mm, 4 µm)
A: 20 mM ammonium acetate, pH 4.6, B: acetonitrile, (60:40, v/v)
- - - - GALLO et al., 2005
Milk ESI-MS/MS
NI (100 x 20 µm, 5 µm)
A: 0.1 % formic acid , B: 0.1% formic acid in acetonitrile
- - 0.05 µg.L-1 0. µg.L-1 NICOLICH et al., 2006

88
CAPÍTULO II
Table 7. (continuation…)
Analyte / Matrix
Detection Column Mobile Phase LOD (µg.kg-1) LOQ (µg.kg-1) CCα (µg.kg-1) CCβ (µg.kg-1) Reference
Honey ESI-MS/MS
Methylcellulose (75 x 2.0 mm, 2.2 µm)
A: water, B: acetonitrile - 0.2 - - LI et al., 2006
Florfenicol Chicken, fish, honey
UV C18 (250 x 4.6 mm)
A: methanol, B: water (30:70, v/v)
- - - - SADEGHI & JAHANI, 2013
Fish ESI-MS/MS
C18 (50 x 3 mm, 2.7 µm)
A: 0.1% formic acid, B: methanol with 0.1% formic acid
- 1.0 - - REZK et al., 2015
Florfenicol amine Bovine, equine, porcine (kidney, liver, muscle)
MS/MS C18 (50 x 2.1 mm, 3 µm)
A: 0.1% acetic acid, 0.05% formic acid, B: 10:90 isopropanol:methanol, C: acetonitrile
33 110 - - FEDENIUK et al., 2015
Chloramphenicol and Thiamphenicol Honey VWD C18 (250 x 4.6
mm, 5 µm) A: methanol, B: water (55:45, v/v)
0.6 (CAP), 0.1 (TAP)
1.6 (CAP), 1.2 (TAP)
- - CHEN et al., 2009
Fish, mussel ESI-MS/MS
C18 (150 x 4.6 mm, 5 μm)
A: 0.1% formic acid, pH 2.6, B: acetonitrile
3.0 9.0 -10.0 2.0 3.0 FERNANDEZ-TORRES et al., 2011
Chloramphenicol and Florfenicol Fish ESI-
MS/MS C18 (100 x 3.0 mm, 3.5 μm)
A: 0.1% formic acid, B: acetonitrile+0.1% formic acid
1.0 (CAP), 1.10 (FF)
3.5 (CAP), 3.6 (FF)
- - MONTEIRO et al., 2015
Thiamphenicol and Florfenicol Pork (muscle, liver, kidney), beef (muscle, liver), fish, chicken
ESI-MS/MS
Phenyl (100 x 2.1 mm, 3.5 µm)
A: 0.1 % formic acid, B: methanol, (75:25, v/v)
- 1.0 - - CHOU et al., 2009
Chloramphenicol and metabolite
Honey, pork kidney, dairy, prawns
MS/MS C18 (125 x 2.0 mm, 5 µm)
A: 10 mM ammonium acetate, B: methanol (55:45, v/v)
- - 0.05–0.09 0.09–0.17 ASHWIN et al., 2005

89
CAPÍTULO II
Table 7. (continuation…)
Analyte / Matrix
Detection Column Mobile Phase LOD (µg.kg-1) LOQ (µg.kg-1) CCα (µg.kg-1) CCβ (µg.kg-1) Reference
Chicken, shrimp, honey
ESI-MS/MS
C18 (125 x 3.0 mm, 4 µm)
A: acetonitrile, B: 10 mM ammonium formate, pH 3.0 (40:60 v/v)
0.05 – 0.1 0.1 – 0.2 -a - BOGUSZ et al., 2004
Thiamphenicol, Florfenicol and Florfenicol amine Eggs FLD C18 (250 x 4.6
mm, 5 µm) A: acetonitrile 0.01 M sodium dihydrogen phosphate + 0.005 M sodium dodecyl sulfate, B: 0.1% triethylamine, pH 4.8 (35:65, v/v)
1.5 (TAP & FF), 0.5 (FFA)
5.0 (TAP & FF), 2.0 (FFA)
- - XIE et al., 2011
Swine ESI-MS/MS
C18 (150 x 2.1 mm, 5 μm)
A: acetonitrile, B: water 1.2 (TAP), 0.6 (FF), 0.12 (FFA)
4.0 (TAP), 2.0 (FF), 0.4 (FFA)
- - LUO et al., 2010
Chloramphenicol, Thiamphenicol and Florfenicol Milk, fish ESI-
MS/MS C18 (50 x 2.0 mm, 5 μm)
A: 0.1% formic acid, B: acetonitrile+ 0.1% formic acid
0.019 (CAP, fish)
- - - GUIDI et al., 2015
Chloramphenicol, Thiamphenicol, Florfenicol and Florfenicol amine Fish DAD C8 (250 x 4.0
mm, 5 µm) A: 0.05 M ammonium acetate, B: acetonitrile
11.0 – 14.8 33.2 – 44.8 51.3 (TAP), 3.3 (CAP), 1019.5 (FF)
53.3 (TAP), 54.9 (CAP), 1022.2 (FF)
EVAGGELOPOULOU & SAMANIDOU, 2013
Milk DAD C18 (250 x 4.0 mm, 5 µm)
A: 0.05 M ammonium acetate, B: acetonitrile
- - 53.8 (CAP), 52.49 (TAP), 55.23 (FF)
55.9 (CAP), 56.80 (TAP), 58.99 (FF)
SAMANIDOU et al., 2015
Chicken, pork, fish, prawns, honey
HESI-MS/MS
Phenyl-hexyl (100 x 2.1 mm, 2.7 µm)
A: methanol, B: acetic acid–ammonium acetate buffer 5 mM, pH 5
- <0.1 – 1.0 0.1–121 0.2–138 ALECHAGA et al., 2012
Chicken ESI- MS/MS
C18 (100 x 2.1 mm, 5 μm)
A: acetonitrile, B: water 0.1 (CAP), 0.2 (FF), 1.0 TAP and FFA)
0.3 (CAP), 0.5 (FF), 3.0 (TAP and FFA)
0.07 (CAP), 3.41 (TAP), 0.57 (FF), 3.40 (FFA)
0.11 (CAP), 3.83 (TAP), 0.64 (FF), 3.81 (FFA)
ZHANG et al., 2008

90
CAPÍTULO II
Table 7. (continuation…)
Analyte / Matrix
Detection Column Mobile Phase LOD (µg.kg-1) LOQ (µg.kg-1) CCα (µg.kg-1) CCβ (µg.kg-1) Reference
Shrimp, fish ESI-MS/MS
C18 (150 x 2.1 mm, 5 µm)
A: 0.1% formic acid with 5 mM ammonium acetate, B: methanol
- - 0.01 (CAP), 0.07–0.09 (TAP), 0.01–0.02 (FF), 0.04–0.05 (FFA)
0.04–0.09 (CAP), 0.13–0.25 (TAP), 0.05–0.07 (FF), 0.11–0.18 (FFA)
TAO et al., 2014
Chicken ESI-MS/MS
C18 (150 x 2.1 mm, 3.5 µm)
A: water, B: acetonitrile 0.010 0.100 - - CHEN et al., 2005
Infant formula ESI-MS/MS
C18 (100 x 2.1 mm, 1.8 µm)
Positive ESI mode, A: 0.1% formic acid+0.5 mM ammonium acetate, B: methanol+0.1% formic acid. Negative ESI mode, A: 2.5 mM ammonium acetate, B: methanol
- 0.2 – 1.0 - - ZHAN et al., 2013
Milk, butter, fish, eggs
ESI-MS/MS
C18 (100 x 2.1 mm, 3 µm)
A: 1 mM ammonium formate, B: methanol, C: acetonitrile
Butter (0.21 CAP, 0.16 TAP, 0.14 FF), Egg (0.16 CAP, 0.22 TAP, 0.16 FF), Fish (0.17 CAP, 0.06 TAP, 0.08 FF), Milk (0.26 CAP, 0.30 TAP, 0.27 FF)
Butter (0.64 CAP, 0.49 TAP, 0.43 FF), Egg (0.49 CAP, 0.65 TAP, 0.47 FF), Fish (0.51 CAP, 0.18 TAP, 0.24 FF), Milk (0.79 CAP, 0.90 TAP, 0.81 FF)
- - DASENAKI & THOMAIDIS, 2015
Fish ESI-MS/MS
C18 (50 x 2.1 mm, 1.7 µm)
A: methanol, B: water - - 0.02 (CAP), 0.06 (TAP), 0.02 (FF)
0.11 (CAP), 0.16 (TAP), 0.10 (FF)
PAN et al., 2015
Milk ESI-MS/MS
C18 (50 x 2.1 mm, 1.7 µm)
A: 0.1% formic acid, B: acetonitrile+ 0.1% formic acid
0.020, 0.003, 0.008
0.050, 0.010, 0.020
- WANG et al., 2016
a – not found; CAP – chloramphenicol; CAP-Glu – Chloramphenicol glucuronide; CCα – decision limit; CCβ – capacity of detection; DAD – diode array detector; ESI – electrospray ionization; FF – florfenicol; FFA – florfenicol amine; FLD – fluorescence detector; HRMS – high resolution mass spectrometry; LOD – limit of detection; LOQ – limit of quantification; MS – mass spectrometry; MS/MS – tandem mass spectrometry; TAP – thiamphenicol; UV – ultraviolet detector; VWD – variable wavelength detector.

91
CAPÍTULO II
The detection system of choice is MS, which allows detection, confirmation and
quantification of many compounds simultaneously (JIMENEZ et al., 2011). Furthermore,
when a chromatograph is coupled to a MS detector, it is possible to develop methods
with high selectivity, efficient separation and also to know about structural information
and molar mass (CHIARADIA et al., 2008). Moreover, a system combining LC with
mass spectrometry detection (LC-MS/MS) can substantially reduce analysis time and
can be used as a confirmatory method.
In the majority (64%) of the LC studies reported in the literature from 2002 to
2015, chloramphenicol was the only amphenicols investigated, and the most frequently
analyzed sample was honey, followed by fishseafood and milk. In some of the studies,
the sensitivity required for chloramphenicol was not always achieved, and therefore, the
method would not fit the purpose. However, some developed methods were adequate
and sensitive for the analysis of chloramphenicol, for example, very low limits of
detection and quantification were achieved - 0.00052 and 0.00185 µg.kg-1, respectively,
for milk and honey, using a C18 column and an ESI-MS/MS detector (MARTINS-
JÚNIOR et al., 2006).
4. OCCURRENCE OF AMPHENICOLS IN FOOD
As summarized in Table 8, several studies were undertaken to investigate the
presence of amphenicols in food of animal origin. However, the number of samples
analyzed is very limited especially considering the several variables which can be
associated with food production, among them, breed, feed, practices, location,
processing and storage.
Only 26.3% of the studies (n=5) investigated the three amphenicols
simultaneously, whereas 5.3% (n=1) determined thiamphenicol, florfenicol and
florfenicol amine in egg and 5.3% (n=1) determined chloramphenicol and florfenicol in
fish. Most of the studies were focused on the quantification of individual amphenicols,
either chloramphenicol (57.9%) in several food matrices or florfenicol (5.3%) in fish.
Fish, milk, honey and eggs were the most frequently analyzed food matrices,
representing, respectively, 27.3, 24.2, 18.2 and 18.2% of the six types of food analyzed.
Based on these results, even though banned in food producing animals,
chloramphenicol is still the amphenicol of major concern, mainly in milk and fish.

92
CAPÍTULO II
Table 8. Prevalence and levels of amphenicols and some metabolites in different food
matrices from 2002 to 2016
Analyte / Matrix
Samples Method / LOD (µg.kg-1 )
Concentration in positive samples (µg.kg-1)
Country / Reference Analyzed Positive (%)
Chloramphenicol Beef Pork Poultry Rabbits Milk Egg Fish
430 271 235 2 286 45 39
0 0 0 0 0.3 0 0
GC-ECD 1.0
n.a. n.a. n.a. n.a. 4.6 n.a. n.a.
Slovenia (CERKVENIK, 2002)
Honey 176 21.6 LC-ESI-MS/MS < 0.1
0.1–75.0 Argentina, Australia, Cuba, Thailand, China (VERZEGNASSI et al., 2003)
Rainbow trout 15 22.5 LC-MS/MS 0.454
1.58–3.94 Portugal (SANTOS et al., 2005)
Honey Milk
4 7
0 42.8
LC-ESI-MS/MS 0.00052 µg.L-1
n.a. 0.0047–0.0061
µg.L-1
Brazil (MARTINS-JÚNIOR et al., 2006)
Milk 41 0 LC-ESI-MS/MS 0.09 µg.L-1
n.a. Brazil (NICOLICH et al., 2006)
Honey 116 9 LC-ESI-MS/MS 0.2
91.0a China, Russia, Georgia, Moldova (SHERIDAN et al., 2008)
Beef Pork Egg Shrimp Poultry Fish
149 199 60 14 208 16
0 0 0 0 0 0
LC-ESI-MS/MS 0.03
n.a. n.a. n.a. n.a. n.a. n.a.
Brazil (ROCHA SIQUEIRA et al., 2009)
Egg Honey Milk
10 10 10
0 0 10
LC-ESI-MS/MS 0.004 0.003
0.003 µg.L-1
n.a. n.a.
< 300 µg.L-1
China (LU et al., 2010)
Milk 5 0 High-throughput suspension array technology
25 µg.L-1
n.a. China (SU et al., 2011)
Milk 50 8% LC-ESI-MS/MS 0.05
> 0.45 China (WANG et al., 2011)
Honey Fish
5 21
0 0
LC-ESI-MS/MS 0.02
n.a. n.a.
Brazil (BARRETO et al., 2012)
Fish 8 12.5% LC-ESI-MS/MS 0.036
0.14 China (WU et al., 2012)
Florfenicol Fish 25 20% HPLC-ESI-
MS/MSb 70.85±1.67 Egypt (REZK et
al., 2015) Chloramphenicol and Florfenicol Fish 36 8.3% (FF) LC-ESI-MS/MS
1.0 (CAP), 1.1 (FF)
521.2–528.0 Brazil (MONTEIRO et al., 2015)

93
CAPÍTULO II
Table 8. (continuation…)
Analyte / Matrix
Samples Method / LOD (µg.kg-1 )
Concentration in positive samples (µg.kg-1)
Country / Reference Analyzed Positive (%)
Chloramphenicol, Thiamphenicol and Florfenicol Shrimp 8 62.5% (FF) NCI-GC/MS
0.0087–0.00174
47–592 Taiwan (LIU et al., 2010)
Egg Honey
11 6
27.3% (FF) 0
GC-MS 0.0004 (CAP egg) 0.0005 (CAP honey, TAP and FF)
1.7–2.5 n.a.
Spain (AZZOUZ & BALLESTEROS, 2015)
Milk powder Butter Fish Egg
73 5 22 8
0 0 0 0
LC-ESI-MS/MS 0.16-0.26 (CAP) 0.06-0.30 (TAP) 0.08-0.27 (FF)
n.a. n.a. n.a. n.a.
Greece (DASENAKI & THOMAIDIS, 2015)
Fish 25 4% (CAP) UPLC-ESI-MS/MS 0.11 (CAP) 0.16 (TAP) 0.10 (FF)
1.8 China (PAN et al., 2015)
Milk 25 8% (TAP) UHPLC-ESI-MS/MS 0.020 (CAP) 0.003 (TAP) 0.008 (FF)
0.6–1.7 China (WANG et al., 2016)
Thiamphenicol, Florfenicol and Florfenicol amine Egg 50 2% (FF)
2% (FFA) HPLC-FLD 1.5 (TAP, FF), 0.5 (FFA)
19 36
China (XIE et al., 2011)
a Maximum concentration cound; b not found; CAP - chloramphenicol; DAD – diode array detector; ECD – electron capture detector; ESI – electrospray ionization; FF – florfenicol; FFA – florfenicol amine; FLD – fluorescence detector; GC – gas chromatography; HPLC – high performance liquid chromatography; LC – liquid chromatography; LOD – limit of detection; MS – mass spectrometry; MS/MS – tandem mass spectrometry; n.a. – not applicable; NCI – electron-capture negative chemical ionization TAP – thiamphenicol; UPLC – ultra performance liquid chromatography; UPLC – ultra high performance liquid chromatography.
Chloramphenicol was detected in different food matrices. The highest prevalence
was in milk (42.8%), followed by fish and honey (22.5% and 21.6%, respectively)
(VERZEGNASSI et al., 2003; SANTOS et al., 2005; MARTINS-JÚNIOR et al., 2006).
Higher levels of chloramphenicol were found in honey (75–91 µg.kg-1) (VERZEGNASSI
et al., 2003; SHERIDAN et al., 2008). Fish also contained chloramphenicol (0.14–3.94
µg.kg-1) (SANTOS et al., 2005; WU et al., 2012; PAN et al., 2015). Several food
samples contained chloramphenicol at levels above the MRPL (CERKVENIK, 2002;
MARTINS-JÚNIOR et al., 2006; LU et al., 2010; WANG et al., 2011). These results
indicate that the use of chloramphenicol in food producing animals is still a possibility.
Chloramphenicol in foods can result from administration of prohibited antibiotics. It is

94
CAPÍTULO II
also important to consider that there are other possible sources of food contamination
with chloramphenicol, among them, its use as a human antimicrobial agent, release and
contamination of waste streams by which food may be contaminated; and its natural
occurrence in soil by bacteria (GUIDI et al., 2015; HANEKAMP & BAST, 2015;
SNIEGOCKI et al., 2015).
The highest prevalence of florfenicol was in shrimp (62.5%), followed by eggs
(27.3%) and fish (20%). The highest levels were found in shrimp (592 µg.kg-1), followed
by fish (528.0 µg.kg-1) and egg (2.5 µg.kg-1) (LIU et al., 2010; AZZOUZ &
BALLESTEROS, 2015; MONTEIRO et al., 2015; REZK et al., 2015). In some samples,
contents exceeded the MLR established by some countries, even though the contents
of florfenicol amine were not determined and included in the total florfenicol levels as
determined by legislation. These results suggest the use of prohibited antibiotics (e.g.,
use in animals from which eggs are produced), and administration of excessive levels or
failure to respect the proper withdrawal periods (GUIDI et al., 2015; HANEKAMP &
BAST, 2015; SNIEGOCKI et al., 2015).
Even though thiamphenicol was investigated in different types of matrices, it was
only detected in milk samples at 8% occurrence, at levels varyed from 0.6 to 1.7 µg.kg-1,
which are below the MRL established by Brazil (10 µg.kg-1) and by the European Union
(50 µg.kg-1) (EC, 2010a; BRASIL, 2015; WANG et al., 2016). Low occurrence of
thiamphenicol is probably associated with its higher cost compared to florfenicol.
5. CONCLUSIONS AND PERSPECTIVES
Most of the studies found in the literature on the analysis of amphenicols in food
used conventional techniques for sample preparation, such as liquid-liquid and/or solid-
phase extraction. However, the tendency nowadays is the use of miniaturized
techniques, which are advantageous as they use reduced amount of sample and less
solvents generating fewer residues to the environment. However, these miniaturized
methods still have limitations such as the need for more steps, applicability to a smaller
number of analytes, low availability of commercial extraction phases and the limited
amount of research studies to attest the efficiency and the robustness of the technique.
Therefore, improvements are still needed.

95
CAPÍTULO II
Although GC and LC have been widely used, the best approach is to use LC-
ESI-MS/MS especially for the analysis of chloramphenicol which has been banned from
food producing animals. It is a selective and efficient system to detect trace levels of
amphenicols and other contaminants. Nevertheless, the availability of this equipment in
laboratories is still unusual, due to elevated price and requirement of specialized
personnel to its operation. Although UHPLC is an advantageous technique when
compared to conventional HPLC, only few studies using this technique were found.
Although chloramphenicol is forbidden in several countries, it has been found in many
food matrices at levels from 0.14 to 592 µg.kg-1. Milk was the matrix that had more
positive samples with occurrence varying from 0.3% to 42.8%. Only milk presented
positive samples for thiamphenicol, with 8% of occurrence at levels from 0.6 to 1.7
µg.kg-1, which are below the Maximum Residue Limit (MRL – 50 µg.kg-1) established by
the European Union. All the positive samples for florfenicol were also below the MRL
established by the European Union, however in most of the methods, florfenicol amine,
which must be added to florfenicol levels for legislation compliance, is seldom included
in the methods available for amphenicols analysis.
In this context, the need for improved rapid and sensitive methods for the
continuous monitoring of the levels of amphenicols in food matrices is obvious.

96
CAPÍTULO III
CAPÍTULO III - A SIMPLE, FAST AND SENSITIVE SCREENING
LC-ESI-MS/MS METHOD FOR ANTIBIOTICS IN FISH
Artigo publicado:
GUIDI, L.R.; SANTOS, F.A.; RIBEIRO, A.C.S.R.; FERNANDES, C.; SILVA, L.H.M.;
GLORIA, M.B.A. A simple, fast and sensitive screening LC-ESI-MS/MS method for
antibiotics in fish. Talanta, v. 163, p. 85-93, 2017.

97
CAPÍTULO III
ABSTRACT
The objective of this study was to develop and validate a fast, sensitive and
simple liquid chromatography-electrospray ionization-tandem mass spectrometry (LC-
ESI-MS/MS) method for the screening of six classes of antibiotics (aminoglycosides,
beta-lactams, macrolides, quinolones, sulfonamides and tetracyclines) in fish. Samples
were extracted with trichloroacetic acid. LC separation was achieved on a Zorbax
Eclipse XDB C18 column and gradient elution using 0.1% heptafluorobutyric acid in
water and acetonitrile as mobile phase. Analysis was carried out in multiple reaction
monitoring mode via electrospray interface operated in the positive ionization mode,
with sulfaphenazole as internal standard. The method was suitable for routine screening
purposes of 40 antibiotics, according to EC Guidelines for the Validation of Screening
Methods for Residues of Veterinary Medicines, taking into consideration threshold
value, cut-off factor, detection capability, limit of detection, sensitivity and specificity.
Real fish samples (n=193) from aquaculture were analyzed and 15% were positive for
enrofloxacin (quinolone), one of them at a higher concentration than the level of interest
(50 µg.kg-1), suggesting possible contamination or illegal use of that antibiotic.
Keywords: aminoglycoside; beta-lactam; macrolide; quinolone; sulfonamide;
tetracycline; aquaculture.

98
CAPÍTULO III
1. INTRODUCTION
Aquaculture is one of the food-producing systems with the highest growth in the
world and today it accounts for nearly 50% of the world’s food fish (FAO, 2016).
However, intensive systems of animal food production are favorable to the spread of
infectious diseases due to high population density. This is specially so in aquaculture,
as the aquatic environment is prone to disease proliferation. In addition, abrupt physico-
chemical changes in the aquatic environment and inappropriate management practices
can directly affect the health of the fish (QUESADA et al., 2013b). For these reasons,
the use of antibiotics in aquaculture is a common practice in the treatment of diseases.
In addition, antibiotics can be used as prophylactic agents to avoid or prevent diseases
and also as a feed additive to promote growth and increase feed efficiency (BLASCO et
al., 2007; GASTALHO et al., 2014; GUIDI et al., 2015).
Many antibiotics are allowed for use in aquaculture worldwide, and varying
classes are permitted in different countries. As examples, tetracycline, oxytetracycline
(tetracyclines), oxolinic acid, flumequine, enrofloxacin (quinolones), amoxicylin (β-
lactam), erythromycin (macrolide), sulfadimethoxine (sulfonamide), ormetoprim
(diaminopyrimidine) and florfenicol (amphenicol) can be cited. The first two are the most
widely used (WHO, 1998; FAO, 2005). Antibiotics are administered through the diet or
are released directly into surface waters and, after metabolism, antibiotics and/or their
metabolites can end up in tissues or can be excreted through urine and feces.
Therefore, there can be accumulation of antibiotics in water and sediments which can
contaminate the aquatic ecosystem (HALLING-SØRENSEN, 1998; CDDEP, 2015). In
addition, some antibiotics from intensive livestock can also be released into the
environment and reach water resources (HALLING-SØRENSEN, 1998; BOXALL et al.,
2003; REGITANO & LEAL, 2010; XIONG et al., 2015).
The inappropriate and abusive use of antibiotics however can be a potential
public health hazard once their residues can remain in the fish muscle (SANTOS &
RAMOS, 2016). For example, residues of tetracyclines and sulfonamides (MENDOZA
et al., 2012), chloramphenicol (WU et al., 2012; GUIDI et al., 2015), oxytetracycline
(MONTEIRO et al., 2015; MONTEIRO et al., 2016), enrofloxacin (DASENAKI &
THOMAIDIS, 2015; REINHOLDS et al., 2016) and florfenicol (MONTEIRO et al., 2015;
REZK et al., 2015; MONTEIRO et al., 2016) have been detected in fish. Furthermore, it
can remain in the water and sediment from aquaculture systems. Indeed, MONTEIRO

99
CAPÍTULO III
et al. (2015 e 2016) detected oxytetracycline, tetracycline and florfenicol in different fish
farms and tetracycline antibiotics were found in river sediments.
Among health hazard issues to man, antibiotics in food can induce allergic
reactions in some sensitive individuals. Furthermore, it can compromise human
intestinal and immune systems, lead to the appearance of bacterial resistance in
humans and animals, and affect the environment selecting the most resistant bacteria
(GASTALHO et al., 2014; GUIDI et al., 2015; SANTOS & RAMOS, 2016). Several
regulatory agencies established Maximum Residue Limits (MRL) for antimicrobials in
food of animal origin (Table 1), and concentrations above the MRL are inappropriate for
human consumption.
In order to warrant public health safety and to maintain competitiveness in
international trade, the monitoring of antibiotics in fish and other foods of animal origin is
needed. Therefore, sensitive and reliable analytical methods for the determination of
multi-antibiotics in food are required. The effective control of antibiotics in foods requires
the combination of cost effective and high sample throughput screening methods,
followed by confirmation and quantification of suspect samples (SAMSONOVA et al.,
2012; GUIDI et al., 2015). Liquid chromatography coupled to mass spectrometry in
tandem (LC-MS/MS) has been used in the analysis of multi-antibiotics in food, both for
screening and quantitative methods (GAUGAIN-JUHEL et al., 2009; LOPES et al.,
2011; VILLAR-PULIDO et al., 2011; MENDOZA et al., 2012; FREITAS et al., 2013;
FREITAS et al., 2014a; FREITAS et al., 2015; JANK et al., 2015; CHEN et al., 2016;
DO et al., 2016; MARTINS et al., 2016; MONTEIRO et al., 2016; MORETTI et al.,
2016). Analytical methods using bioassay techniques or sensitive microorganisms are
widely used as screening methods (PETERS et al., 2009). However, the use of LC-MS
for screening purposes is becoming popular as it can provide good specificity,
sensitivity, and low rate of false-positive samples (GENTILI et al., 2005; BOSCHER et
al., 2010; CHÁFER-PERICÁS et al., 2010; LOPES et al., 2011; CHEN et al., 2016).
Through determination of the cut-off factor in a screening method, it is possible to
evaluate if the sample contains or not the antibiotic in a concentration above MRL (EC,
2010b). Since in most of the cases the samples are expected to comply, reports can be
issued faster for samples which comply, whereas samples with cut-off factor above
MRL should be further analyzed by quantitative methods (SAMSONOVA et al., 2012).

100
CAPÍTULO III
Table 1. Antibiotics included in the study and respective Maximum Residue Limit
(MRL), screening target concentration and concentrations of stock solutions
Class/ Analyte
Concentration
MRL (µg.kg-1) Screening target (µg.kg-1) Stock solution (µg.mL-1)
Aminoglycosides Amikacin 500a 250 200 Apramycin 500a 250 200 Dihydrostreptomycin 500c 250 200 Gentamicin 500a 250 200 Hygromycin 500a 250 200 Kanamycin 500a 250 200 Neomycin 500b 250 200 Paromomycin 500c 250 200 Spectinomycin 500b 250 200 Streptomycin 500c 250 200 Tobramycin 500a 250 200 Beta-lactams Ampicillin 50a 25 200 Cefazolin 50a 25 200 Oxacillin 300c 150 200 Penicillin G 50a 25 200 Penicillin V 25a 12.5 200 Macrolides Clindamycin 100b 50 100 Erythromycin 100b 50 100 Lincomycin 200b 100 100 Spiramycin 200c 100 100 Tilmicosin 100c 100 100 Tylosin 100c 100 100 Virginiamycin 200b 100 100 Quinolones Ciprofloxacin 100a 50 100 Danofloxacin 100b 50 100 Difloxacin 300a 150 100 Enrofloxacin 100a 50 100 Flumequine 600a 300 100 Marbofloxacin 100b 50 100 Nalidixic acid 20a 20 100 Norfloxacin 100b 50 100 Oxolinic acid 20a 20 100 Sarafloxacin 30a 15 100 Sulfonamides Sulfachloropyridazine 100a 50 250 Sulfadiazine 100a 50 250 Sulfadimethoxine 100a 50 250 Sulfadoxine 100a 50 250 Sulfamerazine 100a 50 250 Sulfamethazine 100a 50 250 Sulfamethoxazole 100a 50 250 Sulfamethoxypyridazine 100a 50 250 Sulfaphenazole (IS) - - Sulfaquinoxaline 100a 50 250 Sulfathiazole 100a 50 250 Sulfisoxazole 100a 50 250 Tetracyclines Chlortetracycline 200a 100 200 Doxycicline 200a 100 200 Oxytetracycline 200a 100 200 Tetracycline 200a 100 200 a BRASIL (2015); b CODEX (2014); c EC (2010a); IS – internal standard.

101
CAPÍTULO III
LC-MS/MS methods for the analysis of more than five classes of antibiotics are
available for milk (GAUGAIN-JUHEL et al., 2009; FREITAS et al., 2013; JANK et al.,
2015; CHEN et al., 2016; MARTINS et al., 2016), eggs (CHEN et al., 2016), honey
(HAMMEL et al., 2008), meat (CARRETERO et al., 2008; FREITAS et al., 2014a;
CHEN et al., 2016; DO et al., 2016), liver (FREITAS et al., 2015) and fish (PETERS et
al., 2009; SMITH et al., 2009; LOPES et al., 2012; STOREY et al., 2014; REZK et al.,
2015). However, most of the multiclass methods available for the screening of
antibiotics in fish are, in general, laborious and limited to a few antimicrobials.
Therefore, the objective of this study was to develop a simple, sensitive and fast
screening method for multiple classes of antimicrobials in fish muscle.
2. EXPERIMENTAL
2.1. Material
2.1.1. Chemicals and reagents
LC-MS grade acetonitrile and methanol were purchased from Merck (Darmstadt,
Germany); heptafluorobutyric acid (HFBA) was from Fluka (Buchs, Switzerland) and
trichloroacetic acid (TCA) was from Vetec (Rio de Janeiro, Brazil). Ultra-pure water was
obtained from a Milli-Q purification apparatus (Millipore, Bedford, MA, USA).
All the antibiotics were of high purity grade (>99.0%). They included
aminoglycosides, beta-lactams, macrolides, quinolones, sulfonamides, and
tetracyclines, in a total of 49 compounds. They were purchased from Sigma-Aldrich (St.
Louis, MO, USA), Fluka (Buchs, Switzerland) and Dr. Ehrenstorfer (Augsburg,
Germany). Sulfaphenazole, the internal standard, was purchased from Sigma-Aldrich
(St. Louis, MO, USA). The shelf-lives of the antibiotics were carefully considered and
varied from 3 to 12 months.
Each standard was accurately weighed and transferred to a 50-mL volumetric
flask and used to prepare methanolic stock solutions (Table 1) at concentrations varying
from 100 to 250 µg.mL-1. Beta-lactams and aminoglycosides were dissolved in ultra-
purified water, and 1 mL of 1 mol.L-1 NaOH was added to quinolone standard solutions
to enhance solubility. Individual stock solutions were stored at -10 °C.

102
CAPÍTULO III
Working standard solutions were obtained by dilution of each stock solution in
ultra-purified water, at concentrations varying from 0.125 µg.mL-1 to 3.0 µg.mL-1. The
internal standard (sulfaphenazole) solution was prepared at 0.5 µg.mL-1 in ultra-purified
water. All the working solutions were kept at -10 ºC and prepared fresh monthly, except
beta-lactams, which were prepared weekly.
2.1.2. Samples
Blank samples of Nile tilapia used in the validation process were collected at two
farms from the state of Minas Gerais, Brazil, where none of the studied antimicrobials
were used. A total of 193 fish muscle samples from fish farms under federal inspection
were obtained: 172 from the state of Minas Gerais and 21 from the state of Pará, Brazil.
The samples from Minas Gerais included 149 Nile tilapia (Oreochromis niloticus) and 23
trout (Oncorhynchus mykiss); whereas the samples from Para included 9 Nile tilapia
(Oreochromis niloticus) and 12 tambaqui (Colossoma macropomum).
2.2. LC-MS/MS analysis
Liquid chromatography was performed in an Agilent 1200 Series HPLC (Agilent
Technologies Inc., Santa Clara, CA, USA) coupled to a Triple Quadrupole Mass
Spectrometer detector API 5000 AbSciex (Life Technologies Corporation, CA, USA). A
Zorbax Eclipse XDB C18 (150 x 4.6 mm, 1.8 µm, Agilent Technologies, CA, USA)
column was used. To establish optimum conditions for the chromatographic separation
of all compounds and to achieve a short running time, several chromatographic
parameters were investigated, including composition and flow rate of the mobile phase,
gradient elution, injection volume and column temperature.
Mass spectrometer parameters were also optimized for each compound
separately by direct infusion of individual standard solutions at concentrations ranging
from 50 to 100 µg.L-1 in MeOH. The best precursor and product ions, declustering
potential (DP), collision energy (CE) and collision cell exit potential (CXP) were
established. Electrospray ionization (ESI) generated the ions in a positive mode.
Multiple reaction monitoring (MRM) was used and two transitions were selected: the
most intense transition for quantifications and the second most intense for confirmation
purposes. Each chromatographic run was divided into scan events with a scan time of
90 seconds for each transition. The analytical system control, acquisition and data

103
CAPÍTULO III
processing were performed using Analyst software, version 1.5.1, from AbSciex (Life
Technologies Corporation, CA, USA).
2.3. Sample preparation
The method used for extraction of the antibiotics from the samples was adapted
from that described by GAUGAIN-JUHEL et al. (2009). A schematic diagram for sample
preparation is indicated in Figure 1.
Figure 1. Sample preparation for screening analysis of six classes of antimicrobials in
fish muscle.
Briefly, 2.0 g (wet weight) of ground and homogenized fish muscle was weighted
in a 50-mL polypropylene centrifuge tube. Then, 200 µL of internal standard
(sulfaphenazole at 0.5 µg.mL-1) and 800 µL of deionized water were added. The sample
was vortexed for 30 seconds and after standing for 10 minutes at room temperature, 8
mL of 5% TCA was added. The sample was homogenized in an ultra-turrax for 20
seconds, placed in a shaker for 10 minutes, and centrifuged at 2700 x g for 12 minutes
at 4 °C. The extract was filtered through a PVDF membrane with 0.45 µm pore size
(Millipore, Bedford, MA, USA) immediately prior to LC-MS/MS analysis.

104
CAPÍTULO III
2.4. Validation of the method
The fitness of the screening method optimized for the analysis of antibiotics in
fish was evaluated according to the Guidelines for the Validation of Screening Methods
for Residues of Veterinary Medicines (Initial Validation and Transfer)-Community
Reference Laboratories (CRLs) 20/1/2010 (EC, 2010b). The following parameters were
evaluated: threshold value (Tv), cut-off factor (Fm), detection capability (CCβ), limit of
detection (LOD), sensitivity and specificity.
2.4.1. Threshold value
The threshold value (Tv) was determined by analyzing twenty blank samples of
fish muscle extracted according to the procedure described in item 2.3. The analytical
response (chromatographic peak area) of the blank sample at the retention time (±
10%) of each analyte was determined in each chromatogram for both quantitation and
confirmation transitions. The mean and the estimated standard deviation of the noise
were calculated. Tv was calculated according to Equation 1 (Eq. 1).
Tv = B + 1.64 x SB (Eq. 1)
where B and SB are, respectively, the mean and the standard deviation of the
chromatographic peak areas of blank samples at the retention time of each analyte.
2.4.2. Cut-off factor
The cut-off factors (Fm) were calculated by using twenty blank samples of fish
muscle spiked with the screening target concentration (STC), which is half of the MRL
concentration based on Brazilian legislation for fish and other matrices (chicken, pork
and meat) when not available for fish and European legislations (EC, 2010a; BRASIL,
2015; CODEX, 2014), except for nalidixic acid, oxolinic acid, tilmicosin and tylosin
(STC=1.0xMRL) (Table 1). The samples were analyzed at the same day and this step
was repeated in a different day to obtain forty independent data. Peak area was
determined for each analyte (n=40) for both transitions of quantification and
confirmation. Means and estimated standard deviations were calculated for each
analyte and the cut-off factor was estimated according to Equation 2 (Eq. 2).

105
CAPÍTULO III
Fm = D – 1.64 x Sd (Eq. 2)
where D and Sd are, respectively, the mean and the standard deviation of the
chromatographic peak areas. It means statistically that 95% of the samples spiked at
the level of interest should give an analytical response above this value.
2.4.3. Detection capability
The detection capability (CCβ) was estimated from the comparison of threshold
values and cut-off factors. When the cut-off factor is above the threshold value, CCβ is
considered as definitely below the level of interest (0.5xMRL, in this case). On the other
hand, when the cut-off factor is below the threshold value, more than 5% of the samples
will be considered as negative samples and, consequently, CCβ is really above the
level of interest (EC, 2010b).
2.4.4. Limit of detection (LOD)
The limit of quantification (LOD) was estimated by extracting and analyzing by
LC-MS/MS 20 blank samples of fish muscle. LODs for each analyte (one for each m/z
transition – quantification and confirmation) were calculated as the mean concentration
of the blank samples in the retention time of each analyte plus three times the standard
deviation of the blank concentration. The LOD for each analyte was ascribed as the
higher of the two values, in most cases from the confirmation m/z transition.
2.4.5. Sensitivity and specificity
To calculate the sensitivity (%), twenty samples were spiked with all antibiotics at
0.5xMRL concentration, extracted and analyzed by LC-MS/MS. The instrument
response for peak area (Ran) for each analyte was compared to the cut-off factor and if
Ran>Fm, the sample was considered non-compliant (positive), i.e., it contains a
concentration above 0.5xMRL. However, if Ran<Fm, the sample was considered
compliant (negative), i.e., it contains a concentration below 0.5xMRL.
The method sensitivity was estimated from Equation 3 (Eq. 3) and it must be
higher than 95% to ensure a β error below 5%. In this case, all the samples are positive
because they were spiked at a 0.5xMRL concentration.

106
CAPÍTULO III
𝑆𝑒𝑛𝑠. (%) = 𝑁𝑢𝑚𝑏𝑒𝑟 𝑜𝑓 𝑠𝑎𝑚𝑝𝑙𝑒𝑠 𝑐𝑜𝑛𝑠𝑖𝑑𝑒𝑟𝑒𝑑 𝑝𝑜𝑠𝑖𝑡𝑖𝑣𝑒
𝑁𝑢𝑚𝑏𝑒𝑟 𝑜𝑓 𝑠𝑎𝑚𝑝𝑙𝑒𝑠 𝑟𝑒𝑎𝑙𝑙𝑦 𝑝𝑜𝑠𝑖𝑡𝑖𝑣𝑒 (20)𝑥100 (Eq. 3)
To determine specificity of the method, e.g. its ability to detect unambiguously a
specific analyte from a complex matrix, the blank chromatograms at the retention time
of each studied analyte were carefully evaluated in order to verify possible
interferences.
3. RESULTS AND DISCUSSION
3.1. Optimization of the LC-MS/MS procedure
The optimized spectrometric parameters and the retention time windows (equal
to retention time ± 5%) for each analyte individually are shown in Table 2. The
chromatographic conditions for the screening method were optimized to provide the
shortest possible run of all analytes of interest with appropriate resolution. The mobile
phase composition which provided best results was phase A – 0.1% of
heptafluorobutyric acid (HFBA) in water and phase B – acetonitrile at a gradient elution
of: initial time – 90% A; 7.0 min – 50% A; 11.0 min – 50% A; 12.0 min – 90% A; and 15
min – 90% A at a constant flow rate of 600 µL.min-1. The flow rate and injection volume
were 0.6 mL.min-1 and 10 µL, respectively and the column temperature was set at 35
°C. Total chromatographic run lasted 15 min.
The presence of two chromatographic peaks, one for each m/z transition –
quantification and confirmation, eluting at the same retention time allowed the
unequivocal identification of each analyte. Each chromatographic peak presented a
signal-to-noise ratio (S/N) equal to 3 under these conditions (LOPES et al., 2011). As
can be noticed, several sulfonamides exhibit the same quantification and confirmation
ions. However, as the precursor ion differs among them, distinction of each of them is
allowed. Sulfadimethoxine and sulfadoxine had the same quantification and
confirmation ions but they had also similar precursor ions (311.1 and 311.0,
respectively), which could lead to mistaken identification of these two substances.
However, because of the different retention time windows observed for these
compounds (9.17-9.60 and 8.15-8.57, respectively), the correct identification of each
antibiotic was possible.

107
CAPÍTULO III
Table 2. Optimized spectrometric conditions - precursor ion, confirmation transition (C) and quantification transitions (Q), declustering
potential (DP), entrance potential (EP), collision energy (CE), collision cell exit potential (CXP) and retention time windows (RTW) - for
each analyte in the screening method
ClassAnalyte Precursor ion
(m/z) Quantification/
Confirmation ion (m/z) DP EP CE CXP
Retention time windows RTW* (min)
Aminoglycosides Amikacin 586 163 (Q)245 (C) 60 10 53 21 14 20 7.80-8.13
Apramycin 540 217 (Q)378 (C) 82 10 35 25 12 12 8.22-8.54
Dihydrostreptomycin 584 263 (Q)246 (C) 120 10 42 / 54 12 12 7.43-7.75
Gentamicin 464.3 322.6 (Q)160.2 (C) 50 10 20 20 12 12 8.41-8.92
Hygromycin 528 352 (Q)177 (C) 50 10 25 25 12 12 7.31-7.63
Kanamycin 485 163 (Q)205 (C) 70 10 35 35 12 12 7.88-8.21
Neomycin 615.3 161.3 (Q)293.50 (C) 120 10 41 35 8 18 8.50-9.01
Paromomycin 616.2 293.1 (Q)163.2 (C) 91 10 33 55 18 10 8.19-8.50
Spectinomycin 351 207 (Q)189 (C) 66 10 31 33 12 12 6.74-7.09
Streptomycin 582 263 (Q)246 (C) 157 10 45 51 12 12 7.39-7.83
Tobramycin 468 163 (Q)324 (C) 100 10 20 20 12 8 8.27-8.58
Beta-lactams Ampicillin 350 106 (Q)160 (C) 50 10 20 20 12 12 7.77-8.10
Cefazolin 455 323 (Q)156 (C) 50 10 15 23 12 12 7.15-7.48
Oxacillin 402 160 (Q)243 (C) 50 10 18 18 12 12 11.00-11.60
Penicillin G 335.4 176.3 (Q)160.2 (C) 70 10 21 21 10 10 9.59-10.40
Penicillin V 351.1 160.1 (Q)192 (C) 66 10 15 17 8 12 10.00-11.10
Macrolides Clindamycin 425.3 126.4 (Q)377.2 (C) 75 10 43 27 22 10 9.09-9.35
Erythromycin 734.5 158.2 (Q)576.7 (C) 66 10 43 27 14 8 10.10-10.80
Lincomycin 407 126 (Q)359 (C) 60 10 40 26 12 12 7.39-7.68
Spiramycin 422.5 174.3 (Q)101.3 (C) 56 10 31 25 16 8 9.33-9.72
Tilmicosin 869.5 174.4 (Q)696.5 (C) 56 10 63 57 10 34 10.20-10.50
Tylosin 916.6 174.4 (Q)772.4 (C) 115 10 55 43 6 20 9.88-10.80
Virginiamycin 526.5 355.2 (Q)109 (C) 76 10 25 47 26 10 8.15-11.80
Quinolones Ciprofloxacin 332 314 (Q)231 (C) 61 10 30 47 12 12 8.03-8.33
Danofloxacin 358 340 (Q)255 (C) 60 10 33 50 10 10 8.18-8.26
Difloxacin 400 356 (Q)299 (C) 100 10 35 40 10 10 8.98-9.30

108
CAPÍTULO III
Table 2. (continuation…)
ClassAnalyte Precursor ion
(m/z) Quantification/
Confirmation ion (m/z) DP EP CE CXP
Retention time windows RTW* (min)
Quinolones Enrofloxacin 360 342 (Q)286 (C) 72 10 30 50 12 12 8.42-8.72
Flumequine 262.1 244 (Q)202 (C) 44 10 25 45 12 12 10.6-11.00
Marbofloxacin 363 345 (Q)320 (C) 70 10 30 22 10 10 7.89-7.98
Nalidixic acid 233 215 (Q)187 (C) 42 10 30 35 12 12 10.40-10.80
Norfloxacin 320 302 (Q)231 (C) 60 10 33 50 12 12 7.89-8.20
Oxolinic acid 262 244 (Q)216 (C) 53 10 25 40 12 12 8.92-9.28
Sarafloxacin 386 368 (Q)348 (C) 50 10 30 40 12 12 8.82-9.15
Sulfonamides Sulfachloropyridazine 285 156 (Q)92 (C) 51 10 21 39 12 12 7.82-8.26
Sulfadiazine 251 156 (Q)108 (C) 53 10 22 30 12 12 5.58-6.00
Sulfadimethoxine 311.1 156 (Q)108 (C) 50 10 23 37 12 12 9.17-9.60
Sulfadoxine 311 156 (Q)108 (C) 60 10 25 40 12 12 8.15-8.57
Sulfamerazine 265 156 (Q)92 (C) 60 10 35 35 12 12 6.22-6.59
Sulfamethazine 279 156 (Q)108 (C) 50 10 25 36 12 12 6.73-7.11
Sulfamethoxazole 254 108 (Q)92 (C) 60 10 35 35 12 12 8.23-8.68
Sulfamethoxypyridazine 281 156 (Q)108 (C) 60 10 25 35 12 12 7.04-7.42
Sulfaphenazole (IS) 315 156 50 10 30 12 9.35-9.45 Sulfaquinoxaline 301 156 (Q)108 (C) 50 10 23 40 12 12 9.19-9.61
Sulfathiazole 256 156 (Q)108 (C) 53 10 20 34 12 12 6.15-6.51
Sulfisoxazole 268 156 (Q)113 (C) 46 10 21 23 12 / 12 8.55-8.99
Tetracyclines Chlortetracycline 479.2 98.2 (Q)275 (C) 61 10 67 55 12 12 9.31-9.64
Doxycicline 445 428 (Q)154.2 (C) 55 10 25 40 12 12 9.51-9.82
Oxytetracycline 461.3 201.1 (Q)283.2 (C) 41 10 59 53 12 12 8.07-8.40
Tetracycline 445 410 (Q)427 (C) 55 10 27 25 12 12 8.44-8.77
* RTW, retention time ± 5% (n=20).

109
CAPÍTULO III
The total ion chromatograms obtained for all analytes in solvent (water) and in
the fish matrix are indicated in Figure 2. The run had a total time of 15 minutes and all
analytes eluted within 12 minutes.
Figure 2. Total ion chromatogram of six classes of antibiotics (a) in water and (b) in the
fish matrix extract. Chromatographic conditions: mobile phases A - 0.1%
heptafluorobutyric acid (HFBA) in water and B – acetonitrile, at a gradient elution: initial
time – 90% A; 7.0 min – 50% A; 11.0 min – 50% A; 12.0 min – 90% A; and 15 min –
90% A at a constant flow rate – 600 µLmin.
(a)
(b)

110
CAPÍTULO III
The shortest retention time was observed for sulfadiazine (5.58 – 6.00 min),
which has highest affinity with the aqueous phase and lowest interaction with the
stationary phase. On the other hand, the longest retention time was observed for
oxacicillin (11.00 – 11.60 min).
The high specificity and sensitivity of the triple quadrupole mass analyzer allowed
the detection of the 40 analytes in only one chromatographic run. To assess specificity,
20 blank samples of fish muscle of different origins were analyzed and no
chromatographic peak was detected in these samples at the retention time
corresponding to each analyte, indicating a specificity of 100% for all the analytes. Both
quantification and confirmation transitions (m/z) were used to confirm promptly a
positive response. The extraction procedure proposed provided good quality
chromatograms, suggesting its efficiency for the extraction and the analytes
concentration.
3.2. Screening method validation
During validation of a screening method, it is important to find global conditions to
detect all of the analytes simultaneously. The method has to present sufficient
sensitivity to detect all the targeted analytes at least at the level of interest, which is
0.5xMRL. Furthermore, qualitative methods of analysis must have the capability of a
high sample throughput and the ability to detect all targeted analytes with a false-
compliant rate below 5% (β error) at the level of interest. In the case of suspected non-
compliant results, these must undergo confirmation by a confirmatory method (EC,
2002).
The results of CCβ, LOD, sensitivity, and the comparison between threshold
value and cut-off factor (Fm/Tv) are presented in Table 3. The cut-off factor (the
analytical response - peak area in this case - indicating that a sample contains a
substance with a concentration equal to or higher than the level of interest) was
compared to threshold value, (the minimal analytical response above which the sample
will be truly considered positive) to evaluate CCβ.

111
CAPÍTULO III
Table 3. Limit of detection (LOD), detection capability (CCβ), sensitivity (sens.) and the
comparison of cut-off factor and threshold value (Fm/Tv) for each antibiotic residue in the
validated screening method
Class/Analyte LOD
(µg.kg-1)
Quantification transition Confirmation transition
Fm/Tv CCβ
(µg.kg-1) Sens. (%) Fm/Tv
CCβ
(µg.kg-1) Sens. (%)
Aminoglycosides Amikacin 1.62b Fm>Tv <250 95 Fm>Tv <250 100 Apramycin 3.15a Fm>Tv <250 100 Fm>Tv <250 95 Dihydrostreptomycin 1.91b Fm>Tv <250 95 Fm>Tv <250 95 Gentamicin 3.50b Fm>Tv <250 100 Fm>Tv <250 100 Hygromycin 29.16a Fm>Tv <250 95 Fm>Tv <250 100 Kanamycin 4.11b Fm>Tv <250 95 Fm>Tv <250 95 Neomycin 3.32b Fm>Tv <250 100 Fm>Tv <250 100 Paromomycin 3.67a Fm>Tv <250 95 Fm>Tv <250 95 Spectinomycin 20.29b Fm>Tv <250 100 Fm>Tv <250 100 Streptomycin 6.98b Fm>Tv <250 100 Fm>Tv <250 95 Tobramycin 2.49a Fm>Tv <250 100 Fm>Tv <250 100 Beta-lactams Ampicillin 0.83b Fm<Tv >25 100 Fm<Tv >25 100 Cefazolin 1.88b Fm>Tv <25 100 Fm>Tv <25 100 Oxacillin 95.77b Fm<Tv >150 100 Fm<Tv >150 100 Penicillin G 119.60b Fm<Tv >25 100 Fm<Tv >25 100 Penicillin V 26.89b Fm<Tv >12,5 100 Fm<Tv >12,5 100 Macrolides Clindamycin 0.40b Fm>Tv <50 100 Fm>Tv <50 100 Erythromycin 5.84a Fm<Tv >50 100 Fm<Tv >50 100 Lincomycin 1.60b Fm>Tv <100 100 Fm>Tv <100 100 Spiramycin 74.24a Fm<Tv >50 100 Fm<Tv >50 100 Tilmicosin 1.22b Fm>Tv <100 95 Fm>Tv <100 95 Tylosin 13.29b Fm<Tv >100 100 Fm<Tv >100 95 Virginiamycin 22.86b Fm<Tv >100 100 Fm<Tv >100 100 Quinolones Ciprofloxacin 0.56b Fm>Tv <50 95 Fm>Tv <50 95 Danofloxacin 1.74a Fm>Tv <50 100 Fm>Tv <50 100 Difloxacin 3.42a Fm>Tv <150 95 Fm>Tv <150 100 Enrofloxacin 1.24a Fm>Tv <50 100 Fm>Tv <50 100 Flumequine 9.09a Fm>Tv <300 95 Fm>Tv <300 95 Marbofloxacin 10.02a Fm>Tv <50 95 Fm>Tv <50 95 Nalidixic acid 0.82b Fm>Tv <20 95 Fm>Tv <20 100 Norfloxacin 0.50b Fm>Tv <50 100 Fm>Tv <50 95 Oxolinic acid 6.28a Fm>Tv <20 100 Fm>Tv <20 100 Sarafloxacin 1.71a Fm>Tv <15 95 Fm>Tv <15 100 Sulfonamides Sulfachloropyridazine 6.06a Fm>Tv <50 95 Fm>Tv <50 100 Sulfadiazine 0.39b Fm>Tv <50 100 Fm>Tv <50 100 Sulfadimethoxine 1.20a Fm>Tv <50 100 Fm>Tv <50 95 Sulfadoxine 0.20a Fm>Tv <50 100 Fm>Tv <50 100 Sulfamerazine 1.19a Fm>Tv <50 95 Fm>Tv <50 95 Sulfamethazine 0.19a Fm>Tv <50 95 Fm>Tv <50 100 Sulfamethoxazole 1.30a Fm>Tv <50 100 Fm>Tv <50 95 Sulfamethoxypyridazine 0.54b Fm>Tv <50 100 Fm>Tv <50 100 Sulfaquinoxaline 0.55b Fm>Tv <50 95 Fm>Tv <50 95 Sulfathiazole 0.71b Fm>Tv <50 100 Fm>Tv <50 95 Sulfisoxazole 1.78b Fm>Tv <50 100 Fm>Tv <50 100 Tetracyclines Chlortetracycline 34.76a Fm>Tv <100 100 Fm>Tv <100 100 Doxycicline 2.69b Fm>Tv <100 100 Fm>Tv <100 95 Oxytetracycline 2.60a Fm>Tv <100 95 Fm>Tv <100 95 Tetracycline 3.64b Fm>Tv <100 95 Fm>Tv <100 100
Analytes that do not meet the requirements for inclusion in the screening method are shown in bold. a Estimated from the data arising from the quantification m/z transition. b Estimated from the data arising from the confirmation m/z transition.

112
CAPÍTULO III
According to the protocol for validation of screening methods (EC, 2010b),
detection capability (CCβ) of screening methods can be evaluated only when the cut-off
factor is above the threshold value. When this condition is achieved, CCβ is considered
as definitely below the level of interest (0.5xMRL, in this case). On the other hand, when
the cut-off factor is below the threshold value, more than 5% of the positive samples will
be considered as negative samples and, consequently, CCβ is really above the level of
interest and the analyte cannot be analyzed by the method with 95% of confidence.
Among the 48 antibiotics analyzed, 40 attended the criteria established by EC
(2002) and EC (2010b), e.g., CCβ was truly below the level of interest tested during
validation (0.5xMRL) and the screening method was efficient in detecting all 40 analytes
which presented Fm>Tv, with 95% of significance and a false-compliant rate of 5%. In
general, all these analytes showed low LODs values (minimum concentration of a given
analyte that can be detected with a reasonable statistical confidence), indicating that the
method is capable of detecting low concentrations of these antibiotics.
The eight antibiotics which did not attend EC (2002) and EC (2010b) included
erythromycin, spiramycin, tylosin, virginiamycin, ampicillin, oxacillin, penicillin G and
penicillin V. These compounds did not have cut-off factors above threshold value (e.g.,
Fm<Tv), which indicates that CCβ values for these analytes were higher than 0.5xMRL
and also that more than 5% of the non-compliant samples can show a compliant result
(false negative). Although sensitivities for these analytes at 0.5xMRL concentration
were satisfactory (>95%), most of them had high LODs values (sometimes above the
MRL). Therefore, even though the method demonstrates ability to monitor these
compounds, it is not capable of detecting them in concentrations below the MRL.
Further studies at concentrations above the 0.5xMRL can be undertaken to determine
the difference between this level and CCβ.
3.3. Screening of farm fish samples
The samples collected from Brazilian fish farms were analyzed using the
validated screening method for the presence of the 40 antibiotics that attended the
criteria established by EC (2002) and EC (2010b). Twenty nine samples (15% of 193
fish samples) were positive for enrofloxacin, both tilapia and trout, from the state of
Minas Gerais. None of the samples from the state of Para, both Nile tilapia and
‘tambaqui’, had positive results. This could result from the fish farming practices
prevalent in Para. Due to the large availability of fresh water from rivers, the fishes are

113
CAPÍTULO III
usually cultivated in cages inside the rivers or in large tanks (lower fish densities), which
reduces the risk of spread of diseases, thereby reducing the need of antibiotics. Overall,
the low occurrence of antibiotics in farm fishes can reflect the good practices adopted in
most of the farms, which results in lower need for the use of antibiotics.
Among the 29 positive samples, three were trout samples from the south of
Minas Gerais and 26 samples were Nile tilapia also from Minas Gerais, but different
regions (metropolitan region of Belo Horizonte, ‘Central Mineira’ and ‘Zona da Mata’).
Only one sample of Nile tilapia had analyte concentration above the cut-off factor, which
means that this sample contained enrofloxacin in a concentration higher than the level
of interest, which is 50 µg.kg-1. The other 28 samples had trace levels of enrofloxacin
(<50 µg.kg-1) and they should be submitted to a quantitative method for confirmation.
These samples were positive for enrofloxacin below the cut-off factor.
Even though the use of enrofloxacin is forbidden in aquaculture in several
countries, including Brazil (KIM et al., 2012; BRASIL, 2015; SINDAM, 2016), it was
present in fish. Enrofloxacin is a fluoroquinolone antimicrobial agent with broad
spectrum of activity available in the market for veterinary use and also allowed for use in
aviculture in some countries (BRASIL, 2015; SINDAM, 2016). In 2005, FDA (FAO,
2005) withdrew approval of its use in poultry because it could select for fluoroquinolone
resistant Campylobacter. However, enrofloxacin is still approved for use in some food
producing animals and companion animals (KIM et al., 2012). It is important to consider
that there could be several sources of fish contamination with antibiotics besides its
administration. In the case of enrofloxacin, its use as a veterinary antibiotic, in aviculture
for example, can result in its release in the environment through waste streams by
which fish may be contaminated. Another source could be the direct use of enrofloxacin
in aquaculture, either due to misinformation or on purpose. However, the source of
contamination should be determined and educational programs implemented to warrant
fish quality. Due to the health hazard associated with antibiotics abuse, there should be
continuous monitoring of antibiotics in fish to warrant human health and international
trade.

114
CAPÍTULO III
4. CONCLUSIONS
A screening LC-MS/MS method was optimized for the simultaneous
determination of 40 antibiotics from six different classes, including aminoglycosides,
beta-lactams, macrolides, quinolones, sulfonamides and tetracyclines, in fish muscle.
Extraction was performed with TCA. A C18 column was used along with a gradient
elution of 0.1% HFBA in water:acetonitrile. A single run of 15 minutes was capable of
determining the presence of the compounds.
Sample preparation was simpler and faster when compared with other methods
for multiclass antibiotic analysis in fish found in literature, which is desirable for routine
methods. The developed method was validated according to the Guidelines for the
Validation of Screening Methods for Residues of Veterinary Medicines (Initial Validation
and Transfer)-Community Reference Laboratories (CRLs) 20/1/2010 and it satisfactorily
fulfilled the established criteria for 40 antibiotics in fish. The method was successfully
applied to real samples. Twenty nine (15%) of the 193 samples analyzed were positive
for one of the 40 antibiotics (enrofloxacin), which is not allowed for use in aquaculture in
Brazil. Only one sample had a concentration of enrofloxacin above the cut-off factor (50
µg.kg-1). This sample should proceed to quantification using a quantitative method to
verify its real concentration. The low occurrence of antibiotics in farm fish suggests that
there is a responsible management of aquaculture.

115
CAPÍTULO IV
CAPÍTULO IV - MULTI-RESIDUE QUANTITATIVE METHOD
FOR QUINOLONES AND TETRACYCLINES IN FISH BY LC-
MSMS
ABSTRACT
A multiresidue method for the quantification of 14 quinolones and tetracyclines
antibiotics in fish by liquid-chromatography–tandem mass spectrometry (LC-MS/MS) is
described. Sample preparation was optimized using a Central Composite Rotational
Design. Fish muscle was extracted with 0.5% trichloroacetic acid, homogenized in an
ultra-turrax, shaken and centrifuged. The supernatant was filtered and used for LC-
MS/MS analysis. LC separation was achieved on a Zorbax Eclipse XDB C18 (150 x 4.6
mm, 1.8 µm) column with gradient elution using 0.1% heptafluorobutyric acid in water
and acetonitrile as mobile phases. Analysis was carried out in multiple reaction
monitoring mode via electrospray interface operated in the positive ionization mode,
with sulfaphenazole as internal standard. The method was validated according to
Decision 2002/657/EC. It was considered fit for the purpose. Precision, in terms of
relative standard deviation, was under 20%, and recoveries ranged from 89.3 to
103.7%. Reproducibility values, expressed as coefficient of variation, were below
14.0%. CCα varied from 17.87 to 323.20 μg.kg-1 and CCβ varied from 20.75 to 346.40
μg.kg-1. The method was applied to real samples positive for enrofloxacin (n=29) and
four of them contained levels above the limit of quantification (12.53 to 19.01 µg.kg-1)
but below the Maximum Residue Limit (100 µg.kg-1).
Keywords: fish; antibiotic; enrofloxacin; quantification; chromatography; mass
spectrometry.

116
CAPÍTULO IV
1. INTRODUCTION
Aquaculture is an important system of fish production, which is growing
worldwide faster than any other animal food-production sectors (FAO, 2010; ROMERO
et al., 2012). The contribution of aquaculture fish production to the total captured fishes
(including for nonfood uses) has grown from 13.4% in 1990 to 25.7% in 2000 and to
42.2% in 2012 (FAO, 2014). Its relative contribution to the total amount of fish produced
for human consumption ranged from 5% in 1962 to 37% in 2002 and to 49% in 2012
(FAO, 2014; SANTOS & RAMOS, 2016).
Although aquaculture has many advantages, the fast growth of this production
system has resulted in concerns over fish quality and safety. Fish production adopts
intensive and semi-intensive practices, in which, most of the times, there is a high
concentration of animals in small spaces, substantially increasing the risk of disease
spread in fish resulting in high-mortality rates (EFSA, 2008; QUESADA et al., 2013b;
SANTOS & RAMOS, 2016). The dissemination of diseases in aquaculture is also due to
inadequate management and poor environmental conditions, among them, high density
of animals, feeding levels, removal and restocking, and inadequate nutrition (QUESADA
et al., 2013b). Therefore, the use of antimicrobial agents in aquaculture becomes a
necessity, as they can help in the treatment and prevention of infectious diseases.
Antibiotics are generally used to inhibit microorganisms’ growth, being used as
therapeutic, prophylactic or metaphylactic agents (ROMERO et al., 2012; QUESADA et
al., 2013b).
The most commonly used antibiotics in aquaculture worldwide are tetracycline,
oxytetracycline (tetracyclines), oxolinic acid, flumequine, sarafloxacin, enrofloxacine
(quinolones), amoxicylin (β-lactam), erythromycin (macrolide), sulfadimethoxine
(sulfonamide), ormetoprim (diaminopyrimidine) and florfenicol (amphenicol) (QUESADA
et al., 2013b). Each country has its own legislation on which ones and how much
substances are allowed for use in aquaculture. In Brazil, there are only two
antimicrobials licensed for aquaculture - florfenicol and oxytetracycline (SINDAM, 2016).
Maximum residue limits (MRLs) for antibiotics in food are established by many
regulatory agencies around the world, including the European Union (EU), the U.S.
Food and Drug Administration (FDA), the Ministry of Agriculture, Livestock and Supply
(MAPA) in Brazil, as well as Codex Alimentarius and the European Medicines Agency
(EMEA) to ensure the quality and safety of consumer products (QUESADA et al.,
2013b; REZK et al., 2015). Table 1 presents the MRLs for quinolones and tetracyclines

117
CAPÍTULO IV
in fish. These low limits (level range from μg.kg−1 to ng.kg−1) require sensitive and
specific methods to monitor and determine unequivocally antimicrobial residues in
aquatic products.
Table 1. Maximum residue levels (MRL) of quinolones and tetracyclines in fish
established by different regulatory agencies
Class/Antibiotic
Maximum residue levels - MRL (µg.kg-1) / regulatory agency
BRASIL (2015) CODEX (2015) EUROPEAN
COMMUNITY (2010)
Quinolones
Ciprofloxacina Sum equal to 100 n.e. Sum equal to 100
Danofloxacin - n.e. 100
Difloxacin 300 n.e. 300
Enrofloxacina Sum equal to 100 n.e. Sum equal to 100
Flumequine 600 500 (trout) 600
Marbofloxacin n.e. n.e. n.e.
Nalidixic acid 20 n.e. n.e.
Norfloxacin n.e. n.e. n.e.
Oxolinic acid 20 n.e. 100
Sarafloxacin 30 n.e. 30
Tetracyclinesb Sum equal to 200
Chlortetracycline n.e. 100
Doxycycline n.e. n.e.
Oxytetracycline 200 100
Tetracycline n.e. 100
n.e.- not established; a sum of ciprofloxacin and enrofloxacin; b sum of all tetracyclines
Based on this information, it is important to monitor the presence of antibiotics in
fish in order to protect consumer from health hazards. The presence of such residues in
food can be responsible for toxic effects, allergic reactions in individuals with
hypersensitivity and can also result in the development of resistant strains of bacteria
(FREITAS et al., 2013). Indeed, in recent years, bacterial resistance has become a
worldwide concern and food-producing animals are potential source of antibiotic
resistant bacteria in humans. As a result, there is increasing pressure on laboratories
responsible for ensuring the safety of food for human consumption regarding the
development of reliable and sensitive analytical methods to analyze antibiotic residues
in food (CHÁFER-PERICÁS et al., 2010).

118
CAPÍTULO IV
An analytical technique to fit this purpose is liquid chromatography tandem mass
spectrometry triple quadrupole (LC-MS/MS) because of its high specificity, sensitivity
and detectability (MONTEIRO et al., 2015). Many studies were developed using LC-
MS/MS to detect antibiotics in fish and other aquaculture products (SANTOS et al.,
2005; HERNANDO et al., 2006; KARBIWNYK et al., 2007; SAMANIDOU et al., 2008;
CHÁFER-PERICÁS et al., 2010; VILLAR-PULIDO et al., 2011; MENDOZA et al., 2012;
WU et al., 2012; GBYLIK et al., 2013; QUESADA et al., 2013a; DICKSON, 2014;
FEDOROVA et al., 2014; FREITAS et al., 2014b; MONTEIRO et al., 2015; REZK et al.,
2015; VEACH et al., 2015). However, most of the multiresidue methods available for
antibiotics in fish has, in general, a laborious sample preparation step, which increases
the time of analysis and, sometimes, the consumption of reagents, generating more
residues to the environment.
The aim of the present study was to develop and validate a simple, rapid and
sensitive quantitative method for the simultaneous determination of quinolones and
tetracyclines in fish tissues and to analyze fish samples which provided positive results
from a previous screening study (chapter III).
2. EXPERIMENTAL
2.1. Material
2.1.1. Chemicals and regents
LC-MS grade acetonitrile and methanol were purchased from Merck (Darmstadt,
Germany); heptafluorobutyric acid (HFBA) was from Fluka (Buchs, Switzerland) and
trichloroacetic acid (TCA) was from Vetec (Rio de Janeiro, Brazil). Ultra-pure water was
obtained from a Milli-Q purification apparatus (Millipore, Bedford, MA, USA).
All antibiotics were of high purity grade (>99.0%). They included tetracyclines
(chlortetracycline, doxycycline, oxytetracycline and tetracycline) and quinolones
(ciprofloxacin, danofloxacin, difloxacin, enrofloxacin, flumequine, marbofloxacin,
nalidixic acid, norfloxacin, oxolinic acid and sarafloxacin), a total of 14 compounds. They
were purchased from Sigma-Aldrich (St. Louis, Missouri, USA), Fluka (Buchs,
Switzerland) and Dr. Ehrenstorfer (Augsburg, Germany). Sulfaphenazole, the internal

119
CAPÍTULO IV
standard, was purchased from Sigma-Aldrich (St. Louis, MO, USA). Their shelf-lives
were carefully considered (5 months for tetracyclines and 6 months for quinolones).
Each standard was accurately weighed and transferred to a 50-mL volumetric
flask and used to prepare methanolic stock solutions at concentrations of 100 µg.mL-1
for quinolones and 200 µg.mL-1 for tetracyclines. To enhance solubility, 1 mL of
1 mol.L-1 NaOH was added to quinolone standard solutions. Individual stock solutions
were stored at -10 °C.
Working standard solutions were obtained by dilution of each stock solution in
ultra-purified water, at concentrations varying from 0.15 µg.mL-1 to 3.0 µg.mL-1 for
quinolones and 1.0 µg.mL-1 for all the tetracyclines. The internal standard
(sulfaphenazole) solution was prepared at 0.5 µg.mL-1 in ultra-purified water. All working
solutions were kept at -10 ºC and prepared fresh monthly.
2.1.2. Samples
Blank samples of Nile tilapia used in the validation process were collected at two
farms from the state of Minas Gerais, Brazil, where none of the studied antimicrobials
were used. A total of 29 samples of Nile tilapia (Oreochromis niloticus) and trout
(Oncorhynchus mykiss) from Minas Gerais, previously analyzed by a screening LC-
MS/MS method (chapter III) and positive for enrofloxacin were used in this work.
2.2. LC-MS/MS analysis
Liquid chromatography was performed in an Agilent 1200 Series HPLC (Agilent
Technologies Inc., Santa Clara, CA, USA) coupled to a Triple Quadrupole Mass
Spectrometer detector API 5000 AbSciex (Life Technologies Corporation, CA, USA). A
Zorbax Eclipse XDB C18 (150 x 4.6 mm, 1.8 µm, Agilent Technologies, CA, USA)
column was used. To establish optimum conditions for the chromatographic separation
of all compounds and to achieve a short running time, several chromatographic
parameters were investigated, including composition and flow rate of the mobile phase,
gradient elution, injection volume and column temperature.
Mass spectrometer parameters were also optimized for each compound
separately by direct infusion of individual standard solutions at concentrations ranging
from 50 to 100 µg.L-1 in MeOH. The best precursor and product ions, declustering
potential (DP), collision energy (CE) and collision cell exit potential (CXP) were

120
CAPÍTULO IV
established. Electrospray ionization (ESI) generated the ions in a positive mode.
Multiple reaction monitoring (MRM) was used and two transitions were selected: the
most intense transition for quantifications and the second most intense for confirmation
purposes. Each chromatographic run was divided into scan events with a scan time of
90 seconds for each transition. The analytical system control, acquisition and data
processing were performed using Analyst software, version 1.5.1, from AbSciex (Life
Technologies Corporation, CA, USA).
2.3. Optimization of the sample preparation step
An extraction method based on the method described by GAUGAIN-JUHEL et al.
(2009) was optimized for fish muscle. 2.0 g of ground and homogenized fish muscle
was weighted in a 50-mL polypropylene centrifuge tube. Then, 200 µL of internal
standard (sulfaphenazole at 0.5 µg.mL-1) and 800 µL of deionized water were added.
The sample was vortexed for 30 seconds and after standing for 10 minutes at room
temperature, 8 mL of trichloroacetic acid (TCA) was added. The sample was
homogenized in an ultra-turrax for 20 seconds, placed in a shaker, and centrifuged at
2700 x g at 4 °C. The extract was filtered through a PVDF membrane with 0.45 µm pore
size (Millipore, Bedford, MA, USA) immediately prior to LC-MS/MS analysis.
A Central Composite Rotational Design (CCRD) was used to screen the main
factors that could affect recovery of the antibiotics from fish muscle. The independent
variables investigated were TCA concentration, stirring time and centrifugation time.
The following parameters were kept unchanged: volume of TCA (8 mL), centrifugation
speed (2700 x g), centrifugation temperature (4 °C), homogenization time in ultra-turrax
(20 s). Table 2 shows the levels studied in the CCRD and Table 3 presents the
conditions of each assay of the experimental design and its responses in peak area for
enrofloxacin and oxytetracycline. These two antibiotics were chosen as representatives
of each class to evaluate the response. Encoded values for the axial points are -1.68
and +1.68.
Twenty tests were assembled with six replicates at the central point and six at the
axial points. The results were submitted to analysis of variance (ANOVA) at 5%
probability using Minitab® 16 Statistical Software, version 16.1.0.

121
CAPÍTULO IV
Table 2. Coded and experimental values used in the Central Composite Rotational
Design (CCRD) during optimization of the extraction procedure for antibiotics analysis
by LC-MS/MS
Independent Variables Coded/Experimental Values
-1.68 -1 0 1 1.68
TCA concentration (%) 0.5 1.4 2.8 4 5
Stirring time (min) 5 7 10 13 15
Centrifugation time (min) 4 6 8 10 12
TCA – trichloroacetic acid. Centrifugation conditions: 2700 x g; 10 min at 4 ºC
Table 3. Coded values and responses in peak area of enrofloxacin (ENR) and
oxytetracycline (OXY) for each assay of the Central Composite Rotational Design
Assay TCA
Concentration (%)
Stirring
time (min)
Centrifugation
time (min)
ENR Peak
Area
OXY Peak
Area
1 -1 -1 -1 92900 93800
2 1 -1 -1 89000 92300
3 -1 1 -1 82200 92900
4 1 1 -1 65400 92300
5 -1 -1 1 89700 95200
6 1 -1 1 106000 87800
7 -1 1 1 95400 82000
8 1 1 1 88300 90000
9 -1.68 0 0 49700 65900
10 1.68 0 0 83700 89800
11 0 -1.68 0 88500 90500
12 0 1.68 0 92700 95900
13 0 0 -1.68 88800 85100
14 0 0 1.68 82000 91200
15 0 0 0 93800 91000
16 0 0 0 104000 88100
17 0 0 0 77000 90800
18 0 0 0 77900 82200
19 0 0 0 58900 80100
20 0 0 0 132000 96300
TCA – trichloroacetic acid. Centrifugation conditions: 2700 x g; 10 min at 4 ºC

122
CAPÍTULO IV
2.4. Maximum residue limit and validation level
Maximum residue limit (MRL) values were based on the Brazilian legislation for
fish, on values established for other matrices (chicken, pork and meat) when not
available for fish, and also on values set by Codex Alimentarius (CODEX, 2014;
BRASIL, 2015). Validation levels (VL) were set as 0.5xMRL concentrations, except for
nalidixic acid and oxolinic acid (VL=1.0xMRL).
2.5. Validation of the method
The fitness of the method optimized for the analysis of quinolones and
tetracyclines residues in fish was evaluated according to the Commission Decision
2002/657/EC (EC, 2002). The following parameters were evaluated: calibration curves,
accuracy, precision, recovery, decision limit (CCα), detection capability (CCβ),
specificity and limit of quantification.
2.5.1. Calibration curves
Calibration curves were constructed in blank fish tissue samples spiked with six
concentrations (0.25xVL, 0.50xVL, 0.75xVL, 1.0xVL, 1.25xVL, 1.5xVL). The ranges for
each analyte are described on Table 4. Then, 200 µL of the internal standard
(sulfaphenazole) was added and the samples were extracted as described (item 2.3).
Graphics of the analyte versus the concentration of the compound were plotted
and the equation and the fit degree (determination coefficient) of the data to the curve
were calculated. The acceptable ranges of each curve were established based on EC
(2002).

123
CAPÍTULO IV
Table 4. Maximum residue levels (MRL), validation levels (VL) and range of calibration
curves concentration levels of each antibiotic of the quantification method during the
validation of the method for the analysis of antibiotics in fish by LC-MS/MS
Class/Analyte MRL
(µg.kg-1) VL
(µg.kg-1)
Range of calibration curves concentration
levels (µg.kg-1)
Quinolones
Ciprofloxacin 100a 50 12.5 – 75.0
Danofloxacin 100b 50 12.5 – 75.0
Difloxacin 300a 150 37.5 – 225.0
Enrofloxacin 100a 50 12.5 – 75.0
Flumequine 600a 300 75.0 – 450.0
Marbofloxacin 100b 50 12.5 – 75.0
Nalidixic acid 20a 20 5.0 – 30.0
Norfloxacin 100b 50 12.5 – 75.0
Oxolinic acid 20a 20 5.0 – 30.0
Sarafloxacin 30a 15 3.75 – 22.50
Tetracyclines Sum equal to 200a 25.0 – 150.0
Chlortetracycline 100
Doxycicline 100
Oxytetracycline 100
Tetracycline 100
MRL – Maximum Residue Limit; VL – validation level. a BRASIL (2015); b CODEX (2014).
2.5.2. Recovery, accuracy and precision
Known levels of the analytes were added to a blank matrix to determine recovery,
accuracy and repeatability. Eighteen aliquots of the blank matrix were selected and
three groups of six aliquots each were fortified with 0.5, 1.0 and 1.5 times the validation
levels described on Table 4. The samples were analyzed and the concentration for each
one and the mean concentration of each level were calculated. The mean recovery and
the coefficient of variation (CV) of the six results for each level were also calculated.
Then, recovery was calculated as described in Equation 1 and accuracy was
established by Equation 2 (EC, 2002):
% Recovery = 100 × concentration found/fortification level (Eq. 1)
Accuracy = 100 × mean of concentration found/fortification level (Eq. 2)

124
CAPÍTULO IV
Repeatability was established through evaluation of the coefficient of variation
and the standard deviation for each level. Two different analysts repeated the
experiment previously performed twice in two different days. Mean concentration,
standard deviation and coefficient of variation (%) were calculated for the fortified
samples of each analyst (EC, 2002).
2.5.3. Specificity
Twenty different blank samples of fish muscle were analyzed to evaluate the
specificity of the method. The existence of any interference (possible peaks) that could
interfere with the detection in the range of retention time of the target analytes was
investigated.
2.5.4. Decision limit (CCα) and detection capability (CCβ)
The decision limit was established by the following protocol: twenty blank
samples were fortified in the validation level. The decision limit (α = 5 %) was equal to
validation level concentration plus 1.64 times the corresponding standard deviation (EC,
2002).
In order to determine CCβ, twenty blank samples were fortified in the decision
limit concentration (CCα) for each antibiotic. The detection capability (β = 5 %) was
equal to the CCα concentration plus 1.64 times the corresponding standard deviation
(EC, 2002).
2.5.5. Limit of quantification (LOQ)
The limit of quantification is defined as the lower concentration of the analyte that
can be determined with acceptable accuracy and precision. It was considered as the
first level of the calibration curve (AOAC, 1998).

125
CAPÍTULO IV
3. RESULTS AND DISCUSSION
3.1. Optimization of the LC-MS/MS procedure
The optimized spectrometric parameters and the retention time windows (equal
to retention time ± 5%) for each analyte individually are shown in Table 5. The
chromatographic conditions for the quantitation method were optimized to provide the
shortest possible run of all analytes of interest with appropriate resolution.
Table 5. Range of retention times and optimized spectrometric conditions - precursor
ion (Q1), confirmation (Q) and quantification transitions (C), declustering potential (DP),
entrance potential (EP), collision energy (CE) and collision cell exit potential (CXP) - for
each analyte of the quantification method during analysis of antibiotics by LC-MS/MS
ClassAnalyte
Retention
times range
(min)
Q1
(m/z) Q3 (m/z) DP EP CE CXP
Quinolones
Ciprofloxacin 8.03-8.33 332 314 (Q)231 (C) 61 10 30 47 12 12
Danofloxacin 8.18-8.26 358 340 (Q)255 (C) 60 10 33 50 10 10
Difloxacin 8.98-9.30 400 356 (Q)299 (C) 100 10 35 40 10 10
Enrofloxacin 8.42-8.72 360 342 (Q)286 (C) 72 10 30 50 12 12
Flumequine 10.6-11.00 262.1 244 (Q)202 (C) 44 10 25 45 12 12
Marbofloxacin 7.89-7.98 363 345 (Q)320 (C) 70 10 30 22 10 10
Nalidixic acid 10.40-10.80 233 215 (Q)187 (C) 42 10 30 35 12 12
Norfloxacin 7.89-8.20 320 302 (Q)231 (C) 60 10 33 50 12 12
Oxolinic acid 8.92-9.28 262 244 (Q)216 (C) 53 10 25 40 12 12
Sarafloxacin 8.82-9.15 386 368 (Q)348 (C) 50 10 30 40 12 12
Tetracyclines
Chlortetracycline 9.31-9.64 479.2 98.2 (Q)275 (C) 61 10 67 55 12 12
Doxycicline 9.51-9.82 445 428 (Q)154.2 (C) 55 10 25 40 12 12
Oxytetracycline 8.07-8.40 461.3 201.1 (Q)283.2 (C) 41 10 59 53 12 12
Tetracycline 8.44-8.77 445 410 (Q)427 (C) 55 10 27 25 12 12
C: confirmation transition; CE: collision energy; CXP: Collision Cell Exit Potential; DP: declustering potential; EP: entrance potential; Q: quantification transition. * Retention time range (mean of retention time ± 3s (n=15).
The mobile phase composition which provided best results was phase A – 0.1%
of heptafluorobutyric acid (HFBA) in water and phase B – acetonitrile at a gradient

126
CAPÍTULO IV
elution of: initial time – 90% A; 7.0 min – 50% A; 11.0 min – 50% A; 12.0 min – 90% A;
and 15 min – 90% A at a constant flow rate of 600 µL.min-1. The flow rate and injection
volume were 0.6 mL.min-1 and 10 µL, respectively and the column temperature was set
at 35 °C. Total chromatographic run lasted 15 min.
The presence of two chromatographic peaks, one for each m/z transition –
quantification and confirmation, eluting at the same retention time allowed the
unequivocal identification of each analyte. Each chromatographic peak presented a
signal-to-noise ratio (S/N) equal to 3 under these conditions (LOPES et al., 2011).
The total ion chromatograms obtained for all analytes in solvent (water) and in
the fish matrix are indicated in Figure 1. The run had a total time of 15 minutes and all
analytes eluted within 12 minutes. The shortest retention time was observed for
marbofloxacin (7.89-7.98 min), which had the highest affinity to the aqueous phase and
lowest interaction with the stationary phase. On the other hand, the longest retention
time was observed for flumequine (10.6-11.00 min).
Figure 2 shows typical chromatograms (extracted ion chromatograms) obtained
from fish muscle samples spiked with one antibiotic of each class at the validation level.
These chromatograms were obtained by selecting the quantification transition for each
analyte (Table 5). The high specificity and sensitivity of the triple quadrupole mass
analyzer allowed the detection of the 14 analytes in only one chromatographic run. Both
quantification and confirmation transitions (m/z) were used to confirm promptly a
positive response. As it can be observed in the chromatograms, the extraction
procedure proposed provided chromatographic peaks with good resolution, suggesting
its efficiency for the extraction and the analytes concentration.

127
CAPÍTULO IV
Figure 1. Total Ion Chromatogram (TIC) obtained for quinolones and tetracyclines (a)
in water and (b) in the fish matrix extract during LC-MS/MS analysis.
(a)
(b)

128
CAPÍTULO IV
Figure 2. Extracted Ion Chromatogram (XIC) for blank fish muscle sample spiked with
the quinolones and tetracyclines at the validation level during LC-MS/MS analysis.
Sarafloxacin 386>368
15 µg.kg-1
Ciprofloxacin 332>314
50 µg.kg-1
Norfloxacin 320>302
50 µg.kg-1
Flumequine 262.1>244
300 µg.kg-1
Oxolinic Acid 262>244
20 µg.kg-1
Nalidixic Acid 233>215
20 µg.kg-1
Difloxacin 400>356
150 µg.kg-1
Marbofloxacin 363>345
50 µg.kg-1
Enrofloxacin 360>342
50 µg.kg-1
Danofloxacin 358>340
50 µg.kg-1
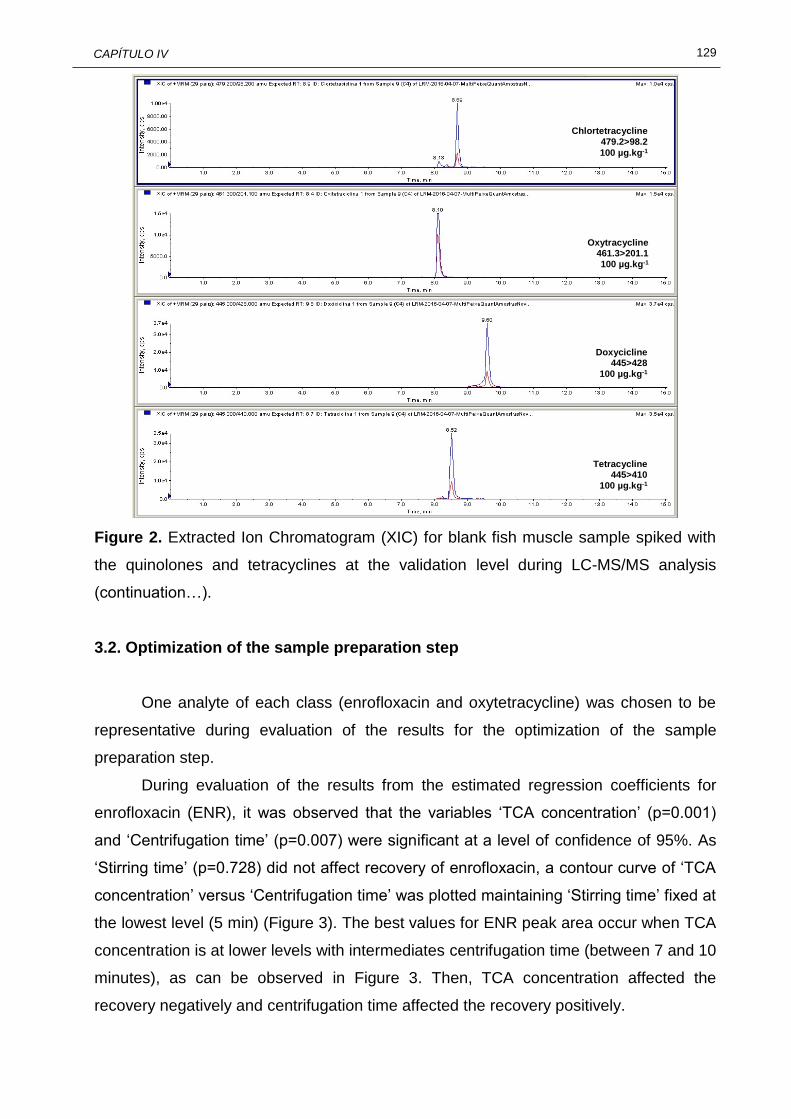
129
CAPÍTULO IV
Figure 2. Extracted Ion Chromatogram (XIC) for blank fish muscle sample spiked with
the quinolones and tetracyclines at the validation level during LC-MS/MS analysis
(continuation…).
3.2. Optimization of the sample preparation step
One analyte of each class (enrofloxacin and oxytetracycline) was chosen to be
representative during evaluation of the results for the optimization of the sample
preparation step.
During evaluation of the results from the estimated regression coefficients for
enrofloxacin (ENR), it was observed that the variables ‘TCA concentration’ (p=0.001)
and ‘Centrifugation time’ (p=0.007) were significant at a level of confidence of 95%. As
‘Stirring time’ (p=0.728) did not affect recovery of enrofloxacin, a contour curve of ‘TCA
concentration’ versus ‘Centrifugation time’ was plotted maintaining ‘Stirring time’ fixed at
the lowest level (5 min) (Figure 3). The best values for ENR peak area occur when TCA
concentration is at lower levels with intermediates centrifugation time (between 7 and 10
minutes), as can be observed in Figure 3. Then, TCA concentration affected the
recovery negatively and centrifugation time affected the recovery positively.
Chlortetracycline 479.2>98.2
100 µg.kg-1
Oxytracycline 461.3>201.1 100 µg.kg-1
Doxycicline 445>428
100 µg.kg-1
Tetracycline 445>410
100 µg.kg-1

130
CAPÍTULO IV
Figure 3. Contour curve for enrofloxacin peak area as a function of TCA concentration
and centrifugation time (stirring time fixed at 5 min).
The results of the estimated regression coefficients for oxytetracycline (OXY)
showed that ‘TCA concentration’ (p=0.022) was significant and ‘Centrifugation time’
(p=0.082) and ‘Stirring time’ (p=0.461) did not affect recovery of oxytetracycline at a
level of confidence of 95%. TCA concentration also affected the recovery negatively,
indicating that lower TCA concentration gives the best recoveries for oxytetracycline.
Therefore, after optimization, the established conditions for extraction of
quinolones and tetracyclines from fish samples were: 0.5 % TCA, of 5 minutes stirring
time and 10 min centrifugation time. A schematic diagram for sample preparation is
indicated in Figure 4.
Using the optimized method, a calibration curve was constructed in order to
evaluate recoveries for all analytes. The method showed good mean recoveries, which
ranged from to 87.5% to 108.1%, attending the criteria established by EC (2002) (Table
6).

131
CAPÍTULO IV
Figure 4. Schematic diagram for the extraction and clean-up of fish samples for the
analysis of selected antibiotics in fish by LC-MS/MS.
Table 6. Recovery ranges and mean recovery of the antibiotics quinolones and
tetracyclines during analysis of antibiotics in fish by LC-MS/MS
ClassAnalyte Recovery range (%) Mean recovery (%)
Quinolones
Ciprofloxacin 83.9 – 97.0 90.6
Danofloxacin 79.5 – 108.3 88.5
Difloxacin 91.0 – 96.8 93.7
Enrofloxacin 101.7 – 114.1 108.1
Flumequine 92.3 – 100.4 95.3
Marbofloxacin 93.0 – 99.9 96.2
Nalidixic acid 93.5 – 98.1 96.0
Norfloxacin 89.0 – 93.6 91.6
Oxolinic acid 73.6 – 100.5 87.5
Sarafloxacin 98.8 – 117.4 108.0
Tetracyclines
Chlortetracycline 97.4 – 103.5 100.8
Doxycicline 90.6 – 107.0 97.5
Oxytetracycline 87.9 – 104.6 97.4
Tetracycline 90.4 – 102.6 97.0
2.0 g ground fish muscle
Spiking with 200 µL internal standard Addition of 800 µL deionized water
10 min/room temperature
30 sec vortex
Addition of 8 mL 0.5% TCA
20 sec ultra-turrax
Shaking 5 min / shaker
Centrifugation (2700 x g/10 min) 4 ºC
Filtration (0.45 µm PVDF membrane)
LC-MS/MS system

132
CAPÍTULO IV
3.3. Method validation
3.3.1. Analytical curves, accuracy, repeatability, reproducibility
Analytical curves of quinolones and tetracyclines and the respective equations
and determination coefficients (R2) are indicated in Figure 5. The data fitted a linear
regression with R2 above 0.98 and adequate linearity within the working range for all
analytes.
Figure 5. Analytical curves in the matrix of fish for quinolones and tetracyclines with the
respective equations (y = peak area, x = analyte concentration in μg.kg-1) and
determination coefficients (R2).

133
CAPÍTULO IV
Figure 5. Analytical curves in the matrix of fish for quinolones and tetracyclines with the
respective equations (y = peak area, x = analyte concentration in μg.kg-1) and
determination coefficients (R2) (continuation…).
Table 7 presents the limit of quantification, average concentration, the
coefficients of variation (CV) of repeatability and reproducibility and the accuracy.
Accuracy was evaluated by means of recovery of known amounts of each analyte
added to a blank matrix. According to the Commission Decision 2002/657/EC (EC,
2002), when analyte concentration is between 1 and 10 μg.kg-1, the acceptable range of
recovery must be between 70% and 110%; when analyte concentration is greater than
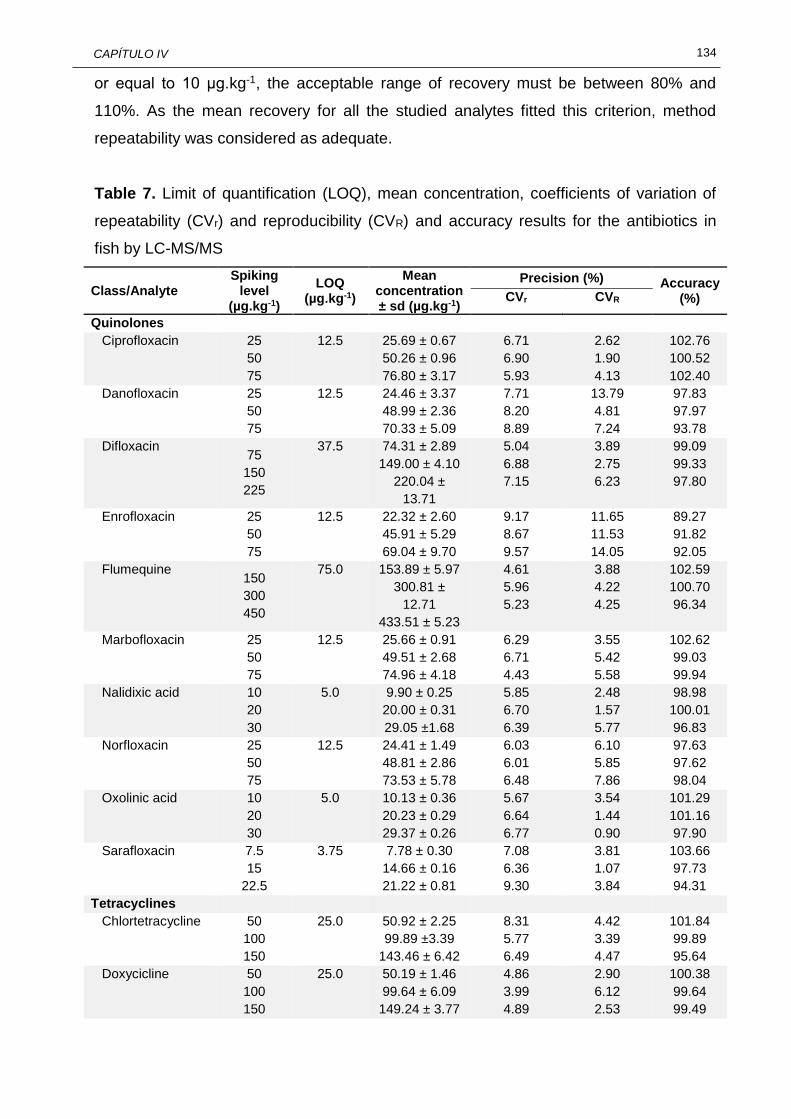
134
CAPÍTULO IV
or equal to 10 μg.kg-1, the acceptable range of recovery must be between 80% and
110%. As the mean recovery for all the studied analytes fitted this criterion, method
repeatability was considered as adequate.
Table 7. Limit of quantification (LOQ), mean concentration, coefficients of variation of
repeatability (CVr) and reproducibility (CVR) and accuracy results for the antibiotics in
fish by LC-MS/MS
Class/Analyte Spiking
level (µg.kg-1)
LOQ (µg.kg-1)
Mean concentration ± sd (µg.kg-1)
Precision (%) Accuracy (%) CVr CVR
Quinolones
Ciprofloxacin 25
50
75
12.5 25.69 ± 0.67
50.26 ± 0.96
76.80 ± 3.17
6.71
6.90
5.93
2.62
1.90
4.13
102.76
100.52
102.40
Danofloxacin 25
50
75
12.5 24.46 ± 3.37
48.99 ± 2.36
70.33 ± 5.09
7.71
8.20
8.89
13.79
4.81
7.24
97.83
97.97
93.78
Difloxacin 75
150
225
37.5 74.31 ± 2.89
149.00 ± 4.10
220.04 ±
13.71
5.04
6.88
7.15
3.89
2.75
6.23
99.09
99.33
97.80
Enrofloxacin 25
50
75
12.5 22.32 ± 2.60
45.91 ± 5.29
69.04 ± 9.70
9.17
8.67
9.57
11.65
11.53
14.05
89.27
91.82
92.05
Flumequine 150
300
450
75.0 153.89 ± 5.97
300.81 ±
12.71
433.51 ± 5.23
4.61
5.96
5.23
3.88
4.22
4.25
102.59
100.70
96.34
Marbofloxacin 25
50
75
12.5 25.66 ± 0.91
49.51 ± 2.68
74.96 ± 4.18
6.29
6.71
4.43
3.55
5.42
5.58
102.62
99.03
99.94
Nalidixic acid 10
20
30
5.0 9.90 ± 0.25
20.00 ± 0.31
29.05 ±1.68
5.85
6.70
6.39
2.48
1.57
5.77
98.98
100.01
96.83
Norfloxacin 25
50
75
12.5 24.41 ± 1.49
48.81 ± 2.86
73.53 ± 5.78
6.03
6.01
6.48
6.10
5.85
7.86
97.63
97.62
98.04
Oxolinic acid 10
20
30
5.0 10.13 ± 0.36
20.23 ± 0.29
29.37 ± 0.26
5.67
6.64
6.77
3.54
1.44
0.90
101.29
101.16
97.90
Sarafloxacin 7.5
15
22.5
3.75 7.78 ± 0.30
14.66 ± 0.16
21.22 ± 0.81
7.08
6.36
9.30
3.81
1.07
3.84
103.66
97.73
94.31
Tetracyclines
Chlortetracycline 50
100
150
25.0 50.92 ± 2.25
99.89 ±3.39
143.46 ± 6.42
8.31
5.77
6.49
4.42
3.39
4.47
101.84
99.89
95.64
Doxycicline 50
100
150
25.0 50.19 ± 1.46
99.64 ± 6.09
149.24 ± 3.77
4.86
3.99
4.89
2.90
6.12
2.53
100.38
99.64
99.49

135
CAPÍTULO IV
Table 7. (continuation…)
Class/Analyte Spiking
level (µg.kg-1)
LOQ (µg.kg-1)
Mean concentration ± sd (µg.kg-1)
Precision (%) Accuracy
(%)
Oxytetracycline 50
100
150
25.0 50.20 ± 2.80
102.34 ± 3.52
142.82 ± 6.21
7.05
7.78
6.41
5.58
3.44
4.35
100.41
102.34
95.21
Tetracycline 50
100
150
25.0 50.12 ± 2.56
101.70 ± 3.87
140.31 ± 6.02
5.10
7.38
7.32
5.11
3.80
4.29
100.23
101.70
93.54
n = 18; sd – standard deviation; CVr – coefficient of variation of repeatability; CVR – coefficient of variation of reproducibility; LOQ – limit of quantification
According to the Commission Decision 2002/657/EC (EC, 2002), the maximum
CV allowed for “in house” reproducibility is 20% for all analytes, except for the tested
concentration levels above 150 μg.kg-1, in which the maximum CV allowed is 15%.
Repeatability maximum CV must be between 1/2 and 2/3 of the CV of reproducibility.
Then, the maximum CVs for repeatability were 13.33% and 10%, respectively. As CVs
for all the analytes fitted these criterions, the method was considered reproducible for
fish muscle.
Precision and recovery measure the variability during the analytical process and
can be used to analyze and prove the robustness of the method, and are mandatory
parameters in the validation process (FREITAS et al., 2015).
3.3.2. Specificity
Blank samples (n=20) of fish muscle were analyzed to evaluate the presence of
interference in the expected retention time of each analyte. The absence of interference
above a signal-to-noise ratio of 3 at the range of retention time of the target compounds
was verified. Thus, there were no interferences that could compromise the detection
and identification of the compounds and the method was considered as specific for all
the studied analytes.
3.3.3. Decision limit (CCα) and detection capability (CCβ)
The results for CCα and CCβ for each antibiotic are indicated on Table 8.
Decision limits varied from 17.87 to 323.20 μg.kg-1 and indicate that samples with
concentration level above these values are considered positives with an error α = 5%.

136
CAPÍTULO IV
Detection capability varied from 20.75 to 346.40 μg.kg-1. CCβ indicate the
concentration level in which the method is capable of detecting concentrations in the
validation level with a statistical certainty of 95%.
Table 8. Decision limit (CCα) and detection capability (CCβ) results for the antibiotics in
fish by LC-MS/MS
Class/Analyte CCα (µg.kg-1) CCβ (µg.kg-1)
Quinolones
Ciprofloxacin 55.63 61.25
Danofloxacin 56.44 62.88
Difloxacin 166.50 183.00
Enrofloxacin 58.51 67.02
Flumequine 323.20 346.40
Marbofloxacin 53.57 57.14
Nalidixic acid 23.89 27.77
Norfloxacin 55.16 60.33
Oxolinic acid 22.39 24.77
Sarafloxacin 17.87 20.75
Tetracyclines
Chlortetracycline 110.78 121.56
Doxycicline 107.39 114.79
Oxytetracycline 110.68 121.36
Tetracycline 111.32 122.65
3.4. Analysis of real samples
The validated method was used in the analysis of 29 samples of fish collected
from Brazilian farms, among them, three trout and twenty six Nile tilapia samples from
Minas Gerais state. These samples were previously analyzed by a screening LC-
MS/MS method and they were positive for enrofloxacin (chapter III). Therefore, this
developed quantitative method was applied to confirm if these samples were really
positive and to quantitate the amount of enrofloxacin present. The presence of the 14
quinolones and tetracyclines was investigated and only four samples of Nile tilapia had
enrofloxacin at concentrations above the first point of the calibration curve (12.5 µg.kg-
1), with concentrations ranging from 12.53 to 19.01 µg.kg-1. The remaining 25 samples
had trace levels of enrofloxacin, below LOQ (<12.5 µg.kg-1). Even though enrofloxacin
was detected in fish samples, the concentration levels were below the MRL established

137
CAPÍTULO IV
by the legislation – 100 µg.kg-1 (BRASIL, 2015). Figure 6 presents the chromatogram of
one real positive sample for enrofloxacin.
Figure 6. LC-MS/MS chromatogram of a real positive fish sample for enrofloxacin.
Enrofloxacin, a fluoroquinolone antimicrobial with broad spectrum of activity, was
present in fish even though its use is not allowed in aquaculture in Brazil and in several
other countries (KIM et al., 2012; BRASIL, 2015; SINDAM, 2016). However,
enrofloxacin is available in the market for veterinary use and also allowed for use in
aviculture in some countries, including Brazil. (BRASIL, 2015; SINDAM, 2016).
Although FDA withdrew approval for the use of enrofloxacin in poultry in 2005 because
it could select for fluoroquinolone resistant Campylobacter, it is still approved for use in
some food producing animals and companion animals (KIM et al., 2012). It is also
important to consider that residues of antibiotics can reach fishes by several sources of
contamination. The use of enrofloxacin in aviculture for example can result in its release
in the environment through waste streams by which fish may be contaminated. Also,
the illegal direct use of enrofloxacin in aquaculture, either due to misinformation or on
purpose, could be another important source of contamination, once it is an effective

138
CAPÍTULO IV
antibiotic. Furthermore, the availability of enrofloxacin as a veterinary antibiotic
facilitates its acquisition and possible illegal use. In order to warrant fish quality, human
health and international trade, it is necessary to determine the source of contamination
and to implement educational programs to prevent health hazard associated with
antibiotics abuse.
4. CONCLUSIONS
A quantitative LC-MS/MS method was optimized for the simultaneous
quantification of 14 antibiotics (quinolones and tetracyclines) in fish muscle.
Sample preparation was optimized using a Central Composite Rotational Design
(CCRD) using enrofloxacin and oxytetracycline as representative of the two classes of
antibiotics to evaluate optimization. The best conditions for the extraction of quinolones
and tetracyclines from fish samples were: TCA concentration – 0.5 %, stirring time – 5
min. and centrifugation time – 10 min. Sample preparation was simple and fast, which is
desirable for routine methods. A C18 column was used along with a gradient elution of
0.1% HFBA in water:acetonitrile. A single run of 15 minutes was capable of determining
the presence of the compounds. The developed method was validated according to
Commission Decision 2002/657/EC (EC, 2002) and it satisfactorily fulfilled the
established criteria for the 14 antibiotics in fish. The method was successfully applied to
real samples positive for enrofloxacin. Four samples of Nile tilapia had enrofloxacin
concentration above the first point of the calibration curve (12.5 µg.kg-1), with
concentrations ranging from 12.53 to 19.01 µg.kg-1. The remaining 25 samples had
trace levels of enrofloxacin below LOQ (<12.5 µg.kg-1). All the samples had
concentration levels of enrofloxacin below the MRL established by the legislation
(BRASIL, 2015). However, it is important to elucidate the source of contamination to
protect consumer’s health. The low occurrence of antibiotics in farm fish suggests that
there is responsible management of aquaculture.

139
CONCLUSÕES INTEGRADAS
CONCLUSÕES INTEGRADAS
A partir do estudo de revisão sobre cloranfenicol realizado, pode-se perceber
que diversos métodos de análise de cloranfenicol em alimentos têm sido
desenvolvidos. Observou-se que, no geral, os métodos de preparo de amostra para
determinação de cloranfenicol em matrizes de alimentos utilizaram procedimentos
simples de extração líquido-líquido sem a necessidade de qualquer técnica de limpeza
sofisticada. Apesar de bastante difundida atualmente, o uso da técnica de CL-EM/EM
só se tornou mais comum nos últimos 10 anos. Os estudos de determinação de
cloranfenicol encontrados na literatura analisaram principalmente mel, leite e peixe,
sendo o leite a matriz com maior ocorrência de amostras positivas.
A maioria dos métodos de análise de anfenicóis em alimentos disponíveis na
literatura também utilizaram técnicas convencionais para o preparo de amostras, como
extração líquido-líquido e em fase sólida. A técnica CL-EM/EM tem sido a mais utilizada
e recomendada para a análise de cloranfenicol, que teve seu uso banido em animais
produtores de alimentos e, por isso, demanda métodos sensíveis o suficiente para
detectar traços desse antibiótico.
Embora o cloranfenicol tenha uso proibido em muitos países, este foi encontrado
em muitas matrizes alimentares ao redor do mundo em concentrações que variaram de
0,14 a 592 μg.kg-1. Algumas amostras apresentaram valores acima do limite máximo de
desempenho requerido (LMDR - 0,3 μg.kg-1), o que é preocupante por se tratar de uma
substância com efeitos adversos sérios e irreversíveis para o homem. O leite
apresentou o maior número de amostras positivas com ocorrência variando de 0,3% a
42,8%. Apenas amostras de leite continham tianfenicol, com 8% de ocorrência em
níveis (0,6 a 1,7 μg.kg-1) abaixo do limite máximo de resíduos estabelecido pela União
Europeia (LMR - 50 μg.kg-1). Todas as amostras positivas para o florfenicol também
estavam abaixo do LMR estabelecido pela União Europeia. A maioria dos métodos não
incluiu o metabólito florfenicol amina, que deve ser adicionado aos níveis de florfenicol
para cumprimento da legislação.
Foi desenvolvido um método de triagem por CL-EM/EM para determinação
multirresíduo e multiclasse de 40 antibióticos pertencentes a 6 classes diferentes
(aminoglicosídeos, beta-lactâmicos, macrolídeos, quinolonas, sulfonamidas e
tetraciclinas) em músculo de peixe. A etapa de preparo da amostra foi mais rápida e

140
CONCLUSÕES INTEGRADAS
mais simples quando comparada com outros métodos de análise multiclasse de
antibióticos em peixe encontrados na literatura, o que é desejável para métodos de
rotina. O método desenvolvido foi validado de acordo com as diretrizes para a
validação de métodos de triagem da União Europeia (EC, 2010b) e os critérios
estabelecidos foram cumpridos para 40 dos antibióticos estudados. Em geral, as
amostras de peixe analisadas, provenientes dos Estados de Minas Gerais e do Pará,
apresentaram qualidade adequada quanto à presença de resíduos de antibióticos.
Entretanto, das 193 amostras analisadas, 15% foram positivas para enrofloxacina em
níveis inferiores ao LMR permitido.
Um método quantitativo por CL-EM/EM foi desenvolvido para análise simultânea
de 14 quinolonas e tetraciclinas em músculo de peixe. Precisão, em termos de desvio
padrão relativo, foi inferior a 20% para todos os compostos e as recuperações variaram
de 89,3 a 103,7%. Valores de reprodutibilidade, expressos como coeficiente de
variação, ficaram abaixo de 14,0%. CCα variou de 17,87 a 323,20 μg.kg-1 e CCβ variou
de 20,75 a 346,40 µg.kg-1. Todos os parâmetros atenderam aos critérios estabelecidos
pela Decisão 2002/657/EC (EC, 2002). Das 29 amostras positivas no método de
triagem para enrofloxacina, apenas 4 continham níveis de concentração acima do LOQ
(12,53 – 19,01 µg.kg-1) mas abaixo do LMR estabelecido pela legislação brasileira para
resíduos de enrofloxacina em peixe – 100 µg.kg-1 (BRASIL, 2015). Devido ao fato da
enrofloxacina não ser um antibiótico permitido para uso em aquicultura, é provável que
esteja havendo contaminação pelo ambiente ou uso ilegal desta substância em peixes.
Orientação dos produtores e melhoria na fiscalização devem ser realizadas para
garantir a saúde do consumidor.
Por fim, é importante reforçar que os métodos de análise por CL-EM/EM são
normalmente implementados em análises de rotina em laboratórios de órgão oficiais,
como por exemplo o Ministério da Agricultura, Pecuária e Abastecimento, por ainda
serem métodos de alto custo de aquisição e de manutenção e por exigirem treinamento
especializado dos analistas.

141
REFERÊNCIAS BIBLIOGRÁFICAS
REFERÊNCIAS BIBLIOGRÁFICAS
ABDEL-REHIM, M. Recent advances in microextraction by packed sorbent for
bioanalysis. Journal of Chromatography A, v. 1217, p. 2569-2580, 2010.
ALECHAGA, E.; MOYANO, E.; GALCERAN, M.T. Ultra-high performance liquid
chromatography-tandem mass spectrometry for the analysis of phenicol drugs and
florfenicol-amine in foods. Analyst, v. 137, p. 2486-2494, 2012.
ANTHEMIDIS, A.N.; IOANNOU, K.-I.G. Recent developments in homogeneous and
dispersive liquid-liquid extraction for inorganic elements determination - a review.
Talanta, v. 80, p. 413-421, 2009.
ANVISA. Agência Nacional de Vigilância Sanitária. PamVet. Monitoramento de
resíduos em leite exposto ao consumo, relatorio 2006-2007, p. 1-74, 2009.
AOAC. Association of Official Analytical Chemists. AOAC Peer-verified methods
program. Manual on polices and procedures. Gaithersburg, Maryland: AOAC,
1998. 35 p.
ARSAND, J.B. Desenvolvimento e validação de método de screening por LC-
qTOF-MS e método quantitativo por LC-MS/MS para análise de antibióticos da
classe aminoglicosídeos em alimentos de origem animal. Porto Alegre: Instituto
de Química, UFRGS. 2015. 96 p. (Dissertação de Mestrado em Química).
ASHWIN, H.M.; STEAD, S.L.; TAYLOR, J.C.; STARTIN, J.R.; RICHMOND, S.F.;
HOMER, V.; BIGWOOD, T.; SHARMAN, M. Development and validation of
screening and confirmatory methods for the detection of chloramphenicol and
chloramphenicol glucuronide using SPR biosensor and liquid chromatography-
tandem mass spectrometry. Analytica Chimica Acta, v. 529, p. 103-108, 2005.
AZZOUZ, A.; BALLESTEROS, E. Multiresidue method for the determination of
pharmacologically active substances in egg and honey using a continuous solid-
phase extraction, system and gas chromatography-mass spectrometry. Food
Chemistry, v. 178, p. 63-69, 2015.
BARGANSKA, Z.; SLEBIODA, M.; NAMIESNIK, J. Determination of antibiotic residues
in honey.Trends Analytical Chemistry, v. 30, n. 7, p. 1035-1041, 2011.
BARRETO, F.; RIBEIRO, C.; HOFF, R.B.; DALLA COSTA, T. Determination and
confirmation of chloramphenicol in honey, fish and prawns by liquid
chromatography-tandem mass spectrometry with minimum sample preparation:

142
REFERÊNCIAS BIBLIOGRÁFICAS
validation according to 2002/657/EC Directive. Food Additives & Contaminants,
Part A, v. 29, p. 550-558, 2012.
BAYLISS, P. Chemistry in the kitchen: fish and fish products. Nutrition and Food
Science, Bradford, n. 1, p. 41-43, 1996.
BERENDSEN, B.; STOLKER, L.; DE JONG, J.; NIELEN, M.; TSERENDORJ, E.;
SODNOMDARJAA, R.; CANNAVAN, A.; ELLIOTT, C. Evidence of natural
occurrence of the banned antibiotic chloramphenicol in herbs and grass. Analytical
and Bioanalytical Chemistry, v. 397, p. 1955-1963, 2010.
BERRADA, H.; BORRULL, F.; FONTA, G.; MARCÉ, R.M. Determination of macrolide
antibiotics in meat and fish using pressurized liquid extraction and liquid
chromatography–mass spectrometry. Journal of Chromatography A, v. 1208, p.
83-89, 2008.
BERRIDGE, N.J. Penicillin in milk – I: the rapid routine assay of low concentrations of
penicillin in milk. Journal of Dairy Reviews, v. 23, p. 336-341, 1956.
BLASCO, C.; TORRES, C. M., PICÓ, Y. Progress in antibacterials analysis of residual
in food. Trends in Analytical Chemistry, v. 26, n. 9, p. 895-913, 2007.
BOGUSZ, M.J.; HASSAN, H.; AL-ENAZI, E.; IBRAHIM, Z.; AL-TUFAIL, M. Rapid
determination of chloramphenicol and its glucuronide in food products by liquid
chromatography-electrospray negative ionization tandem mass spectrometry.
Journal of Chromatography B, v. 807, p. 343-356, 2004.
BOSCHER, A.; GUIGNARD, C.; PELLET, T.; HOFFMANN, L.; BOHN, T. Development
of a multi-class method for the quantification of veterinary drug residues in feeding
stuffs by liquid chromatography-tandem mass spectrometry. Journal of
Chromatography A, v. 1217, p. 6394-6404, 2010.
BOTSOUGLOU, N.A.; FLETOURIS, D.J. Antibacterial drugs, drugs residues in
foods pharmacology, food safety, and analysis. New York: Marcel Dekker, p.
85-94, 2001.
BOXALL, A.B.A.; KOLPIN, D.W.; HALLING-SØRENSEN, B.; TOLLS, J. Are veterinary
medicines causing environmental risks? Environmental Science & Technology, v.
37, p. 286-294, 2003.
BRASIL. Ministério da Agricultura. Portaria nº 51. Dispõe sobre a instituição do Plano
Nacional de Controle de Resíduos Biológicos em Produtos de Origem Animal -
PNCRB. Diário Oficial da União, 1986; 7 fev.

143
REFERÊNCIAS BIBLIOGRÁFICAS
BRASIL. Ministério da Agricultura. Instrução Normativa n. 42 de 20 de dez. de 1999.
Plano nacional de controle de resíduos em produtos de origem animal. Diário
Oficial da União. Brasília, 1999, p. 213-227; 22 dez.
BRASIL. Ministério da Agricultura e Abastecimento. Instrução Normativa n. 9 de 27 de
jun. de 2003, Diário Oficial da União. Brasilia, 2003, p. 4; 30 jun.
BRASIL. Ministério da Agricultura, Pecuária e Abastecimento. Secretaria de Defesa
Agropecuária. Instrução Normativa nº 13. Aprova os Programas de Controle de
Resíduos e Contaminantes em Carnes (Bovina, Aves, Suína e Equina), Leite,
Pescado, Mel e Ovos para o exercício de 2015. Diário Oficial da União, 2015; 15
jul.
BRITO, M.A.V.P. Resíduos de antimicrobianos no leite. Circular Técnica Embrapa
Gado de Leite, n. 60, 2000. 20p.
CACHO, C.; TURIEL, E.; MARTÍN-ESTEBAN, A.; PÉREZ-CONDE, C.; CÁMARA, C.
Clean-up of triazines in vegetable extracts by molecularlyimprinted solid-phase
extraction using a propazine-imprinted polymer. Analytical and Bioanalytical
Chemistry, v. 376, p. 491-496, 2003.
CARRETERO, V.; BLASCO, C.; PICÓ, Y. Multi-class determination of antimicrobials in
meat by pressurized liquid extraction and liquid chromatography–tandem mass
spectrometry. Journal of Chromatography A, v. 1209, n 1-2, p. 162-173, 2008.
CARRILLO, M. Applicación de fluoroquinolonas en medicina veterinaria: criterios
farmacocinéticos y farmacocinéticos/farmacodinamicos (PK/PD). Universidade
de Murcia, Facultatad de Veterinaria, Departamento de Farmacología. 2008.
CAS. Chemical Abstracts Service. Scifinder Chloramphenicol, Thiamphenicol, &
Florfenicol. American Chemical Society, Columbus, Ohio, USA, 2015.
CDDEP (2015). Center for Disease Dynamics, Economics & Policy. State of the World’s
Antibiotics, 2015. CDDEP: Washington, D.C., 2015. Disponível em
https://cddep.org/sites/default/files/swa_2015_final.pdf. Acessado em 03/08/2016.
CENTENO, M.M.G.F.L. Influência do uso de fluoroquinolonas no aparecimento de
Escherichia coli e Salmonella spp. multirresistentes em vitelos
multirresistentes em vitelos. Lisboa: Faculdade de Medicina Veterinária,
Universidade Técnica de Lisboa. 2010. 102 p. (Dissertação do Mestrado Integrado
em Medicina Veterinária).
CERKVENIK, V. Analysis and monitoring of chloramphenicol residues in food of animal
origin in Slovenia from 1991 to 2000. Food Additives & Contaminants, v. 19, p.
357-367, 2002.

144
REFERÊNCIAS BIBLIOGRÁFICAS
CERKVENIK-FAJS, V. Performance characteristics of an analytical procedure for
determining chloramphenicol residues in muscle tissue by gas chromatography-
electron capture detection. Biomedical Chromatography, v. 20, p. 985-992, 2006.
CHÁFER-PERICÁS, C.; MAQUIEIRA, Á.; PUCHADES, R. Fast screening methods to
detect antibiotic residues in food samples. Trends in Analytical Chemistry, v. 29,
p. 1038-1049, 2010.
CHEN, X.; YUE, Z.; JI, C.; LIANG, S. Analysis of chloramphenicol, thiamphenicol and
florfenicol in chickens by high performance liquid chromatography with electrospray
ionizantion mass spectrometry. Chinese Journal of Chromatography, v. 23, p.
92-95, 2005.
CHEN, H.; YING, J.; CHEN, H.; HUANG, J.; LIAO, L. LC determination of
chloramphenicol in honey using dispersive liquid-liquid microextraction.
Chromatographia, v. 68, p. 629-634, 2008.
CHEN, H.; CHEN, H.; YING, J.; HUANG, J.; LIAO, L.; Dispersive liquid-liquid
microextraction followed by high-performance liquid chromatography as an efficient
and sensitive technique for simultaneous determination of chloramphenicol and
thiamphenicol in honey. Analytica Chimica Acta, v. 632, p. 80-85, 2009.
CHEN, L.; LI, B. Magnetic molecularly imprinted polymer extraction of chloramphenicol
from honey. Food Chemistry, v. 141, p. 23-28, 2013.
CHEN, D.; YU, J.; TAO, Y.; PAN, Y.; XIE, S.; HUANG, L.; PENG, L.D.; WANG, X.;
WANG, Y.; LIU, Z.; YUAN, Z. Qualitative screening of veterinary anti-microbial
agents in tissues, milk, and eggs of food-producing animals using liquid
chromatography coupled with tandem mass spectrometry. Journal of
Chromatography B, v. 1017-1018, p. 82-88, 2016.
CHIARADIA, M.C.; COLLINS, C.H.; JARDIM, I.C.S.F. O estado da arte da
cromatografia associada à espectrometria de massas acoplada à espectrometria de
massas na análise de compostos tóxicos em alimentos. Química Nova, v. 31, p.
623-636, 2008.
CHOU, K.Y.; CHENG, T.Y.; CHEN, C.M.; HUNG, P.L.; TANG, Y.Y.; CHUNG-WANG,
Y.J.; SHIH, Y.-C. Simultaneous determination of residual thiamphenicol and
florfenicol in foods of animal origin by HPLC/Electrospray Ionization-MS/MS.
Journal of AOAC International, v.92, p. 1225-1232, 2009.
CODEX (2009). CODEX ALIMENTARIUS. CAC/GL 71-2009. Guidelines for the design
and implementation of national regulatory food safety assurance programme
associated with the use of veterinary drugs in food producing animals. 2009.38 p.

145
REFERÊNCIAS BIBLIOGRÁFICAS
CODEX (2014). CODEX ALIMENTARIUS. Maximum Residue Limits (MRLs) and Risk
Management Recommendations (RMRS) for Residues of Veterinary Drugs in
Foods CAC/MRL 2-2014. Updated as at the 37th Session of the Codex Alimentarius
Commission (July 2014). 38p.
CODEX (2015). CODEX ALIMENTARIUS. Maximum Residue Limits (MRLs) and Risk
Management Recommendations (RMRS) for Residues of Veterinary Drugs in
Foods CAC/MRL 2-2015. Updated as at the 38th Session of the Codex Alimentarius
Commission (July 2015). 41p.
COSTA, E.O. Resíduos de antibióticos no leite: Um risco à saúde do consumidor.
Higiene Alimentar, v. 44, n. 10, p. 15-17, 1996.
COSTI, E.M.; SICILIA, M.D.; RUBIO, S. Supramolecular solvents in solid sample
microextractions: Application to the determination of residues of oxolinic acid and
flumequine in fish and shellfish. Journal of Chromatography A, v. 1217, p. 1447-
1454, 2010.
CRONLY, M. ; BEHAN, P.; FOLEY, B.; MALONE, E.; MARTIN, S.; DOYLE, M.;
REGAN, L. Rapid multi-class multi-residue method for the confirmation of
chloramphenicol and eleven nitroimidazoles in milk and honey by liquid
chromatography-tandem mass spectrometry (LC-MS). Food additives &
Contaminants, Part A, v. 27, p. 1233-1246, 2010.
CUNHA, M.R.R. Análise de multirresíduos de antibióticos anfenicóis e β-
lactâmicos em leite por cromatografia líquida de alta eficiência acoplada ao
detector de massas. Campinas: Faculdade de Engenharia de Alimentos da
UNICAMP. 2009. 172 p. (Tese de Doutorado em Ciência de Alimentos).
DAGNAC, T.; GARCIA-CHAO, M.; PULLEIRO, P.; GARCIA-JARES, C.; LLOMPART,
M. Dispersive solid-phase extraction followed by liquid chromatographic tandem
mass spectrometry for the multi-residue analysis of pesticides in raw bovine milk.
Journal of Chromatography A, v. 1216, p. 3702-3709, 2009.
DASENAKI, M.E.; THOMAIDIS, N.S. Multi-residue determination of seventeen
sulfonamides and five tetracyclines in fish tissue using a multi-stage LC-ESI-MS/MS
approach based on advanced mass spectrometric techniques. Analytica Chimica
Acta, v. 672, p. 93-102, 2010.
DASENAKI, M.E.; THOMAIDIS, N.S. Multi-residue determination of 115 veterinary
drugs and pharmaceutical residues in milk powder, butter, fish tissue and eggs
using liquid chromatography–tandem mass spectrometry. Analytica Chimica Acta,
v. 880, p. 103-121, 2015.

146
REFERÊNCIAS BIBLIOGRÁFICAS
DEGANI, A.L.G.; CASS, Q.B.; VIEIRA, P.C. Cromatografia – um breve ensaio.
Química Nova na Escola - Cromatografia, v. 7, p. 21-25, 1998.
DICKSON, L.C. Performance characterization of a quantitative liquidchromatography–
tandem mass spectrometric method for 12macrolide and lincosamide antibiotics in
salmon, shrimp and tilapia. Journal of Chromatography B, v. 967, p. 203-210, 2014.
DING, S.Y.; SHEN, J.Z.; ZHANG, S.X.; JIANG, H.Y.; SUN, Z.W. Determination of
chloramphenicol residue in fish and shrimp tissues by gas chromatography with a
microcell electron capture detector. Journal of AOAC International, v. 88, p. 57-
60, 2005.
DO, M.H.N.; YAMAGUCHI, T.; OKIHASHI, M.; HARADA, K.; KONISHI, Y.; UCHIDA, K.;
BUI, L.T.; NGUYEN, T.D.; PHAN, H.B.; BUI, H.D.T.; NGUYEN, P.D.; KAJIMURA,
K.; KUMEDA, Y.; DANG, C.V.; HIRATA, K.; YAMAMOTO, Y. Screening of antibiotic
residues in pork meat in Ho Chi Minh City, Vietnam, using a microbiological test kit
and liquid chromatography/tandem mass spectrometry. Food Control, v. 69, p.
262-266, 2016.
DÓREA, H.S.; LOPES, W.G. Aplicação da técnica de dispersão da matriz em fase
sólida (DMFS) na análise de pesticidas em quiabo por CG-EM. Química Nova, v.
27, p. 892-896, 2004.
DORIVAL-GARCÍA, N.; LABAJO-RECIO, C.; ZAFRA-GÓMEZ, A.; JUÁREZ-JIMÉNEZ,
B.; VÍLCHEZ, J.L. Improved sample treatment for the determination of 17 strong
sorbed quinolone antibiotics from compost by ultra high performance liquid
chromatography tandem mass spectrometry. Talanta, v. 138, p. 247-257, 2015.
DOUNY, C.; WIDART, J.; DE PAUW, E.; MAGHUIN-ROGISTER, G.; SCIPPO, M.-L.
Determination of chloramphenicol in honey, shrimp, and poultry meat with liquid
chromatography-mass spectrometry: Validation of the method according to
Commission Decision 2002/657/EC. Food Analytical Methods, v. 6, p. 1458-1465,
2013.
EC. European Commission. Diretiva 96/23/CE do Conselho, de 29 de Abril de 1996,
relativa às medidas de controle a aplicar a certas substâncias e aos seus resíduos
nos animais vivos e respectivos produtos e que revoga as Diretivas 85/358/CEE e
86/469/CEE e as Decisões 89/187/CEE e 91/664/CEE. Official Journal of
European Communities, L0023, p. 1-29, 1996.
EC. European Commission. Council regulation 2377/90 of 26 June 1990 laying down a
community procedure for the establishment of maximum residue limits of veterinary

147
REFERÊNCIAS BIBLIOGRÁFICAS
medicinal products in foodstuffs of animal origin (1990). Official Journal of
European Communities, L224/1, p. 1-110, 1999.
EC. European Commission. Commission Decision 2002/657/EC of 12 August 2002:
implementing Council Directive 96/23/EC concerning the performance of analytical
methods and the interpretation of results. Official Journal of European
Communities, L 221, p. 8-36, 2002.
EC. European Commission. Council regulation N° 37/2010 de 22 de dezembro de 2009
relativo a substâncias farmacologicamente ativas e respectiva classificação no que
respeita aos limites máximos de resíduos nos alimentos de origem animal. Official
Journal of European Communities L15, p. 1-72, 2010a.
EC (2010b). European Commission. Guidelines for the validation of screening
methods for residues of veterinary medicines (initial validation and transfer).
Disponível em
http://ec.europa.eu/food/food/chemicalsafety/residues/lab_analysis_en.htm/.
Acessado em 21/06/2015.
EFSA. European Food Safety Authority. Scientific opinion of the panel on biological
hazards on a request from the European Food Safety Authority on food safety
considerations of animal welfare aspects of husbandry systems for farmed fish,
EFSA Journal, v. 867, p. 1-24, 2008.
EM (2015). Estado de Minas. Disponível em
http://www.em.com.br/app/noticia/economia/2014/01/20/internas_economia,489619
/aquicultura-brasileira-cresce-30-ao-ano-turbinada-pelo-consumo-de-peixe.shtml.
Acessado em 21/06/2015.
EMBRAPA (2015). Empresa Brasileira de Pesquisa Agropecuária. Disponível em
https://www.embrapa.br/tema-pesca-e-aquicultura/perguntas-e-respostas.
Acessado em 21/06/2015.
EMEA (2000). European Medicine Agency. Committee for Veterinary Medicinal
Products. Update of the Positi on Paper on Availability of Veterinary Medicines
agreed on 21 June 2000. Veterinary Medicines and Information Technology.
EMEA/CVMP/411/00-FINAL.
EMEA (2009). European Medicine Agency. Florfenicol Summary report. Disponível
em
http://www.ema.europa.eu/docs/en_GB/document_library/Maximum_Residue_Limit
s_-_Report/2009/11/WC500014274.pdf. Acessado em 22/10/2016.

148
REFERÊNCIAS BIBLIOGRÁFICAS
EMEA (2015). European Medicine Agency. Committee for veterinary medicinal
products. Disponível em
http://www.ema.europa.eu/ema/index.jsp?curl=pages/medicines/landing/vet_mrl_se
arch.jsp&mid=WC0b01ac058006488e. Acessado em 21/06/2015.
EVAGGELOPOULOU, E.N.; SAMANIDOU, V.F. Development and validation of an
HPLC method for the determination of six penicillin and three amphenicol antibiotics
in gilthead seabream (Sparus Aurata) tissue according to the European Union
Decision 2002/657/EC. Food Chemistry, v. 136, p. 1322-1329, 2013a.
EVAGGELOPOULOU, E.,N.; SAMANIDOU, V.F. HPLC confirmatory method
development for the determination of seven quinolones in salmon tissue (Salmo
salar L.) validated according to the European Union Decision 2002/657/EC. Food
Chemistry, v. 136, p. 479-484, 2013b.
FAGHIHI, S.M. How can the antibiotics used as feed additives in animals make problem
for public health? Archive of the Faculty of Veterinary Medicine, Tehran
University, v. 183, p. 150-152, 1990.
FAO. Food and Agriculture Organization. Responsible use of antibiotics in aquaculture.
Fishers Technical Paper, Rome, v.1, n.469, p.97, 2005.
FAO (2010). Food and Agriculture Organization. The state of world fisheries and
aquaculture. Fisheries and Aquaculture Department. Rome. Disponível em
http://www.fao.org/3/a-i1820e.pdf. Acessado em 24/08/2016.
FAO (2014). Food and Agriculture Organization. The State of World Fisheries and
Aquaculture. Fisheries and Aquaculture Department. Rome. Disponível em
http://www.fao.org/3/a-i3720e.pdf. Acessado em 24/08/2016.
FAO (2015a). Food and Agriculture Organization. The State of World Fisheries and
Aquaculture. Fisheries and Aquaculture Department. Rome. Disponível em
http://www.fao.org/fishery/sofia/en. Acessado em 21/06/2015.
FAO (2015b). Food and Agriculture Organization. Disponível em
http://www.fao.org/fishery/facp/BRA/en. Acessado em 21/06/2015.
FAO (2016). Food and Agriculture Organization. The State of World Fisheries and
Aquaculture. Fisheries and Aquaculture Department. Rome. Disponível em
http://www.fao.org/3/a-i5555e.pdf. Acessado em 22/10/2016.
FEDENIUK, R.W.; MCKENZIE, D.; MIZUNO, M.; NEISER, C.; O'BYRNE, C.;
SHURMER, B. Development and validation of determinative and confirmatory LC-
MS/MS methodologies for total florfenicol and tulathromycin residues in bovine,

149
REFERÊNCIAS BIBLIOGRÁFICAS
equine and porcine kidney, liver and muscle tissues. Journal of Chromatography
B, v. 983, p. 1-9, 2015.
FEDOROVA, G.; NEBESKY, V.; RANDAK, T.; GRABIC, R. Simultaneous determination
of 32 antibiotics in aquaculture products using LC-MS/MS. Chemical Papers, v. 68,
n. 1, p. 29-36, 2014.
FERNANDEZ-TORRES, R.; BELLO LOPEZ, M.A.; OLIAS CONSENTINO, M.;
CALLEJON MOCHON, M.; RAMOS PAYAN, M. Enzymatic-microwave assisted
extraction and high-performance liquid chromatography-mass spectrometry for the
determination of selected veterinary antibiotics in fish and mussel samples. Journal
of Pharmaceutical and Biomedical Analysis, v. 54, p. 1146-1156, 2011.
FERREIRA, R.G.; SPISSO, B.F.; HORA, I.M.C.; MONTEIRO, M.A.; PEREIRA, M.U.;
COSTA, R.P.; CARLOS, B.S. Panorama da ocorrência de resíduos de
medicamentos veterinários em leite no Brasil. Revista Segurança Alimentar e
Nutricional, v. 19, n. 2, p. 30-49, 2012.
FOOD INGREDIENTS BRASIL (2009). Revista nº 8. Disponível em www.revista-fi.com.
Acessado em 21/06/2015.
FORTI, A.F.; CAMPANA, G.; SIMONELLA, A.; MULTARI, M.; SCORTICHINI, G.
Determination of chloramphenicol in honey by liquid chromatography-tandem mass
spectrometry. Analytica Chimica Acta, v. 529, p. 257-263, 2005.
FRANCO, D.A.; WEB, B.J.; TAYLOR, C.L. Antibiotics and sulphonamides residues in
meat: implications for human health. Journal of Food Protection, v. 53, p. 178-
185, 1990.
FREITAS, A.; BARBOSA, J.; RAMOS, F. Development and validation of a multi-residue
and multiclass ultra-high-pressure liquid chromatography-tandem mass
spectrometry screening of antibiotics in milk. International Dairy Journal, v. 33, p.
38-43, 2013.
FREITAS, A.; BARBOSA, J.; RAMOS, F. Multi-residue and multi-class method for the
determination of antibiotics in bovine muscle by ultra-high-performance liquid
chromatography tandem mass spectrometry. Meat Science, v. 98, p. 58-64, 2014a.
FREITAS, A.; BARBOSA, J.; RAMOS, F. Multidetection of antibiotics in liver tissue by
ultra-high-pressure-liquid-chromatography–tandem mass spectrometry. Journal of
Chromatography B, v. 976-977, p. 49-54, 2015.
FREITAS, A.; LESTON, S.; ROSA, J.; CASTILHO, M.C.; BARBOSA, J.; REMA, P.
Multiresidue and multi-class determination of antibiotics in gilthead sea bream
(Sparus aurata) by ultra high-performance liquid chromatography-tandem mass

150
REFERÊNCIAS BIBLIOGRÁFICAS
spectrometry. Food Additives & Contaminants Part A, v. 31, n. 5, p. 817-826,
2014b.
GALLO, P.; NASI, A.; VINCI, F.; GUADAGNUOLO, G.; BRAMBILLA, G.; FIORI, M.;
SERPE, L. Development of a liquid chromatography/electrospray tandem mass
spectrometry method for confirmation of chloramphenicol residues in milk after alfa-
1-acid glycoprotein affinity chromatography. Rapid Communications in Mass
Spectrometry, v. 19, p. 574-579, 2005.
GASTALHO, S.; SILVA, G.J. da, RAMOS, F. Uso de antibióticos em aquacultura e
resistência bacteriana: Impacto em saúde pública. Acta Farmacêutica
Portuguesa, v. 3, n. 1, p. 29-45, 2014.
GAUGAIN-JUHEL, M.; DELÉPINE, B.; GAUTIER, S.; FOURMOND, M.; GAUDIN, V.;
HURTAUD-PESSEL, D.; VERDON, E.; SANDERS, P. Validation of a liquid
chromatography-tandem mass spectrometry screening method to monitor 58
antibiotics in milk: qualitative approach. Food Additives & Contaminants, v. 26, n.
11, p. 1459-1471, 2009.
GBYLIK, M.; POSYNIAK, A.; MITROWSKA, K.; BLADEK, T.; ZMUDZKI, J. Multi-residue
determination of antibiotics in fish by liquid chromatography-tandem mass
spectrometry. Food Additives & Contaminants Part A, v. 30, n. 6, p. 940-948,
2013.
GENTILI, A.; PERRET, S.; MARCHESE, S. Liquid chromatography-tandem mass
spectrometry for performing confirmatory analysis of veterinary drugs in animal-food
products. Trends in Analytical Chemistry, v. 24, n. 7, p. 704-733, 2005.
GIKAS, E.; KORMALI, P.; TSIPI, D.; TSARBOPOULOS, A. Development of a rapid and
sensitive SPE-LC-ESI MS/MS method for the determination of chloramphenicol in
seafood. Journal of Agricultural and Food Chemistry, v. 52, n. 5, p. 1025-1030,
2004.
GOMES, A.R.M.C. Determinação de fluoroquinolonas em tecido muscular de
aves. Coimbra: Faculdade de Farmácia, Universidade de Coimbra. 2013. 89 p.
(Dissertação de Mestrado em Segurança Alimentar).
GRANJA, R. Drogas veterinárias e antibióticos. Um panorama geral em carnes. 5º
Simpósio Técnico de Incubação, Matrizes de Corte e Nutrição, Santa Catarina,
2004.
GUIDI, L.R.; SILVA, L.H.M.; FERNANDES, C.; ENGESETH, N.J.; GLORIA, M.B.A. LC-
MS/MS determination of chloramphenicol in food of animal origin in Brazil. Scientia
Chromatographica, v. 7, n. 4, p. 1-9, 2015.

151
REFERÊNCIAS BIBLIOGRÁFICAS
GUIDI, L.R.; OLIVEIRA, M.C.P.P.; TETTE, P.A.S.; GLORIA, M.B.A. In: III Conferência
Nacional sobre Defesa Agropecuária, 2012, Salvador. Anais da III Conferência
Nacional sobre Defesa Agropecuária, p. 58, 2012a.
GUIDI, L.R.; TETTE, P.A.S.; GLORIA, M.B.A. In: III Conferência Nacional sobre Defesa
Agropecuária, 2012, Salvador. Anais da III Conferência Nacional sobre Defesa
Agropecuária, p. 59, 2012b.
GUIMARÃES, D.O.; MOMESSO, L.S.; PUPO, M.T. Antibióticos: importância
terapêutica e perspectivas para a descoberta e desenvolvimento de novos agentes.
Química Nova, v. 33, n. 3, p. 667-679, 2010.
GUSTAFSON, R.H. Symposium: antibiotic residues in meat and milk: use of antibiotics
in livestock and human health concerns. Journal of Dairy Science, v. 74, p. 1428-
1432, 1991.
GUY, P.A.; ROYER, D.; MOTTIER, P.; GREMAUD, E.; PERISSET, A.; STADLER, R.H.
Quantitative determination of chloramphenicol in milk powders by isotope dilution
liquid chromatography coupled to tandem mass spectrometry. Journal of
Chromatography A, v. 1054, p. 365-371, 2004.
HALLING-SØRENSEN, B.; NIELSEN, S.N.; LANZKY, P.F.; INGERSLEV, F.;
LUTZHØFT, H.C.H.; JØRGENSEN, S.E. Occurrence, fate and effects of
pharmaceutical substances in the environment - a review. Chemosphere, v. 36, n.
2, p. 357-393, 1998.
HAMMEL, Y.A.; MOHAMED, R.; GREMAUD, E.; LEBRETON, M.H.; GUY, P.A. Multi-
screening approach to monitor and quantify 42 antibiotic residues in honey by liquid
chromatography-tandem mass spectrometry. Journal of Chromatography A, v.
1177, p. 58-76, 2008.
HAN, J.; WANG, Y.; YU, C.-L.; YAN, Y.-S.; XIE, X.-Q. Extraction and determination of
chloramphenicol in feed water, milk, and honey samples using an ionic
liquid/sodium citrate aqueous two-phase system coupled with high-performance
liquid chromatography. Analytical and Bioanalytical Chemistry, v. 399, p. 1295-
1304, 2011a.
HAN, J.; WANG, Y.; YU, C.; LI, C.; YAN, Y.; LIU, Y.; WANG, L. Separation,
concentration and determination of chloramphenicol in environment and food using
an ionic liquid/salt aqueous two-phase flotation system coupled with high-
performance liquid chromatography. Analytica Chimica Acta, v. 685, p. 138-145,
2011b.

152
REFERÊNCIAS BIBLIOGRÁFICAS
HANEKAMP, J.C.; BAST, A. Antibiotics exposure and health risks: chloramphenicol.
Environmental Toxicology and Pharmacology, v. 39, n. 1, p. 213-220, 2015.
HAYES, J.M.; GILEWICZ, R.; FREEHAUF, K.; FETTER, M. Assay of florfenicol in swine
feed: interlaboratory study. Journal of AOAC International, v. 92, p. 340-347,
2009.
HEALTH CANADA (2015). List of maximum residue limits for veterinary drugs in
foods, Health Canada, Canada. Disponível em http://www.hc-sc.gc.ca/dhp-
mps/vet/mrl-lmr/mrl-lmr_versus_new-nouveau-eng.php. Acessado em 22/10/2016.
HERNANDO, M.D.; MEZCUA, M.; SUAREZ-BARCENA, J.M.; FERNANDEZ-ALBA,
A.R. Liquid chromatography with time-of-flight mass spectrometry for simultaneous
determination of chemotherapeutant residues in salmon. Analytica Chimica Acta,
v. 562, p. 176-184, 2006.
HEWAVITHARANA, A.K. Matrix matching in liquid chromatography-mass spectrometry
with stable isotope labelled internal standards--is it necessary? Journal of
Chromatography A, v. 1218, n. 2, p. 359-361, 2011.
HIRD, J. F.; KNIFTON, A. Chloramphenicol in veterinary medicine. Veterinary Record,
v. 119, p. 248-256, 1986.
HUANG, J.-F.; ZHANG, H.-J.; FENG, Y.-Q. Chloramphenicol extraction from honey,
milk, and eggs using polymer monolith microextraction followed by liquid
chromatography-mass spectrometry determination. Journal of Agricultural and
Food Chemistry, v. 54, p. 9279-9286, 2006.
HUANG, Z.-Y.; YAN, Q.-P.; ZHANG, Q.; PENG, A.-H. Sample digestion for determining
chloramphenicol residues in carp serum and muscle. Aquaculture International, v.
17, p. 69-76, 2009.
IARC. Monographs on the evaluation of the carcinogenic risk of chemicals to
humans. Geneva: WHO, International Agency for Research on Cancer, 1972-
present 5, p. 1-171, 1990.
IBGE. Instituto Brasileiro de Geografia e Estatística. Produção da Pecuária Municipal.
Rio de Janeiro, v. 41, p.1-108, 2013.
ISHII, R.; HORIE, M.; MURAYAMA, M.; MAITANI, T. Analysis of chloramphenicol in
honey and royal jelly by LC/MS/MS. Journal of the Food Hygienic Society of
Japan, v. 47, p. 58-65, 2006.
JANK, L.; MARTINS, M.T.; ARSAND, J.B.; MOTTA, T.M.C.; HOFF, R.B.; BARRETO,
F.; PIZZOLATO, T.M. High-throughput method for macrolides and lincosamides
antibiotics residues analysis in milk and muscle using a simple liquid–liquid

153
REFERÊNCIAS BIBLIOGRÁFICAS
extraction technique and liquid chromatography–electrospray–tandem mass
spectrometry analysis (LC-MS/MS). Talanta, v. 144, p. 686-695, 2015.
JECFA. Joint FAO/WHO Expert Committee on Food Additives. Monography on
residues of antibiotic. Roma,1999. paper, 45/61; 52/17.
JECFA. Joint FAO/WHO Expert Committee on Food Additives. WHO Food Additives
Series, v. 53, p. 1-40, 2014.
JIMENEZ, V.; RUBIES, A.; CENTRICH, F.; COMPANYO, R.; GUITERAS, J.
Development and validation of a multiclass method for the analysis of antibiotic
residues in eggs by liquid chromatography-tandem mass spectrometry. Journal of
Chromatography A, v. 1218, p. 1443-1451, 2011.
KARA, M.; UZUN, L.; KOLAYLI, S.; DENIZLI, A. Combining molecular imprinted
nanoparticles with surface plasmon resonance nanosensor for chloramphenicol
detection in honey. Journal of Applied Polymer Science, v. 129, p. 2273-2279,
2013.
KARBIWNYK, C.M.; CARR, L.E.; TURNIPSEED, S.B.; ANDERSEN, W.C.; MILLER,
K.E. Determination of quinolone residues in shrimp using liquid chromatography
with fluorescence detection and residue confirmation by mass spectrometry.
Analytica Chimica Acta, v. 596, p. 257-263, 2007.
KAUFMANN, A.; BUTCHER, P. Quantitative liquid chromatography/tandem mass
spectrometry determination of chloramphenicol residues in food using sub-2 microm
particulate high-performance liquid chromatography columns for sensitivity and
speed. Rapid Communications in Mass Spectrometry, v. 19, p. 3694-3700,
2005.
KAUFMANN, A.; BUTCHER, P.; MADEN, K.; WALKER, S.; WIDMER, M. Determination
of nitrofuran and chloramphenicol residues by high resolution mass spectrometry
versus tandem quadrupole mass spectrometry. Analytica Chimica Acta, v. 862, p.
41-52, 2015.
KAWANO, S.-I.; HAO, H.-Y.; HASHI, Y.; LIN, J.-M. Analysis of chloramphenicol in
honey by on-line pretreatment liquid chromatography-tandem mass spectrometry.
Chinese Chemical Letters, v. 26, p. 36-38, 2015.
KIM, B.-S.; KIM, J.N.; YOON, S.-H.; CHUN, J.; CERNIGLIA, C.E. Impact of enrofloxacin
on the human intestinal microbiota revealed by comparative molecular analysis.
Anaerobe, v. 18, p. 310-320, 2012.
KOR, K.; ZAREI, K. Electrochemical determination of chloramphenicol on glassy carbon
electrode modified with multi-walled carbon nanotube-cetyltrimethylammonium

154
REFERÊNCIAS BIBLIOGRÁFICAS
bromide-poly(diphenylamine). Journal of Electroanalytical Chemistry, v. 733, p.
39-46, 2014.
KOWALSKI, P. Capillary electrophoretic determination of thiamphenicol in turkeys
serum and its pharmacokinetic application. Journal of Pharmaceutical and
Biomedical Analysis, v. 43, p. 222-227, 2007.
KOWALSKI, P.; PLENIS, A.; OLEDZKA, I. Optimization and validation of capillary
electrophoretic method for the analysis of amphenicols in poultry tissues. Acta
Poloniae Pharmaceutica, v. 65, p. 45-50, 2008.
KOWALSKI, P.; PLENIS, A.; OLEDZKA, I.; KONIECZNA, L. Optimization and validation
of the micellar electrokinetic capillary chromatographic method for simultaneous
determination of sulfonamide and amphenicol-type drugs in poultry tissue. Journal
of Pharmaceutical and Biomedical Analysis, v. 54, p. 160-167, 2011.
LEON, N.; ROCA, M.; IGUALADA, C.; MARTINS, C.P.B.; PASTOR, A.; YUSA, V. Wide-
range screening of banned veterinary drugs in urine by ultra high liquid
chromatography coupled to high-resolution mass spectrometry. Journal of
Chromatography A, v. 1258, p. 55-65, 2012.
LI, J.; CHEN, H.; CHEN, H.; YE, Y. Selective determination of trace thiamphenicol in
milk and honey by molecularly imprinted polymer monolith microextraction and high-
performance liquid chromatography. Journal of Separation Science, v. 35, n. 1, p.
137-144, 2012.
LI, P.; QIU, Y.; CAI, H.; KONG, Y.; TANG, Y.; WANG, D.; XIE, M. Simultaneous
determination of chloramphenicol, thiamphenicol, and florfenicol residues in animal
tissues by gas chromatography/mass spectrometry. Chinese Journal of
Chromatography, v. 24, p. 14-18, 2006.
LIMA, F.J.C.; MARQUES, P.R.B.O.; NUNES, G.S.; TANAKA, S.M.C.N. Inseticida
organofosforado metamidofós: aspectos toxicológicos e analíticos. Revista
Ecotoxicologia e Meio Ambiente, Curitiba, v. 11, p. 17-34, 2001.
LIU, W.-L.; LEE, R.-J.; LEE, M.-R. Supercritical fluid extraction in situ derivatization for
simultaneous determination of chloramphenicol, florfenicol and thiamphenicol in
shrimp. Food Chemistry, v. 121, p. 797-802, 2010.
LIU, H.-Y.; LIN, S.-L.; FUH, M.-R. Determination of chloramphenicol, thiamphenicol and
florfenicol in milk and honey using modified QuEChERS extraction coupled with
polymeric monolith-based capillary liquid chromatography tandem mass
spectrometry. Talanta, v. 150, p. 233-239, 2016.

155
REFERÊNCIAS BIBLIOGRÁFICAS
LOPES, R.P.; AUGUSTI, D.V.; OLIVEIRA, A.G.M.; OLIVEIRA, F.A.S.; VARGAS, E.A.;
AUGUSTI, R. Development and validation of a methodology to qualitatively
screening veterinary drugs in porcine muscle via an innovative extraction/clean-up
procedure and LC-MS/MS analysis. Food Additives & Contaminants, Part A, v.
28, n. 12, p. 1667-1676, 2011.
LOPES, R.P.; REYES, R.C.; ROMERO-GONZÁLEZ, R.; VIDAL, J.L.M.; FRENICH, A.G.
Multiresidue determination of veterinary drugs in aquaculture fish samples by ultra
high performance liquid chromatography coupled to tandem mass spectrometry.
Journal of Chromatography B, v. 895-896, p. 39-47, 2012.
LU, Y.; YAO, H.; LI, C.; HAN, J.; TAN, Z.; YAN, Y. Separation, concentration and
determination of trace chloramphenicol in shrimp from different waters by using
polyoxyethylene lauryl ether-salt aqueous two-phase system coupled with high-
performance liquid chromatography. Food Chemistry, v. 192, p. 163-170, 2016.
LU, Y.; ZHENG, T.; HE, X.; LIN, X.; CHEN, L.; DAI, Z. Rapid determination of
chloramphenicol in soft-shelled turtle tissues using on-line MSPD-HPLC-MS/MS.
Food Chemistry, v. 134, p. 533-539, 2012.
LU, Y.; SHEN, Q.; DAI, Z.; ZHANG, H. Multi-walled carbon nanotubes as solid-phase
extraction adsorbent for the ultra-fast determination of chloramphenicol in egg,
honey, and milk by fused-core C18-based high-performance liquid chromatography-
tandem mass spectrometry. Analytical and Bioanalytical Chemistry, v. 398, p.
1819-1826, 2010.
LUO, P.; CHEN, X.; LIANG, C.; KUANG, H.; LU, L.; JIANG, Z.; WANG, Z.; LI, C.;
ZHANG, S.; SHEN, J. Simultaneous determination of thiamphenicol, florfenicol and
florfenicol amine in swine muscle by liquid chromatography-tandem mass
spectrometry with immunoaffinity chromatography clean-up. Journal of
Chromatography B, v. 878, p. 207-212, 2010.
MAMANI, M.C.V.; REYES REYES, F.G.; RATH, S. Multiresidue determination of
tetracyclines, sulphonamides and chloramphenicol in bovine milk using HPLC-DAD.
Food Chemistry, v. 117, p. 545-552, 2009.
MAPA (2015). Ministério da Agricultura, Pecuária e Abastecimento. Disponível em
http://www.agricultura.gov.br/animal/qualidade-dos-alimentos/residuos-e-
contaminantes. Acessado em 21/06/2015.
MARKMAN, B.E.O.; KOSCHTSCHAK, M.R.W.; YANO, H.M. Determinação de
quinolonas por cromatografia líquida de alta eficiência empregando coluna

156
REFERÊNCIAS BIBLIOGRÁFICAS
monolítica de fase reversa. Revista do Instuto Adolfo Lutz, v. 64 n. 1, p.65-69,
2005.
MARTIN, B.S.; MORAGA, R. Evaluación de la técnica microbiológica con Bacillus
subtilis BGA para la identificación de residuos de antimicrobianos en leche bovina.
Avances en Ciencias Veterinarias, v. 10, p. 43-48, 1996.
MARTINS, M.T.; BARRETO, F.; HOFF, R.B.; JANK, L.; ARSAND, J.B.; MOTTA,
T.M.C.; SCHAPOVAL, E.E.S. Multiclass and multi-residue determination of
antibiotics in bovine milk by liquid chromatography tandem mass spectrometry:
Combining efficiency of milk control and simplicity of routine analysis. International
Dairy Journal, v. 59, p. 44-51, 2016.
MARTINS JÚNIOR, H.A.; BUSTILLOS, O.V.; PIRES, M.A.F. Determinação de resíduos
de cloranfenicol em amostras de leite e mel industrializados utilizando a técnica de
espectrometria de massas em “tandem” (CLAE-EM/EM). Química Nova, v. 29, n.
3, p. 586-592, 2006.
MAURICIO, A.Q.; LINS, E.S.; ALVARENGA, M.B. A National Residue Control Plan from
the analytical perspective--the Brazilian case. Analytica Chimica Acta, v. 637, p.
333-336, 2009.
MCEVOY, J.D.G.; MAYNE, C.S.; HIGGINS, H.C.; KENNEDY, D.G. Transfer of
chlortetracycline from contaminated feeding stuff to cow’s milk. The Veterinary
Record, v. 22, p. 102-106, 2000.
MEDLEY. Programa de Desenvolvimento Profissional ao Farmacêutico. Módulo V –
Antibióticos. Disponível em: http://www.aofarmaceutico.com.br. Acesso em 28 de
junho de 2012.
MEJÍA, M.J.M. Desenvolvimento e validação de métodos para a determinação de
aminoglicosídeos em medicamentos veterinários. Campinas: Instituto de
Química, UNICAMP. 2013. 145 p. (Dissertação de Mestrado em Química).
MENA, M.L.; AGUI, L.; MARTINEZ-RUIZ, P.; YANEZ-SEDENO, P.; REVIEJO, A.J.;
PINGARRON, J.M. Molecularly imprinted polymers for on-line clean up and
preconcentration of chloramphenicol prior to its voltammetric determination.
Analytical and Bioanalytical Chemistry, v. 376, p. 18-25, 2003.
MENDOZA, J.H.; MAGGI, L.; BONETTO, L.; CARMENA, B.R.; LEZANA, A.; MOCHOLÍ,
F.A.; CARMONA, M. Validation of antibiotics in catfish by on-line solid phase
extraction coupled to liquid chromatography tandem mass spectrometry. Food
Chemistry, v. 134, p. 1149-1155, 2012.

157
REFERÊNCIAS BIBLIOGRÁFICAS
MILHAUD, G.; PERSON, J.M. Évaluation de la toxicité des residus d’antibiotiques dans
le lait. Recueil de Medecine Veterinaire, v. 157, n. 2, p. 179-185, 1981.
MINETTO, L. Antibióticos macrolídeos: determinação e identificação de
metabólitos e subprodutos de degradação em efluente hospitalar. Santa
Maria: Centro de Ciências Naturais e Exatas, UFSM. 2013. 146 p. (Tese de
Doutorado em Química).
MITCHELL, J.M.; GRIFFITHS, M.W.; MCEWEN, S.A.; MCNAB, W.B.; YEE, A.
Antimicrobial drug residues in milk and meat: causes, concerns, prevalence,
regulations, tests, and test performance. Journal of Food Protection, v. 61, n. 6,
p. 742-745, 1998.
MONTEIRO, S.H. Ocorrência de antibióticos e estudo deresistência microbiana
em sistemas aquaculturais do Rio Paraná, reservatório de Ilha Solteira, na
região de Santa Fé do Sul, estado de São Paulo. Piracicaba: Centro de Energia
Nuclear na Agricultura, USP. 2014. 113 p. (Tese de Doutorado em Ciências –
Quínica na Agricultura e no Ambiente).
MONTEIRO, S.H.; FRANCISCO, J.G.; CAMPION, T.F.; PIMPINATO, R.F.; MOURA
ANDRADE, G.C.R.; GARCIA, F.; TORNISIELO, V.L. Multiresidue antimicrobial
determination in Nile tilapia (Oreochromis Niloticus) cage farming by liquid
chromatography tandem mass spectrometry. Aquaculture, v. 447, p. 37-43, 2015.
MONTEIRO, S.H.; FRANCISCO, J.G.; ANDRADE, G.C.R.M.; BOTELHO, R.G.;
FIGUEIREDO, L.A.; TORNISIELO, V.L. Study of spatial and temporal distribution of
antimicrobial in water and sediments from caging fish farms by on-line SPE-LC-
MS/MS. Journal of Environmental Science and Health, Part B, v. 1, 1-10, 2016.
MORAGUES, F.; IGUALADA, C.; LEON, N. Validation of the determination of
chloramphenicol residues in animal feed by liquid chromatography with an ion trap
detector based on European Decision 2002/657/EC. Food Analytical Methods, v.
5, p. 416-421, 2012.
MOREIRA, R.P.L. Desenvolvimento e validação de métodos multirresíduos para
determinação de medicamentos veterinários em alimentos e em ração
utilizando CL-EM/EM. Belo Horizonte: Departamento de Química, UFMG. 2012.
188 p. (Tese de Doutorado em Ciências – Química).
MORETTI, S.; DUSI, G.; GIUSEPPONI, D.; PELLICCIOTTI, S.; ROSSI, R.; SALUTI, G.;
CRUCIANI, G.; GALARINI, R. Screening and confirmatory method for multiclass
determination of 62 antibiotics in meat. Journal of Chromatography A, v. 1429, p.
175-188, 2016.

158
REFERÊNCIAS BIBLIOGRÁFICAS
MOTTIER, P.; PARISOD, V.; GREMAUD, E.; GUY, P.A.; STADLER, R.H.
Determination of the antibiotic chloramphenicol in meat and seafood products by
liquid chromatography - electrospray ionization tandem mass spectrometry. Journal
of Chromatography A, v. 994, p. 75-84, 2003.
MPA (2010). Ministério da Pesca e da Aquicultura. Boletim estatístico da pesca e
aquicultura. Disponível em
http://www.uesc.br/cursos/pos_graduacao/mestrado/animal/bibliografia2013/luis_art
4_rousseff.pdf. Acessado em 20/06/2015.
MPA (2011). Ministério da Pesca e da Aquicultura. Boletim estatístico da pesca e
aquicultura. Disponível em
http://www.mpa.gov.br/files/docs/Boletim_MPA_2011_pub.pdf. Acessado em
20/06/2015.
MPA (2015). Ministério da Pesca e da Aquicultura. Disponível em
http://www.mpa.gov.br/aquicultura. Acessado em 21/06/2015.
MV&Z. Revista de Educacao Continuada em Medicina Veterinaria e Zootecnia do
CRMV-SP / Publicacao do Conselho Regional de Medicina Veterinaria. – v. 10, n. 2
e 3 (2012) – Sao Paulo: Conselho Regional de Medicina Veterinaria, 1998.
NICOLICH, R.S.; WERNECK-BARROSO, E.; MARQUES, M.A.S. Food safety
evaluation: Detection and confirmation of chloramphenicol in milk by high
performance liquid chromatography-tandem mass spectrometry. Analytica
Chimica Acta, v. 565, p. 97-102, 2006.
OLIVEIRA, R.C.; BANDO, E.; JUNIOR, M.M. Ocorrência de cloranfenicol em leite
pasteurizado comercializado no Estado do Paraná, Brasil. Acta Scientiarum
Health Science, Maringá, v. 29, n. 1, p. 59-62, 2007.
OLIVEIRA, F.A.S. Validação de um método multirresíduos e multiclasses para
determinação e quantificação de 140 resíduos de agrotóxicos em leite através
da técnica LC-MS/MS. Belo Horizonte: Escola de Veterinária, UFMG. 2011. 142 p.
(Dissertação de Mestrado em Ciência Animal).
OLIVEIRA, J.M. O peixe e a saúde: das recomendações para o consumo às
possibilidades ambientais de atendê-lo. Segurança Alimentar e Nutricional,
Campinas, v. 20, p. 141-146, 2013.
ORLANDO, E.A. Resíduos de antibióticos tetraciclínicos em músculo de peixe:
comparação de diversos métodos de extração e avaliação por HPLC.
Campinas: Instituto de Química, UNICAMP. 2013. 87 p. (Dissertação de Mestrado
em Química Analítica).

159
REFERÊNCIAS BIBLIOGRÁFICAS
ORTELLI, D.; EDDER, P.; CORVI, C. Analysis of Chloramphenicol Residues in Honey
by Liquid Chromatography–Tandem Mass Spectrometry. Chromatographia, v. 59,
n. 1, p. 61-64, 2004.
OZCAN, N.; AYCAN, O. Determination of chloramphenicol in honey, milk, and egg by
liquid chromatography/mass spectrometry: Single-laboratory validation. Journal of
AOAC International, v. 96, p. 1158-1163, 2013.
PAN, X.-D.; WU, P.-G.; JIANG, W.; MA, B.-J. Determination of chloramphenicol,
thiamphenicol, and florfenicol in fish muscle by matrix solid-phase dispersion
extraction (MSPD) and ultra-high pressure liquid chromatography tandem mass
spectrometry. Food Control, v. 52, p. 34-38, 2015.
PAN, C.; ZHANG, H.; CHEN, S.; XU, Y.; JIANG, S. Determination of chloramphenicol
residues in honey by monolithic column liquid chromatography-mass spectrometry
after use of quechers clean-up. Acta Chromatographica, v. 17, p. 320-327, 2006.
PENG, X.; WANG, Z.; KUANG, W.; TAN, J.; LI, K. A preliminary study on the
occurrence and behavior of sulfonamides, ofloxacin and chloramphenicol
antimicrobials in wastewaters of two sewage treatment plants in Guangzhou, China.
Science of the Total Environment, v. 371, p. 314-322, 2006.
PASCHOAL, J.A.R. Resíduos de antimicrobianos em peixe: depleção residual e
desenvolvimento de métodos analíticos. Campinas: Instituo de Química,
Departamento de Química Analítica, UNICAMP. 2007. 174 p. (Tese de Doutorado
em Ciências).
PEREIRA-MAIA, E.C.; SILVA, P.P.; ALMEIDA, W.B.; SANTOS, H.F.; MARCIAL, B.L.;
RUGGIERO, R.; GUERRA, W. Tetraciclinas e glicilciclinas: uma visão
geral. Química Nova, v. 33, n. 3, p. 700-706, 2010.
PETERS, R.J.B.; BOLCK, Y.J.C.; RUTGERS, P.; STOLKER, A.A.M.; NIELEN, M.W.F.
Multi-residue screening of veterinary drugs in egg, fish and meat using high-
resolution liquid chromatography accurate mass time-of-flight mass spectrometry.
Journal of Chromatography A, v. 1216, p. 8206-8216, 2009.
PIMENTEL-GOMES, F. Curso de estatística experimental. 14 ed., Piracicaba, 477 p.
2000.
POLZER, J.; HACKENBERG, R.; STACHEL, C.; GOWIK, P. Determination of
chloramphenicol residues in crustaceans: Preparation and evaluation of a
proficiency test in Germany. Food Additives & Contaminants, v. 23, p. 1132-
1140, 2006.
PORFÍRIO, T. A. Resíduos em carne. Higiene Alimentar, v. 8, p. 26-29, 1994.

160
REFERÊNCIAS BIBLIOGRÁFICAS
PORTAL DO AGRONEGÓCIO (2015). Disponível em
http://www.portaldoagronegocio.com.br/noticia/piscicultura--uma-oportunidade-no-
campo-126935. Acessado em 21/06/2015.
PUBCHEM (2015). Disponível em
http://pubchem.ncbi.nlm.nih.gov/compound/chloramphenicol# section=Top.
Acessado em 09/12/2015.
QUESADA, S.P. Desenvolvimento e validação de método analítico empregando
LC-MS/MS QToF para a determinação de fluoroquinolonas em peixes.
Campinas: Faculdade de Engenharia de Alimentos, UNICAMP. 2012. 95p.
(Dissertação de Mestrado em Ciência de Alimentos).
QUESADA, S.P.; PASCHOAL, J.A.R.; REYES, F.A.G. A simple method for the
determination of fluoroquinolone residues in tilapia (Oreochromis niloticus) and
pacu (Piaractus mesopotamicus) employing LC-MS/MS QToF. Food Additives &
Contaminants Part A, v. 30, n.5, p. 813-825, 2013a.
QUESADA, S.P.; PASCHOAL, J.A.; REYES, F.G. Considerations on the aquaculture
development and on the use of veterinary drugs: special issue for fluoroquinolones -
a review. Journal of Food Science, v. 78, n. 9, p. 1321-1333, 2013b.
QUON, D.G.; CARSON, M.C.; NOCHETTO, C.; HELLER, D.N.; BUTTERWORTH, F.
Peer validation of a method to confirm chloramphenicol in honey by liquid
chromatography-tandem mass spectrometry. Journal of AOAC International, v.
89, p. 586-593, 2006.
RAMBLA-ALEGRE, M.; PERIS-VICENTE, J.; ESTEVE-ROMERO, J.; CARDA-BROCH,
S. Analysis of selected veterinary antibiotics in fish by micellar liquid
chromatography with fluorescence detection and validation in accordance with
regulation 2002/657/EC. Food Chemistry, v. 123, p. 1294-1302, 2010.
RAMOS, M.; ARANDA, A.; DE POZUELO, M.M.; REUVERS, T. Chloramphenicol
residues in food samples: their analysis and stability during storage. Journal of
Liquid Chromatography & Related Technologies, v. 26, p. 2535-2549, 2003.
RAMIREZ, A.; GUTIERREZ, R.; DIAZ, G.; GONZALEZ, C.; PEREZ, N.; VEGA, S.;
NOA, M. High-performance thin-layer chromatography-bioautography for multiple
antibiotic residues in cow's milk. Journal of Chromatography B, v. 784, 315-322,
2003.
REGITANO, J.B.; LEAL, R.M.P. Comportamento e impacto ambiental de antibióticos
usados na produção animal brasileira. Revista Brasileira de Ciência do Solo, v.
34, p. 601-616, 2010.

161
REFERÊNCIAS BIBLIOGRÁFICAS
REINHOLDS, I.; PUGAJEVA, I.; PERKONS, I.; BARTKEVICS, V. The application of
phospholipid removal columns and ultra-high performance liquid chromatography—
tandem quadrupole mass spectrometry for quantification of multi-class antibiotics in
aquaculture samples. Journal of Pharmaceutical and Biomedical Analysis, v.
128, p. 126-131, 2016.
REJTHAROVA, M.; REJTHAR, L. Determination of chloramphenicol in urine, feed
water, milk and honey samples using molecular imprinted polymer clean-up.
Journal of Chromatography A, v. 1216, p. 8246-8253, 2009.
REZK, M.R.; RIAD, S.M.; KHATTAB, F.I.; MARZOUK, H.M. Multi-residues
determination of antimicrobials in fish tissues by HPLC-ESI-MS/MS method.
Journal of Chromatography B, v. 978-979, p. 103-110, 2015.
ROCHA SIQUEIRA, S.R.; DONATO, J.L.; DE NUCCI, G.; REYES REYES, F.G. A high-
throughput method for determining chloramphenicol residues in poultry, egg,
shrimp, fish, swine and bovine using LC-ESI-MS/MS. Journal of Separation
Science, v. 32, p. 4012-4019, 2009.
RODZIEWICZ, L.; ZAWADZKA, I. Rapid determination of chloramphenicol residues in
honey by liquid chromatography tandem mass spectrometry and the validation of
method based on 2002/657/EC. APIACTA, v. 42, p. 25-30, 2007.
ROMERO, J.; FEIJOO, C.G.; NAVARRETE, P. Antibiotics in Aquaculture – Use,
Abuse, and Alternatives, Health and Environment in Aquaculture. p. 159-198,
2012. Disponível em http://www.intechopen.com/books/health-and-environment-in-
aquaculture/antibioticsin-aquaculture-use-abuse-and-alternatives. Acessado em
23/08/2016.
RONNING, H.T.; EINARSEN, K.; ASP, T.N. Determination of chloramphenicol residues
in meat, seafood, egg, honey, milk, plasma and urine with liquid chromatography-
tandem mass spectrometry, and the validation of the method based on
2002/657/EC. Journal of Chromatography A, v. 1118, p. 226-233, 2006.
SADEGHI, S.; JAHANI, M. Selective solid-phase extraction using molecular imprinted
polymer sorbent for the analysis of florfenicol in food samples. Food Chemistry, v.
141, p. 1242-1251, 2013.
SAMANIDOU, V.F. & EVAGGELOPOULOU, E.N. Analytical Strategies to Determine
Antibiotic Residues in Fish. Journal of Separation Science, v. 30, p. 2549-2569,
2007.
SAMANIDOU, V.; EVAGGELOPOULOU, E.; TROTZMÜLLERB, M.; GUOB, X.;
LANKMAYRB, E. Multi-residue determination of seven quinolones antibiotics in

162
REFERÊNCIAS BIBLIOGRÁFICAS
gilthead seabream using liquid chromatography tandem mass spectrometry.
Journal of Chromatography A, v. 1203, p. 115-123, 2008.
SAMANIDOU, V.; GALANOPOULOS, L.-D.; KABIR, A.; FURTON, K.G. Fast extraction
of amphenicol residues from raw milk using novel fabric phase sorptive extraction
followed by high-performance liquid chromatography-diode array detection.
Analytica Chimica Acta, v. 855, p. 41-50, 2015.
SAMSONOVA, J.V.; CANNAVAN, A.; ELLIOTT, C.T. A critical review of screening
methods for the detection of chloramphenicol, thiamphenicol, and florfenicol
residues in foodstuffs. Critical Reviews in Analytical Chemistry, v. 42, p. 50-78,
2012.
SANCHEZ-BRUNETE, C.; ALBERO, B.; MIGUEL, E.; TADEO, J.L. Rapid method for
determination of chloramphenicol residues in honey using gas chromatography-
mass spectrometry. Bulletin of Environmental Contamination and Toxicology,
v. 75, p. 459-465, 2005.
SANTOS, L.; BARBOSA, J.; CASTILHO, M.C.; RAMOS, F.; RIBEIRO, C.A.F.; DA
SILVEIRA, M.I.N. Determination of chloramphenicol residues in rainbow trouts by
gas chromatography-mass spectometry and liquid chromatography-tandem mass
spectometry. Analytica Chimica Acta, v. 529, p. 249-256, 2005.
SANTOS, P.N.; MACIEL, M.I.S.; LAVORANTE, B.R.B.O.; MEDEIROS, M.M.; JÚNIOR,
E.C.A. Otimização e validação de método multirresíduo para determinação de
sulfonamidas em camarão cultivado por cromatografia líquida de alta eficiência com
detecção por UV. Química Nova, v. 34, n. 7, p. 1265-1270, 2011.
SANTOS, H.S. Interação entre aminoglicosídeos e nanopartículas de ouro e o
desenvolvimento de sonda para a determinação espectrofotométrica ultra
traço de tobramicina. Rio de Janeiro: Departamento de Química, Universidade
Católica do Rio de Janeiro. 2014. 219 p. (Dissertação de Mestrado em Química).
SANTOS, L.; RAMOS, F. Analytical strategies for the detection and quantification of
antibiotic residues in aquaculture fishes: A review. Trends in Food Science &
Technology, v. 52, p. 16-30, 2016.
SARTORI, A.G.O & AMANCIO, R.D. Pescado: importância nutricional e consumo no
Brasil. Segurança Alimentar e Nutricional, v. 19, p. 83-93, 2012.
SEAP (2015). Secretaria Especial de Aquicultura e Pesca. Disponível em
http://www.presidencia.gov.br/seap. Acessado em 20/06/15.
SHEN, J.; XIA, X.; JIANG, H.; LI, C.; LI, J.; LI, X.; DING, S. Determination of
chloramphenicol, thiamphenicol, florfenicol, and florfenicol amine in poultry and

163
REFERÊNCIAS BIBLIOGRÁFICAS
porcine muscle and liver by gas chromatography-negative chemical ionization mass
spectrometry. Journal of Chromatography B, v. 877, p. 1523-1529, 2009.
SHEN, H.Y.; JIANG, H.L. Screening, determination and confirmation of chloramphenicol
in seafood, meat and honey using ELISA, HPLC-UVD, GC-ECD, GC-MS-EI-SIM
and GCMS-NCI-SIM methods. Analytica Chimica Acta, v. 535, p. 33-41, 2005.
SHERIDAN, R.; POLICASTRO, B.; THOMAS, S.; RICE, D. Analysis and occurrence of
14 sulfonamide antibacterials and chloramphenicol in honey by solid-phase
extraction followed by LC/MS/MS analysis. Journal of Agricultural and Food
Chemistry, v. 56, p. 3509-3516, 2008.
SHI, X.; WU, A.; ZHENG, S.; LI, R.; ZHANG, D. Molecularly imprinted polymer
microspheres for solid-phase extraction of chloramphenicol residues in foods.
Journal of Chromatography B, v. 850, p. 24-30, 2007.
SHI, X.; SONG, S.; SUN, A.; LI, D.; WU, A.; ZHANG, D. Determination of
chloramphenicol residues in foods by ELISA and LC-MS/MS coupled with
molecularly imprinted solid phase extraction. Analytical Letters, v. 43, p. 2798-
2807, 2010.
SILVA, J.R.; SILVA, L.T.; DRUZIAN, J.I. Optimization and intralaboratorial validation of
method for analysis of chloramphenicol residues in goat milk by GC/ECD. Química
Nova, v. 33, p. 90-96, 2010.
SINDAM (2016). Sindicato Nacional da Indústria de Produtos para a Saúde Animal.
Compêndio de Produtos Veterinários. Disponível em
http://www.cpvs.com.br/cpvs/pesquisar.aspx. Acessado em 24/08/2016.
SISMOTTO, M., RIZZATO PASCHOAL, J.A.R., REYES, F.G.R. Aspectos analíticos e
regulatórios na determinação de resíduos de macrolídeos em alimentos de origem
animal por cromatografia líquida associada à espectrometria de massas. Química
Nova, v. 36, n. 3, p. 449-461, 2013.
SISMOTTO, M.; PASCHOAL, J.A.R.; TELES, J.A.; DE REZENDE, R.A.E.; REYES,
F.G.R. A simple liquid chromatography coupled to quadrupole time of flight mass
spectrometry method for macrolide determination in tilapia fillets. Journal of Food
Composition and Analysis, v. 34, p. 153-162, 2014.
SMITH, S.; GIESEKER, C.; REIMSCHUESSEL, R.; DECKER, C.; CARSON, M.C.
Simultaneous screening and confirmation of multiple classes of drug residues in fish
by liquid chromatography-ion trap mass spectrometry. Journal of
Chromatography A, v. 1216, p. 8224-8232, 2009.

164
REFERÊNCIAS BIBLIOGRÁFICAS
SNIEGOCKI, T.; POSYNIAK, A.; ZMUDZKI, J. Determination of chloramphenicol
residues in milk by gas and liquid chromatography mass spectrometry methods.
Bulletin of the Veterinary Institute in Pulawy, v. 51, p. 59-64, 2007.
SNIEGOCKI, T.; GBYLIK-SIKORSKA, M.; POSYNIAK, A. Transfer of chloramphenicol
from milk to commercial dairy products - Experimental proof. Food Control, v. 57,
p. 411-418, 2015.
SPINOSA, H.S.; GORNIAK, S.L.; BERNARDI, M.M. Farmacologia aplicada à
medicina veterinária. 2. ed. Rio de Janeiro: Guanabara, 1999. p. 391-395.
SPLENDORE, M.; KELLOGG, C.; THAKUR, R. The Danger of Chloramphenicol in
Milk. Food Safety Magazine, June 7, 2013. Disponível em
http://www.foodsafetymagazine.com/signature-series/the-danger-of-
chloramphenicol-in-milk/. Acessado em 22/10/2016.
STEPPANI, J.A. The hazard of using chloramphenicol in food animal. Journal of the
American Veterinary Medical Association, v. 184, p. 930, 1984.
STOREY, J.M.; CLARK, S.B.; JOHNSON, A.S.; ANDERSEN, W.C.; TURNIPSEED,
S.B.; LOHNE, J.J.; BURGER, R.J.; AYRES, P.R.; CARR, J.R.; MADSON, M.R.
Analysis of sulfonamides, trimethoprim, fluoroquinolones,quinolones,
triphenylmethane dyes and methyltestosterone in fishand shrimp using liquid
chromatography–mass spectrometry. Journal of Chromatography B, v. 972, p.
38-47, 2014.
SU, P.; LIU, N.; ZHU, M.; NING, B.; LIU, M.; YANG, Z.; PAN, X.; GAO, Z. Simultaneous
detection of five antibiotics in milk by high-throughput suspension array technology.
Talanta, v. 85, p. 1160-1165, 2011.
TAJIK, H.; MALEKINEJAD, H.; RAZAVI-ROUHANI, S.M.; PAJOUHI, M.R.;
MAHMOUDI, R.; HAGHNAZARI, A. Chloramphenicol residues in chicken liver,
kidney and muscle: A comparison among the antibacterial residues monitoring
methods of four plate test, ELISA and HPLC. Food and Chemical Toxicology, v.
48, p. 2464-2468, 2010.
TAKA, T.; BARAS, M.C.; CHAUDHRY BET, Z.F. Validation of a rapid and sensitive
routine method for determination of chloramphenicol in honey by LC-MS/MS. Food
Additives & Contaminants, Part A, v. 29, 596-601, 2012.
TAKINO, M.; DAISHIMA, S.; NAKAHARA, T. Determination of chloramphenicol
residues in fish meats by liquid chromatography-atmospheric pressure
photoionization mass spectrometry. Journal of Chromatography A, v. 1011, p. 67-
75, 2003.

165
REFERÊNCIAS BIBLIOGRÁFICAS
TAN, Z.; XU, H.; LI, G.; YANG, X.; CHOI, M.M.F. Fluorescence quenching for
chloramphenicol detection in milk based on protein-stabilized Au nanoclusters.
Spectrochimica Acta Part A: Molecular Spectroscopy, v. 149, p. 615-620, 2015.
TAO, Y.; ZHU, F.; CHEN, D.; WEI, H.; PAN, Y.; WANG, X.; LIU, Z.; HUANG, L.; WANG,
Y.; YUAN, Z. Evaluation of matrix solid-phase dispersion (MSPD) extraction for
multi-fenicols determination in shrimp and fish by liquid chromatography-
electrospray ionisation tandem mass spectrometry. Food Chemistry, v. 150, p.
500-506, 2014.
TAVARES-DIAS, M.; MORAES, F.R.; MARTINS, M.L.; KRONKA, S.N. Fauna
parasitária de peixes oriundos de "pesque-pagues" do município de Franca, São
Paulo, Brasil. II. Metazoários. Revista Brasileira de Zoologia, v.18, p. 81-95,
2001.
TETTE, P.A.S.; GUIDI, L.R.; EVANGELISTA, W.P.; GLORIA, M.B.A. III Conferência
Nacional sobre Defesa Agropecuária, 2012, Salvador. Anais da III Conferência
Nacional sobre Defesa Agropecuária, p. 97, 2012.
TIAN, H. Determination of chloramphenicol, enrofloxacin and 29 pesticides residues in
bovine milk by liquid chromatography-tandem mass spectrometry. Chemosphere,
v. 83, p. 349-355, 2011.
USDA (2015). United States Department of Agriculture. Foreign agriculture service.
maximum residue limits (MRL) Database. Disponível em
www.fas.usda.gov/maximum-residue-limits-mrl-database. Acessado em
15/12/2015.
VEACH, B.T.; BAKER, C.A.; KIBBEY, J.H.; FONG, A.; BROADAWAY, B.J.; DRAKE,
C.P. Quantitation of chloramphenicol and nitrofuran metabolites in aquaculture
products using microwave-assisted derivatization, automated SPE, and LC-MS/
MS. Journal of AOAC International, v. 98, n. 3, p. 588-594, 2015.
VERZEGNASSI, L.; ROYER, D.; MOTTIER, P.; STADLER, R.H. Analysis of
chloramphenicol in honeys of different geographical origin by liquid chromatography
coupled to electrospray ionization tandem mass spectrometry. Food Additives &
Contaminants, v. 20, p. 335-342, 2003.
VILLAR-PULIDO, M.; GILBERT-LÓPEZ, B.; GARCÍA-REYES, J.F.; MARTOS, N.R.;
MOLINA-DÍAZ, A. Multiclass detection and quantitation of antibiotics and veterinary
drugs in shrimps by fast liquid chromatography time-of-flight mass spectrometry.
Talanta, v. 85, p. 1419-1427, 2011.

166
REFERÊNCIAS BIBLIOGRÁFICAS
VINAS, P.; BALSALOBRE, N.; HERNANDEZ-CORDOBA, M. Determination of
chloramphenicol residues in animal feeds by liquid chromatography with photo-
diode array detection. Analytica Chimica Acta, v. 558, p. 11-15, 2006.
VORA, V.R.; RAIKWAR, M.K. Determination of chloramphenicol and thiamphenicol
residues in fish, shrimp and milk by ESI-LCMSMS. International Journal of
Agriculture and Food Science Technology, v. 4, p. 823-828, 2013.
VSBD (2016). Veterinary Substances DataBase - Chloramphenicol, thiamphenicol &
florfenicol. Disponível em http://sitem.herts.ac.uk/aeru/vsdb/Reports/1835.htm.
Acessado em 22/01/2016.
WAGNER, P.M. et al. Avaliação do desempenho produtivo de linhagens de tilápias do
Nilo (Oreochromis niloticus) em diferentes fases de criação. Revista Acta
Scientiarium: animal sciences, v. 26, n. 2, p. 187-196, 2004.
WANG, H.; ZHOU, X.-J.; LIU, Y.-Q.; YANG, H.-M.; GUO, Q.-L. Simultaneous
determination of chloramphenicol and aflatoxin M-1 residues in milk by triple
quadrupole liquid chromatography-tandem mass spectrometry. Journal of
Agricultural and Food Chemistry, v. 59, p. 3532-3538, 2011.
WANG, Y.; LI, X.; ZHANG, Z.; DING, S.; JIANG, H.; LI, J.; SHEN, J.; XIA, X.
Simultaneous determination of nitroimidazoles, benzimidazoles, and
chloramphenicol components in bovine milk by ultra-high performance liquid
chromatography–tandem mass spectrometry. Food Chemistry, v. 192, p. 280-287,
2016.
WATKINSON, A.J.; MURBY, E.J.; KOLPIN, D.W.; COSTANZO, S.D. The occurrence of
antibiotics in an urban watershed: from wastewater to drinking water. Science of
the Total Environment, v. 407, p. 2711-2723, 2009.
WHITE, C.R.; MOATS, W.A.; KOTULA, K.L. Optimization of a liquid chromatographic
method for determination of oxytetracycline, tetracycline, and chlortetracycline in
milk. Journal of the Association of Official and Analytical Chemists
International, v. 76, n. 3, p. 549-555, 1993.
WHO (1998). World Health Organization. Use of quinolones in food animals and
potential impact on human health. Report of a WHO Meeting – Emerging and
other communicable diseases, surveillance and control. Geneva, June/1998.
WILKOWSKA, A.; BIZIUK, M. Determination of pesticide residues in food matrices
using the QuEChERS methodology. Food Chemistry, v. 125, p. 803-812, 2011.
WONGTAVATCHAI, J.; MCLEAN, J.G.; RAMOS, F.; ARNOLD, D. WHO Food Additives
Series: Chloramphenicol. JECFA 53 (2004).

167
REFERÊNCIAS BIBLIOGRÁFICAS
WU, J.; CHEN, L.; MAO, P.; LU, Y.; WANG, H. Determination of chloramphenicol in
aquatic products by graphene-based SPE coupled with HPLC-MS/MS. Journal of
Separation Science, v. 35, p. 3586-3592, 2012.
XIAO, Z.M.; SONG, R.; RAO, Z.H.; WEI, S.L.; JIA, Z.; SUO, D.C.; FAN, X. Development
of a subcritical water extraction approach for trace analysis of chloramphenicol,
thiamphenicol, florfenicol, and florfenicol amine in poultry tissues. Journal of
Chromatography A, v. 1418, p. 29-35, 2015.
XIE, K.; JIA, L.; YAO, Y.; XU, D.; CHEN, S.; XIE, X.; PEI, Y.; BAO, W.; DAI, G.; WANG,
J.; LIU, Z. Simultaneous determination of thiamphenicol, florfenicol and florfenicol
amine in eggs by reversed-phase high-performance liquid chromatography with
fluorescence detection. Journal of Chromatography B, v. 879, p. 2351-2354,
2011.
XIONG, W.; SUN, Y.; ZHANG, T.; DING, X.; LI, Y.; WANG, M.; ZENG, Z. Antibiotics,
Antibiotic resistance genes, and bacterial community composition in fresh water
aquaculture environment in China. Microbial Ecology, v. 70, n. 2, p. 425-432,
2015.
XUE, Q.; QI, Y.; LIU, F. Ultra-high performance liquid chromatography-electrospray
tandem mass spectrometry for the analysis of antibiotic residues in environmental
waters. Environmental Science and Pollution Research, v. 22, p. 16857-16867,
2015.
YANG, X.; ZHANG, H.; LIU, H.; WANG, J.; ZHANG, Y.Z.; DONG, A.J.; ZHAO, H.T.;
SUN, C.H.; CUI, J. Multiresidue method for determination of 88 pesticides in berry
fruits using solid-phase extraction and gas chromatographic mass spectrometry:
Determination of 88 pesticides in berries using SPE and GC-MS. Food Chemistry,
v. 127, p. 855-865, 2011.
YAO, H.; LU, Y.; HAN, J.; WANG, Y.; YAN, Y. Separation, concentration and
determination of trace thiamphenicol in egg, milk and honey using polyoxyethylene
lauryl ether-salt aqueous two-phase system coupled with high performance liquid
chromatography. Journal of the Brazilian Chemical Society, v. 26, n. 6, p. 1098-
1110, 2015.
ZELENY, R.; ULBERTH, F.; GOWIK, P.; POLZER, J.; van GINKEL, L.A.; EMONS, H.
Developing new reference materials for effective veterinary drug-residue testing in
food-producing animals. Trends in Analytical Chemistry, v. 25, n. 9, p. 927-936,
2006.

168
REFERÊNCIAS BIBLIOGRÁFICAS
ZHAN, J.; ZHONG, Y.-Y.; YU, X.-J.; PENG, J.-F.; CHEN, S.; YIN, J.-Y.; ZHANG, J.-J.;
ZHU, Y. Multi-class method for determination of veterinary drug residues and other
contaminants in infant formula by ultra performance liquid chromatography-tandem
mass spectrometry. Food Chemistry, v. 138, p. 827-834, 2013.
ZHANG, S.; LIU, Z.; GUO, X.; CHENG, L.; WANG, Z.; SHEN, J. Simultaneous
determination and confirmation of chloramphenicol, thiamphenicol, florfenicol and
florfenicol amine in chicken muscle by liquid chromatography-tandem mass
spectrometry. Journal of Chromatography B, v. 875, p. 399-404, 2008.
ZHANG, S.X.; ZHOU, J.H.; SHEN, J.Z.; DNC, S.Y.; LI, J.C. Determination of
chloramphenicol residue in chicken tissues by immunoaffinity chromatography
cleanup and gas chromatography with a microcell electron capture detector.
Journal of AOAC International, v. 89, p. 369-373, 2006.

169
PRODUÇÃO CIENTÍFICA
PRODUÇÃO CIENTÍFICA
PUBLICAÇÕES RESULTANTES DO TRABALHO DE DOUTORADO Artigos completos publicados em periódicos 1. GUIDI, L.R.; TETTE, P.A.S.; FERNANDES, C.; SILVA, L.H.M.; GLÓRIA, M.B.A. Advances on the chromatographic determination of amphenicols in food. Talanta, v. 162 p. 324–338. 2017. (ANEXO A) 2. GUIDI, L.R.; SANTOS, F.A.; RIBEIRO, A.C.S.R.; FERNANDES, C.; SILVA, L.H.M.; GLORIA, M.B.A. A simple, fast and sensitive screening LC-ESI-MS/MS method for antibiotics in fish. Talanta, v. 163, pg. 85-93, 2017. (ANEXO B) 3. GUIDI, L.R.; Silva, L.H.M.; FERNANDES, C.; Engeseth, N.; Gloria, M.B.A. LC MS/MS determination of chloramphenicol in food of animal origin in Brazil. Scientia Chromatographica, v. 7, p. 1-9, 2015 (ANEXO C). PUBLICAÇÕES NÃO RELACIONADAS AO TRABALHO DE DOUTORADO Artigos completos publicados em periódicos 1. TETTE, P.A.S.; GUIDI, L.R.; GLÓRIA, M.B.A.; FERNANDES, C. Pesticides in honey: A review on chromatographic analytical methods. Talanta, v. 149, p. 124-141, 2016 (ANEXO D). Artigo com um dos maiores números de visualizações nos meses de fevereiro à maio de 2016 (ANEXO E). 4. EVANGELISTA, W.P.; SILVA, T.M.; GUIDI, L.R.; TETTE, P.A.S.; BYRRO, R.M.D.; SANTIAGO-SILVA, P.; FERNANDES, C.; GLORIA, M.B.A. Quality assurance of histamine analysis in fresh and canned fish. Food Chemistry, v. 211, p. 100-106, 2016. 6. GUIDI, L.R.; TETTE, P.A.S.; EVANGELISTA, W.P.; FERNANDES, C.; GLORIA, M.B.A. Matrix effect on the analysis of amphenicols in fish by liquid chromatography-tandem mass spectrometry (LC-MS/MS). Journal of Physics. Conference Series (Online), v. 575, p. 1-5, 2015. Resumos expandidos publicados em anais de congressos 1. GUIDI, L.R.; TETTE, P.A.S.; FERNANDES, C.; GLORIA, M.B.A. Estudo do efeito matriz na análise de anfenicóis em pescado por cromatografia líquida com detecção por espectrometria de massas sequencial (CLAE-EM/EM). In: 7º Congresso Brasileiro de Metrologia, 2013, Ouro Preto. Anais do 7º Congresso Brasileiro de Metrologia, 2013. 2. TETTE,P.A.S.; GUIDI, L.R.; FERNANDES, C.; GLORIA, M.B.A. Optimization of sample preparation for the simultaneous determination of amphenicols in fish using LC-MS/MS. In: 15th International Symposium on Advances in ExtractionTechnologies -

170
PRODUÇÃO CIENTÍFICA
Extech, 2013, João Pessoa - PB. Anais do 15th International Symposium on Advances in Extraction Technologies - Extech, 2013. Resumos publicados em anais de congressos 1. GUIDI, L.R.; GOUVEA, J.; GLÓRIA, M.B.A.BIOGENIC AMINES IN BRAZILIAN VINEGARS. In: 17th World Congress of Food Science and Technology & Expo, 2014, Montreal, Canadá. Abstracts. Montreal, Canada: IUF6.oST, 2014. 2. GUIDI, L.R.; TETTE,P.A.S.; FERNANDES, C.; GLORIA, M.B.A. Optimization of the
extraction step of amphenicols from fish and determination the LCMS/MS.. In: 5⁰ Congresso Brasileiro de Espectrometria de Massas - BrMass, 2013, Campinas - SP.
Anais do 5⁰ Congresso Brasileiro de Espectrometria de Massas - BrMass, 2013.
3. TETTE, P.A.S.; GUIDI, L.R.; GLÓRIA, M.B.A. METHOD FOR THE DETERMINATION OF CHLORAMPHENICOL IN FOOD. In: EUROFOODCHEM XVII, 2013, Istanbul. Book of Abstracts of the EuroFoodChem XVII. Istanbul: Arber Professional Congress Service, 2013. v. 1. p. 434-434. 4. GUIDI, L.R.; TETTE, P.A.S.; GLORIA, M.B.A. Análise de cloranfenicol em pescado por CL-EM/EM. In: III Conferência Nacional Sobre Defesa Agropecuária, 2 5. GUIDI, L.R.; OLIVEIRA, M.C.P.P; TETTE, P.A.S.; GLORIA, M.B.A. Análise de cloranfenicol em leite cru do estado de Minas Gerais. In: III Conferência Nacional Sobre Defesa Agropecuária, 2012, Salvador. III Conferência Nacional Sobre Defesa Agropecuária, 2012. 6. TETTE, P.A.S.; GUIDI, L.R.; EVANGELISTA, W.P.; GLORIA, M.B.A. Análise de cloranfenicol em mel por CL-EM/EM. In: III Conferência Nacional Sobre Defesa Agropecuária, 2012, Salvador. III Conferência Nacional Sobre Defesa Agropecuária, 2012 7. GUIDI, L.R.; TETTE, P.A.S.; FERNANDES, C.; GLÓRIA, M.B.A. Optimization of method for simultaneous determination of amphenicols using liquid chromatography with mass spectrometry (LC-MS/MS) IN FOOD. In: World Congress of Food Science and Technology, 2012, Foz do Iguaçu. ISSN 2304-7992 World Congress of Food Science and Technology, 2012. 8. TETTE, P.A.S.; Guidi, L.R.; GLÓRIA, M.B.A. Chloramphenicol determination in food from animal origin using the liquid chromatography with tandem mass spectrometry detection (LC-MS/MS). In: World Congress of Food Science and Technology, 2012, Foz do Iguaçu. ISSN 2304-7992 World Congress of Food Science and Technology, 2012.

171
ANEXOS
ANEXOS
ANEXO A

172
ANEXOS
ANEXO B

173
ANEXOS
ANEXO C

174
ANEXOS
ANEXO D
ANEXO E