Embed Size (px)
Citation preview
2013/04/09 MN 1
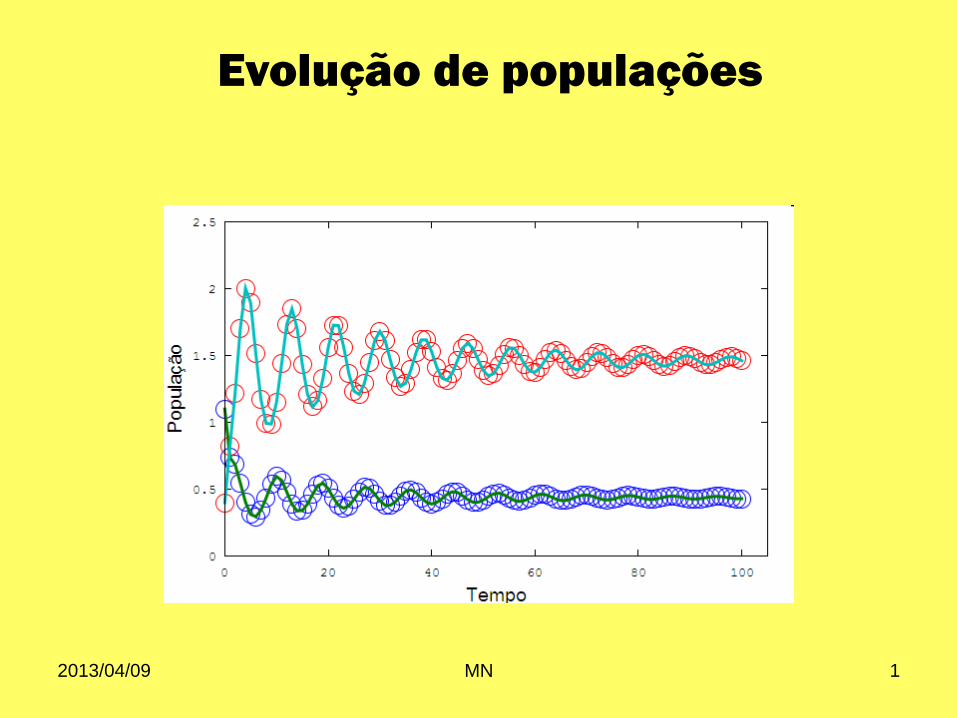
Evolução de populações
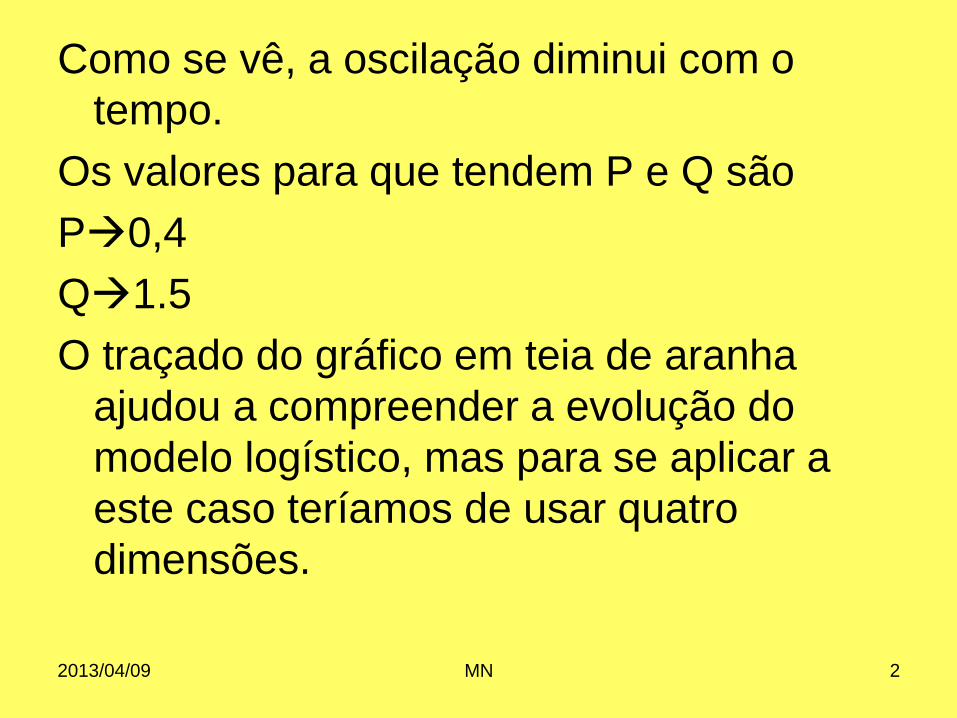
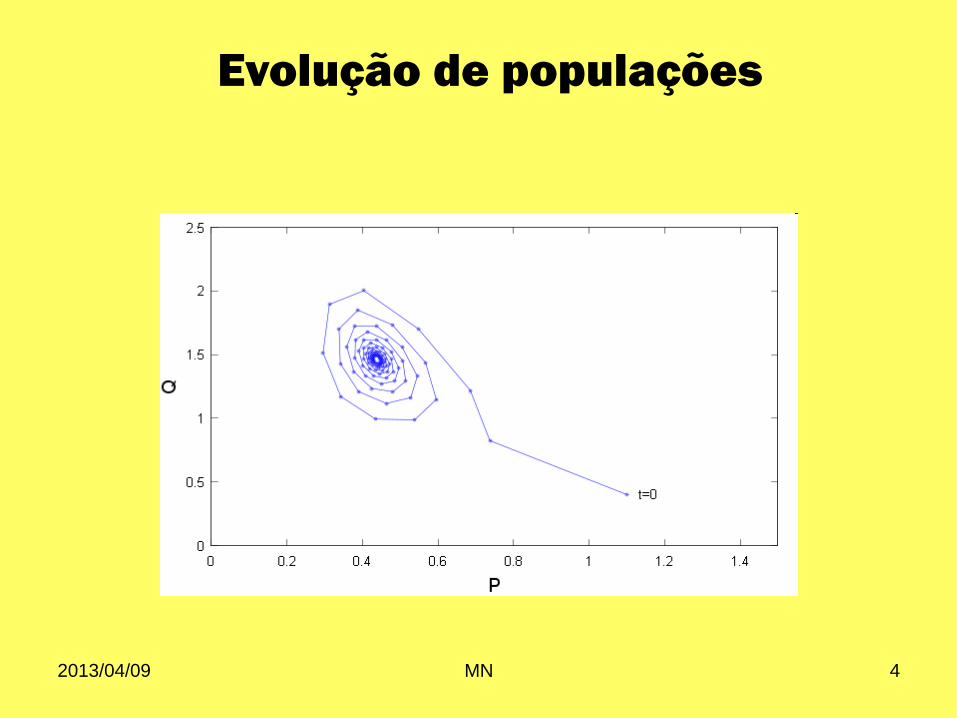
Como se vê, a oscilação diminui com o
tempo.
Os valores para que tendem P e Q são
P0,4
Q1.5
O traçado do gráfico em teia de aranha
ajudou a compreender a evolução do
modelo logístico, mas para se aplicar a
este caso teríamos de usar quatro
dimensões.
2013/04/09 MN 2

Para fazermos uma visualização conjunta das
duas variáveis, P e Q, vamos usar o chamado
plano de fase em que se representa P nas
abcissas e Q nas ordenadas.
A sucessão dos pontos (Pi,Qi) designa-se por
órbita.
Como é evidente perdemos alguma informação,
em relação à variável tempo, pelo que em geral
se indica qual o ponto correspondente a t=0
2013/04/09 MN 3
Evolução de populações
2013/04/09 MN 4
Evolução de populações
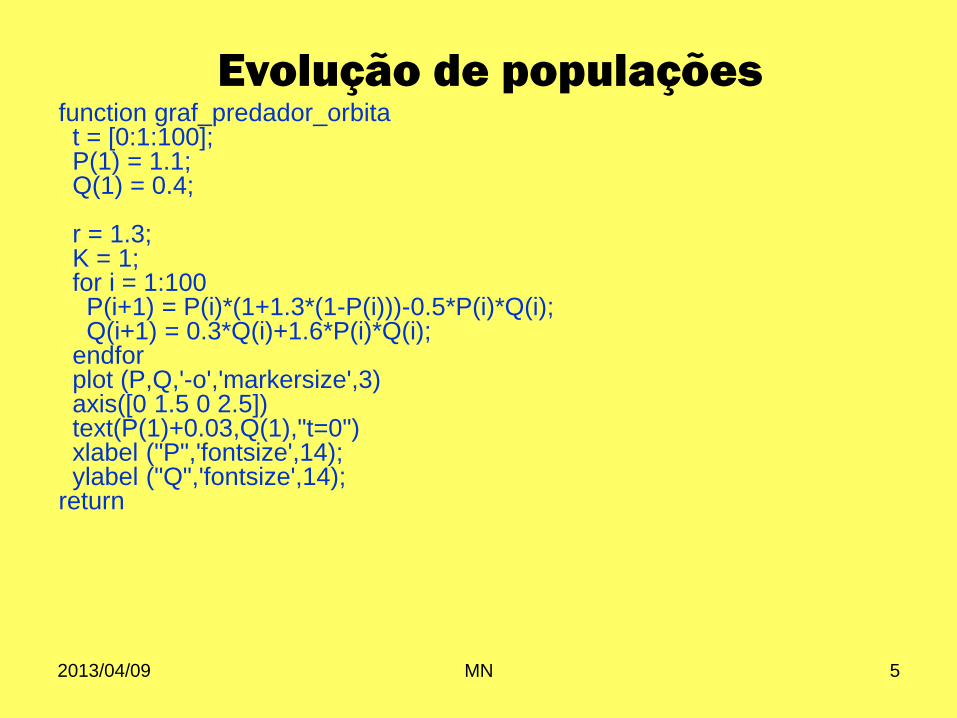
function graf_predador_orbita t = [0:1:100]; P(1) = 1.1; Q(1) = 0.4; r = 1.3; K = 1; for i = 1:100 P(i+1) = P(i)*(1+1.3*(1-P(i)))-0.5*P(i)*Q(i); Q(i+1) = 0.3*Q(i)+1.6*P(i)*Q(i); endfor plot (P,Q,'-o','markersize',3) axis([0 1.5 0 2.5]) text(P(1)+0.03,Q(1),"t=0") xlabel ("P",'fontsize',14); ylabel ("Q",'fontsize',14); return
2013/04/09 MN 5
Evolução de populações
Podemos, mas não o faremos aprofundar o
estudo deste modelos, considerando mais
que duas espécies, determinando os
pontos de equilíbrio, etc..
Passamos então a outra modelização, que é
muito importante, mas que, como nos
casos anteriores, encararemos de forma
simplificada: Modelos de epidemias
2013/04/09 MN 6
Evolução de populações
Evolução de populações
2013/04/09 MN 7
Puella Magi
Evolução de populações
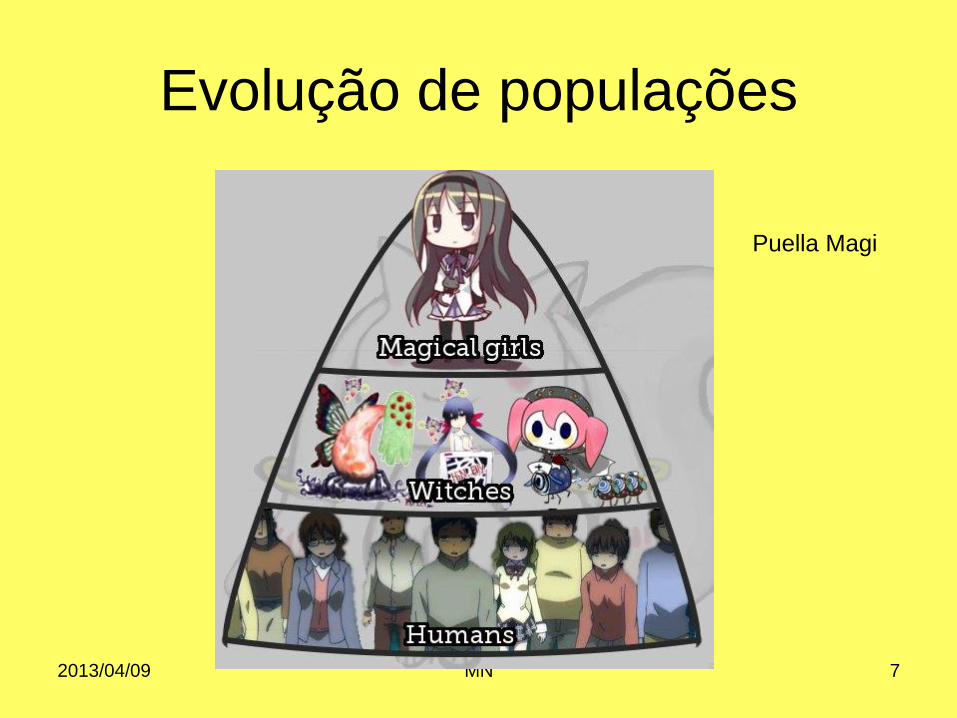
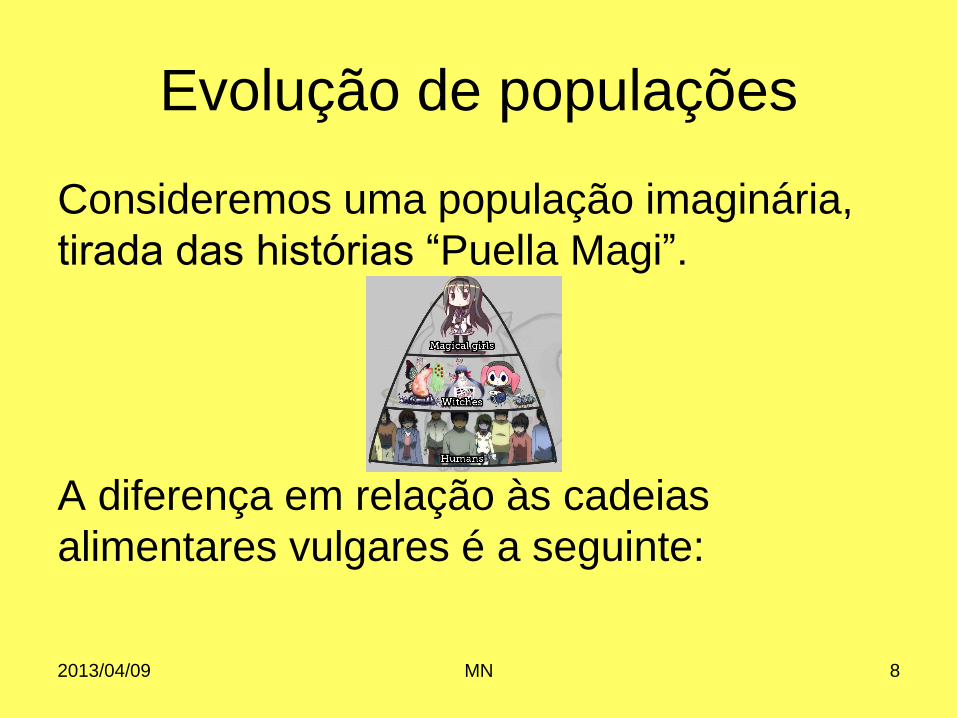
Consideremos uma população imaginária,
tirada das histórias “Puella Magi”.
A diferença em relação às cadeias
alimentares vulgares é a seguinte:
2013/04/09 MN 8
Evolução de populações
quando a “alma-jóia” de uma “rapariga
mágica” (RM) se apaga, ela renasce como
bruxa. Há portanto uma regressão na
cadeia destes seres o que complica o
modelo a utilizar.
Por outro lado existe uma entidade
chamada Kyubey que transforma a
população em RMs.
2013/04/09 MN 9
Evolução de populações
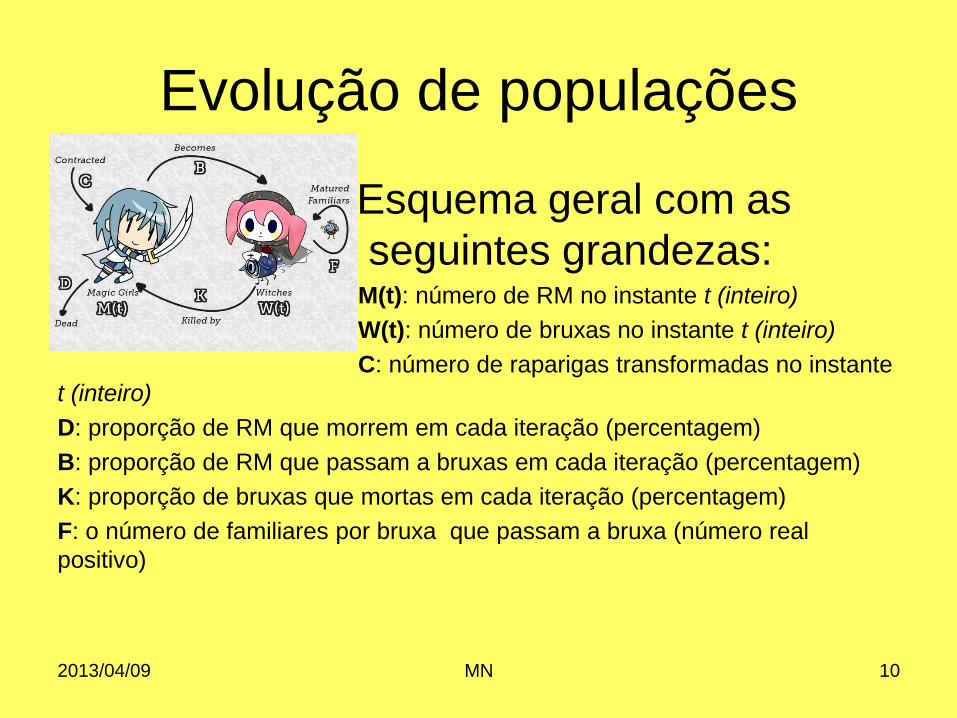
Esquema geral com as
seguintes grandezas: M(t): número de RM no instante t (inteiro)
W(t): número de bruxas no instante t (inteiro)
C: número de raparigas transformadas no instante
t (inteiro)
D: proporção de RM que morrem em cada iteração (percentagem)
B: proporção de RM que passam a bruxas em cada iteração (percentagem)
K: proporção de bruxas que mortas em cada iteração (percentagem)
F: o número de familiares por bruxa que passam a bruxa (número real
positivo)
2013/04/09 MN 10
Evolução de populações
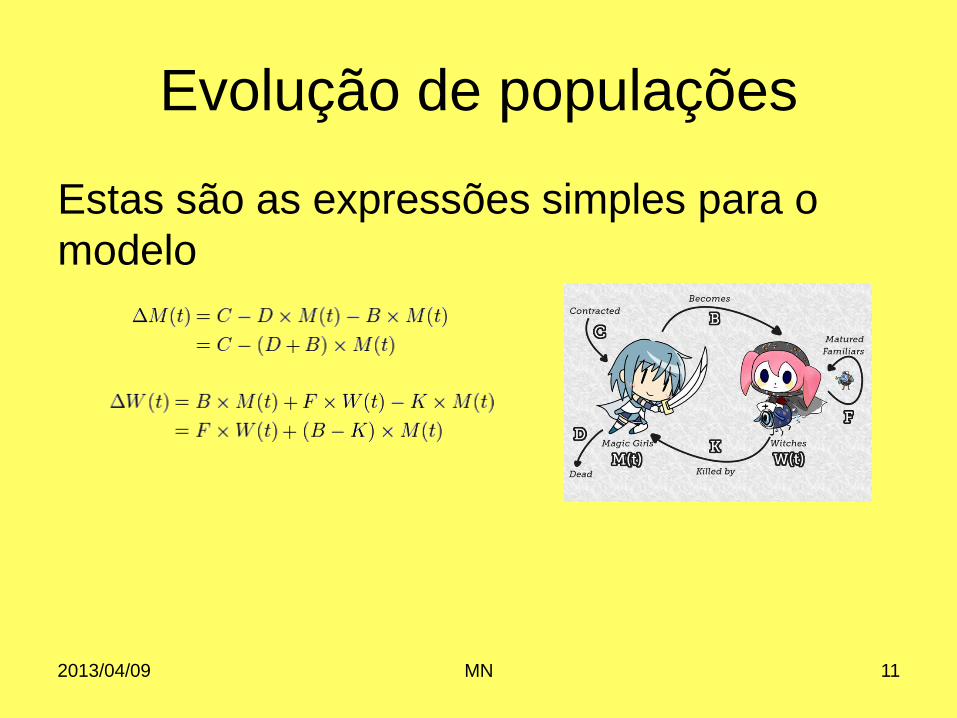
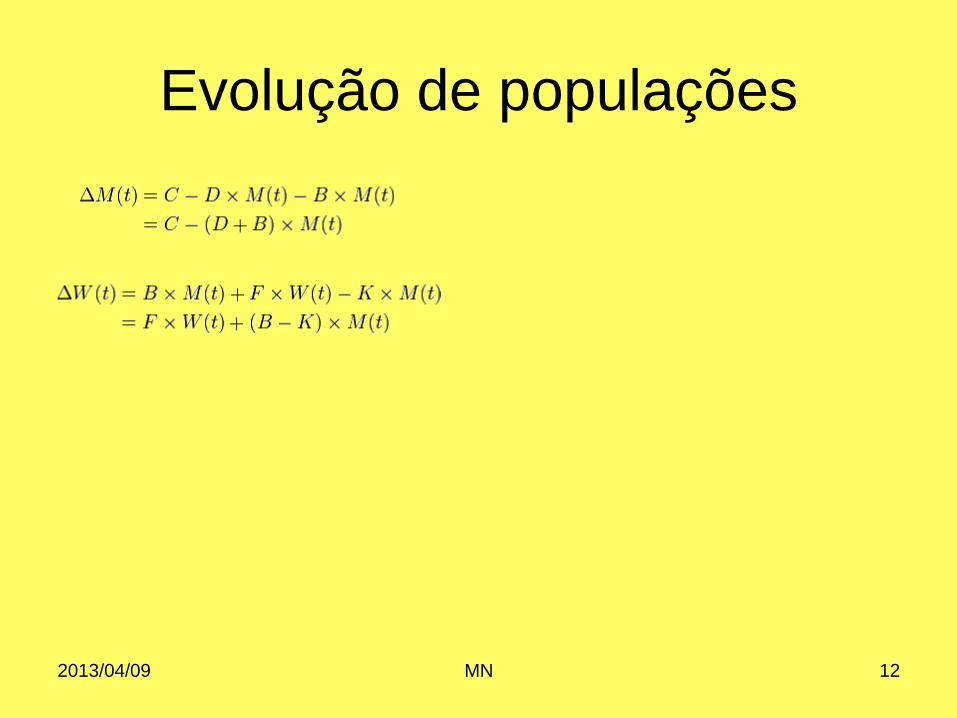
Estas são as expressões simples para o
modelo
2013/04/09 MN 11
Evolução de populações
2013/04/09 MN 12
Evolução de populações
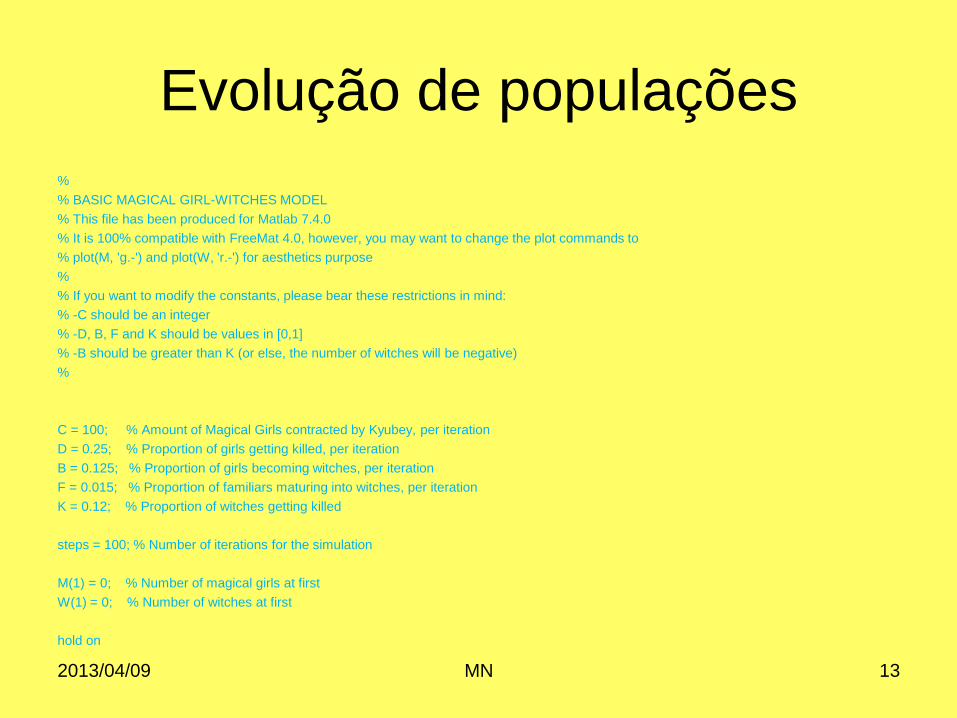
%
% BASIC MAGICAL GIRL-WITCHES MODEL
% This file has been produced for Matlab 7.4.0
% It is 100% compatible with FreeMat 4.0, however, you may want to change the plot commands to
% plot(M, 'g.-') and plot(W, 'r.-') for aesthetics purpose
%
% If you want to modify the constants, please bear these restrictions in mind:
% -C should be an integer
% -D, B, F and K should be values in [0,1]
% -B should be greater than K (or else, the number of witches will be negative)
%
C = 100; % Amount of Magical Girls contracted by Kyubey, per iteration
D = 0.25; % Proportion of girls getting killed, per iteration
B = 0.125; % Proportion of girls becoming witches, per iteration
F = 0.015; % Proportion of familiars maturing into witches, per iteration
K = 0.12; % Proportion of witches getting killed
steps = 100; % Number of iterations for the simulation
M(1) = 0; % Number of magical girls at first
W(1) = 0; % Number of witches at first
hold on
2013/04/09 MN 13
Evolução de populações
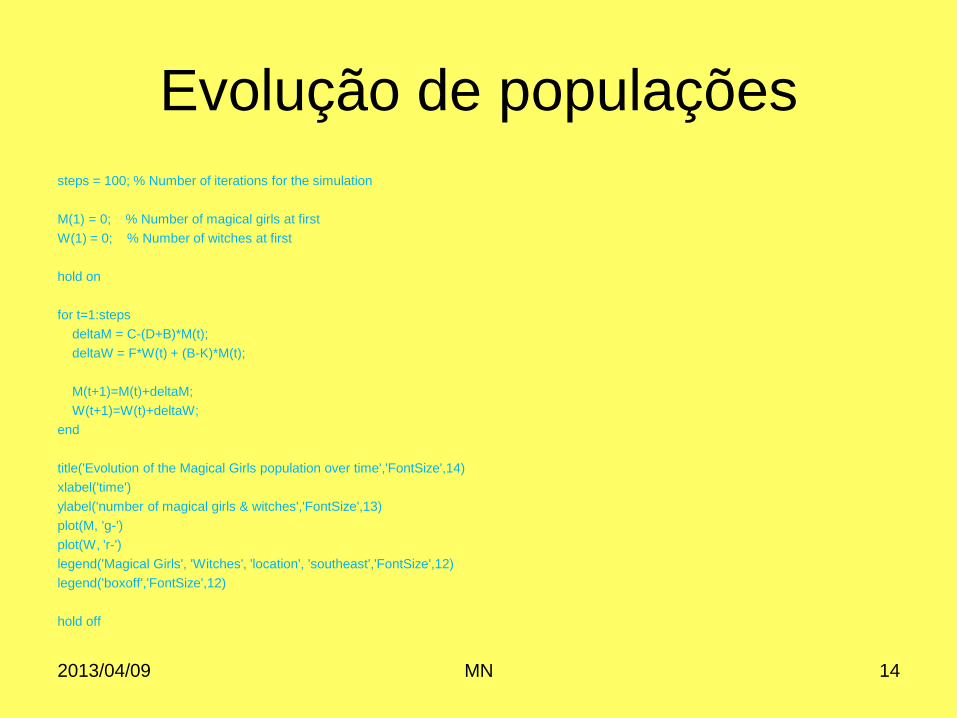
steps = 100; % Number of iterations for the simulation
M(1) = 0; % Number of magical girls at first
W(1) = 0; % Number of witches at first
hold on
for t=1:steps
deltaM = C-(D+B)*M(t);
deltaW = F*W(t) + (B-K)*M(t);
M(t+1)=M(t)+deltaM;
W(t+1)=W(t)+deltaW;
end
title('Evolution of the Magical Girls population over time','FontSize',14)
xlabel('time')
ylabel('number of magical girls & witches','FontSize',13)
plot(M, 'g-')
plot(W, 'r-')
legend('Magical Girls', 'Witches', 'location', 'southeast','FontSize',12)
legend('boxoff','FontSize',12)
hold off
2013/04/09 MN 14
Evolução de populações
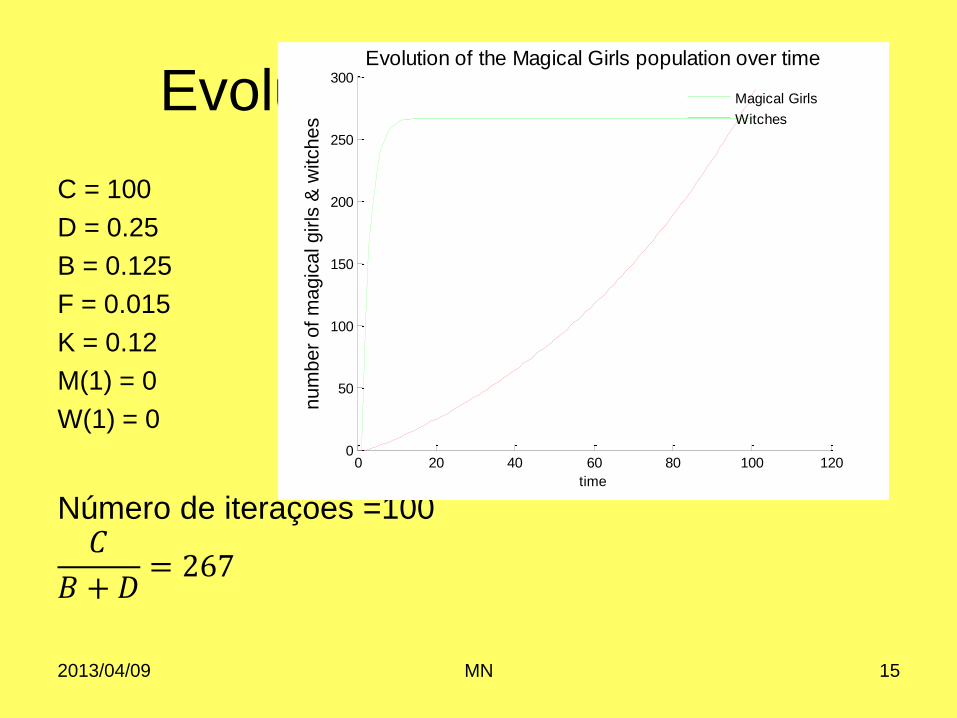
C = 100
D = 0.25
B = 0.125
F = 0.015
K = 0.12
M(1) = 0
W(1) = 0
Número de iterações =100 𝐶
𝐵 + 𝐷= 267
2013/04/09 MN 15
0 20 40 60 80 100 1200
50
100
150
200
250
300
Evolution of the Magical Girls population over time
time
num
ber
of m
agic
al girls
& w
itches
Magical Girls
Witches

Evolução de populações
Se as populações estiverem em equilíbrio
dinâmico, o número de cada uma não varia:
ΔM(t) = 0
ΔW(t) = 0
C = (D+B)M(t) (Magic girls)
F.W(t) = (K-B) W(t)
2013/04/09 MN 16
Evolução de populações
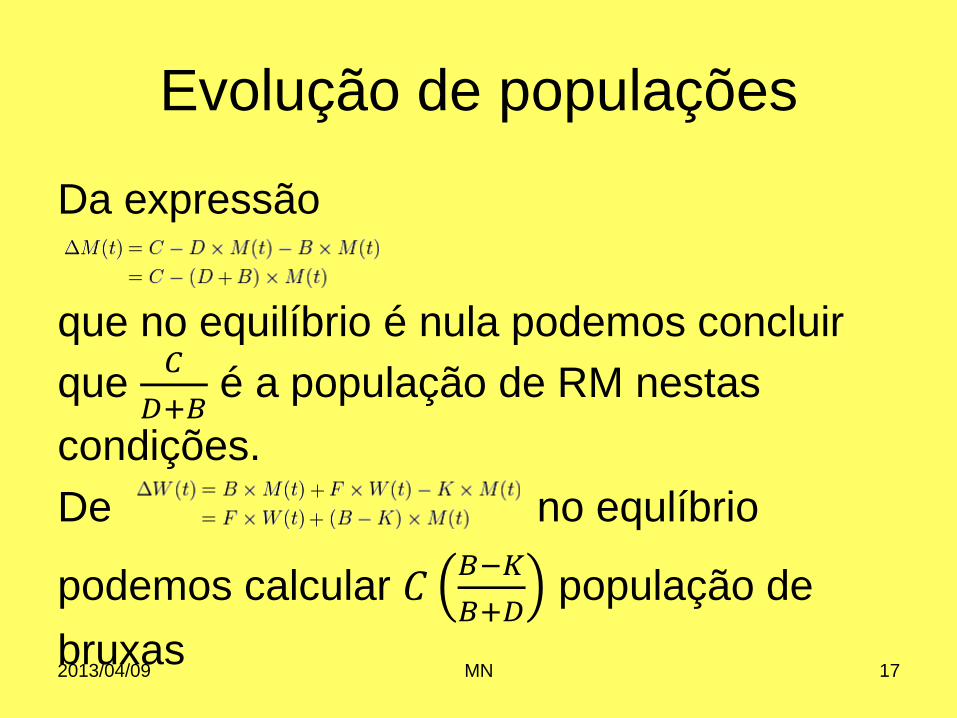
Da expressão
que no equilíbrio é nula podemos concluir
que 𝐶
𝐷+𝐵 é a população de RM nestas
condições.
De no equlíbrio
podemos calcular 𝐶𝐵−𝐾
𝐵+𝐷 população de
bruxas
2013/04/09 MN 17
Evolução de populações
Esta evolução pode ser representada por
equações diferenciais e suas soluções,
mas, para casos especiais não
conseguimos resolvê-las e temos de
recorrer a simulações.
Este tipo de problemas surge muitas vezes
na vida real.
2013/04/09 MN 18

Evolução de populações
Se houver mortes naturais podemos
acrescentar uma variável T que representa
a proporção destas.
Traduzindo para Matlab e fazendo diversas
aplicações obtemos resultados muito
diferentes.
2013/04/09 MN 19

Evolução de populações
%
% REFINED MAGICAL GIRL-WITCH POPULATION MODEL WITH DIMMING OVER TIME
% BASIC MAGICAL GIRL-WITCHES MODEL
% This file has been produced for Matlab 7.4.0
% It is 100% compatible with FreeMat 4.0, however, you may want to change the plot commands to
% plot(M, 'g.-') and plot(W, 'r.-') for aesthetics purpose
%
% This is the script that simulates the Refined Model, but with an
% additionnal effect of soul gems dimming over time.
%
% If you want to modify the constants, please bear these restrictions in mind:
% -C should be an integer
% -D, B, F, K, and T should be values in [0,1]
% -B should be greater than K (or else, the number of witches will be negative)
%
C = 100; % Number of girls contracted by QBe
D = 0.4; % Proportion of girls (who are fighting) that die
B = 0.15; % Proportion of girls (who are fighting) to become witches
F = 0.01; % Proportion of familiars becoming witches
K = 0.165; % Proportion of witches getting killed by MSes
T = 0.0001; % Number of MSes turning into witches over time
2013/04/09 MN 20
Evolução de populações
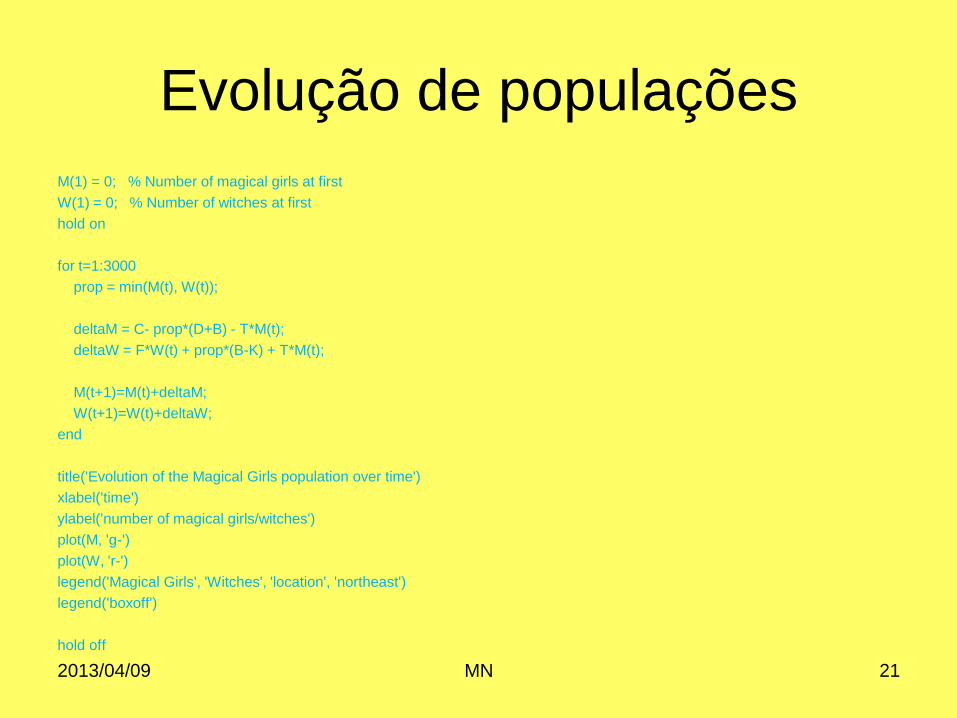
M(1) = 0; % Number of magical girls at first
W(1) = 0; % Number of witches at first
hold on
for t=1:3000
prop = min(M(t), W(t));
deltaM = C- prop*(D+B) - T*M(t);
deltaW = F*W(t) + prop*(B-K) + T*M(t);
M(t+1)=M(t)+deltaM;
W(t+1)=W(t)+deltaW;
end
title('Evolution of the Magical Girls population over time')
xlabel('time')
ylabel('number of magical girls/witches')
plot(M, 'g-')
plot(W, 'r-')
legend('Magical Girls', 'Witches', 'location', 'northeast')
legend('boxoff')
hold off
2013/04/09 MN 21
Evolução de populações
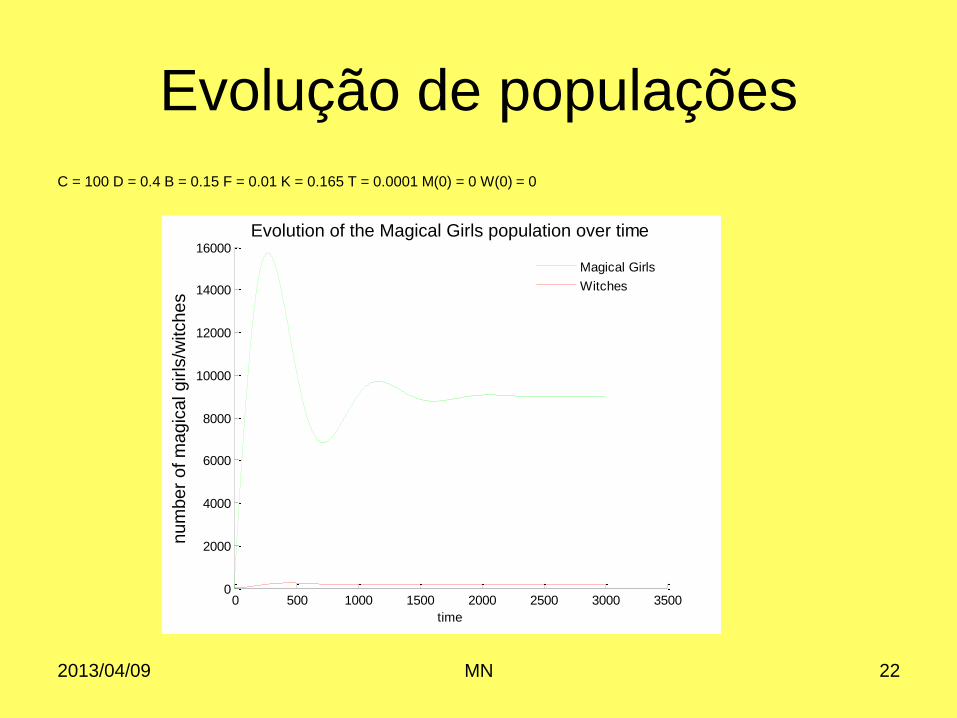
C = 100 D = 0.4 B = 0.15 F = 0.01 K = 0.165 T = 0.0001 M(0) = 0 W(0) = 0
2013/04/09 MN 22
0 500 1000 1500 2000 2500 3000 35000
2000
4000
6000
8000
10000
12000
14000
16000
Evolution of the Magical Girls population over time
time
num
ber
of m
agic
al girls
/witches
Magical Girls
Witches
Evolução de populações
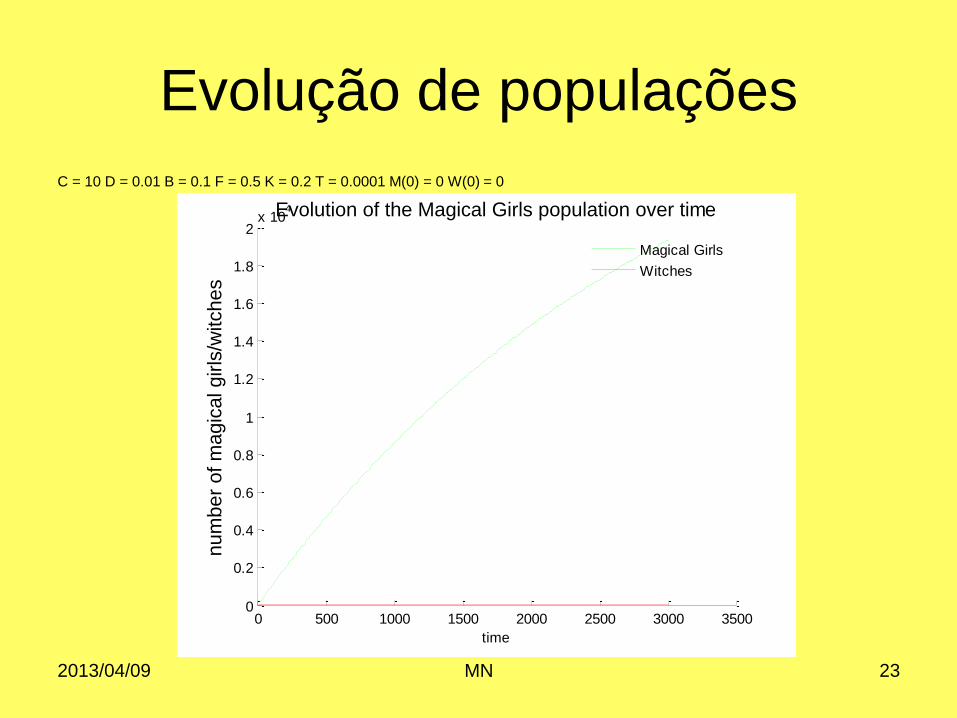
C = 10 D = 0.01 B = 0.1 F = 0.5 K = 0.2 T = 0.0001 M(0) = 0 W(0) = 0
2013/04/09 MN 23
0 500 1000 1500 2000 2500 3000 35000
0.2
0.4
0.6
0.8
1
1.2
1.4
1.6
1.8
2x 10
4Evolution of the Magical Girls population over time
time
num
ber
of m
agic
al girls
/witches
Magical Girls
Witches
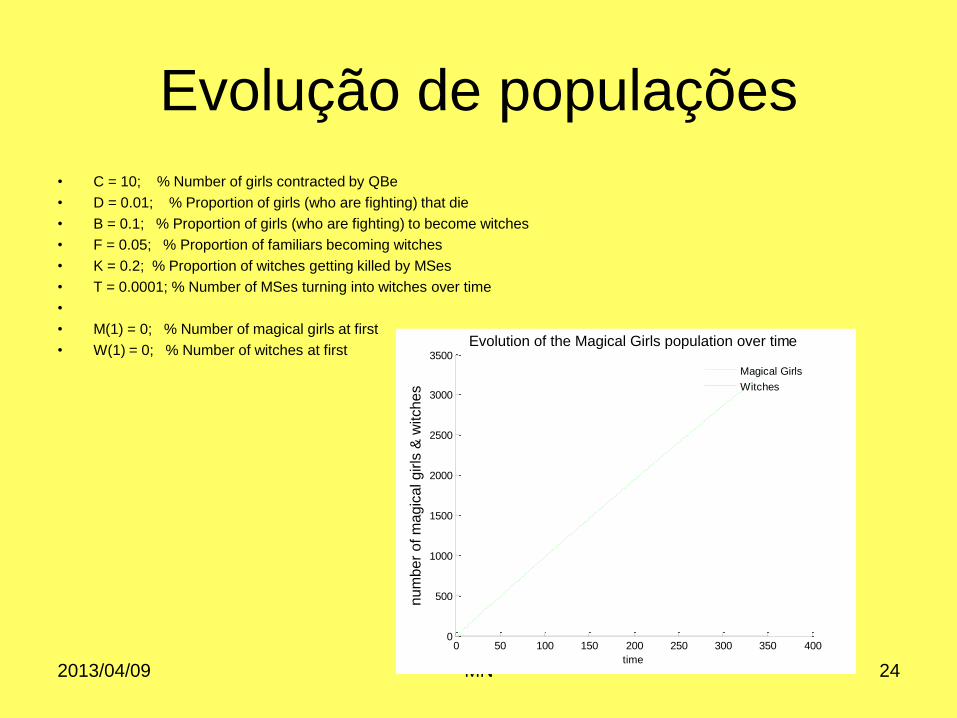
Evolução de populações
• C = 10; % Number of girls contracted by QBe
• D = 0.01; % Proportion of girls (who are fighting) that die
• B = 0.1; % Proportion of girls (who are fighting) to become witches
• F = 0.05; % Proportion of familiars becoming witches
• K = 0.2; % Proportion of witches getting killed by MSes
• T = 0.0001; % Number of MSes turning into witches over time
•
• M(1) = 0; % Number of magical girls at first
• W(1) = 0; % Number of witches at first
2013/04/09 MN 24
0 50 100 150 200 250 300 350 4000
500
1000
1500
2000
2500
3000
3500
Evolution of the Magical Girls population over time
time
num
ber
of m
agic
al girls
& w
itches
Magical Girls
Witches

Evolução de populações
C = 10; % Number of girls contracted by QBe
D = 0.01; % Proportion of girls (who are fighting) that die
B = 0.1; % Proportion of girls (who are fighting) to become witches
F = 0.5; % Proportion of familiars becoming witches
K = 0.2; % Proportion of witches getting killed by MSes
T = 0.01; % Number of MSes turning into witches over time
M(1) = 0; % Number of magical girls at first
W(1) = 0; % Number of witches at first
2013/04/09 MN 25
0 50 100 150 200 250 300 350 4000
1
2
3
4
5
6
7
8x 10
60Evolution of the Magical Girls population over time
time
num
ber
of m
agic
al girls
& w
itches
Magical Girls
Witches