Embed Size (px)
Citation preview
6º SILUSBA – Simpósio de Hidráulica e Recursos Hídricos dos Países de Língua Oficial Portuguesa
697
PROBLEMAS DE RECURSOS HÍDRICOS EM ILHAS EXEMPLO DA ILHA DE SANTIAGO
CASO DA BACIA HIDROGRÁFICA DA RIBEIRA GRANDE DA
CIDADE VELHA CASO DA BACIA HIDROGRÁFICA DA RIBEIRA SECA
Alberto da Mota GOMESi
Professor Associado do Instituto Superior de Educação
António Filipe Lobo de Pinaii
Professor Convidado do Instituto Superior de Educação
ENQUADRAMENTO DO ARQUIPÉLAGO DE CABO VERDE Origem e Localização As ilhas de Cabo Verde elevam-se de um soco submarino, em forma de ferradura, situado a uma profundidade da ordem de 3.000 metros. Deste soco emergem três pedestais bem distintos1. A Norte, compreendendo as ilhas de St° Antão, S. Vicente, St.ª Luzia e S. Nicolau e os ilhéus Boi, Pássaros, Branco e Raso. A Leste e a Sul, com as ilhas do Sal, Boa Vista, Maio e Santiago e os ilhéus Rabo de Junco, Curral de Dadó, Fragata, Chano, Baluarte e de Santa Maria. A Oeste, compreendendo as ilhas do Fogo e da Brava e os ilhéus Grande, Luís Carneiro e de Cima (Fig. 1 - Mapa de Cabo Verde e distribuição das ilhas nos três pedestais). A formação das ilhas teria sido iniciada por uma actividade vulcânica submarina central, mais tarde completada por uma rede físsural manifestada nos afloramentos. A maior parte das ilhas é dominada por emissões de escoadas lávicas e de materiais piroclásticos (escórias, bagacinas ou "lapilli" e cinzas) subaéreos, predominantemente basálticas. O Arquipélago de Cabo Verde fica localizado na margem Oriental do Atlântico Norte, a cerca de 450 Km da Costa Ocidental da África e a cerca de 1.400 Km a SSW das Canárias, limitado pelos paralelos 17° 13' (Ponta Cais dos Fortes, Ilha de St° Antão) e 14º 48' (Ponta de Nho Martinho, Ilha Brava), de latitude Norte e pelos meridianos de 22° 42' (ilhéu Baluarte, Ilha da Boa Vista) e 25° 22' (Ponta Chã de Mangrado, Ilha de St° Antão) de longitude Oeste de Greenwich. O Arquipélago de Cabo Verde fica situado a cerca de 2.000 Km a Leste do actual "rift" da "Crista Média Atlântica" e a Oeste da zona de quietude magnética ("quite zone"), entre as isócronas dos 120 e 140 M.A., segundo Vacquier (1972), e a dos 107 e 153 M.A., segundo Haynes & Rabinowitz (1975), argumentos invocados para se considerar que as ilhas teriam sido geradas em ambiente oceânico. O Arquipélago de Cabo Verde fica situado numa região elevada do actual fundo oceânico, que faz parte da "Crista de Cabo Verde" (" Cape Verde Rise"), e que na vizinhança das ilhas corresponde a um domo com cerca de 400 Km de largura (Lancelot et al., 1977). Presume-se que um domo

6º SILUSBA – Simpósio de Hidráulica e Recursos Hídricos dos Países de Língua Oficial Portuguesa
698
daquelas dimensões representa um fenómeno importante, possivelmente relacionado com descompressão e fusão parcial (Le Bas, 1980) que forneceria a fonte dos magmas que originaram as ilhas (Stillman et al., 1982). As ilhas se teriam implantado por um mecanismo do tipo "hot-spot", de acordo com alguns autores. ______________________________________________ BEBIANO, J. Bacelar - A Geologia do Arquipélago de Cabo Verde, 1932.
Fig.1 - Mapa de Distribuição das ilhas nos três pedestais.
6º SILUSBA – Simpósio de Hidráulica e Recursos Hídricos dos Países de Língua Oficial Portuguesa
699
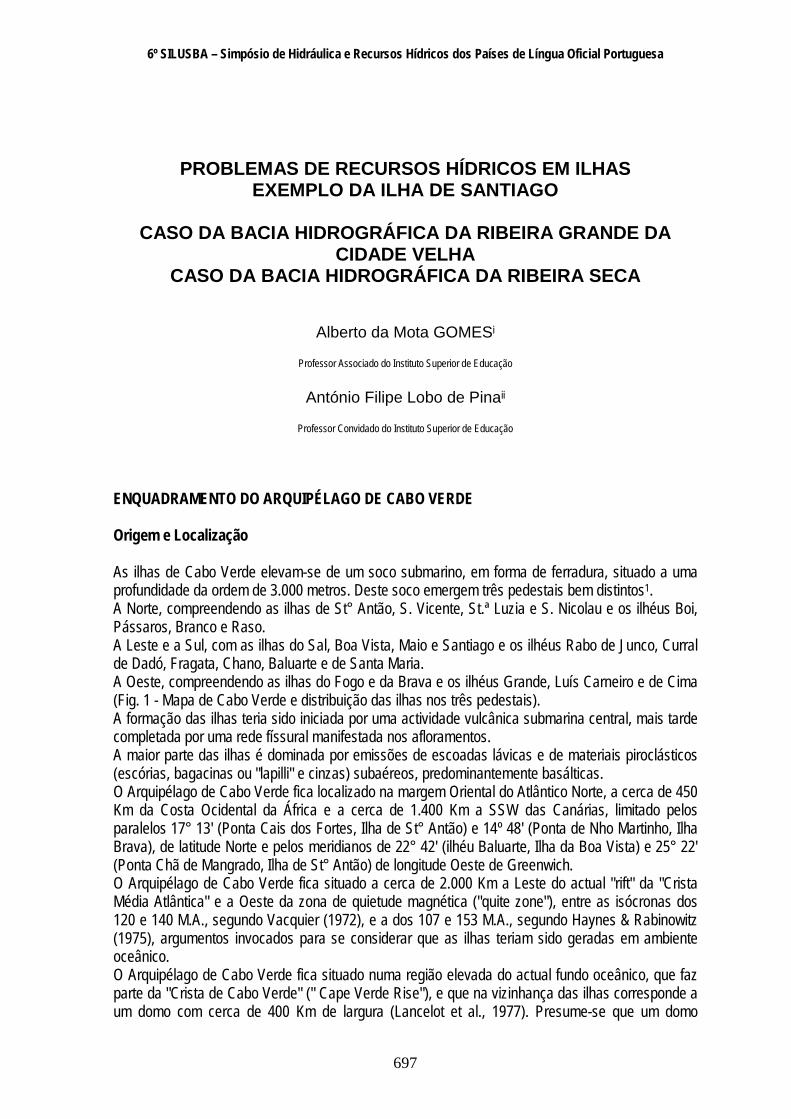
Fonte - A Geologia do Arquipélago de Cabo Verde, J. Bacelar Bebiano, 1932.
QUADRO N.º 1 CARACTERÍSTICAS FISICAS DAS ILHAS
Superfície Terra arável Ilha Km2 % Altitude (m) Pluviometria
mm/ano ha % Santo Antão S. Vicente S. Nicolau Sal Boa Vista Maio Santiago Fogo Brava Santa Luzia Cabo Verde
785 230 347 221 628 275 1.007 470 63 46 4.033
19,3 5,6 8,5 5,4 15,4 6,8 24,7 11,5 1,5 1,1 100,0
1.979 750 1.312 406 387 437 1.394 2.829 976
237 93 142 60 68 150 321 495 268 230
8.800 450 2.000 220 500 660 21.500 5.900 1.060 41.090
21,4 1,1 4,9 0,5 1,2 1,6 52,3 14,4 12,6 100,0
Fonte: Schéma Directeur pour la mise en valeur des ressources en eau (1993 – 2005) Volume 1, Chapitre 1, pg. 1.1.
6º SILUSBA – Simpósio de Hidráulica e Recursos Hídricos dos Países de Língua Oficial Portuguesa
700
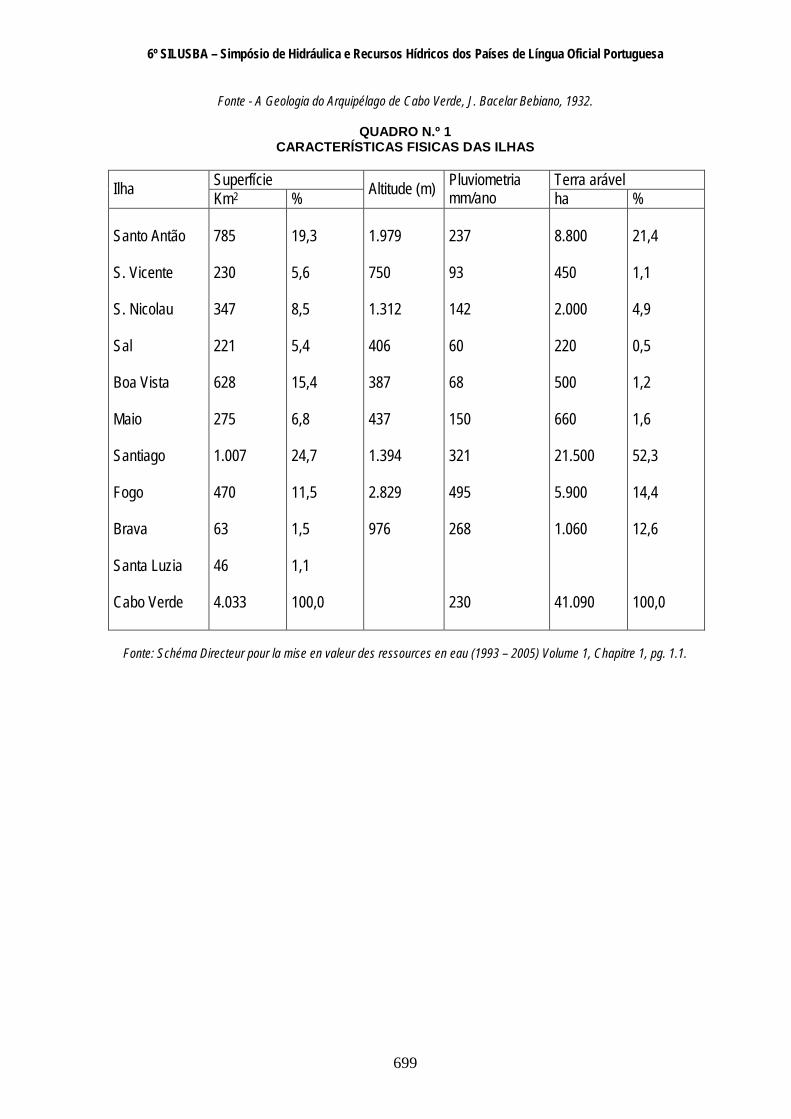
QUADRO N.º 2
RECURSOS HÍDRICOS
(milhões de m3/ano)
Água Subterrânea Ilha
Precipitação mm (período médio)
Água Superficial (período médio)
Bruto (período médio)
Explorável (período médio)
Explorável (período seco)
Santo Antão S. Vicente S. Nicolau Sal Boa Vista Maio Santiago Fogo Brava Cabo Verde
186 21 49 13 42 41 323 233 17 925
27,0 2,3 5,9 0,7 2,5 4,7 56,6 79 2,3 181
28,6 0,6 4,2 0,4 1,6 2,1 42,4 42 1,9 124
21,3 0,4 2,5 0,1 0,7 0,9 26,0 12,0 1,6 65
14,5 0,2 1,5 0,05 0,3 0,5 16,5 9,3 1,0 44
Fonte: Schéma Directeur pour la mise en valeur des ressources en eau (1993 – 2005) Volume 1, Chapitre 3, pg. 3.14 -
Source : Projet PNUD/DDES CVI – 87 – 001.
GEOMORFOLOGIA De acordo com M. Monteiro Marques (1990), na ilha de Santiago da República de Cabo Verde, consideram-se sete unidades geomorfológicas, nomeadamente: Achadas Meridionais (I); Maciço Montanhoso do Pico da Antónia (II); Planalto de Santa Catarina (III); Flanco Oriental (IV); Maciço Montanhoso da Malagueta (V); Tarrafal (VI); Flanco Ocidental (VII). (Fig. 2 – Grandes Unidades Geomorfológicas). A altitude média da ilha é de 278,5 m, sendo a altitude máxima de 1394 m (Pico da Antónia). A Sul destaca-se uma série de achadas escalonadas entre o nível do mar e 300-500 m de altitude. A Oeste, o litoral é normalmente escarpado e, a Leste, é baixo e constituído por achadas. No centro da ilha localiza-se o extenso Planalto de Santa Catarina, que se situa entre 400 e 600 m de altitude.
6º SILUSBA – Simpósio de Hidráulica e Recursos Hídricos dos Países de Língua Oficial Portuguesa
701
Limitando a Sul e a Norte aquele planalto erguem-se, respectivamente, os maciços montanhosos do Pico da Antónia e o da Malagueta, cujos cimos ultrapassam os 1000 m. A Oeste, o flanco do Planalto de Santa Catarina é extremamente declivoso até o mar; a Leste, o flanco oriental inicia-se por encostas alcantiladas, mas os declives médios vão-se adoçando bastante até às achadas litorais. No Norte da ilha, destaca-se o Tarrafal, extensa região de achadas cujas altitudes variam entre 20 e 300 m, que se desenvolve a partir do sopé setentrional do Maciço Montanhoso da Malagueta, devendo-se destacar a plataforma de Chão Bom, Tarrafal, cujas altitudes variam entre 0 e 20 m. Neste relevo variado e bastante movimentado, insere-se uma rede hidrográfica de regime temporário relativamente densa e, na grande maioria dos casos, correndo em vales encaixados cujos talvegues apresentam perfil longitudinal torrencial. Nesta paisagem sobressaem os troços terminais dos vales principais das bacias hidrográficas mais importantes cuja forma terminal em canhão é vulgar. Isto fundamentalmente nos troços que cortam as achadas, tanto nos litorais como nas dos planaltos do interior da ilha. Esta forma de vale é devida à estrutura colunar que afecta as escoadas lávicas.

6º SILUSBA – Simpósio de Hidráulica e Recursos Hídricos dos Países de Língua Oficial Portuguesa
702
Fig. 2 - Grandes Unidades Geomorfológicas. Fonte – Garcia de Orta, Sér. Est. Agron., Lisboa, 17 (1-2), 1990, 19-29
6º SILUSBA – Simpósio de Hidráulica e Recursos Hídricos dos Países de Língua Oficial Portuguesa
703
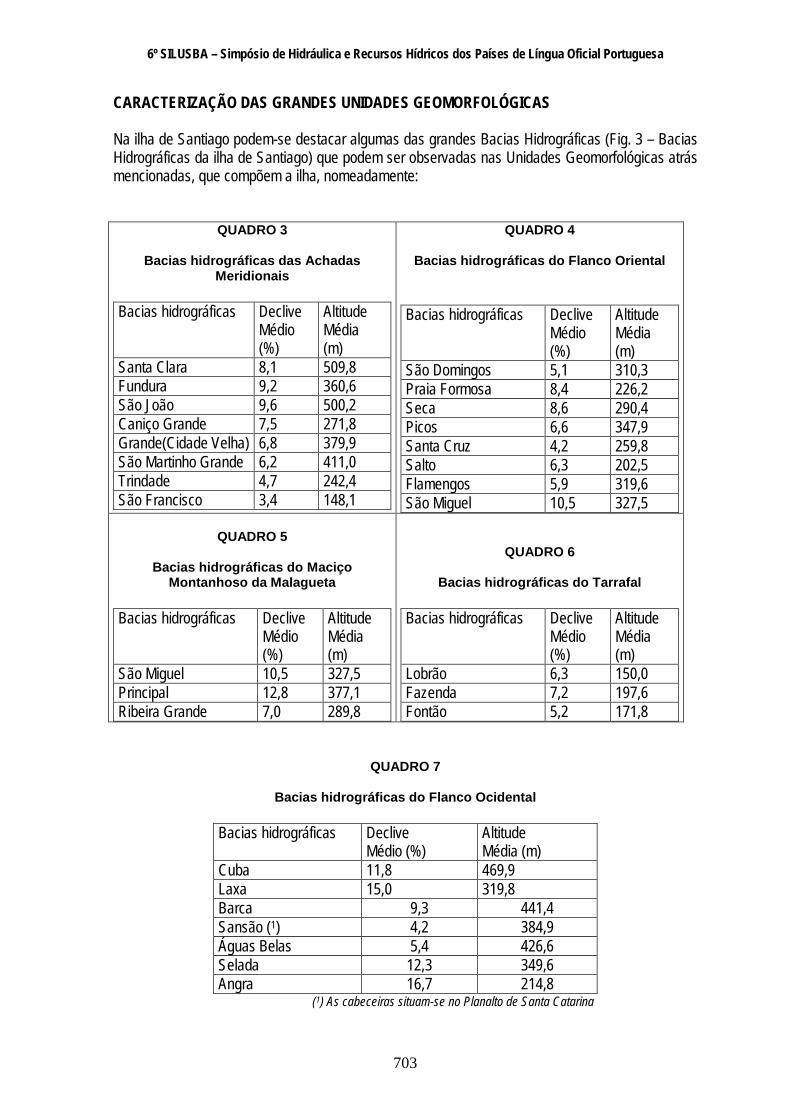
CARACTERIZAÇÃO DAS GRANDES UNIDADES GEOMORFOLÓGICAS Na ilha de Santiago podem-se destacar algumas das grandes Bacias Hidrográficas (Fig. 3 – Bacias Hidrográficas da ilha de Santiago) que podem ser observadas nas Unidades Geomorfológicas atrás mencionadas, que compõem a ilha, nomeadamente:
QUADRO 3
Bacias hidrográficas das Achadas Meridionais
Bacias hidrográficas Declive
Médio (%)
Altitude Média (m)
Santa Clara 8,1 509,8 Fundura 9,2 360,6 São João 9,6 500,2 Caniço Grande 7,5 271,8 Grande(Cidade Velha) 6,8 379,9 São Martinho Grande 6,2 411,0 Trindade 4,7 242,4 São Francisco 3,4 148,1
QUADRO 4
Bacias hidrográficas do Flanco Oriental Bacias hidrográficas Declive
Médio (%)
Altitude Média (m)
São Domingos 5,1 310,3 Praia Formosa 8,4 226,2 Seca 8,6 290,4 Picos 6,6 347,9 Santa Cruz 4,2 259,8 Salto 6,3 202,5 Flamengos 5,9 319,6 São Miguel 10,5 327,5
QUADRO 5
Bacias hidrográficas do Maciço
Montanhoso da Malagueta Bacias hidrográficas Declive
Médio (%)
Altitude Média (m)
São Miguel 10,5 327,5 Principal 12,8 377,1 Ribeira Grande 7,0 289,8
QUADRO 6
Bacias hidrográficas do Tarrafal Bacias hidrográficas Declive
Médio (%)
Altitude Média (m)
Lobrão 6,3 150,0 Fazenda 7,2 197,6 Fontão 5,2 171,8
QUADRO 7
Bacias hidrográficas do Flanco Ocidental
Bacias hidrográficas Declive Médio (%)
Altitude Média (m)
Cuba 11,8 469,9 Laxa 15,0 319,8 Barca 9,3 441,4 Sansão (1) 4,2 384,9 Águas Belas 5,4 426,6 Selada 12,3 349,6 Angra 16,7 214,8 (1) As cabeceiras situam-se no Planalto de Santa Catarina

6º SILUSBA – Simpósio de Hidráulica e Recursos Hídricos dos Países de Língua Oficial Portuguesa
704
Fig. 3 – Bacias Hidrográficas da ilha de Santiago
Fonte: I.N.G.R.H.
6º SILUSBA – Simpósio de Hidráulica e Recursos Hídricos dos Países de Língua Oficial Portuguesa
705
CLIMATOLOGIA E ALIMENTAÇÃO DE AQUÍFEROS 1.1. Climatologia Em Santiago, na generalidade, a temperatura média mensal ronda os 25 a 27º C, nos meses mais quentes (Agosto e Setembro) e 22 a 24º C nos meses mais frios (Janeiro e Fevereiro), sendo as médias anuais nunca superiores a 27º C e não inferiores a 18º C. Relativamente aos ventos predominantes, pode-se assinalar a existência de vários tipos de tempo, em função às massas de ar que predominam:
a) Alísio marítimo, de direcção nordeste; b) Alísio continental ou Harmatão – Lestada; c) Invasão do ar polar; d) Monção do sudoeste africano; e) Perturbações tropicais – Ciclones.
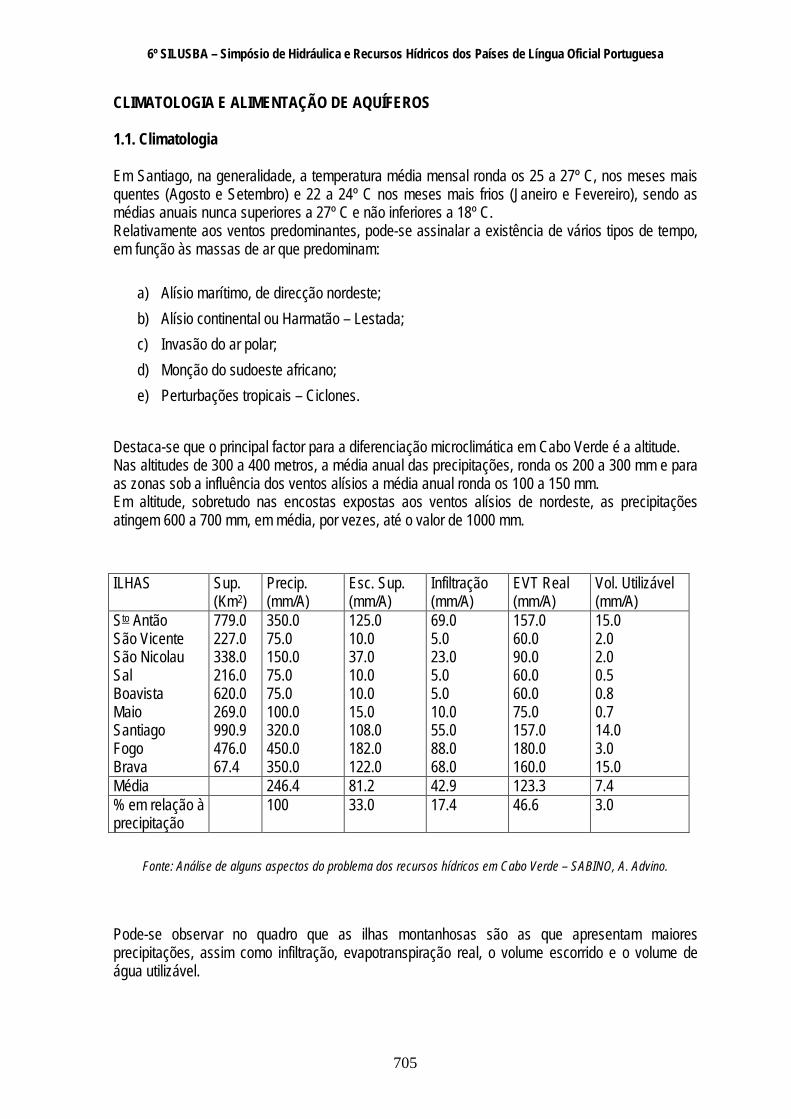
Destaca-se que o principal factor para a diferenciação microclimática em Cabo Verde é a altitude. Nas altitudes de 300 a 400 metros, a média anual das precipitações, ronda os 200 a 300 mm e para as zonas sob a influência dos ventos alísios a média anual ronda os 100 a 150 mm. Em altitude, sobretudo nas encostas expostas aos ventos alísios de nordeste, as precipitações atingem 600 a 700 mm, em média, por vezes, até o valor de 1000 mm. ILHAS Sup.
(Km2) Precip. (mm/A)
Esc. Sup. (mm/A)
Infiltração (mm/A)
EVT Real (mm/A)
Vol. Utilizável (mm/A)
Sto Antão São Vicente São Nicolau Sal Boavista Maio Santiago Fogo Brava
779.0 227.0 338.0 216.0 620.0 269.0 990.9 476.0 67.4
350.0 75.0 150.0 75.0 75.0 100.0 320.0 450.0 350.0
125.0 10.0 37.0 10.0 10.0 15.0 108.0 182.0 122.0
69.0 5.0 23.0 5.0 5.0 10.0 55.0 88.0 68.0
157.0 60.0 90.0 60.0 60.0 75.0 157.0 180.0 160.0
15.0 2.0 2.0 0.5 0.8 0.7 14.0 3.0 15.0
Média 246.4 81.2 42.9 123.3 7.4 % em relação à precipitação
100 33.0 17.4 46.6 3.0
Fonte: Análise de alguns aspectos do problema dos recursos hídricos em Cabo Verde – SABINO, A. Advino.
Pode-se observar no quadro que as ilhas montanhosas são as que apresentam maiores precipitações, assim como infiltração, evapotranspiração real, o volume escorrido e o volume de água utilizável.
6º SILUSBA – Simpósio de Hidráulica e Recursos Hídricos dos Países de Língua Oficial Portuguesa
706
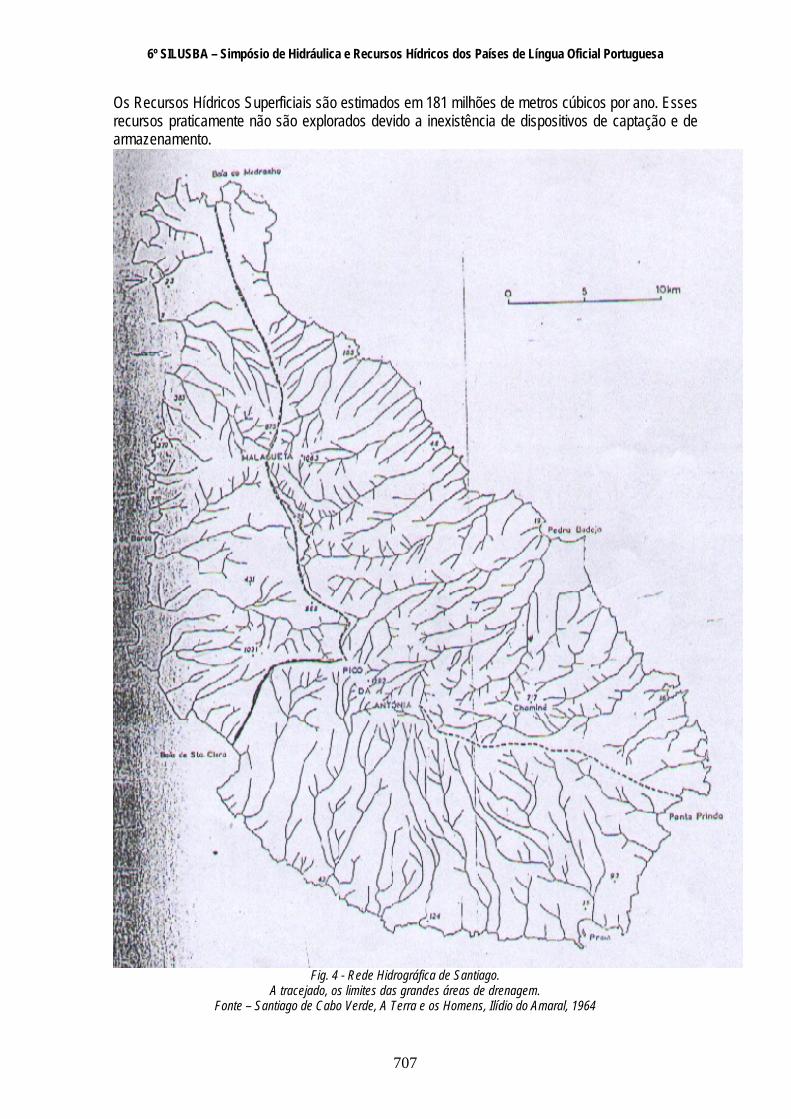
O clima é do tipo tropical seco, com duas estações, a seca e a húmida. A estação seca ou das “brisas”, de Dezembro a Junho e a estação húmida ou das “águas”, de Agosto a Outubro. Os meses de Julho e Novembro são considerados de transição. A estação das chuvas é irregular, devendo-se ressaltar que desde 1968 a precipitação tem sido bastante deficitária. 1.2. Alimentação de Aquíferos Quando olharmos o mapa de Santiago, logo nos impressiona a forte densidade de vales profundos que cortam a sua área, correndo das zonas altas para todos os lados, em direcção ao oceano. O maciço do Pico da Antónia é a área de drenagem de maior importância, com uma rede de vales mais densa para Leste, apresentando as bacias de recepção a característica comum de anfiteatros amplos. Da mesma forma, a serra da Malagueta é retalhada por numerosos vales, abismos profundos que correm de acordo com o declive estrutural; na sua evolução, algumas das cabeceiras da rede vão-se aproximando do relevo vigoroso da escarpa da serra. Três grandes áreas de drenagem se podem delimitar por linhas tiradas do Pico da Antónia (Fig. 4 – Rede Hidrográfica de Santiago):
1. Para a baía do Medronho (Tarrafal), passando pela Quebrada;
2. Para a baía de St.ª Clara, passando pela Achada Lagoa;
3. Para a Ponta Prinda, através de Pedra Branca e de Ribeirão Chiqueiro. Alberto da Mota Gomes no seu trabalho “Protecção de Ambiente, Gestão dos Recursos Naturais, Luta contra a Pobreza) p.10,11, como Consultor do Programa das Nações Unidas, afirma que a precipitação é a origem dos Recursos Hídricos em Cabo Verde. Toda a água utilizada, com excepção da água dessalinizada tem a sua origem na chuva. Assim, os Recursos Hídricos Subterrâneos e Superficiais são alimentados pelas precipitações. Infelizmente, há dezenas de anos que a precipitação em Cabo Verde tem sido bastante irregular, com o agravante de que uma boa parte se perde no mar. O balanço hidrológico, citando “Esquema Director para a Exploração dos Recursos Hídricos (1993-2005), Programa das Nações Unidas para o Desenvolvimento – Conselho Nacional de Águas, Instituto Nacional de Gestão dos Recursos Hídricos, Abril de 1993” mostra que a precipitação que cai sobre as ilhas reparte-se em período médio, da seguinte maneira:
- 67% evapora-se; - 20% escoa-se sob a forma de escoamento superficial; - 13% recarga os aquíferos.
Os Recursos Hídricos Subterrâneos são estimados em 124 milhões de metros cúbicos por ano. Dessa quantidade total, apenas 65 milhões de metros cúbicos por ano é tecnicamente explorável, num ano de pluviometria regular, e em 44 milhões de metros cúbicos por ano, nos períodos de seca.
6º SILUSBA – Simpósio de Hidráulica e Recursos Hídricos dos Países de Língua Oficial Portuguesa
707
Os Recursos Hídricos Superficiais são estimados em 181 milhões de metros cúbicos por ano. Esses recursos praticamente não são explorados devido a inexistência de dispositivos de captação e de armazenamento.
Fig. 4 - Rede Hidrográfica de Santiago. A tracejado, os limites das grandes áreas de drenagem.
Fonte – Santiago de Cabo Verde, A Terra e os Homens, Ilídio do Amaral, 1964
6º SILUSBA – Simpósio de Hidráulica e Recursos Hídricos dos Países de Língua Oficial Portuguesa
708
GEOLOGIA SEQUÊNCIA VULCANO – ESTRATIGRÁFICA Os trabalhos realizados por António Serralheiro, que conduziram à elaboração e publicação da Carta Geológica nas escalas 1:25.000 e 1:100.000 e a respectiva Notícia Explicativa, permitiram estabelecer a Sequência Vulcano-Estratigráfica da ilha de Santiago, que tem servido de suporte básico para os trabalhos de Hidrogeologia e Recursos Hídricos. Também se deverá salientar a contribuição dada pelo “Estudo geológico, petrológico e vulcanológico da ilha de Santiago (Cabo Verde)” da autoria de C. A. Matos Alves, J. R. Macedo, L. Celestino Silva, A. Serralheiro e A. F. Peixoto Faria no reforço dos conhecimentos da Sequência Vulcano-Estratigráfica da ilha de Santiago. É neste contexto que passaremos a descrever a ocorrência dos acontecimentos geológicos, tomando como princípio do mais antigo (I) ao mais recente (X):
I - Complexo Eruptivo Interno Antigo (CA)
a) Complexo filoniano de base de natureza essencialmente basáltica (CA); b) Intrusões de rochas granulares silicatadas (γ); c) Brechas intravulcânicas e filões brechóides (B); d) Intrusões e extrusões fonolíticas e traquíticas (ϕ); e) Carbonatitos (Cb).
II - Conglomerados anteformação dos Flamengos III - Formação dos Flamengos (λρ) IV - Formação dos Órgãos (CB) V - Formação Lávica pós-Formação dos Órgãos
VI - Sedimentos posteriores à Formação dos Órgãos e anteriores às lavas submarinas inferiores (LRi) do Complexo Eruptivo do Pico da Antónia;
VII - Complexo Eruptivo do Pico da Antónia (PA); VIII - Formação da Assomada (A); IX - Formação do Monte das Vacas (MV); X - Formações Sedimentares recentes de idade Quaternária
PROBLEMAS DE RECURSOS HÍDRICOS EM ILHAS 1.1. Considerações Gerais Emílio Custódio no seu trabalho “Hidrogeologia de las rocas volcanicas, 1975”, assinala que nos terrenos vulcânicos, sob o ponto de vista geohidrológico, debruçam-se sobre os princípios
6º SILUSBA – Simpósio de Hidráulica e Recursos Hídricos dos Países de Língua Oficial Portuguesa
709
fundamentais da hidráulica subterrânea com suporte nos trabalhos realizados nas Ilhas Canárias e em outras regiões vulcânicas. Nos terrenos vulcânicos existe uma superfície de saturação real ou virtual, que permite definir superfícies piezométricas e redes de escoamento subterrâneo, mas para a sua validação devem ser considerados volumes de rocha suficientemente grandes. Os diques aumentam a anisotropia do meio, mas normalmente não interrompem a continuidade das superfícies piezométricas e em certos casos os diques, aonde as zonas fissuradas associadas, constituem áreas com uma maior permeabilidade. A hidrogeoquímica das formações vulcânicas apresenta características peculiares que têm grande interesse para o estudo do movimento e comportamento da água subterrânea; os dados existentes em maciços antigos parecem indicar uma mobilidade de água bastante reduzida. Também os métodos de reconhecimento apresentam algumas particularidades que se devem ter em conta. O modo de captação da água subterrânea através de galerias e furos é muito característico em várias regiões do mundo. Em algumas regiões, como Hawai, Decan (Índia) e Canárias foram realizados trabalhos de grande valor científico. Ao se debruçar sobre os problemas dos recursos hídricos em ilhas vulcânicas é aconselhável abordar os seguintes temas:
- Formações vulcânicas de interesse hidrogeológico. - Alteração, fissuração e erosão dos materiais vulcânicos. - Problemas da cartografia geológica com fins geohidrológicos nos materiais vulcânicos. - Heterogenidade e anisotropia das formações vulcânicas. - Porosidade total e porosidade eficaz. - Permeabilidade, transmissividade e caudal específico dos furos nos materiais
vulcânicos. - Existência e características de um nível de saturação regional. - Papel geohidrológico dos diques. - Caracterização hidráulica de um meio vulcânico saturado. - Análise dos rebaixamentos em ensaios de bombagem em rochas vulcânicas. - Evolução dos caudais e ensaios nas galerias em terrenos vulcânicos. - Considerações gerais sobre hidrogeoquímica das formações vulcânicas. - Processo de mineralização das águas de terrenos vulcânicos. - A composição catiónica da água do meio saturado em materiais vulcânicos. - Aplicações das variações isotópicas do oxigénio e do hidrogénio no estudo das águas
subterrâneas. - Aspectos das relações água doce / água salgada nas regiões costeiras. - Contaminação de aquíferos costeiros. - Exploração da água subterrânea em terrenos vulcânicos. - Captação de águas subterrâneas em terrenos vulcânicos. - Aspectos das relações água superficial / água subterrânea. - Balanço hídrico em ilhas e terrenos vulcânicos.
1.1.Exemplo da Ilha de Santiago 1.1.1.Caracterização Hidrogeológica e de Recursos Hídricos
Desde 1968 que o arquipélago de Cabo Verde tem sofrido duramente os efeitos de uma prolongada seca, o que esteve na origem da solicitação feita pelo Centro de Estudos de Cabo Verde à empresa
6º SILUSBA – Simpósio de Hidráulica e Recursos Hídricos dos Países de Língua Oficial Portuguesa
710
francesa especializada em águas subterrâneas, BURGEAP, em Junho de 1969, a realização de uma missão de reconhecimento em quatro ilhas (Santiago, Fogo, Boavista e S. Nicolau). A referida missão teve a duração de cinco semanas, tendo levado a BURGEAP à conclusão da existência de recursos hídricos em quantidade suficiente que justificasse a realização de um programa de trabalhos de reconhecimento durante dois anos, compreendendo a prospecção geofísica e perfuração (realização de furos) nas ilhas de Santiago, Fogo, Boavista e S. Nicolau. Com o suporte deste estudo preliminar a Inspecção Geral de Minas do Ministério do Ultramar decidiu estabelecer um contrato de trabalho com a BURGEAP, para prestação de serviços da sua especialidade integrados num programa de acção. Assim, foi criada a Brigada de Águas Subterrâneas de Cabo Verde em Setembro de 1971 dotada de meios humanos, materiais e financeiros para a execução dos trabalhos programados. Á BURGEAP foi confiado o papel de conselheiro técnico da Brigada de Águas Subterrâneas de Cabo Verde, enquanto que à Companhia Geral de Geofísica foi confiada a execução de uma missão de prospecção eléctrica de seis meses. Esses trabalhos hidrogeológicos estenderam-se de Setembro de 1971 a Dezembro de 1973, devendo-se destacar que as primeiras perfurações foram realizadas na ilha de Santiago em Fevereiro de 1972. Como resultado desses trabalhos foi possível estabelecer as Características Hidrogeológicas e de Recursos Hídricos da ilha de Santiago e de propor um conjunto de acções a serem implementadas. 1.1.2.As Unidades Hidrogeológicas Com a Independência Nacional, em Julho de 1975, o Governo Caboverdiano determinou como prioridade das prioridades, o problema dos recursos hídricos. Nesse contexto e, por solicitação do Governo Caboverdiano, uma equipa das Nações Unidas (PNUD) especializada no domínio das águas subterrâneas chegou a Cabo Verde, em Julho de 1975, integrada no Projecto CVI 1975 – 1979 e constituiu a primeira fase de uma vasta operação das Nações Unidas em Cabo Verde, tendo ajudado imenso na elaboração de uma política de água no País. Os trabalhos foram concentrados nas ilhas de Santiago, Maio, S. Vicente, Boavista e Sal, nomeadamente perfuração, equipamento de furos, totalizando cerca de 200 furos realizados e 62 equipados. Outros projectos das Nações Unidas sucederam ao citado projecto PNUD CVI 1975 – 1979. Gestores nacionais que acompanharam os trabalhos realizados pela BURGEAP e pelas Nações Unidas tornaram-se nos verdadeiros seguidores dos excelentes trabalhos realizados em Cabo Verde pela BURGEAP e pelas Nações Unidas, devendo-se afirmar que o País tem-se beneficiado enormemente do conhecimento da problemática hídrica caboverdiana. Com o suporte da Sequência Vulcano-Estratigráfica estabelecida por António Serralheiro e apoiado pelo resultado dos trabalhos de Hidrogeologia realizados na ilha de Santiago há dezenas de anos, (desde finais do ano de 1971 até à presente data), foi possível estabelecer a Sequência Hidrogeológica para a ilha de Santiago, integrada pelas Séries de Base, Intermediária e Recente. 3. Série Recente – Quaternário, constituída pela Formação do Monte das Vacas que é formada por cones de material piroclástico com algumas escoadas lávicas associadas, e muito permeável. Por isso, não permite a retenção das águas que se infiltram, priveligiadamente, em direcção ao aquífero principal. 2. Série Intermediária – Mio – Pliocénico, constituída pelo Complexo Eruptivo do Pico da Antónia, que é formada por mantos basálticos subaéreos com material piroclástico intercalado e mantos basálticos submarinos, formando um empilhamento de maior espessura e de maior extensão da Ilha de Santiago. Apresenta uma permeabilidade bastante superior à da Série de Base.

6º SILUSBA – Simpósio de Hidráulica e Recursos Hídricos dos Países de Língua Oficial Portuguesa
711
Constitui, sem dúvida, o aquífero principal da Ilha. Também se inclui nesta Série a Formação da Assomada. 1. Série de Base – Ante – Miocénico, constituída pelo Complexo Eruptivo Interno Antigo, Formação dos Flamengos e da Formação Conglomerático – Brechóide. Esta série apresenta-se muito compacta e, por conseguinte, pouco permeável. 1.1.2. Ensinamentos recolhidos dos trabalhos realizados (Experiências de Cabo Verde) Não há dúvida alguma que os trabalhos no domínio das águas subterrâneas realizados pela BURGEAP e pelo PNUD, muito bem acompanhados pelos gestores de água na República de Cabo Verde dão ao País a garantia da continuidade de se velar com eficácia pela problemática da água subterrânea. Infelizmente, a exploração das águas tem sido, praticamente, à custa dos recursos subterrâneos, enquanto que os recursos superficiais vêm-se perdendo no mar ao longo dos anos de crise (desde 1968), devido à inexistência de dispositivos de retenção (barragens), de recarga artificial, de espraiamento, entre outros. Tem-se constatado, por isso, indícios de salinização nalgumas zonas costeiras, casos da Ribeira Seca e Ribeira Achada Baleia, assim como rebaixamento pronunciado do nível freático nalgumas zonas interiores, como por exemplo na Ribeira Seca. Esses casos podem querer assinalar uma sobre-exploração ou/e um controlo hidrogeológico não adequado às circunstâncias.
6º SILUSBA – Simpósio de Hidráulica e Recursos Hídricos dos Países de Língua Oficial Portuguesa
712
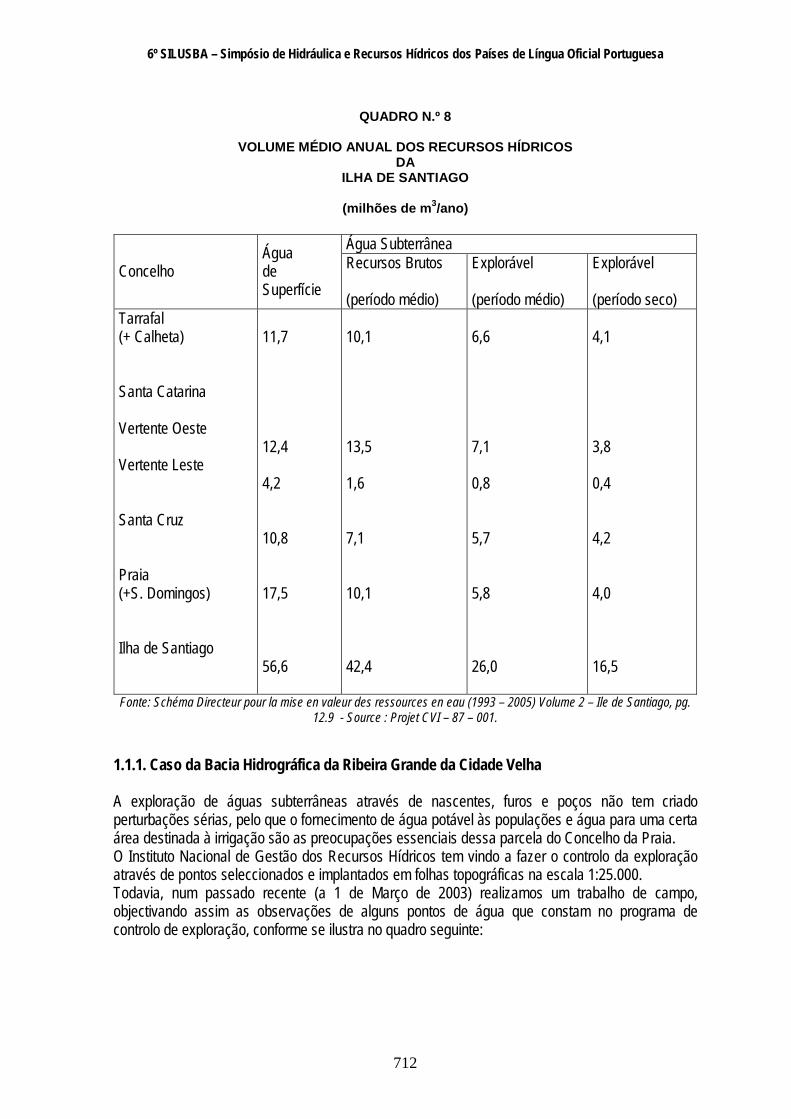
QUADRO N.º 8
VOLUME MÉDIO ANUAL DOS RECURSOS HÍDRICOS
DA ILHA DE SANTIAGO
(milhões de m3/ano)
Água Subterrânea
Concelho Água de Superfície
Recursos Brutos (período médio)
Explorável (período médio)
Explorável (período seco)
Tarrafal (+ Calheta) Santa Catarina Vertente Oeste Vertente Leste Santa Cruz Praia (+S. Domingos) Ilha de Santiago
11,7 12,4 4,2 10,8 17,5 56,6
10,1 13,5 1,6 7,1 10,1 42,4
6,6 7,1 0,8 5,7 5,8 26,0
4,1 3,8 0,4 4,2 4,0 16,5
Fonte: Schéma Directeur pour la mise en valeur des ressources en eau (1993 – 2005) Volume 2 – Ile de Santiago, pg. 12.9 - Source : Projet CVI – 87 – 001.
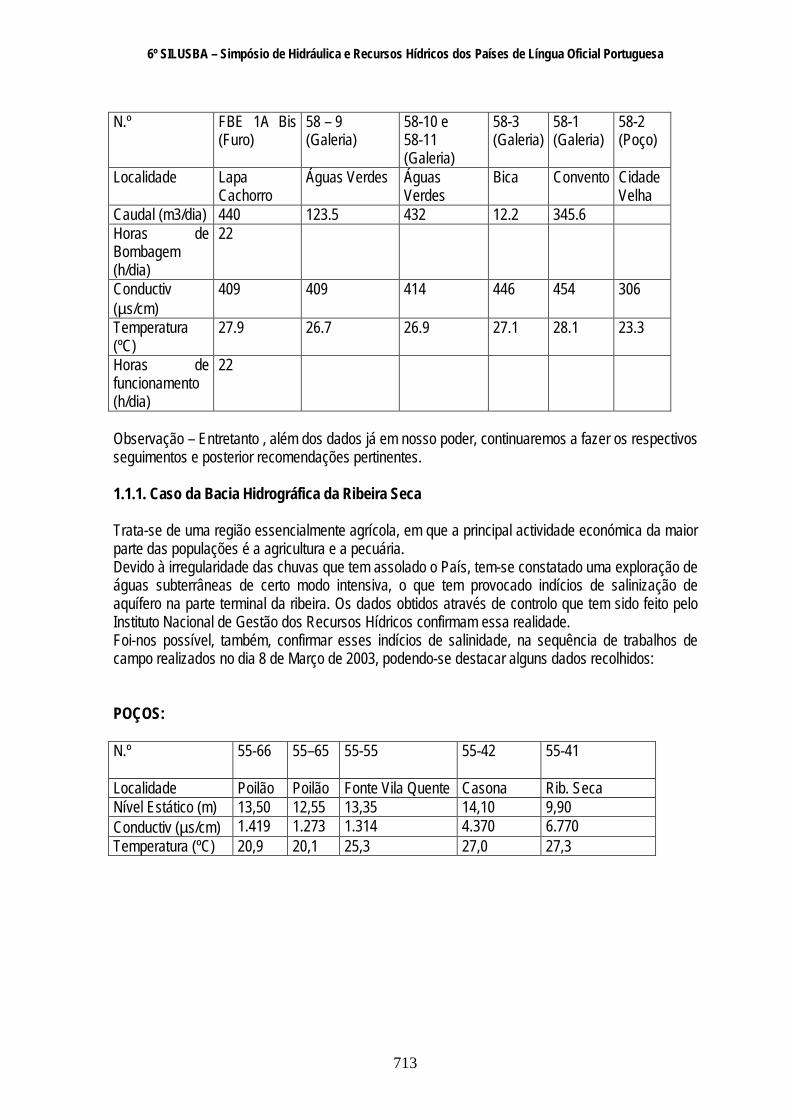
1.1.1. Caso da Bacia Hidrográfica da Ribeira Grande da Cidade Velha A exploração de águas subterrâneas através de nascentes, furos e poços não tem criado perturbações sérias, pelo que o fornecimento de água potável às populações e água para uma certa área destinada à irrigação são as preocupações essenciais dessa parcela do Concelho da Praia. O Instituto Nacional de Gestão dos Recursos Hídricos tem vindo a fazer o controlo da exploração através de pontos seleccionados e implantados em folhas topográficas na escala 1:25.000. Todavia, num passado recente (a 1 de Março de 2003) realizamos um trabalho de campo, objectivando assim as observações de alguns pontos de água que constam no programa de controlo de exploração, conforme se ilustra no quadro seguinte:
6º SILUSBA – Simpósio de Hidráulica e Recursos Hídricos dos Países de Língua Oficial Portuguesa
713
N.º FBE 1A Bis
(Furo) 58 – 9 (Galeria)
58-10 e 58-11 (Galeria)
58-3 (Galeria)
58-1 (Galeria)
58-2 (Poço)
Localidade Lapa Cachorro
Águas Verdes Águas Verdes
Bica Convento Cidade Velha
Caudal (m3/dia) 440 123.5 432 12.2 345.6 Horas de Bombagem (h/dia)
22
Conductiv (µs/cm)
409 409 414 446 454 306
Temperatura (ºC)
27.9 26.7 26.9 27.1 28.1 23.3
Horas de funcionamento (h/dia)
22
Observação – Entretanto , além dos dados já em nosso poder, continuaremos a fazer os respectivos seguimentos e posterior recomendações pertinentes. 1.1.1. Caso da Bacia Hidrográfica da Ribeira Seca Trata-se de uma região essencialmente agrícola, em que a principal actividade económica da maior parte das populações é a agricultura e a pecuária. Devido à irregularidade das chuvas que tem assolado o País, tem-se constatado uma exploração de águas subterrâneas de certo modo intensiva, o que tem provocado indícios de salinização de aquífero na parte terminal da ribeira. Os dados obtidos através de controlo que tem sido feito pelo Instituto Nacional de Gestão dos Recursos Hídricos confirmam essa realidade. Foi-nos possível, também, confirmar esses indícios de salinidade, na sequência de trabalhos de campo realizados no dia 8 de Março de 2003, podendo-se destacar alguns dados recolhidos: POÇOS: N.º 55-66
55–65
55-55
55-42
55-41
Localidade Poilão Poilão Fonte Vila Quente Casona Rib. Seca Nível Estático (m) 13,50 12,55 13,35 14,10 9,90 Conductiv (µs/cm) 1.419 1.273 1.314 4.370 6.770 Temperatura (ºC) 20,9 20,1 25,3 27,0 27,3
6º SILUSBA – Simpósio de Hidráulica e Recursos Hídricos dos Países de Língua Oficial Portuguesa
714
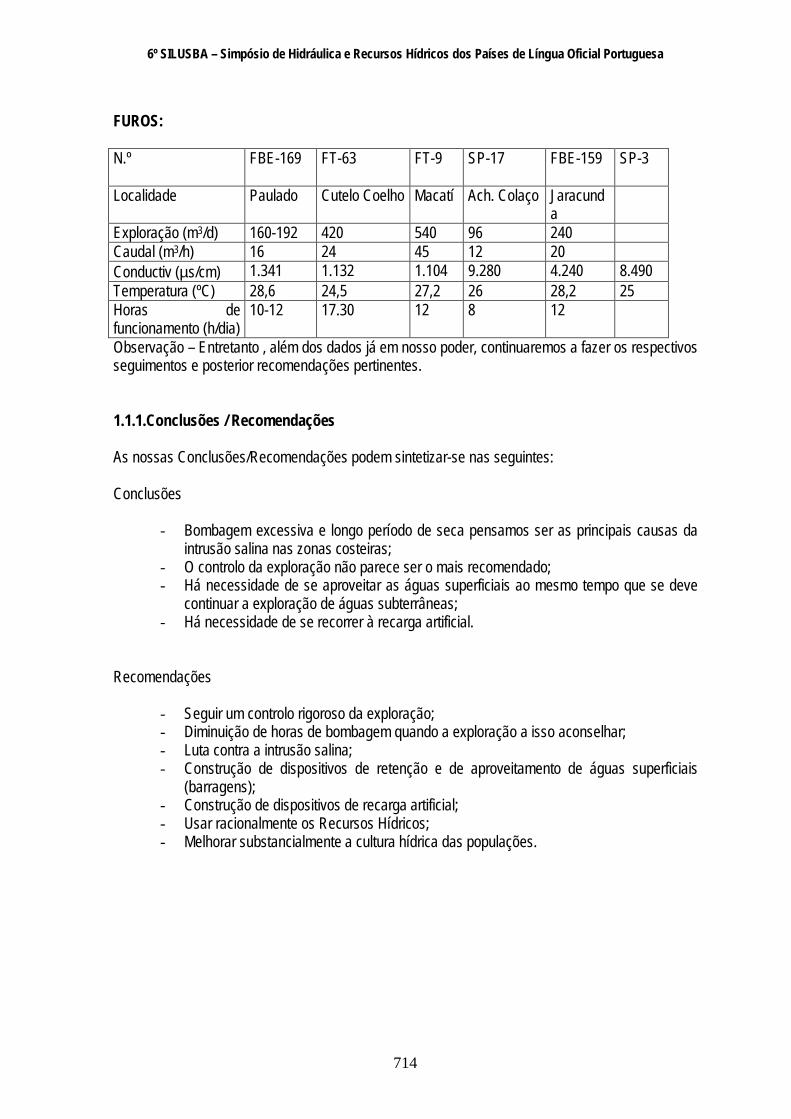
FUROS: N.º FBE-169
FT-63
FT-9
SP-17
FBE-159
SP-3
Localidade Paulado Cutelo Coelho Macatí Ach. Colaço Jaracunda
Exploração (m3/d) 160-192 420 540 96 240 Caudal (m3/h) 16 24 45 12 20 Conductiv (µs/cm) 1.341 1.132 1.104 9.280 4.240 8.490 Temperatura (ºC) 28,6 24,5 27,2 26 28,2 25 Horas de funcionamento (h/dia)
10-12 17.30 12 8 12
Observação – Entretanto , além dos dados já em nosso poder, continuaremos a fazer os respectivos seguimentos e posterior recomendações pertinentes. 1.1.1.Conclusões / Recomendações As nossas Conclusões/Recomendações podem sintetizar-se nas seguintes: Conclusões
- Bombagem excessiva e longo período de seca pensamos ser as principais causas da intrusão salina nas zonas costeiras;
- O controlo da exploração não parece ser o mais recomendado; - Há necessidade de se aproveitar as águas superficiais ao mesmo tempo que se deve
continuar a exploração de águas subterrâneas; - Há necessidade de se recorrer à recarga artificial.
Recomendações
- Seguir um controlo rigoroso da exploração; - Diminuição de horas de bombagem quando a exploração a isso aconselhar; - Luta contra a intrusão salina; - Construção de dispositivos de retenção e de aproveitamento de águas superficiais
(barragens); - Construção de dispositivos de recarga artificial; - Usar racionalmente os Recursos Hídricos; - Melhorar substancialmente a cultura hídrica das populações.

6º SILUSBA – Simpósio de Hidráulica e Recursos Hídricos dos Países de Língua Oficial Portuguesa
715
BIBLIOGRAFIA
AGÊNCIA JAPONESA DE COOPERAÇÃO INTERNACIONAL E INSTITUTO NACIONAL DE GESTÃO DE RECURSOS HÍDRICOS DE CABO VERDE – Estudo sobre o desenvolvimento da água subterrânea na ilha de Santiago da República de Cabo Verde – Relatório Final, 1999.
AMARAL, Ilídio do – Santiago de Cabo Verde – A Terra e os Homens, 1964.
BEBIANO, J. Bacelar – A Geologia do Arquipélago de Cabo Verde, 1932.
BURGEAP – La mise en valeur des eaux souterraines dans l’archipel du Cap Vert -Rapport de fin de mission, 1974.
CASTANY, G. – Prospection et exploitation des eaux souterraines, 1968.
CUSTÓDIO, Emílio - Hidrogeologia de las Rocas Volcanicas, 1975.
CUSTÓDIO, E. e LLAMAS, M. R. – Hidrologia Subterrânea, Tomo I, 1975.
CUSTÓDIO, E. e LLAMAS, M. R. – Hidrologia Subterrânea, Tomo II, 1975.
MARQUES, Manuel Monteiro – Caracterização das grandes unidades geomorfológicas da ilha de Santiago (República de Cabo Verde), 1990.
MOTA GOMES, Alberto – A Hidrogeologia de Santiago, 1980.
PNUD – Recherche et mise en valeur des eaux souterraines. Rapport terminal du Project CVI/75/001-BCT/PNUD, 1980.
PNUD/INGRH – Esquema Director dos Recursos Hídricos, 1993.
SERRALHEIRO, António – A Geologia da Ilha de Santiago (Cabo Verde), 1976.

6º SILUSBA – Simpósio de Hidráulica e Recursos Hídricos dos Países de Língua Oficial Portuguesa
716

6º SILUSBA – Simpósio de Hidráulica e Recursos Hídricos dos Países de Língua Oficial Portuguesa
717
INTERNATIONAL POST-GRADUATE COURSE ON HYDROLOGY
WITH SPECIAL REGARD TO IWRM
34TH COURSE
WATER RESOURCES MANAGEMENT IN TARRAFAL (SANTIAGO
ISLAND, CAPE VERDE) - FUTURE ISSUES -
By
Marize Gominho
Cape Verde
Water Resources Research Centre
Budapest, Hungary
2003
6º SILUSBA – Simpósio de Hidráulica e Recursos Hídricos dos Países de Língua Oficial Portuguesa
718
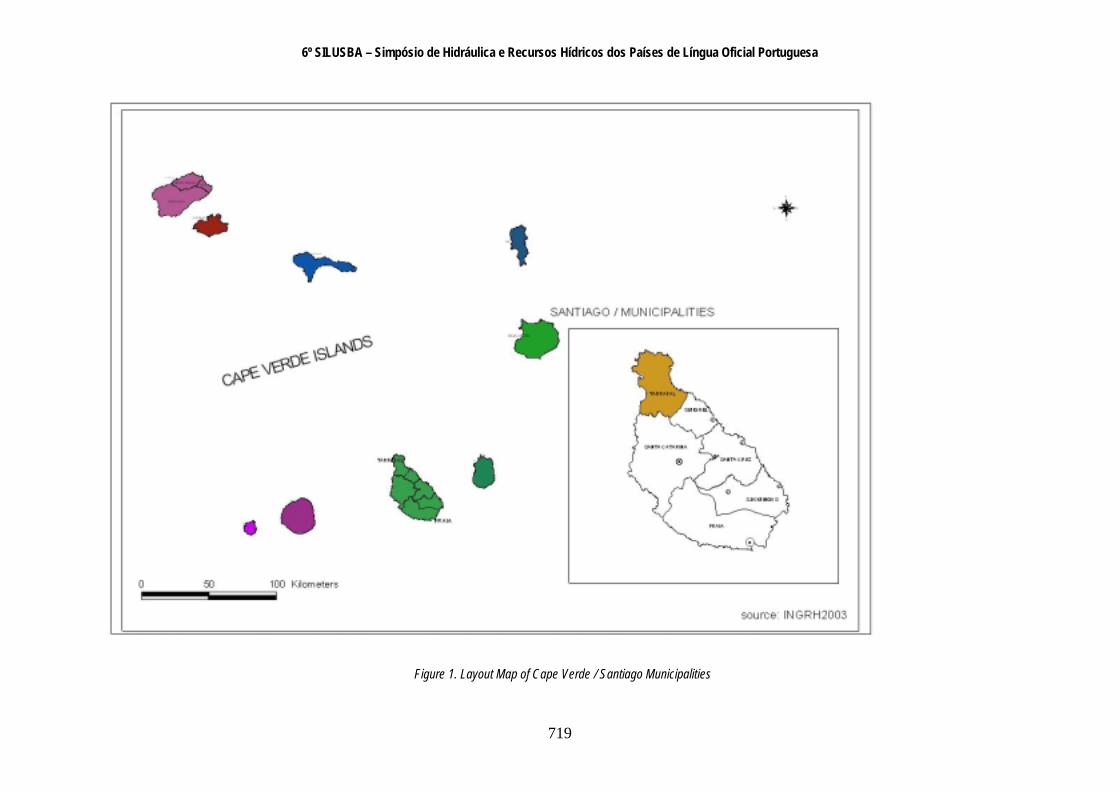
1. OBJECTIVE The republic of Cape Verde is an island situated at 500Km of West Africa. It comprises 10 volcanic island, 9 of which are inhabited with an estimation population of 434.625 (Figure 1.). The total area of the 10 islands is 4.033 Km2 and they belong to the dry sahelian climatic zone where the annual precipitation is very limited and the rainy period is very short (from August to October). The drinking water supply of the population is a basic task of the close future. The crop production, which gives some fundamental job possibility for approximately one half of the population, would need irrigation under this climatic condition. The tourism, which can be considered as an expanding and economically promising sector in the future, needs stable water supply. Therefore the availability of the water is an essential factor in the development of both the human life standard and the economy. Perennial river is very rare, even during the rainy season, surface water flow is observed from only a few hours in major rivers after heavy rain, as the island steep volcanic features facilitate rapid runoff and infiltration. In addition, the general requirements of the sustainable use of groundwater resources (i.e. no overexploitation) make the water management very difficult and with the actual conditions intermittent shortage in water for domestic use and irrigation appear, in some part of Santiago Island. The objective of this study is to evaluate the basic conditions of water resources management until 2010 by analysing with strategic approach the expected demand, the available water resources and the possible measures in a study area. The Tarrafal region is the northern part of Santiago Island (the biggest island, where Praia, the capital city is located). The estimated population is 20.000, while the town itself in the coastal area accounts 6.000 inhabitants. 1. SOCIO-ECONOMIC CONDITION 1.1. Socio-Economic Situation of Cape Verde Praia, the national capital, is located in Santiago island where one fourth the population lives. Other major islands are Santo Antão, São Vicente and Sal. Santo Antão has the highest rainfall and is therefore the most forested island. It also holds the second largest population nation-wide. Only one tenth of the country’s land is arable which implies a high population density (~800 person per Km2) if the arable land is considered as a base. The sahelian climate with its prolonged periods of drought, limited amount of fresh water resources, and a high natural population growth rate of 2,7% implicate intolerable pressure on the fragile alimentation of the country. Even in years when rainfall is abundant, the country can produce only 50 to 60% of its food requirements. The poor natural resources, particularly with respect to fresh water, and absence of mineral resources base have led to high rates of immigration. As a result, twice as many Capeverdian live abroad.
6º SILUSBA – Simpósio de Hidráulica e Recursos Hídricos dos Países de Língua Oficial Portuguesa
719
Figure 1. Layout Map of Cape Verde / Santiago Municipalities
6º SILUSBA – Simpósio de Hidráulica e Recursos Hídricos dos Países de Língua Oficial Portuguesa
720
Cape Verde is divided into 14 municipalities. Santiago island comprises of 6 municipalities, Praia, São Domingos, Santa Catarina, Tarrafal, São Miguel, and Santa Cruz (Figure1.). The coverage area and the population distribution in Santiago per municipality are shown in Table 1.
Table 1. Area and population in Santiago
Municipality Area (Km2)
Population 2002
Tarrafal S. Miguel S. Catarina S. Cruz S.Domingos Praia
123 76 274 146 142 244
19.168 16.437 51.841 34.223 13.523 112.735
Total 1005 247.927 Source: National Institute of Statistics 2002
In spite of the country’s many handicaps, the economy has grown steadily since its independence (5 July 1975) as a result of continued efforts of the population, influx of official foreign aid, and substantial remittance from emigrants. Based on the data supplied by the National Bank in Cape Verde the Gross Domestic Product (GDP) has increased from US$ 1.126 in 1997 to US$ 2.000 in 2002 per capita. The economy has been traditionally based on services. The service sector accounts for 74% of the GDP (commerce, transport, and public service), manufacturing industry occupies 15%, agriculture 8%, and tourism only 3%. Although services account for the largest share in GDP, the economy of Cape Verde remains oriented towards agriculture and fishing, since the agriculture employ 53% of the country’s labour force. The majority of the country’s export consists of agricultural products such as banana, and some processed products like frozen and canned fish. The arable land in Cape Verde is estimated at about 41.090ha (source Agriculture Statistics Ministry of Agriculture, Food and Environment 1997). Nearly 97% are rain feed. The majority of the farmers cultivate maize and beans. The tourism shows clear increasing tendency. The number of the tourists was 145 thousand in 2000, while 163 thousand in 2001. Beside the immigrants the “real” foreign visitors are more and more interested to spend their holiday in one of the islands. The most frequented island is Sal and the second one is Santiago. The international airport is located in Sal, the construction of a new international airport in Praia is in its final stage. 1.1. Specialities of the Tarrafal Region Each municipality is an autonomous body. Hence each municipality has a different administrative system. A municipality is a small administrative unit. It consists of a Municipal council and an administrative body called Camara Municipal. One of the municipalities is our study area: Tarrafal. Major economic activities are intensive agriculture, forestry, livestock, hunting, fishing and construction. Some women are engaged in small scale trading e.g. selling fish, firewood, sand among others means for survival. According to the 2002 census, 33% of the labour force in Tarrafal practice agriculture, manufacturing 3%, construction 28%, commerce 10%, service 13% and others 13%. Comparing Tarrafal with the other municipalities in Santiago, it is a clear sign of development, that the municipality of Tarrafal is first ranked in the construction sector. The difference from other municipalities is also marked by the fact, that relatively less people are involved in the traditional sectors (agriculture and manufacturing) than the country’s average. But the migration from Tarrafal mostly to Portugal is still very strong. The arable land in Tarrafal is estimated at 6.000 ha in 1990. The dominating crops are maize and beans in the rainy season, and different kinds of vegetables are produced during the whole year in the irrigated areas.

6º SILUSBA – Simpósio de Hidráulica e Recursos Hídricos dos Países de Língua Oficial Portuguesa
721
A tropical paradise with beaches with white sand and clean water and some palm trees, Tarrafal is approximately 70Km from the capital city, Praia. It is a natural tourist instance, with several hotels. In this town one can find some historical places as well. Nowadays most of the tourists come from European countries such as Germany, Italy and Portugal. According to the National Institute of Statistics, in 2002, 28.196 tourist visited Santiago Island, and the majority went to Tarrafal. Cape Verde is a country with 365 days of sunshine, with an average temperature of 25 0C. Therefore, the tourist season is constant all year long. The basic sanitation facilities are very poor, especially in the rural areas. The population of the 20 villages in Tarrafal region is served by a health center located in the town of Tarrafal. A big step in the development of public service was the construction of a pipeline system for healthy drinking water supply, and the recently finished sewage water treatment plant. However, the majority of the houses use septic tanks. 3. Water RESOURCES MANAGEMENT 3.1. National Policy on Water Supply According to the Water Act of Rep. Of Cape Verde (adopted in 1984) and its principal decrees for application (promulgated in 1985 and 1997) water in all its forms is a national asset, which should be developed and managed by a central administrative unit. The National Water Council (CNAG), an inter-ministerial institution presided by the Ministry of Agriculture, Food and Environment, is responsible for the management of water resources in the country. The executive organ of CNAG is the National Institute for Water Resources Management (INGRH). The Master Plan for Water Resources (1993-2005) of Cape Verde, prepared in 1993, stipulates that the government’s objectives for the sector of drinking water supply are to provide safe and stable drinking water for the whole population by 2005, as well as to restore infrastructures and improve the technical and financial state of water supply systems. With regard to specific consumption, the Master Plan targets 50l/cap/day, and the distribution points shouldn’t be further than 1000m from house. In order to attain these objectives, the government is actively implementing projects with special emphasis on drinking water supply and sanitation. There is no plan available for the satisfaction of the likely increasing demand related to tourism. To optimise the use of the scarce water resources and to increase the irrigable area, the introduction of modern and sound irrigation technology has also high priority. Since water resources are very limited, considerable investigations were and are carried out on the development of all possible resources and water supply alternatives: sea water desalinisation, surface water storage through construction of dams, rainwater collection and storage in reservoir, groundwater exploitation by shallow and deep wells, groundwater recharge enhancement, and spring water abstraction by “�alleria”. 3.2. Organisations Related to Water Resources Management The organisation in the sector of water supply in Cape Verde and their functions are as follows:
6º SILUSBA – Simpósio de Hidráulica e Recursos Hídricos dos Países de Língua Oficial Portuguesa
722
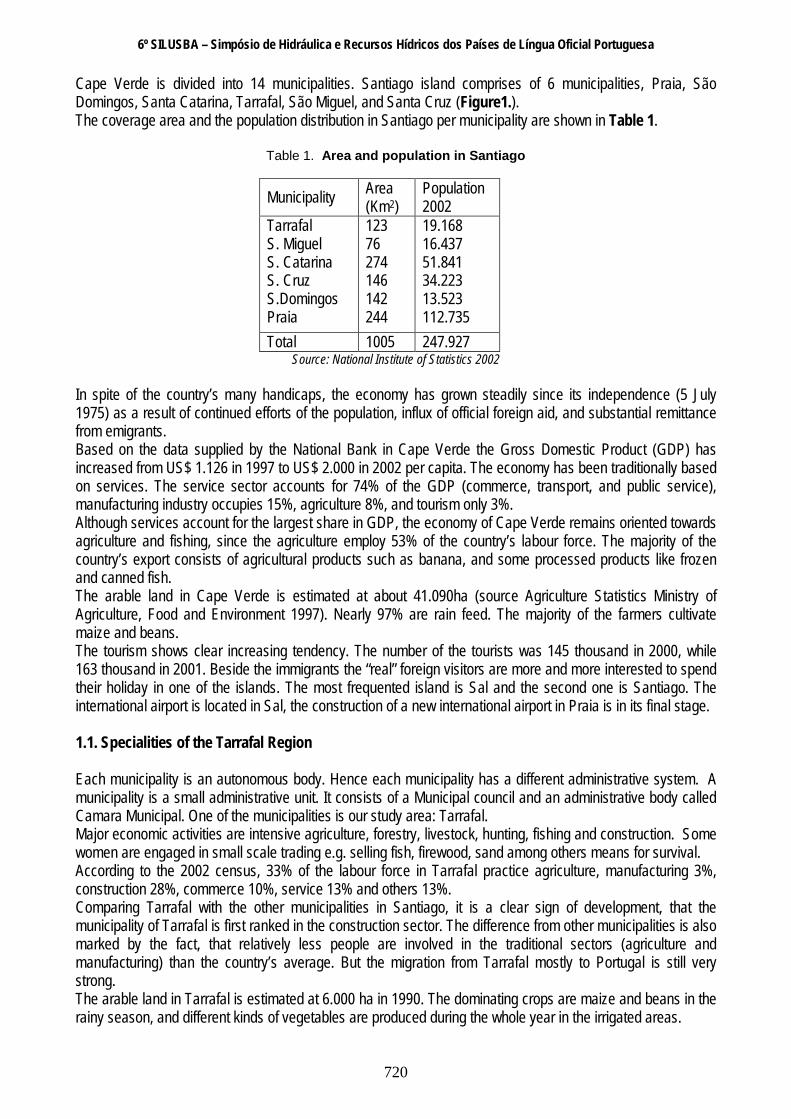
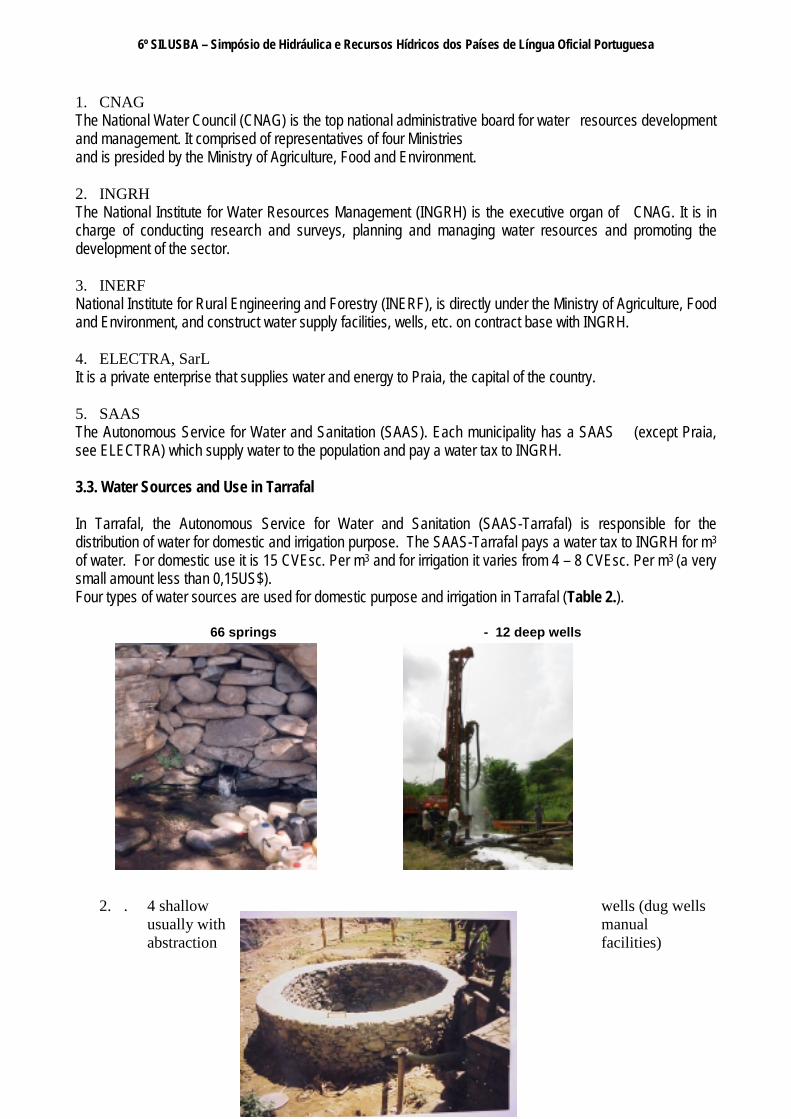
1. CNAG The National Water Council (CNAG) is the top national administrative board for water resources development and management. It comprised of representatives of four Ministries and is presided by the Ministry of Agriculture, Food and Environment. 2. INGRH The National Institute for Water Resources Management (INGRH) is the executive organ of CNAG. It is in charge of conducting research and surveys, planning and managing water resources and promoting the development of the sector. 3. INERF National Institute for Rural Engineering and Forestry (INERF), is directly under the Ministry of Agriculture, Food and Environment, and construct water supply facilities, wells, etc. on contract base with INGRH. 4. ELECTRA, SarL It is a private enterprise that supplies water and energy to Praia, the capital of the country. 5. SAAS The Autonomous Service for Water and Sanitation (SAAS). Each municipality has a SAAS (except Praia, see ELECTRA) which supply water to the population and pay a water tax to INGRH. 3.3. Water Sources and Use in Tarrafal In Tarrafal, the Autonomous Service for Water and Sanitation (SAAS-Tarrafal) is responsible for the distribution of water for domestic and irrigation purpose. The SAAS-Tarrafal pays a water tax to INGRH for m3 of water. For domestic use it is 15 CVEsc. Per m3 and for irrigation it varies from 4 – 8 CVEsc. Per m3 (a very small amount less than 0,15US$). Four types of water sources are used for domestic purpose and irrigation in Tarrafal (Table 2.).
66 springs - 12 deep wells
2.�. 4 shallow wells (dug wells
usually with manual abstraction facilities)
6º SILUSBA – Simpósio de Hidráulica e Recursos Hídricos dos Países de Língua Oficial Portuguesa
723
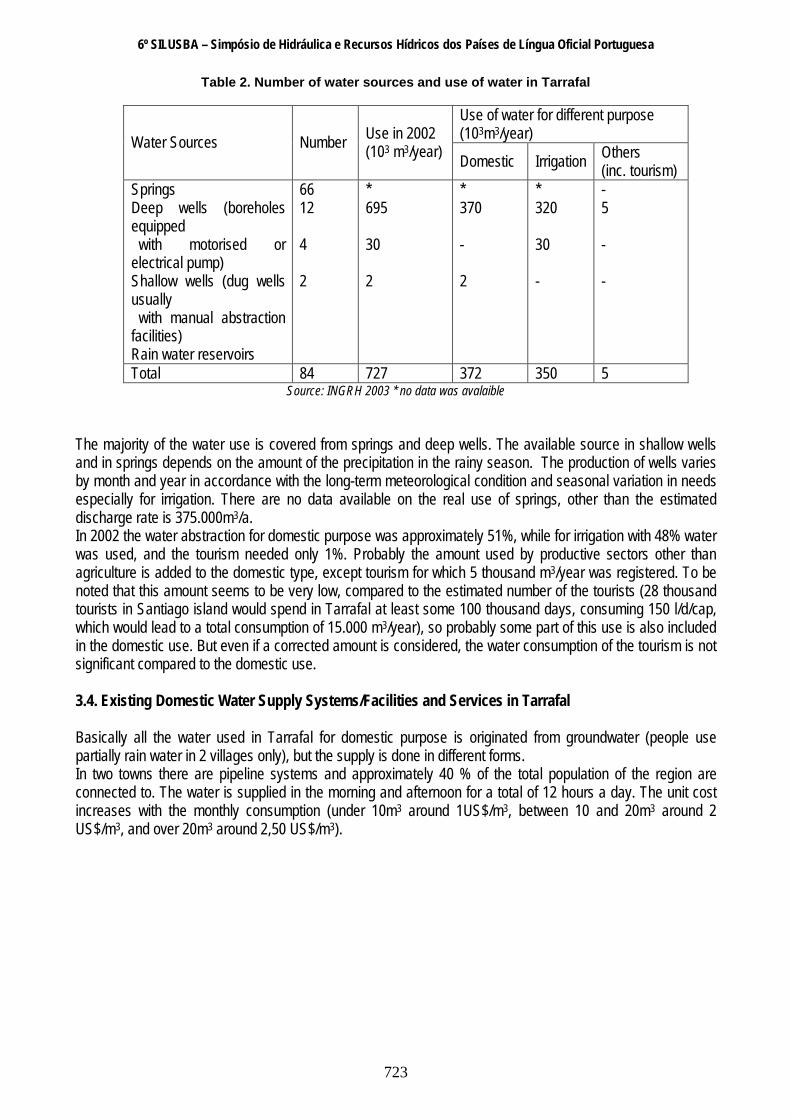
Table 2. Number of water sources and use of water in Tarrafal
Use of water for different purpose (103m3/year) Water Sources Number Use in 2002
(103 m3/year) Domestic Irrigation Others (inc. tourism)
Springs Deep wells (boreholes equipped with motorised or electrical pump) Shallow wells (dug wells usually with manual abstraction facilities) Rain water reservoirs
66 12 4 2
* 695 30 2
* 370 - 2
* 320 30 -
- 5 - -
Total 84 727 372 350 5 Source: INGRH 2003 * no data was avalaible
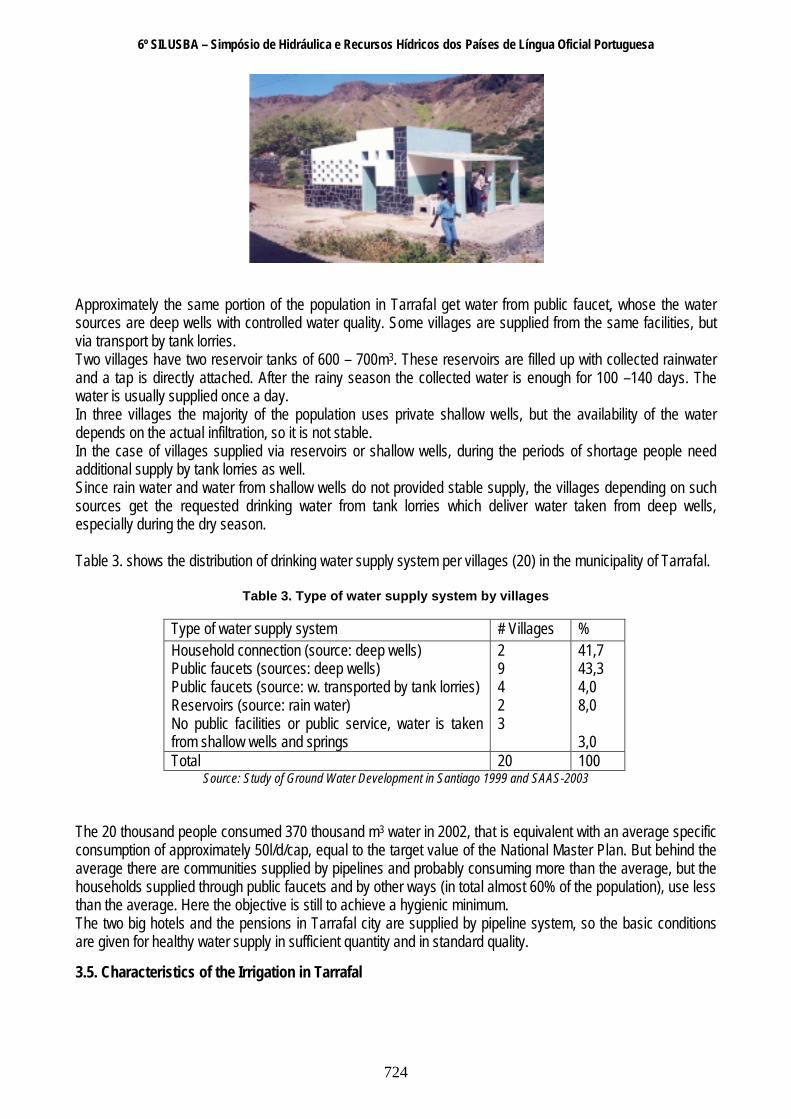
The majority of the water use is covered from springs and deep wells. The available source in shallow wells and in springs depends on the amount of the precipitation in the rainy season. The production of wells varies by month and year in accordance with the long-term meteorological condition and seasonal variation in needs especially for irrigation. There are no data available on the real use of springs, other than the estimated discharge rate is 375.000m3/a. In 2002 the water abstraction for domestic purpose was approximately 51%, while for irrigation with 48% water was used, and the tourism needed only 1%. Probably the amount used by productive sectors other than agriculture is added to the domestic type, except tourism for which 5 thousand m3/year was registered. To be noted that this amount seems to be very low, compared to the estimated number of the tourists (28 thousand tourists in Santiago island would spend in Tarrafal at least some 100 thousand days, consuming 150 l/d/cap, which would lead to a total consumption of 15.000 m3/year), so probably some part of this use is also included in the domestic use. But even if a corrected amount is considered, the water consumption of the tourism is not significant compared to the domestic use. 3.4. Existing Domestic Water Supply Systems/Facilities and Services in Tarrafal Basically all the water used in Tarrafal for domestic purpose is originated from groundwater (people use partially rain water in 2 villages only), but the supply is done in different forms. In two towns there are pipeline systems and approximately 40 % of the total population of the region are connected to. The water is supplied in the morning and afternoon for a total of 12 hours a day. The unit cost increases with the monthly consumption (under 10m3 around 1US$/m3, between 10 and 20m3 around 2 US$/m3, and over 20m3 around 2,50 US$/m3).
6º SILUSBA – Simpósio de Hidráulica e Recursos Hídricos dos Países de Língua Oficial Portuguesa
724
Approximately the same portion of the population in Tarrafal get water from public faucet, whose the water sources are deep wells with controlled water quality. Some villages are supplied from the same facilities, but via transport by tank lorries. Two villages have two reservoir tanks of 600 – 700m3. These reservoirs are filled up with collected rainwater and a tap is directly attached. After the rainy season the collected water is enough for 100 –140 days. The water is usually supplied once a day. In three villages the majority of the population uses private shallow wells, but the availability of the water depends on the actual infiltration, so it is not stable. In the case of villages supplied via reservoirs or shallow wells, during the periods of shortage people need additional supply by tank lorries as well. Since rain water and water from shallow wells do not provided stable supply, the villages depending on such sources get the requested drinking water from tank lorries which deliver water taken from deep wells, especially during the dry season. Table 3. shows the distribution of drinking water supply system per villages (20) in the municipality of Tarrafal.
Table 3. Type of water supply system by villages
Type of water supply system # Villages % Household connection (source: deep wells) Public faucets (sources: deep wells) Public faucets (source: w. transported by tank lorries) Reservoirs (source: rain water) No public facilities or public service, water is taken from shallow wells and springs
2 9 4 2 3
41,7 43,3 4,0 8,0 3,0
Total 20 100 Source: Study of Ground Water Development in Santiago 1999 and SAAS-2003
The 20 thousand people consumed 370 thousand m3 water in 2002, that is equivalent with an average specific consumption of approximately 50l/d/cap, equal to the target value of the National Master Plan. But behind the average there are communities supplied by pipelines and probably consuming more than the average, but the households supplied through public faucets and by other ways (in total almost 60% of the population), use less than the average. Here the objective is still to achieve a hygienic minimum. The two big hotels and the pensions in Tarrafal city are supplied by pipeline system, so the basic conditions are given for healthy water supply in sufficient quantity and in standard quality. 3.5. Characteristics of the Irrigation in Tarrafal

6º SILUSBA – Simpósio de Hidráulica e Recursos Hídricos dos Países de Língua Oficial Portuguesa
725
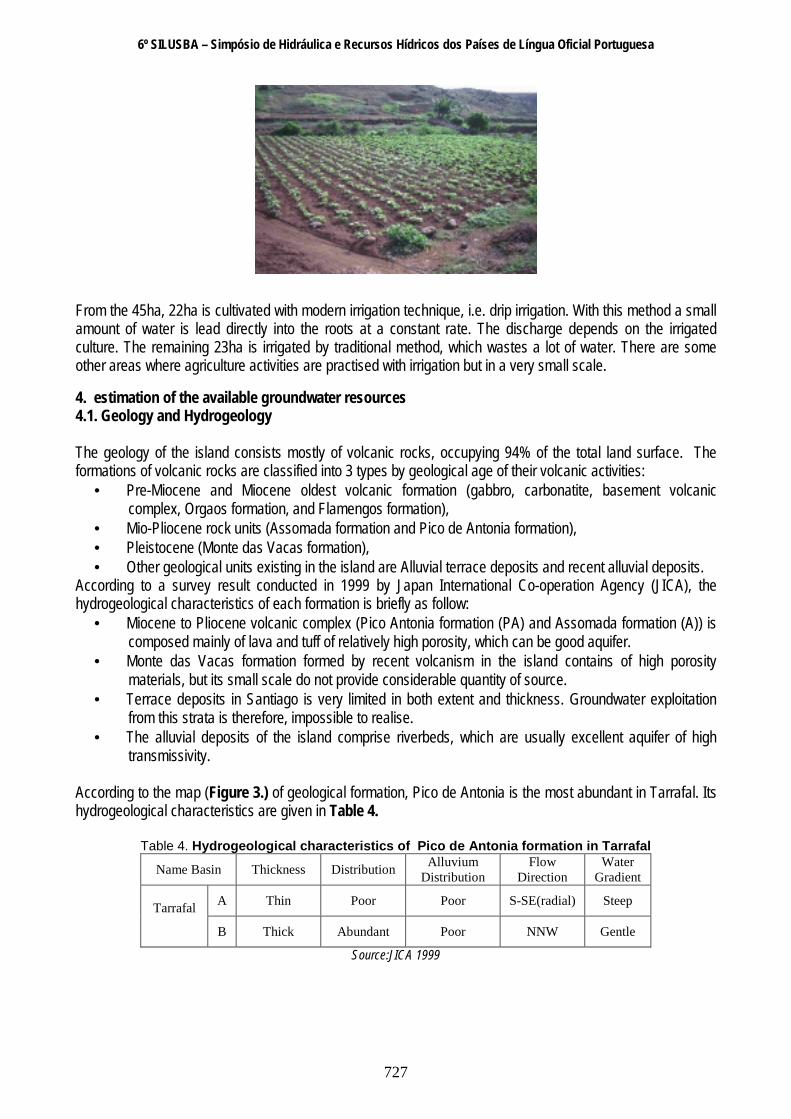
In the area called Chão Bom where most of the irrigated agriculture activities are done, only 45ha is irrigated at the moment: different vegetables such as potatoes, sweet potatoes, carrots, cabbages, lettuce, etc (see Figure 2.) are cultivated all over the year.

6º SILUSBA – Simpósio de Hidráulica e Recursos Hídricos dos Países de Língua Oficial Portuguesa
726
Figure 2. Irrigated Area in Tarrafal
6º SILUSBA – Simpósio de Hidráulica e Recursos Hídricos dos Países de Língua Oficial Portuguesa
727
From the 45ha, 22ha is cultivated with modern irrigation technique, i.e. drip irrigation. With this method a small amount of water is lead directly into the roots at a constant rate. The discharge depends on the irrigated culture. The remaining 23ha is irrigated by traditional method, which wastes a lot of water. There are some other areas where agriculture activities are practised with irrigation but in a very small scale. 4. estimation of the available groundwater resources 4.1. Geology and Hydrogeology The geology of the island consists mostly of volcanic rocks, occupying 94% of the total land surface. The formations of volcanic rocks are classified into 3 types by geological age of their volcanic activities:
• Pre-Miocene and Miocene oldest volcanic formation (gabbro, carbonatite, basement volcanic complex, Orgaos formation, and Flamengos formation),
• Mio-Pliocene rock units (Assomada formation and Pico de Antonia formation), • Pleistocene (Monte das Vacas formation), • Other geological units existing in the island are Alluvial terrace deposits and recent alluvial deposits.
According to a survey result conducted in 1999 by Japan International Co-operation Agency (JICA), the hydrogeological characteristics of each formation is briefly as follow:
• Miocene to Pliocene volcanic complex (Pico Antonia formation (PA) and Assomada formation (A)) is composed mainly of lava and tuff of relatively high porosity, which can be good aquifer.
• Monte das Vacas formation formed by recent volcanism in the island contains of high porosity materials, but its small scale do not provide considerable quantity of source.
• Terrace deposits in Santiago is very limited in both extent and thickness. Groundwater exploitation from this strata is therefore, impossible to realise.
• The alluvial deposits of the island comprise riverbeds, which are usually excellent aquifer of high transmissivity.
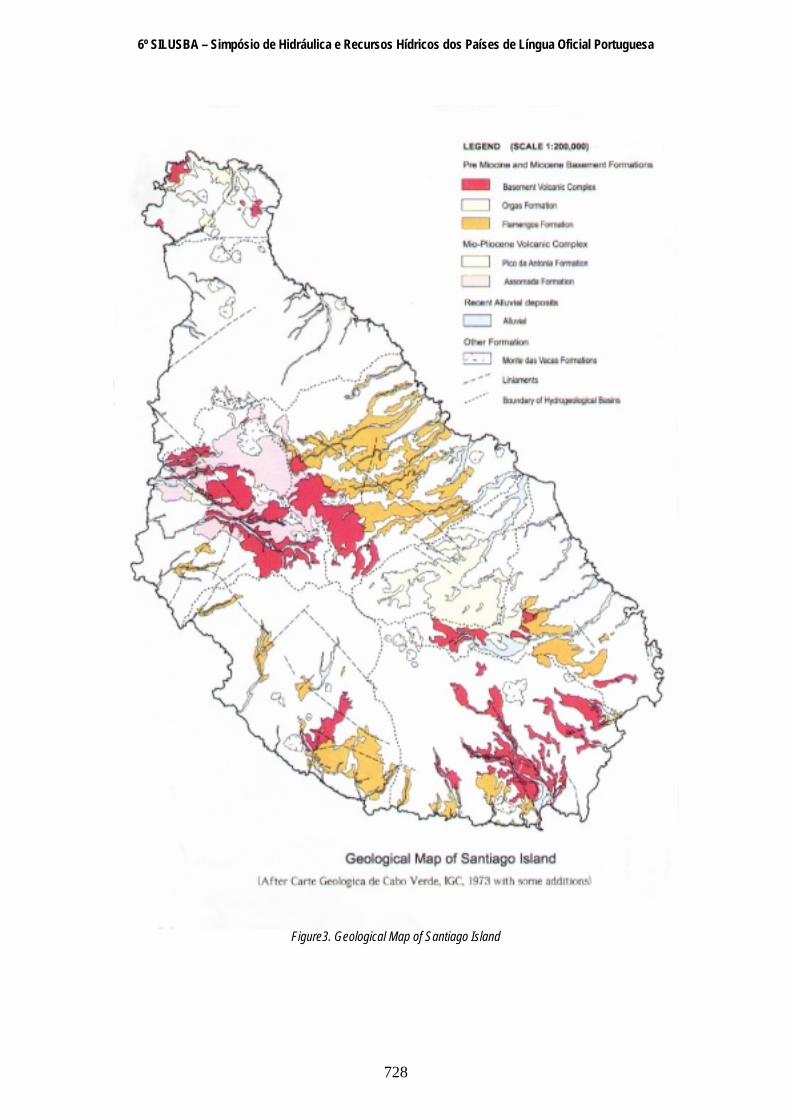
According to the map (Figure 3.) of geological formation, Pico de Antonia is the most abundant in Tarrafal. Its hydrogeological characteristics are given in Table 4.
Table 4. Hydrogeological characteristics of Pico de Antonia formation in Tarrafal
Name Basin Thickness Distribution Alluvium Distribution
Flow Direction
Water Gradient
A Thin Poor Poor S-SE(radial) Steep Tarrafal B Thick Abundant Poor NNW Gentle
Source:JICA 1999
6º SILUSBA – Simpósio de Hidráulica e Recursos Hídricos dos Países de Língua Oficial Portuguesa
728
Figure3. Geological Map of Santiago Island
6º SILUSBA – Simpósio de Hidráulica e Recursos Hídricos dos Países de Língua Oficial Portuguesa
729
4.2. Topography and Hydrology Surface features of Tarrafal are generally volcanic rocks with steep mountain and hilly areas (Figure 4.). There are some flat areas such as the central plateau corresponding to highly eroded mountain and narrow alluvial valleys along rivers or along the coast where agriculture activities is practised. Various studies have been carried out to describe the hydrological characteristics in Cape Verde, such as the BURGEAP project, the CVI/75/0001 project, PNUD/ INGRH “Esquema Director 1992”, and “The Study of Ground Water Development in Santiago” by JICA in 1999. It is important to mention that these studies give quite different results: in the case of surface runoff infiltration the difference can be 100 %. We have based our study on data from the JICA study since it is the most recent and was based on the most reliable database. In this study the Tarrafal catchment area is divided into two parts (see Figure 4.). The applied water balance formula was:
P = ET + SR + I Where the precipitation (P) - as the input source - is equal to the outflow of water by evapotranspiration (ET), surface runoff (SR) and infiltration (I). It is to be mentioned that here the surface runoff (SR) is related to the mouth of the water courses to the sea, thus the amount infiltrated from the riverbed is considered as infiltration (I). In the above mentioned report the evapotranspiration and the infiltration was estimated using empirical formulas, and the surface runoff was calculated from the water balance equation, thus:
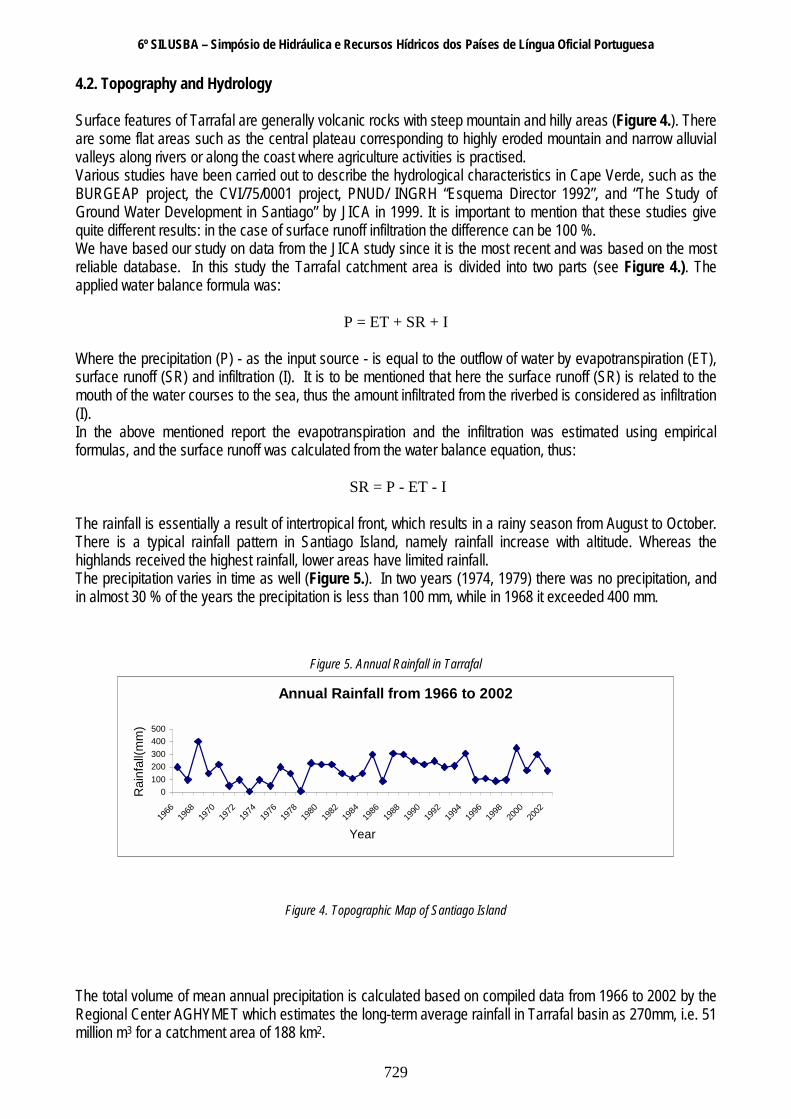
SR = P - ET - I The rainfall is essentially a result of intertropical front, which results in a rainy season from August to October. There is a typical rainfall pattern in Santiago Island, namely rainfall increase with altitude. Whereas the highlands received the highest rainfall, lower areas have limited rainfall. The precipitation varies in time as well (Figure 5.). In two years (1974, 1979) there was no precipitation, and in almost 30 % of the years the precipitation is less than 100 mm, while in 1968 it exceeded 400 mm.
Figure 5. Annual Rainfall in Tarrafal
Annual Rainfall from 1966 to 2002
0100200300400500
1966
1968
1970
1972
1974
1976
1978
1980
1982
1984
1986
1988
1990
1992
1994
1996
1998
2000
2002
Year
Rai
nfal
l(mm
)
Figure 4. Topographic Map of Santiago Island The total volume of mean annual precipitation is calculated based on compiled data from 1966 to 2002 by the Regional Center AGHYMET which estimates the long-term average rainfall in Tarrafal basin as 270mm, i.e. 51 million m3 for a catchment area of 188 km2.

6º SILUSBA – Simpósio de Hidráulica e Recursos Hídricos dos Países de Língua Oficial Portuguesa
730
For the calculation of ET, the Thornthwaite method has been applied. The infiltration has been estimated as a fraction of the precipitation, based on experimental figures adopted in accordance with the surface geology and the slope of the ground surface:
• Basement rocks on the surface = 5% • Aquifer (PA, FL, AL), with slope greater than 20 degrees = 10 %
with slope between 5 - 20 degrees =15% • with slope less than 5 degrees = 20 %.
Table 5. shows the obtained results for the two sub-catchments.
Table 5. Average precipitation, evaporation, infiltration and surface runoff
Hydrological basin
Total area (km2)
Annual average precipitation
Evaporation
Infiltration
Surface runoff
325 98 (30 % of P) 42 (13 % of P)
185 (57 % of P)
Tarrafal(A) mm Vol. million m 3
142,576 46,337 13,972 6,006 26,359
213 107 (50 % of P)
27 (13 % of P) 79 (37 % of P) Tarrafal(B)
mm Vol. million m3
45,306 9,650 4,848 1,214 3,589
Source: JICA 1999 The above estimation can be validated by the observed surface runoff and spring discharges. Data are available only for spring discharges (see in detail below), it is only 5 – 7 % of the infiltration, so there is no contradiction with the above results. The applied method is based on empirical formulas developed for other parts of the world, so the uncertainty is quite high (which is also marked by the considerable differences among results of the different available studies). For the conclusions of our study the estimation of the infiltration is essential. The detailed analysis of the relationship between groundwater abstraction and fluctuation of the groundwater level (see chapter 5) can be helpful in the evaluation. Without groundwater abstraction, there are two main discharge forms of the groundwater: springs and lateral flow into the sea. The locations of those springs are either at the boundary of basement rocks and PA formation or at the intersection of vertical and horizontal joints. The discharge rate in 1998 ranged from 0,2 to 28,2 m3/h. According to the data collected at INGRH, in 1991 162 springs were active (143 in the southern part and 19 in the northern part of the catchment area) with a total discharge of 0,5 million m3/year, while in 1998 only 66 (64 + 2) were active and the discharge also decreased to 0,36 million m3/year. The reason is likely the difference in precipitation: from 1988 until 1995 the precipitation was slightly higher than the average, but from 1996 to 1999 it was considerably lower. The above amounts would reflect the impact of the abstracted groundwater by wells upstream the springs. Except four abstraction sites (total amount is appr. 40.000 m3/year) the wells are located downstream, thus they have no important effect on the natural discharge of the springs. As a conclusion of the above effects, 0,45 million m3 can be considered as “natural” annual average of the spring discharge for further evaluation.
6º SILUSBA – Simpósio de Hidráulica e Recursos Hídricos dos Países de Língua Oficial Portuguesa
731
The not used spring water provides sufficient water in the upper reaches of the river sections for perennial flow. But this surface flow – decreased a little bit by evaporation - infiltrates again in the downstream sections of the river. Thus in undisturbed conditions the final discharge of the groundwater flow system is the sea. The use of groundwater for different purposes modifies this water regime, which should be considered while evaluating the available groundwater resources for human use. 4.3. Available and Free Groundwater Resources The infiltrated water (recharge) can be considered as potential groundwater resource. This approach assure, that not the stored amount of water is used, which is in harmony with the sustainability principle. However, not all recharge can be exploited because of environmental, technical and economical reasons. As part of the environmental requirements, the ecological factor includes the amount of groundwater needed for groundwater dependent aquatic and terrestrial ecosystems. Other aspects related to the water quality protection should also be considered (e.g. pollution sources in the vicinity of the wells or sea water intrusion). To decide about its importance in the study area, the impact of the use of groundwater should be briefly analysed:
• The abstracted groundwater upstream of the springs decreases the discharge of the springs and as a consequences the available flow in the river bed,
• The used spring water will not increase by infiltration the recharge to groundwater,
• The abstracted groundwater will decrease the amount of flow into the sea,
• If the decline of pressure in the vicinity of the coastal area produce lower potential than the sea level, salt water intrusion can occur.
Abstraction of groundwater by wells upstream of the springs or leaving it flowing towards the springs is only a water resources management problem, because there are no special requirements for the rate of the spring discharges (see later, the economical aspects), thus no limitation from environmental point of view exists. Considering, that there are no valuable aquatic ecosystems in the river bed, furthermore there is no surface water use, which could be influenced by the lack of spring discharge and finally the decreasing infiltration from river bed is important only from water resources management point of view (if there is no ecological requirement, the spring discharge and the infiltrated amount from the river bed and abstracted downstream by wells is the same resource only the form of abstraction is different), the spring discharges can be used without limitations from environmental point of view. In order to eliminate the sea water intrusion the flow direction towards the sea should be maintained, thus not all groundwater recharge can be exploited, especially not by wells close to coast. The technical reasons reflect that wells can not be drilled everywhere, therefore not all flowing groundwater to the sea can be abstracted. Usually the cost related to the use of spring waters is smaller than in the case of wells, which need permanent energy-cost for pumping. Thus, abstraction by wells upstream of the springs - if it is technically feasible – should be justified by local need, when the distance from the springs makes the use of the spring water inconvenient and /or expensive. In certain areas even if some development were technically feasible, the potential rate of abstraction would be low and the cost of the construction extremely high, resulting an inefficient abstraction site. Considering the above aspects, the following recommendations can be drown:
• Taking into account the variability of the spring discharges, the potential amount available in dry period (320.000 m3/a in the south-eastern part and 80.000 m3/a in the northern part) can be

6º SILUSBA – Simpósio de Hidráulica e Recursos Hídricos dos Países de Língua Oficial Portuguesa
732
considered as the base. It should be decreased first by the justified abstraction in the upstream region. This value is now around 40.000 m3/a in the south-eastern part and null in the northern part, but would be much more, if the numerous villages in the south-eastern plateau will be supplied by sufficient amount of drinking water in a safe way from deep wells (5.000 people need around 100.000 m3/a, considering 50 l/d/cap as specific demand). Secondly the basic amount should be limited at 70 %, considering that not all small springs can be exploited. Thus, in the south-eastern upper plateau and at its border 100.000 m3/a for abstraction by deep wells, and 150.000 m3/a from springs, while in the northern part of high elevation 50.000 m3/a from springs are available for human purpose.
• There are no data available on the real use of springs.
• In the area of lower elevation the potential resource for exploitation is the total annual average recharge decreased by the abstracted amount (supposing that all the not used spring water will be infiltrated again), which means 5,75 million m3/a for the surrounding of Tarrafal and Montinho, 1,15 million m3/a in the northern part of the region. In order to safely maintain the flow direction towards the sea, and considering that not all water can be economically exploited, the JICA study applies a reduction of 50 %. We accept this very robust approach, since a detailed study would be needed for more accurate estimation. The available groundwater resource for abstraction by wells is 2,8 million m3/a in the middle part of the region and around 600.000 m3/a in the northern part.
• The abstracted amount of groundwater by deep wells in the area of lower elevation was 1790 m3/d in
May 2003, which corresponds to an annual use of 654.000 m3/a, out of that amount 42 m3/d i.e. 15.000 m3/a was abstracted in the northern part of the region. (To be noted, that the JICA-study in 1998 mentioned 540.000 m3/d for the southern part and null for the northern part and the INGRH statistic for 2002 mention 695.000 m3/a for the whole region.). The slight differences in the abstracted amount (related to different period) have no importance, any of them are much less, than the available groundwater resources. The few thousand m3/a abstraction from shallow wells is also insignificant compared to the available resources. The still free amount is appr. 2,2 million m3/a and 585.000 m3/a for the sub-catchments A and B, respectively.
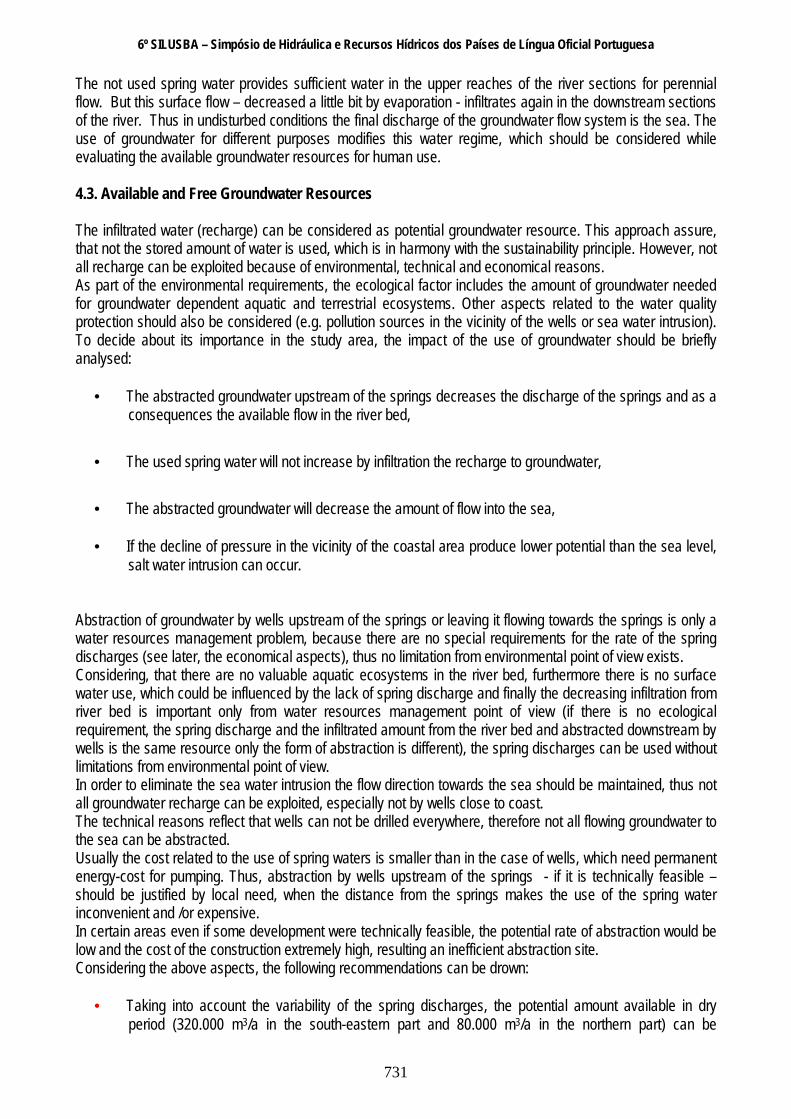
The Figure 6. show the potential areas for exploitation of groundwater resources proposed by the JICA study. The lower Tarrafal volcanic plateau was identified as a high potential area for groundwater exploitation, supposing that the major part of the recharge concentrates here through the regional groundwater flow system. The original JICA-figure shows the spatial variability of the capacity of aquifers for exploitation. Additionally we mentioned in the figure the estimated available (total) groundwater resources and the actual abstraction by regions as well.
6º SILUSBA – Simpósio de Hidráulica e Recursos Hídricos dos Países de Língua Oficial Portuguesa
733
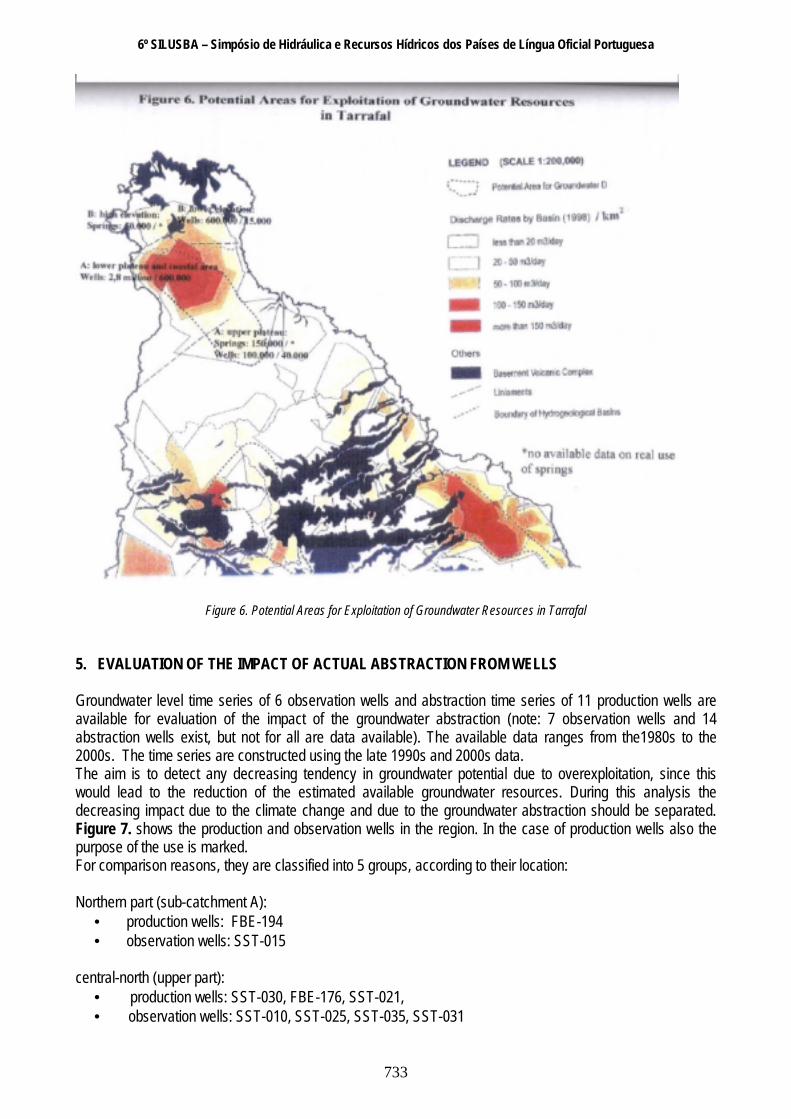
Figure 6. Potential Areas for Exploitation of Groundwater Resources in Tarrafal 5. EVALUATION OF THE IMPACT OF ACTUAL ABSTRACTION FROM WELLS Groundwater level time series of 6 observation wells and abstraction time series of 11 production wells are available for evaluation of the impact of the groundwater abstraction (note: 7 observation wells and 14 abstraction wells exist, but not for all are data available). The available data ranges from the1980s to the 2000s. The time series are constructed using the late 1990s and 2000s data. The aim is to detect any decreasing tendency in groundwater potential due to overexploitation, since this would lead to the reduction of the estimated available groundwater resources. During this analysis the decreasing impact due to the climate change and due to the groundwater abstraction should be separated. Figure 7. shows the production and observation wells in the region. In the case of production wells also the purpose of the use is marked. For comparison reasons, they are classified into 5 groups, according to their location: Northern part (sub-catchment A):
• production wells: FBE-194 • observation wells: SST-015
central-north (upper part):
• production wells: SST-030, FBE-176, SST-021, • observation wells: SST-010, SST-025, SST-035, SST-031
6º SILUSBA – Simpósio de Hidráulica e Recursos Hídricos dos Países de Língua Oficial Portuguesa
734
central-south (low area):
• production wells: FBE-129, FT-029, ST-004 • observation wells: FT-027, SST-34
south-eastern part (upper plateau): • Production wells: FBE-113, FBE-121, FBE-122, FBE-131 • Observation wells: -
south-western part (low area):
• Production wells: SP-019, FBE-150, FBE-151 • Observation wells: -
It is clear, that the spatial distribution of the observation wells are not homogeneous: only one can be found in the northern part (here also the abstraction wells are rare, only one), and there are no observation wells in the southern part, although 7 abstraction wells can be found here.
Figure 7. Production and Observation Wells in Tarrafal
6º SILUSBA – Simpósio de Hidráulica e Recursos Hídricos dos Países de Língua Oficial Portuguesa
735
5.1. Groundwater Levels Table 6. summarise some important characteristics of the observation wells.
Table 6. Observation wells in Tarrafal
Observation Wells Location
Year of construction
Total depth (m)
Static water level * (m)
Northern part: SST-015 Central-north: SST-010 SST-025 SST-035 SST-031 Central-south: FT-027 SST-34
Achada Fazenda Cabeca Leao Achada Tomas Achada Tomas Achada Tomas Chão Bom Achada Colonato
1981 1980 1982 1983 1982 1973 1982
140,88 116,00 120,00 125,00 116,00 34,00 49,38
62,17 93,47 93,65 92,30 68,54 13,80 19,84
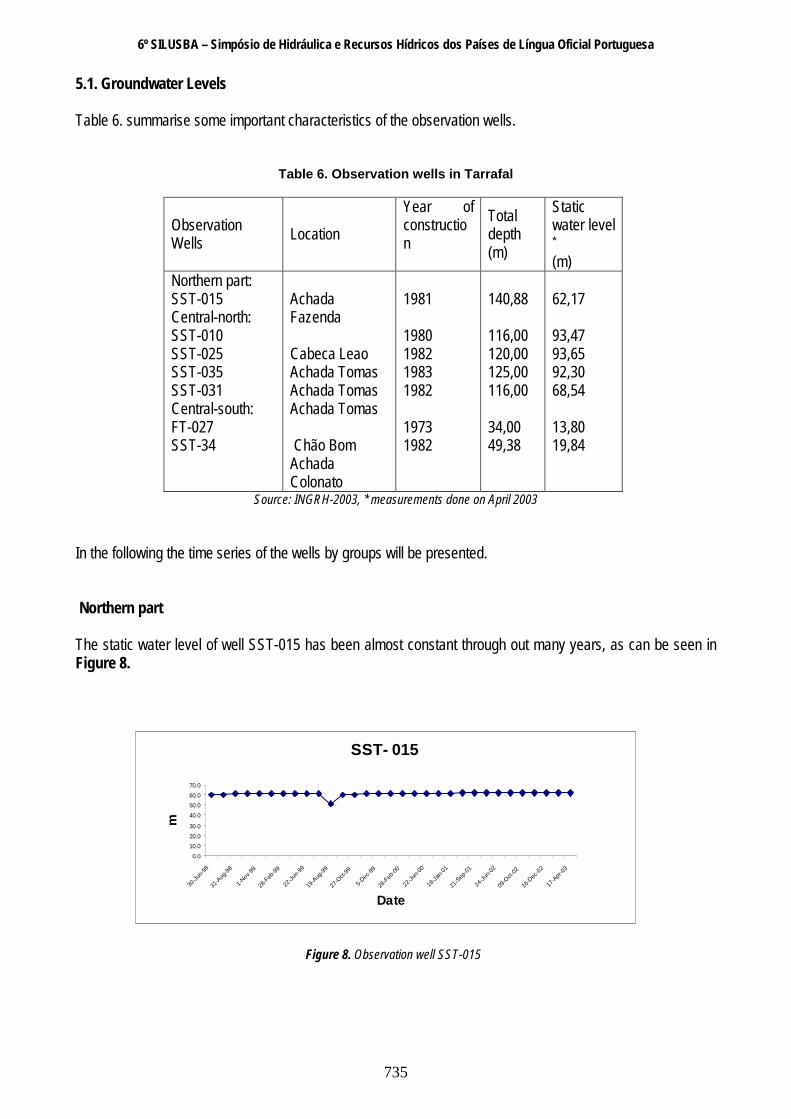
Source: INGRH-2003, * measurements done on April 2003 In the following the time series of the wells by groups will be presented. Northern part The static water level of well SST-015 has been almost constant through out many years, as can be seen in Figure 8.
Figure 8. Observation well SST-015
SST- 015
0.0
10.020.0
30.0
40.0
50.060.0
70.0
30-Ju
n-98
31-A
ug-98
1-Nov
-98
28-F
eb-99
22-Ju
n-99
19-A
ug-99
27-O
ct-99
5-Dec
-99
28-F
eb-00
22-Ju
n-00
18-Ja
n-01
21-S
ep-01
24-Ju
n-02
09-O
ct-02
16-D
ec-02
17-A
pr-03
Date
m
6º SILUSBA – Simpósio de Hidráulica e Recursos Hídricos dos Países de Língua Oficial Portuguesa
736
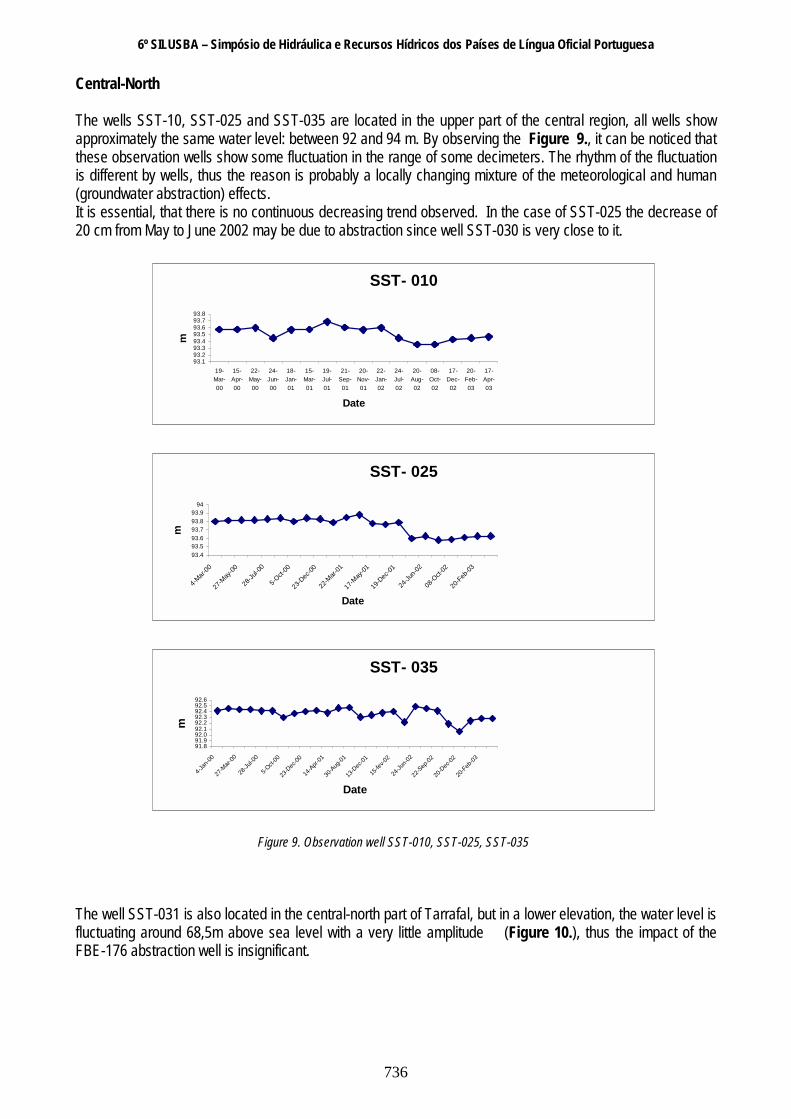
Central-North The wells SST-10, SST-025 and SST-035 are located in the upper part of the central region, all wells show approximately the same water level: between 92 and 94 m. By observing the Figure 9., it can be noticed that these observation wells show some fluctuation in the range of some decimeters. The rhythm of the fluctuation is different by wells, thus the reason is probably a locally changing mixture of the meteorological and human (groundwater abstraction) effects. It is essential, that there is no continuous decreasing trend observed. In the case of SST-025 the decrease of 20 cm from May to June 2002 may be due to abstraction since well SST-030 is very close to it.
Figure 9. Observation well SST-010, SST-025, SST-035
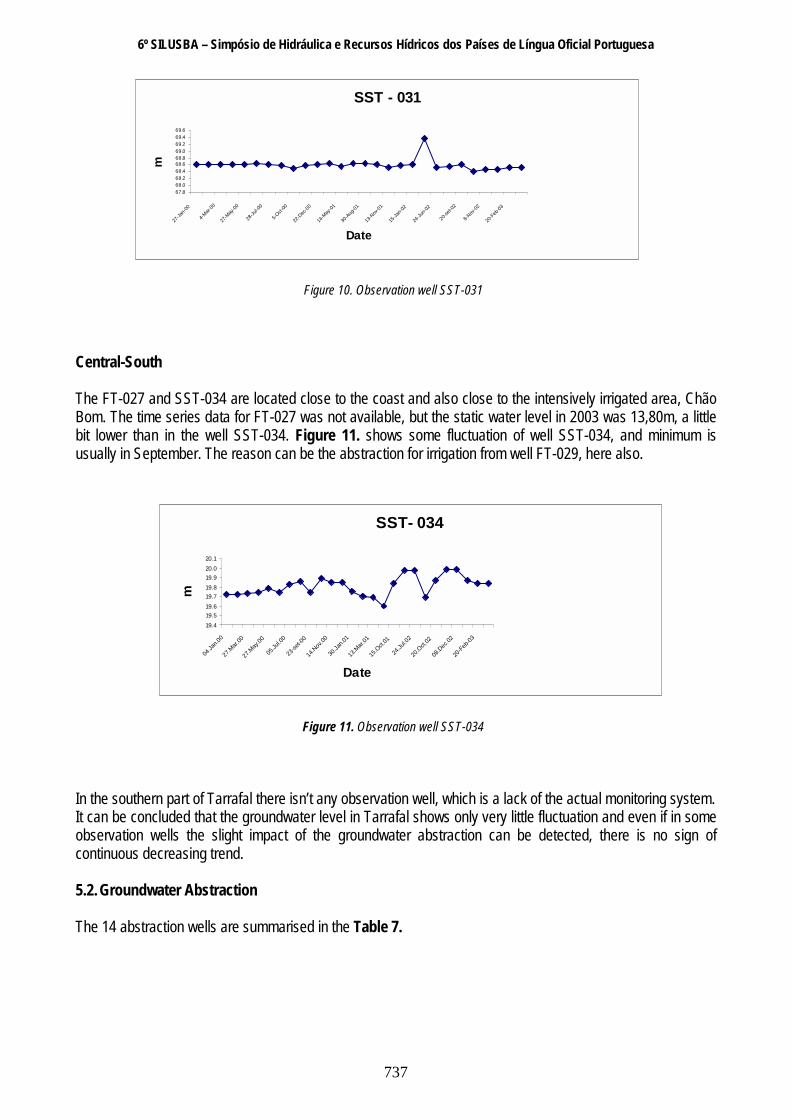
The well SST-031 is also located in the central-north part of Tarrafal, but in a lower elevation, the water level is fluctuating around 68,5m above sea level with a very little amplitude (Figure 10.), thus the impact of the FBE-176 abstraction well is insignificant.
SST- 010
93.193.293.393.493.593.693.793.8
19-Mar-00
15-Apr-00
22-May-00
24-Jun-00
18-Jan-01
15-Mar-01
19-Jul-01
21-Sep-01
20-Nov-01
22-Jan-02
24-Jul-02
20-Aug-02
08-Oct-02
17-Dec-02
20-Feb-03
17-Apr-03
Date
m
SST- 025
93.493.593.693.793.893.9
94
4-Mar-
00
27-M
ay-00
28-Ju
l-00
5-Oct-
00
23-D
ec-00
22-M
ar-01
17-M
ay-01
19-D
ec-01
24-Ju
n-02
08-O
ct-02
20-F
eb-03
Date
m
SST- 035
91.891.992.092.192.292.392.492.592.6
4-Jan
-00
27-M
ar-00
28-Ju
l-00
5-Oct-
00
23-D
ec-00
14-A
pr-01
30-A
ug-01
13-D
ec-01
15-fe
v-02
24-Ju
n-02
22-S
ep-02
20-D
ec-02
20-Feb
-03
Date
m
6º SILUSBA – Simpósio de Hidráulica e Recursos Hídricos dos Países de Língua Oficial Portuguesa
737
Figure 10. Observation well SST-031
Central-South The FT-027 and SST-034 are located close to the coast and also close to the intensively irrigated area, Chão Bom. The time series data for FT-027 was not available, but the static water level in 2003 was 13,80m, a little bit lower than in the well SST-034. Figure 11. shows some fluctuation of well SST-034, and minimum is usually in September. The reason can be the abstraction for irrigation from well FT-029, here also.
Figure 11. Observation well SST-034
In the southern part of Tarrafal there isn’t any observation well, which is a lack of the actual monitoring system. It can be concluded that the groundwater level in Tarrafal shows only very little fluctuation and even if in some observation wells the slight impact of the groundwater abstraction can be detected, there is no sign of continuous decreasing trend. 5.2. Groundwater Abstraction The 14 abstraction wells are summarised in the Table 7.
SST- 034
19.419.519.6
19.719.819.920.020.1
04.Ja
n.00
27.M
ar.00
27.M
ay.00
05.Ju
l.00
23-se
t-00
14.N
ov.00
30.Ja
n.01
13.M
ar.01
15.O
ct.01
24.Ju
l.02
20.O
ct.02
08.D
ec.02
20-F
eb-03
Date
m
SST - 031
67.868.068.268.468.668.869.069.269.469.6
27-Ja
n-00
4-Mar-
00
27-M
ay-00
28-Ju
l-00
5-Oct-
00
22-D
ec-00
14-M
ay-01
30-A
ug-01
13-N
ov-01
15-Ja
n-02
24-Ju
n-02
20-se
t-02
8-Nov
-02
20-F
eb-03
Date
m

6º SILUSBA – Simpósio de Hidráulica e Recursos Hídricos dos Países de Língua Oficial Portuguesa
738
Table 7. Abstraction wells in Tarrafal
Well Location Year of constr.
Total depth (m)
Pumping time* (hr/day)
Q*
(m3/hr)
Abstr. amount (m3/d)
Abstr. amount (m3/a) Purpose
Northern part: FBE-194 Central-North: SST-030 SST-021 FBE-176 Central-South: FT-029 SST-04 FBE-129 South-East: FBE-113 FBE-131 FBE-122 FBE-121+
South-West: FBE-150 FBE-151 SP- 019+
Fazenda Achada Tomas Achada Tomas Achada Tomas Lem Mendes Ribeira Grande Lem Mendes Milho Branco Mato Mendes Achada Moirao Ribeira Cuba Ribeira Prata
1999 1982 1981 1998 1973 1980 1989 1989 1989 1989 1994 1994
24,50 131,00 115,00 100,00 36,00 75,00 36,50 209,00270,00 300,00 40,00 30,00
4,00 12,00 12,00 12,00 13,00 5,00 12,00 8,00 4,00 7,00 5,00 9,00
10,50 15,00 30,00 19,00 30,00 30,00 10,00 5,40 5,10 5,10 30,00 18,90
42,00 180,00 360,00 228,00 390,00 150,00 120,00 43,20 20,40 35,70 150,00 170,10
25.330,00 65.700,00 131.400,00 83.220,00 142.350,00 54.750,00 43.800,00 15.768,00 7.446,00 13.030,50 54.750,00 62.086,50
Dom./Irr. Domestic Dom./Irr. Irrigation Irrigation Domestic Domestic Domestic Domestic Domestic Domestic Irrigation
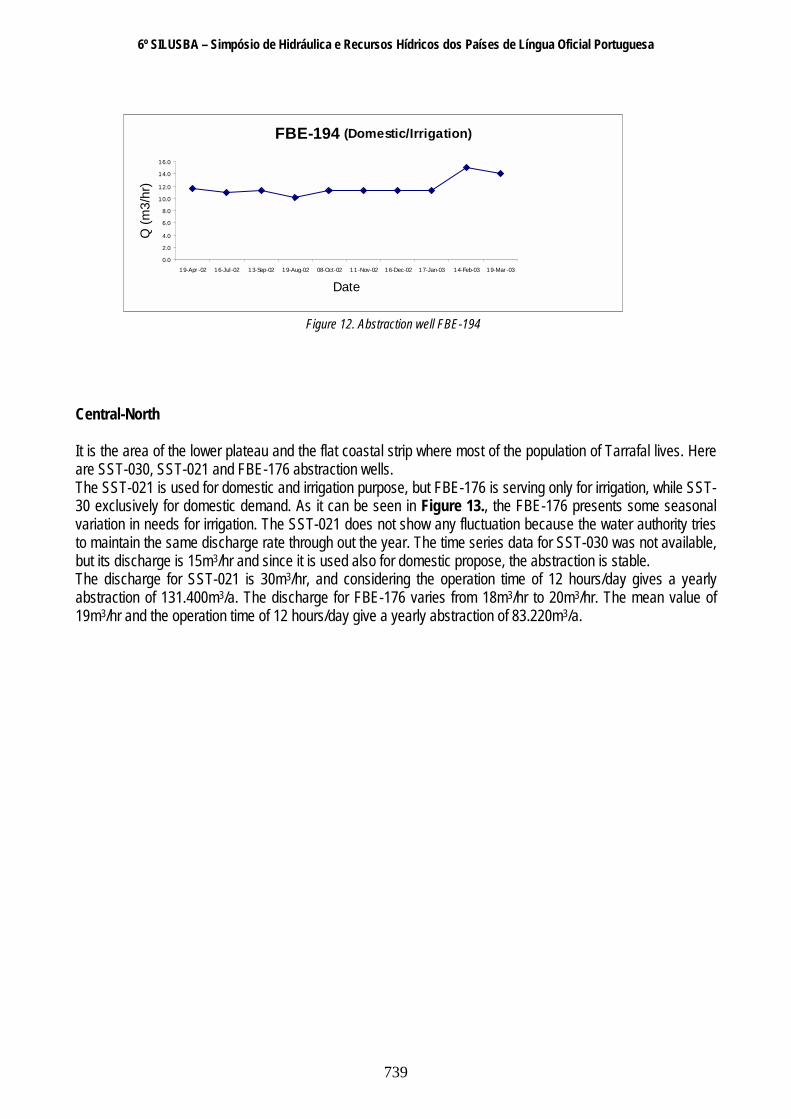
Source: INGRH-2003, * measurements done on April 2003, + out of order Northern part There is only one abstraction well in the northern part, FBE-194 is close to the sea. It is used for irrigation and domestic purposes for a small village called Fazenda. Figure 12. show some fluctuations due to the demand for irrigation, which is not constant. The discharge varies between 10 - 16 m3/hr depending on irrigation needs. The mean value between April 2002 and April 2003 was 12,5 m3/h and considering an operation of 4 hours/day in average, the yearly abstraction amounts at 20.000 m3/a.
6º SILUSBA – Simpósio de Hidráulica e Recursos Hídricos dos Países de Língua Oficial Portuguesa
739
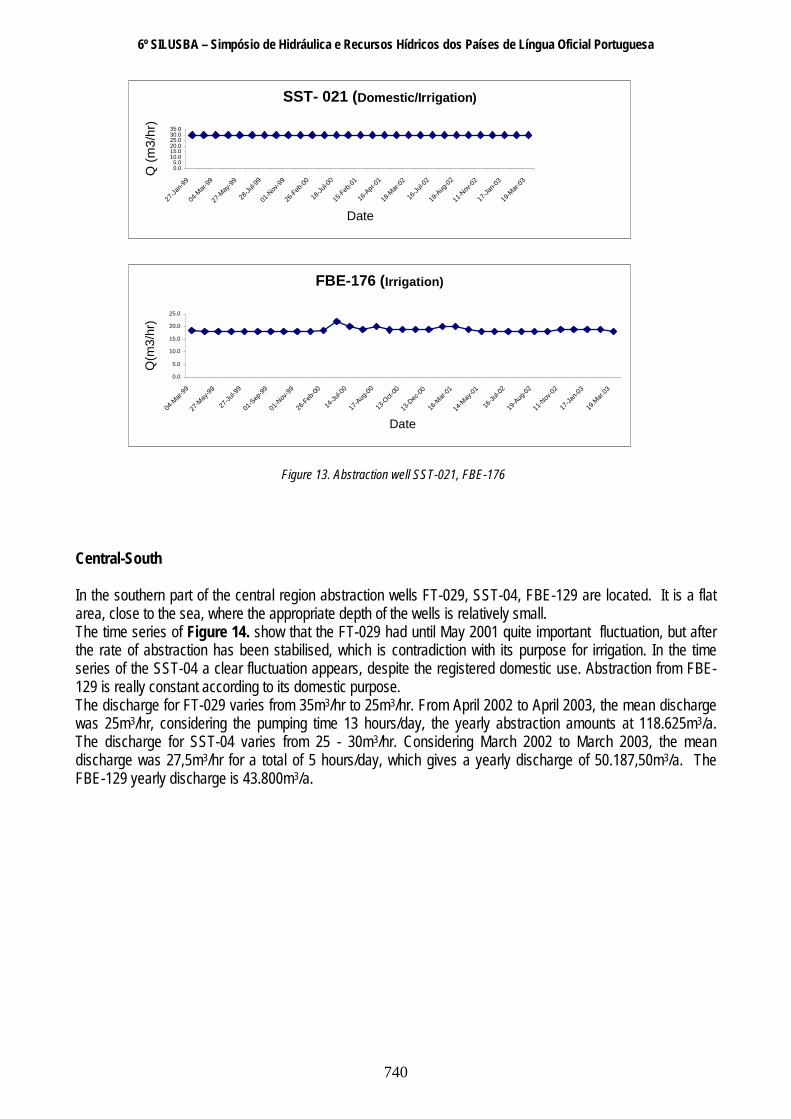
Figure 12. Abstraction well FBE-194 Central-North It is the area of the lower plateau and the flat coastal strip where most of the population of Tarrafal lives. Here are SST-030, SST-021 and FBE-176 abstraction wells. The SST-021 is used for domestic and irrigation purpose, but FBE-176 is serving only for irrigation, while SST-30 exclusively for domestic demand. As it can be seen in Figure 13., the FBE-176 presents some seasonal variation in needs for irrigation. The SST-021 does not show any fluctuation because the water authority tries to maintain the same discharge rate through out the year. The time series data for SST-030 was not available, but its discharge is 15m3/hr and since it is used also for domestic propose, the abstraction is stable. The discharge for SST-021 is 30m3/hr, and considering the operation time of 12 hours/day gives a yearly abstraction of 131.400m3/a. The discharge for FBE-176 varies from 18m3/hr to 20m3/hr. The mean value of 19m3/hr and the operation time of 12 hours/day give a yearly abstraction of 83.220m3/a.
FBE-194 (Domestic/Irrigation)
0.0
2.0
4.0
6.0
8.0
10.0
12.0
14.0
16.0
19-Apr -02 16-Jul-02 13-Sep-02 19-Aug-02 08-Oct-02 11-Nov-02 16-Dec-02 17-Jan-03 14-Feb-03 19-Mar -03
Date
Q (m
3/hr
)
6º SILUSBA – Simpósio de Hidráulica e Recursos Hídricos dos Países de Língua Oficial Portuguesa
740
Figure 13. Abstraction well SST-021, FBE-176
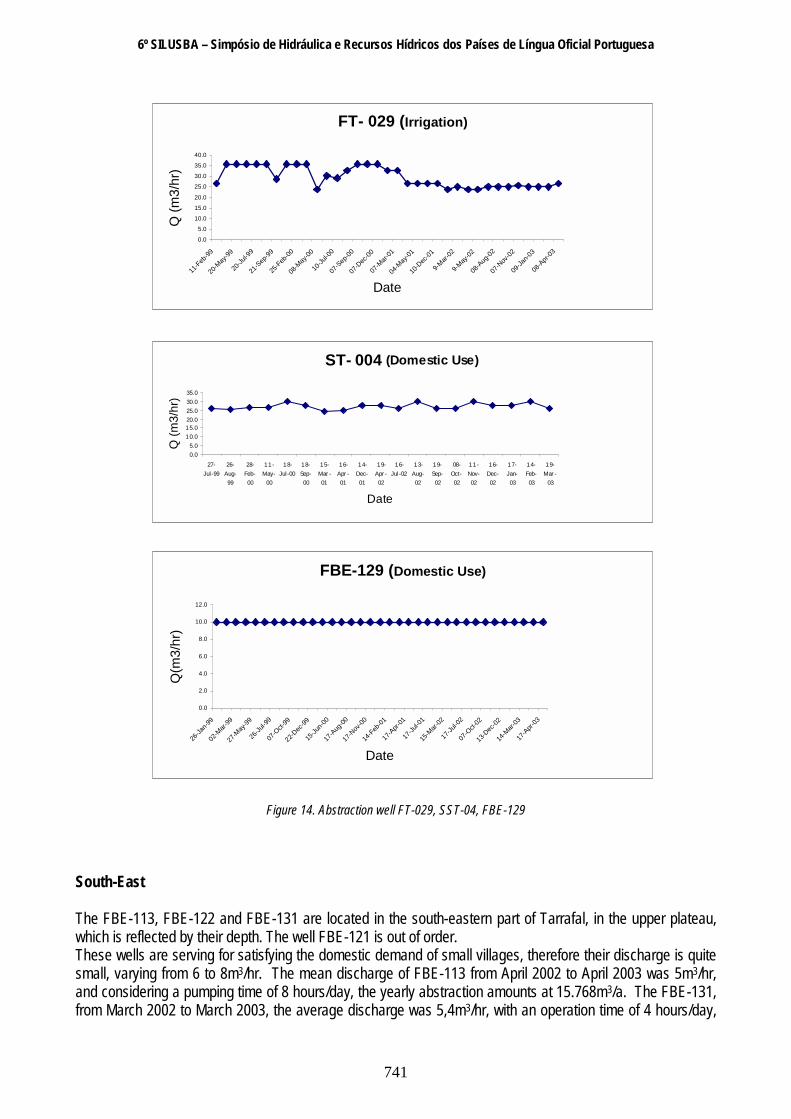
Central-South In the southern part of the central region abstraction wells FT-029, SST-04, FBE-129 are located. It is a flat area, close to the sea, where the appropriate depth of the wells is relatively small. The time series of Figure 14. show that the FT-029 had until May 2001 quite important fluctuation, but after the rate of abstraction has been stabilised, which is contradiction with its purpose for irrigation. In the time series of the SST-04 a clear fluctuation appears, despite the registered domestic use. Abstraction from FBE-129 is really constant according to its domestic purpose. The discharge for FT-029 varies from 35m3/hr to 25m3/hr. From April 2002 to April 2003, the mean discharge was 25m3/hr, considering the pumping time 13 hours/day, the yearly abstraction amounts at 118.625m3/a. The discharge for SST-04 varies from 25 - 30m3/hr. Considering March 2002 to March 2003, the mean discharge was 27,5m3/hr for a total of 5 hours/day, which gives a yearly discharge of 50.187,50m3/a. The FBE-129 yearly discharge is 43.800m3/a.
FBE-176 (Irrigation)
0.0
5.0
10.0
15.0
20.0
25.0
04-M
ar-99
27-M
ay-99
27-Ju
l-99
01-S
ep-99
01-N
ov-99
26-Feb
-00
14-Ju
l-00
17-A
ug-00
13-O
ct-00
13-D
ec-00
16-M
ar-01
14-M
ay-01
16-Ju
l-02
19-A
ug-02
11-N
ov-02
17-Ja
n-03
19.M
ar.03
Date
Q(m
3/hr
)
SST- 021 (Domestic/Irrigation)
0.05.0
10.015.020.025.030.035.0
27-Ja
n-99
04-M
ar-99
27-M
ay-99
28-Ju
l-99
01-N
ov-99
26-Feb
-00
18-Ju
l-00
15-Feb
-01
16-A
pr-01
18-M
ar-02
16-Ju
l-02
19-A
ug-02
11-N
ov-02
17-Ja
n-03
19-M
ar-03
Date
Q (m
3/hr
)
6º SILUSBA – Simpósio de Hidráulica e Recursos Hídricos dos Países de Língua Oficial Portuguesa
741
Figure 14. Abstraction well FT-029, SST-04, FBE-129
South-East The FBE-113, FBE-122 and FBE-131 are located in the south-eastern part of Tarrafal, in the upper plateau, which is reflected by their depth. The well FBE-121 is out of order. These wells are serving for satisfying the domestic demand of small villages, therefore their discharge is quite small, varying from 6 to 8m3/hr. The mean discharge of FBE-113 from April 2002 to April 2003 was 5m3/hr, and considering a pumping time of 8 hours/day, the yearly abstraction amounts at 15.768m3/a. The FBE-131, from March 2002 to March 2003, the average discharge was 5,4m3/hr, with an operation time of 4 hours/day,
ST- 004 (Domestic Use)
0.05.0
10.015.020.025.030.035.0
27-Jul-99
26-Aug-99
28-Feb-00
11-May-
00
18-Jul-00
18-Sep-00
15-Mar -01
16-Apr -01
14-Dec-01
19-Apr -02
16-Jul-02
13-Aug-02
19-Sep-02
08-Oct-02
11-Nov-02
16-Dec-02
17-Jan-03
14-Feb-03
19-Mar -
03
Date
Q (m
3/hr
)
FBE-129 (Domestic Use)
0.0
2.0
4.0
6.0
8.0
10.0
12.0
26-Ja
n-99
02-M
ar-99
27-M
ay-99
26-Ju
l-99
07-O
ct-99
22-D
ec-99
15-Ju
n-00
17-A
ug-00
17-N
ov-00
14-F
eb-01
17-A
pr-01
17-Ju
l-01
15-M
ar-02
17-Ju
l-02
07-O
ct-02
13-D
ec-02
14-M
ar-03
17-A
pr-03
Date
Q(m
3/hr
)
FT- 029 (Irrigation)
0.0
5.0
10.0
15.0
20.0
25.0
30.0
35.0
40.0
11-F
eb-99
20-M
ay-99
20-Ju
l-99
21-S
ep-99
25-F
eb-00
08-M
ay-00
10-Ju
l-00
07-S
ep-00
07-D
ec-00
07-M
ar-01
04-M
ay-01
10-D
ec-01
9-Mar-
02
9-May
-02
08-A
ug-02
07-N
ov-02
09-Ja
n-03
08-A
pr-03
Date
Q (m
3/hr
)
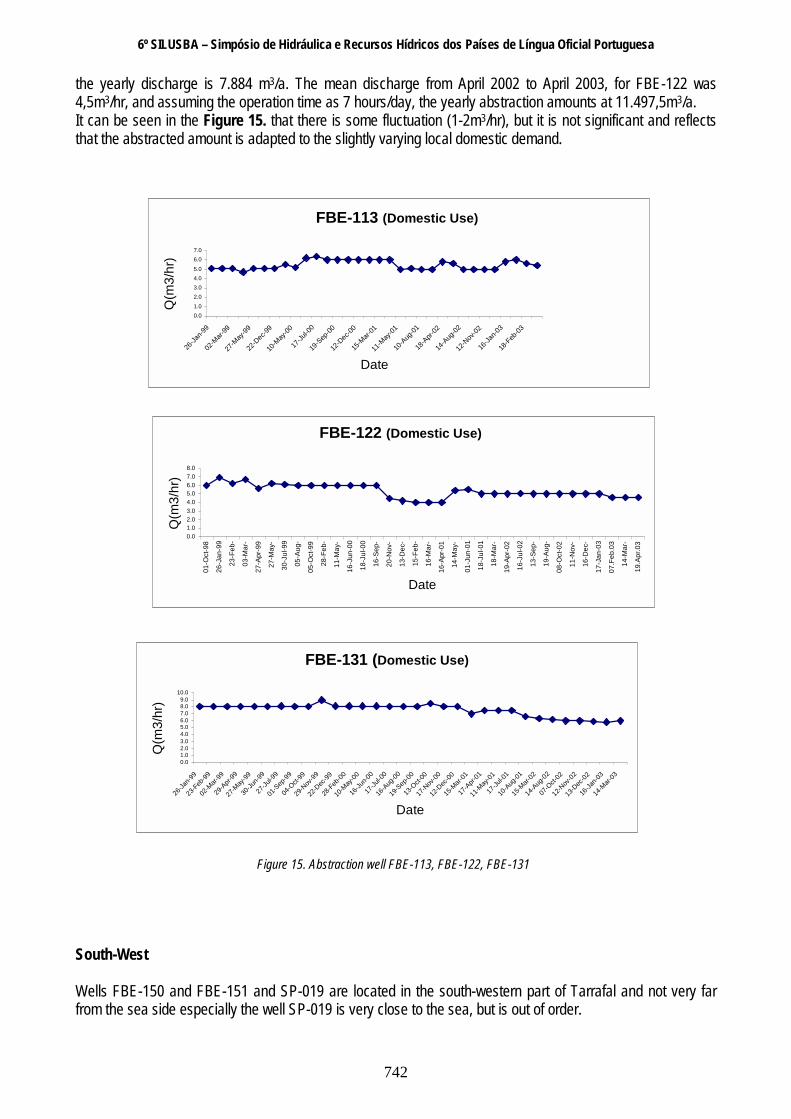
6º SILUSBA – Simpósio de Hidráulica e Recursos Hídricos dos Países de Língua Oficial Portuguesa
742
the yearly discharge is 7.884 m3/a. The mean discharge from April 2002 to April 2003, for FBE-122 was 4,5m3/hr, and assuming the operation time as 7 hours/day, the yearly abstraction amounts at 11.497,5m3/a. It can be seen in the Figure 15. that there is some fluctuation (1-2m3/hr), but it is not significant and reflects that the abstracted amount is adapted to the slightly varying local domestic demand.
Figure 15. Abstraction well FBE-113, FBE-122, FBE-131
South-West Wells FBE-150 and FBE-151 and SP-019 are located in the south-western part of Tarrafal and not very far from the sea side especially the well SP-019 is very close to the sea, but is out of order.
FBE-113 (Domestic Use)
0.01.0
2.03.04.05.0
6.07.0
26-Ja
n-99
02-M
ar-99
27-M
ay-99
22-D
ec-99
10-M
ay-00
17-Ju
l-00
19-S
ep-00
12-D
ec-00
15-M
ar-01
11-M
ay-01
10-A
ug-01
18-A
pr-02
14-A
ug-02
12-N
ov-02
16-Ja
n-03
18-Feb
-03
Date
Q(m
3/hr
)
FBE-131 (Domestic Use)
0.01.02.03.04.05.06.07.08.09.0
10.0
26-Ja
n-99
23-Feb
-99
02-M
ar-99
29-A
pr-99
27-M
ay-99
30-Ju
n-99
27-Ju
l-99
01-S
ep-99
04-O
ct-99
29-N
ov-99
22-D
ec-99
28-Feb
-00
10-M
ay-00
16-Ju
n-00
17-Ju
l-00
16-A
ug-00
19-S
ep-00
13-O
ct-00
17-N
ov-00
12-D
ec-00
15-M
ar-01
17-A
pr-01
11-M
ay-01
17-Ju
l-01
10-A
ug-01
15-M
ar-02
14-A
ug-02
07-O
ct-02
12-N
ov-02
13-D
ec-02
16-Ja
n-03
14-M
ar-03
Date
Q(m
3/hr
)
FBE-122 (Domestic Use)
0.01.02.03.04.05.06.07.08.0
01-O
ct-9
8
26-J
an-9
9
23-F
eb-
03-M
ar-
27-A
pr-9
9
27-M
ay-
30-J
ul-9
9
05-A
ug-
05-O
ct-9
9
28-F
eb-
11-M
ay-
16-J
un-0
0
18-J
ul-0
0
16-S
ep-
20-N
ov-
13-D
ec-
15-F
eb-
16-M
ar-
16-A
pr-0
1
14-M
ay-
01-J
un-0
1
18-J
ul-0
1
18-M
ar-
19-A
pr-0
2
16-J
ul-0
2
13-S
ep-
19-A
ug-
08-O
ct-0
2
11-N
ov-
16-D
ec-
17-J
an-0
3
07.F
eb.0
3
14-M
ar-
19.A
pr.0
3
Date
Q(m
3/hr
)
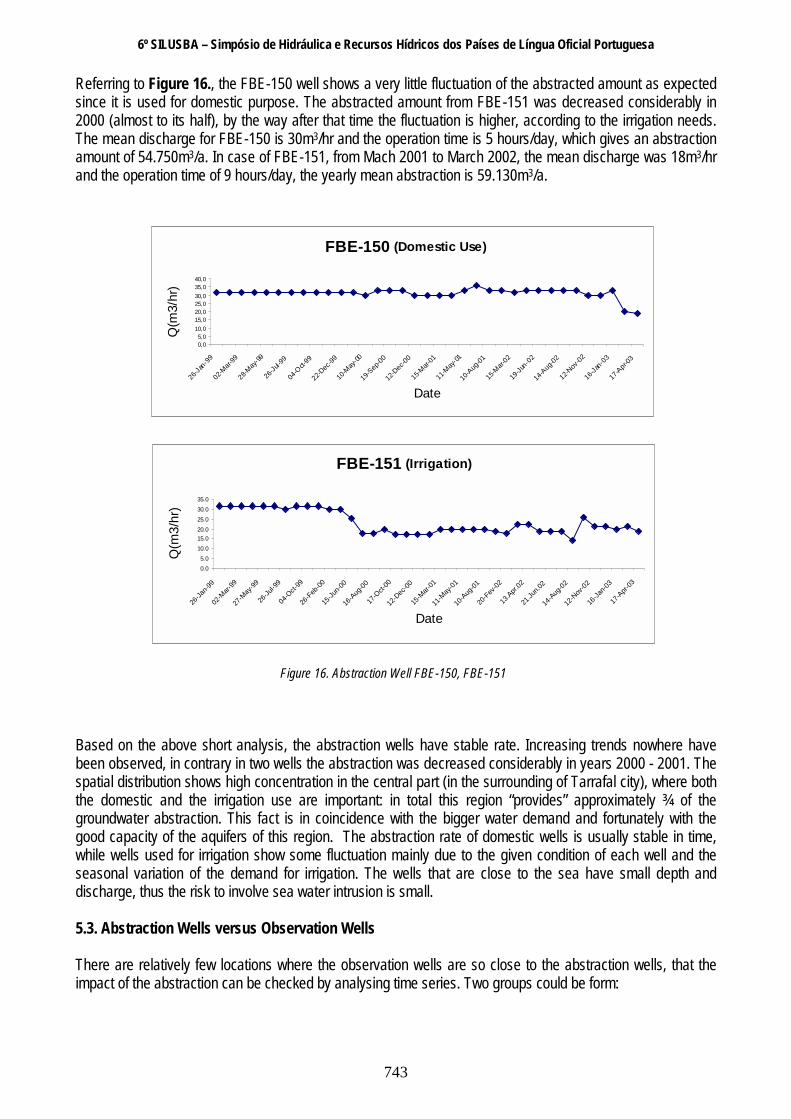
6º SILUSBA – Simpósio de Hidráulica e Recursos Hídricos dos Países de Língua Oficial Portuguesa
743
Referring to Figure 16., the FBE-150 well shows a very little fluctuation of the abstracted amount as expected since it is used for domestic purpose. The abstracted amount from FBE-151 was decreased considerably in 2000 (almost to its half), by the way after that time the fluctuation is higher, according to the irrigation needs. The mean discharge for FBE-150 is 30m3/hr and the operation time is 5 hours/day, which gives an abstraction amount of 54.750m3/a. In case of FBE-151, from Mach 2001 to March 2002, the mean discharge was 18m3/hr and the operation time of 9 hours/day, the yearly mean abstraction is 59.130m3/a.
Figure 16. Abstraction Well FBE-150, FBE-151
Based on the above short analysis, the abstraction wells have stable rate. Increasing trends nowhere have been observed, in contrary in two wells the abstraction was decreased considerably in years 2000 - 2001. The spatial distribution shows high concentration in the central part (in the surrounding of Tarrafal city), where both the domestic and the irrigation use are important: in total this region “provides” approximately ¾ of the groundwater abstraction. This fact is in coincidence with the bigger water demand and fortunately with the good capacity of the aquifers of this region. The abstraction rate of domestic wells is usually stable in time, while wells used for irrigation show some fluctuation mainly due to the given condition of each well and the seasonal variation of the demand for irrigation. The wells that are close to the sea have small depth and discharge, thus the risk to involve sea water intrusion is small. 5.3. Abstraction Wells versus Observation Wells There are relatively few locations where the observation wells are so close to the abstraction wells, that the impact of the abstraction can be checked by analysing time series. Two groups could be form:
FBE-150 (Domestic Use)
0,05,0
10,015,020,025,030,035,040,0
26-Ja
n-99
02-M
ar-99
28-M
ay-99
26-Ju
l-99
04-O
ct-99
22-D
ec-99
10-M
ay-00
19-S
ep-00
12-D
ec-00
15-M
ar-01
11-M
ay-01
10-A
ug-01
15-M
ar-02
19-Ju
n-02
14-A
ug-02
12-N
ov-02
16-Ja
n-03
17-A
pr-03
Date
Q(m
3/hr
)
FBE-151 (Irrigation)
0.05.0
10.0
15.020.0
25.0
30.0
35.0
26-Ja
n-99
02-M
ar-99
27-M
ay-99
26-Ju
l-99
04-O
ct-99
26-Feb
-00
15-Ju
n-00
16-A
ug-00
17-O
ct-00
12-D
ec-00
15-M
ar-01
11-M
ay-01
10-A
ug-01
20-Fev
-02
13.Apr.
02
21.Ju
n.02
14-A
ug-02
12-N
ov-02
16-Ja
n-03
17-A
pr-03
Date
Q(m
3/hr
)

6º SILUSBA – Simpósio de Hidráulica e Recursos Hídricos dos Países de Língua Oficial Portuguesa
744
In the central-northern region SST-031 controls the abstraction by wells SST-021 and FBE-176, and in the Central-Southern part SST-034 is close enough to the irrigation well FT-029. SST-031 versus SST-021 and FBE-176 SST-021 has stable abstraction, so only the well FBE-176, which is used for irrigation would cause the slight fluctuation of the water level in the observation well SST-031.
Figure 17. SST-031 versus SST-021 and FBE-176
SST-034 versus FT-029 Referring to Figure 18., the observation well SST-034 shows some fluctuation not just because of abstraction from FT-029 which is used for irrigation but also due to its closeness to the sea.
Figure 18. SST-034 versus FT-029
SST - 031 (Obs. Well)
67.868.068.268.468.668.869.069.269.469.6
27-Ja
n-00
25-Feb
-00
4-Mar-
00
29-A
pr-00
27-M
ay-00
30-Ju
l-00
28-Ju
l-00
31-A
ug-00
5-Oct-
00
30-N
ov-00
22-D
ec-00
26-Feb
-01
14-M
ay-01
22-Ju
l-01
30-A
ug-01
17-O
ct-01
13-N
ov-01
19-D
ec-01
15-Ja
n-02
22-A
pr-02
24-Ju
n-02
21-Ju
l-02
20-se
t-02
20-O
ct-02
8-Nov
-02
17-D
ec-02
20-Feb
-03
17-A
pr-03
Date
m
SST- 021 (Domestic/irrigation)
0.0
5.0
10.0
15.0
20.0
25.0
30.0
35.0
26-Dec-00
26-Feb-00
16-Jun-00
18-Jul-00
17-Aug-00
15-Feb-01
16-Mar-01
16-Apr-01
14-May-
01
18-Mar-02
19-Apr-02
16-Jul-02
13-Sep-02
19-Aug-02
08-Oct-02
11-Nov-02
13-Dec-02
17-Jan-03
7-Feb-03
19-Mar-03
Date
Q (m
3/hr
)
SST- 034 (Obs. Well)
19.419.519.619.719.819.920.020.1
04-Ja
n-00
27-M
ar-00
27-M
ay-00
05-Ju
l-00
23-se
t-00
14-N
ov-00
30-Ja
n-01
13-M
ar-01
15-O
ct-01
24-Ju
l-02
20-O
ct-02
08-D
ec-02
20-F
eb-03
Date
m

6º SILUSBA – Simpósio de Hidráulica e Recursos Hídricos dos Países de Língua Oficial Portuguesa
745
6. WATER DEMAND IN 2010 Because of the uncertainties in the economical and social development, the water demands, which are highly related to these circumstances, can only be determined supposing scenarios of the future development. In order to estimate the expected changes, two scenarioshave been analysed:
• medium scenario (SC1), which reflects a “business as usual” situation, i.e. the tendency of the improvement in life standard and production is the same as presently,
• optimistic scenario (SC2), considering that economic conditions will improve better that in SC1, the major driving force would be the tourism, and this can generate development in other sectors of economy, like construction, services, manufacturing and also in agriculture.
Domestic use The water consumption in 2002 for domestic purpose was 372.000 m3, which represents around 50 l/day/cap. Assuming that in 2010 the population will be 25.000 (according to the National Institute of Statistics - INE) and the unit consumption will increase to 100 l/cap/day for SC1 and 150 l/cap/day for SC2, the water consumption is shown in Table 8. By increasing the amount of water available per capita and in quality it will improve the health condition, consequently the population and the consumption amount will increase. For the SC2, the population is assumed to be the same as SC1, considering that the immigration and migration from Tarrafal is very strong.
Table 8. Water demand for domestic use
Year Population Consumption (l/day/cap)
Demand (m3/a )
2002 19.168 50 370.000 SC1 25.000 100 900.000 SC2 25.000 150 1.400.000
Tourism The number of tourists that visited Tarrafal in 2002 was around 28.000. The duration of staying per person varies from 2 days to a week, in 2002 it was 4 days in average. The registered water demand was 5.639m3, but it is clear, that 100 thousands mandays by some 130-150 l/d/cap unit water consumption would give 15.000 m3/year consumption, so – as it was already concluded in chapter 3. – some part of this consumption is registered as domestic water use.
FBE-176 (Irrigation)
0.0
5.0
10.0
15.0
20.0
25.0
26-Feb-00
11-May-00
14-Jul-00
18-Jul-00
17-Aug-00
18-Sep-00
13-Oct-00
20-Nov-00
13-Dec-00
15-Feb-01
16-Mar-01
16-Apr-01
14-May-01
19-Apr-02
16-Jul-02
13-Sep-02
19-Aug-02
08-Oct-02
11-Nov-02
13-Dec-02
17-Jan-03
7-Feb-03
19-Mar-03
Date
Q (m
3/hr
)
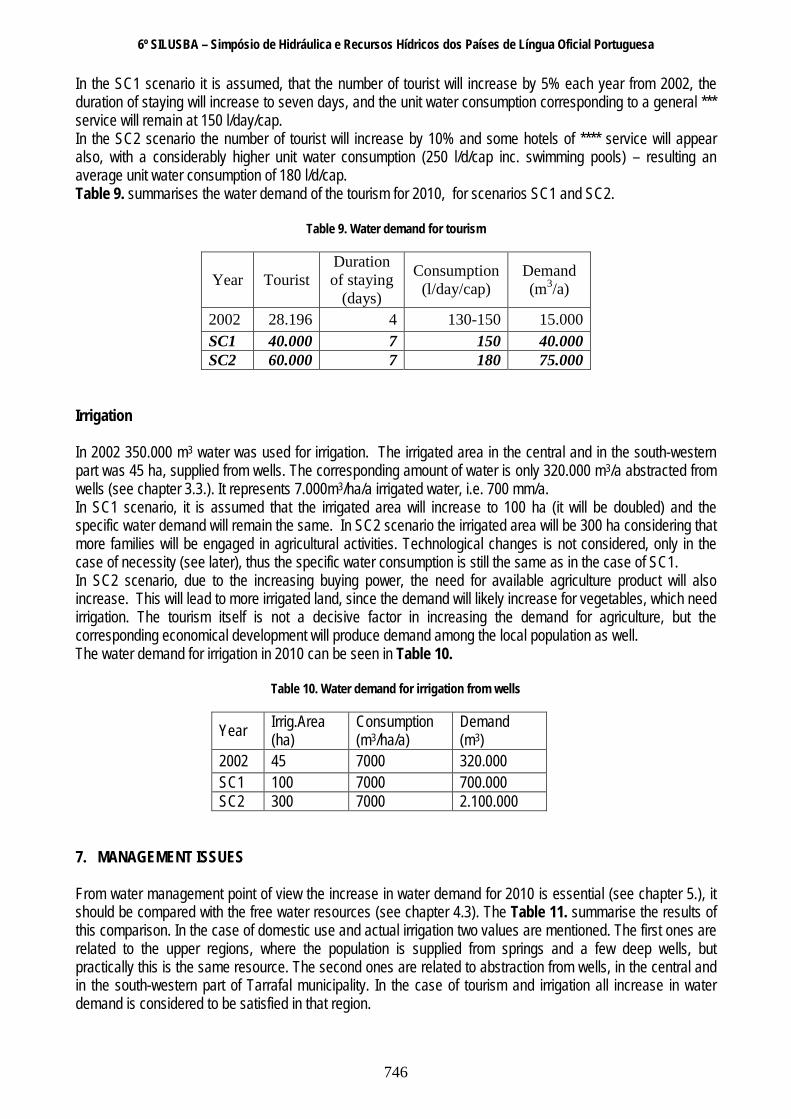
6º SILUSBA – Simpósio de Hidráulica e Recursos Hídricos dos Países de Língua Oficial Portuguesa
746
In the SC1 scenario it is assumed, that the number of tourist will increase by 5% each year from 2002, the duration of staying will increase to seven days, and the unit water consumption corresponding to a general *** service will remain at 150 l/day/cap. In the SC2 scenario the number of tourist will increase by 10% and some hotels of **** service will appear also, with a considerably higher unit water consumption (250 l/d/cap inc. swimming pools) – resulting an average unit water consumption of 180 l/d/cap. Table 9. summarises the water demand of the tourism for 2010, for scenarios SC1 and SC2.
Table 9. Water demand for tourism
Year Tourist Duration of staying
(days)
Consumption (l/day/cap)
Demand (m3/a)
2002 28.196 4 130-150 15.000 SC1 40.000 7 150 40.000 SC2 60.000 7 180 75.000
Irrigation In 2002 350.000 m3 water was used for irrigation. The irrigated area in the central and in the south-western part was 45 ha, supplied from wells. The corresponding amount of water is only 320.000 m3/a abstracted from wells (see chapter 3.3.). It represents 7.000m3/ha/a irrigated water, i.e. 700 mm/a. In SC1 scenario, it is assumed that the irrigated area will increase to 100 ha (it will be doubled) and the specific water demand will remain the same. In SC2 scenario the irrigated area will be 300 ha considering that more families will be engaged in agricultural activities. Technological changes is not considered, only in the case of necessity (see later), thus the specific water consumption is still the same as in the case of SC1. In SC2 scenario, due to the increasing buying power, the need for available agriculture product will also increase. This will lead to more irrigated land, since the demand will likely increase for vegetables, which need irrigation. The tourism itself is not a decisive factor in increasing the demand for agriculture, but the corresponding economical development will produce demand among the local population as well. The water demand for irrigation in 2010 can be seen in Table 10.
Table 10. Water demand for irrigation from wells
Year Irrig.Area (ha)
Consumption (m3/ha/a)
Demand (m3)
2002 45 7000 320.000 SC1 100 7000 700.000 SC2 300 7000 2.100.000
7. MANAGEMENT ISSUES From water management point of view the increase in water demand for 2010 is essential (see chapter 5.), it should be compared with the free water resources (see chapter 4.3). The Table 11. summarise the results of this comparison. In the case of domestic use and actual irrigation two values are mentioned. The first ones are related to the upper regions, where the population is supplied from springs and a few deep wells, but practically this is the same resource. The second ones are related to abstraction from wells, in the central and in the south-western part of Tarrafal municipality. In the case of tourism and irrigation all increase in water demand is considered to be satisfied in that region.

6º SILUSBA – Simpósio de Hidráulica e Recursos Hídricos dos Países de Língua Oficial Portuguesa
747
Table 11. Increase in water demands in 2010 and free resources
Increase in demand purpose In 2002 Scenario 1 Scenario 2
domestic 200.000/170.000
60.000/470.000
90.000/940.000
tourism 15.000
25.000
60.000
Irrigation 75.000/245.000
380.000
1.780.000
total 275.000/430.000
60.000/875.000
90.000/2.780.000
Free water resources
600.000/2,8 million
For the medium scenario (SC1) the amount of free groundwater resources is largely enough. In this case a management plan should focus in construction of more wells in the high potential areas - identified by the study of JICA – in the lower Tarrafal volcanic plateau for covering the increasing drinking water demand of the population and tourism (appr. 500.000 m3/a). In the same time the spring discharges and the newly constructed deep wells with small capacity in the upper plateau (where groundwater abstraction is technically and economically possible) can cover the increasing demand of the population of small villages for healthy drinking water (estimated at 60.000 m3/a). Even in the case of the optimistic scenario (SC2) the demand for domestic use and tourism (1 million m3/a) can be covered without difficulties from the 2,2 million m3 free resources in the central region. The supply of water for irrigation can be easily doubled (SC1), the problem of satisfying water demand can occur only in the case of the optimistic scenario (SC2). Considering the estimated free groundwater resources, the water demand of 300 ha irrigated area (with 260 ha more than actually, which would need an additional amount of almost 1,8 million m3/a water) can only be satisfied if the available water resources of the northern region (almost 600.000 m3/a) is exploited as well. At that level of exploitation the uncertainty of the estimation (on one hand related to impact of the global climate change or increasing variability, the estimation of the available recharge, the economically exploitable ratio, on the other hand to the estimation of the water demand) can play an important role in the decisions. The precautionary principle against this uncertainty would make the water as a limiting factor of the agricultural development. The impact of the uncertainty can be considerably decreased by gradual development of the irrigation. Meantime, a more detailed monitoring system would allow a more precise estimation of the hydrological and hydrogeological regime and as a consequence the more accurate estimation of the available groundwater resources. The analysis would need a strong economical background as well. First for the estimation of the economically feasible technical solutions of construction of groundwater wells and secondly the use of groundwater for agriculture need a very detailed economical analysis. The investment and the maintenance costs of an irrigation supply system should be justified from both economical and social aspects. It should be noted that the pure economical approach probably will not give favourite results, the agriculture is not able to produce sufficient benefit for covering the total cost of the irrigation. From efficiency point view (benefit/1 m3 water) the tourism and the light industry is much more favourable. In Tarrafal the agriculture is very important from employment point of view, so the subsidence of that sector has a strong social support. Thus the conclusion is that the development of the irrigation in agriculture is a possible alternative task for the water management. The detailed analysis should include also the different possibilities of the water resources management for increasing the available groundwater resources, on one hand, and for decreasing the specific demands on the other hand:
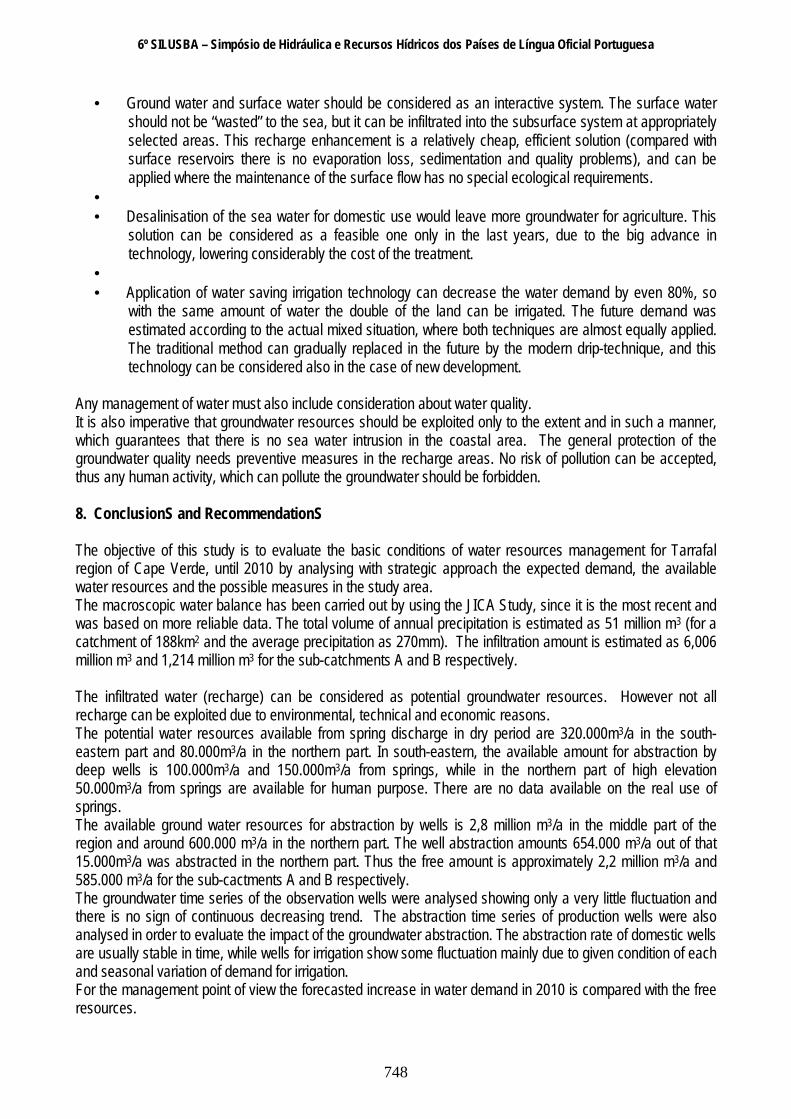
6º SILUSBA – Simpósio de Hidráulica e Recursos Hídricos dos Países de Língua Oficial Portuguesa
748
• Ground water and surface water should be considered as an interactive system. The surface water
should not be “wasted” to the sea, but it can be infiltrated into the subsurface system at appropriately selected areas. This recharge enhancement is a relatively cheap, efficient solution (compared with surface reservoirs there is no evaporation loss, sedimentation and quality problems), and can be applied where the maintenance of the surface flow has no special ecological requirements.
• • Desalinisation of the sea water for domestic use would leave more groundwater for agriculture. This
solution can be considered as a feasible one only in the last years, due to the big advance in technology, lowering considerably the cost of the treatment.
• • Application of water saving irrigation technology can decrease the water demand by even 80%, so
with the same amount of water the double of the land can be irrigated. The future demand was estimated according to the actual mixed situation, where both techniques are almost equally applied. The traditional method can gradually replaced in the future by the modern drip-technique, and this technology can be considered also in the case of new development.
Any management of water must also include consideration about water quality. It is also imperative that groundwater resources should be exploited only to the extent and in such a manner, which guarantees that there is no sea water intrusion in the coastal area. The general protection of the groundwater quality needs preventive measures in the recharge areas. No risk of pollution can be accepted, thus any human activity, which can pollute the groundwater should be forbidden. 8. ConclusionS and RecommendationS The objective of this study is to evaluate the basic conditions of water resources management for Tarrafal region of Cape Verde, until 2010 by analysing with strategic approach the expected demand, the available water resources and the possible measures in the study area. The macroscopic water balance has been carried out by using the JICA Study, since it is the most recent and was based on more reliable data. The total volume of annual precipitation is estimated as 51 million m3 (for a catchment of 188km2 and the average precipitation as 270mm). The infiltration amount is estimated as 6,006 million m3 and 1,214 million m3 for the sub-catchments A and B respectively. The infiltrated water (recharge) can be considered as potential groundwater resources. However not all recharge can be exploited due to environmental, technical and economic reasons. The potential water resources available from spring discharge in dry period are 320.000m3/a in the south-eastern part and 80.000m3/a in the northern part. In south-eastern, the available amount for abstraction by deep wells is 100.000m3/a and 150.000m3/a from springs, while in the northern part of high elevation 50.000m3/a from springs are available for human purpose. There are no data available on the real use of springs. The available ground water resources for abstraction by wells is 2,8 million m3/a in the middle part of the region and around 600.000 m3/a in the northern part. The well abstraction amounts 654.000 m3/a out of that 15.000m3/a was abstracted in the northern part. Thus the free amount is approximately 2,2 million m3/a and 585.000 m3/a for the sub-cactments A and B respectively. The groundwater time series of the observation wells were analysed showing only a very little fluctuation and there is no sign of continuous decreasing trend. The abstraction time series of production wells were also analysed in order to evaluate the impact of the groundwater abstraction. The abstraction rate of domestic wells are usually stable in time, while wells for irrigation show some fluctuation mainly due to given condition of each and seasonal variation of demand for irrigation. For the management point of view the forecasted increase in water demand in 2010 is compared with the free resources.
6º SILUSBA – Simpósio de Hidráulica e Recursos Hídricos dos Países de Língua Oficial Portuguesa
749
For the medium scenario the amount of free ground water is largely enough. In this case the management plan should focus in construction of more wells in the high potential area identified by JICA Study in the lower Tarrafal volcanic plateau for covering the increase drinking water demand of the population and tourism. For the optimistic scenario, considering the free groundwater resources, the water demand of 300ha can only be satisfied if the available water resources of northern region (almost 600.000 m3/a) is exploited, as well. The uncertainty of the estimation can play an important role in the decision. The precaution principle against this uncertainty would make water as limiting factor of the ground water development. Although groundwater balance is apparently positive in Tarrafal, in certain ambitious development scenarios water can be a limiting factor of the development in agriculture. 33% of the population of Tarrafal practice agriculture activities under poor natural base, providing their main income. Increasing the water supply for irrigation and by that way making the production more efficient will improve their living standard as well. This planning would need careful analysis including several aspects: technical solutions, economical background, and social aspects. It has been concluded that more detailed monitoring system would allow more precise estimation of hydrological and hydrogeological regime and as a consequence the more accurate estimation of the available ground water resources. Construction of more observation wells especially in the southern part where lacks monitoring system, is strongly recommended. The impact of climate change should also be further analysed since in the past decade the precipitation has declined. Since spring water has no adverse impact on ground water conservation the use of this precious source should be taken into consideration rather than artificial exploitation of ground water by well construction. A more detailed survey on springs should be conducted. Policies for use priorization, e.g. allocation of some of the water amount currently used for irrigation for domestic use, should be considered by accelerating the use of sound irrigation method. In addition the protection of the resource, altering of habits in use, etc, should be encouraged. The establishment of a groundwater flow model for Cape Verde in order to decrease the uncertainty experienced when using models developed for others countries is suggested. Thus reducing the uncertainty, better estimation of the recharge and the impact of abstraction can be made. Finally it is proposed to establish a medium and long-term water management plan for the Tarrafal region, identifying and harmonising the basic actions needed for a sustainable use of the available groundwater resources. In this plan the future water management issues should be analysed in a more detailed way from technical, economical and social aspects in accordance with a general regional development plan. References
Bereslawski, Etel (1992) Sintesis Hidrologica de las Ilas du Cape Verde, INGRH.
BURGEAP (1974) La Mise en Valeur des Eaux Souterraines dans l’ Archipel du Cape
Verde, repport de fim de mission, Tome 3.
CNAG / INGRH (1992) Schema Directeur pour la Mise en Valeur de Resources en Eau
(1993-2005), Programmme des Nations Unies pour le Development
ONU / Departement pour le Developpement Economic et Social / CNAG, INGRH.
INGRH (2000) Visao National da Agua, a Vida e o Ambiente, Praia, Rep. of Cape Verde.
6º SILUSBA – Simpósio de Hidráulica e Recursos Hídricos dos Países de Língua Oficial Portuguesa
750
Kokusai Kogyo Co, LTD, INGRH (1999) The Study of Ground Water Development in
Santiago, Vol.1.
Sabino, Antonio, Water Management and Soil Management in Cape Verde, Drought and Flood Control Impacts.
SEPA (1999) Estudo da Vulnerabilidade e Adptação dos Recursos Hidricos e o Impacto das Mudanças Climaticas.
VITUKI (2003) Water Related Problems, lecture notes of 34th International Post Graduated
Course in Hydrology, Budapest, Hungary.
Wanielista, Martin (1990) Hydrology and Water Quality Control, WILEY Inc.,University of
Central Florida, USA. Acknowledgments First of all, I would like to express my deep sense of gratitude to PEAS (Program of Energy, Water and Sanitation) and INGRH (National Institute for Water Resources Management) for providing me financial support to attend the 34th International Pos-Graduate Course in Hydrology. My sincere gratitude to VITUKI (Water Resource Research Center) and to all of the lecturers who have shared their knowledge with us throughout the period of the course. I am very grateful to my adviser, Dr. Zoltan Simonffy, for his valuable guidance and suggestion during the preparation of this paper. A special thanks go to Dr. Josef Gayer, the course director, to Mr. Josef Tichy-Racs, the course manager, and to Mrs. Szilvia Godor, the course secretary for extending all the available facilities and whose help and cooperation encouraged me. Last but not the least, my sincere gratitude to my family and friends especially Naldo (my son) and Índia (my niece) who were deprived of my company during theses four months and gave me the emotional support to succeed.