Embed Size (px)
Citation preview

UNIVERSIDADE ESTADUAL DE CAMPINAS
Faculdade de Engenharia Agrícola
MARIANA NAGLE DOS REIS
ASSOCIAÇÃO DE MÉTODOS NÃO DESTRUTIVOS PARA
INSPEÇÃO DE ÁRVORES.
ASSOCIATION OF NONDESTRUCTIVE METHODS FOR
TREE INSPECTION
CAMPINAS
2017

MARIANA NAGLE DOS REIS
ASSOCIAÇÃO DE MÉTODOS NÃO DESTRUTIVOS PARA
INSPEÇÃO DE ÁRVORES.
Dissertação apresentada à Faculdade de
Engenharia Agrícola da Universidade Estadual de
Campinas como parte dos requisitos exigidos para a
obtenção do título de Mestra em Engenharia
Agrícola, na área de Concentração Construções
Rurais e Ambiência.
Orientadora: Profa. Dra. Raquel Gonçalves
Co-orientador: Dr. Alex Julio Trinca
CAMPINAS
2017


AGRADECIMENTOS
Agradeço a professora Raquel pela dedicação, empenho e carinho, aos amigos do LabEnd por
toda ajuda nos experimentos e à minha família pelo apoio incondicional. Agradeço também
ao Conselho Nacional de Desenvolvimento Científico e Tecnológico – CNPQ pela bolsa de
estudos e à FAPESP (Proc. 2015/05692-3) pelo financiamento da pesquisa. Agradeço a
Diretoria de Meio Ambiente da UNICAMP pela doação das toras utilizadas nos ensaios e à
PD Instrumentos pelo auxílio e equipamento utilizado nos ensaios de resistência a perfuração.

RESUMO
A arborização é importante para propiciar equilíbrio ao ambiente, liberar oxigênio e
absorver gás carbônico, melhorar a qualidade do ar, ofertar sombra, absorver ruídos, fornecer
proteção térmica, quebrar a monotonia da paisagem, abrigar e alimentar a fauna e propiciar
bem-estar às pessoas. No entanto, as árvores que se localizam nas proximidades de
habitações, equipamentos urbanos ou estruturas agrícolas, podem representar riscos humanos
e financeiros quando seu estado fitossanitário está comprometido. Detectar o estado
fitossanitário de uma árvore nem sempre é possível utilizando-se somente de análises visuais
ou sinais externos de enfermidades ou ataques de fungos e organismos xilófagos, tornando as
técnicas de inspeção fundamentais. Essa pesquisa teve como objetivo avaliar a tomografia
ultrassônica e a resistência a perfuração, de forma isolada e associada, na detecção dos níveis,
das dimensões e da localização de deteriorações. Os ensaios foram realizados em toretes de 6
espécies de árvores, com diferentes tipos e níveis de deterioração. No caso da tomografia a
avaliação foi feita com base nas variações de velocidade fornecidas pela imagem tomográfica
e para a resistência a perfuração com base no gráfico de amplitude de resistência. Os
resultados permitiram concluir que a resistência a perfuração foi eficiente na detecção e na
obtenção da dimensão aproximada de ocos, uma vez que a amplitude nestes casos é zero. As
amplitudes em regiões deterioradas são inferiores (média em torno de 4%) às de zonas de
madeira sã, permitindo inferir a localização destas zonas. No entanto, a identificação do nível
da deterioração não é evidente, já que a amplitude varia entre cerne alterado e alburno e,
também, entre espécies. A resistência a perfuração é um ensaio pontual e, assim, sua
eficiência depende da localização adequada para ser executado. No caso da tomografia, as
zonas ocadas apresentam redução de velocidades superiores a 70%, enquanto as zonas
deterioradas por fungos começam a ser destacadas com reduções de 30% na velocidade. No
caso de fendas ou galerias o detalhamento da imagem depende da relação entre o
comprimento de onda e a dimensão destes defeitos. De maneira geral as imagens de
tomografia ultrassônica não permitem a obtenção do formato e da localização exata da área
deteriorada, mas permite aportar informações gerais da condição da madeira inspecionada. A
associação dos métodos é eficaz, pois a resistência a perfuração permite detalhar a condição
da madeira nas zonas destacadas pela tomografia como suspeitas.
Palavras-chave: tomografia ultrassônica, resistência à perfuração, sanidade de árvores

ABSTRACT
The urban forestation is important to balance the environment, release oxygen and
absorb carbon dioxide, improve air quality, provide shade, absorb noise, provide thermal
protection, break the monotony of the landscape, as shelter and food to the fauna and provide
wellness to people. However, trees that are located near housing, urban equipment or
agricultural structures may pose human and financial risks when their sanity is compromised.
Detecting the health status of a tree is not always possible using only visual analyzes or
external signs of diseases or attacks of fungi and xylophage organisms, making very
important the improvement of inspection techniques. The aim of this research was to evaluate
ultrasound and drilling resistance, isolated and associated, in the detection of levels,
dimensions and location of decays. The tests were carried out on 6 tree species, with different
types and levels of deterioration. In the case of ultrasound tomography, the evaluation was
made based on the velocity variations provided by the tomographic image and for the drilling
resistance based on the graph of resistance amplitude. The results allowed concluding that the
drilling resistance was efficient in detecting and obtaining the approximate size of hollows,
since the amplitude in these cases is zero. The amplitudes in deteriorated regions are inferior
(average around 4%) to those of healthy wood zones, allowing to infer the location of these
zones. However, the identification of the level of decay is not evident, since the amplitude
varies between modified core and sapwood and also between species. The drilling resistance
is a punctual test and its efficiency depends on the proper location to be executed. In the case
of tomography, the hollow zones present reduction of velocities greater than 70%, while the
zones deteriorated by fungi begin to be highlighted with 30% velocities reductions. In the case
of cracks or galleries the image detailing depends on the relationship between the wavelength
and the size of these defects. In general, the ultrasonic tomography images do not show the
format and the exact location of the decayed area, but it provides general information of the
condition of the inspected wood. The association of the methods is effective, because the
drilling resistance allows detailing the condition of the wood in the areas highlighted as
suspect by the tomography.
Key words: ultrasonic tomography, drilling resistance, tree sanity.

Sumário
INTRODUÇÃO GERAL ..................................................................................................... 9
ARTIGO 1: DRILLING RESISTANCE AMPLITUDE IN DIFFERENT TYPES OF
DETERIORATED LOGS OF TREES................................................................................. 12
ARTIGO 2: ULTRASONIC TOMOGRAPHY IN LOGS OF TREES WITH DIFFERENT
TYPES OF DETERIORATION ......................................................................................... 26
ARTIGO 3: ASSOCIATION OF NONDESTRUCTIVE TOOLS FOR TREE INSPECTION ... 42
DISCUSSÃO GERAL ....................................................................................................... 59
Resistência a perfuração ............................................................................................................ 59
Tomografia ultrassônica ............................................................................................................ 61
Associação da tomografia ultrassônica e resistência a perfuração ............................................ 63
CONCLUSÃO GERAL ..................................................................................................... 65
ANEXO I ......................................................................................................................... 66
Gráficos de Resistência à Perfuração em todas as rotas de medição dos toretes ensaiados ...... 66
ANEXO II ....................................................................................................................... 85
Tabelas de dados utilizados para geração das imagens de tomografia ultrassônica .................. 85
ANEXO III ...................................................................................................................... 92
Imagens Tomográficas dos toretes ensaiados ............................................................................ 92

9
INTRODUÇÃO GERAL
A importância da existência de arborização é indiscutível, sendo, portanto, um tema de
grande interesse e atualidade. Políticas de manutenção de áreas verdes têm grande relevância
social, estética, cultural e educacional, além de desempenharem significativo papel do ponto
de vista climático e ambiental.
A falta de planejamento da arborização urbana no passado e as atuais mudanças
climáticas podem provocar declínio nas árvores, com alterações de dimensão, de formato e de
posição em relação ao eixo, tornando estas árvores mais propícias a problemas patológicos e
posteriormente à queda. Adicionalmente, as árvores são seres vivos e, como tal, têm um ciclo
de vida que envolve o início do crescimento, a fase juvenil, a fase adulta e a morte, mesmo
sem nenhum agente externo causador.
Assim, a manutenção de áreas verdes requer ações políticas, administrativas e técnicas
e, do ponto de vista da coexistência das árvores com as estruturas que envolvam riscos
humanos ou financeiros, devem ser estabelecidos critérios que permitam a aplicação de novas
metodologias que minimizem os problemas.
A inspeção visual dirigida à poda, já praticada, muitas vezes não contempla a
identificação de anomalias que sejam indicativas de fragilidades ou instabilidades internas. A
alternativa vislumbrada nesse projeto é o uso de tecnologias que, associadas à inspeção visual,
permitam monitorar a condição interna da árvore, de forma a ser possível, em uma fase
posterior, ligar esse conhecimento ao risco de queda desse indivíduo arbóreo.
Na madeira, diferentes tipos de deteriorações provocam, como consequência,
alterações em sua estrutura. Por outro lado, a propagação de ondas mecânicas em meios
materiais é afetada, por diferenças de propriedades elásticas, por diferenças de impedância
entre os meios e por alterações de percurso. Por essa razão, existe a viabilidade de se utilizar
variações na velocidade de propagação de ondas como parâmetros de inferência de
modificações estruturais na madeira (alterações na rigidez ou na estrutura anatômica e zona
ocadas).
A tomografia utilizando métodos sônicos tem sido adotada com frequência para
avaliação da condição interna de árvores em diversos países, principalmente como ferramenta
auxiliar na avaliação do risco de queda. Existem no mercado vários equipamentos comerciais

10
de tomografia acústica, utilizando, principalmente, propagação de ondas de tensão
(denominados tomógrafos sônicos), mas ainda tem havido muita pesquisa na área, fruto da
necessidade de melhor entendimento do significado da imagem gerada, bem como de seu
alcance em termos de precisão.
Da mesma forma, a resistência a perfuração tem sido reconhecida como técnica que
apresenta bons resultados em inspeções de árvores e de estruturas, embora de forma muito
localizada. Considerando que o equipamento mede a resistência que a madeira oferece à
perfuração, é esperado, também, que seus resultados possam ser correlacionados com perdas
de resistência devidas a deteriorações. Assim, tem havido vários estudos que visam avaliar as
correlações entre a amplitude da resistência a perfuração, obtida pelo equipamento, e a
resistência da madeira ou sua eficácia na detecção de deteriorações em estruturas, toras ou
árvores.
Considerando os aspectos mencionados o objetivo geral desta pesquisa foi avaliar a
tomografia ultrassônica e a resistência a perfuração, de forma isolada e associada, na detecção
dos níveis, das dimensões e da localização de deteriorações. No caso da tomografia
ultrassônica é importante salientar que os ensaios foram realizados com equipamento e
software desenvolvidos no grupo de pesquisa da Faculdade de Engenharia Agrícola
(FEAGRI) da Universidade Estadual de Campinas (UNICAMP).
A dissertação foi redigida em formato alternativo previsto pela Intuição, no qual após
o capítulo de Introdução Geral da pesquisa são apresentados os artigos submetidos à
publicação, o capítulo de Discussão Geral, que aglutina os resultados dos artigos, e o capítulo
de Conclusões Gerais, que estabelece o vínculo dos artigos com a hipótese e objetivo
principal da pesquisa.
Os dois objetivos específicos compuseram os temas dos dois primeiros artigos, que
tratam, isoladamente, da avaliação da resistência à perfuração e da tomografia ultrassônica,
respectivamente. O terceiro artigo trata da associação destes métodos não destrutivos para a
avaliação interna de árvores. Artigos possuem lógica e formatação específicas, exigindo
apresentação resumida e focada de resultados, sendo assim, foram inseridos em anexos os
resultados completos obtidos durante a pesquisa.
No Anexo I são apresentados todos os gráficos de resistência à perfuração obtidos nos
ensaios com resistógrafo, os quais foram a base das análises envolvidas nos artigos 1 e 3.

11
No Anexo II são apresentadas as tabelas de dados utilizados para geração das imagens
de tomografia ultrassônica, utilizadas para a elaboração dos artigos 2 e 3.
No Anexo III apresentam-se as imagens de tomografia ultrassônica utilizadas como
base para a elaboração dos artigos 2 e 3.

12
ARTIGO 1: DRILLING RESISTANCE AMPLITUDE IN DIFFERENT TYPES OF
DETERIORATED LOGS OF TREES
Submetido ao periódico: Arboriculture and Urban Forestry

13
Drilling resistance amplitude in different types of deteriorated logs of trees.
Authors and Afilliations:
Mariana Reis (1), Raquel Gonçalves (2), Gustavo Garcia (3), Leandro Manes (4)
(1) (3) Master Student, School of Agricultural Engineering, Nondestructive Testing Laboratory, University of Campinas,
Campinas, SP, Brasil
(2) Professor, School of Agricultural Engineering, Nondestructive Testing Laboratory, University of Campinas, Campinas,
SP, Brasil. E-mail: [email protected]
(4) Undergraduate Student, School of Agricultural Engineering, Nondestructive Testing Laboratory, University of Campinas,
Campinas, SP, Brasil
Author Contribution Statement:
(1) This paper is part of her Master degree research. Worked in the tests, in discussions of results and in text
writing.
(2) Supervisor of the Master student (1). Responsible for the research idea. Worked supervising the developing
of the research, discussing the methodology and results and on the final correction of the text.
(3) Part of the research group, collaborated in the tests, prepared the images and participated on discussions of
the results.
(4) This paper is part of his Undergraduate research. Collaborated with author (1) during the tests and also
participated of the discussion of the results.
Key Message
This paper contributes, with theoretical bases discussion and statistical analysis, for interpretation of drilling
technology results that, although widely used, has no the directly interpretation released by manufacturers.
Abstract
The drilling resistance test has been widely used in tree inspections and structures. As the needle pierces the
wood, the equipment registers, in amplitude graphs (%), the resistance to drilling offered by the wood. So, it´s
expected that in the presence of a hollow, the amplitude obtained in the graph is zero, allowing its detection.
However, when the wood doesn´t have a hollow, the results of the amplitude doesn´t have an obvious
interpretation and can be influenced by different factors. The objective of this research was to use discs, from
different tree species and with different types of deterioration, to study the behavior of the amplitude of the
drilling resistance. In this research, the amplitude ranged from 0% to 40%, with the 0% sections corresponding
to hollows, allowing the confirmation that this tool is adequate for the detection of the location and approximate
size of hollows. In the heartwood, the values of amplitudes were superior and statistically different from those
obtained in the sapwood. There were statistical differences between drilling amplitude among the studied
species. The variance analysis showed that the amplitude in deteriorated regions was always lower (average
around 4%), except in the wood attacked by Coleoptera, whose deterioration was not captured by the equipment.
In some discs, there were peaks of amplitude of the drilling resistance, probably associated to
compartmentalization zones promoted in the tree tissues to protect themselves from the advance of the
deteriorated zone. This behavior may affect the interpretation of the inspection.
Key words: Tree Risk assessment, urban arborization, deterioration in trees.

14
Introduction
The drilling resistance is a semi-destructive test in which a drilling needle is inserted in the wood under
inspection. The needle must be very thin to capture tangential density differences and minimize material damage
and, on the other hand, can´t be so thin that could suffer from resonance or buckling problems (Tannert et al.,
2013). In general, the needle has a 3 mm diameter tip where the cutting edges are located, and 1.5 mm diameter
shaft (Nutto & Biechele 2015, Tannert et al. 2013). With the rotation, the needle cuts the wood and perforates the
material as it advances (Nutto & Biechele 2015, Botelho 2006). Some equipment allows the variation of the
advance speed of the needle (cm / min) as it´s rotation speed (turns / min), and it´s already known that this
adjustment must be done according to the hardness or the density of the wood (Nutto & Biechele 2015). Besides
the velocities, sharpening of the needle tip is also very important to reduce friction, which is one of the
responsible for interpretation problems of this technique´s results, especially in dense woods (Nutto & Biechele
2015, Tannert et al. 2013). While drilling, the needed energy is measures depending on the drilling depth of the
needle, and registers this parameter in a percent-amplitude graph. The more resistance the wood offers to
drilling, the greater the energy required. Some manufacturers offer new versions featuring two amplitude curves,
one representing the resistance of the drill to the rotation and another that represents the resistance to drilling,
this last one less affected by friction.
It is expected that in the presence of a hollow, the amplitude obtained in the drilling resistance graph is zero or
close to zero, allowing its detection. However, when the wood doesn´t have a hollow, the meaning of the
amplitude of drilling resistance has no obvious interpretation.
Considering that the equipment measures the resistance offered by the wood to drilling, it´s also expected that its
results can be correlated with resistance losses due to deterioration. So, there has been several studies aiming the
evaluation of the correlations between the amplitude of the drilling resistance obtained by the equipment and the
wood resistance (Botelho Jr., 2006) or its effectiveness in detecting deteriorations in wood structures (Brashaw et
al. 2011; Tannert et al. 2013, Rinn 2012), logs (Wang et al. 2005 apud Nutto & Biechele 2015) or trees
(Johnstone et al. 2010; Kubus 2009, Johnstone et al. 2007, Wang et al. 2008).
In order to contribute with information that would allow the interpretation of the drilling resistance test, the
objective of this work was to use real images of wood discs of different species and with different types of
deterioration to study the behavior of the drilling resistance amplitude.
Methodology
Sampling was composed of logs collected from six tree species: Centrolobium sp., Tabebuia ochracea,
Liquidambar styraciflua, Platanus sp., Poencianella pluviosa and Copaifera sp., widely spread in the urban
arborization of São Paulo State, Brazil. From these logs were removed 6 discs approximately 200 mm high.
Eight equidistant points were marked on each discs perimeter for measurements with the drilling resistance

15
equipment (IML F400, Germany) - Figure 1. The measurements were performed in the perpendicular direction
to the grain in the 8 marked points (measurement routes), obtaining 48 graphs of amplitude of drilling resistance.
To help with the test, the discs were fixed to a concrete table with sergeants (Fig 1).
Fig 1 Drilling Resistance Test in discs
The species used in the research had different densities and deterioration conditions (Table 1). The model of
equipment used allows the choice of different levels of feed speed (from 15cm / min to 200cm / min) and needle
rotation (1500 revolutions per minute at 5000 rotations / minute). This adjustment is usually made according to
the density of the wood. In light woods the feeding speed must be higher to allow sufficient amplitude so that the
curve variations can be seen. In denser woods the feed speed must be reduced and the rotation increased so
drilling is possible. Considering these aspects of the equipment, feeding and rotation velocities were adopted
according to the wood density, and it was also necessary to consider the deterioration condition of the disc,
avoiding that it would break with the needle entry (Table 1).
The wood condition influenced the choice of feed velocity, although the species Liquidambar and Platanus has
practically the same density, the feed velocity used in the Liquidambar was lower than in the Platanus (Table 1).
The feed speed used in the Copaifera sample could also be 100 cm / min, but it was necessary to reduce it and
increase the rotation so that the drill inlet did not break the disc (Table 1).
Table 1 Values of basic density (bas), feed velocity (VA) and rotation speed (VR) adopted for each species
Species bas
kg.m-3
VA
cm/min
VR
rot/min
Liquidambar styraciflua 490* 100 2500
Platanus sp. 500** 150 2500
Copaifera sp. 575*** 50 3500
Centrolobium sp. 660**** 100 2500
Tabebuia ochracea 840*** 100 2500
Poencianella pluviosa 890**** 50 3500
*Lima et al. 2015;
**Freitas 2012;
***IPT http://www.ipt.br/informacoes_madeiras3.php?madeira=38;
****Remade http://www.remade.com.br/madeiras-exoticas/116/madeiras-brasileiras-e-exoticas/arariba

16
After the drilling resistance tests were completed, the discs were cut to the exact position of the drill travel on the
different routes. These sections were detailed through photographic record in order to compare the amplitude
plots of drilling resistance with the different zones of the wood through which the drilling occurred. The
equipment model used in this research provides two amplitude curves, one representative of the power supply
(power needed for drilling) and the other for the drilling resistance. However, older models provide only the feed
curve. Nutto and Biechele (2015) observed that in high density wood the feed amplitude tends to increase with
the drilling depth due to friction. This increase in amplitude may cause wrong interpretation of the results, since
it can camouflage the amplitude drop that would be caused by deterioration.
The discs were macroscopically analyzed to identify the heartwood, sapwood and deteriorated areas.
Descriptions of the species were obtained in the literature (Lima et al., 2015, Freitas 2012 and IPT and Remade
sites) as well as experienced person support in visual assessment. For the species in which it was possible to
distinguish the heartwood and sapwood regions, the average amplitude of drilling resistance obtained separately
in the bark, heartwood, sapwood and deterioration zones was determined.
For all discs, the drilling resistance graphs obtained on each route were compared with the photographic images,
by image overlay. In the case of discs with heart and sapwood zones, the average amplitudes of drilling
resistance were statistically analyzed using multivariate variance analysis. In this research, only the amplitude
plots of drilling resistance were used because the use of the two graphs (power amplitude and resistance to
drilling) made the image overlay very loaded with information.
Results and Discussion
In the Centrolobium, Platanus, Poencianella and Copaífera discs, it was possible to define the heartwood and
sapwood zones from coloring distinction (Fig 2), whereas at the Tabebuia and Liquidambar species this
distinction was not possible (Fig 3). The characteristics of the heartwood and sapwood differentiation as a
function of color differentiation were similar to those proposed in the literature (Chudnoff 1980; Lima et al.,
2015, Freitas 2012 and IPT and Remade sites). Not all of the discs contained hollowed areas and all differed in
types and levels of deterioration (Table 2).
Fig 2 Images of the Cetrolobium sp. (a), Platanus sp. (b), Poencianella pluviosa (c) and Copaifera sp. (d) discs
with color distinction between heartwood and sapwood

17
Fig 3 Images of the discs of the species Tabebuia ochracea (a) and Liquidambar styraciflua (b), without
distinction of color between heartwood and sapwood
Table 2 Short description of disc deterioration
Species Description
Centrolobium sp. Hollow caused by termites
Tabebuia ochracea Coleopterans attack
Liquidambar styraciflua Near the pith there is a small area with an early stage of fungal decay and lateral
cracking from the pith to the bark
Platanus sp. Most of the wood shows signs of fungi attack and there are some hollowed areas
caused by termites
Poencianella pluviosa Fungi attack at the center of the disc
Copaifera sp. Hollow caused by termites and fungi deterioration around them
Considering the methodology, it was possible to obtain 8 graphics of drilling resistance amplitude from each
disc, corresponding to the 8 measurement routes, which were overlaid with the photographic images (Example in
Fig 4). The same result observed in the example of Fig 4 was obtained for the six-species studied (48 overlapped
images).

18
Fig 4 Superposition of the amplitude graph of drilling resistance to the photographic image obtained from the
disc, in the position of the needle passage of the resistograph. Species: Centrolobium sp.
The detailed analysis of the 48 superimposed images allowed to verify the existence of a pattern of behavior of
the amplitude of drilling resistance against the different zones of the wood (healthy and with deterioration)
traveled by the needle during the drilling.
For all studied species, the amplitude ranged from 0% to 40%, with the 0% sections corresponding to the
hollows, as expected. This result confirms that this tool is adequate to detect the location and the approximate
size of hollows. The same result was highlighted by Kubus (2009) when analyzing the condition of a large
monumental tree in Poland. The author presents records of 10 graphs of resistance to drilling, obtained in
different positions of the tree, in which there are several zones with amplitudes close to zero (probably hollowed
zones) and, in the other regions, average amplitudes of resistance to perforation of 16%. In the bark area the
average amplitudes were 6%. Brashaw et al (2011) obtained drilling resistance varying from 0 to 25% in zones
with different levels of wood degradation.
In this research, in the species in which it was possible to define the heartwood and sapwood regions, there was
amplitude variation in these regions (Examples in Fig 4). In the two species in which it was not possible to
visualize the distinction between heartwood and sapwood (Tabebuia ochracea and Liquidambar styraciflua), the
amplitude of the drilling resistance graph also does not show variations (Ex: Fig 5). Similar graphs, without
heartwood and sapwood visual distinction, were obtained by Kubus (2009).

19
Fig 5 Superposition of the amplitude graph of drilling resistance to the photographic image obtained from the
disc, in the position of the needle passage of the resistograph. Species: Liquidambar styraciflua
In the heartwood, the values of amplitudes were higher than those obtained in the sapwood. For the four species
in which it was possible to define the heartwood and sapwood regions (Fig 2) this result was statistically
demonstrated (Fig 6). The analysis of variance showed that amplitudes in deteriorated regions (with or without
hollows) were always lower (average around 4%), always higher in the heartwood regions (average around 22%)
and sapwood region (average around 15%) and of bark (average around 14%) intermediate and statistically
equivalent (Fig 6).

20
Fig 6 Representative graph of the average values and the variability of amplitude obtained in the different zones
of the disc
Considering only the heartwood and sapwood regions without apparent deterioration, there was a differentiation
between species. The amplitudes of drilling resistance were higher (about 25%) and statistically different for
Platanus sp. and the same (about 11%) for the other species. This result is not expected, since the Platanus sp.
has the lowest density (Table 1) and the drilling resistance, in general, has a positive correlation with density
(Couto et al., 2013, Costelo & Quarles 1999). However, it is important to note that the amplitude of drilling
resistance can be affected by the advance velocity, which for Platanus sp. was higher (Table 1) and that, in order
to properly interpret as well as to compare amplitude results obtained in the resistance test, it´s necessary to
know, in advance, the profiles obtained in the whole condition (Martinez 2016, Matheny et al., 1999). For the
Poencianella pluviosa hearthwood, denser wood (Table 1), was statistically different from the others, with a
drilling resistance of about 30% compared to 22% of the others.
For the Tabebuia ochracea, with beetle insect attack (Fig 3), the amplitude of drilling resistance did not show
variations that allowed, in an inspection, to visualize the wood state (Example in Fig 7).
Zone (1 = bark; 2 = sapwood; 3 = heartwood; 4 = decay wood
Am
plitu
de o
f D
rilli
ng
resis
tan
ce (
%)
1 2 3 4
0
4
8
12
16
20

21
Fig 7 Superposition of the amplitude graph of drilling resistance to the photographic image obtained from the
disc, in the position of the needle passage of the resistograph. Species: Tabebuia ochracea. Deterioration caused
by Coleoptera insects
In the Liquidambar styraciflua disc there was a significant crack (Fig 3) that was not identified in any drilling
resistance amplitude graph, because no needle route passed through the crack site (Fig 5). This result stands out
the fact that this type of inspection is punctual, and it is important to know where it should be applied. Botelho
(2006) and Tannert et al (2014) had the same conclusion.
It was possible to observe that in some discs there was, in the contour of the fungi deteriorated zone, a darker
colored region. In these cases, an increase peak in the amplitude of the drilling resistance was observed (Fig 8).
Similar result was obtained by Rinn (1996) and was explained by the compartmentalization process promoted in
the trees tissue to protect them from the advance of the deteriorated zone. In this process the tree develops a
thicker cell wall tissue, in addition to obstruct cell voids, causing this tissue to act as a deterioration barrier
(Fraedrich 1999, Shigo 1977, Shortle 1979). The darker color is due to the antimicrobial substances produced
(Shigo1977, Shortle 1979). The Platanus sp. disc was the only one that presented these peaks in the sapwood
zone, which may have influenced the average value of amplitude of drilling resistance, making this species,
although with lower density, present the highest values of amplitude.

22
Fig 8 Details of amplitude peak observed in zones close to fungal decay a) Centrolobium sp., b) Platanus sp., c)
Poencianella pluviosa, d) Copaifera sp
Rinn (1996) observed that differentiated patterns of behavior of the drilling resistance plot may help the
inspection interpretation. The authors point out that in fungi deteriorated wood, the amplitudes are low and
approximately homogeneous, while in termite deteriorated areas or with cracks present the graph is more
variable, with higher amplitudes (surrounding wood in good condition) followed by amplitude values much
smaller and localized. In the Platanus sp. and Poencianella pluviosa discs, in which there was a large fungus
deteriorated zone (Fig 2 and Table 2), the drilling resistance graph shows a continuous segment of low
amplitudes (Fig 9a and b), according to the behavior indicated by Rinn (1996).
Fig 9 Superposition of the amplitude graph of drilling resistance to the photographic image obtained from the
disc, in the position of the needle passage of the resistograph. Species: a) Platanus sp.., b) Poencianella pluviosa

23
Conclusion
For all studied species, the amplitude ranged from 0% to 40%, with the 0% sections corresponding to the
hollows, as expected, allowing confirming that this tool is adequate for the detection of the location and the
approximate size of hollows. In the heartwood, the values of amplitudes were superior and statistically different
from those obtained in the sapwood. There were also statistical differences between species. The variance
analysis showed that the amplitude in deteriorated regions (with or without hollows) was always lower (average
around 4%), except in the Coleoptera attacked wood, whose deterioration was not captured by the equipment. In
some discs, amplitude increase peaks were observed on the drilling resistance graph, probably associated to
compartmentalization zones promoted in the tree tissue to protect themselves from the advancement of the
deteriorated zone. This behavior, also observed by other researchers, can affect the inspection interpretation,
hiding, for example deterioration.
Acknowledgements
The authors would like to thank the National Council for Scientific and Technological Development (CNPQ) for
the scholarships and Sao Paulo Research Foundation (FAPESP) - Proc. 2015/05692-3 - for the research funding.
They also thank the Environment Department of UNICAMP for donating the logs used in the tests and to PD
Instruments Company for lending the equipment used in tests of drilling resistance.
Conflict of Interest
The authors declare that they have no conflict of interest.
References
BOTELHO JR, J.A. (2006) Avaliação não destrutiva da capacidade resistente de estruturas de madeira de
edifícios antigos. Thesis, Universidade do Porto, Portugal
BRASHAW, B. K.; VATALARO, R.; ROSS, R. J.; WANG, X.; SCHMIEDING, S.; OKSTAD, W. (2011)
Historic Log Cabin structural condition assessment and rehabilitation – A case study. In: International
nondestructive testing and evaluation of wood symposium, 17, Hungria. Anais... Hungria: University of West
Hungary, v.2, p. 505-512
COSTELO L.R. QUARLES, S.L. (1999) Detection of wood decay in Blue Gum and Elm: an evaluation of the
resistograph and the portable drill. Journal of Arboriculture, EUA, 25(6), p. 311 – 318

24
COUTO AL, TRUGILHO RF, NEVES TA, PROTÁSIO TP, Sá VA. (2013) Modeling of basic density of wood
from Eucalyptus grandis and Eucalyptus urophylla using nondestructive methods. Cerne, v.19, n.1, p.27-34
FRAEDRICH, B. R. (1999) Compartmentalization of decay in trees, TR-18, Technical Report, Bartlett Tree
Research Laboratories, Charlotte, NC
FREITAS, T. (2012) Caracterização tecnológica da madeira de Platanus sp. Monografia, Departamento de
Ciências Florestais e da Madeira, Universidade do Espirito Santo, ES
INSTITUTO DE PESQUISAS TECNOLÓGICAS, IPT. Informações sobre Madeiras. Disponível em
<http://www.ipt.br/informacoes_madeiras/31.htm> Acessed 04 November 2016
JOHNSTONE, D. M.; ADES, P. K.; MOORE, G. M.; SMITH, I. W. (2007) Predicting Wood Decay in
Eucalypts Using an Expert System and the IML- Resistograph Drill. Arboriculture & Urban Forestry, 33(2),
p. 76-82
JOHNSTONE, D.; MOORE, G.; TAUSZ, M.; NICOLAS, M. (2010) The Measurement of Wood Decay in
Landscape Trees, Arboriculture & Urban Forestry, 36(3), p. 121-127
KUBUS, M. (2009) The Evaluation of Using Resistograph when Specifying the Health Condition of a
Monumental Tree. Notuale Botanicae Horti Agrobotanici Cluj-Napoca, v. 37, n. 1, p. 157–164
MARTÍNEZ, R. et al. (2015) NDT to identify biological damage in wood. In: International nondestructive
testing and evaluation of wood symposium, 19, Brasil, Anais…Brasil: Rio de Janeiro, p. 453-461.
MARTÍNEZ, R. (2016) Métodos no destructivos de estimación de la densidad de la madera. Thesis, 210p.
Universidad de Santiago de Compostela, Espanha
MATHENY, N.P.; CLARK, J.R., ATTEWELL, D. (1999) Assessment of fracture moment and fracture angle in
25 tree species in the United States using fractometer. Journal of Arboriculture, v.25-1, p.18 – 23
NUTTO, L.; Biechele, T. (2015) Drilling resistance measurement and the effect of shaft friction – using feed
force information for improving decay identification on hard tropical wood. In: International nondestructive
testing and evaluation of wood symposium, 19 Anais… Brasil, Rio de Janeiro, p. 156-160
RINN, F. (1996) Resistographic visualization of tree-ring density variations. Radiocarbon, p. 871-878

25
RINN, F. (2012) Basics of Typical Resistance-Drilling for Timber Inspection. Holztechnologie, 53, p. 24-29
SHIGO, A.L.; MARX, H. (1977) Compartimentalization of decay in trees. (CODIT). Inf. Bull. U.S. Dep. Agric.,
405, 73p
SHORTLE, W.C. (1979) Mechanisms of Compartimentalization of Decay in living trees. Symposium on wood
decay, v.69, n.10, p.1147-1151
TANNERT, T.; ANTHONY, R.W.; KASAL, B.; KLOIBER, M.; PIAZZA, M.; RIGGIO, M.; RINN, F.;
WIDMANN, R.; YAMAGUCHI, N. (2013): In situ assessment of structural timber using semi-destructive
techniques. Materials and Structures DOI 10.1617/s11527-013-0094-5. July 2013
WANG, X.; ALLISON, R.B. (2008) Decay Detection in Red Oak Trees Using a Combination of Visual
Inspection, Acoustic Testing, and Resistance Microdrilling. Arboriculture & Urban Forestry, 34(1), p. 1-4
WILCOX, W.W. (1978) Review of literature on the effects of early stages of decay on wood strength, Wood
and Fiber, p. 252-257

26
ARTIGO 2: ULTRASONIC TOMOGRAPHY IN LOGS OF TREES
WITH DIFFERENT TYPES OF DETERIORATION
Submetido ao periódico: Revista Árvore

27
Ultrasonic tomography in logs of trees with different types of deterioration
Authors and Affiliations:
Mariana Reis (1), Raquel Gonçalves (2), Stella Stopa Assis Palma (3), Danilo Profeta Ziller (4)
(1) (3) Master Student, School of Agricultural Engineering, Nondestructive Testing Laboratory, University of Campinas, Campinas, SP, Brasil
(2) Professor, School of Agricultural Engineering, Nondestructive Testing Laboratory, University of Campinas, Campinas, SP, Brasil. E-mail: [email protected]
(4) Undergraduate Student, School of Agricultural Engineering, Nondestructive Testing Laboratory, University of Campinas,
Campinas, SP, Brasil
Author Contribution Statement:
(1) This paper is part of her Master degree research. Worked in the tests, in discussions of results and in text
writing.
(2) Supervisor of the Master student (1). Responsible by the research idea. Worked supervising the developing of
the research, discussing the methodology and results and on the final correction of the text.
(3) Part of the research group, collaborated on discussions of the results and in text writing.
(4) This paper is part of his Undergraduate research. Collaborated with author (1) during the tests and also
participated of the discussion of the results.
Key Message
This paper contributes, with theoretical bases discussion and statistical analysis, for interpretation of ultrasonic
tomography technique that, although widely used, needs improvement to be more useful and safe for tree risk
assessment.
Abstract
The mechanical wave propagation is affected by elastic properties differences and impedance differences on
propagation medium. Deviations in the wave routes also affect propagation, and therefore velocity. The
deteriorated wood will have its properties of strength and stiffness affected, therefore, causing variations in
velocity of wave propagation when compared with sound wood. Hollows in the wood will cause changes in the
wave path, which seek the material medium, also affecting the velocity by the change of course. To facilitate
visualization, speed variations can be associated with color and, through interpolation software, images are
constructed. This procedure, which can have different levels of sophistication, is called acoustic tomography,
which the greatest limitation is the interpretation of the image produced. Considering the mentioned aspects, the
objective of this research was to evaluate, qualitative and quantitatively, results of ultrasound tomography in face
of different types and levels of deterioration. The tests were performed on logs of 6 tree species. Hollowed areas
presented reduction of velocities greater than 70%, while zones deteriorated by fungi begin to be highlighted on
the tomographic imagens with reductions of 30% in speed. In the case of cracks or galleries the image detailing
depends on the relationship between the wavelength and the size of these defects. In general, the images of
ultrasound tomography are adequate to provide important information for the tree risk assessment.
Keywords: velocity variation, acoustic tomography, fungal decay, hollowed wood, tree risk assessment

28
Introduction
Different types of decay can cause changes in the wood structure, affecting the wave propagation
(Bucur 2006) and these changes can be used to detect the wood internal defects (Wang 2013, Brancherian et al.
2012, Wessels et al. 2011).
In case of fungi attack, the wood becomes less resistant and less rigid. Brazolin et al. (2014)
demonstrated statistical differences between modulus of rupture and elasticity in bending in sound and in wood
deteriorated by fungi. The reductions of strength and stiffness obtained by Brazolin et al. (2014) varied from
about 70% in the wood with incipient deterioration to about 90% in wood severe decayed. The same result was
obtained by Trevisan et al. (2007), with statistically significant strength differences in sound and wood decayed
by fungus reached 42% in compression and in 52% in bending. Such reductions in strength and stiffness produce
reductions in wave propagation velocity (USDA 2014, Deflorio et al., 2007, Ross et al. 1998).
In the case of wood decayed by termites or other xylophage’s insects, the wood presents galleries in its
interior, but the surrounding material is generally sound. Weiler et al. (2013) showed statistically significant
variations of modulus of elasticity (MOE) and rupture (MOR) when termite deterioration was between 20% and
100%.
The association of fungal attack, followed by termites may be responsible for the existence of hollowed
areas in trees. In these cases (galleries and hollows), the wave propagation will suffer deviations, and consequent
velocity reduction. Deviations occur because mechanical waves seek the material medium to propagate (Weiller
et al. 2013, Secco et al. 2012, Najafi et al. 2009, Lin et al. 2008, Bucur 2006, Wang et al. 2007, Wang et al.
2004). Thus, if deteriorations or cavities in the wood reduce the velocity of wave propagation, the variations can
be used as identifiers of changes in the material.
In order to obtain a scan in the inspected element, a measurement mesh (Divos and Szalai, 2002), called
diffraction (Example in Fig. 1a) is used. Through this mesh it is possible to obtain measurement routes, whose
quantity depends on the number of sensors used. To facilitate visualization, velocities ranges are associated with
colors and, through interpolation software (Du et al., Feng et al., 2014, Zeng et al., 2013), images are constructed
(Example in Fig. 1b). This procedure, which may have varying degrees of sophistication, is called acoustic
tomography. The quality of the image is affected by the interpolation process used, but the accuracy of the
results, also suffers interference from the power of the equipment and the quality of the data obtained in the field.
Fig. 1 Example of measurement mesh (a) and tomography image generated (b)

29
There are several commercial acoustic tomography equipment on the market, mainly using stress wave
propagation (called sonic tomography), but there is still a lot of research in the area (Balázs & Divós 2015,
Yamashita et al 2015, Trinca et al. 2015 a e b, Arciniegas et al. 2014, Trinca et al. 2013 a,b e c, Van Dijk et al.
2013, Turpening 2011, Secco et al. 2012, Sanabria et al. 2011, Gonçalves et al. 2011, Secco et al. 2011a e b,
Secco et al. 2010, Kim et al. 2009, Batista et al. 2009, Brancheriau et al. 2008, Lin et al. 2008, Secco et al. 2004,
Bucur 2002, Comino et al. 2000), proof of the need for a better understanding of the meaning of the generated
image, as well as its reach in terms of accuracy. Pereira et al. (2007) summarizes this understanding by
concluding that acoustic tomography is a developing technique and, therefore, lacking in studies. The same
conclusion was presented by the USDA (2014), which discusses acoustic tomography in one of its chapters,
presenting examples of tomographic images produced using commercial tomographs, but indicating that the
greatest limitation of the method is still the interpretation of the tomographic image. Du et al (2015) also point
out that the quality of reconstructed imagens by acoustic tomography can be improved.
Considering the aspects mentioned, the objective of this research was to evaluate, qualitative and
quantitatively, the results of ultrasound tomography in face of different types and levels of deteriorations.
Methods
The wood samples used in this study were taken from trunks of trees of the species: Centrolobium sp.,
Tabebuia ochracea, Liquidambar styraciflua, Platanus sp., Poencianella pluviosa and Copaifera sp. In order to
carry out the ultrasonic tests, discs with a minimum of 200 mm height were cut from those trunks.
The ultrasound tests were performed using the diffraction mesh (Fig. 1a) in which 8 measurement
points were adopted for all species. The measuring points were approximately equidistant and positioned at the
middle height of the disc. As used in the standing tree tests, at each measurement point, 3 mm holes were drilled
for the introduction of the transducer tip, to ensure coupling of the transducer to the wood and not to the bark.
The tests performed on each diffraction mesh measurement route (Fig. 1a) were done using
conventional ultrasound equipment developed by the research group in partnership with a technology-based
company (USLab, Agricef, Brazil) and 45 kHz-frequency dry tips longitudinal transducers (Fig. 2). To obtain the
tomography image we used software (ImageWood 2.0) also developed in the research group.

30
Fig. 2 Centrolobium sp. disc being tested by ultrasound
After the ultrasound tests, the discs were cut at the height where the measurements were taken and the
surface was polished to be analyzed and photographed in detail. The species presented different conditions of
deterioration and the decayed zones were recognized only macroscopically through a detailed visual analysis of
its surfaces. The generated pictures were used to obtain representative mask of the deteriorated zone, using the
free software ImageJ. This mask was used to calculate the percentage of deteriorated area.
The tomographic images were generated in two ways. In the first one, 6 velocity bands were used, based
on the percentage of the maximum velocity obtained on discs (red up to 20%, orange 20% to 30%, yellow 30%
to 50%, green 50% to 70%, blue 70% to 80% and black from 80% to 100%). According to a USDA publication
(2014), a 50% reduction in velocity means that the region presents severe deterioration, so the second form of
image generation was done considering only two colors: brown for zones with speeds above 50% of the
maximum velocity obtained on discs and yellow for zones with speeds below 50% of maximum speed,
considering as areas with severe deterioration. These two-color images were used to determine the percentage of
impaired area inferred by tomography, also using the free ImageJ software. The images generated in different
colors by the ultrasound tomography were visually compared with the pictures obtained from the surface. In
addition to this visual analysis, the percentage of deteriorated area, inferred by tomographic images with two
colors, was compared with the percentage of deteriorated area obtained from the mask created by the picture of
the discs surface.
Results and Discussion
The visual analysis of the treated surfaces allowed detailing the deteriorated zones in the discs of the
different species (Table 1)

31
Table 1. Summary description of the visual analysis of the deteriorations in the discs
Species Description
Centrolobium sp. Large hollow caused by termite attack
Tabebuia ochraceae Numerous galleries caused by Coleoptera attack
Liquidambar
styraciflua Lateral crack from the pith to the bark caused by drying process
Platanus sp. Most of the wood shows signs of attack by fungi and there are some hollowed
areas caused by termites
Poencianella pluviosa Fungus attack in the center of the disc
Copaifera sp Large hollow caused by termites. In the surroundings of these hollows there is
deterioration by fungi
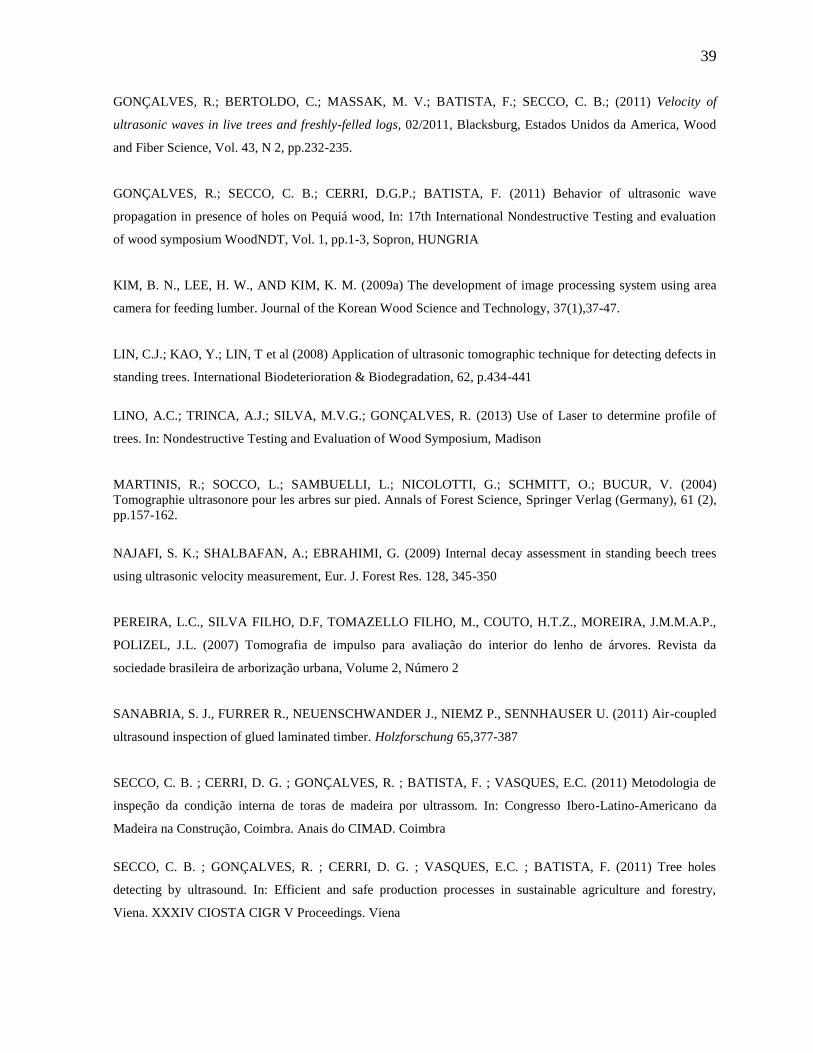
The images of Centrolobium sp. and Copaifera sp.discs (Fig.3a, 3f) are those were the red and orange
colors appear, which represent zones with velocities lower than 30% of the maximum velocity (or velocity loss
greater than 70%). These discs are the ones that have great hollowed regions. Thus, although the image does not
represent the exact shape or size of the decayed region, it was efficient to assess the falling risk of these two logs.
The images identified advanced deterioration inside the logs, which would be enough to indicate the risk
involved. Differences in image precision can be obtained using different algorithmic to interpolate velocities in
acoustic tomography (Du et al. 2015) but, in spite of these differences, none tomographic imagens constructed
using interpolation methods proposed by Du et al. 2015, Feng et al. 2014, Zeng et al. 2013, showed precisely the
shape or the dimension of the internal hollows. On the other hand, in the same way as discussed here, the
representation was enough to indicate the degree and the extension of the decay. The use of more complete
algorithmic or other data manipulation, as compensate radial/tangential velocities, can improve the correctly
detection of healthy areas (Du et al. 2015), minimizing the overestimation of decayed areas mentioned by Wang
et al. (2009) or the worse quality of the image near the sensor (Gilbert and Smiley 2004).
In the Liquidambar styraciflua disc (Fig. 3c) there´s also a small region with the orange color located at
the edge, representing reduction of 70% to 80% of the velocity. This region corresponds to the zone of greater
opening of the crack in the disc. The rest of the image is mostly black (velocity losses below 20%) with a zone
with velocity loss between 30% and 50% (green), which is on the same side of the crack. The tomographic
image analysis would not adequately identify the size and position of the defect (crack). The ability to detect
defects using wave propagation is associated with the relationship between wavelength () and defect size
(Bucur 2006). In general, the detection sensitivity is of /2 order (Bucur 2006). In the case of the Liquidambar
styraciflua specimen, the maximum speed (integral area) was 2000 m/s, so 44 mm. Thus, defect detection
from 22 mm is expected to be possible. The largest aperture of the crack, located at the edge of the disc and
detected by the tomographic image (Fig. 3c) is 25 mm, consistent with the theoretical aspects of this test.
The image of the Tabebuia ochracea (Fig. 3b) specimen has only colors green and yellow. There are
many yellow cords within the green zone. Since the cords are representative of interferences caused by the
interpolation system used by the software (Trinca et al., 2015, Trinca et al., 2013 a, bc, Van Dijk et al., 2013,
Secco et al. 2012, Secco et al. 2011a e b, Secco et al. 2010, Batista et al. 2009), the interpretation of this image
would consider that, in the internal part of the piece, the loss of velocity would be between 30% and 50% which,
32
according to USDA (2014) would indicate strength loss about 50%. At the edges of the piece there are large
areas in yellow, indicating speed losses between 50% and 70% that, according to USDA (2014), represent severe
deterioration. The visual analysis shows that the piece is completely taken by cavities and at its extremities there
is a more severe Coleoptera attack. Therefore, in this case, the diagnosis of the inspection would lead to consider
the piece with considerable loss of resistance, although it is not possible to visualize the cavities in the image.
The non-visualization of the cavities in the image was already expected since, in this case, the velocity in the
sound wood is also about 2000 m / s ( 44 mm) and the cavities size are way below 22 mm (/2).
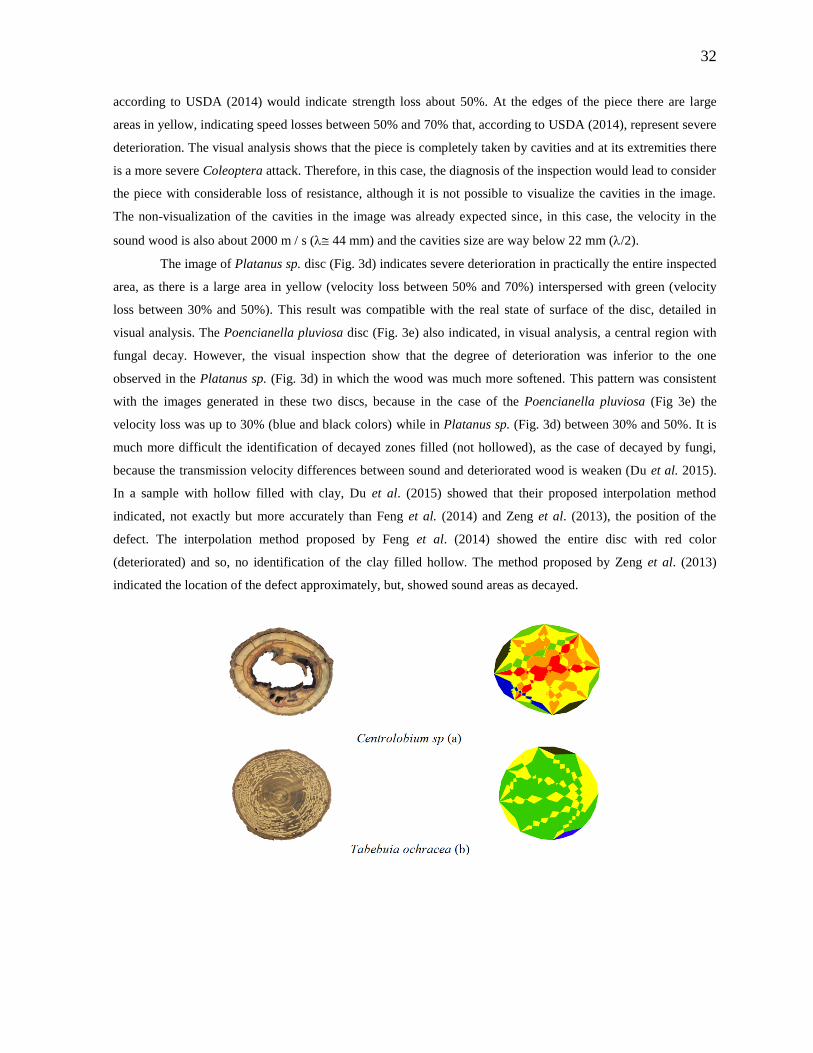
The image of Platanus sp. disc (Fig. 3d) indicates severe deterioration in practically the entire inspected
area, as there is a large area in yellow (velocity loss between 50% and 70%) interspersed with green (velocity
loss between 30% and 50%). This result was compatible with the real state of surface of the disc, detailed in
visual analysis. The Poencianella pluviosa disc (Fig. 3e) also indicated, in visual analysis, a central region with
fungal decay. However, the visual inspection show that the degree of deterioration was inferior to the one
observed in the Platanus sp. (Fig. 3d) in which the wood was much more softened. This pattern was consistent
with the images generated in these two discs, because in the case of the Poencianella pluviosa (Fig 3e) the
velocity loss was up to 30% (blue and black colors) while in Platanus sp. (Fig. 3d) between 30% and 50%. It is
much more difficult the identification of decayed zones filled (not hollowed), as the case of decayed by fungi,
because the transmission velocity differences between sound and deteriorated wood is weaken (Du et al. 2015).
In a sample with hollow filled with clay, Du et al. (2015) showed that their proposed interpolation method
indicated, not exactly but more accurately than Feng et al. (2014) and Zeng et al. (2013), the position of the
defect. The interpolation method proposed by Feng et al. (2014) showed the entire disc with red color
(deteriorated) and so, no identification of the clay filled hollow. The method proposed by Zeng et al. (2013)
indicated the location of the defect approximately, but, showed sound areas as decayed.

33
Fig. 3 Pictures of the surfaces of the discs from the different species and images of its ultrasonic tomography
Legend: percentages of maximum speed: red up to 20%, orange 20% to 30%, yellow from 30% to 50%, green
from 50% to 70%, blue from 70% to 80% and black from 80% to 100% %
For the Centrolobium sp. and Copaifera sp. discs, the percentage of decayed area (Table 2) obtained by
the representative mask of zones with deterioration (Fig. 4) was approximately 30% lower than the decayed
percentage area infered using the two colors tomographic image (Table 2). Wang et al. (2009) concluded that an
internal defect in the tree trunk tends to be overestimated in it size using acoustic tomografy. Areas with hollows
show loses in velocities superior to 70% (Fig. 3), but the two colors tomographic images adopted as reference
the one proposed by the USDA (2014), corresponding to velocity loss around 50% (zones in yellow in Fig. 4).
So, the area of this zone (yellow) also covered regions not affected by the hollow, explaining the differences
between percentage of decayed areas (Table 2). Trinca et al. (2015) also obtained loses of velocity superior to
70% in holow zones.
On the other hand, in discs with zones deteriorated by fungi (Platanus sp. and Poencianella pluviosa)
the tomographic image underestimated the real area deteriorated (Table 2). This can be explained because the

34
reduction of velocity is associated by the strength and stiffness loss which, in turn, depends on the level of the
decay (Trinca et al., 2015) and the level of the decay was not considerated for mask creation. The mask (Figure
3) was constructed based only on size and not based on the deterioration level. The results of Trinca et al. (2015)
indicate that for insipient decay in wood attacked by fungi the vlocity loss is only around 10%, reaching about
80% in wood with severe decay. As the Poencianella pluviosa disc show, in visual analysis, an insipient to
moderate fungal decay, the velocity loss will be not represented in two colors tomography because it is less than
50%.
In the case of the Tabebuia ochracea specimen it was not possible to obtain a mask due to the difficulty
in obtaining the sum of the areas of the numerous of small galleries, which were also superficial.
Table 2. Percentage of deteriorated area using the photograph of the discs surfaces and the image of ultrasound
tomography and difference between these two percentages
Deteriorated area (%)
Species Mask obtaine in
Surface picture
Tomographic image* Difference
(%)
Centrolobium sp. 48,09 78,34 -30,25
Copaifera sp 43,46 73,70 -30,24
Platanus sp. 66,60 53,64 12,96
Liquidambar styraciflua 1,83 2,29 -0,46
Tabebuia ochracea** - 32,14 -
Poencianella pluviosa 24,87 0 24,87
* Areas of the image with more than 50% of velocity loss; ** It was not possible to calculate because it was
composed of numerous small and superficial cavities
Applying the expected ultrasonic velocity variations to zones with hollows and with deterioration
caused by fungi (Trinca et al., 2015), new two colors tomographic images were constructed (Fig. 4). For the
discs with hollows (Centrolobium sp. and Copaifera sp), yellow represents areas with 70% velocity loss (Fig. 4a,
4f) and for disc deteriorated by fungi, the zone in yellow was considered to have 30% velocity loss (Fig. 4c, 4d,
4e). Of course, this discussion has no practical motivation, as it was considered from the knowledge of the actual
condition of the discs.The purpose of this discussion was to analyse the ranges of velocity losses associated with
hollows and zones decayed by fungi attack.
Using the same procedure to calculate deteriorated areas (mask and tomographic image), we can see
that the hollowed areas (Centrolobium sp. and Copaifera sp.species) provided by the ultrasonic tomography are
now closer to the actually affected areas (Table 3) than the first analysis (Table 2). In the case of the Platanus sp,
the area deteriorated by fungi inferred by tomography, which was previously underestimated, surpassed the
highlighted area by the mask in about 15%. In the Poencianella pluviosa specimen, whose deterioration by fungi
seems to be in the initial phase, the use of 30% of speed loss begins to highlight some deterioration, but still
inferior to that highlighted by the mask (Table 3).

35
Table 3 Percentage of deteriorated area using the photograph of the discs surfaces and the image of ultrasonic
tomography, and difference between these two percentages
Deteriorated area (%)
Species Surface photograph Tomographic image Difference
(%)
Centrolobium sp. 48,09 38,74* 9,35
Copaifera sp 43,46 45,50* -2,04
Platanus sp. 66,60 82,15** -15,55
Tabebuia ochracea*** - 32,14 -
Poencianella pluviosa 24,87 8,10** 16,77
* Areas of the image representing speed losses exceeding 70%; ** image areas representing speed losses of more
than 30%; *** It was not possible to calculate because it was composed of innumerable small and superficial
cavities

36
Fig. 4 Masks representative of the deteriorated zones based on the surface pictures (A1, B1, C1, D1 and E1) and
ultrasonic tomography images considering two situations. Situation 1: yellow: velocity losses greater than 50%
and brown: velocity losses less than 50% (A2, B2, C2, D2, E2). Situation 2: discs with hollow - yellow: velocity
losses greater than 70% and brown: velocity losses of less than 70% (A3, E3) and discs with presence of zones
deteriorated by fungi - yellow: velocity losses greater than 30% and brown: velocity losses of less than 30% (C3,
D3)
The tomography image generated with different colors (Fig. 3) is a little more confusing for a layman,
but conceptually allows better differentiation of velocity variation levels, and consequently the location of the
zones with greatest loss of wood stiffness, regardless of the level of the decay.
Using the USDA recommendation (2014) to construct images with two colors (above and below 50%
loss of velocity) the hollowed region shown is amplified (Fig. 2 and Table 2) and zones with deterioration by
fungi will only be identified when this deterioration is not in its initial stage. However, despite having
deficiencies to localize and to give the exact size of deteriorated areas, the ultrasonic tomography show to be an
important tool for falling tree risk assessment purposes, since it allows inferring the existence of zones with loss
of stiffness.
Conclusions
In this paper we evaluate, qualitative and quantitatively, the results of ultrasound tomography facing
different decay condition in wood.

37
Considering as hollowed areas those with 70% of velocity loss, the percentage of decayed area predict
by the tomography is closer to the actual condition. If 50% of velocity loss are considering as hollowed areas the
image interpretation tends to overestimated the hollowed areas.
In zones with moderate to severe decayed by fungi the velocity loss is greater than 50% whereas
velocity loss around 20% and 30% are associated with insipient to low decay.
The identification of cracks depends on the relationship between their size and the wave length, which
in turn depends on the transducers frequency. In areas with great number of small and superficial holes (as in
case of Coleoptera attack), although ultrasound tomography is not capable to identify the holes, the velocity loss
(30% to 50%) in the whole disc is an adequate result to the actual situation, since despite the attack being
superficial, it was numerous, so it is expected wood stiffness loss.
Ultrasound tomography images are adequate to provide important information for falling tree risk
assessment.
Acknowledgments
The authors would like to thank the National Council for Scientific and Technological Development (CNPQ) for
the scholarships and Sao Paulo Research Foundation (FAPESP) - Proc. 2015/05692-3 - for the research funding.
They also thank the Environment Department of UNICAMP for donating the logs used in the tests.
Conflict of interest:
The authors declare that they have no conflict of interest
References
ARCINIEGAS, A.; PRIETO, F; BRANCHERIAU, L.; LASAYGUES, P. (2014) Literature review of acoustic
and ultrasonic tomography in standing trees. Trees. 28(6): 1559-1567
BALAZS, M.; DIVOS, F., (2015) Glue laminated timber structure evaluation by acoustic tomography. In:
International Nondestructive testing and evaluation of wood symposium, Anais…, v.19. p.462 – 466
BATISTA, F.; GONÇALVES, R.; CERRI, D.G.P.; SECCO, C.B., (2010) Reprodução da condição interna de
peças de madeira através de imagens representativas da propagação de ondas, 06/2010, Científico Internacional,
XXVIII Congresso Nacional de Ensaios Não Destrutivos e Inspeção - 14a. Conferencia Internacional sobre
Evaluacion de Integridad y Extension de Vida de Equipos Industriales, Vol. 1, pp.1-12, Santos, SP, BRASIL

38
BATISTA, F.A.F; GONÇALVES, R.; CERRI, D.G.P.; SECCO, C.B. (2009) Reprodução da condição interna de
peças de madeira através de imagens representativas da propagação de ondas. Madeira: Arquitetura e
Engenharia, v.10 (25), p 23-32
BRANCHERIAU L., LASAYGUES P., DEBIEU E., LEFEBVRE JP. (2008) "Ultrasonic tomography of green
wood using a non-parametric imaging algorithm with reflected waves".Annals of Forest Science, 65(7):712-718
BRAZOLIN, S.; TOMAZELLO FILHO, M.; YOJO, T.; NETO, M.A.O.; ALBUQUERQUE, A.R.; JUNIOR,
C.R.S; (2014) Propriedades físico-mecânicas do lenho deteriorado por fungos apodrecedores de árvores de
tipuana tipu, Cerne, Lavras, v. 20, n. 2, p. 183-190
BUCUR, V. (2002) High resolution Imaging of Wood Structure. In: International Symposium on Nondestructive
Testing of Wood. Berkeley, California
BUCUR, V. (2005) Ultrasonic techniques for nondestructive testing of standing trees. Ultrasonics. 43:237-239
BUCUR, V. (2006) Acoustics of wood. 2nd ed. New York: Springer-Verlag, 393p
COMINO E, MARTINIS R, NICOLOTTI G (2000) Low current tomography for tree stability assessment, 278,
In: Backhaus G F, H Balder, and E ldczak (Eds). International symposium on plant health in urban horticulture,
Braunschweig, Germany, 22-25
DEFLORIO, G; FINK, S; SCHWARZE, F.W.M.R.; (2007) Detection of incipient decay in tree stems with sonic
tomography after wounding and fungal inoculation. Wood Sci Technol. 42:117-132.
DIVOS, F.; SZALAI, L. (2002) Tree evaluation by acoustic tomography. In: Proceedings of the 13th
International symposium on nondestructive testing of wood; 2002 August 19. 21; Berkeley, CA. Madison, WI:
Forest Products Society: 251.256
DU, X. et al. (2015) Stress Wave Tomography of Wood Internal Defects using Ellipse-Based Spatial
Interpolation and Velocity Compensation. BioResources, v. 10, n. 3, p. 3948-3962
FENG, H. et al. (2014) Tomographic image reconstruction using an interpolation method for tree decay
detection. BioResources, v. 9, n. 2, p. 3248-3263
GILBERT E, SMILEY E (2004). Picus sonic tomography for the quantification of decay in white oak (Quercus
alba) and hickory (Carya sp.). Journal of the Arboriculture 30(5), 277-281.
39
GONÇALVES, R.; BERTOLDO, C.; MASSAK, M. V.; BATISTA, F.; SECCO, C. B.; (2011) Velocity of
ultrasonic waves in live trees and freshly-felled logs, 02/2011, Blacksburg, Estados Unidos da America, Wood
and Fiber Science, Vol. 43, N 2, pp.232-235.
GONÇALVES, R.; SECCO, C. B.; CERRI, D.G.P.; BATISTA, F. (2011) Behavior of ultrasonic wave
propagation in presence of holes on Pequiá wood, In: 17th International Nondestructive Testing and evaluation
of wood symposium WoodNDT, Vol. 1, pp.1-3, Sopron, HUNGRIA
KIM, B. N., LEE, H. W., AND KIM, K. M. (2009a) The development of image processing system using area
camera for feeding lumber. Journal of the Korean Wood Science and Technology, 37(1),37-47.
LIN, C.J.; KAO, Y.; LIN, T et al (2008) Application of ultrasonic tomographic technique for detecting defects in
standing trees. International Biodeterioration & Biodegradation, 62, p.434-441
LINO, A.C.; TRINCA, A.J.; SILVA, M.V.G.; GONÇALVES, R. (2013) Use of Laser to determine profile of
trees. In: Nondestructive Testing and Evaluation of Wood Symposium, Madison
MARTINIS, R.; SOCCO, L.; SAMBUELLI, L.; NICOLOTTI, G.; SCHMITT, O.; BUCUR, V. (2004)
Tomographie ultrasonore pour les arbres sur pied. Annals of Forest Science, Springer Verlag (Germany), 61 (2),
pp.157-162.
NAJAFI, S. K.; SHALBAFAN, A.; EBRAHIMI, G. (2009) Internal decay assessment in standing beech trees
using ultrasonic velocity measurement, Eur. J. Forest Res. 128, 345-350
PEREIRA, L.C., SILVA FILHO, D.F, TOMAZELLO FILHO, M., COUTO, H.T.Z., MOREIRA, J.M.M.A.P.,
POLIZEL, J.L. (2007) Tomografia de impulso para avaliação do interior do lenho de árvores. Revista da
sociedade brasileira de arborização urbana, Volume 2, Número 2
SANABRIA, S. J., FURRER R., NEUENSCHWANDER J., NIEMZ P., SENNHAUSER U. (2011) Air-coupled
ultrasound inspection of glued laminated timber. Holzforschung 65,377-387
SECCO, C. B. ; CERRI, D. G. ; GONÇALVES, R. ; BATISTA, F. ; VASQUES, E.C. (2011) Metodologia de
inspeção da condição interna de toras de madeira por ultrassom. In: Congresso Ibero-Latino-Americano da
Madeira na Construção, Coimbra. Anais do CIMAD. Coimbra
SECCO, C. B. ; GONÇALVES, R. ; CERRI, D. G. ; VASQUES, E.C. ; BATISTA, F. (2011) Tree holes
detecting by ultrasound. In: Efficient and safe production processes in sustainable agriculture and forestry,
Viena. XXXIV CIOSTA CIGR V Proceedings. Viena

40
SECCO, C. B.; GONÇALVES, R.; CERRI, D. G.; VASQUES, E.C.; BATISTA, F. (2012) Behavior of
ultrasonic wave propagation in presence of holes on wood. Cerne (UFLA), v. 18, p. 12-16
SECCO, C. B.; Gonçalves, Raquel ; CERRI, D. G. ; BATISTA, F. (2010) Avaliação de dois tipos de medição na
detecção da condição interna da madeira por ultrassom. In: Congreso Latinoamericano y del Caribe de Ingeniería
Agrícola, Vitória.
SECCO, C.B.; GONÇALVES, R.; CERRI, D.G.P.; BATISTA, F.A.B. (2010) Avaliação de dois tipos de
medição na detecção da condição interna da madeira por ultrassom. Madeira: Arquitetura e Engenharia,
v.11(27), p.1-5
SOCCO, L.V., SAMBUELLI, L. MARTINIS, R., COMINO, E., AND NICOLOTTI, G. (2004) Feasibility of
ultrasonic tomography for nondestructive testing of decay on living trees. Research in Nondestructive
Evaluation, 15, 31-54
STANGERLIN, D.M., CORASSSA, J.N., GATTO, D.A., PEREIRA, R.L. (2015) Caracterização mecânica de
madeiras deterioradas em campo por meio de ultrassom e flexão estática, Comunicata Scientiae 6(3): 365-372
TREVISAN H.; TIEPPO, F.M.M.; CARVALHO, A.G.; LELIS, R.C.C. (2007) Avaliação de propriedades físicas
e mecânicas da madeira de cinco espécies florestais em função da deterioração em dois ambientes, Árvore,
Viçosa-MG, v.31, n.1, p.93-101
TRINCA, A. J.; GONÇALVES, R. (2009) Efeito da dimensão e da frequência sobre a determinação da
velocidade de propagação de ondas de ultrassom na madeira. Revista Árvore, v. 33 (1), p. 177-184
TRINCA, A.J., GUERRA, M.R., GONÇALVES, R. (2015) Velocity variation in wood as a function of defects,
In: International Nondestructive Testing and Evaluation of Wood Symposium, v.19. Rio de Janeiro, Brasil, p.
593 – 599
TRINCA, A.J.; GONÇALVES, R.; LINHARES, C.S.F. (2013) Ultrasonic tomography in detecting knots. In:
Nondestructive Testing and Evaluation of Wood Symposium. Madison
TRINCA, A.J.; GONÇALVES, R.; VAN DIJK, R.; AGUSTINHO, D.M. (2013) Interference of pith in
ultrasonic tomography. In: Nondestructive Testing and Evaluation of Wood Symposium. Madison
TURPENING, R. (2011) Acoustic imaging of Sandalwood (santalum albu) logs. In: Nondestructive Testing and
Evaluation of Wood Symposium. Sopron, Hungary

41
UNITED STATES DEPARTMENT OF AGRICULTURE (USDA), (2014) Wood and Timber Assessment
Manual. Forest Products Laboratory, Madison, WI, 2ed. 94p.
VAN DJIK R. (2013) Associação de métodos não destrutivos para inspeção de estruturas de madeira,
Dissertation, Universidade Estadual de Campinas, Campinas, SP, 2013.
WANG, X.; CARTER, P.; ROSS, R.J.; BRASHAW, B.K.. (2007) Acoustic assessment of wood quality of raw
forest materials – a path to increased profitability. Forest Products Journal, Madison, v.57, n.5, p.6-14
WANG, X; ROSS, R. J.; BRASHAW, B. K.; VERHEY, S. A.; FORSMAN, J. W.; ERICKSON, J. R. (2004)
Flexural properties of laminated veneer lumber manufactured from ultrasonically rated red maple veneer.
USDA/FS/FPL Research Note FPL-RN-0288. 5p
WANG X, WIEDENBECK J, LIANG S (2009). Acoustic tomograph for decay detection in black cherry trees.
Wood and Fiber Science 41(2), 127-137.
WEILER, M.; MISSIO, A.L.; GATTO, D.A.; GUTHS, W.G. (2013) Nondestructive Evaluation of Wood
Decayed by Xylophagous Organisms, Materials Research: 16(5): 1203-1208
YAMASHITA, K.; YAMADA, T.; OTA, Y.; YONEZAWA, H.; TOKUE, I. (2015) Detecting defects in
standing trees by an acoustic wave tomography with pseudorandom binary sequence code: simulation of
defects using artificial cavity. In: International Nondestructive Testing and Evaluation of Wood
Symposium. Rio de Janeiro, Brasil, v.19, p. 542- 546
ZENG, L. et al. (2013) Interference resisting design for guided wave tomography. Smart Materials and
Structures, v. 22, n. 5, p. 055017
42
ARTIGO 3: ASSOCIATION OF NONDESTRUCTIVE TOOLS FOR
TREE INSPECTION
Artigo a ser submetido ao periódico: Arboriculture & Urban Forestry
Obs: O artigo está sendo discutido com outros pesquisadores do Brasil e da Espanha que, de
acordo com suas contribuições, serão incorporados como autores na versão final.

43
Association of nondestructive tools for tree inspection
Mariana Nagle dos Reis
Master student, Laboratory of Nondestructive Testing – LabEND, College of Agricultural Engineering -
FEAGRI - University of Campinas - UNICAMP, Brazil – E-mail: [email protected]
Raquel Gonçalves
Professor, Coordinator of the Laboratory of Nondestructive Testing – LabEND, College of Agricultural
Engineering - FEAGRI - University of Campinas - UNICAMP, Brazil – E-mail: [email protected]
Stella Stopa Assis Palma
Master student, Laboratory of Nondestructive Testing – LabEND, College of Agricultural Engineering -
FEAGRI - University of Campinas - UNICAMP, Brazil – E-mail:[email protected]
Luiz Eduardo Marchiore Libanio
Undergraduate student, Laboratory of Nondestructive Testing – LabEND, College of Agricultural Engineering -
FEAGRI - University of Campinas - UNICAMP, Brazil – E-mail:[email protected]
Abstract
The visual inspection, practiced in several parts of the world for the tree risk assessment, is a very important tool,
because it allows the identification of pathologies with low cost. On the other hand, besides being highly
dependent on the inspector's experience, it may not identify internal decays on the tree. In many cases, it is
necessary to complement this information with technologies capable to infer and to monitor the internal
condition of the tree to help with the falling tree risk assessment. Both tomography and drilling resistance have
shown great potential to be used in tree inspections, but both have limitations inherent to any technology.
Therefore, the objective of this research was to evaluate the association of the nondestructive tools - ultrasound
tomography and drilling resistance – to identify internal conditions of trees. The results showed that the
tomography is sufficient to predict the condition of a region with severe and extensive deterioration. However,
when it is necessary to have more precise information about the size and the location of the deteriorated zone,
the association with drilling resistance becomes essential to ensure a precise and safe diagnosis. The drilling
resistance gives very efficient diagnoses of areas with hollows. However, in specimens with different levels of
deterioration, the numerical value of the amplitude does not allow to indicate the degree of deterioration.
Amplitude graphs of drilling resistance without large variations are indicative of sound wood, which associated
with velocity range obtained in the tomography, can assure more secure diagnosis.
Keywords: ultrasonic tomography, drilling resistance, deterioration of wood, tree risk assessment

44
Introduction
The urban forestry has great social, aesthetic, cultural and educational relevance, as well as significant
climatic and environmental aspects. However, lack of urban forest planning and environmental conditions can
lead to the declining of trees, with significant changes in size, shape and position relative to the axis. These
conditions make trees more susceptible to pathological problems that can lead to its fall. In addition, trees are
living organisms and as such have a life cycle that involves the onset of growth, juvenile stage, adulthood and
natural death. Therefore, its correct maintenance is extremely important for the safety of the population and
integrity of urban equipment and public goods. All these aspects bring the necessity of more studies involving
the subsidies for the use of effective methodologies and economically feasible inspection tools (Martinez and
Diaz 2016, Rollo et al. 2013).
Visual inspection, already practiced in several parts of the world, is a very important tool, since it
allows the identification of pathologies with low cost and is very useful to be the starting point of the tree
evaluation (Wang and Allison 2008, Mattheck 2007, Kennard et al. 1996). On the other hand, besides being
highly dependent on the inspector's experience, it may not include the identification of internal anomalies
indicative of fragility or instabilities of the trunk (Martinez and Diaz 2016, Rollo et al. 2013). In many cases it is
necessary, to infer tree risk, associate visual analysis with technologies capable of inferring and monitoring the
internal condition of the tree.
Tomography using sonic methods has been used to evaluate the internal condition of trees in several
countries, mainly as an auxiliary tool to the falling tree risk assessment. There are several commercial acoustic
tomography equipments on the market, mainly using propagation of stress waves (called sonic tomographs).
Other techniques are also used to generate tomographic imagens with adequate results (Nicolotti et al. 2003).
Due to the need for a better understanding of the meaning of the generated image, as well as its reach in terms of
accuracy, there is still a lot of research in the area (Balázs & Divós 2015, Yamashita et al 2015, Trinca et al.
2015 a e b, Arciniegas et al. 2014, Rollo et al. 2013, Trinca et al. 2013 a,b e c, Van Dijk et al. 2013, Turpening
2011, Secco et al. 2012, Sanabria et al. 2011, Gonçalves et al. 2011, Secco et al. 2011a e b, Secco et al. 2010,
Kim et al. 2009, Batista et al. 2009, Brancheriau et al. 2008, Lin et al. 2008, Gilbert and Smiley 2004, Socco et
al. 2004, Bucur 2002, Comino et al. 2000). Thus, there are still lack of knowledge (Pereira 2007) and space to
scientific contribution, highlighting the image interpretation (USDA 2014) and improvements in algorithmic of
interpolation to image construction (Du et al. 2015).
Likewise, drilling resistance has been recognized as a technique that shows good results in inspections
of trees and structures, although in a much-localized way (Rollo et al. 2013). Considering that the equipment
measures the resistance offering to drilling, it is also expected that its results can be correlated with material
strength losses due to deterioration. Studies have been developed to evaluate the correlation between the
amplitude of the drilling resistance obtained by the equipment and the strength of the wood (Botelho Jr., 2006)
or its effectiveness in detection of decay in timber members (Brashaw et al. 2011; Tannert et al. 2013, Rinn

45
2012), on trunks (Wang et al. 2005 apud Nutto & Biechele 2015) or on trees (Johnstone et al. 2010; Kubus 2009,
Johnstone et al. 2007, Wang et al. 2008).
Both tomography and drilling resistance have shown great potential to be used in tree inspections, but
both have limitations, which is inherent in any technology. Rollo et al. (2013) obtained very good correlations
between results from impulse tomography and drilling resistance using trunks from sound wood. For decayed
wood Wang & Allison (2008) analyzed the results of a trunk inspection combining visual, single-path stress
wave testing, sonic tomography and drilling resistance using a trunk of red oak (Quercus rubra).
The objective of this research was to evaluate the association of ultrasonic tomography and drilling
resistance to inspect the internal conditions of trunks with different types of decay.
Methodology
The sampling used in this research was composed of trunks collected from the trees specimens:
Centrolobium sp., Tabebuia ochracea, Liquidambar styraciflua, Platanus sp., Poencianella pluviosa and
Copaifera sp. These species are widely found in the urban forestry from São Paulo state, Brazil. From these
trunks were removed 6 discs approximately 200 mm thick.
Ultrasound tests were performed using the diffraction mesh proposed by Divos and Szalai (2002).
At the mean height of each disc, 8 equidistant points were marked in the perimeter, in which 3 mm
holes were drilled through the bark region, to coupling the exponential faces of the 45 kHz-frequency
longitudinal transducers. The tests were performed with conventional ultrasound equipment (UsLab, Agricef,
Brazil), developed by the research group in partnership with a spin-off company (Figure 1). In the diffraction
mesh, each of the points is connected to the other 7, configuring 28 measurement paths, in which are obtained
the wave propagation times. In order to obtain the tomography image, we used a software (ImageWood 2.0) also
developed in the research group. The images were generated using 6 velocity ranges, adopted according to the
maximum velocity obtained in each disc (red up to 20%, orange from 20% to 30%, yellow from 30% to 50%,
green from 50% to 70% blue from 70% to 80% and black from 80% to 100%) (Example in Figure 1b).
a b Figure 1. Example of a ultrasound test on the Tabebuia ochracea disc (a) and the tomographic image of
Centrolobium sp. with its different velocity ranges (b).

46
After the ultrasonic tests, the measurements of drilling resistance (IML F400 Resistograph, Germany)
were carried out in the perpendicular to the grain direction, on the same radial measurement routes used for the
ultrasonic tests. For the tests the discs were fixed to a concrete table with the help of sergeants (Figure 2a). The
drilling resistance equipment used in the tests allows the choice of different feed rates (from 15 cm / min to 200
cm / min) and needle rotation (1500 rpm to 5000 rpm). These adjustments are usually made in function of
density of the wood as well as its level of deterioration. Therefore, speeds used in each species took these aspects
into consideration (Table 1). From the tests, 48 drilling resistance amplitude graphs were obtained (Example in
Figure 2b) according to the different routes.
a b Figure 2: Example of the drilling resistance test on the Tabebuia ochracea disc (a) and drilling resistance
amplitude graphics in Tabebuia ochracea disc on route 1-5 (b).
After the ultrasonic and drilling resistance tests, the discs were sawn at the exact height where the
measurements were taken and the surface of the new discs obtained was sanded to be macroscopically analyzed
and digitally photographed. From the macroscopic visual analysis it was verified that the discs presented
different conditions and degrees of deterioration (Table 1).
Table 1: Values of basic density (bas), feed velocity (VA), rotation speed (VR) and type of deterioration verified
in visual analysis
Specie bas VA VR Disc diameter
Type of deterioration observed kg.m
-3 cm/min rot/min cm
Centrolobium
sp. 660**** 100 2500 30,8 Hollow caused by termites
Tabebuia
ochracea 840*** 100 2500 28,2 Coleoptera attack
Liquidambar
styraciflua 490* 100 2500 37,3 Lateral longitudinal crack
Platanus sp. 500** 150 2500 39,6 Attack by fungi and some hollowed areas
caused by termites
Poencianella
pluviosa 890**** 50 3500 37,9 Fungus attack in the center of the disc
Copaifera sp. 575*** 50 3500 22 Hollow caused by termites with fungal
decay around them
*Lima et al. 2015; **Freitas 2012; ***IPT http://www.ipt.br/informacoes_madeiras3.php?madeira=38;
****Remade http://www.remade.com.br/madeiras-exoticas/116/madeiras-brasileiras-e-exoticas/arariba

47
Initially, the tomographic images were analyzed to verify the feasibility of a diagnosis using this tool.
Then, the amplitude of drilling resistance graphs were associated with the images generated by the ultrasound
tomography, in order to evaluate if there was diagnoses improvement. Finally, the diagnostic result using both
technologies was compared with the digital pictures of the discs as well as with the macroscopic visual analysis.
Results and Discussion
In the preliminary analysis of the ultrasonic tomography, the Centrolobium sp. and Copaifera sp.discs
present on its images the colors red and orange, representing zones with velocities lower than 30% of the
maximum velocity obtained in these discs. Previous studies by the research group (Trinca & Gonçalves 2015,
Trinca et al. 2015, Trinca et al. 2013 a,b e c, Van Dijk et al. 2013, Secco et al. 2012, Secco et al. 2011a e b,
Secco et al. 2010, Batista et al. 2009.) allowed to conclude that images as arrow forms represent interferences
produced by the interpolation algorithm used by ImageWood 2.0 software. Therefore, these areas (with arrow
forms) should not be considered in the interpretation of the tomographic images. So, the conclusion regarding
these discs would be that the entire areas highlighted in gray (Figure 3) would be seriously compromised
(velocity losses greater than 70%). For both discs (Centrolobium sp. and Copaifera sp), there is also a seriously
compromised contour area, with velocity losses between 50% and 70% (yellow zones in Figure 3).
Considering the results of previous researches (Trinca & Gonçalves 2015, USDA 2014, Secco et al.,
2011), the level of velocity reduction in these two discs would be indicative of the hollowed region (gray zones
of Figure 3) and severely compromised in terms of stiffness in the surrounding area (yellow zone of Figure 3),
leading to the conclusion, in the case of an inspection, that practically the entire disc would be decayed. This
result would already be sufficient to indicate the falling tree risk.
a b
Figure 3. Interpretation of the ultrasonic tomography image in the discs of the species Centrolobium sp. (a) and
Copaifera sp.(b)
In the case of the Centrolobium sp. disc, the use of the drilling resistance equipment made it possible to
verify that the area delimited by velocities with less than 30% of the maximum velocity obtained on disc was

48
effectively a hollow, once the amplitude was zero in that region in all measurement routes (Example in Figure
4a). The zones in yellow presented amplitudes around 20%. Note that in the vicinity of the zone with more
severe deterioration, represented by zero amplitude, there is an amplitude increase to 40% (Figure 4a). Thus, for
this disc, the association of drilling resistance to the tomographic image allowed us to identify and delimit, more
precisely, the hollow dimension (regions with zero amplitude). In the case of a tree inspection, this result,
repeated in different highs would assist in a decision making for the suppression.
In the case of Copaifera sp.the tomographic image (Figure 3b) shows a hollow of much larger
proportions than indicated by the drilling resistance and by the actual condition (Figure 4b). Wang & Allison
(2008) analyzed the association of inspection methods using two red oak (Quercus rubra) trees (4 discs). The
results obtained by Wang & Allison (2008) shows that the acoustic tomography provided strong evidence of
structural defect in both trees and these evidences showed strong correspondence with the actual condition of the
discs. However, the potential decayed zones indicating by tomography were larger than the true decayed areas.
Wang & Allison (2008) impute this behavior to the numerous internal cracks which cut off linear propagation of
the waves diverting them to a much longer travel path, reducing the velocity. Wang & Allison (2008) concluded
that, in these cases, the use of drilling resistance can sort out the real decay from the crack-induced shadows
produced by the tomography. In this research, the drilling resistance indicates amplitudes around 20 to 30% in
the zones represented in green in the tomographic image, around 10% in the zones in yellow and zero in the zone
actually hollowed. In this case, the association of the methods would allow to infer that the zone delimited in
gray (Figure 3b - from interpretation of the tomography) is not entirely a hollow area, as also described by Wang
and Allison (2008). Considering the route indicated in Figure 4b, the result of drilling resistance would indicate
that the right part of the disc would be quite deteriorated with a hollow of about 30 mm (points 13 to 17 of
Figure 4b) and the remaining of the disc with low amplitudes (10%) when compared to the left side (around
30%). The USDA (2014) indicate drilling resistance from 5% to 15% as moderate decay level but, in the same
manual, author highlight to the influence of the wood density in this amplitude. The association of the both
information (tomography and drilling resistance) would allow a more adequate interpretation of the areas that
effectively present hollows, although, in fact, the loss of stiffness indicated in the tomography adequately
represents the actually condition of the disc, even in the regions without the presence of hollow.
Centrolobium sp. (a)

49
Copaifera sp.(b)
Figure 4. Comparative images of the digital pictures of the discs and the superposition of the ultrasound
tomographic images to the drilling resistance amplitude graphics
Legend: percentages of maximum velocity: red up to 20%, orange 20% to 30%, yellow from 30% to 50%, green
from 50% to 70%, blue from 70% to 80% and black from 80% to 100% %
In the Liquidambar styraciflua disc the crack is apparent and can, therefore, be detected visually. This
disc is being used in this discussion to simulate the situation of a defect of smaller proportions than the two
previously analyzed. In addition, in the previous situation, mainly for the Copaifera sp, the wood around the
hollow was also deteriorated, while in the Liquidambar styraciflua disc the wood is sound. In the tomographic
image of the Liquidambar styraciflua disc appears a small region, located in the upper right border, represented
by orange color (Figure 5), indicative of reduction of 70% to 80% of the velocity. This region corresponds to the
zone of greater opening of the crack in the disc. Thus, the tomographic image did not allow seeing the depth of
the crack, indicating only reduction of speed in the border. Eliminating from the analysis the images in arrows
form (interferences) the interpretation of the tomography would be that the disc has only a stiffness loss in the
upper right border (zones in orange and uninterrupted green in Figure 5). This behavior of the tomographic
image is related to the limitation given by the relation between the wavelength and the size of the defect
evaluated (Bucur, 2006). Since the wavelength is affected by the frequency of the transducer used in the test and
by the propagation velocity of the wave in the medium, the defects visible for the test conditions of this research
would be around 20 mm.
The drilling resistance test in Liquidambar styraciflua disc did not identified the crack, since no
measurement route passed through it. This result is a good example of a localized test problem, such as the
drilling resistance test. The average amplitude of the drilling resistance in different measurement routes was
around 20%. Considering that the wood is sound, it is verified that the numerical value of the percentage of
drilling resistance cannot be used directly or alone to interpret the condition of strength or stiffness, since, for
example, amplitudes of 20% in Centrolobium sp. disc were obtained in deteriorated areas. The Liquidambar
styraciflua has a lower density than Centrolobium sp. (Table 1) affecting the drilling resistance. So, more
important than the level of drilling resistance amplitude is the homogeneity of the graphic (example in Figure 5),
indicating sound wood.

50
Figure 5. Comparative images of the digital pictures of the Liquidambar styraciflua disc and the superposition of
the ultrasound tomographic images to the drilling resistance amplitude graphic
Legend: percentages of maximum velocity: orange 20% to 30%, green from 50% to 70%, blue from 70% to 80%
and black from 80% to 100% %
The image of the Tabebuia ochracea disc (Figure 6) shows, for the most part, ranges of velocities in
green and yellow, indicating velocities reductions from 30% to 50% (green zone) and from 50% to 70% (yellow
zone). Eliminating from the image the yellow arrow forms within the green zone, the interpretation of the
tomography would be that a large part of the disc has velocity losses from 30% to 50%, which, according to the
USDA (2014), indicates zones with more than 50% loss in strength. Large yellow areas are observed at the edges
of this image (Figure 6), indicating a reduction in velocity superior to 50% that, according to the USDA (2014),
with severe deterioration. As there are no red or orange areas in the image, the interpretation of the tomography
would not lead to infer the existence of hollowed areas.
The association of the tomography with the drilling resistance test in Tabebuia ochracea disc would
confirm the absence of hollows, since there was no zero-amplitude registered in any of the graphic routes
(Example in Figure 6). The average amplitude of drilling resistance on the different routes was 20%, therefore
equal to the one obtained in Liquidambar styraciflua disc. Again, it can be verified that the numerical value of
the amplitude cannot be used for the direct interpretation of the stiffness nor for a direct comparison of the
velocity on tomography. The Liquidambar styraciflua disc presented velocity losses from 0 to 20%, while for
Tabebuia ochracea between 30% and 50%. The amplitude graph in this disc was not as regular as in the
Liquidambar styraciflua disc, but the interpretation of this isolated result would be not evident, indicating the
importance of the two methods association. Once more the high density of Tabebuia ochracea play a very
important hole in the drilling resistance amplitude. Isolated, the drilling resistance test would indicate that the
disc is in good condition; however, the diagnosis of the ultrasound inspection infers a considerable loss of
velocity, evidencing, in the case of a tree inspection, a possible risk. The visual analysis shows that the piece is
almost completely taken up of cavities and that, at the extremities, more severe attack of the Coleoptera insects,
compatible with the loss of velocity shown in the tomographic image.

51
Figure 6. Comparative images of the Tabebuia ochracea digital picture and the superposition of the drilling
resistance amplitude graph to the ultrasound tomography images.
Legend: percentages of maximum velocity: yellow from 30% to 50%, green from 50% to 70%, blue from 70%
to 80% and black from 80% to 100 %
The image generated by ultrasonic tomography of Platanus sp. (Fig. 7) indicates severe deterioration in
practically all its extension, since it shows a large area in yellow (velocity reduction between 50% and 70%).
The green strings would be eliminated from the interpretation, because it is considered as interpolation
interferences. The absence of red and orange areas in the image would lead to infer that the piece had no areas
with holes. The association of the drilling resistance amplitude would indicate the loss of stiffness inside of the
disc, once the graphic is quite irregular, with large and continuous zones with very low amplitudes (5 to 10%).
According to USDA (2014) drilling resistance from 5 to 15% indicate moderate decay level but, in this case, the
graph irregularity would indicate wood more decayed. The drilling resistance test also did not show any
hollowed areas. So, the interpretation of the inspection using the association of both methods would allow to
infer that the wood, although without any hole, present moderate to severe decay, therefore subject to risk.
Figure 7. Comparative images of the Platanus sp. disc digital pictures and the superposition of the drilling
resistance amplitude graph to the ultrasound tomography image.
Legend: percentages of maximum velocity: yellow from 30% to 50%, green from 50% to 70%, blue from 70%
to 80% and black from 80% to 100% %

52
The image generated in the Poencianella pluviosa disc, excluding the strings forms (interference in the
interpolation system), shows blue (velocity losses between 20% and 30%) and black colors (velocity losses of
0% a 20%) - Figure 8. The interpretation of this image would lead to infer that the wood has slightly to insipient
deterioration in some areas (USDA 2014). The result of the drilling resistance shows graphics (Figure 9) with
no zero amplitude, but very irregular and with a drop at the central part reaching 10% (moderate decay level
according to USDA 2014). In this case, the association of methods would allow better interpretation of the actual
state of the disc than using only one of the techniques. As the blue zones are scattered (Figure 8), the
tomography would not indicate the existence of a central decayed region. On the other hand, the drilling
resistance would indicate a central region with decayed, but as previously seen; the numerical value of the
amplitude percentage cannot be directly related to the degree of loss of stiffness.
The range of velocity loss obtained on the ultrasound tomography indicate that Platanus sp. disc would
have greater level of decay than the Poencianella pluviosa disc. This result is compatible with the macroscopic
visual analysis of these two discs. Both have fungi deteriorated areas, however, the decay on central zone of the
Poencianella pluviosa disc (Figure 8) is more insipient than the deterioration of Platanus sp. disc. This decay
level can be felt touching the discs, because Platanus sp. disc has a decay region much more soft than the disc of
Poencianella pluviosa
Figure 8. Comparative images of the Poencianella pluviosa disc digital picture and the superposition of
the drilling resistance amplitude graph to the ultrasound tomography image.
Legend: percentages of maximum velocity: green from 50% to 70%, blue from 70% to 80% and black
from 80% to 100%

53
Figure 9. Different measurement routes of the drilling resistance amplitude graphs superposed on the ultrasound
tomography images of the Poencianella pluviosa disc.
Conclusions
The association of two inspection tools was discussed in this paper, using discs from different tree
species and with different types and level of deterioration, inferred by macroscopic visual inspection.
The results shows that the association of ultrasound tomography and drilling resistance allows
improving the quality of the diagnosis, since both techniques are suitable for inspection, but both have
limitations.
Ultrasound tomography allows a global analysis of velocity variation, which is related to the deterioration and
wood stiffness loss. Since the drilling resistance is a very punctual test, the use of tomography can be used to
target the locations where the diagnosis of drilling resistance is necessary, increasing the accuracy of diagnosis.
Ultrasound tomography shows clearly results in wood severely and extensively decayed. In these cases,
diagnosis using only this tool would already indicate the high risk. However, in zones with moderately or with
insipient decay the ultrasound tomography can generate important doubts. So, in these cases, the association with
the drilling resistance is essential to ensure the safety of the diagnosis, showing more precisely the size and the
location of the decayed zones.

54
The drilling resistance allows very efficient diagnostics of areas with hollows. However, in wood with
different level of deterioration, the numerical value of the amplitude does not allow its indication by itself, since
the amplitude value depends on the species (density) and parameters (speed of advance and rotation) adopted in
the test. The homogeneity of the graph is also an indicative parameter of the disc condition. Amplitude graphs
without large variations (peaks and valleys) are indicative of sound wood, which associated with the velocity
range obtained in the tomography can point to a safer diagnosis.
Acknowledgements
The authors would like to thank the National Council for Scientific and Technological Development (CNPQ) for
the scholarships and Sao Paulo Research Foundation (FAPESP) - Proc. 2015/05692-3 - for the research funding.
They also thank the Environment Department of UNICAMP for donating the trunks used in the tests and to PD
Instruments Company for lending the equipment used in tests of drilling resistance.
Literature Cited
ARCINIEGAS, A.; PRIETO, F; BRANCHERIAU, L.; LASAYGUES, P. (2014) Literature review of acoustic
and ultrasonic tomography in standing trees. Trees. 28(6): 1559-1567
BALAZS, M.; DIVOS, F., (2015) Glue laminated timber structure evaluation by acoustic tomography. In:
International Nondestructive testing and evaluation of wood symposium, Anais…, v.19. p.462 – 466
BATISTA, F.A.F; GONÇALVES, R.; CERRI, D.G.P.; SECCO, C.B. (2009) Reprodução da condição interna de
peças de madeira através de imagens representativas da propagação de ondas. Madeira: Arquitetura e
Engenharia, v.10 (25), p 23-32
BOTELHO JR, J.A. (2006) Avaliação não destrutiva da capacidade resistente de estruturas de madeira de
edifícios antigos. Thesis, Universidade do Porto, Portugal
BRANCHERIAU L., LASAYGUES P., DEBIEU E., LEFEBVRE JP. (2008) "Ultrasonic tomography of green
wood using a non-parametric imaging algorithm with reflected waves". Annals of Forest Science, 65(7):712-718
BRASHAW, B. K.; VATALARO, R.; ROSS, R. J.; WANG, X.; SCHMIEDING, S.; OKSTAD, W. (2011)
Historic Log Cabin structural condition assessment and rehabilitation – A case study. In: International
nondestructive testing and evaluation of wood symposium, 17, Hungria. Anais... Hungria: University of West
Hungary, v.2, p. 505-512

55
BUCUR, V. (2002) High resolution Imaging of Wood Structure. In: International Symposium on Nondestructive
Testing of Wood. Berkeley, California
BUCUR, V. (2006) Acoustics of wood. 2nd ed. New York: Springer-Verlag, 393p
COMINO E, MARTINIS R, NICOLOTTI G, et al. (2000) Low current tomography for tree stability assessment,
278, In: Backhaus G F, H Balder, and E ldczak (Eds). International symposium on plant health in urban
horticulture, Braunschweig, Germany, 22-25
DIVOS, F.; SZALAI, L. (2002) Tree evaluation by acoustic tomography. In: Proceedings of the 13th
International symposium on nondestructive testing of wood; 2002 August 19. 21; Berkeley, CA. Madison, WI:
Forest Products Society: 251.256
DU, X. et al. (2015) Stress Wave Tomography of Wood Internal Defects using Ellipse-Based Spatial
Interpolation and Velocity Compensation. BioResources, v. 10, n. 3, p. 3948-3962
FREITAS, T. (2012) Caracterização tecnológica da madeira de Platanus sp. Monografia, Departamento de
Ciências Florestais e da Madeira, Universidade do Espirito Santo, ES
GILBERT, E. A.; SMILEY, T. Picus Sonic tomography for the quantification of decay in white oak (Quercus
alba) and hickory (Carya sp.). Journal of Arboriculture, Champaign, v. 30, n. 5, p. 277-281, Sept. 2004.
GONÇALVES, R.; BERTOLDO, C.; MASSAK, M. V.; BATISTA, F.; SECCO, C. B.; (2011) Velocity of
ultrasonic waves in live trees and freshly-felled logs, 02/2011, Blacksburg, Estados Unidos da America, Wood
and Fiber Science, Vol. 43, N 2, pp.232-235
GONÇALVES, R.; SECCO, C. B.; CERRI, D.G.P.; BATISTA, F. (2011) Behavior of ultrasonic wave
propagation in presence of holes on Pequiá wood, In: 17th International Nondestructive Testing and evaluation
of wood symposium WoodNDT, Vol. 1, pp.1-3, Sopron, HUNGRIA
INSTITUTO DE PESQUISAS TECNOLÓGICAS, IPT. Informações sobre Madeiras. Disponível em
<http://www.ipt.br/informacoes_madeiras/31.htm> Acessed 04 November 2016
JOHNSTONE, D. M.; ADES, P. K.; MOORE, G. M.; SMITH, I. W. (2007) Predicting Wood Decay in
Eucalypts Using an Expert System and the IML- Resistograph Drill. Arboriculture & Urban Forestry, 33(2), p.
76-82

56
JOHNSTONE, D.; MOORE, G.; TAUSZ, M.; NICOLAS, M. (2010) The Measurement of Wood Decay in
Landscape Trees, Arboriculture & Urban Forestry, 36(3), p. 121-127
KENARD D K, PUTZ F E, NIEDERHOFER M. (1996). The predictability of tree decay based on visual
assessments. Journal of Arboriculture: 27(2), pp.249-254.
KIM, B. N., LEE, H. W., AND KIM, K. M. (2009a) "The development of image processing system using area
camera for feeding lumber." Journal ofthe Korean Wood Science and Technology, 37(1),37-47
KUBUS, M. (2009) The Evaluation of Using Resistograph when Specifying the Health Condition of a
Monumental Tree. Notuale Botanicae Horti Agrobotanici Cluj-Napoca, v. 37, n. 1, p. 157–164
LIN, C.J.; KAO, Y.; LIN, T et al (2008) Application of ultrasonic tomographic technique for detecting defects in
standing trees. International Biodeterioration & Biodegradation, 62, p.434-441
MARTÍNEZ P C, DÍAZ M I I (2016). El riesgo del Arbolado Urbano – Contexto, concepto y evaluación.
Ediciones Mundi-Prensa, Madrid, Espanha, 465p.
MATTHECK C. (2007). Field Guide for Visual Tree Assessment. Forschungzentrum Karlsruhe GmbH.
Alemanha, 170p.
NICOLOTTI, G.; SOCCO, L. V.; MARTINIS, R.; GODIO, A.; SAMBUELLI, L. (2003) Application and
comparison of three tomographic tecniques for detection of decay in trees. Journal of Arboriculture, Champaign,
v. 29, n. 2, p. 66-78
NUTTO, L.; BIECHELE, T. (2015) Drilling resistance measurement and the effect of shaft friction – using feed
force information for improving decay identification on hard tropical wood. In: International nondestructive
testing and evaluation of wood symposium, 19 Anais… Brasil, Rio de Janeiro, p. 156-160
PEREIRA, L.C., SILVA FILHO, D.F., TOMAZELLO FILHO, M., COUTO, H.T.Z., MOREIRA, J.M.M.A.P.,
POLIZEL, J.L. (2007) Tomografia de impulso para avaliação do interior do lenho de árvores. Revista da
sociedade brasileira de arborização urbana, Volume 2, Número 2
REMADE. Disponível em <http://www.remade.com.br/madeiras-exoticas/116/madeiras-brasileiras-e-
exoticas/arariba> Acesso em 4.Nov.2016.
RINN, F. (2012) Basics of Typical Resistance-Drilling for Timber Inspection. Holztechnologie, 53, p. 24-29

57
ROLLO, F.M.A; SOAVE JUNIOR, M.A..; Viana, S.M.; ROLLO, L.C.P..; COUTO, H.T.Z.; SILVA FILHO,
D.F. Comparação entre leituras de resistógrafo e imagens tomográficas na avaliação interna de troncos de
árvores. CERNE, vol. 19, n. 2, abril-junho, pp. 331-337, 2013, Universidade Federal de Lavras. Lavras, Brasil
SANABRIA, S. J., FURRER R., NEUENSCHWANDER J., NIEMZ P., SENNHAUSER U. (2011) Air-coupled
ultrasound inspection of glued laminated timber. Holzforschung 65,377-387
SECCO, C. B. ; CERRI, D. G. ; GONÇALVES, R. ; BATISTA, F. ; VASQUES, E.C. (2011) Metodologia de
inspeção da condição interna de toras de madeira por ultrassom. In: Congresso Ibero-Latino-Americano da
Madeira na Construção, Coimbra. Anais do CIMAD. Coimbra
SECCO, C. B. ; GONÇALVES, R. ; CERRI, D. G. ; VASQUES, E.C. ; BATISTA, F. (2011) Tree holes
detecting by ultrasound. In: Efficient and safe production processes in sustainable agriculture and forestry,
Viena. XXXIV CIOSTA CIGR V Proceedings. Viena
SECCO, C. B.; GONÇALVES, R.; CERRI, D. G.; VASQUES, E.C.; BATISTA, F. (2012) Behavior of
ultrasonic wave propagation in presence of holes on wood. Cerne (UFLA), v. 18, p. 12-16
SECCO, C.B.; GONÇALVES, R.; CERRI, D.G.P.; BATISTA, F.A.B. (2010) Avaliação de dois tipos de
medição na detecção da condição interna da madeira por ultrassom. Madeira: Arquitetura e Engenharia,
v.11(27), p.1-5
SOCCO, L.V., SAMBUELLI, L. MARTINIS, R., COMINO, E., AND NICOLOTTI, G. (2004) Feasibility of
ultrasonic tomography for nondestructive testing of decay on living trees. Research in Nondestructive
Evaluation, 15, 31-54
TANNERT, T.; ANTHONY, R.W.; KASAL, B.; KLOIBER, M.; PIAZZA, M.; RIGGIO, M.; RINN, F.;
WIDMANN, R.; YAMAGUCHI, N. (2013): In situ assessment of structural timber using semi-destructive
techniques. Materials and Structures DOI 10.1617/s11527-013-0094-5. July 2013
TRINCA, A.J., GUERRA, M.R., GONÇALVES, R. (2015) Velocity variation in wood as a function of defects,
In: International Nondestructive Testing and Evaluation of Wood Symposium, v.19. Rio de Janeiro, Brasil, p.
593 – 599
TRINCA, A.J.; GONÇALVES, R.; LINHARES, C.S.F. (2013) Ultrasonic tomography in detecting knots. In:
Nondestructive Testing and Evaluation of Wood Symposium. Madison

58
TRINCA, A.J.; GONÇALVES, R.; VAN DIJK, R.; AGUSTINHO, D.M. (2013) Interference of pith in
ultrasonic tomography. In: Nondestructive Testing and Evaluation of Wood Symposium. Madison
TURPENING, R. (2011) Acoustic imaging of Sandalwood (santalum albu) logs. In: Nondestructive Testing and
Evaluation of Wood Symposium. Sopron, Hungary
UNITED STATES DEPARTMENT OF AGRICULTURE (USDA), (2014) Wood and Timber Assessment
Manual. Forest Products Laboratory, Madison, WI, 2ed. 94p
VAN DJIK R. (2013) Associação de métodos não destrutivos para inspeção de estruturas de madeira,
Dissertation, Universidade Estadual de Campinas, Campinas, SP, 2013
WANG, X.; ALLISON, R.B. (2008) Decay Detection in Red Oak Trees Using a Combination of Visual
Inspection, Acoustic Testing, and Resistance Microdrilling. Arboriculture & Urban Forestry, 34(1), p. 1-4
YAMASHITA, K.; YAMADA, T.; OTA, Y.; YONEZAWA, H.; TOKUE, I. (2015) Detecting defects in
standing trees by an acoustic wave tomography with pseudorandom binary sequence code: simulation of defects
using artificial cavity. In: International Nondestructive Testing and Evaluation of Wood Symposium. Rio de
Janeiro, Brasil, v.19, p. 542- 546

59
DISCUSSÃO GERAL
Resistência a perfuração
O primeiro artigo teve como objetivo avaliar a resistência a perfuração, de forma
isolada, na detecção dos níveis, das dimensões e da localização de deteriorações. Dos
resultados foi possível tecer os comentários gerais que a seguir são apresentados e discutidos
com base em literatura pertinente.
Da análise do gráfico de amplitude de resistência a perfuração superposto à fotografia
da superfície real dos toretes verificou-se haver um padrão de comportamento da amplitude
frente à diferentes zonas da madeira (sadia e com deterioração) percorridas pela agulha
durante a perfuração.
Para todas as espécies analisadas a amplitude variou de 0% a 40% sendo os trechos de
0% correspondentes aos ocos, como esperado. Esse resultado confirma que essa ferramenta é
adequada para a detecção da localização e da dimensão aproximada de ocos. O mesmo
resultado foi destacado por Kubus (2009) ao analisar a condição de uma árvore monumental
de grandes dimensões na Polônia. O autor apresenta registros de 10 gráficos de resistência a
perfuração, obtidos em diferentes posições da árvore, nos quais se verificam várias zonas com
amplitudes próximas de zero (provavelmente zonas ocadas) e, nas demais regiões, amplitudes
médias de resistência a perfuração de 16%. Na zona de casca as amplitudes médias foram de
6%. Brashaw et al (2011) obtiveram resistências a perfuração variando de 0 a 25% em zonas
com diferentes níveis de degradação da madeira.
Nesta pesquisa, nas espécies nas quais foi possível definir as regiões de cerne alterado
e de alburno, verificou-se variação na amplitude nessas regiões. Nas duas espécies nas quais
não foi possível visualizar a distinção entre cerne e alburno (Ipê e Liquidambar) o gráfico de
amplitude de resistência a perfuração também não apresenta variações. Gráficos semelhantes,
sem distinção de cerne e de alburno, foram obtidos por Kubus (2009).
Em geral, na madeira de cerne os valores de amplitudes foram superiores aos obtidos
na madeira de alburno. Para as quatro espécies nas quais foi possível definir as regiões de
cerne alterado e alburno esse resultado ficou estatisticamente demonstrado. A análise de
variância mostrou que as amplitudes em regiões deterioradas (com ou sem ocos) foram
sempre inferiores (média em torno de 4%), regiões de cerne sempre superiores (média em

60
torno de 22%) e região de alburno (média em torno de 15%) e de casca (média em torno de
14%) intermediárias e estatisticamente equivalentes (Figura 6).
Considerando apenas as regiões de cerne alterado e de alburno sem deterioração
aparente, houve diferenciação entre espécies. No entanto as amplitudes de resistência a
perfuração não seguiram o padrão esperado, de aumento com a densidade da espécie (Couto
et al. 2013, Costelo & Quarles 1999). No entanto, é importante destacar que a amplitude de
resistência a perfuração pode ser afetada pela velocidade de avanço e que, para poder
interpretar adequadamente bem como comparar resultados de amplitude obtidos no ensaio de
resistência a perfuração é necessário conhecer, previamente, os perfis obtidos na condição
íntegra (Martínez 2016, Matheny et al. 1999).
Para a madeira com ataque de insetos coleópteros, com presença de inúmeras galerias
superficiais, a amplitude de resistência a perfuração não apresentou variações que
permitissem, em uma inspeção, visualizar o estado da madeira. No entanto, as depressões
apresentadas no gráfico, seriam indicativos de que a madeira não está sadia.
Rachadura presente em uma das espécies avaliadas também não foi identificada em
nenhum gráfico de amplitude de resistência a perfuração, pois nenhuma rota da agulha passou
pelo local da rachadura. Esse resultado ressalta a questão de que este tipo de inspeção é
pontual, sendo importante conhecer onde deve ser aplicado. Mesma conclusão foi exarada por
Botelho (2006) e Tannert et al. (2014).
Em alguns discos foi possível observar que havia, no contorno da zona deteriorada por
fungos, uma região de cor mais escura. Nesses casos, observou-se um pico de elevação da
amplitude da resistência a perfuração. Resultado semelhante foi obtido por Rinn (1996) e foi
explicado pelo processo de compartimentalização promovido no tecido das árvores para se
protegerem do avanço da zona deteriorada. Nesse processo a árvore desenvolve um tecido
com paredes celulares mais espessas, além de obstruir os vazios celulares, fazendo com que
esse tecido aja como se fosse uma barreira para o avanço da deterioração (Fraedrich 1999,
Shigo 1977, Shortle 1979). Nessas regiões em geral é possível visualizar uma cor mais
escurecida, decorrente das substâncias antimicrobianas produzidas (Shigo1977, Shortle 1979).
Rinn (1996) observou que padrões diferenciados de comportamento do gráfico de
resistência a perfuração podem auxiliar a interpretação da inspeção. O autor destaca que na
madeira deteriorada por fungos as amplitudes são baixas e aproximadamente homogêneas,
61
enquanto em zonas deterioradas por cupins ou com presença de rachaduras o gráfico
apresenta-se mais variável, com amplitudes mais altas (madeira circundante em bom estado)
seguido de valores de amplitude bem menores e localizadas. Nesta pesquisa, nos discos nos
quais havia uma grande zona deteriorada por fungos verificou-se que o gráfico de resistência
a perfuração exibe um contínuo trecho de baixas amplitudes, conforme comportamento
indicado por Rinn (1996).
Tomografia ultrassônica
O segundo artigo teve como objetivo avaliar a tomografia ultrassônica, de forma
isolada, na detecção dos níveis, das dimensões e da localização de deteriorações. Dos
resultados foi possível tecer os comentários gerais que a seguir são apresentados e discutidos
com base em literatura pertinente.
As imagens dos toretes das espécies que possuem grandes regiões ocadas foram as
únicas a apresentar, na imagem tomográfica, as cores vermelho e laranja, as quais
representam zonas com perda de velocidade superior a 70%. A imagem gerada não
representou, de maneira exata, a forma e a dimensão da região deteriorada, no entanto, para
avaliação de risco de queda, a imagem tomográfica se mostrou eficiente, pois identificou
deterioração avançada no interior do exemplar, o que já seria suficiente para indicar risco.
No caso do torete com presença de rachadura, também aparece uma região pequena
com a cor laranja situada na borda, que representa redução de 70% a 80% na velocidade. Essa
região correspondeu a zona de maior abertura da fenda no torete. O restante da imagem deste
torete mostra uma zona com perda de velocidade entre 30% a 50% (verde), que está do
mesmo lado da fenda e grande parte da área com perdas de velocidade abaixo de 20% (preto).
A análise dessa imagem tomográfica não permitiria identificar adequadamente a dimensão e a
posição do defeito (fenda). A capacidade de detecção de defeitos utilizando propagação de
ondas está associada à relação entre o comprimento de onda () e a dimensão do defeito
(Bucur 2006). Em geral a sensibilidade de detecção é da ordem /2 (Bucur 2006). No caso da
espécie em questão, a velocidade máxima (zona íntegra) foi de 2000 m/s, de forma que 44
mm. Assim, espera-se que seja viável a detecção de defeitos da ordem de 22 mm. A maior

62
abertura da fenda, que se encontra na borda do torete e foi detectada na imagem tomográfica é
de 25 mm, condizente com os aspectos teóricos deste ensaio.
A imagem do torete da espécie com ataque de coleobrocas só apresentou as cores
verde (redução de velocidade entre 30% e 50%) e amarelo (redução de velocidade entre 50%
a 70%). A imagem apresentou a presença de muitos cordões amarelos dentro da zona em
verde. Tendo em vista que os cordões são representativos de interferências da interpolação
utilizada pelo software (Trinca et al. 2015, Trinca et al. 2013 a,b e c, Van Dijk et al. 2013,
Secco et al. 2012, Secco et al. 2011a e b, Secco et al. 2010, Batista et al. 2009), a
interpretação dessa imagem consideraria que, na parte interna da peça a perda de velocidade
estaria entre 30% a 50% que, segundo a USDA (2014) indicaria perda de resistência da ordem
de 50%. Nas bordas da peça aparecem grandes áreas em amarelo, indicando perdas de
velocidade entre 50% e 70% e, segundo a USDA (2014) deteriorações severas. A análise
visual mostra que a peça está integralmente tomada de cavidades e que, nas extremidades há
um ataque mais severo das coleobrocas. Portanto, neste caso, o diagnóstico da inspeção
levaria a considerar a peça com considerável perda de resistência, embora não seja possível
visualizar as cavidades na imagem. A não visualização das cavidades na imagem já era
esperada, já que neste caso a velocidade na madeira íntegra também é de cerca de 2000 m/s (
44 mm) e a dimensão das cavidades bem inferiores a 22 mm.
As imagens dos toretes com deterioração por fungos mostrou diferenças significativas
de redução de velocidade. Em um dos toretes foi detectado, na análise visual, deterioração
severa. A imagem tomográfica desta peça apresentou grande área em amarelo (perda de
velocidade entre 50% e 70%) entremeada de verde (perda de velocidade entre 30% e 50%),
indicando deterioração severa praticamente em toda a área inspecionada e, portanto,
compatível com o estado de deterioração apresentado na superfície em análise. Na peça com
zona em estágio inicial de deterioração por fungos a perda de velocidade foi de até 30%
(cores azul e preta), indicando, também, coerência com a condição observada visualmente.
Para realizar analise quantitativa foram comparadas as porcentagens de áreas
deterioradas reais com as porcentagens de áreas deterioradas indicadas pela imagem
tomográfica. Desta comparação verificou-se que, com o uso da proposta da USDA (2014),
que considera redução de 50% da velocidade como zonas com deterioração severa, nos toretes
com presença de ocos a porcentagem de área deteriorada real foi cerca de 30% inferior à

63
porcentagem de área deteriorada inferida com o uso da imagem tomográfica. Isso ocorre
porque nas zonas ocadas há grandes quedas na velocidade mínima (Trinca et al. 2015), que no
caso desta pesquisa foram superiores a 70%.
Por outro lado, nos toretes com zonas deterioradas por fungos a imagem tomográfica
subestimou a área real deteriorada em cerca de 13% para o torete com deterioração severa e
de cerca de 25% para o torete com deterioração em fase inicial. Isso ocorreu porque o
comprometimento da resistência e da rigidez da madeira depende do nível da deterioração
(Trinca et al. 2015), e isso não foi avaliado. A avaliação da porcentagem de deterioração real
foi feita com base apenas na dimensão e não com base no nível da deterioração.
Os resultados de Trinca et al. (2015) indicam que para deteriorações ainda insipientes
da madeira por fungos a velocidade tem queda de apenas cerca de 10%, chegando a cerca de
80% quando a degradação está em nível avançado. Assim, aplicando as variações de
velocidade esperadas para zonas ocadas e com deterioração provocada por fungos propostas
por Trinca et al. (2015), novas imagens tomográficas foram construídas. Utilizando o mesmo
procedimento de cálculo de áreas deterioradas verificou-se que a diferença entre as as áreas
deterioradas previstas pela tomografia se aproximam mais das áreas efetivamente deterioradas
(diferença máxima de cerca de 17% e mínima de cerca de 2%).
Associação da tomografia ultrassônica e resistência à perfuração
O terceiro artigo teve como objetivo avaliar a associação da tomografia ultrassônica e
da resistência a perfuração na detecção dos níveis, das dimensões e da localização de
deteriorações. Dos resultados foi possível tecer os comentários gerais que a seguir são
apresentados.
As imagens de tomografia ultrassônica e os seus respectivos gráficos de resistência à
perfuração foram sobrepostos, de modo a obter uma análise mais concreta desta correlação
com a dimensão e com o estágio da degradação visualmente detectados nos toretes. Desta
análise comparativa foi constatado que existe uma coerência entre os dois resultados.
Da tomografia ultrassônica verifica-se que existe uma faixa de velocidade onde a
degradação é mais evidente, representada pelas cores vermelha e rosa (redução de 70% a 80%

64
da velocidade) e amarela (50%). As faixas verde, laranja e preta (reduções de velocidade entre
0% a 30%) indicam regiões onde a madeira se encontra íntegra ou com deterioração inicial.
Para a resistência a perfuração, quando a amplitude atinge valores próximos ou iguais a
zero evidencia-se uma região ocada. Essa informação, associada a imagem tomográfica
permitiu definir o nível de velocidade que se espera para outras zonas ocadas na peça,
informação altamente significativa para a interpretação da imagem. Dessa associação foi
possível verificar que regiões ocadas foram mais adequadamente representadas por reduções
de velocidade superiores a 70%.
Quando há quedas acentuadas de amplitude no gráfico fornecido pelo resistógrafo,
espera-se que haja zonas deterioradas. No entanto, relacionar a amplitude do gráfico com o
nível da deterioração é complexo, uma vez que a amplitude varia entre espécies e até mesmo
com parâmetros do equipamento (velocidade de avance e de rotação). Assim, a associação do
nível de queda da amplitude com faixas de redução de velocidade, também permitem melhor
inferência do nível de deterioração do que o que pode aportar cada tecnologia de forma
isolada.
Portanto, as duas técnicas se mostram complementares e, quando associadas, permitem
a obtenção de resultados mais satisfatórios na detecção da condição interna da árvore.

65
CONCLUSÃO GERAL
Os resultados permitiram concluir que a resistência a perfuração foi eficiente na
detecção e na obtenção da dimensão aproximada de ocos, uma vez que a amplitude nestes
casos é zero. As amplitudes em regiões deterioradas são inferiores (média em torno de 4%) às
de zonas de madeira sã, permitindo inferir a localização destas zonas. No entanto, a
identificação do nível da deterioração utilizando somente o resultado da resistência a
perfuração não é evidente, já que variações na amplitude não são apenas decorrentes de
deteriorações. A amplitude varia entre cerne alterado e alburno e, também, entre espécies. A
resistência a perfuração é um ensaio pontual e, assim, sua eficiência depende da localização
adequada para ser executado. No caso da tomografia, as zonas ocadas apresentam redução de
velocidades superiores a 70%, enquanto as zonas deterioradas por fungos começam a ser
destacadas com reduções de 30% na velocidade. No caso de fendas ou galerias o
detalhamento da imagem depende da relação entre o comprimento de onda e a dimensão
destes defeitos. De maneira geral as imagens de tomografia ultrassônica não permitem a
obtenção do formato e da localização exata da área deteriorada, mas permite aportar
informações gerais da condição da madeira inspecionada. A associação dos métodos é eficaz,
pois a resistência a perfuração permite detalhar a condição da madeira nas zonas suspeitas
destacadas pela tomografia.

66
ANEXO I
Gráficos de Resistência à Perfuração em todas as rotas de medição dos toretes ensaiados

67
Figura AI.1 Gráficos de Resistência à perfuração da espécie Centrolobium sp.. (Araribá);
velocidade de alimentação: 100 cm/min; velocidade rotação agulha: 2500 r/min; Legenda: em
azul representadas as amplitudes de resistência à penetração e em verde representadas as
amplitudes de rotação da agulha do resistógrafo.
AI1.1.Rota de medição 1 - 5
AI1.2. na rota de medição 2 – 6.
AI1.3. Rota da medição: 3 - 7:

68
AI1.4. Rota da medição: 4 - 8:
AI1.5. Rota da medição: 5 - 1:
AI1.6. Rota da medição: 6 - 2
AI1.7. Rota da medição: 7 – 3

69
AI1.8. Rota da medição: 8 - 4

70
Figura AI.2 Gráficos de Resistência à perfuração da espécie Tabebuia ochraceae (Ipê
Amarelo); velocidade de alimentação: 100 cm/min; velocidade rotação agulha: 2500 r/min;
Legenda: em azul representadas as amplitudes de resistência à penetração e em verde
representadas as amplitudes de rotação da agulha do resistógrafo
AI2.1.Rota de medição 1 - 5
AI2.2. na rota de medição 2 – 6
AI2.3. Rota da medição: 3 - 7

71
AI2.4. Rota da medição: 4 - 8
AI2.5. Rota da medição: 5 - 1
AI2.6. Rota da medição: 6 - 2
AI2.7. Rota da medição: 7 – 3

72
AI2.8. Rota da medição: 8 - 4

73
Figura AI.3 Gráficos de Resistência à perfuração da espécie Liquidambar styraciflua
(Liquidambar); velocidade de alimentação: 100 cm/min; velocidade rotação agulha: 2500
r/min; Legenda: em azul representadas as amplitudes de resistência à penetração e em verde
representadas as amplitudes de rotação da agulha do resistógrafo.
AI3.1.Rota de medição 1 - 5
AI3.2. Rota de medição 2 – 6.
AI3.3. Rota da medição: 3 - 7:

74
AI3.4. Rota da medição: 4 - 8:
AI3.5. Rota da medição: 5 - 1:
AI3.6. Rota da medição: 6 - 2
AI3.7. Rota da medição: 7 – 3

75
AI3.8. Rota da medição: 8 - 4

76
Figura AI.4 Gráficos de Resistência à perfuração da espécie Platanus sp (plátano);
velocidade de alimentação: 150 cm/min; velocidade rotação agulha: 2500 r/min; Legenda: em
azul representadas as amplitudes de resistência à penetração e em verde representadas as
amplitudes de rotação da agulha do resistógrafo.
AI4.1.Rota de medição 1 - 5
AI4.2. na rota de medição 2 – 6.
AI4.3. Rota da medição: 3 - 7:

77
AI4.4. Rota da medição: 4 - 8:
AI4.5. Rota da medição: 5 - 1:
AI4.6. Rota da medição: 6 - 2
AI4.7. Rota da medição: 7 – 3

78
AI4.8. Rota da medição: 8 - 4

79
Figura AI.5 Gráficos de Resistência à perfuração da espécie Poencianella pluviosa
(sibipiruna); velocidade de alimentação: 50 cm/min; velocidade rotação agulha: 3500 r/min;
Legenda: em azul representadas as amplitudes de resistência à penetração e em verde
representadas as amplitudes de rotação da agulha do resistógrafo.
AI5.1.Rota de medição 1 - 5
AI5.2. na rota de medição 2 – 6.
AI5.3. Rota da medição: 3 - 7:

80
AI5.4. Rota da medição: 4 - 8:
AI5.5. Rota da medição: 5 - 1:
AI5.6. Rota da medição: 6 - 2
AI5.7. Rota da medição: 7 – 3

81
AI5.8. Rota da medição: 8 - 4

82
Figura AI.6 Gráficos de Resistência à perfuração da espécie Copaifera sp. (copaíba);
velocidade de alimentação: 50 cm/min; velocidade rotação agulha: 3500 r/min; Legenda: em
azul representadas as amplitudes de resistência à penetração e em verde representadas as
amplitudes de rotação da agulha do resistógrafo.
AI6.1.Rota de medição 1 - 5
AI6.2. na rota de medição 2 – 6.
AI6.3. Rota da medição: 3 - 7:

83
AI6.4. Rota da medição: 4 - 8:
AI6.5. Rota da medição: 5 - 1:
AI6.6. Rota da medição: 6 - 2
AI6.7. Rota da medição: 7 – 3
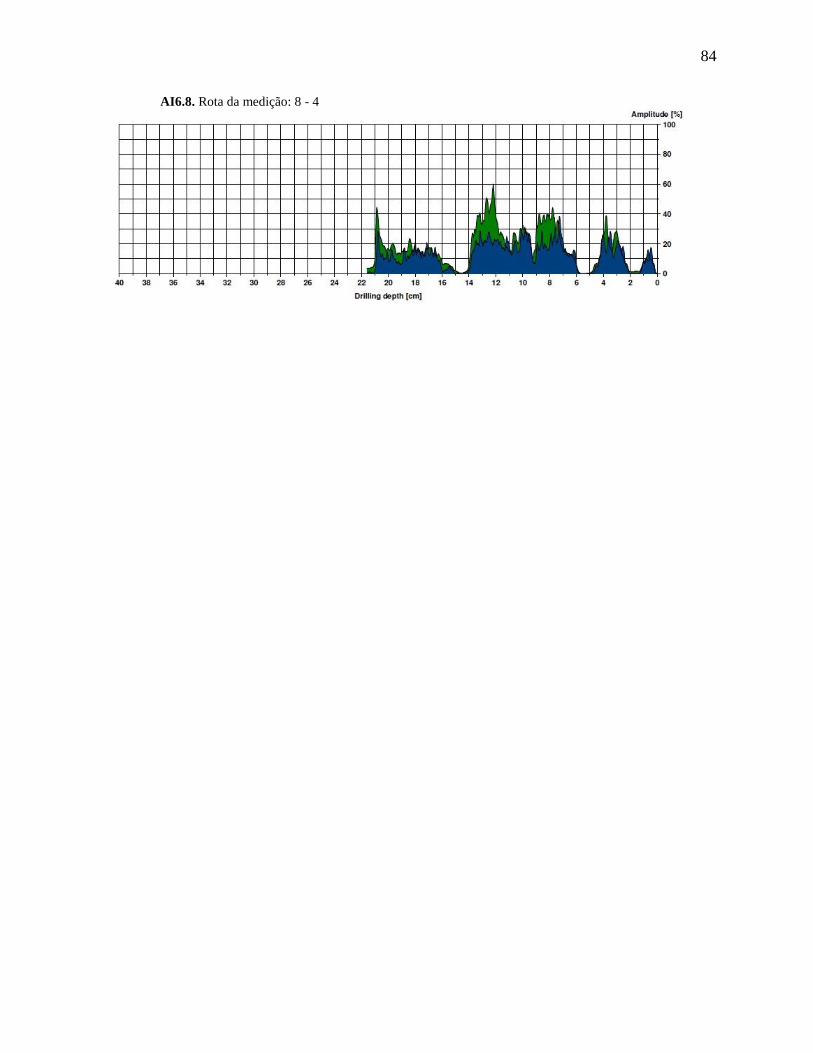
84
AI6.8. Rota da medição: 8 - 4

85
ANEXO II
Tabelas de dados utilizados para geração das imagens de tomografia ultrassônica

86
Tabela AII.1 Valores de coordenadas da localização dos pontos de medição (xi,xf, yi, yf),
tempo de propagação das ondas de ultrassom (µs), comprimento da onda de ultrassom (cm) e
velocidade de propagação das ondas de ultrassom naquele trajeto (m/s). Espécie
Centrolobium sp. (Araribá)
Coordenadas t (µs) L (cm) V (m.s
-¹)
xi yi xf yf
38,5 23,1 34,0 13,5 223,5 10,6 473,8
38,5 23,1 23,1 9,6 274,6 20,5 747,0
38,5 23,1 12,2 13,5 410,0 28,0 682,5
38,5 23,1 7,7 23,1 779,3 30,8 395,2
38,5 23,1 12,2 32,7 335,2 28,0 834,8
38,5 23,1 23,1 36,7 218,6 20,5 938,6
38,5 23,1 34,0 32,7 63,8 10,6 1661,2
34,0 13,5 23,1 9,6 65,1 11,6 1780,4
34,0 13,5 12,2 13,5 211,8 21,8 1028,5
34,0 13,5 7,7 23,1 314,2 28,0 890,5
34,0 13,5 12,2 32,7 631,2 29,0 459,6
34,0 13,5 23,1 36,7 395,3 25,6 646,8
34,0 13,5 34,0 32,7 193,9 19,2 988,5
23,1 9,6 12,2 13,5 73,7 11,6 1573,7
23,1 9,6 7,7 23,1 175,0 20,5 1172,1
23,1 9,6 12,2 32,7 349,8 25,6 730,9
23,1 9,6 23,1 36,7 454,7 27,1 596,1
23,1 9,6 34,0 32,7 323,4 25,6 790,7
12,2 13,5 7,7 23,1 45,6 10,6 2322,4
12,2 13,5 12,2 32,7 166,1 19,2 1154,0
12,2 13,5 23,1 36,7 308,3 25,6 829,4
12,2 13,5 34,0 32,7 537,5 29,0 539,8
7,7 23,1 12,2 32,7 51,6 10,6 2054,3
7,7 23,1 23,1 36,7 115,7 20,5 1772,9
7,7 23,1 34,0 32,7 268,2 28,0 1043,5
12,2 32,7 23,1 36,7 72,6 11,6 1596,4
12,2 32,7 34,0 32,7 182,3 21,8 1194,7
23,1 36,7 34,0 32,7 46,9 11,6 2473,9

87
Tabela AII.2 Valores de coordenadas da localização dos pontos de medição (xi,xf, yi, yf),
tempo de propagação das ondas de ultrassom (us), comprimento da onda de ultrassom (cm) e
velocidade de propagação das ondas de ultrassom naquele trajeto (m/s). Espécie Tabebuia
ochraceae (Ipê Amarelo)
Coordenadas t (µs) L (cm) V (m.s
-¹)
xi yi xf yf
35,3 21,2 31,1 11,3 146,4 10,7 728,2
35,3 21,2 21,2 7,3 205,2 19,8 965,1
35,3 21,2 11,2 11,3 249,9 26,0 1040,6
35,3 21,2 7,1 21,2 264,4 28,2 1066,6
35,3 21,2 11,2 31,0 235,3 26,0 1105,0
35,3 21,2 21,2 35,1 174,8 19,8 1132,7
35,3 21,2 31,1 31,0 89,6 10,7 1189,9
31,1 11,3 21,2 7,3 49,9 10,8 2160,4
31,1 11,3 11,2 11,3 182,6 19,9 1092,0
31,1 11,3 7,1 21,2 207,2 26,0 1255,1
31,1 11,3 11,2 31,0 204,4 28,0 1369,9
31,1 11,3 21,2 35,1 196,9 25,7 1307,2
31,1 11,3 31,1 31,0 183,7 19,7 1070,1
21,2 7,3 11,2 11,3 103,9 10,8 1036,5
21,2 7,3 7,1 21,2 208,4 19,8 950,3
21,2 7,3 11,2 31,0 223,8 25,7 1150,1
21,2 7,3 21,2 35,1 219,1 27,8 1269,1
21,2 7,3 31,1 31,0 226,7 25,7 1135,3
11,2 11,3 7,1 21,2 64,3 10,7 1658,0
11,2 11,3 11,2 31,0 161,9 19,7 1214,2
11,2 11,3 21,2 35,1 194,1 25,7 1326,4
11,2 11,3 31,1 31,0 218,6 28,0 1280,9
7,1 21,2 11,2 31,0 99,2 10,7 1074,7
7,1 21,2 21,2 35,1 159,8 19,8 1239,4
7,1 21,2 31,1 31,0 214,9 26,0 1209,8
11,2 31,0 21,2 35,1 71,9 10,8 1497,8
11,2 31,0 31,1 31,0 151,0 19,9 1321,0
21,2 35,1 31,1 31,0 54,3 10,8 1985,1

88
Tabela AII.3 Valores de coordenadas da localização dos pontos de medição (xi,xf, yi, yf),
tempo de propagação das ondas de ultrassom (µs), comprimento da onda de ultrassom (cm) e
velocidade de propagação das ondas de ultrassom naquele trajeto (m/s). Espécie Liquidambar
styraciflua (Liquidambar)
Coordenadas t (µs) L (cm) V (m.s
-¹)
xi yi xf yf
46,6 28,0 41,2 15,8 103,45 13,3 1288,8
46,6 28,0 28,0 10,8 190,25 25,4 1333,5
46,6 28,0 14,8 15,8 192,6 34,1 1769,5
46,6 28,0 9,3 28,0 198,3 37,3 1881,0
46,6 28,0 14,8 40,1 190,4 34,1 1790,0
46,6 28,0 28,0 45,2 160 25,4 1585,7
46,6 28,0 41,2 40,1 89,65 13,3 1487,2
41,2 15,8 28,0 10,8 89,7 14,1 1573,8
41,2 15,8 14,8 15,8 165 26,4 1598,5
41,2 15,8 9,3 28,0 169,7 34,1 2008,3
41,2 15,8 14,8 40,1 172,8 35,9 2076,3
41,2 15,8 28,0 45,2 164,45 32,2 1957,3
41,2 15,8 41,2 40,1 148,55 24,3 1637,5
28,0 10,8 14,8 15,8 301,65 14,1 468,0
28,0 10,8 9,3 28,0 198,5 25,4 1278,1
28,0 10,8 14,8 40,1 196,5 32,2 1638,1
28,0 10,8 28,0 45,2 198,35 34,4 1734,3
28,0 10,8 41,2 40,1 197,25 32,2 1631,8
14,8 15,8 9,3 28,0 96,95 13,3 1375,2
14,8 15,8 14,8 40,1 148 24,3 1643,5
14,8 15,8 28,0 45,2 180,2 32,2 1786,2
14,8 15,8 41,2 40,1 184,55 35,9 1944,2
9,3 28,0 14,8 40,1 74,05 13,3 1800,5
9,3 28,0 28,0 45,2 167,2 25,4 1517,4
9,3 28,0 41,2 40,1 189,25 34,1 1800,9
14,8 40,1 28,0 45,2 75,2 14,1 1877,3
14,8 40,1 41,2 40,1 169,8 26,4 1553,3
28,0 45,2 41,2 40,1 82,6 14,1 1709,1

89
Tabela AII.4 Valores de coordenadas da localização dos pontos de medição (xi,xf, yi, yf),
tempo de propagação das ondas de ultrassom (µs), comprimento da onda de ultrassom (cm) e
velocidade de propagação das ondas de ultrassom naquele trajeto (m/s). Espécie Platanus sp
(plátano)
coordenadas t (µs) L (cm) V (m.s
-¹)
xi yi xf yf
49,5 29,7 43,7 19,1 97,1 12,1 1248,8
49,5 29,7 29,7 14,7 208,2 24,9 1194,8
49,5 29,7 15,7 19,1 329,1 35,4 1076,9
49,5 29,7 9,9 29,7 405,6 39,6 976,5
49,5 29,7 15,7 40,3 305,5 35,4 1160,1
49,5 29,7 29,7 44,8 189,7 24,9 1311,0
49,5 29,7 43,7 40,3 62,1 12,1 1951,6
43,7 19,1 29,7 14,7 78,1 14,7 1879,4
43,7 19,1 15,7 19,1 291,7 28,0 959,9
43,7 19,1 9,9 29,7 410,3 35,4 863,8
43,7 19,1 15,7 40,3 403,4 35,2 871,9
43,7 19,1 29,7 44,8 234,2 29,3 1249,6
43,7 19,1 43,7 40,3 125,1 21,3 1701,4
29,7 14,7 15,7 19,1 63,1 14,7 2326,2
29,7 14,7 9,9 29,7 182,8 24,9 1360,5
29,7 14,7 15,7 40,3 287,1 29,3 1019,3
29,7 14,7 29,7 44,8 314,2 30,1 958,0
29,7 14,7 43,7 40,3 273,0 29,3 1072,0
15,7 19,1 9,9 29,7 67,8 12,1 1788,9
15,7 19,1 15,7 40,3 167,6 21,3 1269,9
15,7 19,1 29,7 44,8 215,4 29,3 1358,4
15,7 19,1 43,7 40,3 304,8 35,2 1153,9
9,9 29,7 15,7 40,3 63,3 12,1 1914,6
9,9 29,7 29,7 44,8 210,5 24,9 1181,8
9,9 29,7 43,7 40,3 324,2 35,4 1093,0
15,7 40,3 29,7 44,8 73,1 14,7 2008,0
15,7 40,3 43,7 40,3 196,0 28,0 1428,6
29,7 44,8 43,7 40,3 78,1 14,7 1879,4

90
Tabela AII.5 Valores de coordenadas da localização dos pontos de medição (xi,xf, yi, yf),
tempo de propagação das ondas de ultrassom (µs), comprimento da onda de ultrassom (cm) e
velocidade de propagação das ondas de ultrassom naquele trajeto (m/s). Espécie Poencianella
pluviosa (sibipiruna)
coordenadas t (µs) L (cm)
V (m.s-
¹) xi yi xf yf
47,4 28,4 41,8 16,5 84,8 13,1 1546,2
47,4 28,4 28,4 11,6 136,7 25,3 1853,3
47,4 28,4 15,0 16,5 222,9 34,5 1546,4
47,4 28,4 9,5 28,4 252,3 37,9 1502,2
47,4 28,4 15,0 40,3 226,7 34,5 1520,5
47,4 28,4 28,4 45,2 124,2 25,3 2039,9
47,4 28,4 41,8 40,3 69,4 13,1 1890,7
41,8 16,5 28,4 11,6 65,7 14,3 2174,3
41,8 16,5 15,0 16,5 114,6 26,8 2338,5
41,8 16,5 9,5 28,4 198,6 34,5 1735,2
41,8 16,5 15,0 40,3 194,5 35,8 1841,8
41,8 16,5 28,4 45,2 216,6 31,7 1461,5
41,8 16,5 41,8 40,3 117,4 23,8 2023,7
28,4 11,6 15,0 16,5 71,5 14,3 1997,8
28,4 11,6 9,5 28,4 124,2 25,3 2039,9
28,4 11,6 15,0 40,3 163,6 31,7 1934,9
28,4 11,6 28,4 45,2 192,7 33,6 1744,1
28,4 11,6 41,8 40,3 166,1 31,7 1905,8
15,0 16,5 9,5 28,4 60,6 13,1 2163,7
15,0 16,5 15,0 40,3 107,2 23,8 2217,3
15,0 16,5 28,4 45,2 148,0 31,7 2139,6
15,0 16,5 41,8 40,3 210,9 35,8 1698,2
9,5 28,4 15,0 40,3 64,9 13,1 2021,9
9,5 28,4 28,4 45,2 118,0 25,3 2146,2
9,5 28,4 41,8 40,3 194,1 34,5 1775,9
15,0 40,3 28,4 45,2 70,2 14,3 2034,9
15,0 40,3 41,8 40,3 139,2 26,8 1925,2
28,4 45,2 41,8 40,3 66,8 14,3 2136,9

91
Tabela AII.6 Valores de coordenadas da localização dos pontos de medição (xi,xf, yi, yf),
tempo de propagação das ondas de ultrassom (µs), comprimento da onda de ultrassom (cm) e
velocidade de propagação das ondas de ultrassom naquele trajeto (m/s). Espécie Copaifera
sp.(copaíba)
coordenadas t (µs) L (cm)
V (m.s-
¹) xi yi xf yf
27,5 16,5 24,3 9,4 48,5 7,8 1602,2
27,5 16,5 16,5 6,5 465,6 14,9 319,3
27,5 16,5 8,7 9,4 271,45 20,1 739,2
27,5 16,5 5,5 16,5 417 22,0 527,6
27,5 16,5 8,7 23,6 356,7 20,1 562,5
27,5 16,5 16,5 26,5 106,75 14,9 1392,6
27,5 16,5 24,3 23,6 69,3 7,8 1121,3
24,3 9,4 16,5 6,5 520,1 8,3 159,8
24,3 9,4 8,7 9,4 224,45 15,6 693,1
24,3 9,4 5,5 16,5 301,65 20,1 665,2
24,3 9,4 8,7 23,6 460,75 21,0 456,3
24,3 9,4 16,5 26,5 156,45 18,8 1199,1
24,3 9,4 24,3 23,6 118,3 14,1 1195,4
16,5 6,5 8,7 9,4 100 8,3 831,1
16,5 6,5 5,5 16,5 186,4 14,9 797,5
16,5 6,5 8,7 23,6 426,45 18,8 439,9
16,5 6,5 16,5 26,5 572,6 20,0 349,3
16,5 6,5 24,3 23,6 394,55 18,8 475,5
8,7 9,4 5,5 16,5 41,05 7,8 1892,9
8,7 9,4 8,7 23,6 128,5 14,1 1100,6
8,7 9,4 16,5 26,5 240 18,8 781,6
8,7 9,4 24,3 23,6 284,5 21,0 739,0
5,5 16,5 8,7 23,6 50,3 7,8 1544,8
5,5 16,5 16,5 26,5 148,4 14,9 1001,8
5,5 16,5 24,3 23,6 336,95 20,1 595,5
8,7 23,6 16,5 26,5 59,3 8,3 1401,6
8,7 23,6 24,3 23,6 163,1 15,6 953,8
16,5 26,5 24,3 23,6 64,7 8,3 1284,6

92
ANEXO III
Imagens Tomográficas dos toretes ensaiados
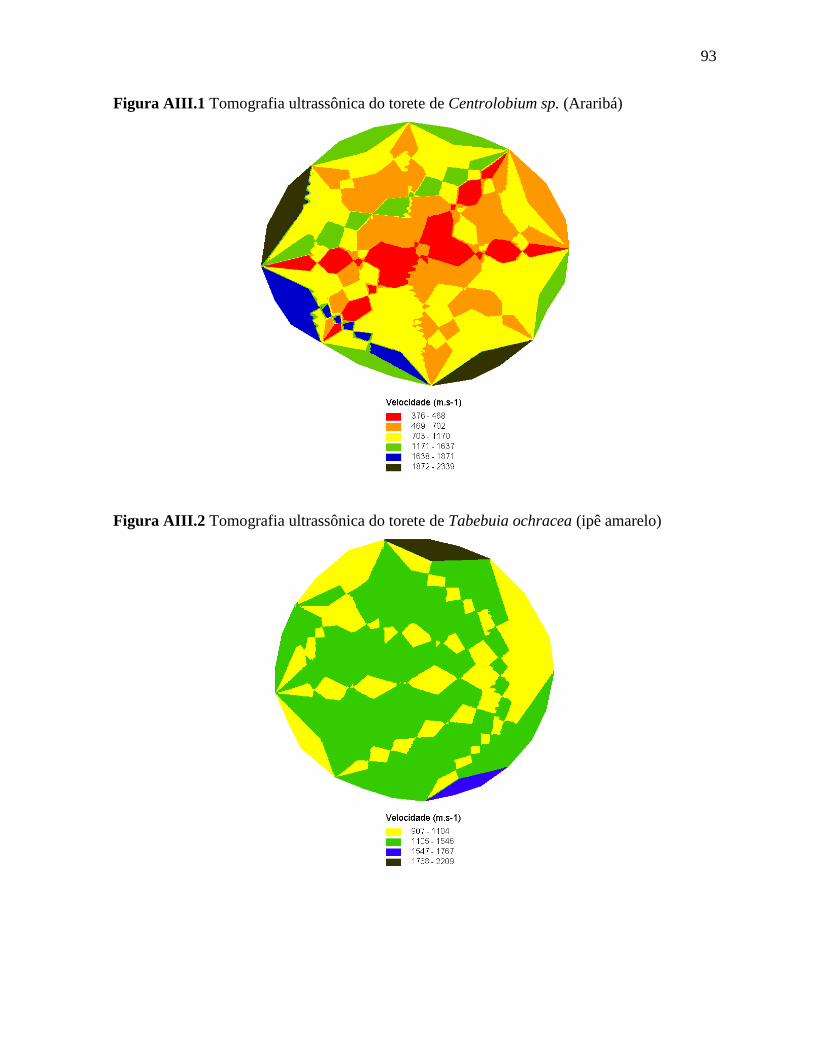
93
Figura AIII.1 Tomografia ultrassônica do torete de Centrolobium sp. (Araribá)
Figura AIII.2 Tomografia ultrassônica do torete de Tabebuia ochracea (ipê amarelo)

94
Figura AIII.3 Tomografia ultrassônica do torete de Liquidambar styraciflua (liquidambar)
Figura AIII.4 Tomografia ultrassônica do torete de Platanus sp. (plátano)

95
Figura AIII.5 Tomografia ultrassônica do torete de Poencianella pluviosa (sibipiruna)
Figura AIII.6 Tomografia ultrassônica do torete de Copaifera sp.(copaíba)