Embed Size (px)
Citation preview

SECO-AM: AN APPROACH FOR MAINTENANCE OF IT ARCHITECTURE IN
SOFTWARE ECOSYSTEMS
Thaiana Maria Pinheiro Lima
Dissertação de Mestrado apresentada ao
Programa de Pós-graduação em Engenharia de
Sistemas e Computação, COPPE, da
Universidade Federal do Rio de Janeiro, como
parte dos requisitos necessários à obtenção do
título de Mestre em Engenharia de Sistemas e
Computação.
Orientadores: Cláudia Maria Lima Werner
Rodrigo Pereira dos Santos
Rio de Janeiro
Março de 2018
SECO-AM: AN APPROACH FOR MAINTENANCE OF IT ARCHITECTURE IN
SOFTWARE ECOSYSTEMS
Thaiana Maria Pinheiro Lima
DISSERTAÇÃO SUBMETIDA AO CORPO DOCENTE DO INSTITUTO ALBERTO
LUIZ COIMBRA DE PÓS-GRADUAÇÃO E PESQUISA DE ENGENHARIA
(COPPE) DA UNIVERSIDADE FEDERAL DO RIO DE JANEIRO COMO PARTE
DOS REQUISITOS NECESSÁRIOS PARA A OBTENÇÃO DO GRAU DE MESTRE
EM CIÊNCIAS EM ENGENHARIA DE SISTEMAS E COMPUTAÇÃO.
Examinada por:
________________________________________________
Prof. Cláudia Maria Lima Werner, D.Sc.
________________________________________________
Prof. Rodrigo Pereira dos Santos, D.Sc.
________________________________________________
Prof. Guilherme Horta Travassos, D.Sc.
________________________________________________
Prof. Elisa Yumi Nakagawa, D.Sc.
RIO DE JANEIRO, RJ – BRASIL
MARÇO DE 2018
iii
Lima, Thaiana Maria Pinheiro
SECO-AM: An Approach for Maintenance of IT
Architecture in Software Ecosystems / Thaiana Maria
Pinheiro Lima. – Rio de Janeiro: UFRJ/COPPE, 2018.
XV, 175 p.: il.; 29,7 cm.
Orientadores: Cláudia Maria Lima Werner
Rodrigo Pereira dos Santos
Dissertação (mestrado) – UFRJ/ COPPE/ Programa de
Engenharia de Sistemas e Computação, 2018.
Referências Bibliográficas: p. 122-128
1. Software Ecosystems. 2. IT Management. 3. IT
Architecture Maintenance. 4. Sociotechnical Networks. 5.
Software Engineering. I. Werner, Claudia Maria Lima et
al.. II. Universidade Federal do Rio de Janeiro, COPPE,
Programa de Engenharia de Sistemas e Computação. III.
Título.

iv
For my dear grandmother Maria Luiza Pinheiro (in memoriam)...
I love and miss you deeply.
Para minha querida avó Maria Luiza Pinheiro (in memoriam) ...
Eu amo e sinto sua falta profundamente.
v
Acknowledgements
I would like to thank my family for the support I received since I was just a kid,
especially to my mother Eurisvan, my brother Thalles, and my father Antonio. I
dedicate this work for my grandma Maria Luiza (in memoriam). I would like to thank
my friends Rafaela Pedrosa and Beatriz Campos for the encouragement, as well as Lívia
Ribeiro, Luiz Alves, Mariane Martins, Vítor Silva, Sylvia Coradesqui, and all other
colleagues for helping me through college.
To my great advisors Prof. Cláudia Werner and Prof. Rodrigo Santos, I may say
that I cannot thank you enough for the opportunity, advices, reviews, and all teachings
since 2011 in the Scientific Initiation Program, during my final project for Bachelor
degree, and Master course. I would like to thank PESC/COPPE/UFRJ professors
Guilherme Travassos, Ana Regina, Toacy, and Jano de Souza for the precious classes in
the last few years.
I appreciate all Reuse Research Group for helping me to grow and for the
friendship, in special, Cláudia Susie, Sergio Henriques, Filipe Arantes, Gabriel Souza,
Benno Albert, Eldany Teixeira, Marcelo Schots, and Marcelo França. I need to thank
my friends from CAPGov Nathália Lopes, Gustavo Pinto, Silvia Benza, and all
colleagues that helped me to get in touch with companies outside the university
addressing current industry problems.
Finally, I would like to thank CAPES for financial support during my research.

vi
Resumo da Dissertação apresentada à COPPE/UFRJ como parte dos requisitos
necessários para a obtenção do grau de Mestre em Ciências (M.Sc.)
SECO-AM: UMA ABORDAGEM PARA MANUTENÇÃO DA ARQUITETURA DE
TI EM ECOSSISTEMAS DE SOFTWARE
Thaiana Maria Pinheiro Lima
Março/2018
Orientadores: Cláudia Maria Lima Werner
Rodrigo Pereira dos Santos
Programa: Engenharia de Sistemas e Computação
Organizações adquirentes ou fornecedoras de software compõem um Ecossistema
de Software (ECOS). Os sistemas utilizados pela organização para alcançar seus
objetivos e processos de trabalho são apoiados por tecnologias incluídas na plataforma
tecnológica de seu ECOS, e.g., bancos de dados e servidores web. Modificações nessas
tecnologias podem levar sistemas essenciais a ficarem sem suporte ou a perderem
desempenho. É relevante que informações sobre tecnologias e seus relacionamentos
sejam consideradas pelo gerente de TI. No entanto, tais informações podem estar em
diferentes documentos e serem difíceis de analisar devido à falta de suporte. O objetivo
deste trabalho é auxiliar a tomada de decisão na modificação da arquitetura de TI, i.e., o
conjunto de tecnologias de suporte aos produtos e serviços da organização. Dois estudos
exploratórios indicaram características que auxiliam na manutenção, e.g., visualização
de redes do ECOS e utilização de critérios bem definidos. Nesse sentido, foram
investigados fatores críticos para manutenção da arquitetura de TI por meio de um
mapeamento da literatura e pesquisa de opinião com especialistas. Uma abordagem que
apoia esta comparação e análise foi desenvolvida, observando a estrutura da rede que
representa o ECOS da organização. Um protótipo implementando as principais
características da abordagem foi desenvolvido e um estudo de viabilidade foi executado,
obtendo feedback positivo sobre a relevância da abordagem e dos recursos do protótipo.
vii
Abstract of Dissertation presented to COPPE/UFRJ as a partial fulfillment of the
requirements for the degree of Master of Science (M.Sc.)
SECO-AM: AN APPROACH FOR MAINTENANCE OF IT ARCHITECTURE IN
SOFTWARE ECOSYSTEMS
Thaiana Maria Pinheiro Lima
March/2018
Advisors: Cláudia Maria Lima Werner
Rodrigo Pereira dos Santos
Department: Computer Science and System Engineering
Software acquirer or supplier organizations compose a Software Ecosystem
(SECO). The systems used by an organization to achieve its objectives and work
processes are supported by technologies included in the SECO’s technology platform,
e.g., databases and web servers. Modifications on these technologies can lead to
essential systems becoming unsupported or losing performance. Thus, IT managers
should consider information about technologies and their relationships. Such
information may be spread in different documents and difficult to analyze due to the
lack of support. The purpose of this research is to assist IT managers and architects in
making decisions regarding the IT architecture modification, i.e., the set of technologies
supporting products and services adopted by an organization. Two exploratory studies
have indicated features to assist in maintenance, e.g., visualization of SECO networks
and use of well-defined criteria. From those studies, we investigated critical factors for
maintaining the IT architecture through a literature mapping and an expert opinion
survey. As a result, we developed an approach to support technology assessment and
analysis by looking at the network structure that represents the organization’s SECO. A
prototype implementing the key features of the proposed approach was developed. We
evaluated both approach and prototype based on a feasibility study, obtaining positive
feedback on the approach’s relevance and prototype’s resources.
viii
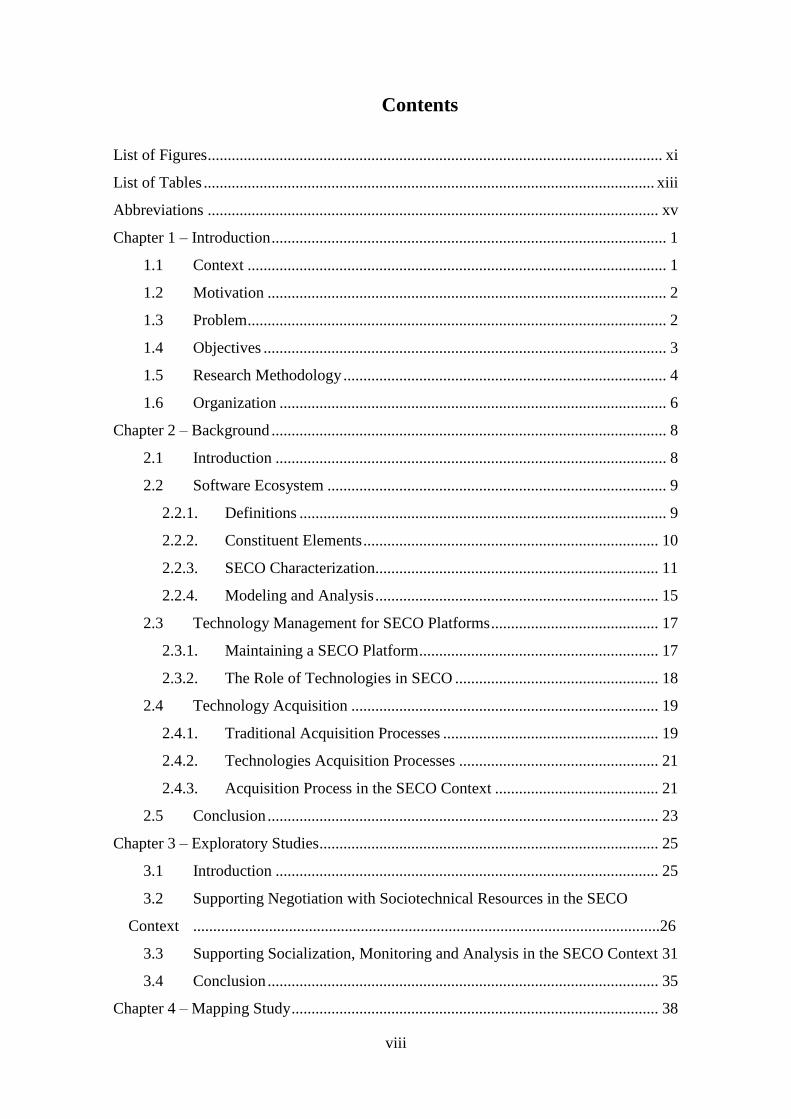
Contents
List of Figures .................................................................................................................. xi
List of Tables ................................................................................................................. xiii
Abbreviations ................................................................................................................. xv
Chapter 1 – Introduction ................................................................................................... 1
1.1 Context ......................................................................................................... 1
1.2 Motivation .................................................................................................... 2
1.3 Problem ......................................................................................................... 2
1.4 Objectives ..................................................................................................... 3
1.5 Research Methodology ................................................................................. 4
1.6 Organization ................................................................................................. 6
Chapter 2 – Background ................................................................................................... 8
2.1 Introduction .................................................................................................. 8
2.2 Software Ecosystem ..................................................................................... 9
2.2.1. Definitions ............................................................................................ 9
2.2.2. Constituent Elements .......................................................................... 10
2.2.3. SECO Characterization....................................................................... 11
2.2.4. Modeling and Analysis ....................................................................... 15
2.3 Technology Management for SECO Platforms .......................................... 17
2.3.1. Maintaining a SECO Platform ............................................................ 17
2.3.2. The Role of Technologies in SECO ................................................... 18
2.4 Technology Acquisition ............................................................................. 19
2.4.1. Traditional Acquisition Processes ...................................................... 19
2.4.2. Technologies Acquisition Processes .................................................. 21
2.4.3. Acquisition Process in the SECO Context ......................................... 21
2.5 Conclusion .................................................................................................. 23
Chapter 3 – Exploratory Studies ..................................................................................... 25
3.1 Introduction ................................................................................................ 25
3.2 Supporting Negotiation with Sociotechnical Resources in the SECO
Context .....................................................................................................................26
3.3 Supporting Socialization, Monitoring and Analysis in the SECO Context 31
3.4 Conclusion .................................................................................................. 35
Chapter 4 – Mapping Study ............................................................................................ 38
ix
4.1 Introduction ................................................................................................ 38
4.1.1. The Previous Mapping Study ............................................................. 39
4.2 Planning ...................................................................................................... 40
4.3 Execution .................................................................................................... 41
4.4 Results ........................................................................................................ 42
4.5 Analysis ...................................................................................................... 47
4.5.1. ISO/IEC 25000 Comparison ............................................................... 49
4.6 Threats to Validity ...................................................................................... 52
4.7 Conclusion .................................................................................................. 53
Chapter 5 – Survey ......................................................................................................... 55
5.1 Introduction ................................................................................................ 55
5.2 Planning ...................................................................................................... 56
5.2.1. Objective ............................................................................................. 56
5.2.2. Participants ......................................................................................... 57
5.3 Execution .................................................................................................... 57
5.4 Results ........................................................................................................ 58
5.4.1. Characterization .................................................................................. 58
5.4.2. Critical Factors ................................................................................... 59
5.4.3. Critical Factors’ Attributes Assessment ............................................ 61
5.5 Analysis ...................................................................................................... 70
5.6 Threats to Validity ...................................................................................... 73
5.7 Conclusion .................................................................................................. 74
Chapter 6 – SECO-AM approach ................................................................................... 76
6.1 Introduction ................................................................................................ 76
6.2 Research Questions and Requirements....................................................... 77
6.3 Approach Definition ................................................................................... 79
6.4 Tool support ................................................................................................ 85
6.4.1. Tool’s Motivation ............................................................................... 85
6.4.2. Tool’s Requirements .......................................................................... 85
6.4.3. Tool’s Architecture ............................................................................. 86
6.4.4. Prototype ............................................................................................. 88
6.4.5. Discussion ........................................................................................... 94
6.5 Related Work .............................................................................................. 94
6.6 Conclusion .................................................................................................. 97
x
Chapter 7 – Evaluation ................................................................................................... 98
7.1 Introduction ................................................................................................ 98
7.2 Feasibility Study ......................................................................................... 98
7.2.1. Planning .............................................................................................. 98
7.2.1.1. Specific Goals ..................................................................................... 99
7.2.1.2. Questions and metrics ......................................................................... 99
7.2.1.3. Definition of Hypotheses .................................................................. 101
7.2.1.4. Participants ....................................................................................... 102
7.2.1.5. Tasks ................................................................................................. 102
7.2.1.6. Data ................................................................................................... 103
7.2.1.7. Groups .............................................................................................. 104
7.2.1.8. Variables ........................................................................................... 105
7.2.1.9. Instruments and Preparation ............................................................. 105
7.3 Pilot ........................................................................................................... 106
7.4 Execution .................................................................................................. 107
7.5 Analysis .................................................................................................... 107
7.5.1. Participant’s Profile .......................................................................... 107
7.6 Results ...................................................................................................... 108
7.7 Threats to validity ..................................................................................... 115
7.8 Conclusion ................................................................................................ 117
Chapter 8 – Conclusion ................................................................................................ 118
8.1 Contributions ............................................................................................ 118
8.2 Limitations ................................................................................................ 120
8.3 Future Work .............................................................................................. 120
References .................................................................................................................... 122
Appendix I - Selected Papers from the Mapping Study ............................................... 129
Appendix II – Glossary ................................................................................................ 133
Appendix III - Survey forms ........................................................................................ 145
Appendix IV – Informed Consent Form (In Portuguese) ............................................. 154
Appendix V - Participant Characterization Form (In Portuguese) ............................... 156
Appendix VI - Theoretical Background on SECO (In Portuguese) ............................. 157
Appendix VII – Tool’s Instructions (In Portuguese) ................................................... 163
Appendix VIII - Form for Conducting the Study (Tasks in Portuguese) ..................... 169
Appendix IX - Study Evaluation Questionnaire (In Portuguese) ................................. 171
xi
List of Figures
Figure 1.1. Research methodology ................................................................................... 4
Figure 2.1. Types of actor’s roles in a SECO ................................................................. 11
Figure 2.2. ReuseECOS ‘3+1’ Framework. Source: (SANTOS & WERNER, 2012) ... 13
Figure 2.3. SECO Social Lifecycle. Source: (SANTOS et al., 2014) ............................ 14
Figure 2.4. Example of a SECO modeled by SSN ......................................................... 16
Figure 2.5. Representation of SECO as graphs .............................................................. 17
Figure 2.6. MPS acquisition process. Source: (SOFTEX, 2013) ................................... 21
Figure 3.1. The negotiation process implemented at Brechó-EcoSys. Source: (SANTOS
et al., 2017) ..................................................................................................................... 27
Figure 3.2. Negotiation functionalities at Brechó-EcoSys. Source: (SANTOS et al.,
2017) ............................................................................................................................... 28
Figure 3.3. Negotiator profile at Brechó-EcoSys. Source: (SANTOS et al., 2017) ....... 28
Figure 3.4. My Network Panel at Brechó-EcoSys. Source: (SANTOS et al., 2017) ..... 29
Figure 3.5. Brechó-EcoSys extension for sociotechnical network analysis and
visualization. Source: (LIMA et al., 2016a) ................................................................... 32
Figure 3.6. SECO elements related to demand and solution analysis. Source: (LIMA et
al., 2016a) ....................................................................................................................... 33
Figure 3.7. Brechó-EcoSys extension as a Gephi’s plugi-in .......................................... 35
Figure 4.1. Mapping study methodology ....................................................................... 41
Figure 4.2. Number of citations for each attribute ......................................................... 45
Figure 4.3. ISO/IEC 25000 SQuaRE characteristics and sub-characteristics (part 1) ... 50
Figure 4.4. ISO/IEC 25000 SQuaRE characteristics and sub-characteristics
(continuation) ................................................................................................................. 50
Figure 5.1. Participant’s responses regarding experience with related topics ................ 58
Figure 5.2. (A) Q2 - Participants’ academic background, and (B) Q3 - Participants’
workplace........................................................................................................................ 58
Figure 5.3. Critical factors relevance assessment ........................................................... 59
Figure 5.4. Attributes’ assessment for CF1 .................................................................... 61
Figure 5.5. Attributes’ assessment for CF2 .................................................................... 62
Figure 5.6. Attributes’ assessment for CF3 .................................................................... 62
Figure 5.7. Attributes’ assessment for CF4 .................................................................... 63
xii
Figure 5.8. Attributes’ assessment for CF5 .................................................................... 63
Figure 5.9. Attributes’ assessment for CF6 .................................................................... 64
Figure 5.10. Attributes’ assessment for CF7 .................................................................. 64
Figure 5.11. Attributes’ assessment for CF8 .................................................................. 65
Figure 5.12. Attributes’ assessment for CF9 .................................................................. 65
Figure 5.13. Attributes’ assessment for CF10 ................................................................ 66
Figure 5.14. Attributes’ assessment for CF11 ................................................................ 66
Figure 5.15. Attributes’ assessment for CF12 ................................................................ 67
Figure 5.16. Attributes’ assessment for CF13 ................................................................ 67
Figure 5.17. Attributes’ assessment for CF14 ................................................................ 68
Figure 6.1. Initial SECO-AM design .............................................................................. 80
Figure 6.2. Selecting candidate technologies for an analysis ......................................... 84
Figure 6.3. Assessing candidate technologies ................................................................ 84
Figure 6.4. Analyzing an organization’s SECO ............................................................. 85
Figure 6.5. Tool’s overview ........................................................................................... 86
Figure 6.6. Brechó-EcoSys extension............................................................................. 87
Figure 6.7. SECO-AM’s main screen ............................................................................. 88
Figure 6.8. Registered analyses ...................................................................................... 89
Figure 6.9. Analysis details ............................................................................................ 89
Figure 6.10. Selecting critical factors ............................................................................. 89
Figure 6.11. Selecting attributes ..................................................................................... 90
Figure 6.12. Assessing candidates .................................................................................. 90
Figure 6.13. Side panel for SECO indicatons ................................................................. 91
Figure 6.14. Supplier Dependency network ................................................................... 92
Figure 6.15. Technology Dependency network ............................................................. 93
Figure 6.16. Potential Candidate’s Analysis network .................................................... 93
Figure 6.17. SWOT matrix ............................................................................................. 94
Figure 7.1. GQM model for evaluation ........................................................................ 100
Figure 7.2. Efficiency data for G1 (no tool) and G2 (with tool) .................................. 110
Figure 7.3. Effectiveness data for G1 (no tool) and G2 (with tool) ............................. 111
Figure 7.4. Tool support evaluation on helping to perform the tasks ........................... 114

xiii
List of Tables
Table 2.1. Definitions for SECO. Source: (MANIKAS & HANSEN, 2013) .................. 9
Table 2.2. SECO Taxonomy. Source: (BOSCH, 2009) ................................................. 12
Table 2.3. Considerations from the first step of MPS acquisition process (SOFTEX,
2013) ............................................................................................................................... 22
Table 2.4. Related concepts listed in the top 25 keywords from the SECO literature for
SECO architecture group ................................................................................................ 24
Table 4.1. Studies resulted from the mapping study extraction ..................................... 42
Table 4.2. Architecture-related quality attributes and the studies that mentioned them. 44
Table 4.3. Mapping study results organized as critical factors and attributes ................ 46
Table 4.4. Critical factors versus SECO health indications ........................................... 48
Table 4.5. SECO’s critical factors versus ISO/IEC 25000’s characteristics and sub-
characteristics ................................................................................................................. 51
Table 5.1. GQM for the survey goals ............................................................................. 57
Table 5.2. Comments about the SECO’s critical factors (Part 1) ................................... 60
Table 5.3. Comments about the critical factors (continuation) ...................................... 61
Table 5.4. Responses for Q9 – Missing attributes for the critical factors ...................... 69
Table 5.5. General comments about the attributes associated to the critical factors ...... 69
Table 5.6. Critical Factors’ evaluations in percentage related to the total number of
respondents for each questions. SR = Some Relevance; HR = Highly Relevant ........... 70
Table 5.7. Lowest evaluated attributes. HR = Highly Relevant ..................................... 71
Table 5.8. Final set of critical factor and attributes ........................................................ 75
Table 6.1. Networks considered by the SECO-AM ....................................................... 82
Table 6.2. Benefits and metrics ...................................................................................... 83
Table 6.3. Related work comparison (Y = Yes, P = Partly, N = No) ............................. 96
Table 7.1. G1 (feasibility)............................................................................................... 99
Table 7.2. G2 (ease of use) ............................................................................................. 99
Table 7.3. G3 (utility) ..................................................................................................... 99
Table 7.4. TAM Model’s questions for evaluating SECO-AM’s tool (also shortly called
‘SECO-AM’) ................................................................................................................ 101
Table 7.5. Participants’ group formation ...................................................................... 108
Table 7.6. Data from the tasks for each group performance ........................................ 109

xiv
Table 7.7. Efficiency and effectiveness for each group ............................................... 109
Table 7.8. Hypothesis test for efficiency ...................................................................... 110
Table 7.9. Hypothesis test for effectiveness ................................................................. 111
Table 7.10. SECO-AM evaluation ............................................................................... 112

xv
Abbreviations
API Application Programming Interface
BPMN Business Process Model and Notation
COTS Commercial Off-The-Shelf
GOTS Government Off-The-Shelf
GQM Goal-Question-Metric
ISO International Organization for Standardization
IEC International Electrotechnical Commission
ISV Independent Software Vendor
IT Information Technology
ICSOB International Conference on Software Business
IWSECO International Workshop on Software Ecosystems
FD Full Development
LOC Lines Of Code
MOTS Modifiable Off-The-Shelf
MPS Melhoria de Processo de Software (Software Process Improvement)
OSE Open Software Ecosystem
PR PageRank
RQ Research Question
SECO Software Ecosystem
SSN Software Supply Network
WEA Workshop on Ecosystem Architectures
WDES Workshop on Distributed Software Development, Software Ecosystems
and Systems-of-Systems

1
Chapter 1 – Introduction
This chapter aims to present the context, motivation, and problem addressed in this
research. In addition, we explain the goals and the methodology adopted to achieve
those goals, as well as the research structure.
1.1 Context
Software acquiring organizations generally have an IT to plan and establish
which technologies they adopt or standardize to support their applications (i.e., software
products and services). IT architecture is a list of technologies to be used as standard
within the organization (ROSS, 2013), often classified according to a category
(technology categories used by the organization, such as database, programming
language, among others). In addition, IT architecture contributes to meet organizational
business demands through a set of technical decisions (WEILS & ROSS, 2004).
Architecture modifications may involve adopting a new technology, removing part of
the architecture, or replacing technologies an organization already uses. Changes in
such architecture are not trivial as they affect the development or acquisition of new
applications that must be adherent to IT architecture, e.g., new software development
projects should use existing technological standard according to the IT architecture.
In addition, they may reflect on development team’s training needs regarding the
new technology, aversion to changes and switching licensing costs, or even applications
that depend on discontinued technology (LAGERSTRÖM et al., 2014). Because of
rapid technological evolution, organizations frequently need to update and reevaluate
their IT architecture. Evaluating the technology in relation to pre-established,
manageable, and well-structured criteria provides greater transparency to the process, as
the IT managers and architects should be able to check/audit the adopted criteria. In
(LAGERSTRÖM et al., 2014), one of the most successful actions pointed out by
companies is to use a well-defined procedure for IT acquisition. Part of the definition of
that procedure is to establish evaluation criteria for technology selection (SHAFIA et
al., 2015).
Hence, an organizational platform is maintained through sustaining a set of
technologies employed by an organization’s teams. The context in which decisions
regarding platform maintenance becomes more complex as third parties have greater

2
influence in the organization, and its boundaries become more blurred due to
relationships with external organization and developers. Such context reflects Software
Ecosystem (SECO) problems since they handle internal and external parties. SECO
consists of a set of actors, software artifacts, a common technological platform, and
their relationships (JANSEN et al., 2009). A keystone is the central organization in a
SECO. Part of the elements a keystone controls is the set of technologies used to
maintain a SECO platform based on its architecture. The keystone’s IT management
team is responsible for maintaining the SECO’s applications and their supporting
technologies according to business (or community) and technical needs.
1.2 Motivation
The problem of choosing which technology to introduce, discontinue, or replace
in the platform architecture affects software governance and development process. A
keystone may disrupt its network, loose players and break dependencies. However, a
right choice can improve relationships and reduce costs with training and licensing, for
example. In order to choose a given technology, IT managers and architects need to
understand what requirements and quality attributes should be addressed. Often, they
make decisions together as an IT management team.
As a result, the organization would have a minimum set of criteria to be used in
the technology selection activity. A difficulty faced by an IT architect is that quality
attributes are not always clearly specified in the requirements, or even sufficiently
captured by requirements engineering teams (GORTON, 2011). Exploring SECO
literature, it was noticed a lack of studies that investigate the context of selecting
technologies to acquire or discontinue, considering an organization’s SECO. It is
aggravated by the common sense that practitioners often lack a formal procedure for
acquiring or removing technologies, or even for analyzing the impact this procedure
may have on other applications an organization uses.
1.3 Problem
Forming and sustaining a SECO is a challenge that includes more than technical
problems: organizational and business concerns are also defiant (SADI & YU, 2015).
Maintaining a platform is one of the existing activities for sustaining a SECO, since this
context aggravates the problem of identifying, obtaining, and analyzing data that

3
influence IT architecture maintenance. In addition, it is also necessary to know what
impact such change brings to the organization’s SECO in terms of critical issues, such
as costs, integration problems, technology dependencies, and different types of license.
The problem addressed in this research refers to the identification of critical factors for
evaluating candidate technologies in SECO.
Revisiting an organization’s IT architecture is necessary to maintain the
technological platform. Moreover, it is a particular challenge considering that a SECO
involves elements that interact outside the organization scope, e.g., applications,
technologies, internal and external developers, suppliers, and users. There are critical
factors for the maintenance of an IT architecture, from organizational or technical
nature, not identified or used together in the SECO context. Those critical factors often
are not clear as to their description, possible qualities, and analysis. Each critical factor
may be specified in attributes so that it is better comprehended through many
perspectives of the same critical factor. Those attributes are sub characteristics tied to a
critical factor.
For public companies, this problem has even more restrictions, such as
adherence to governmental norms and standards, current legislation, electronic
procurement process with less control over technology selection processes, and budget.
Private organizations usually have more freedom to choose technologies and
applications. However, both types of organizations face the problem of lacking
indications to guide technologies’ modification to maintain IT architecture (and how to
collect them).
1.4 Objectives
This work aims to develop an approach to support the IT management team on
maintaining an organizational platform based on IT architecture through technology
selection process and impact analysis regarding the organization’s arrangement and
strategy, from the SECO perspective. There are alternatives for representing a SECO
network, e.g., Software Supply Networks (SSN), Graphs Theory, and i* modeling,
although only SSN is specifically designed for SECO (SADI & YU, 2015).
It is necessary to analyze the sociotechnical network based on a modeling
representation, which characterizes relationships within a SECO so that an IT
manager/architect can clearly decide which technology is more beneficial to the

4
organization at the time of selection (for acquisition, modification or discontinuation),
or in a near future. The objective is not to be limited by a specific SECO environment,
such as mobile or cloud, but to have a broad range so that it benefits IT managers and
architects in different domains.
The specific goals to address problems and needs described in this chapter are:
Identification and validation of critical factors and their attributes for
selecting technologies, providing an auditable, explicit, and general
evaluation criteria based on a literature mapping study1 and a survey with
experts;
Analysis of an acquisition process in order to adapt it for technology selection
and SECO concerns;
Use of graphs as a SECO representation and analysis method;
An approach for comprising the goals presented above (solution); and
A tool support for implementing the proposed solution.
1.5 Research Methodology
This research followed the methodology shown in Figure 1.1. Literature
mapping and survey studies sustained the solution’s conception and a feasibility study
were used as procedures for evaluating the proposed solution and the supporting tool.
Figure 1.1. Research methodology
Each activity from Figure 1.1 is described as follows:
Initial literature characterization: In this phase, the literature on SECO was
studied and some research challenges were identified, mainly covering the
1 Systematic Mapping Study: A mapping study gathers a list of research papers in a topic. This type of
literature review mainly focuses on structuring a research area. Hence, it offers a general idea of the
research area scope. Besides, it also aids the determination of research gaps and tendencies (PETERSON
et al., 2015).
5
following topics: technology selection, quality measures for the SECO
context, SECO health, software product quality, and SECO characteristics
and classification;
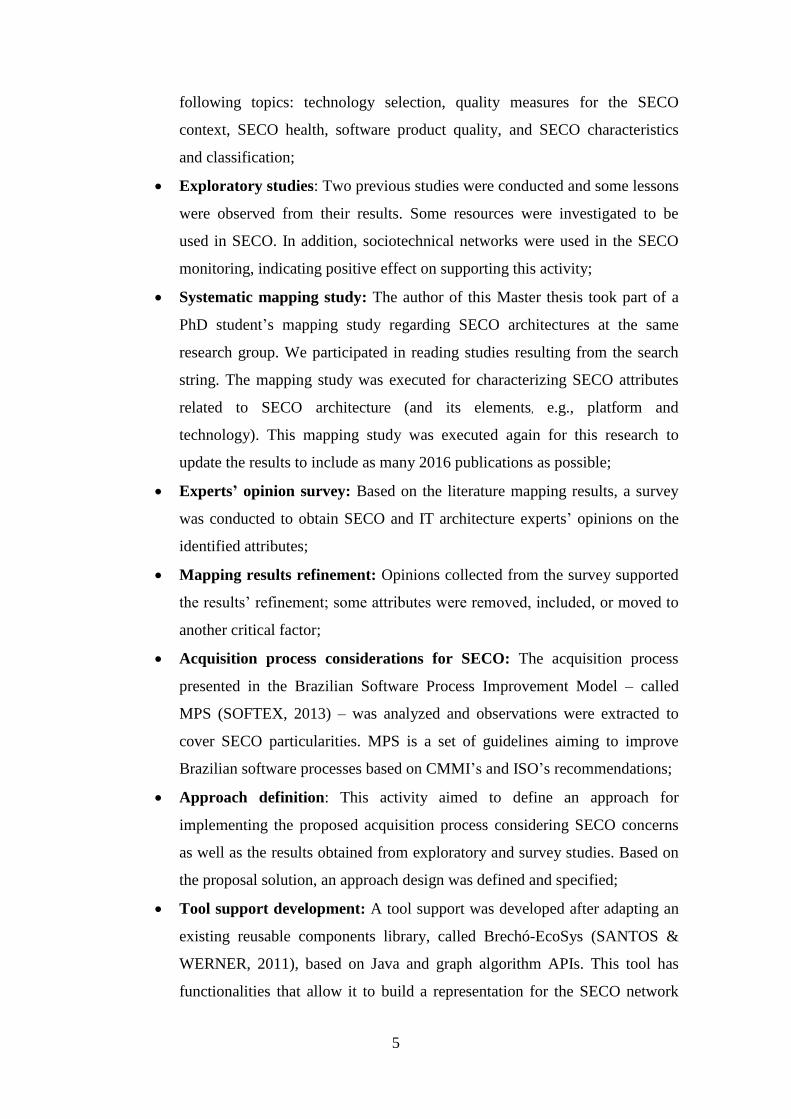
Exploratory studies: Two previous studies were conducted and some lessons
were observed from their results. Some resources were investigated to be
used in SECO. In addition, sociotechnical networks were used in the SECO
monitoring, indicating positive effect on supporting this activity;
Systematic mapping study: The author of this Master thesis took part of a
PhD student’s mapping study regarding SECO architectures at the same
research group. We participated in reading studies resulting from the search
string. The mapping study was executed for characterizing SECO attributes
related to SECO architecture (and its elements, e.g., platform and
technology). This mapping study was executed again for this research to
update the results to include as many 2016 publications as possible;
Experts’ opinion survey: Based on the literature mapping results, a survey
was conducted to obtain SECO and IT architecture experts’ opinions on the
identified attributes;
Mapping results refinement: Opinions collected from the survey supported
the results’ refinement; some attributes were removed, included, or moved to
another critical factor;
Acquisition process considerations for SECO: The acquisition process
presented in the Brazilian Software Process Improvement Model – called
MPS (SOFTEX, 2013) – was analyzed and observations were extracted to
cover SECO particularities. MPS is a set of guidelines aiming to improve
Brazilian software processes based on CMMI’s and ISO’s recommendations;
Approach definition: This activity aimed to define an approach for
implementing the proposed acquisition process considering SECO concerns
as well as the results obtained from exploratory and survey studies. Based on
the proposal solution, an approach design was defined and specified;
Tool support development: A tool support was developed after adapting an
existing reusable components library, called Brechó-EcoSys (SANTOS &
WERNER, 2011), based on Java and graph algorithm APIs. This tool has
functionalities that allow it to build a representation for the SECO network
6
structure, e.g., registering applications, technologies (candidates or not) and
dependencies as library’s components. This network is analyzed before and
after choosing a given technology so that it is possible to assess any related
impact on the SECO;
Feasibility study: A evaluation was performed with the proposal of
evaluating the tool support to assess its feasibility and also the approach’s
contribution, as well as to collect suggestions of improvements on its
functionalities and usability; and
Refinement: After analyzing the results of the feasibility study, the proposed
approach was refined and the tool’s functionalities modified to better suit the
practitioners’ context.
1.6 Organization
This Master thesis is organized in eight chapters. In this chapter, the context of
this work is presented, as well as the motivation and problem this research addresses.
Objectives are defined and the methodology to reach those objectives is explained.
Chapter 2 presents a discussion on the main topics of this research that serve as
background to develop an approach for supporting the problems described in Chapter 1.
Furthermore, the SECO literature is discussed, key concepts and representation are
presented, and technology management based on technology selection in SECO
platform is explored.
Chapter 3 describes two exploratory studies where it was possible to better
understand some resources and analysis that can be applied to a SECO context. Those
resources are based on the social network theory and help SECO actors to find
information and artifacts they are searching for in a component library. The negotiation
decision process between a software artifact’s seller and buyer was explored. From
those studies, it was possible to realize many challenges when handling software
artifacts in a SECO, e.g., difficulty of finding information about the artifact that is not
provided by known suppliers; importance of having a sense of the community opinion;
and lack of sociotechnical resources to support users to communicate among them and
with the keystone.
Chapter 4 explores the planning, execution, and analysis of a literature mapping
study. This study aims to collect data on how a technology can be assessed to be

7
adopted or discontinued from the SECO literature and considering the architecture
perspective. The main finding is a list of criteria that serves as a baseline for technology
comparison based on literature rather than having different criteria for each decision-
maker.
Chapter 5 evaluates the results described in Chapter 4 based on a survey with
experts on SECO and IT architecture. The list of criteria was adapted from the experts’
recommendations, adding, removing, and changing criteria to another critical factor.
Chapter 6 describes the proposed approach to reach the objectives presented in
Chapter 1. The approach aims to support an IT management team to maintain the set of
technologies that sustains a SECO platform. Lessons from the exploratory studies were
used to benefit the approach with both social and technical features, as well as the
results from Chapter 5 with the refined set of criteria. In addition, a tool support was
developed and described in this chapter.
Chapter 7 explains how the proposed approach and tool support were evaluated.
A feasibility study was conducted with a large organization’s IT management team
members. Data from a large software development project was used and those
professionals executed pre-established tasks and answered a questionnaire. Based on the
results, the proposed approach was refined.
Chapter 8 concludes this Master thesis with some final considerations.
Contributions to the state of the art and to IT practitioners are discussed, as well as the
research limitations. Future work is also presented in this chapter.

8
Chapter 2 – Background
To address the problem exposed in Chapter 1, this chapter presents the main areas that
ground the search for a solution and other topics addressed in this work. Concepts about
software ecosystems (SECO), technology selection and platform maintenance based on
IT management are essential to the development of an approach to support SECO
platform maintenance.
2.1 Introduction
Software acquiring organizations use a variety of processes to organize and
select software products and services from the market to develop, acquire, or sell IT
solutions to their clients in accordance with the organization’s strategic objectives.
These processes influence other organization’s dimensions, e.g., political, economic,
and technical. The acquisition process particularly affects a software organization’s
technological architecture (i.e., standard listing of specific technologies to be used in the
organization) because such process helps adoption/discontinuity of technologies that
support the organization’s software products. This is hard to handle when it includes
supporting technologies, e.g., database management system, virtual machines, over
which other applications are executed.
Those technologies are not isolated within their institutional boundaries
(especially in a SECO) and generate a sociotechnical network that can aid to decide
whether to insert/remove technologies into/from the organization’s platform. When
choosing to acquire a supporting technology, an organization is also choosing to which
SECO it will be integrated. To achieve better results in selecting such technologies, a
large set of information is needed regarding technology dependencies and their
relationships with other software products and services, as well as data on SECO
elements, e.g., licenses, number of actors using the technology, etc. This information
may be spread throughout the organizational sectors and the underlying network, or
they may not have registered indications where the technology modification could affect
the organization, such as costs or the need for training.
This chapter is structured as follows: Section 2.2 presents the main concepts
from SECO literature used to for the background for this research; Section 2.3 discuss
some aspects of SECO platform maintenance and the role technologies have in the
9
platform; Section 2.4 present steps necessary for software and technology's acquisition;
and Section 2.5 concludes the chapter.
2.2 Software Ecosystem
Once an organization ‘opens’ its platform beyond organizational boundaries by
making them available under a common technological platform and interacting with
external actors, a SECO is formed (BOSCH, 2009). In addition, an organization reaches
external partners exchanging technical artifacts, creating value and connections (such as
dependencies). Thus, a SECO encompasses not only the organization and its products,
but also other organizations (e.g., partners and suppliers) based on a SECO common
technological platform.
2.2.1. Definitions
A systematic literature review (MANIKAS & HANSEN, 2013) gathered
different definitions from the SECO literature, as reproduced in Table 2.1. From those
definitions, MANIKAS & HANSEN (2013) identified three essential concepts:
Business (expressed as 'set of business' or 'community of users'), Common Software
(expressed as common technological platform), and Connecting Relationships.
Table 2.1. Definitions for SECO. Source: (MANIKAS & HANSEN, 2013)
Authors Definition MESSERSCHMITT
& SZYPERSKI
(2003)
“a software ecosystem refers to a collection of software products that
have some given degree of symbiotic relationships.”
JANSEN et al.
(2009)
(most cited
definition)
“We define a software ecosystem as a set of businesses functioning
as a unit and interacting with a shared market for software and
services, together with the relationships among them. These
relationships are frequently under-pinned by a common
technological platform or market and operate through the exchange
of information, resources and artifacts.”
BOSCH
(2009) “A software ecosystem consists of the set of software solutions that
enable, support and automate the activities and transactions by the
actors in the associated social or business ecosystem and the
organizations that provide these solutions.”
BOSCH AND
BOSCH-
SIJTSEMA
(2010a; 2010b)
“A software ecosystem consists of a software platform, a set of
internal and external developers and a community of domain experts
in service to a community of users that compose relevant solution
elements to satisfy their needs.”
LUNGU et al.
(2010) “A software ecosystem is a collection of software projects which are
developed and evolve together in the same environment.”

10
From this compilation, it is noticed that the concepts have different dimensions
at the same time, i.e., social, business, and technical. Relationships and communities are
features that differentiate SECO from traditional environments, as they have concerns
about external partners and developers outside an organization.
2.2.2. Constituent Elements
SECO is essentially formed by relationships. There is a set of elements that
configure a SECO as they form relationships: a common technological platform to
support software development, e.g., Java platform supporting development of
applications in Android SECO; actors inside and outside an organization, e.g., user,
technology’s suppliers, and external and internal developers; and SECO assets, e.g.,
developed applications, documentation, videos, pattern specification, software
components etc.
The common technological platform comprises the core software technology
on which a SECO is built and maintained (MANIKAS & HANSEN, 2013), e.g.,
Eclipse, Windows, and SAP. A real example is the iPhone environment where the
actors are Apple, users, internal and external developers; and iOS is the core software
technology, i.e., the common technological platform on which the applications are built.
An actor (LIMA et al., 2014) can play a variety of roles, e.g., a company (or
other types of organizations), a company’s sector, end user, supplier, client, and a
project team. Depending on the relationship being analyzed, the same actor may play a
distinct role, e.g., an actor may be a component supplier and an application end-user
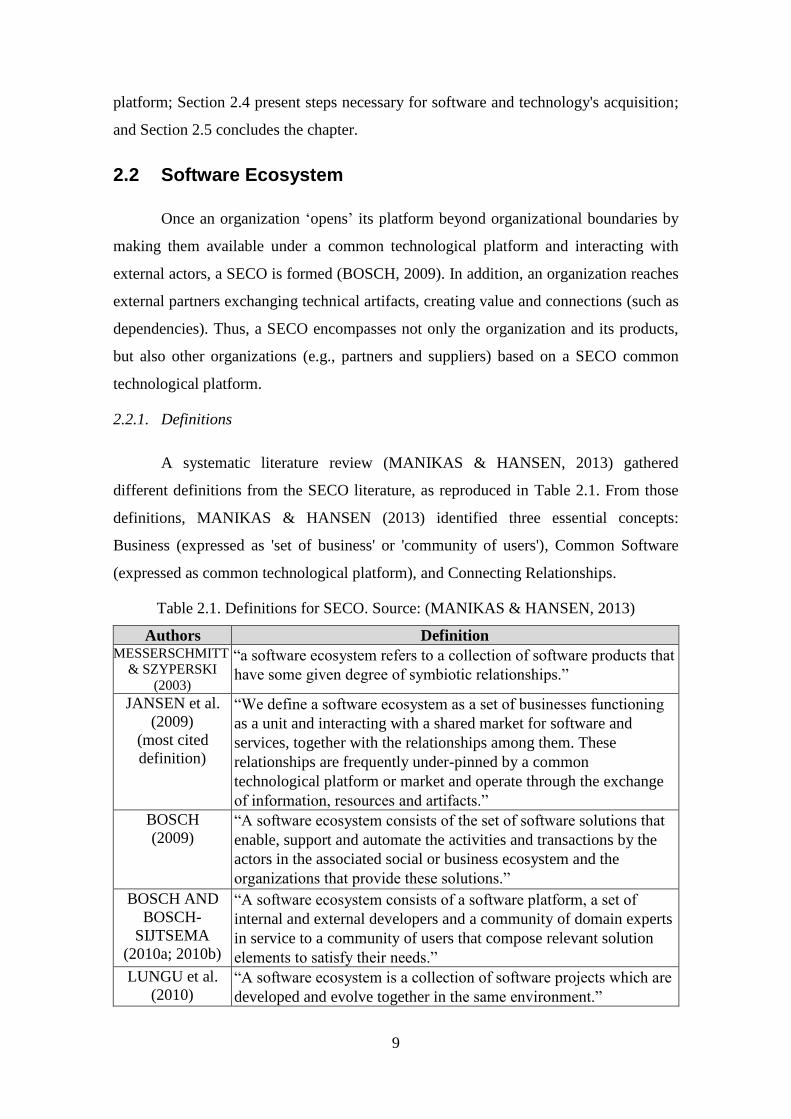
within the same SECO. There are many types of actors. Figure 2.1 illustrates three types
of actors’ roles extracted from the literature (LIMA et al., 2013; 2014).
Niche players are actors who are internal to an organization and can perform a
variety of activities, e.g., selling, purchasing, and developing. They are classified into
different types according to their activities. Actors that work outside the organization
are labelled as external actors and may change the platform by developing on their own,
e.g., developing a mobile application for only later submit it to the marketplace or
unofficial means of distribution. Nonetheless, that may happen under the organization
demand, e.g., an organization hires an independent development and provides
requirements. The actors that heavily influence a SECO are known as hubs. The main
11
hubs are keystone (wants the SECO to grow) and dominator (wants the SECO to fail),
e.g., in Android SECO, Google is the keystone and Apple is the dominator.
Figure 2.1. Types of actor’s roles in a SECO
Software assets are artifacts produced/acquired and stored by an organization
(ADAMS & GOVEKAR, 2012). In the scope of this work, SECO assets (LIMA et al.,
2014) comprise SECO products, such as software assets (components, services, and
applications) and needs (demands or software requirements). A SECO platform can be
supported by a software asset library, responsible for managing the SECO’s lifecycle.
Software assets can be considered reusable assets. These reusable assets can be created
within the organization, brought from outside the organization or even from the SECO.
2.2.3. SECO Characterization
There are many ways to characterize a SECO. MANIKAS (2016) uses the
structure initially presented in (CHRISTENSEN et al., 2014) as starting point:
organizational, business, and software. Organizational structure reveals characteristics
of orchestration, distinguishing how to govern and arrange a SECO: Monarchy,
Federal, Collective, and Anarchy. Business structure explores value creation, similar to
how open a SECO is: Proprietary, Open Source, and Hybrid. Software structure is a
technical perspective as it refers to the variety of common technologies shared within a
SECO: Platform, Protocol, Standard, and Infrastructure.

12
BOSCH (2009b) suggests a taxonomy for SECO in two dimensions: platform
type (Desktop, Web, and Mobile) and platform category (Operating Systems,
Application, and End-user Programming) as shown in Table 2.2. This taxonomy is to
some extent difficult to use nowadays; for example, the same software may be
multiplatform working on web and mobile, e.g., Google services, or it may have a
version for each platform, e.g., Office Desktop, Office 360, and Office Mobile.
Bosch’s taxonomy was important since it defined frontiers for researching in
those specific SECO classes, although platforms are not so separate anymore; they are
still important concepts and give visibility to emerging SECO such as Mobile. At the
time it was proposed, there was no example that fitted the category Application in
Mobile platform, or End-user Programming in Mobile platform, according to BOSCH
(2009). Currently, MS Excel (previously categorized as Desktop and End-user
programming) has a mobile version as most of MS Office applications have.
Table 2.2. SECO Taxonomy. Source: (BOSCH, 2009)
Platform
Category Desktop Web Mobile
Operating
System
MS Windows,
Linux, iOS
Google AppEngine,
Yahoo Developer,
Coghead, Bungee Labs
Nokia S60, Palm,
Android, iPhone
Application MS Office SalesForce, eBay,
Amazon, Ning
None in 2009
End-User
Programing
MS Excel,
VHDL,
Mathematica
Google’s mashup editor
MS PopFly, Yahoo!
Pipes
None in 2009
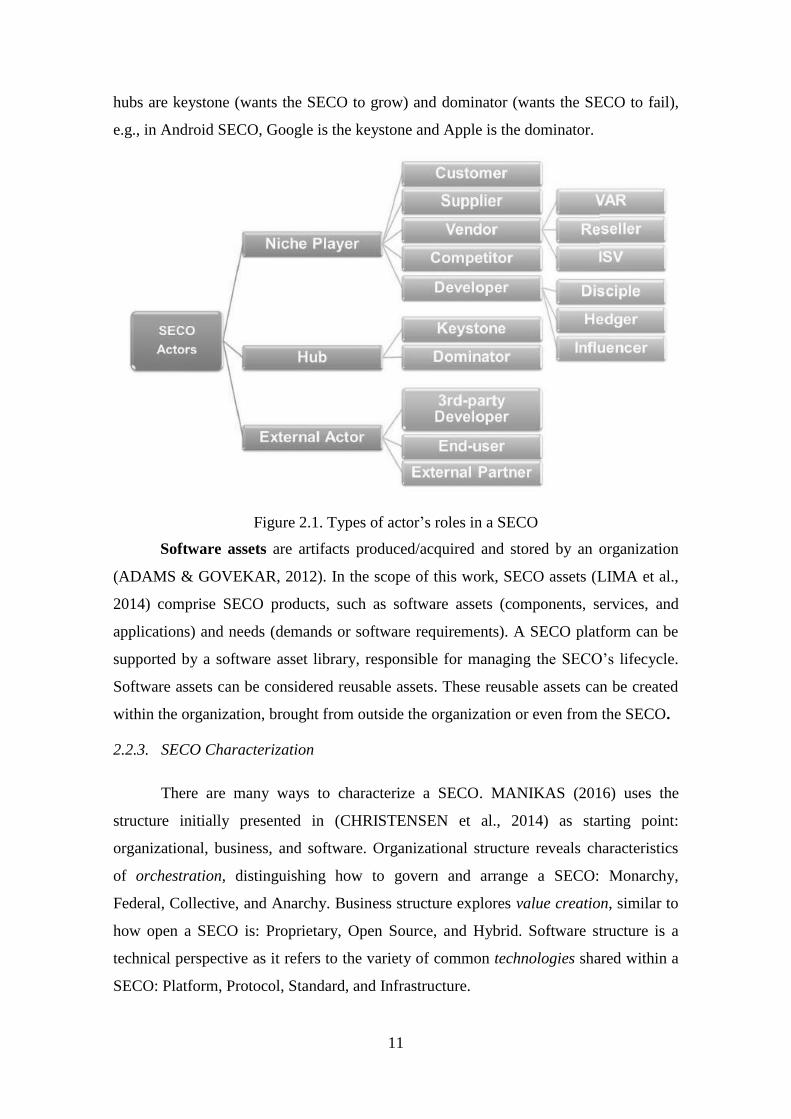
Another way to distinguish different SECO is through their dimensions as
described in ReuseECOS ‘3+1’ Framework (SANTOS & WERNER, 2012). This
framework comprises the following SECO dimensions: Technical, Business (or
Transactional), Social, and Engineering & Management, as shown in Figure 2.2. Those
dimensions are to some extent related to the main groups proposed by MANIKAS
(2016): Software Engineering, Business and Management, and Relationships.
The Technical Dimension represents concerns about SECO platform that
encompasses elements, such as a common market, common technological platform, and
13
technologies. From MANIKAS’s groups, Software Engineering is the closest one to the
Technical Dimension, since it covers software and its infrastructure (platform).
Figure 2.2. ReuseECOS ‘3+1’ Framework. Source: (SANTOS & WERNER, 2012)
The Social Dimension covers actors (people that somehow interact with the
SECO) and their relationships. This dimension is similar to the MANIKAS’ group
known as Relationships. It comprises the community and social network derived from
the set of interactions within a SECO.
The Transactional Dimension refers to knowledge and strategy and it is similar
to the MANIKAS’ group known as Business and Management (since organizational
elements are part of it). Engineering and Management Dimension comprises
interactions among other dimensions similarly to Business and Management group,
because both aim at monitoring a SECO.
Those SECO dimensions can be observed in several levels of development. A
SECO can be characterized by looking in which stage of lifecycle it is. Considering that
natural ecosystems background has inspired SECO concepts, a SECO also has
properties, such as health, sustainability, and diversity (DHUNGANA et al., 2010). A
healthy SECO can extend its lifecycle, keeping clients and consumers satisfied,
enhancing software quality, and keeping the community active.
SECO health is simply translated to how well it attracts new actors and artifacts,
although there are indications to specify this property. Sustainability is measured by the
ecosystem ability to maintain or expand its community (DHUNGANA et al., 2010).
Diversity grows according to how many different actors’ roles an ecosystem has. In the
ecosystem lifecycle, IANSITI & LEVIEN (2004) propose the following measures for
determining health: (1) robustness measures how the ecosystem recovers from
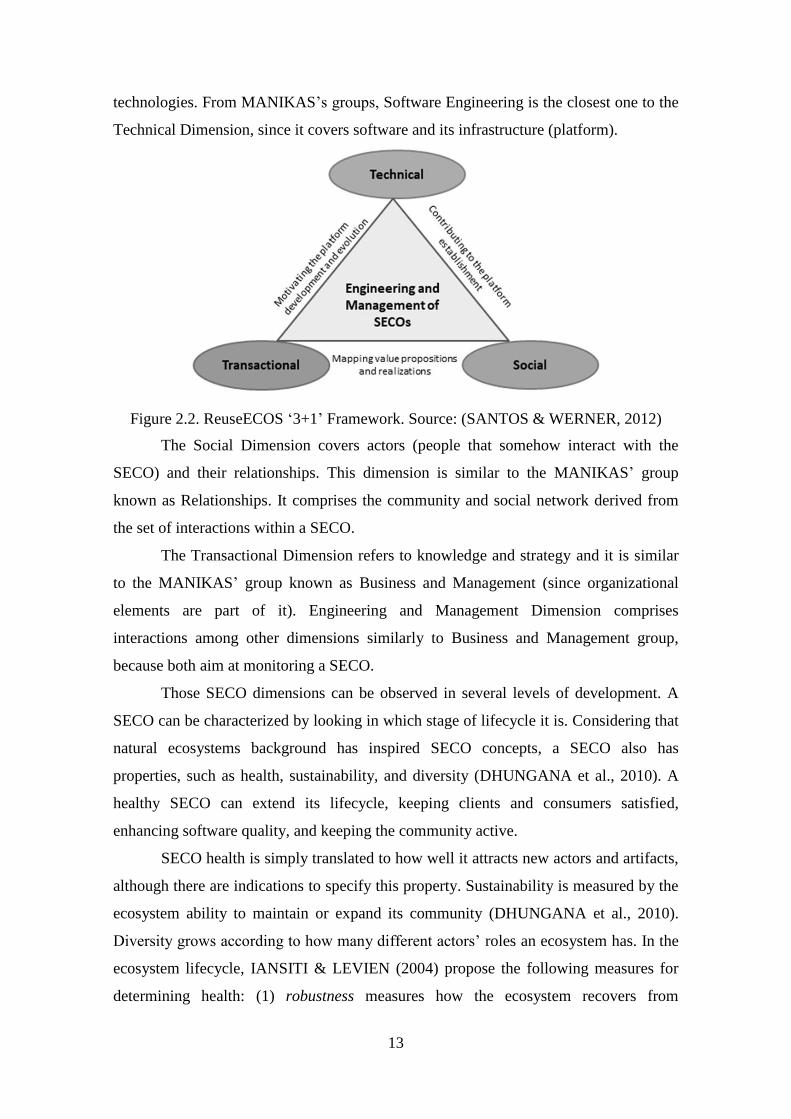
14
disturbances in its structure or network; (2) productivity measures the level of activity;
and (3) niche creation refers to the ability of creating opportunities for (new) members.
Robustness can be indicated by some characteristics such as number of non-
active projects or network connectivity before and after a disturbance. Productivity can
be measured by the amount of software products and services produced within the
SECO platform, or lines of code included or changed over a period. Niche creation can
be conveyed through the diversity of contributors and projects, i.e., number of different
roles and projects created within the ecosystem.
Figure 2.3. SECO Social Lifecycle. Source: (SANTOS et al., 2014)
Thus, a lifecycle model aids the understanding of how a SECO is formed and
grows together with its community development. To do so, SANTOS et al. (2014)
proposed a SECO lifecycle from the social network perspective based on four stages
(Figure 2.3): Initiation, Propagation, Amplification, and Termination. Such lifecycle
proposal covers different phases of a SECO over time according to its social network
and number of actor and artifacts. Such number tends to start low (initiation) and then
grow (propagation) until it reaches a maximum (end of amplification). Usually, it starts
decreasing (termination) towards the ecosystem death since the community stops
existing, or there is no condition to keep the ecosystem alive. It might happen because
the community lacks interest due to new platforms, keystone’s negligence to meet the
community’s demand, or strategic decision to not invest in the SECO any longer.

15
2.2.4. Modeling and Analysis
According to SEICHTER et al. (2010), communication and interaction among
actors happen from the artifacts they share. Because actors have a greater turnover than
artifacts in the ecosystem network, an identity is created for the artifact, transforming it
into a “first-class citizen” by exploiting the network extract that holds the target
information not contemplated before by ‘pure’ social networks. It is possible to map the
network that represents these relationships as investigated by the sociotechnical network
field (LIMA et al., 2015).
One way to map the SECO network is through the Product Deployment Context
(PDC) model, which was created to aid an organization to obtain a view of software
products and services’ architecture and dependencies (BOUCHARAS et al., 2009).
PDC shows the position and relationships of SECO elements in the network. In turn,
Software Supply Network (SSN) model comprises software, hardware, and services used
to meet an organization’s demands based on PDC concepts (BOUCHARAS et al.,
2009). Therefore, SSN can be used to model an organization’s SECO. Since we focus
on applications, hardware representation will not be used in this work (there is no
analysis that requires such SSN element). Based on SSN model, it is possible to analyze
technology exchange effect by exploring mapped relationships and traded products.
PDC elements are: Product, Product of Interest, Mediator, and Hardware
Product. SSN elements are (BOUCHARAS et al., 2009):
Company of Interest: This actor is unique in a model representation and
represents a central organization that owns the business model being
investigated;
Supplier: If an actor supplies at least one product or service to another actor,
it is considered a Supplier;
Customer: This actor uses or acquires the product or service;
Intermediary: This actor facilitates the trade between other actors, e.g.,
resellers;
Trade Relationship: The trade relationship is composed by at least one
product or service to be traded between actors;
Flow of Artifacts or Services between Actors; and
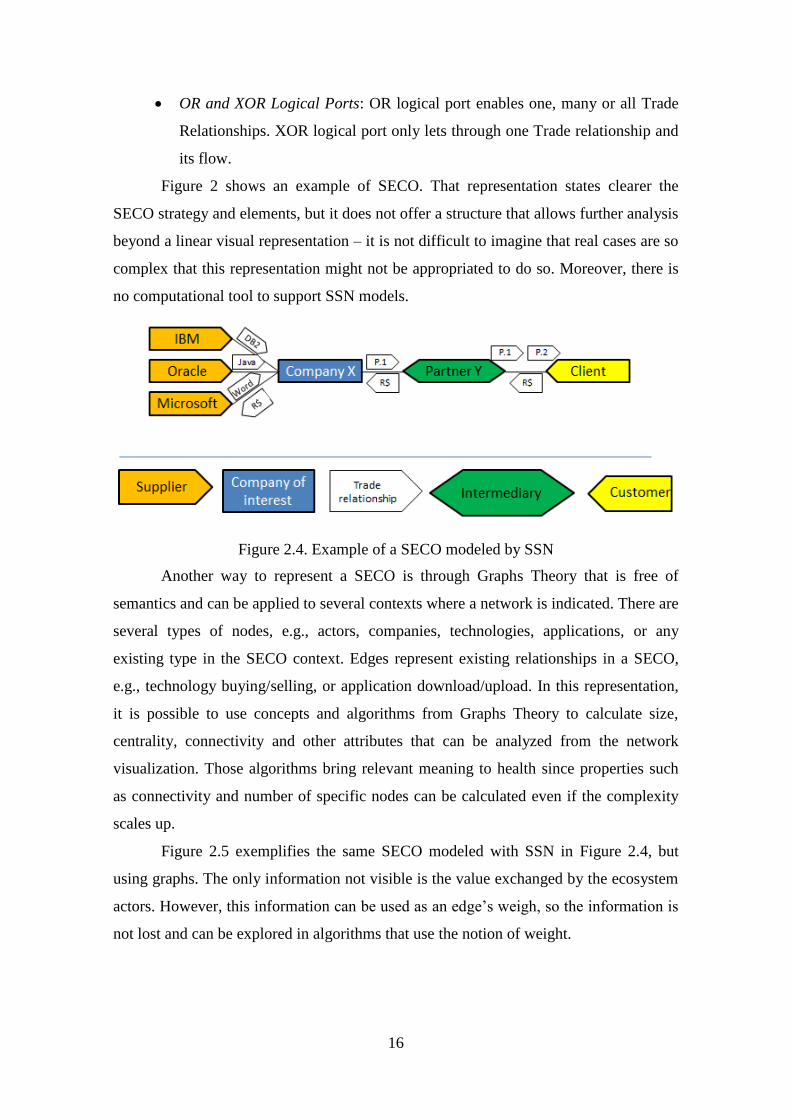
16
OR and XOR Logical Ports: OR logical port enables one, many or all Trade
Relationships. XOR logical port only lets through one Trade relationship and
its flow.
Figure 2 shows an example of SECO. That representation states clearer the
SECO strategy and elements, but it does not offer a structure that allows further analysis
beyond a linear visual representation – it is not difficult to imagine that real cases are so
complex that this representation might not be appropriated to do so. Moreover, there is
no computational tool to support SSN models.
Figure 2.4. Example of a SECO modeled by SSN
Another way to represent a SECO is through Graphs Theory that is free of
semantics and can be applied to several contexts where a network is indicated. There are
several types of nodes, e.g., actors, companies, technologies, applications, or any
existing type in the SECO context. Edges represent existing relationships in a SECO,
e.g., technology buying/selling, or application download/upload. In this representation,
it is possible to use concepts and algorithms from Graphs Theory to calculate size,
centrality, connectivity and other attributes that can be analyzed from the network
visualization. Those algorithms bring relevant meaning to health since properties such
as connectivity and number of specific nodes can be calculated even if the complexity
scales up.
Figure 2.5 exemplifies the same SECO modeled with SSN in Figure 2.4, but
using graphs. The only information not visible is the value exchanged by the ecosystem
actors. However, this information can be used as an edge’s weigh, so the information is
not lost and can be explored in algorithms that use the notion of weight.
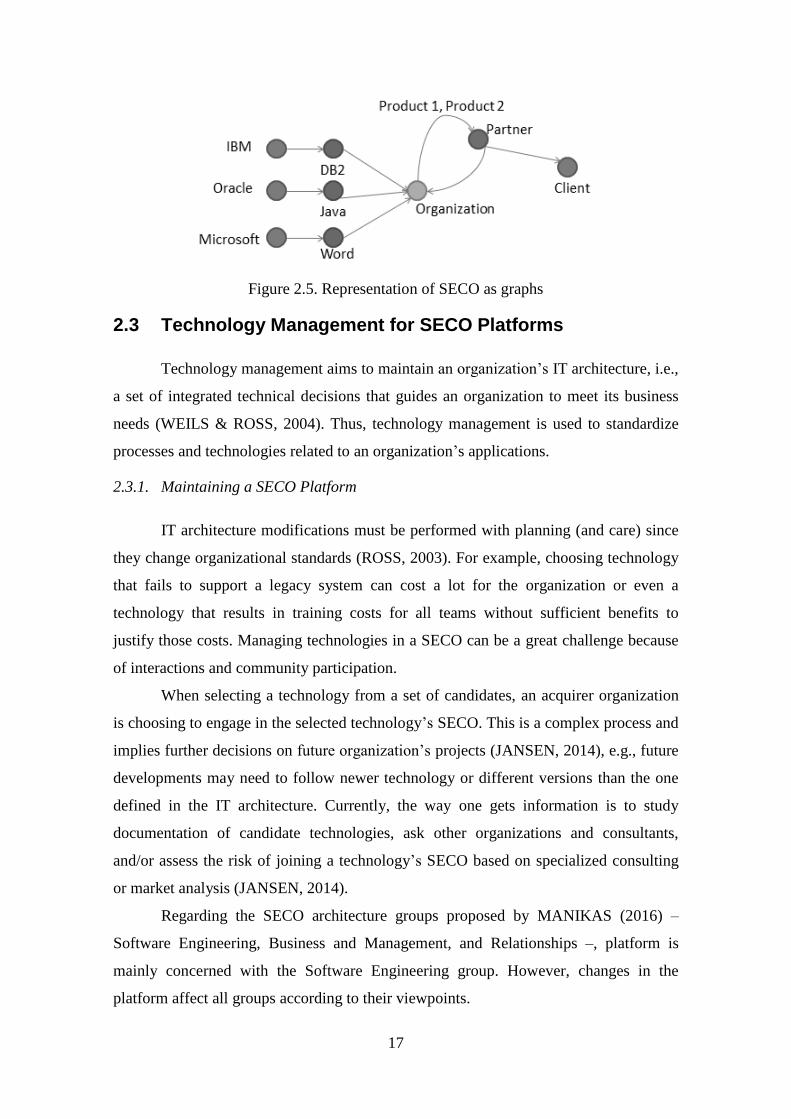
17
Figure 2.5. Representation of SECO as graphs
2.3 Technology Management for SECO Platforms
Technology management aims to maintain an organization’s IT architecture, i.e.,
a set of integrated technical decisions that guides an organization to meet its business
needs (WEILS & ROSS, 2004). Thus, technology management is used to standardize
processes and technologies related to an organization’s applications.
2.3.1. Maintaining a SECO Platform
IT architecture modifications must be performed with planning (and care) since
they change organizational standards (ROSS, 2003). For example, choosing technology
that fails to support a legacy system can cost a lot for the organization or even a
technology that results in training costs for all teams without sufficient benefits to
justify those costs. Managing technologies in a SECO can be a great challenge because
of interactions and community participation.
When selecting a technology from a set of candidates, an acquirer organization
is choosing to engage in the selected technology’s SECO. This is a complex process and
implies further decisions on future organization’s projects (JANSEN, 2014), e.g., future
developments may need to follow newer technology or different versions than the one
defined in the IT architecture. Currently, the way one gets information is to study
documentation of candidate technologies, ask other organizations and consultants,
and/or assess the risk of joining a technology’s SECO based on specialized consulting
or market analysis (JANSEN, 2014).
Regarding the SECO architecture groups proposed by MANIKAS (2016) –
Software Engineering, Business and Management, and Relationships –, platform is
mainly concerned with the Software Engineering group. However, changes in the
platform affect all groups according to their viewpoints.
18
2.3.2. The Role of Technologies in SECO
According to the SECO strategy and guidelines, it is possible to standardize
processes and technologies for software application development. As such, changing
technologies within the platform development must be carefully performed since such
action affects the organization’s standards. There are also organizational constraints that
may affect technology adoption or discontinuation (SHAFIA et al., 2015):
Organization policies and standards, e.g., encourage open source software or
national suppliers, or not accept certain types of proprietary licenses;
Legislation, e.g., especially in cases of public companies, a country’s
legislation may affect candidate technologies regarding taxation and
economic embargoes;
Economic issues, e.g., budget for the period and country’s economic
situation; and
Problems of organizational culture, e.g., aversion to paradigm shifts, rejection
of technologies that reuse external components, and rejection of certain
vendors.
Modifications in IT architecture involve adoption of a new technology, removal
of part of the architecture or technology replacement. Managing changes in such
architecture is not a trivial task, as they affect the development or acquisition of new
applications since technologies support SECO platform applications and infrastructure.
In addition, it may affect organizational teams regarding new technology development,
version change and license switching costs, or even applications that depend on
discontinued technologies.
Evaluating a technology in relation to pre-established, manageable and well-
structured data gives the process more transparency, as a list of criteria can be checked.
In (FREITAS & RECH, 2003), one of the most successful actions in companies is to
use well-defined procedure in IT acquisition. Part of the process definition is to define
criteria for evaluating candidate technologies (DURRANI et al., 1998).
Another factor that contributes to the problem of maintaining the IT architecture
is that the source of information used in assessing technologies is often informal and
internal to the organization, or consulting opinions that do not consider the communities
surrounding each technology (and its respective SECO). Such communities can
influence aspects, such as quality, support, maintenance, and continuity of technologies.

19
2.4 Technology Acquisition
Maintaining a SECO platform refers to operations of including or removing
technologies. When including a technology in a project, it may be possible to choose
from a technology owned by the organization or to acquire one from an external partner.
2.4.1. Traditional Acquisition Processes
Several organizations do not implement a process for acquisition. It might not be
necessary depending on the organization’s size, or it is necessary but it is performed
solely by an IT manager’s tacit knowledge so that the reason for acquisition decisions
becomes a tacit knowledge. Some organizations develop their own processes, others use
processes well established in the software industry, e.g., MPS model (based on ISO/IEC
and CMMI guides). MPS model defines a process for acquiring software and services.
There are six modalities of acquisitions (SOFTEX, 2013):
COTS (Commercial off-the-shelf): scope is defined;
MOTS (Modifiable off-the-shelf): software artifact can be partially modified;
FD (Full development): customized software on demand;
Open scope development services; and
Related services (maintenance, training, technical assistance, customization).
The process can be customized for each organization as long as they meet some
basic demands about defining a formal process. The process for acquiring software and
correlated services (S&SC) steps is represented in Figure 2.6 and includes four stages:
Acquisition preparation: this stage is responsible for establishing
acquisition requirements and objectives. If necessary, a market analysis and
consulting can be performed. Once it is ready, information is communicated
to possible suppliers. After executing requirements’ refinement based on
suppliers’ feedback, the acquirer should define the expected quality, selection
criteria, and acquisition strategy. This stage defines not only criteria for
selecting a supplier, but also for accepting a software product or service, as
well as some possible risks;
Supplier selection: a supplier is evaluated before its software product or
service. This evaluation comprises supplier capability, requirements
specification, and proposal itself. According to those elements, a list of
preferential suppliers is formed and the proposals they have sent are assessed
20
to choose one of them. Proposals present the technical solutions they offer as
well as supplier information. The organization evaluates a proposal by
examining: process, products, if they meet optional software requirements,
effort to acquisition, cost to make an acquisition viable, deadlines, and prices.
Once a supplier is chosen, a contract is negotiated;
Contract monitoring: the organization will monitor the supplier
performance according to the contract terms. If modifications are necessary,
an agreement between organization and supplier should be reached.
Problems, changes, performance, and communication are registered and
monitored; and
Client acceptance: deliverables are evaluated according to acceptance
criteria defined in this stage based on tests, acquisition plan from the first
stage, and contract requirements. If any conflict emerges, it should be firstly
resolved with the supplier before accepting and informing the result.
Public organizations have particularities and might not be flexible in elaborating
their own criteria. For example, the city hall in Rio de Janeiro follows an acquisition
process similar to MPS model2. The city hall’s IT department uses a well-defined
process for software acquisition and a repository of lessons learned. The stages are:
Contract planning: this stage addresses needs, requirements, acquisition
strategy, and supplier selection criteria. The strategies fall into four
categories: existing solution from partners, i.e., Government Off the-shelf
(GOTS); software ready and defined scope (COTS); software ready but
modifiable (MOTS); and develop the entire software (FD);
Supplier selection: this stage aims to evaluate suppliers’ capabilities, select
the supplier, and negotiate and prepare a contract;
Contract management: this stage aims to establish communication, revise
supplier performance, arrange alterations, and monitor problems; and
Client acceptance: this stage aims to prepare acceptance, evaluate the
product, review the contract, and accept it.
The organization also stores, maintains, and evolves acquisition projects and
artifacts whose process is influenced by legislation, regulations, and models.
2 http://prefeitura.rio/web/aquisicaodesoftware/ (In Portuguese).

21
Figure 2.6. MPS acquisition process. Source: (SOFTEX, 2013)
2.4.2. Technologies Acquisition Processes
A software acquisition process can be adapted to technology acquisition. This
research uses MPS acquisition process for software and services as a baseline.
According to the definition of activities in each stage of such process, no activity was
described particularly for software or services. Artifacts used in that process, e.g.,
requirements, test cases, and supplier information, are applied to technologies with little
(or no) loss. There are some different concerns regarding criteria and process type. As
technologies are supporting artifacts for applications, it is rare for an organization to
develop or modify technology programming; therefore, the type of technology
acquisition falls mostly under COTS or GOTS categories. Technologies to be inserted
into IT architecture will support organizational applications and become a standard. As
such, many dependencies will be created. It is necessary to be aware of compatibility
with other SECO platform’s applications. There might not be necessary to arrange
modifications, but there may be a need for configuration and extensibility.
2.4.3. Acquisition Process in the SECO Context
Software or technology acquisition process evaluates not only a product to be
acquired but also a supplier. Two SECO principles are relationship with external
players and supplier as a SECO actor. MPS model applies those principles throughout
22
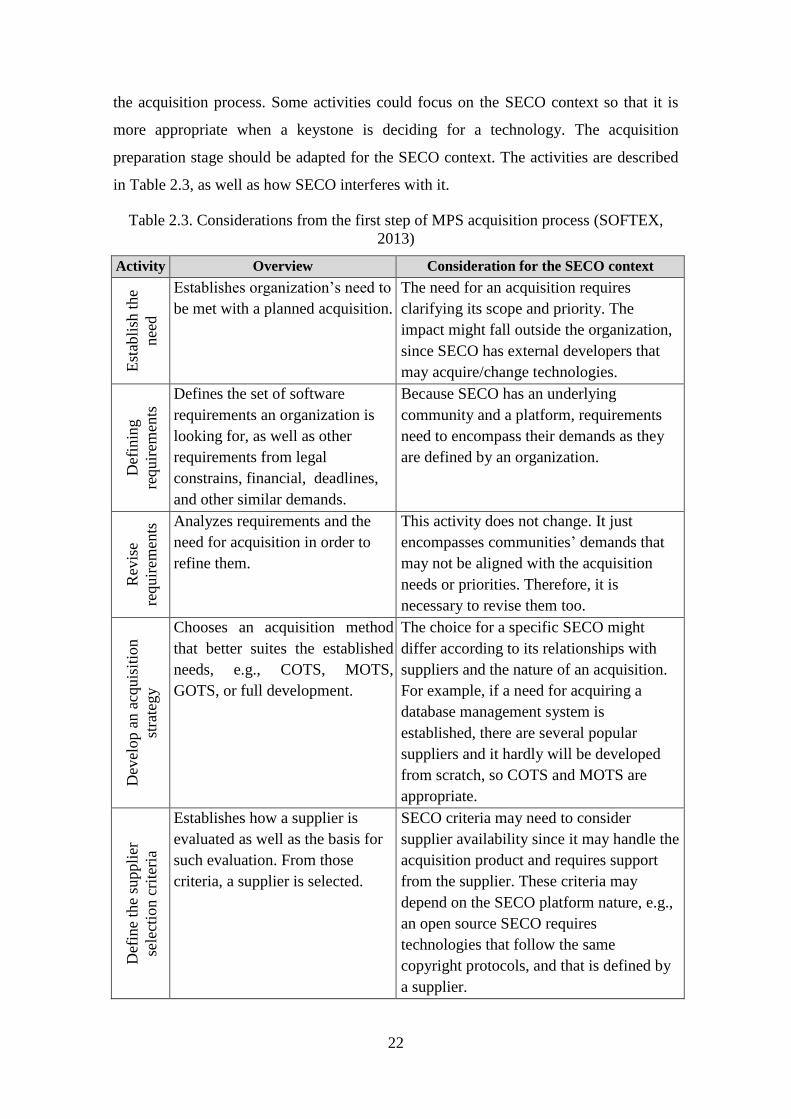
the acquisition process. Some activities could focus on the SECO context so that it is
more appropriate when a keystone is deciding for a technology. The acquisition
preparation stage should be adapted for the SECO context. The activities are described
in Table 2.3, as well as how SECO interferes with it.
Table 2.3. Considerations from the first step of MPS acquisition process (SOFTEX,
2013)
Activity Overview Consideration for the SECO context
Est
abli
sh t
he
nee
d
Establishes organization’s need to
be met with a planned acquisition.
The need for an acquisition requires
clarifying its scope and priority. The
impact might fall outside the organization,
since SECO has external developers that
may acquire/change technologies.
Def
inin
g
requir
emen
ts
Defines the set of software
requirements an organization is
looking for, as well as other
requirements from legal
constrains, financial, deadlines,
and other similar demands.
Because SECO has an underlying
community and a platform, requirements
need to encompass their demands as they
are defined by an organization.
Rev
ise
requir
emen
ts Analyzes requirements and the
need for acquisition in order to
refine them.
This activity does not change. It just
encompasses communities’ demands that
may not be aligned with the acquisition
needs or priorities. Therefore, it is
necessary to revise them too.
Dev
elop a
n a
cquis
itio
n
stra
tegy
Chooses an acquisition method
that better suites the established
needs, e.g., COTS, MOTS,
GOTS, or full development.
The choice for a specific SECO might
differ according to its relationships with
suppliers and the nature of an acquisition.
For example, if a need for acquiring a
database management system is
established, there are several popular
suppliers and it hardly will be developed
from scratch, so COTS and MOTS are
appropriate.
Def
ine
the
suppli
er
sele
ctio
n c
rite
ria
Establishes how a supplier is
evaluated as well as the basis for
such evaluation. From those
criteria, a supplier is selected.
SECO criteria may need to consider
supplier availability since it may handle the
acquisition product and requires support
from the supplier. These criteria may
depend on the SECO platform nature, e.g.,
an open source SECO requires
technologies that follow the same
copyright protocols, and that is defined by
a supplier.
23
2.5 Conclusion
By modifying the IT architecture, an organization also modifies its SECO based
on another SECO in which the technology supplier is inserted. This is not a trivial task
and requires information about candidate technologies (e.g., community, adherence,
quality etc.) as well as their SECO network that affect technology selection (e.g., teams
with knowledge in a candidate technology, government policies, restrictions, and
standards).
In addition, the SECO perspective brings information from external
relationships. This is important because supplier relationships, user community support,
and other factors from outside the organization can determine the success of technology
acquisition and adoption.
As presented in Section 2.2, SECO has a few different definitions but the main
elements are actors, artifacts, platform, and relationships. They are all explored when an
acquisition round is performed. SECO platform features bring more concerns for an
acquisition round since participation of external players in SECO is highly relevant.
Therefore, they have easier access to the platform and rely on it for their own projects.
(BOSCH, 2009).
Hence, when performing an acquisition round, maintaining IT architecture is a
relevant aspect since it changes the platform available for the organization and external
developers (SANTOS, 2016). From the keywords of 90 studies extracted in a literature
review on SECO (MANIKAS, 2016), architecture is the top keyword appearing in 49
studies, demonstrating the relevance of researching this perspective in SECO. Other
concepts related to this research made the top 25 keywords list as shown in Table 2.4.
From this study on the SECO literature, next chapter presents two exploratory
studies to explore SECO concepts. They reveal new resources that this research can use
to better explore SECO relationships in IT architecture maintenance. In addition, they
support this research by identifying information about artifacts that are not sufficient for
an acquiring organization in software negotiation and purchase processes. Those studies
use an infrastructure that organizes types of actors, artifacts, and SECO relationships.
Additionally, for the approach definition and studies that grounded its
conception (mapping study and survey with experts), it was fundamental to understand
what forms a SECO and how an organization maintains its SECO platform (another
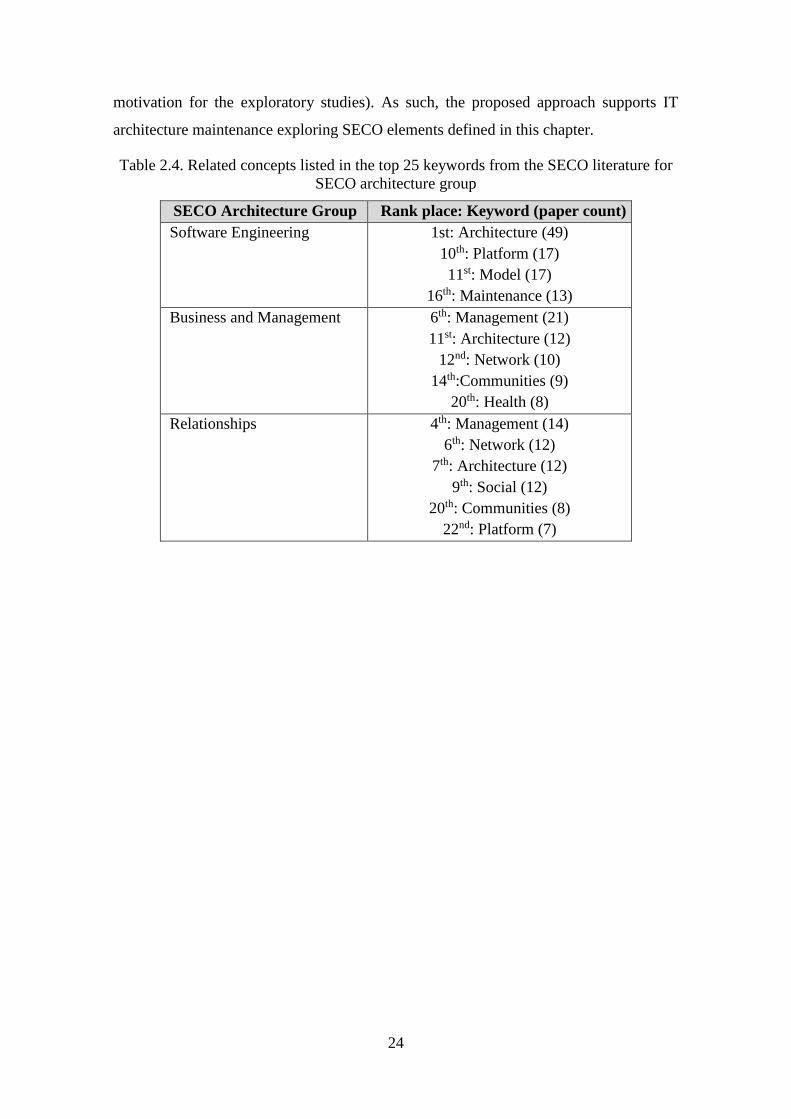
24
motivation for the exploratory studies). As such, the proposed approach supports IT
architecture maintenance exploring SECO elements defined in this chapter.
Table 2.4. Related concepts listed in the top 25 keywords from the SECO literature for
SECO architecture group
SECO Architecture Group Rank place: Keyword (paper count)
Software Engineering 1st: Architecture (49)
10th: Platform (17)
11st: Model (17)
16th: Maintenance (13)
Business and Management 6th: Management (21)
11st: Architecture (12)
12nd: Network (10)
14th:Communities (9)
20th: Health (8)
Relationships 4th: Management (14)
6th: Network (12)
7th: Architecture (12)
9th: Social (12)
20th: Communities (8)
22nd: Platform (7)

25
Chapter 3 – Exploratory Studies
In this chapter, two exploratory studies are discussed with the purpose of identifying
features to help us to reach the objectives proposed in Chapter 1 based on the context
described in Chapter 2. Those studies were published in academic conferences and
encompass observational studies to initially assess SECO concepts based on experts’
opinion. Therefore, lessons learned are explored to find features that benefit this
research. The sociotechnical resources used by the studies are part of the infrastructure
the proposed approach develops.
3.1 Introduction
As indicated in Section 1.4, the main objective of this research is to support
technology selection from a SECO platform. An acquisition process is used in most
organizations to acquire software application, component, service, or technology.
Negotiation with a supplier (or potential suppliers) that competes for an acquisition
contract is an inherent part of any acquisition process. As such, supporting negotiation
processes and learning from past negotiations can benefit an acquiring organization on
few stages of the acquisition process.
Some of the fundamental SECO elements are community and relationships with
external players as suppliers, market consultants, and users. When external players
interact with a platform and its artifacts, they participate in a network surrounding a
specific SECO. Such network is formed by social, technical, and sociotechnical
interactions. Negotiation is an interaction that involves different SECO actors and
technical artifacts.
A software repository supports some technical challenges since a technical
network is stored and accessible to SECO actors. Resources based on social networks
sites can assist the social side of a sociotechnical network. In (LIMA et al., 2016b), the
main types of actors, artifacts, and resources are studied from the literature and
executing a survey. However, concepts from social interaction analysis are not widely
employed in SECO (SANTOS & OLIVEIRA, 2013). In this regard, SEICHTER et al.
(2010) identified eight social network sites’ features: Profiles, Wall, News Feed, Data
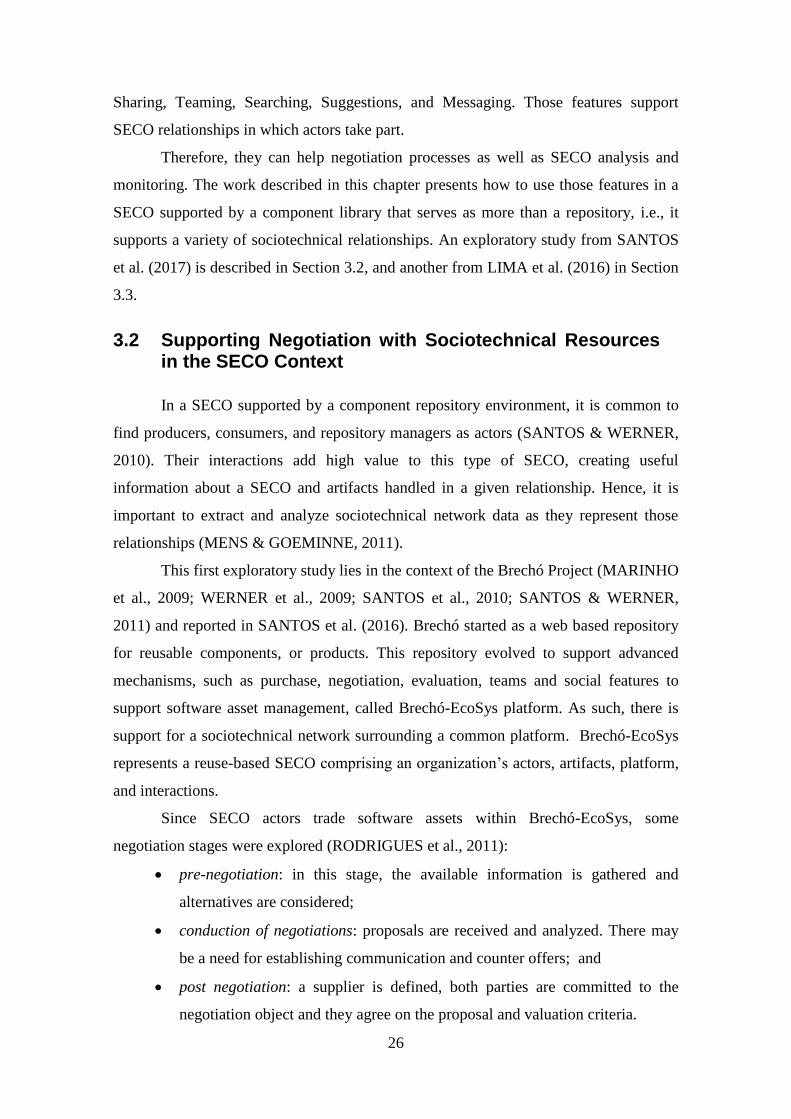
26
Sharing, Teaming, Searching, Suggestions, and Messaging. Those features support
SECO relationships in which actors take part.
Therefore, they can help negotiation processes as well as SECO analysis and
monitoring. The work described in this chapter presents how to use those features in a
SECO supported by a component library that serves as more than a repository, i.e., it
supports a variety of sociotechnical relationships. An exploratory study from SANTOS
et al. (2017) is described in Section 3.2, and another from LIMA et al. (2016) in Section
3.3.
3.2 Supporting Negotiation with Sociotechnical Resources in the SECO Context
In a SECO supported by a component repository environment, it is common to
find producers, consumers, and repository managers as actors (SANTOS & WERNER,
2010). Their interactions add high value to this type of SECO, creating useful
information about a SECO and artifacts handled in a given relationship. Hence, it is
important to extract and analyze sociotechnical network data as they represent those
relationships (MENS & GOEMINNE, 2011).
This first exploratory study lies in the context of the Brechó Project (MARINHO
et al., 2009; WERNER et al., 2009; SANTOS et al., 2010; SANTOS & WERNER,
2011) and reported in SANTOS et al. (2016). Brechó started as a web based repository
for reusable components, or products. This repository evolved to support advanced
mechanisms, such as purchase, negotiation, evaluation, teams and social features to
support software asset management, called Brechó-EcoSys platform. As such, there is
support for a sociotechnical network surrounding a common platform. Brechó-EcoSys
represents a reuse-based SECO comprising an organization’s actors, artifacts, platform,
and interactions.
Since SECO actors trade software assets within Brechó-EcoSys, some
negotiation stages were explored (RODRIGUES et al., 2011):
pre-negotiation: in this stage, the available information is gathered and
alternatives are considered;
conduction of negotiations: proposals are received and analyzed. There may
be a need for establishing communication and counter offers; and
post negotiation: a supplier is defined, both parties are committed to the
negotiation object and they agree on the proposal and valuation criteria.
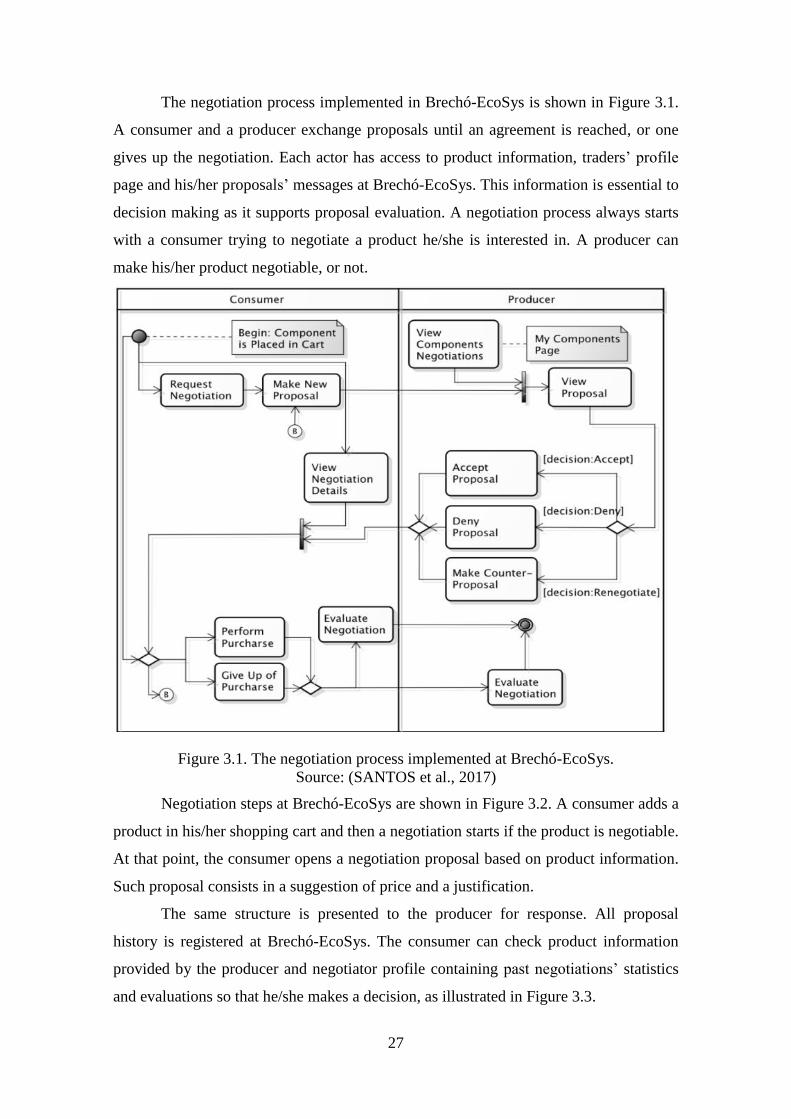
27
The negotiation process implemented in Brechó-EcoSys is shown in Figure 3.1.
A consumer and a producer exchange proposals until an agreement is reached, or one
gives up the negotiation. Each actor has access to product information, traders’ profile
page and his/her proposals’ messages at Brechó-EcoSys. This information is essential to
decision making as it supports proposal evaluation. A negotiation process always starts
with a consumer trying to negotiate a product he/she is interested in. A producer can
make his/her product negotiable, or not.
Figure 3.1. The negotiation process implemented at Brechó-EcoSys.
Source: (SANTOS et al., 2017)
Negotiation steps at Brechó-EcoSys are shown in Figure 3.2. A consumer adds a
product in his/her shopping cart and then a negotiation starts if the product is negotiable.
At that point, the consumer opens a negotiation proposal based on product information.
Such proposal consists in a suggestion of price and a justification.
The same structure is presented to the producer for response. All proposal
history is registered at Brechó-EcoSys. The consumer can check product information
provided by the producer and negotiator profile containing past negotiations’ statistics
and evaluations so that he/she makes a decision, as illustrated in Figure 3.3.
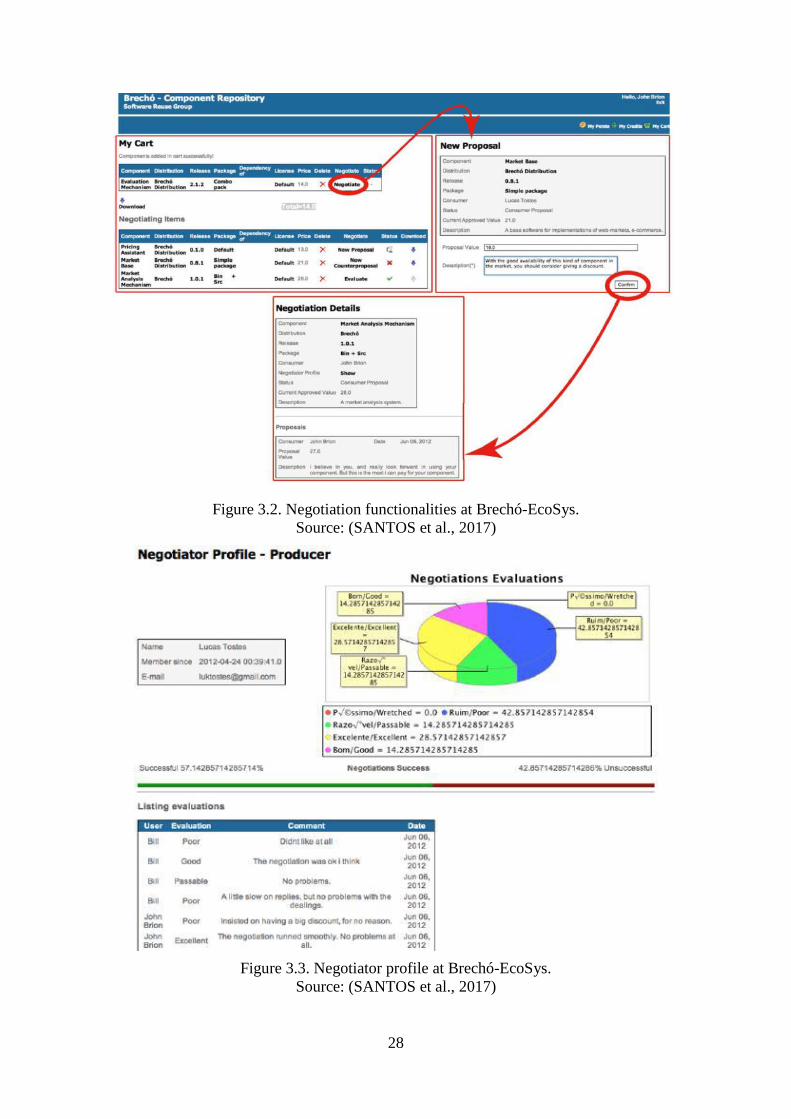
28
Figure 3.2. Negotiation functionalities at Brechó-EcoSys.
Source: (SANTOS et al., 2017)
Figure 3.3. Negotiator profile at Brechó-EcoSys.
Source: (SANTOS et al., 2017)

29
Based on Seichter et al.’s work on social networks in SECO (SEICHTER et al.,
2010), social resources were identified as features to be implemented at Brechó-EcoSys
aiming to aid consumers to have access to product information besides existing data
provided by producers. In addition, social resources consist in tools for organizations,
developers and users communication, as well as for information and community
opinions management.
Those resources are: profile, forums, requirements coordination support,
evaluation system, teams, tag clouds, and news feed (LIMA et al., 2015). Such Brechó-
EcoSys features can reveal SECO trends and useful discussions for negotiation
processes. All sociotechnical network resources implemented at Brechó-EcoSys are
available at “My Network” section, as shown in Figure 3.4. This, each actor sees a
different content at such section.
Figure 3.4. My Network Panel at Brechó-EcoSys. Source: (SANTOS et al., 2017)
“My Forums” resource lists the forums an actor takes part. Forums are open for
anyone’s participation and refer to an artifact or an organization’s team. An artifact’s
forum is managed by its producer, i.e., user, team or external developer.
A forum is structured in three sections: (i) Topics, used for general discussions,
e.g., user asking for help and reporting bugs. Each message can be evaluated by a forum
participant voting ‘positive’ or ‘negative’; (ii) Suggestions, where participants can
register any suggestion, e.g., new functionalities and new releases; and (iii)
Requirements, where a producer registers requirements for a product (visible for the
community) and external developers can provide solutions. Suggestions also can

30
become requirements if an organization’s manager (playing as a keystone) is able to
discover community demands. Producers and consumers can “follow” a requirement
from a product forum. They also have a panel for managing the requirements they are
responsible for, as well as the ones they follow. Thus, this resource supports a strategy
for requirements coordination.
Actors can create teams at Brechó-EcoSys to support development teams,
organization departments, and users groups. In this context, each team has one member
as a manager. Additionally, “My Profile” section informs the actor what roles he/she
performed within the SECO, i.e., producer, consumer, or user.
A proportion is calculated according to the actions an actor takes at Brechó-
EcoSys, e.g., publishing a product counts as producer, purchasing counts as consumer
etc. “Tag Cloud” resource mines the terms frequency from forums an actor takes part as
well as his/her teams’ descriptions, providing relevant trends according to the actor’s
interests within the ecosystem. The “Suggestion” resource encompasses repository
recommendations based on an actor’s forums and requirements he/she follows. “News
feed” resource shows SECO updates regarding information such as team actions,
product status, and new releases.
With the purpose of evaluating sociotechnical resources to support product
negotiation in the SECO context, a feasibility study was conducted. Participants
performed tasks at Brechó-EcoSys, playing as consumers and producers in some
negotiation scenarios supervised by researchers involved in this work. The hypothesis
was that introducing sociotechnical mechanisms on the negotiation process improves
the negotiator capabilities (both buyer and seller) in the SECO context. An electronic
form was elaborated with four sections: (1) Informed Consent; (2) Characterization; (3)
Task Execution; and (4) Evaluation. Seven participants completed the study on
November 3rd and 4th, 2016. Several Brechó-EcoSys resources were used, but this
study focused on tag cloud and forum support, since they provide information new to
the platform linking technical aspect (software artifacts) and social aspect (user
participating in the forum and their interests represented by the tag cloud).
From seven participants, four said that the use of forums helps a negotiation
process, one said ‘partially’, and two answered ‘no’. The same answers were obtained
for the use of tag cloud in a negotiation process. Participants were asked to list their
insights on the negotiation process based on the Brechó-EcoSys platform. Some
participants left suggestions for improvements, as for example:
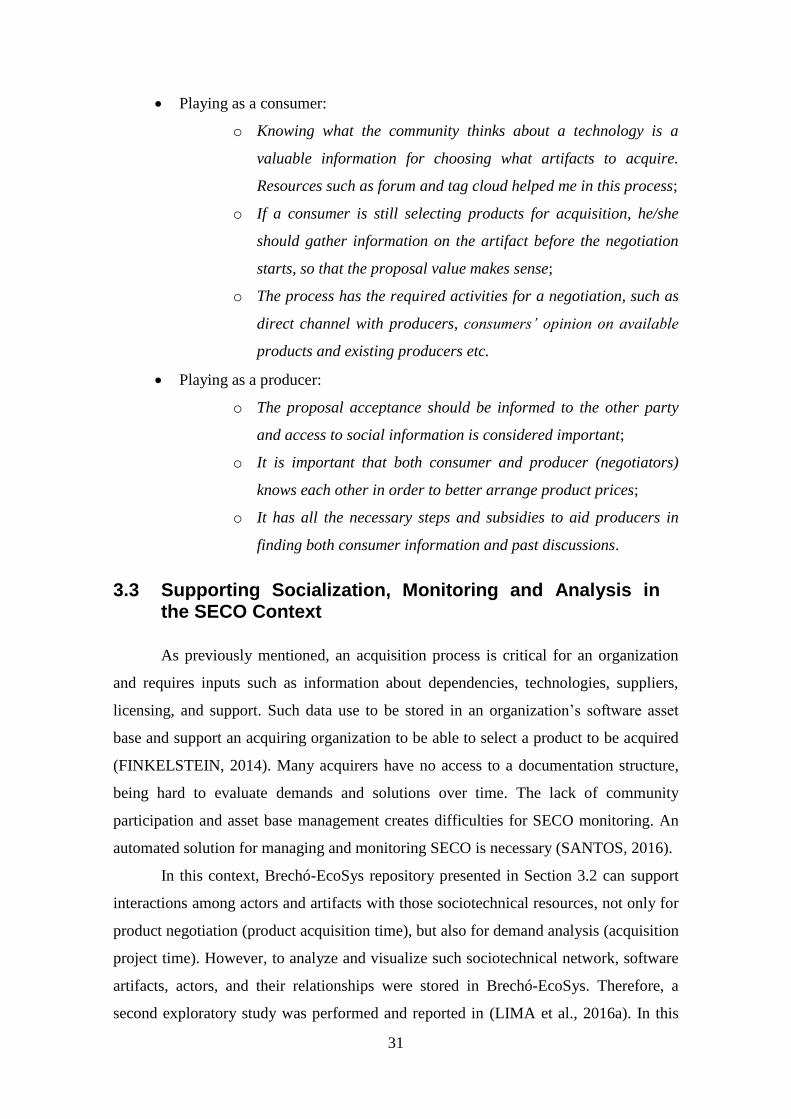
31
Playing as a consumer:
o Knowing what the community thinks about a technology is a
valuable information for choosing what artifacts to acquire.
Resources such as forum and tag cloud helped me in this process;
o If a consumer is still selecting products for acquisition, he/she
should gather information on the artifact before the negotiation
starts, so that the proposal value makes sense;
o The process has the required activities for a negotiation, such as
direct channel with producers, consumers’ opinion on available
products and existing producers etc.
Playing as a producer:
o The proposal acceptance should be informed to the other party
and access to social information is considered important;
o It is important that both consumer and producer (negotiators)
knows each other in order to better arrange product prices;
o It has all the necessary steps and subsidies to aid producers in
finding both consumer information and past discussions.
3.3 Supporting Socialization, Monitoring and Analysis in the SECO Context
As previously mentioned, an acquisition process is critical for an organization
and requires inputs such as information about dependencies, technologies, suppliers,
licensing, and support. Such data use to be stored in an organization’s software asset
base and support an acquiring organization to be able to select a product to be acquired
(FINKELSTEIN, 2014). Many acquirers have no access to a documentation structure,
being hard to evaluate demands and solutions over time. The lack of community
participation and asset base management creates difficulties for SECO monitoring. An
automated solution for managing and monitoring SECO is necessary (SANTOS, 2016).
In this context, Brechó-EcoSys repository presented in Section 3.2 can support
interactions among actors and artifacts with those sociotechnical resources, not only for
product negotiation (product acquisition time), but also for demand analysis (acquisition
project time). However, to analyze and visualize such sociotechnical network, software
artifacts, actors, and their relationships were stored in Brechó-EcoSys. Therefore, a
second exploratory study was performed and reported in (LIMA et al., 2016a). In this

32
context, data were exported to a network analysis and visualization tool implemented as
a Gephi3 plug-in. As such, measurements on sociotechnical networks can be calculated
to aid SECO monitoring regarding demand and solution analysis. This process is shown
in Figure 3.5.
Figure 3.5. Brechó-EcoSys extension for sociotechnical network analysis and
visualization. Source: (LIMA et al., 2016a)
“Forum” resource was evolved to register demands and community discussions
regarding an artifact. “Tag Cloud” resource displays the most frequent terms in the
SECO. In this case, it may be used to provide an overview of community discussion
topics. Moreover, to support demand and solution analysis, SECO elements registered
at Brechó-EcoSys are:
application (APP): all applications an organization uses must be registered
and are identified as APP, e.g., SAP and ERP systems;
technologies (TEC): all technologies that support an organization’s APP’s,
e.g., programming languages and database management systems;
demands (DEM): a demand is a need of at least an organization’s department;
candidate solutions (CAN APP): all applications that are being considered to
the acquisition, i.e., all candidates for a specific demand; and
business objectives (OBJ): all business objectives the organization uses to
reach its strategy according to its business model.
In addition, there are relationships, such as dependencies (between applications),
supporting (between technologies and applications), and satisfaction (between business
objectives and applications). In a given moment, a SECO comprises applications,
objectives and technologies (AS-IS). In this context, a demand analysis support
implemented at Gephi simulates the effect of considering a new acquisition idea that
meets organizational objectives and requires evolving organizational applications
3 The Open Graph Viz Platform. Available at https://gephi.org/
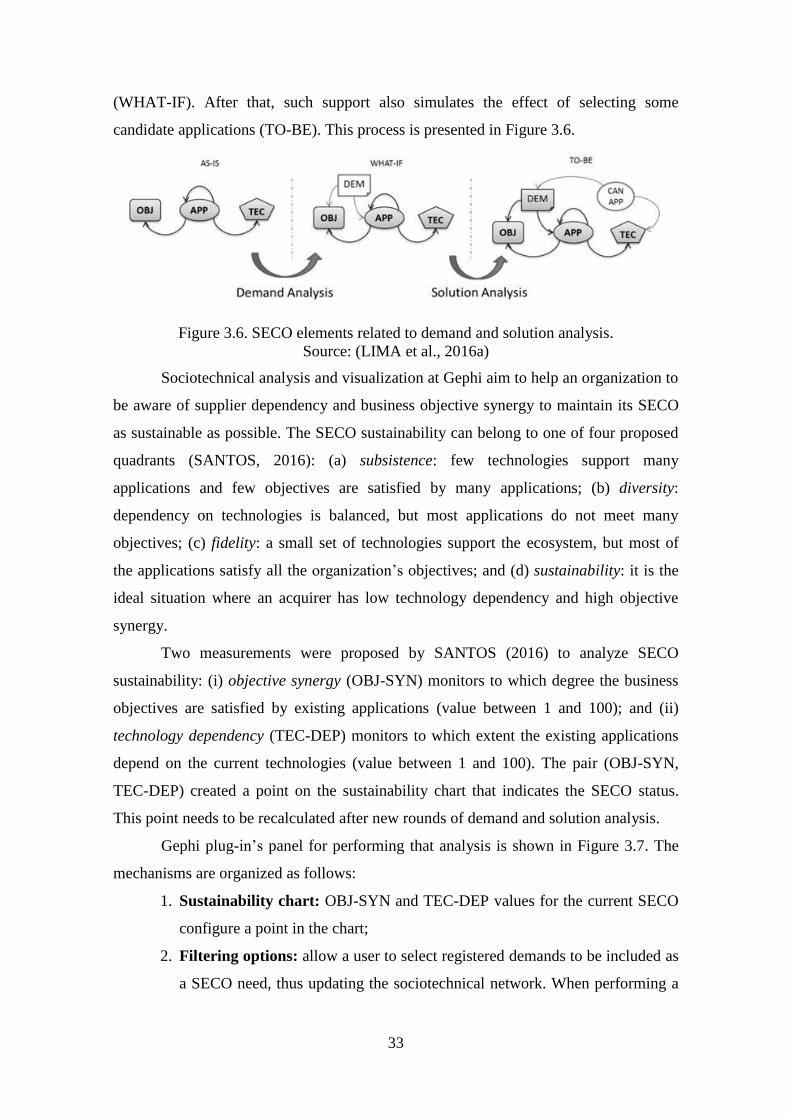
33
(WHAT-IF). After that, such support also simulates the effect of selecting some
candidate applications (TO-BE). This process is presented in Figure 3.6.
Figure 3.6. SECO elements related to demand and solution analysis.
Source: (LIMA et al., 2016a)
Sociotechnical analysis and visualization at Gephi aim to help an organization to
be aware of supplier dependency and business objective synergy to maintain its SECO
as sustainable as possible. The SECO sustainability can belong to one of four proposed
quadrants (SANTOS, 2016): (a) subsistence: few technologies support many
applications and few objectives are satisfied by many applications; (b) diversity:
dependency on technologies is balanced, but most applications do not meet many
objectives; (c) fidelity: a small set of technologies support the ecosystem, but most of
the applications satisfy all the organization’s objectives; and (d) sustainability: it is the
ideal situation where an acquirer has low technology dependency and high objective
synergy.
Two measurements were proposed by SANTOS (2016) to analyze SECO
sustainability: (i) objective synergy (OBJ-SYN) monitors to which degree the business
objectives are satisfied by existing applications (value between 1 and 100); and (ii)
technology dependency (TEC-DEP) monitors to which extent the existing applications
depend on the current technologies (value between 1 and 100). The pair (OBJ-SYN,
TEC-DEP) created a point on the sustainability chart that indicates the SECO status.
This point needs to be recalculated after new rounds of demand and solution analysis.
Gephi plug-in’s panel for performing that analysis is shown in Figure 3.7. The
mechanisms are organized as follows:
1. Sustainability chart: OBJ-SYN and TEC-DEP values for the current SECO
configure a point in the chart;
2. Filtering options: allow a user to select registered demands to be included as
a SECO need, thus updating the sociotechnical network. When performing a

34
solution analysis, each selected demand enables its candidate solutions and
the sociotechnical network is also updated with the chosen solutions;
3. Node colors: explain what color represents each type of node according to
the SECO elements;
4. Instructions and actions buttons: present steps to calculate a sustainability
point (using functions from (7));
5. Chart information: shows information on the previous and current charts;
6. Network visualization: is a native Gephi’s panel and shows a graph built
from the sociotechnical network extracted from software asset base registered
at Brechó-EcoSys. This graph is updated after demand and solution selection;
and
7. Graph algorithm: is a native module and makes graphs algorithms available.
In order to evaluate SECO monitoring resources to support demand and solution
analysis in the SECO context, a feasibility study was conducted. Participants performed
tasks at Brechó-EcoSys playing as IT managers and architects in some acquisition
scenarios supervised by researchers involved in this work. Some tasks were performed,
simulating demand selection and then solution selection for each selected demand. After
that, participants filled a feedback questionnaire. The study’s main question was: Are
participants able to realize the impact of SECO monitoring in the software acquirer’s
IT management activities for demand and solution analysis, regarding effectiveness and
efficiency?. Five practitioners participated in this study in June, 2016.
Participants’ feedback was analyzed and the following findings were
summarized from this study:
“What were the biggest difficulties in performing the proposed tasks?”:
difficulties in performing steps involved in Part 4 of the plug-in’s panel;
difficulty in visualizing some data since points were too close in Part 1 of the
plug-in’s panel; and difficulties to find the list of team’s members;
“If you are missing resources, please write here”: storing SECO network
graphs’ historical series in order to allow us to evaluate different
combinations; and automatic comparison of different SECO configurations
(scenarios);
“In your opinion, what are the most useful resources?”: sustainability chart
visualization and simulations of selection’s combinations; forum’s structure
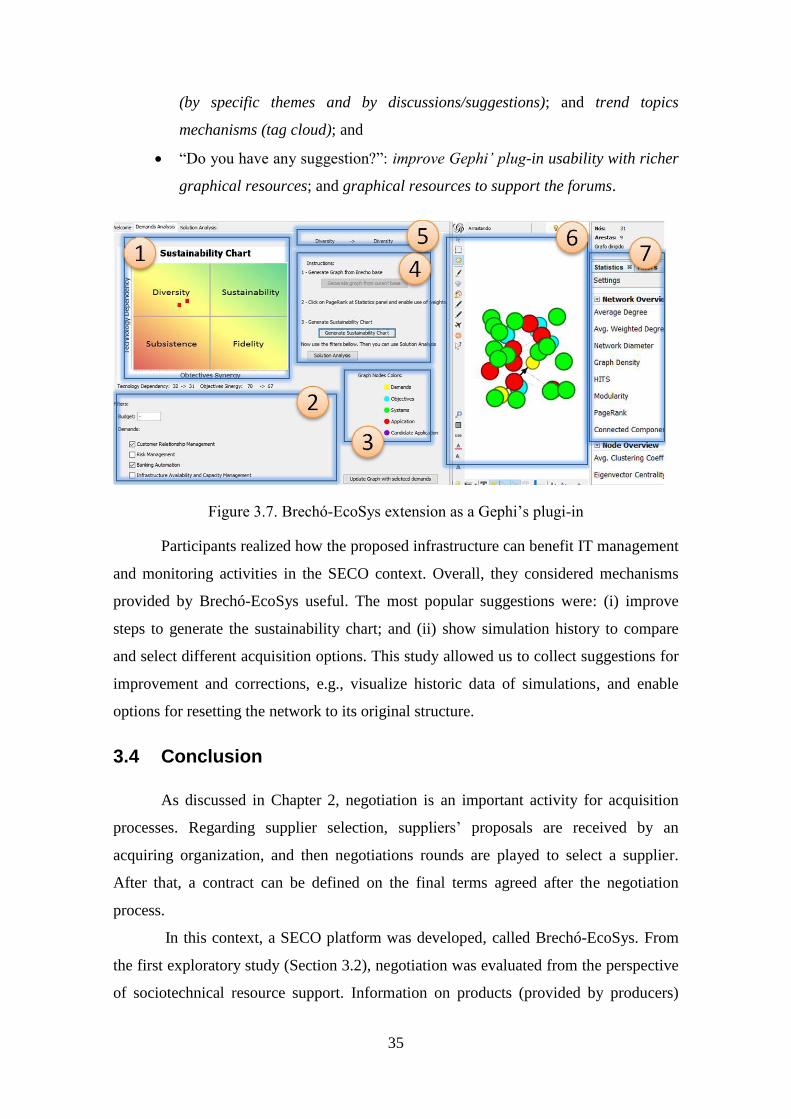
35
(by specific themes and by discussions/suggestions); and trend topics
mechanisms (tag cloud); and
“Do you have any suggestion?”: improve Gephi’ plug-in usability with richer
graphical resources; and graphical resources to support the forums.
Figure 3.7. Brechó-EcoSys extension as a Gephi’s plugi-in
Participants realized how the proposed infrastructure can benefit IT management
and monitoring activities in the SECO context. Overall, they considered mechanisms
provided by Brechó-EcoSys useful. The most popular suggestions were: (i) improve
steps to generate the sustainability chart; and (ii) show simulation history to compare
and select different acquisition options. This study allowed us to collect suggestions for
improvement and corrections, e.g., visualize historic data of simulations, and enable
options for resetting the network to its original structure.
3.4 Conclusion
As discussed in Chapter 2, negotiation is an important activity for acquisition
processes. Regarding supplier selection, suppliers’ proposals are received by an
acquiring organization, and then negotiations rounds are played to select a supplier.
After that, a contract can be defined on the final terms agreed after the negotiation
process.
In this context, a SECO platform was developed, called Brechó-EcoSys. From
the first exploratory study (Section 3.2), negotiation was evaluated from the perspective
of sociotechnical resource support. Information on products (provided by producers)

36
and actors (negotiator profiles) were explored at Brechó-EcoSys. In the SECO context,
it is important to hear the community’s opinion so that the ecosystem can be alive. In
turn, from the second exploratory study (Section 3.3), ecosystem monitoring was
evaluated with sociotechnical network analysis and visualization. In the SECO context,
different demand and solution selections can affect the acquisition process.
Both exploratory studies reinforce benefits of sociotechnical network analysis to
make decisions in the SECO context. From the studies described in this chapter, the
following considerations were summarized to this research:
Acquisition encompasses negotiation and can be benefited from the use of
forums, requirement information, communities suggestions and discussions,
tag clouds, and negotiator profiles;
Information on the SECO community, negotiators, and SECO trends are
useful in negotiation activities (social perspective). In turn, different
relationships among SECO elements are considered in monitoring activities
(business perspective), including demands and business objectives. However,
we observed a lack of architecture criteria to compare candidate solutions for
acquisition (technical perspective). Those criteria and a sustainability chart
can be used as acceptance criteria defined in the acquisition processes;
Sociotechnical network can represent a SECO and its elements can be used to
support demands and solutions analysis (and then acquisition);
Data visualization was a concern in both studies. It helps an acquiring
organization to be aware of what is going on in negotiations, and shows
tendencies calculated from a SECO monitoring support. Important network
properties, such as hubs, density, and connectivity, were not available to
acquirers in the existing SECO tool support;
As a negotiation process ends with no (or one) chosen supplier, SECO
monitoring can be performed over time to narrow down suppliers and
candidate solutions (before negotiation rounds). Hence, a negotiation can start
with the best potential suppliers. They may not be the best suppliers, but they
are the most appropriated for the SECO particularities since they are mapped
in the network; and
An acquisition process starts with requirements definition and refinement.
This is supported by suggestions and requirements in existing forums.
37
Suggestions can modify/change to requirements based on community needs;
so far, it was centralized in an acquiring organization (SECO keystone).
The infrastructure offered by Brechó-EcoSys is used in this research since it
provides sociotechnical resources and SECO monitoring that benefit acquisition
processes. Additionally, SECO is structured at Brechó-EcoSys to support different types
of actors and relationships involved in an acquisition. In order to identify criteria used
for acquisition in the SECO context, a mapping study was conducted to find quality
attributes related to SECO platform and architecture as described in the next chapter.
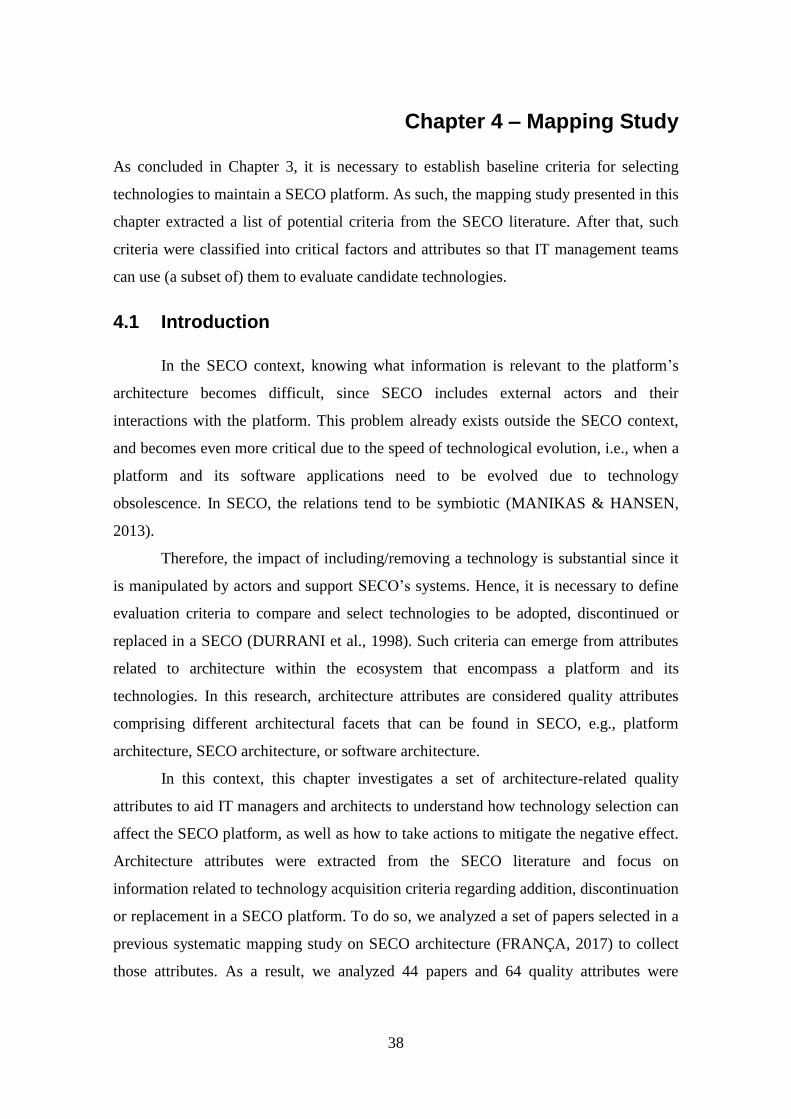
38
Chapter 4 – Mapping Study
As concluded in Chapter 3, it is necessary to establish baseline criteria for selecting
technologies to maintain a SECO platform. As such, the mapping study presented in this
chapter extracted a list of potential criteria from the SECO literature. After that, such
criteria were classified into critical factors and attributes so that IT management teams
can use (a subset of) them to evaluate candidate technologies.
4.1 Introduction
In the SECO context, knowing what information is relevant to the platform’s
architecture becomes difficult, since SECO includes external actors and their
interactions with the platform. This problem already exists outside the SECO context,
and becomes even more critical due to the speed of technological evolution, i.e., when a
platform and its software applications need to be evolved due to technology
obsolescence. In SECO, the relations tend to be symbiotic (MANIKAS & HANSEN,
2013).
Therefore, the impact of including/removing a technology is substantial since it
is manipulated by actors and support SECO’s systems. Hence, it is necessary to define
evaluation criteria to compare and select technologies to be adopted, discontinued or
replaced in a SECO (DURRANI et al., 1998). Such criteria can emerge from attributes
related to architecture within the ecosystem that encompass a platform and its
technologies. In this research, architecture attributes are considered quality attributes
comprising different architectural facets that can be found in SECO, e.g., platform
architecture, SECO architecture, or software architecture.
In this context, this chapter investigates a set of architecture-related quality
attributes to aid IT managers and architects to understand how technology selection can
affect the SECO platform, as well as how to take actions to mitigate the negative effect.
Architecture attributes were extracted from the SECO literature and focus on
information related to technology acquisition criteria regarding addition, discontinuation
or replacement in a SECO platform. To do so, we analyzed a set of papers selected in a
previous systematic mapping study on SECO architecture (FRANÇA, 2017) to collect
those attributes. As a result, we analyzed 44 papers and 64 quality attributes were

39
identified and classified into 11 critical factors. In this case, critical factors are macro
attributes that encompass other specific attributes.
This work serves as an initial basis to aid IT managers and architects to
understand how their choices regarding technology acquisition can affect a SECO
platform, as well as the actions to diminish harmful effects. Moreover, with the
intention of comparing this research to a well-accepted related work, ISO/IEC 25000
(2014) characteristics were analyzed against the critical factors, looking for similarities
and non-explored attributes that can reveal a new context to be considered.
Section 4.2 describes how the mapping study was planned. Section 4.3 presents
the execution and initial data obtained, the complete data resulting from the study's
execution is presented at Section 4.4. A better discussion of the results, and what they
mean to the research, is explained at Section 4.4. Section 4.5 concludes the chapter with
the final considerations.
4.1.1. The Previous Mapping Study
The researcher responsible for this Master thesis participated in a previous
mapping study conducted by four researchers from the Systems Engineering and
Computer Science Program at COPPE/UFRJ (FRANÇA, 2017): a Master student and a
PhD student; both supervised by the same two PhD researchers. This mapping study
primarily investigated how scientific literature studies software architecture in the
SECO context, e.g., key characteristics, research needs, and reference architectures. The
search string covers title, abstract and keyword with the terms “software ecosystem”
and “software architecture” (and their plural variations). The search string was:
(“software architecture” OR “software architectures”) AND
(“software ecosystem” OR “software ecosystems”)
For each search engine, the search string was adapted according to the machine
syntax rules, but maintaining the terms and logical operators. For the automatic
execution, a search string was run on the Scopus, Springer, IEEE, ACM, and Science
Direct search engines in February 2016 without executing snowballing.
This first mapping study grounded the study presented in this chapter. In
addition, accepted papers and search strings were reused as starting point for the
mapping studied to serve as a corpus for the extraction of architecture-related quality
attributes for technology selection in SECO.

40
4.2 Planning
The goal of the mapping study is to investigate architecture-related quality
attributes for technology selection in SECO. The main motivation is to aid IT managers
and architects to understand how to compare and evaluate technologies that sustain a
SECO platform. Critical factors are macro attributes that encompass other attributes that
affect a SECO platform and its technologies. The following research questions (RQ)
help addressing this study’s goals:
RQ1. What are the architecture-related quality attributes that describe or
qualify software ecosystems and their platform regarding the architecture perspective?
RQ2. How do the architecture-related quality attributes relate to each other?
The activities planned for this study are illustrated in Figure 4.1. The set of
studies was obtained after executing the mapping study (Step 1). Then, the full reading
allowed us to extract the attributes and also track the source papers (Step 2), as well as
identify relations among attributes described in the selected papers and other possible
associations (Step 3). From such relations, it was possible to group the attributes based
on similarities, level of abstraction, or interactions reported at the papers (Step 4).
Finally, we analyzed the possible effects those attributes could have on a SECO
platform (Step 5).
This mapping study followed the same procedure of the previous study
described in Section 4.1.1. Thus, the search string was the same and it was run again at
the same search engines, but it considered the publishing year of 2016 since the
previous study only partially covered this year.
The study was conducted by a Master student and supervised by two PhD
students. There was not a specific term to be searched for, i.e., studies were scavenged
for any term that characterized a SECO as well as its architecture or platform,
considering that all the included studies have discussed SECO/architecture.
As inclusion criteria, the studies must meet the following requirements:
The studies must present a discussion about SECO, its elements and
architecture, regardless of which element of the SECO they focused on;
The studies must not be a result of the previous mapping on Section 4.1.1 in
order to avoid duplicated;
The studies must be written in English or Portuguese; and
The studies must be available online.
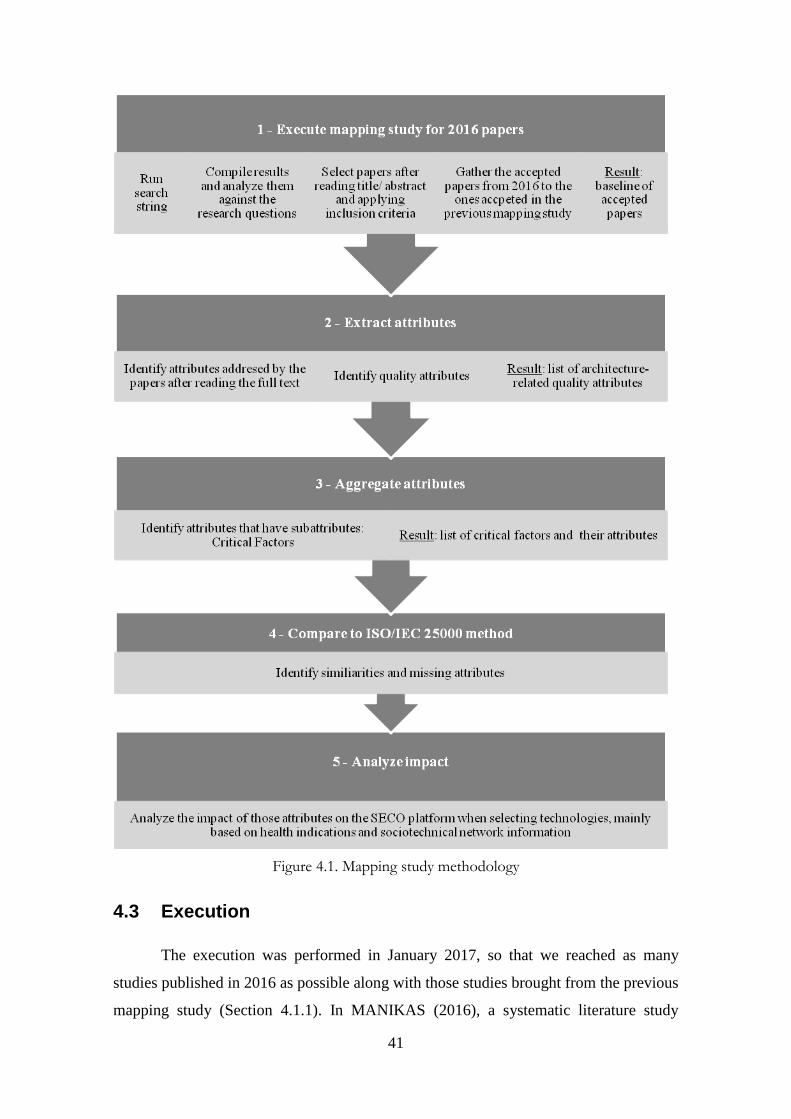
41
Figure 4.1. Mapping study methodology
4.3 Execution
The execution was performed in January 2017, so that we reached as many
studies published in 2016 as possible along with those studies brought from the previous
mapping study (Section 4.1.1). In MANIKAS (2016), a systematic literature study
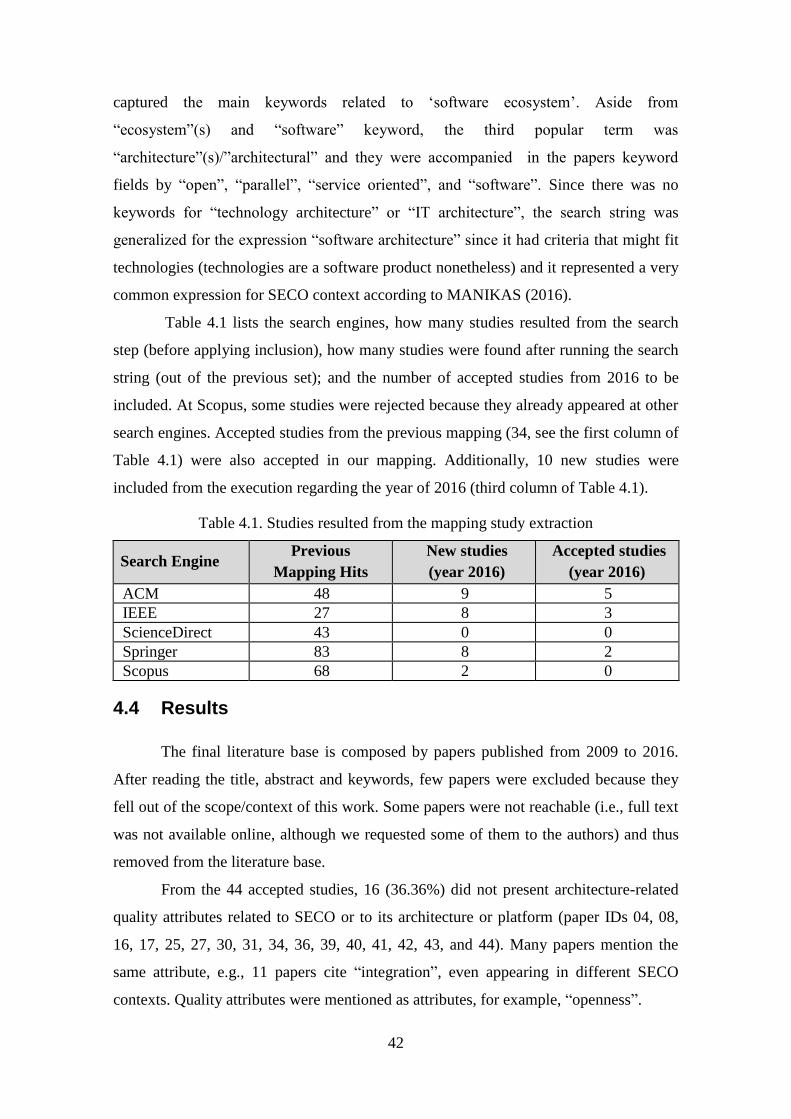
42
captured the main keywords related to ‘software ecosystem’. Aside from
“ecosystem”(s) and “software” keyword, the third popular term was
“architecture”(s)/”architectural” and they were accompanied in the papers keyword
fields by “open”, “parallel”, “service oriented”, and “software”. Since there was no
keywords for “technology architecture” or “IT architecture”, the search string was
generalized for the expression “software architecture” since it had criteria that might fit
technologies (technologies are a software product nonetheless) and it represented a very
common expression for SECO context according to MANIKAS (2016).
Table 4.1 lists the search engines, how many studies resulted from the search
step (before applying inclusion), how many studies were found after running the search
string (out of the previous set); and the number of accepted studies from 2016 to be
included. At Scopus, some studies were rejected because they already appeared at other
search engines. Accepted studies from the previous mapping (34, see the first column of
Table 4.1) were also accepted in our mapping. Additionally, 10 new studies were
included from the execution regarding the year of 2016 (third column of Table 4.1).
Table 4.1. Studies resulted from the mapping study extraction
Search Engine Previous
Mapping Hits
New studies
(year 2016)
Accepted studies
(year 2016)
ACM 48 9 5
IEEE 27 8 3
ScienceDirect 43 0 0
Springer 83 8 2
Scopus 68 2 0
4.4 Results
The final literature base is composed by papers published from 2009 to 2016.
After reading the title, abstract and keywords, few papers were excluded because they
fell out of the scope/context of this work. Some papers were not reachable (i.e., full text
was not available online, although we requested some of them to the authors) and thus
removed from the literature base.
From the 44 accepted studies, 16 (36.36%) did not present architecture-related
quality attributes related to SECO or to its architecture or platform (paper IDs 04, 08,
16, 17, 25, 27, 30, 31, 34, 36, 39, 40, 41, 42, 43, and 44). Many papers mention the
same attribute, e.g., 11 papers cite “integration”, even appearing in different SECO
contexts. Quality attributes were mentioned as attributes, for example, “openness”.
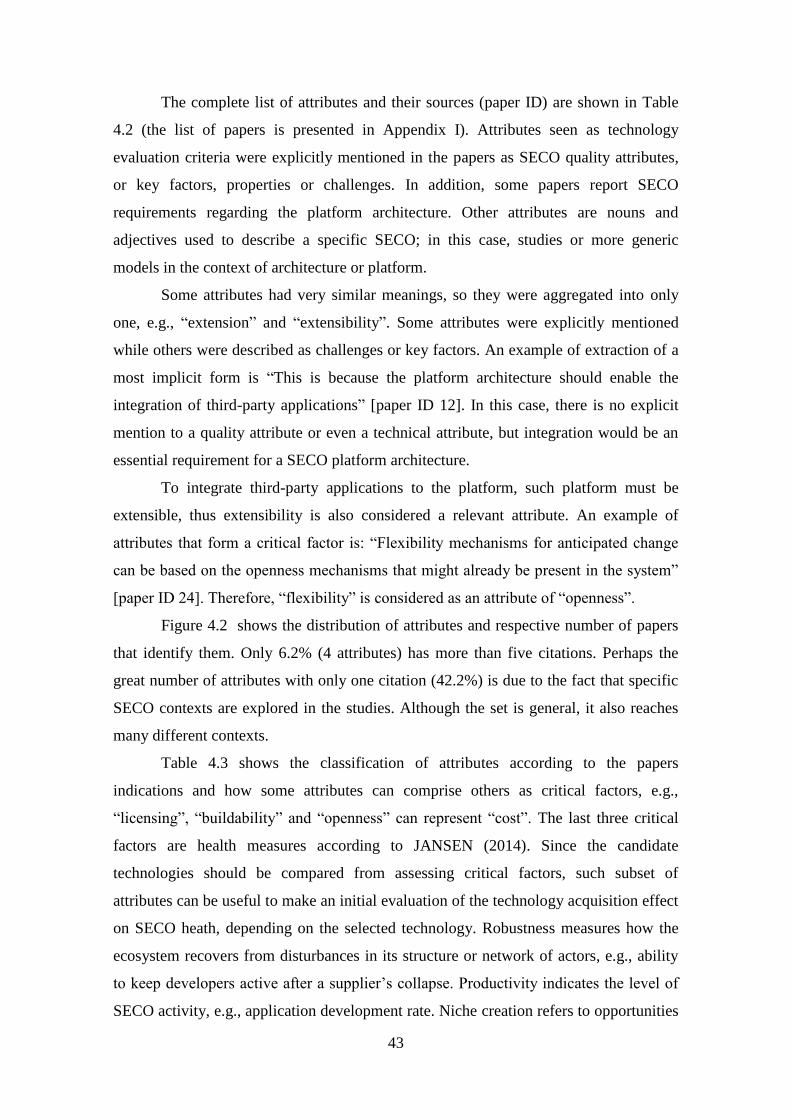
43
The complete list of attributes and their sources (paper ID) are shown in Table
4.2 (the list of papers is presented in Appendix I). Attributes seen as technology
evaluation criteria were explicitly mentioned in the papers as SECO quality attributes,
or key factors, properties or challenges. In addition, some papers report SECO
requirements regarding the platform architecture. Other attributes are nouns and
adjectives used to describe a specific SECO; in this case, studies or more generic
models in the context of architecture or platform.
Some attributes had very similar meanings, so they were aggregated into only
one, e.g., “extension” and “extensibility”. Some attributes were explicitly mentioned
while others were described as challenges or key factors. An example of extraction of a
most implicit form is “This is because the platform architecture should enable the
integration of third-party applications” [paper ID 12]. In this case, there is no explicit
mention to a quality attribute or even a technical attribute, but integration would be an
essential requirement for a SECO platform architecture.
To integrate third-party applications to the platform, such platform must be
extensible, thus extensibility is also considered a relevant attribute. An example of
attributes that form a critical factor is: “Flexibility mechanisms for anticipated change
can be based on the openness mechanisms that might already be present in the system”
[paper ID 24]. Therefore, “flexibility” is considered as an attribute of “openness”.
Figure 4.2 shows the distribution of attributes and respective number of papers
that identify them. Only 6.2% (4 attributes) has more than five citations. Perhaps the
great number of attributes with only one citation (42.2%) is due to the fact that specific
SECO contexts are explored in the studies. Although the set is general, it also reaches
many different contexts.
Table 4.3 shows the classification of attributes according to the papers
indications and how some attributes can comprise others as critical factors, e.g.,
“licensing”, “buildability” and “openness” can represent “cost”. The last three critical
factors are health measures according to JANSEN (2014). Since the candidate
technologies should be compared from assessing critical factors, such subset of
attributes can be useful to make an initial evaluation of the technology acquisition effect
on SECO heath, depending on the selected technology. Robustness measures how the
ecosystem recovers from disturbances in its structure or network of actors, e.g., ability
to keep developers active after a supplier’s collapse. Productivity indicates the level of
SECO activity, e.g., application development rate. Niche creation refers to opportunities
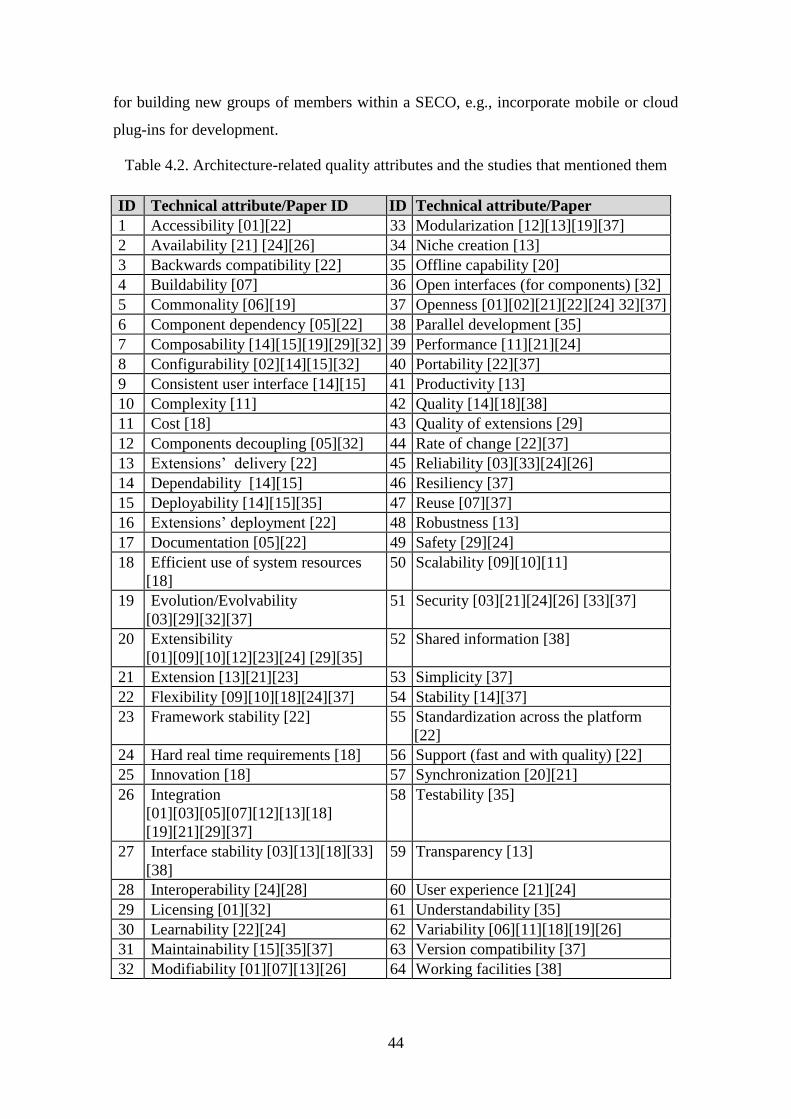
44
for building new groups of members within a SECO, e.g., incorporate mobile or cloud
plug-ins for development.
Table 4.2. Architecture-related quality attributes and the studies that mentioned them
ID Technical attribute/Paper ID ID Technical attribute/Paper
1 Accessibility [01][22] 33 Modularization [12][13][19][37]
2 Availability [21] [24][26] 34 Niche creation [13]
3 Backwards compatibility [22] 35 Offline capability [20]
4 Buildability [07] 36 Open interfaces (for components) [32]
5 Commonality [06][19] 37 Openness [01][02][21][22][24] 32][37]
6 Component dependency [05][22] 38 Parallel development [35]
7 Composability [14][15][19][29][32] 39 Performance [11][21][24]
8 Configurability [02][14][15][32] 40 Portability [22][37]
9 Consistent user interface [14][15] 41 Productivity [13]
10 Complexity [11] 42 Quality [14][18][38]
11 Cost [18] 43 Quality of extensions [29]
12 Components decoupling [05][32] 44 Rate of change [22][37]
13 Extensions’ delivery [22] 45 Reliability [03][33][24][26]
14 Dependability [14][15] 46 Resiliency [37]
15 Deployability [14][15][35] 47 Reuse [07][37]
16 Extensions’ deployment [22] 48 Robustness [13]
17 Documentation [05][22] 49 Safety [29][24]
18 Efficient use of system resources
[18]
50 Scalability [09][10][11]
19 Evolution/Evolvability
[03][29][32][37]
51 Security [03][21][24][26] [33][37]
20 Extensibility
[01][09][10][12][23][24] [29][35]
52 Shared information [38]
21 Extension [13][21][23] 53 Simplicity [37]
22 Flexibility [09][10][18][24][37] 54 Stability [14][37]
23 Framework stability [22] 55 Standardization across the platform
[22]
24 Hard real time requirements [18] 56 Support (fast and with quality) [22]
25 Innovation [18] 57 Synchronization [20][21]
26 Integration
[01][03][05][07][12][13][18]
[19][21][29][37]
58 Testability [35]
27 Interface stability [03][13][18][33]
[38]
59 Transparency [13]
28 Interoperability [24][28] 60 User experience [21][24]
29 Licensing [01][32] 61 Understandability [35]
30 Learnability [22][24] 62 Variability [06][11][18][19][26]
31 Maintainability [15][35][37] 63 Version compatibility [37]
32 Modifiability [01][07][13][26] 64 Working facilities [38]

45
Figure 4.2. Number of citations for each attribute
46
Table 4.3. Mapping study results organized as critical factors and attributes
Critical Factor Attributes
CF1 - Configurability
Commonality Variability
CF2 - Cost
Buildability Licensing Openness
CF3 - Extension
Buildability
Extensions’ delivery
Extensibility
Extensions’ deployment
Modifiability
Standardization across
the platform
CF4 - Openness
Accessibility Availability Flexibility
Licensing Performance Reliability
Safety Security
Synchronization User experience
CF5 - Quality
Certification Efficient use of resources
Hard real time
requirements Quality of extensions
Testability
CF6 - Reuse
Composability Components decoupling
Cost
Dependability
Extensibility Integration
Modularization Open interface (for
components) Transparency
Understandability
CF7 - Scalability
Complexity Extensibility
Interoperability Performance
CF8 - Stability
Framework stability Interface stability
Rate of change Parallel development
CF9 - Support
Documentation Shared information
CF10 - User experience
Accessibility Consistent user interface Documentation Simplicity
CF11 - Version compatibility
Backwards compatibility Maintainability Portability
CF12 - Niche creation
Innovation Work facilities
CF13 - Robustness
Availability Offline capability Resilience Stability
CF14 - Productivity
Extensions’ delivery Deployability Learnability

47
4.5 Analysis
The extraction resulted in 64 architecture-related quality attributes. After
analyzing the attributes’ association, we observed that “quality” is connected to
“certification”. Thus, certification was considered as an attribute, too. Some results
easily derive metrics, e.g., “dependability”: possible metrics are number of function
parameters, and number of external APIs necessary for building an application. Other
attributes are more subjective and require a deeper analysis where different levels can
be recognized, e.g., “rate of change”: what is a high, low or steady rate of change? What
is the baseline?
The more generic attributes (bold font in the row above quality attributes in
Table 4.3) are critical factors. They help technology assessment as they represent
categories of criteria for comparing candidate technologies. Attributes associated with
critical factors (subsequent rows in Table 4.3) can be perceived as different perspectives
to assess a factor.
Some associations can repeat for different factors, e.g., “availability” is
associated to “openness”, since an open source application architecture might be more
available than a proprietary one with restricted licenses; at the same time, it is
associated to how robust a SECO can be. Those associations were directly extracted
from the papers, or assigned by the researcher according to critical factors and
attributes’ definition in the papers. An association happens in cases when an attribute
definition includes another one, then the attribute becomes a critical factor related to the
attribute contained in the definition, even if both are not explicitly linked as key factors,
challenges, or another similar relationship.
It might not be necessary to use the whole list of attributes, since a specific
organizational context might differ from others’, i.e., one may require only a subset of
attributes that applies to the SECO platform technologies. In that case, it is useful to
create scenarios that determine a minimum subset of attributes. Organizational context
requires different assessments, e.g., a government department must assess “cost” and
“quality” rather than platform “openness”; on the other hand, a multinational company
might need “scalability” rather than “version compatibility”.
For step 5 of the methodology presented in Figure 4.1, it is important to evaluate
the technology effect on attributes related to SECO health. As such, health is a property
that reflects how well a SECO is (MANIKAS, 2016). Maintaining the SECO platform

48
affects software use and development. Health measurements may offer an indication of
the ecosystem status and allow ecosystem comparison (MANIKAS, 2016). In addition,
health can support decisions related to making corrections and improvements over the
platform architecture (MANIKAS & HANSEN, 2013).
Health measures for SECO are shown in Table 4.4. JANSEN (2014) defines
indications for the health measures in Open Source Ecosystem (OSE) and they overlap
attributes’ associations, bringing some new possible metrics. Three levels are described:
theory, network, and project. For evaluating a SECO technology, network level
becomes more appropriate because it considers organization, interactions and projects.
Table 4.4 lists network level metrics with possible association with critical
factors in the third column. Many ecosystems reveal statistics and information on their
projects usage/downloads and documentation. Therefore, the metrics may be applicable
for proprietary and closed platforms too. The impact of a technology entering or leaving
a SECO can be assessed by comparing health indications before and after technology
selection. Furthermore, network metrics that affect some critical factors may be a
comparison element, e.g., the speed of a SECO network topology change may indicate
lack of “stability”; network connectivity around a new technology may refer to “niche
creation”.
Table 4.4. Critical factors versus SECO health indications
Health Indicator Metrics from (JANSEN, 2014) Related Attribute
Productivity
(1) New related projects
(2) Downloads (new projects)
(3) New knowledge about ecosystem
(4) Events
-
-
(3) Support
(4) User experience
Robustness
(5) Number of active projects
(6) Project connectedness/Cohesion
(7) Core network consistency
(8) Outbound links to other SECO
(9) Switching costs to other ecosystem
-
-
(7) Stability
-
(9) Cost
Niche creation (10) Variety in projects -
With the set of critical factors and attributes, it is possible to compare
technologies based on properties studied in the SECO literature. Depending on the
SECO context or type, the whole set of criteria might not be necessary. Therefore, an
acquiring organization can decide what information is available or relevant. Critical
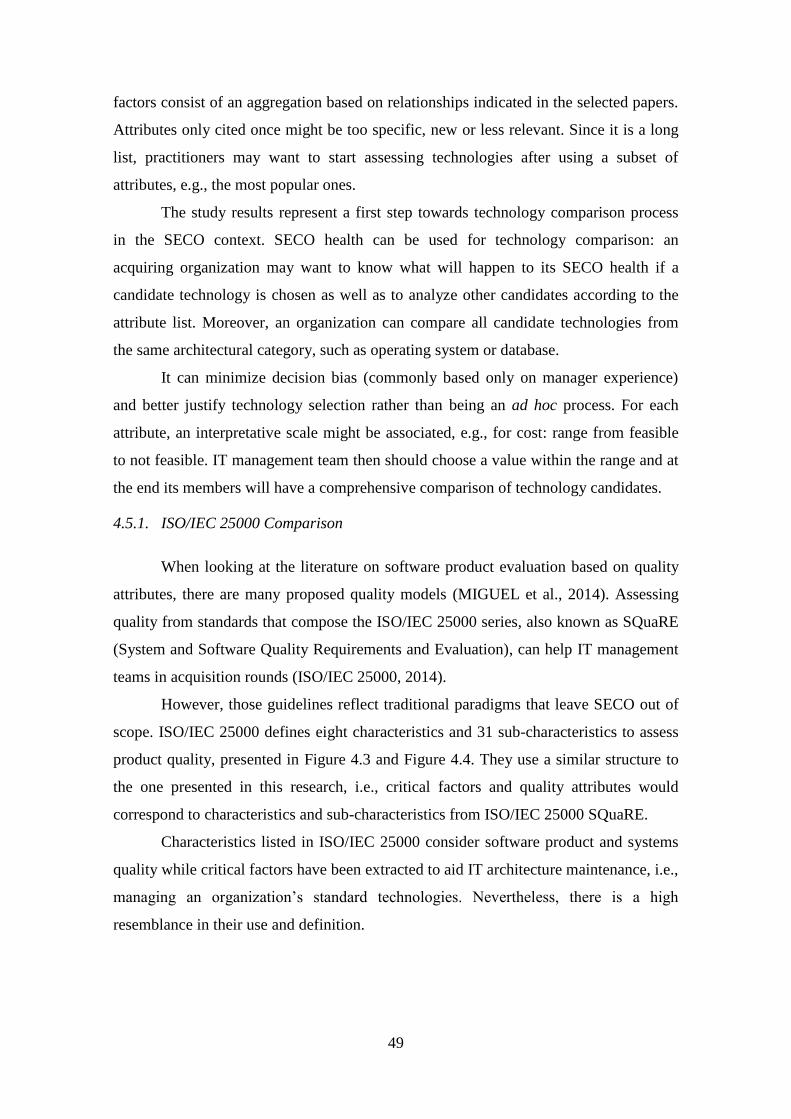
49
factors consist of an aggregation based on relationships indicated in the selected papers.
Attributes only cited once might be too specific, new or less relevant. Since it is a long
list, practitioners may want to start assessing technologies after using a subset of
attributes, e.g., the most popular ones.
The study results represent a first step towards technology comparison process
in the SECO context. SECO health can be used for technology comparison: an
acquiring organization may want to know what will happen to its SECO health if a
candidate technology is chosen as well as to analyze other candidates according to the
attribute list. Moreover, an organization can compare all candidate technologies from
the same architectural category, such as operating system or database.
It can minimize decision bias (commonly based only on manager experience)
and better justify technology selection rather than being an ad hoc process. For each
attribute, an interpretative scale might be associated, e.g., for cost: range from feasible
to not feasible. IT management team then should choose a value within the range and at
the end its members will have a comprehensive comparison of technology candidates.
4.5.1. ISO/IEC 25000 Comparison
When looking at the literature on software product evaluation based on quality
attributes, there are many proposed quality models (MIGUEL et al., 2014). Assessing
quality from standards that compose the ISO/IEC 25000 series, also known as SQuaRE
(System and Software Quality Requirements and Evaluation), can help IT management
teams in acquisition rounds (ISO/IEC 25000, 2014).
However, those guidelines reflect traditional paradigms that leave SECO out of
scope. ISO/IEC 25000 defines eight characteristics and 31 sub-characteristics to assess
product quality, presented in Figure 4.3 and Figure 4.4. They use a similar structure to
the one presented in this research, i.e., critical factors and quality attributes would
correspond to characteristics and sub-characteristics from ISO/IEC 25000 SQuaRE.
Characteristics listed in ISO/IEC 25000 consider software product and systems
quality while critical factors have been extracted to aid IT architecture maintenance, i.e.,
managing an organization’s standard technologies. Nevertheless, there is a high
resemblance in their use and definition.
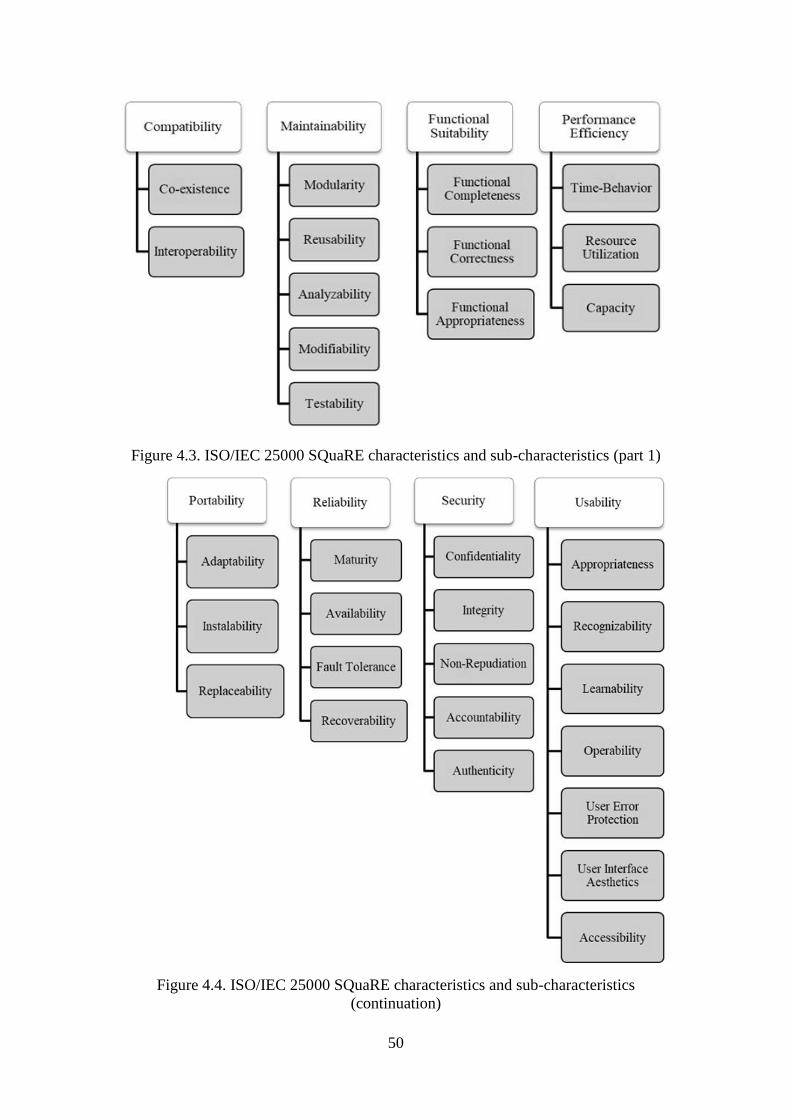
50
Figure 4.3. ISO/IEC 25000 SQuaRE characteristics and sub-characteristics (part 1)
Figure 4.4. ISO/IEC 25000 SQuaRE characteristics and sub-characteristics
(continuation)

51
Critical factors and ISO/IEC 25000’s characteristics present many similarities,
as shown in Table 4.5. Columns represent ISO/IEC 25000’s characteristics and rows
represent SECO’s critical factors. If applicable, each cell contains a critical factor or
attribute that is related to an ISO/IEC 25000’s characteristic, also considering its sub-
characteristics. For example, the critical factor “extension” (third row) has an attribute
“modifiability” that is similar to “portability” (“adaptability” sub-characteristic).
Table 4.5. SECO’s critical factors versus ISO/IEC 25000’s characteristics and sub-
characteristics
Critical Factor ISO/IEC 25000 Characteristics
Com
pa
tib
ilit
y
Ma
inta
ina
bil
ity
Fu
nct
ion
al
Su
ita
bil
ity
Per
form
an
ce
Eff
icie
ncy
Port
ab
ilit
y
Rel
iab
ilit
y
Sec
uri
ty
Usa
bil
ity
Configura-
bility - Variability - -
Variabili-
ty - - -
Cost - - - - Licensing - - -
Extension - - - - Modifia-
bility - - -
Openness - - - Performance - Availability
Security Accessibi-
lity Reliability
Quality
Efficient
use of
system
resources
Testability
Efficient use
of system
resources
- - - -
Reuse -
Composa-bility
- - - - - - Modulari-
zation
Components decoupling
Scalability Interopera-
bility Performance - - - -
Stability - - - - - - - -
Support Shared
Information Documenta-
tion Documenta-
tion - - - - -
User experience
- - - - - - - Consistent
user interface
Version Compatibi-
lity
Maintaina-bility
Portability - - -
Niche creation
- - - - - - - -
Robustness - - - - - Availability - -
Resilience
Productivity - - - - - - - Learnability
52
Some critical factors and attributes are not similar to the ISO/IEC 25000’s
definitions but might be related to. For example, “maintainability” (ISO/IEC 25000,
2014) might be affected by “scalability” (critical factor) and “stability” (critical factor)
might affect “reliability” (ISO/IEC 25000, 2014).
Since quality attributes are related to SECO platform and architecture, “security”
(characteristic) is just one attribute of “openness” (critical factor). “Openness” degree is
a very important concern for the SECO platform and “security” is relevant in this
regards. In ISO/IEC 25000, “security” relates to software use as its sub-characteristics
reflect user data manipulation, e.g., “confidentiality” and “authenticity”.
ISO/IEC 25000 models lack characteristics to address SECO concerns related to
the external player activities (development of extensions or applications). Those matters
are illustrated by quality attributes that had no correspondence, e.g., “extensions’
deliver”, “extensibility” and “quality of extensions”. All ISO/IEC 25000’s
characteristics are considered by at least one critical factor. On the other hand,
“stability” and “niche creation” (SECO’s critical factors) are not similar to any ISO/IEC
25000’s characteristic (according to the sub-characteristics’ definition). “Stability”
encompasses “framework stability”, “interface stability”, “rate of change”, and “parallel
development”.
It may be due to different scopes considered by ISO/IEC 25000 (software
product or system quality) and SECO (organization’s internal and external
relationships). “Niche creation” is inherent to SECO and then creation of opportunities
consequently generating niches inside the SECO. “Niche creation” involves an artifact
as means for new opportunities, a community as a recipient of opportunities, and an
acquiring organization (SECO keystone) as a beneficiary and manager.
4.6 Threats to Validity
We can point out some threats to validity as follows: the literature base of the
mapping study could overlook some studies with architecture-related quality attributes;
attributes might be incorrectly identified; and attributes might not be identified from the
accepted studies; and the attributes extraction did not follow a formal method. A global
survey with experts on related areas was executed to evaluate the mapping study results
and get new suggestions (Chapter 5). The main objective was to ask experts
(practitioners and researchers) whether the identified attributes are relevant for the
53
SECO context and to which extent they are appropriate to aid IT managers and
architects to compare technologies. Consequently, the list was updated with evaluated
attributes as well as experts’ suggestions based on their experience. The attributes’
extraction does not consider differences among SECO contexts, e.g., mobile sector,
health sector or agriculture section. Therefore, this set of attributes is an initial list and
must be broken into subsets according to the suitability for each SECO platform (IT
management team’s members should select a subset of attributes to work with).
4.7 Conclusion
A SECO platform broadly supports software artifact use and development. In
this context, technologies that support a SECO platform affect who enters or keeps
playing within a SECO. Such technologies are usually referred as standards as they are
used by both acquiring organization and external actors.
Candidate technologies to be adopted/changed/discontinued need to be carefully
compared to keep or improve how well a SECO platform works. Hence a baseline of
attributes is necessary for comparing technologies in the context of SECO platforms.
Managing platform technologies brings many benefits to an acquiring organization, e.g.,
technology standardization, money savings, unnecessary acquisitions avoidance, and
controlled number of technologies. Fast market changes, deployment of new versions or
support discontinuation require frequent modification and assessment of a SECO
platform’s reference technologies.
In addition, there are impacts on finances, users, politics, training, and other
perspectives that need to be considered when an organization is changing platform
technologies. It is necessary to compare several candidate technologies – what is a few
different in the SECO context as discussed in this chapter. Information used to compare
technologies should cover not only technical properties but also sociotechnical
elements, i.e., communities (users, developers and organization), feasibility, quality,
cost, and support. This is due to the fact that the SECO perspective brings to the stage
external information regarding organization/platform and relationships. A comparison
with ISO/IEC 25000’s characteristics suggests that SECO’s critical factors have a good
coverage of software quality attributes while considering specificities of the SECO
context, its technologies and platform concerns.
54
As a result, this chapter identified a set of architecture-related quality attributes
that may aid IT managers and architects maintaining their SECO platform and
technologies. That information was extracted from the literature based on a mapping
study. We analyzed 44 studies and 64 attributes were identified and grouped by 11
critical factors, i.e., macro attributes that encompass other specific attributes (all
attributes are described at Appendix II). The main contribution of this chapter is the
identification and summary of architecture attributes (as well as their associations) that
affect a SECO platform and its technologies. This set was investigated in Chapter 5 for
assessing the relevance in supporting IT managers and architects to compare candidate
technologies for acquisition and then to maintain an acquiring organization’s IT
architecture in the opinion of researchers who are experts on SECO, software
architecture and correlated related areas.

55
Chapter 5 – Survey
Chapter 4 presented a mapping study that resulted on a set of critical factors and their
attributes that can be used as technology assessment criteria in SECO platform. Those
attributes only appear scattered in the scientific literature (and evaluated by their
corresponding authors). In this chapter, experts on related topics were asked to assess
the relevance and appropriateness of each attribute to evaluate and update the list
according to participant’s suggestions.
5.1 Introduction
Once a list of critical factors and attributes for supporting technology selection
in a SECO platform was built from the mapping study presented in Chapter 4, it is
important to verify how appropriate and useful they are in the real world. To do so, a
survey with experts on SECO, technology selection and IT management/architecture
was conducted.
The participants were selected from taking part as referees or organizers in
international conferences regarding SECO research. From their assessment, the set of
attributes were evaluated, updated and then used to develop a solution in this research.
We asked how relevant each critical factor is for technology selection in an
organization. For each critical factor, we asked to which extent each attribute is relevant
for the critical factor they belong. The goal was to capture suggestions on attributes
(addition to, removal from or change critical factors).
This study is important to evaluate the results captured from the literature in the
opinion of experts on SECO, software architecture and correlated related areas. SECO-
AM approach (presented in the next chapter) uses those critical factors so that IT
managers and architects can choose criteria for technology analysis from an evaluated,
refined set. The use of a set of criteria makes easier the comparison among technologies
as IT managers and architects can report and discuss each candidate technology in the
same criteria.
Section 5.2 presents the planned steps and instruments for the survey. Section
5.3 describes how the execution was performed based in the plan from Section 5.2.
Section 5.4 presents the results captured from the survey questionnaires and Section 5.5
discusses the results aiming to find a final set of criteria. Section 5.6 lists some threats
56
to the study's validity that need to be considered when analyzing the results. Section 5.7
concludes the chapter with the main results from the survey.
5.2 Planning
The survey consists of an electronic questionnaire written in English to be filled
in 20-30 minutes. It was sent to the invitees’ e-mails; in this case, experts in SECO,
technology selection and IT management/architecture. The complete questionnaire is
presented in Appendix III, and it is divided as:
1. Research Summary;
2. Term of Consent;
3. Characterization Form;
4. Critical Factors’ Relevance; and
5. Critical Factors’ Attributes Relevance.
Considering the objective of capturing participants’ experience, it was used a
five-point scale similar to previous surveys executed by SECO researchers (ALBERT,
2014; LIMA, 2015, SANTOS, 2016):
Don’t Know it;
Don’t Know, but I’ve heard of it;
I know;
I know it and have some experience; and
I have much experience with it.
5.2.1. Objective
This survey objective was to investigate if the critical factors presented in
Chapter 4 are relevant for technologies selection in a SECO platform. As a result,
experts’ opinions on the critical factors and their attributes were collected. The
following questions guided the survey participants:
How relevant are the critical factors?
How relevant are the set of attributes assigned to each critical factor?
Is there any misplaced, missing, or inappropriate attribute or critical factor?
From the experts’ opinions, critical factors and their attributes were evaluated. In
addition, this survey studied if the attributes represent relevant perspectives on the

57
related critical factors. In Table 5.1, the goal of this survey is described following the
GQM model (BASILI et al., 1994).
Table 5.1. GQM for the survey goals
Analyze List of critical factors and their attributes
With the purpose of Characterize
With respect to Relevance
The point of view of Experts who are researchers on SECO, software architecture
and correlated research areas
In the context of IT management activities working with the decision making
5.2.2. Participants
The survey used an electronic questionnaire for collecting information from
invited experts. 144 participants were invited from 22 countries. Invitations were sent
by e-mail and participants were chosen from websites of events related to this Master
thesis’ research topics, including:
ICSOB4: 2015, 2016 and 2017;
WDES5: 2015, 2016, and 2017;
IWSECO6: 2014, 2015, and 2016; and
WEA7: 2014, 2015, and 2016.
5.3 Execution
E-mails inviting the selected experts were sent on June 26th, 2017. Answers were
collected between June 28th, 2017 and August 21th, 2017. From those 144 researchers
invited to participate in this survey, 28 invitees responded the questionnaire (19.4%). A
rate of response of 20% is adequate when the sample size exceed 100 (NULTY, 2008),
thus this survey response rate is acceptable considering the samples size of 144. It was
mandatory to fill the questionnaire’ parts: (1) Research summary, (2) Term of Consent,
and (3) Characterization Form. Participants had no obligation to answer all the
relevance questions from parts (4) Critical Factors’ Relevance and (5) Critical Factors’
Attributes Relevance, in case they thought some assessments did not apply.
4 ICSOB – International Conference on Software Business. Available at:
https://icsob2017.wordpress.com/ 5 WDES – Workshop on Distributed Software Development, Software Ecosystems and Systems-of-
Systems. Available at: http://sesos-wdes-2017.icmc.usp.br/ 6 IWSECO – International Workshop on Software Ecosystems. Available at: https://iwseco.org/
7 WEA – Workshop on Software Ecosystem Architectures. Available at: http://wea.github.io/
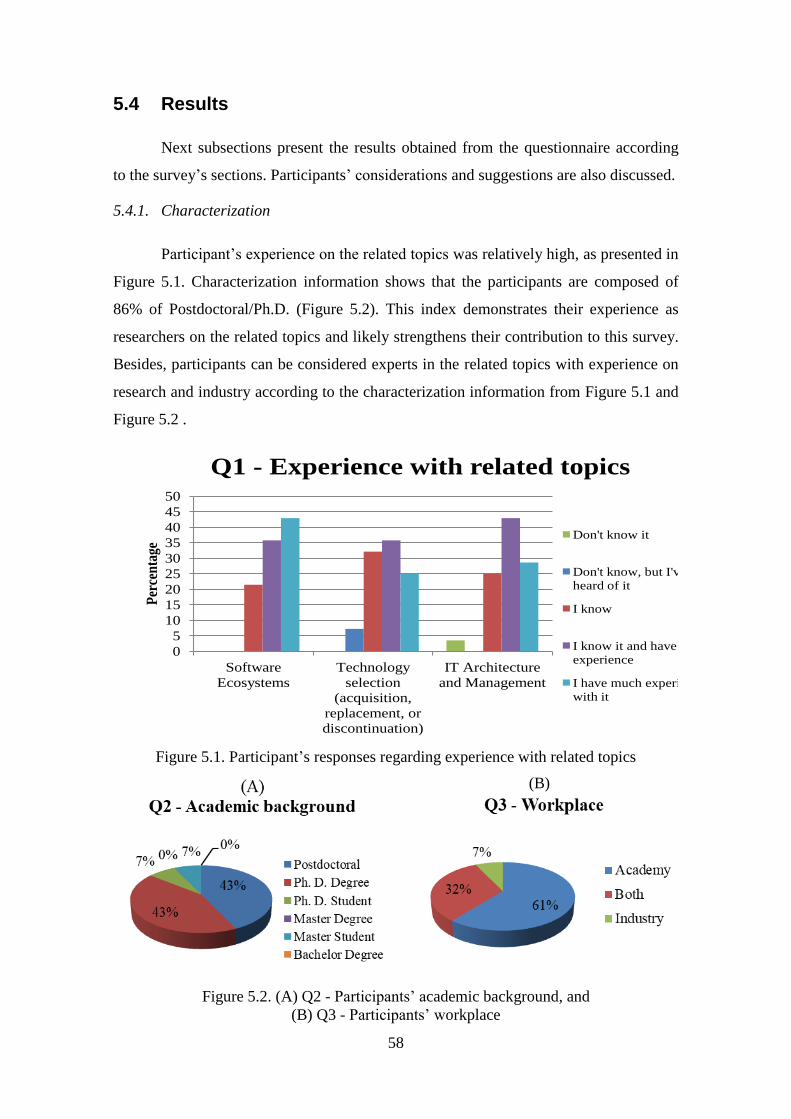
58
5.4 Results
Next subsections present the results obtained from the questionnaire according
to the survey’s sections. Participants’ considerations and suggestions are also discussed.
5.4.1. Characterization
Participant’s experience on the related topics was relatively high, as presented in
Figure 5.1. Characterization information shows that the participants are composed of
86% of Postdoctoral/Ph.D. (Figure 5.2). This index demonstrates their experience as
researchers on the related topics and likely strengthens their contribution to this survey.
Besides, participants can be considered experts in the related topics with experience on
research and industry according to the characterization information from Figure 5.1 and
Figure 5.2 .
0
5
10
15
20
25
30
35
40
45
50
Software
Ecosystems
Technology
selection
(acquisition,
replacement, or
discontinuation)
IT Architecture
and Management
Per
cen
tage
Q1 - Experience with related topics
Don't know it
Don't know, but I've
heard of it
I know
I know it and have some
experience
I have much experience
with it
Figure 5.1. Participant’s responses regarding experience with related topics
(B)
Figure 5.2. (A) Q2 - Participants’ academic background, and
(B) Q3 - Participants’ workplace

59
5.4.2. Critical Factors
All critical factors were assessed as ‘Some relevance’ and ‘Highly relevant’. As
shown in Figure 5.3, ‘No Relevance’, ‘Little Relevance’ and ‘Limited Relevance’
answers all together did not reach 50%. It means that experts find those critical factors
relevant and therefore applicable for technology selection in a SECO platform. Few
features were suggested, some of them already presented as attributes of critical factors.
Participants had not seen the attribute list before the question regarding suggestions of
critical factors, so it is positive that they might recommend some features that are
attributes already proposed by this research.
Figure 5.3. Critical factors relevance assessment
The critical factors from Figure 5.3 are:
CF1. Configurability;
CF2. Cost;
CF3. Extension;
CF4. Openness;
CF5. Quality;
CF6. Reuse;
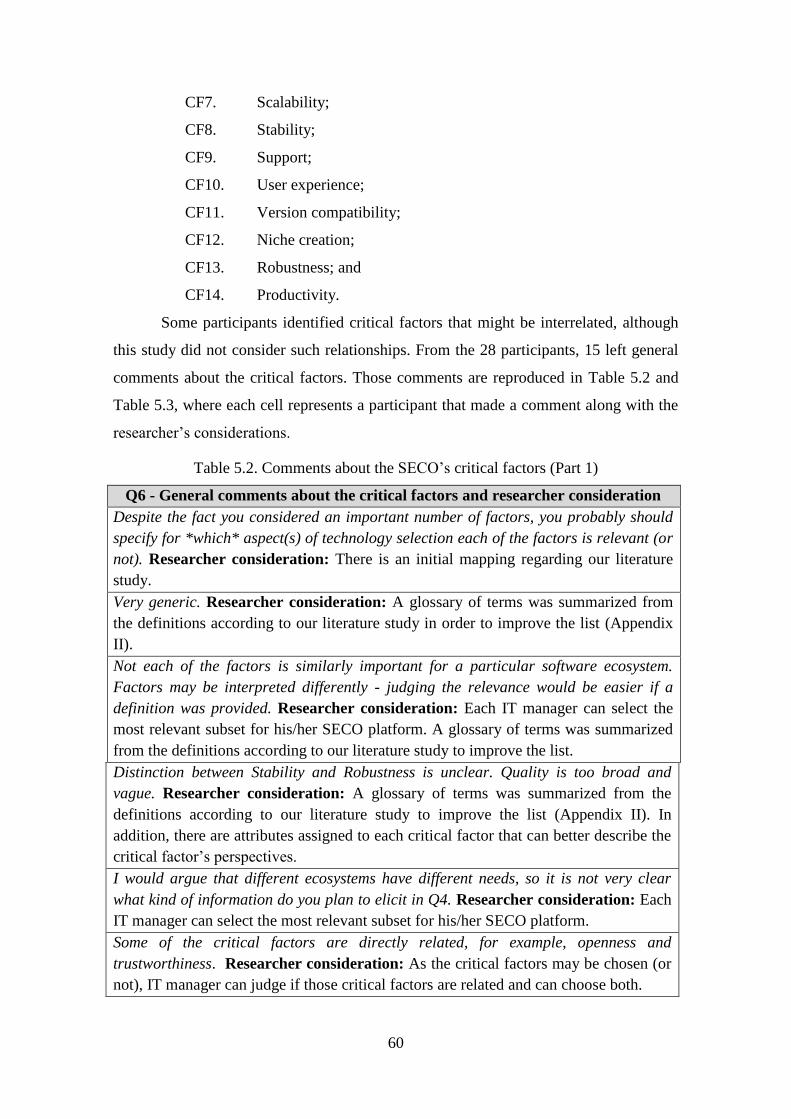
60
CF7. Scalability;
CF8. Stability;
CF9. Support;
CF10. User experience;
CF11. Version compatibility;
CF12. Niche creation;
CF13. Robustness; and
CF14. Productivity.
Some participants identified critical factors that might be interrelated, although
this study did not consider such relationships. From the 28 participants, 15 left general
comments about the critical factors. Those comments are reproduced in Table 5.2 and
Table 5.3, where each cell represents a participant that made a comment along with the
researcher’s considerations.
Table 5.2. Comments about the SECO’s critical factors (Part 1)
Q6 - General comments about the critical factors and researcher consideration
Despite the fact you considered an important number of factors, you probably should
specify for *which* aspect(s) of technology selection each of the factors is relevant (or
not). Researcher consideration: There is an initial mapping regarding our literature
study.
Very generic. Researcher consideration: A glossary of terms was summarized from
the definitions according to our literature study in order to improve the list (Appendix
II).
Not each of the factors is similarly important for a particular software ecosystem.
Factors may be interpreted differently - judging the relevance would be easier if a
definition was provided. Researcher consideration: Each IT manager can select the
most relevant subset for his/her SECO platform. A glossary of terms was summarized
from the definitions according to our literature study to improve the list.
Distinction between Stability and Robustness is unclear. Quality is too broad and
vague. Researcher consideration: A glossary of terms was summarized from the
definitions according to our literature study to improve the list (Appendix II). In
addition, there are attributes assigned to each critical factor that can better describe the
critical factor’s perspectives.
I would argue that different ecosystems have different needs, so it is not very clear
what kind of information do you plan to elicit in Q4. Researcher consideration: Each
IT manager can select the most relevant subset for his/her SECO platform.
Some of the critical factors are directly related, for example, openness and
trustworthiness. Researcher consideration: As the critical factors may be chosen (or
not), IT manager can judge if those critical factors are related and can choose both.
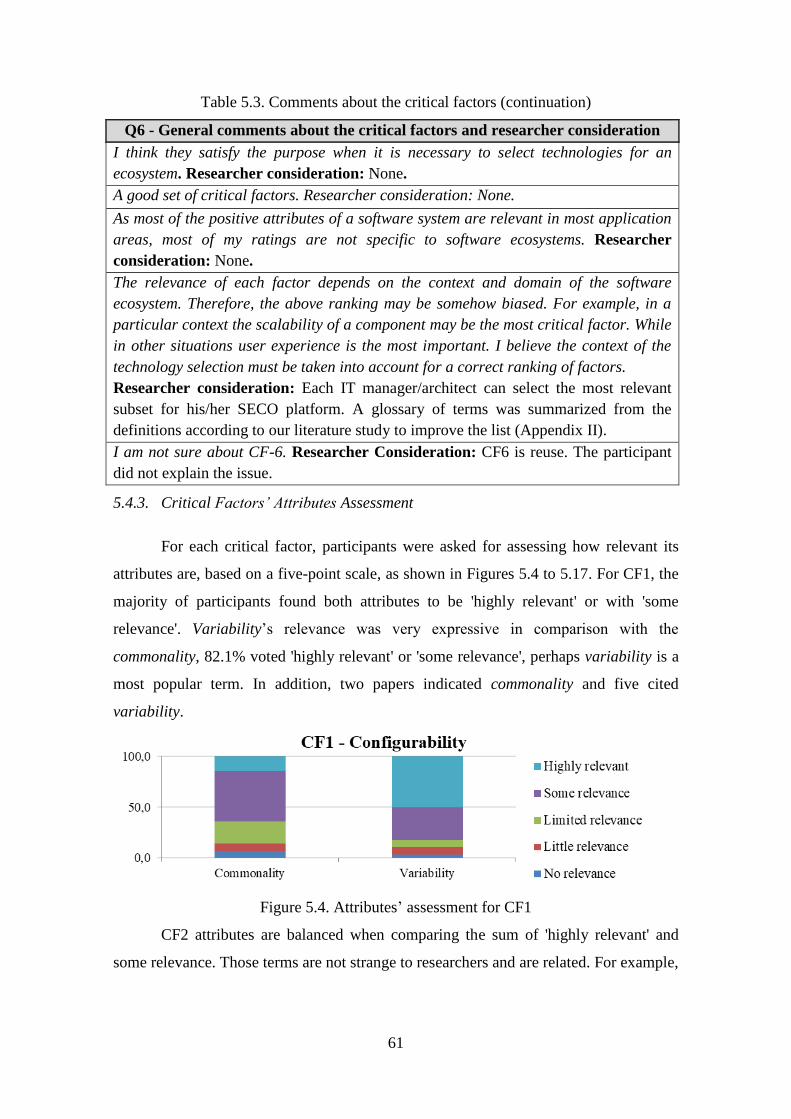
61
Table 5.3. Comments about the critical factors (continuation)
Q6 - General comments about the critical factors and researcher consideration
I think they satisfy the purpose when it is necessary to select technologies for an
ecosystem. Researcher consideration: None.
A good set of critical factors. Researcher consideration: None.
As most of the positive attributes of a software system are relevant in most application
areas, most of my ratings are not specific to software ecosystems. Researcher
consideration: None.
The relevance of each factor depends on the context and domain of the software
ecosystem. Therefore, the above ranking may be somehow biased. For example, in a
particular context the scalability of a component may be the most critical factor. While
in other situations user experience is the most important. I believe the context of the
technology selection must be taken into account for a correct ranking of factors.
Researcher consideration: Each IT manager/architect can select the most relevant
subset for his/her SECO platform. A glossary of terms was summarized from the
definitions according to our literature study to improve the list (Appendix II).
I am not sure about CF-6. Researcher Consideration: CF6 is reuse. The participant
did not explain the issue.
5.4.3. Critical Factors’ Attributes Assessment
For each critical factor, participants were asked for assessing how relevant its
attributes are, based on a five-point scale, as shown in Figures 5.4 to 5.17. For CF1, the
majority of participants found both attributes to be 'highly relevant' or with 'some
relevance'. Variability’s relevance was very expressive in comparison with the
commonality, 82.1% voted 'highly relevant' or 'some relevance', perhaps variability is a
most popular term. In addition, two papers indicated commonality and five cited
variability.
Figure 5.4. Attributes’ assessment for CF1
CF2 attributes are balanced when comparing the sum of 'highly relevant' and
some relevance. Those terms are not strange to researchers and are related. For example,
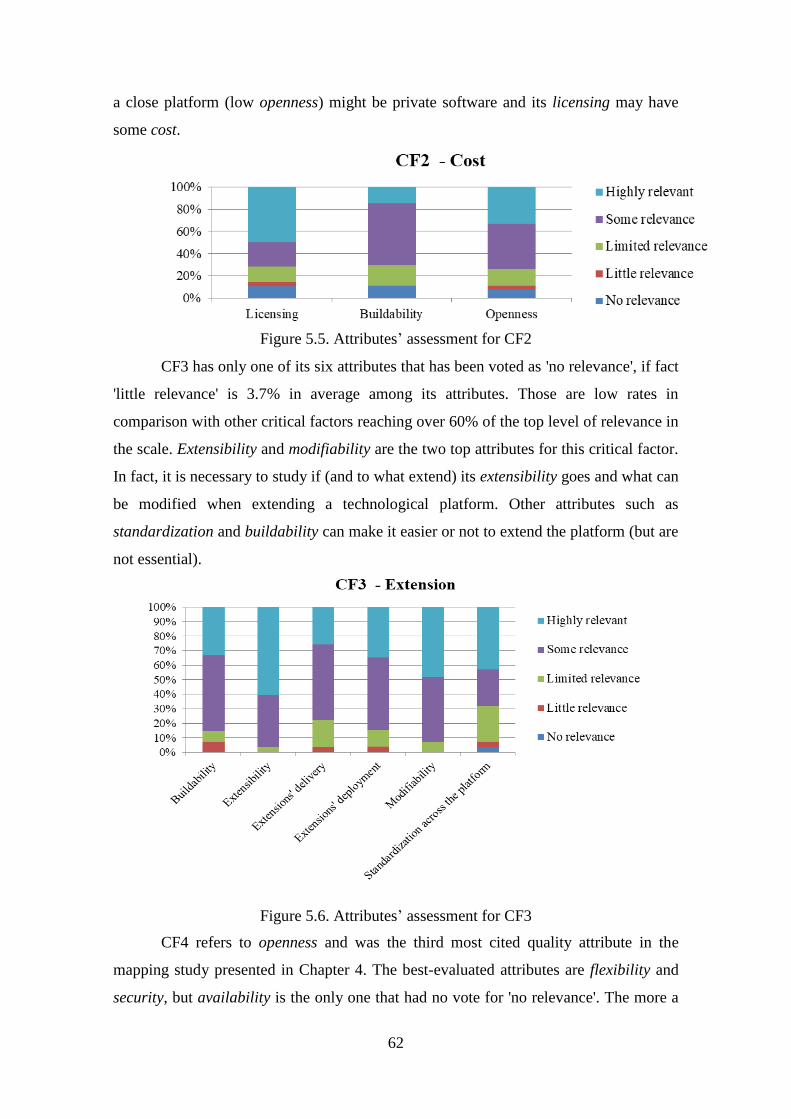
62
a close platform (low openness) might be private software and its licensing may have
some cost.
Figure 5.5. Attributes’ assessment for CF2
CF3 has only one of its six attributes that has been voted as 'no relevance', if fact
'little relevance' is 3.7% in average among its attributes. Those are low rates in
comparison with other critical factors reaching over 60% of the top level of relevance in
the scale. Extensibility and modifiability are the two top attributes for this critical factor.
In fact, it is necessary to study if (and to what extend) its extensibility goes and what can
be modified when extending a technological platform. Other attributes such as
standardization and buildability can make it easier or not to extend the platform (but are
not essential).
Figure 5.6. Attributes’ assessment for CF3
CF4 refers to openness and was the third most cited quality attribute in the
mapping study presented in Chapter 4. The best-evaluated attributes are flexibility and
security, but availability is the only one that had no vote for 'no relevance'. The more a
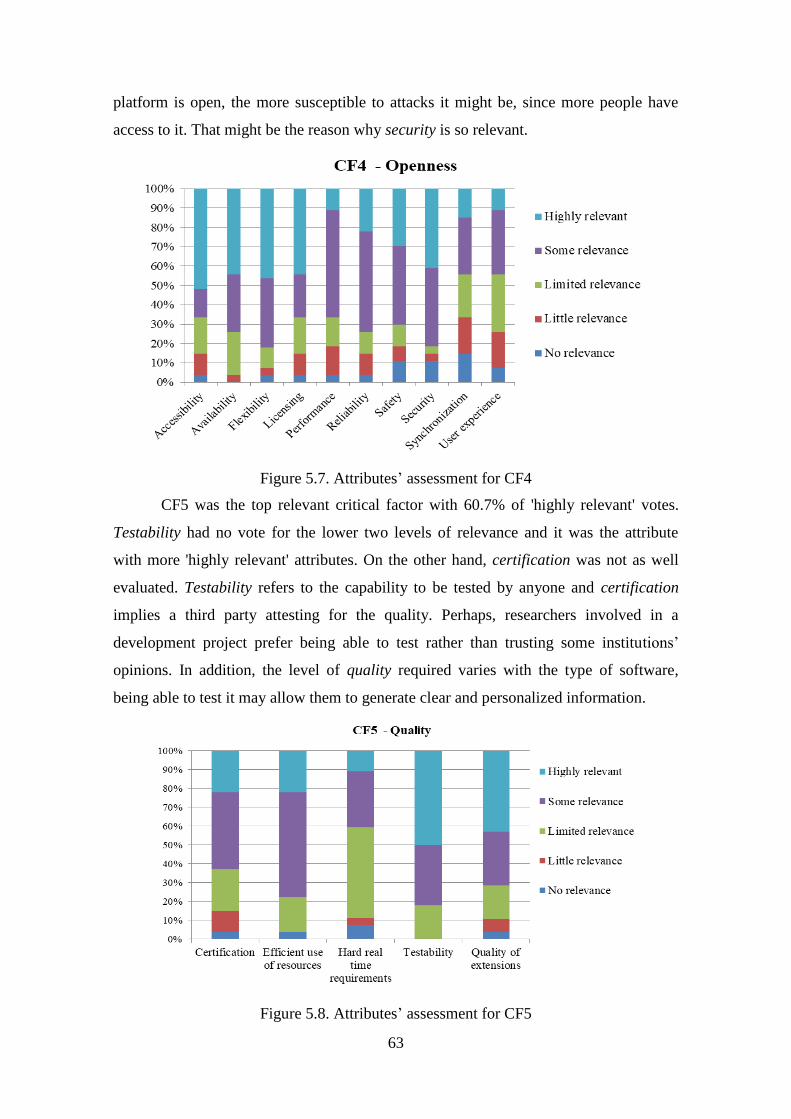
63
platform is open, the more susceptible to attacks it might be, since more people have
access to it. That might be the reason why security is so relevant.
Figure 5.7. Attributes’ assessment for CF4
CF5 was the top relevant critical factor with 60.7% of 'highly relevant' votes.
Testability had no vote for the lower two levels of relevance and it was the attribute
with more 'highly relevant' attributes. On the other hand, certification was not as well
evaluated. Testability refers to the capability to be tested by anyone and certification
implies a third party attesting for the quality. Perhaps, researchers involved in a
development project prefer being able to test rather than trusting some institutions’
opinions. In addition, the level of quality required varies with the type of software,
being able to test it may allow them to generate clear and personalized information.
Figure 5.8. Attributes’ assessment for CF5
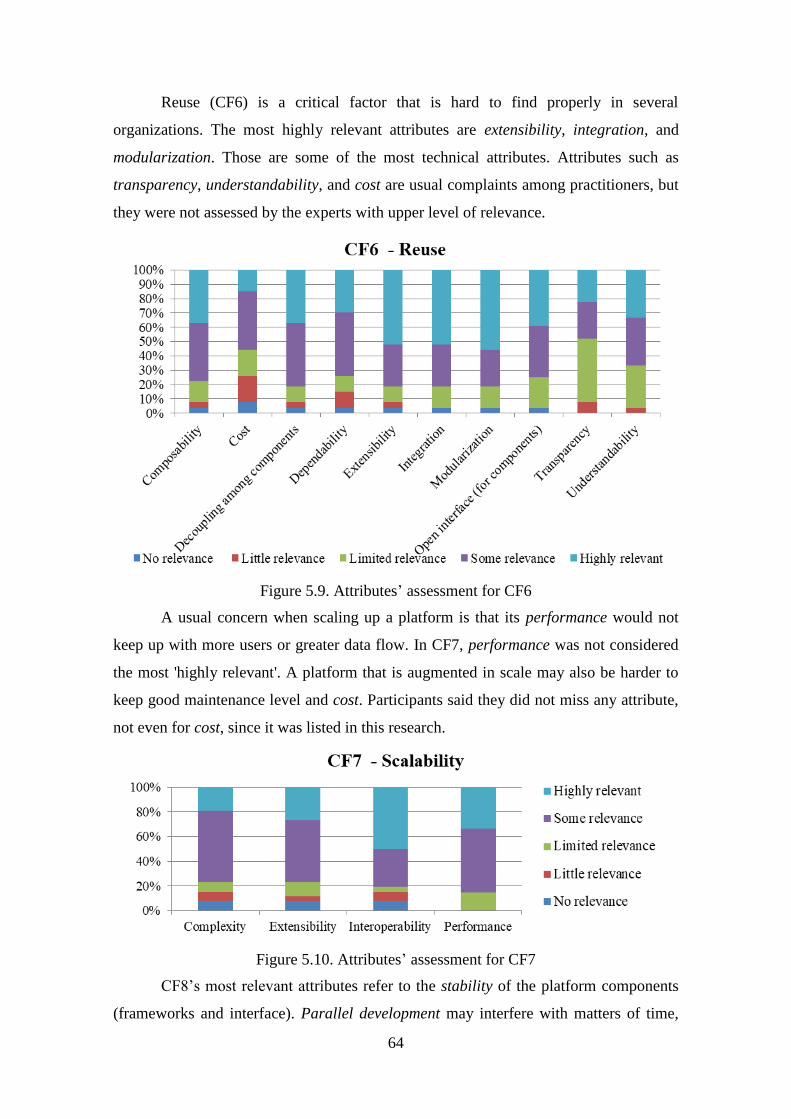
64
Reuse (CF6) is a critical factor that is hard to find properly in several
organizations. The most highly relevant attributes are extensibility, integration, and
modularization. Those are some of the most technical attributes. Attributes such as
transparency, understandability, and cost are usual complaints among practitioners, but
they were not assessed by the experts with upper level of relevance.
Figure 5.9. Attributes’ assessment for CF6
A usual concern when scaling up a platform is that its performance would not
keep up with more users or greater data flow. In CF7, performance was not considered
the most 'highly relevant'. A platform that is augmented in scale may also be harder to
keep good maintenance level and cost. Participants said they did not miss any attribute,
not even for cost, since it was listed in this research.
Figure 5.10. Attributes’ assessment for CF7
CF8’s most relevant attributes refer to the stability of the platform components
(frameworks and interface). Parallel development may interfere with matters of time,

65
but it was not considered very relevant since it is not a dominant practice in
organizations. Rate of change might depend on the framework and interface stability,
since their rate of change can influence the platform’s demands for changes.
Figure 5.11. Attributes’ assessment for CF8
CF9’s attributes' assessment are very similar. Documentation is essential for
supporting developers in understanding the functionalities and differences between
releases. The shared information is not necessary from external parties, e.g., forums and
FAQs, but also among the developers and architects working in the platform that also
refer to non-technical problems, such as lack of communication.
Figure 5.12. Attributes’ assessment for CF9
User experience (CF10) is essential for a SECO that deals with end users, as
they can stop using the platform if user experience fails. User experience is not
restricted to the interface they interact with, but also to how easy and simple it is to find
and use the platform’s information and functionalities. For example, a developer that
easily finds downloads and forums in a simple SECO portal has a better experience than
using a repository full of information and permission requirements to simply access a
forum.
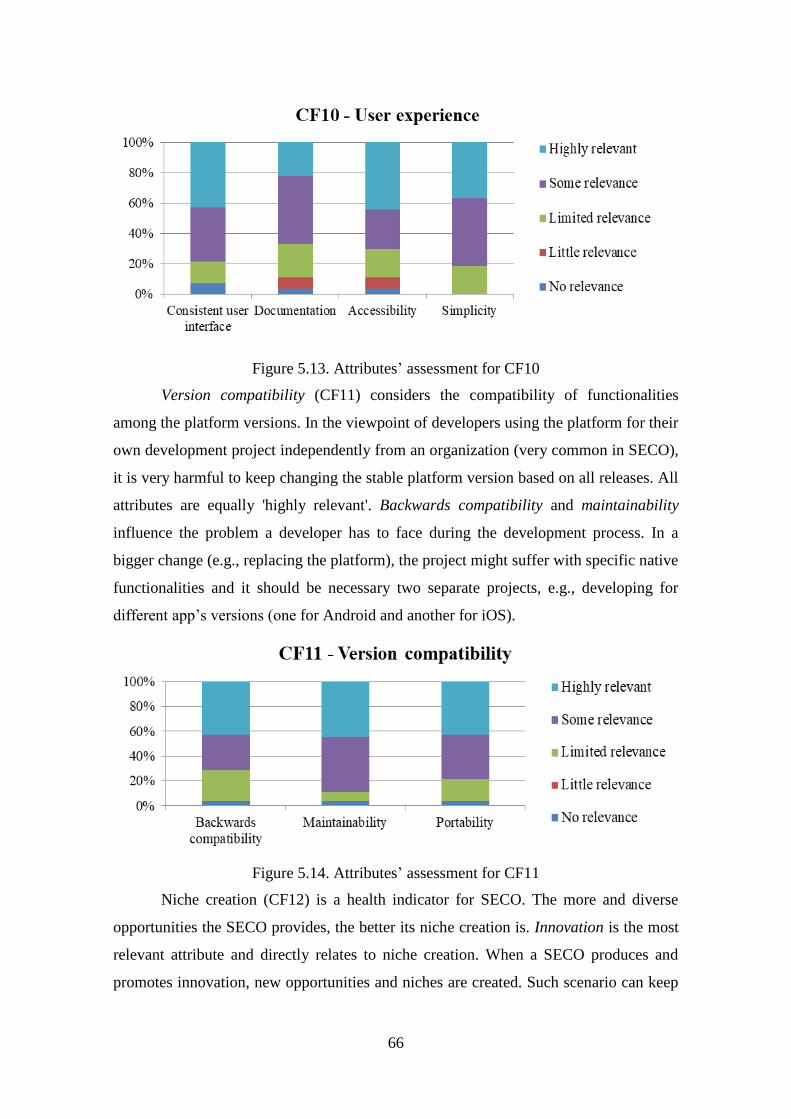
66
Figure 5.13. Attributes’ assessment for CF10
Version compatibility (CF11) considers the compatibility of functionalities
among the platform versions. In the viewpoint of developers using the platform for their
own development project independently from an organization (very common in SECO),
it is very harmful to keep changing the stable platform version based on all releases. All
attributes are equally 'highly relevant'. Backwards compatibility and maintainability
influence the problem a developer has to face during the development process. In a
bigger change (e.g., replacing the platform), the project might suffer with specific native
functionalities and it should be necessary two separate projects, e.g., developing for
different app’s versions (one for Android and another for iOS).
Figure 5.14. Attributes’ assessment for CF11
Niche creation (CF12) is a health indicator for SECO. The more and diverse
opportunities the SECO provides, the better its niche creation is. Innovation is the most
relevant attribute and directly relates to niche creation. When a SECO produces and
promotes innovation, new opportunities and niches are created. Such scenario can keep

67
users close to the platform and bring new ones as well, since they find innovative
features that might be unique and only found in a given SECO.
Figure 5.15. Attributes’ assessment for CF12
Robustness (CF13) is defined as the capability of a SECO to resist disturbances.
Availability is assessed as the most 'highly relevant' attribute. It makes sense since
comparing SECO availability before and after a disturbance may be an indication of
how much a SECO is robust. For that, other attributes influence a SECO regarding the
platform and technologies, e.g., how resilient and stable are the technologies that
support the platform. The offline capability was not considered very relevant, perhaps
because it is a very particular requirement (not all platforms concerns with offline
capability).
Figure 5.16. Attributes’ assessment for CF13
Productivity (CF14) reflects how many projects the SECO produces. The
relevance of each attribute does not differ much. All attributes refer to the existence of
external parties developing on that platform. Deployability affects how fast a developer
is able to deploy and then publish his/her projects, affecting the individual productivity
that composes the overall productivity. Extension’s delivery may stop the projects’
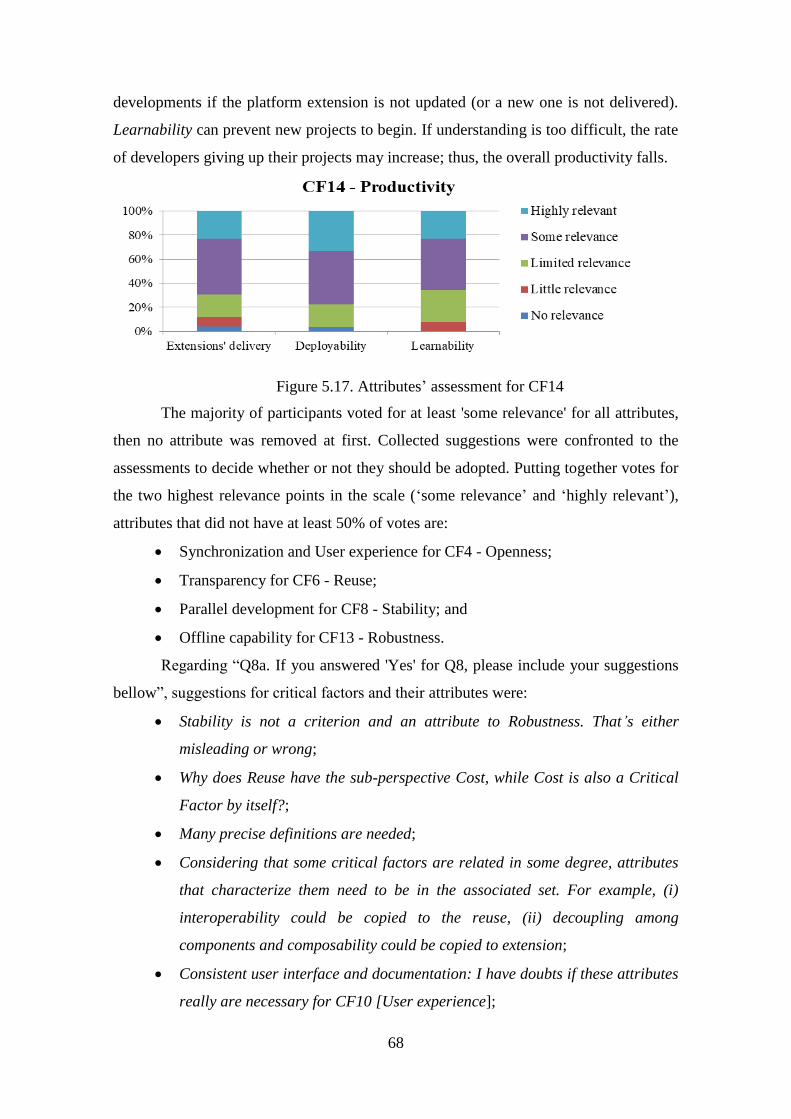
68
developments if the platform extension is not updated (or a new one is not delivered).
Learnability can prevent new projects to begin. If understanding is too difficult, the rate
of developers giving up their projects may increase; thus, the overall productivity falls.
Figure 5.17. Attributes’ assessment for CF14
The majority of participants voted for at least 'some relevance' for all attributes,
then no attribute was removed at first. Collected suggestions were confronted to the
assessments to decide whether or not they should be adopted. Putting together votes for
the two highest relevance points in the scale (‘some relevance’ and ‘highly relevant’),
attributes that did not have at least 50% of votes are:
Synchronization and User experience for CF4 - Openness;
Transparency for CF6 - Reuse;
Parallel development for CF8 - Stability; and
Offline capability for CF13 - Robustness.
Regarding “Q8a. If you answered 'Yes' for Q8, please include your suggestions
bellow”, suggestions for critical factors and their attributes were:
Stability is not a criterion and an attribute to Robustness. That’s either
misleading or wrong;
Why does Reuse have the sub-perspective Cost, while Cost is also a Critical
Factor by itself?;
Many precise definitions are needed;
Considering that some critical factors are related in some degree, attributes
that characterize them need to be in the associated set. For example, (i)
interoperability could be copied to the reuse, (ii) decoupling among
components and composability could be copied to extension;
Consistent user interface and documentation: I have doubts if these attributes
really are necessary for CF10 [User experience];
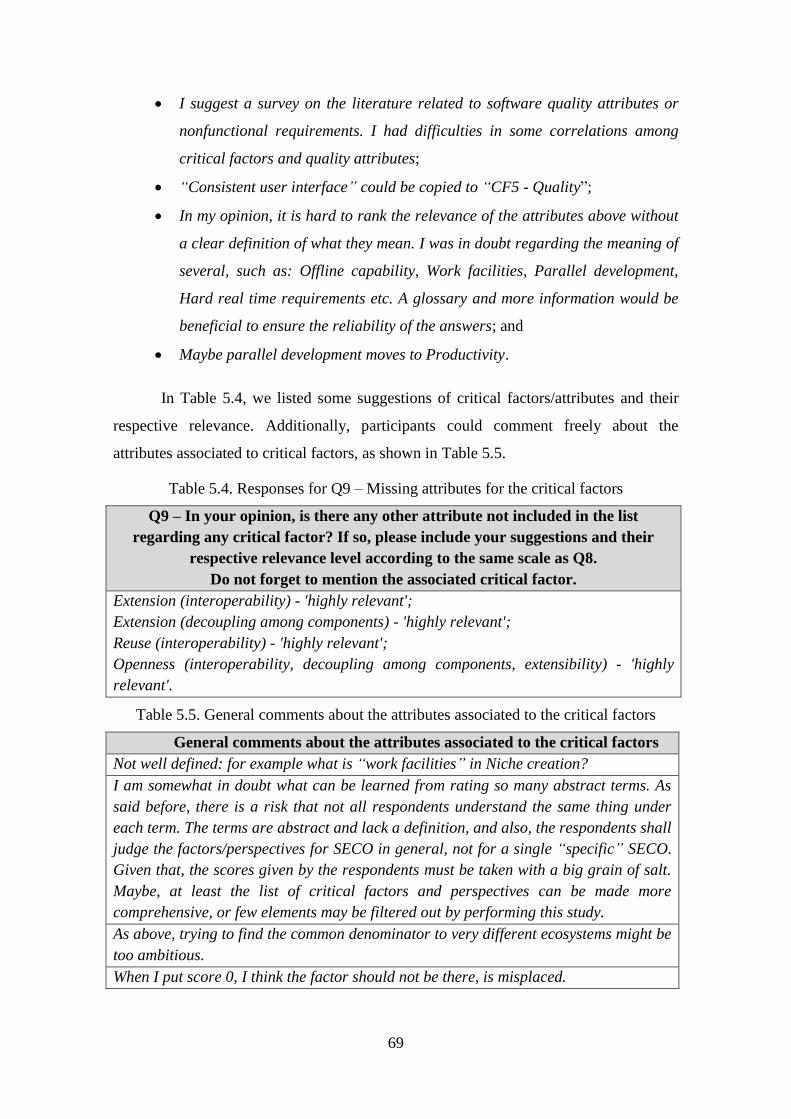
69
I suggest a survey on the literature related to software quality attributes or
nonfunctional requirements. I had difficulties in some correlations among
critical factors and quality attributes;
“Consistent user interface” could be copied to “CF5 - Quality”;
In my opinion, it is hard to rank the relevance of the attributes above without
a clear definition of what they mean. I was in doubt regarding the meaning of
several, such as: Offline capability, Work facilities, Parallel development,
Hard real time requirements etc. A glossary and more information would be
beneficial to ensure the reliability of the answers; and
Maybe parallel development moves to Productivity.
In Table 5.4, we listed some suggestions of critical factors/attributes and their
respective relevance. Additionally, participants could comment freely about the
attributes associated to critical factors, as shown in Table 5.5.
Table 5.4. Responses for Q9 – Missing attributes for the critical factors
Q9 – In your opinion, is there any other attribute not included in the list
regarding any critical factor? If so, please include your suggestions and their
respective relevance level according to the same scale as Q8.
Do not forget to mention the associated critical factor.
Extension (interoperability) - 'highly relevant';
Extension (decoupling among components) - 'highly relevant';
Reuse (interoperability) - 'highly relevant';
Openness (interoperability, decoupling among components, extensibility) - 'highly
relevant'.
Table 5.5. General comments about the attributes associated to the critical factors
General comments about the attributes associated to the critical factors
Not well defined: for example what is “work facilities” in Niche creation?
I am somewhat in doubt what can be learned from rating so many abstract terms. As
said before, there is a risk that not all respondents understand the same thing under
each term. The terms are abstract and lack a definition, and also, the respondents shall
judge the factors/perspectives for SECO in general, not for a single “specific” SECO.
Given that, the scores given by the respondents must be taken with a big grain of salt.
Maybe, at least the list of critical factors and perspectives can be made more
comprehensive, or few elements may be filtered out by performing this study.
As above, trying to find the common denominator to very different ecosystems might be
too ambitious.
When I put score 0, I think the factor should not be there, is misplaced.
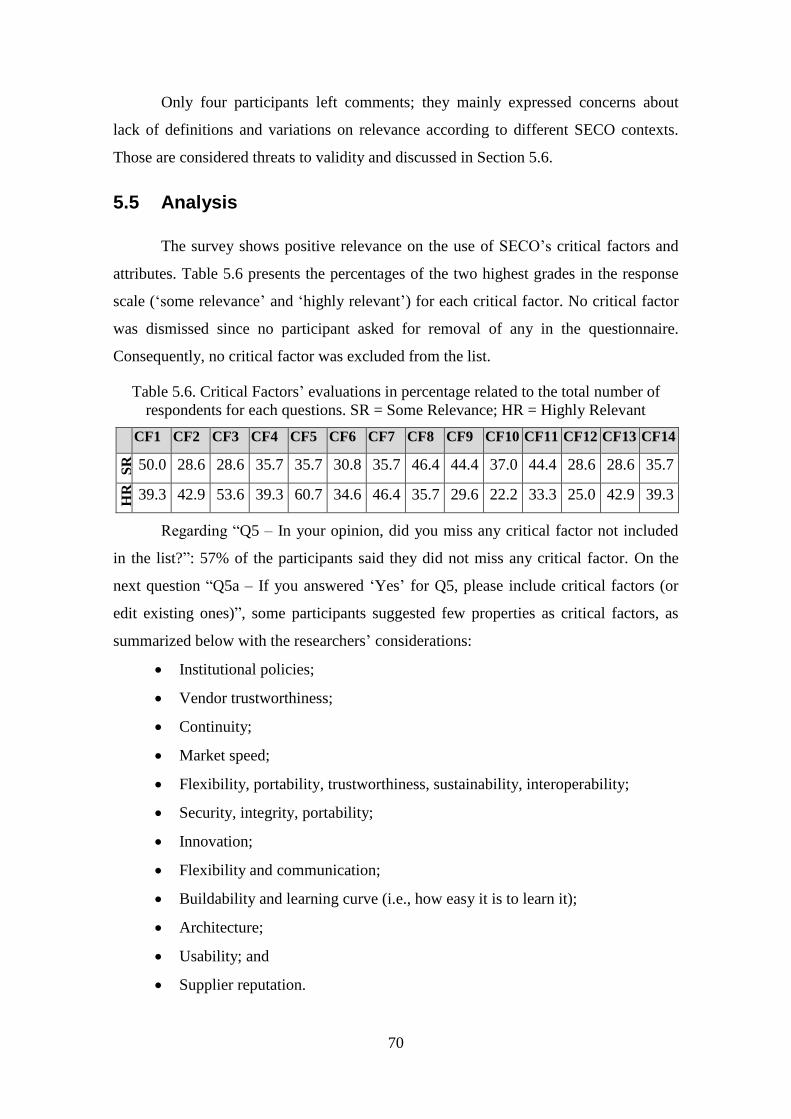
70
Only four participants left comments; they mainly expressed concerns about
lack of definitions and variations on relevance according to different SECO contexts.
Those are considered threats to validity and discussed in Section 5.6.
5.5 Analysis
The survey shows positive relevance on the use of SECO’s critical factors and
attributes. Table 5.6 presents the percentages of the two highest grades in the response
scale (‘some relevance’ and ‘highly relevant’) for each critical factor. No critical factor
was dismissed since no participant asked for removal of any in the questionnaire.
Consequently, no critical factor was excluded from the list.
Table 5.6. Critical Factors’ evaluations in percentage related to the total number of
respondents for each questions. SR = Some Relevance; HR = Highly Relevant
CF1 CF2 CF3 CF4 CF5 CF6 CF7 CF8 CF9 CF10 CF11 CF12 CF13 CF14
SR
50.0 28.6 28.6 35.7 35.7 30.8 35.7 46.4 44.4 37.0 44.4 28.6 28.6 35.7
HR
39.3 42.9 53.6 39.3 60.7 34.6 46.4 35.7 29.6 22.2 33.3 25.0 42.9 39.3
Regarding “Q5 – In your opinion, did you miss any critical factor not included
in the list?”: 57% of the participants said they did not miss any critical factor. On the
next question “Q5a – If you answered ‘Yes’ for Q5, please include critical factors (or
edit existing ones)”, some participants suggested few properties as critical factors, as
summarized below with the researchers’ considerations:
Institutional policies;
Vendor trustworthiness;
Continuity;
Market speed;
Flexibility, portability, trustworthiness, sustainability, interoperability;
Security, integrity, portability;
Innovation;
Flexibility and communication;
Buildability and learning curve (i.e., how easy it is to learn it);
Architecture;
Usability; and
Supplier reputation.

71
As part of the IT management constraints for SECO platforms in Section 2.3,
several types of institutional policies were considered as nontechnical issues.
Consequently, they were not considered as criteria for selecting technologies at this
point. Therefore, we argue that institutional policies should be considered but as a
previous step.
The set of criteria used in this research (list of critical factors) relate to SECO
platform as well as to its architecture and technologies. Thus, properties such as vendor
trustworthiness, continuity, market speed, sustainability, communication, and supplier
reputation were not considered as critical factors. They are relevant for technologies’
assessment in other dimensions, e.g., transactional. Moreover, they should not be
dismissed but rather evaluated at a previous step.
Flexibility, portability, interoperability, flexibility, buildability, and learning
curve are already addressed by the following attributes: “flexibility” (CF4 - Openness),
“portability” (CF11 - Version compatibility), “interoperability” (CF7 - Scalability),
“buildability” (CF2 - Cost, and CF3 - Extension), and “learnability” (CF14 -
Productivity). It is a positive outcome since it shows that experts in the related topics
anticipated some attributes because they had only seen the critical factors before the
referring question.
From all 64 attributes (some of them are repeated from different critical factors),
only five had less than 50% when putting together ‘some relevance’ and ‘highly
relevant’. In order to decide if they should be removed, we looked into participants’
suggestions and comments to find out if anyone expressed an intention of dropping
these attributes out of the list.
Table 5.7. Lowest evaluated attributes. HR = Highly Relevant
Critical Factor Attribute (NR) Suggestions
CF4 - Openness Synchronization – 14.8%
User experience – 14.8%
Eliminate
-
CF5 - Quality Hard real time requirements – 7.4% -
CF6 - Reuse Transparency – 22.2% -
CF8 - Stability Parallel development – 3.7% Move to CF14 - Productivity
CF13 - Robustness Offline capability – 10.7% -
72
Hence, comments were searched for explicit suggestions of removing those
attributes (if pointed by at least one participant). In addition, there was suggestion for
both attributes. As a result, “synchronization” was eliminated from CF4 - Openness and
“parallel development” was moved to CF14 - Productivity. The suggestions for lowest
evaluated attributes are listed in Table 5.7.
From Q8 (“In your opinion, is there any misplaced attribute, i.e., any attribute
should be moved or copied to another critical factor?”), 68% of participants said they
did not think any attribute was misplaced. Suggestions from the ones who expressed
their opinions about Q8, Q9 and Comments, as well as our considerations, are discussed
below:
Eliminate stability from robustness: As stability is a critical factor, we have
decided to remove the “stability” attribute;
Interoperability could be copied to reuse: As more than one participant
made that suggestion and assigned it as ‘highly relevant’, the suggestion was
accepted;
Decoupling among components (‘Highly relevant’), interoperability
(‘Highly relevant’) and composability could be copied to extension: As
more than one participant made that suggestion and assigned it as ‘Highly
relevant’, the suggestion was accepted;
Consistent user interface and documentation: I have doubts if these
attributes really are necessary for CF10 - User experience: ‘some
relevance’ and ‘highly relevant’ answers (percentage) were checked to decide
if those attributes should be removed. “Consistent user interface” and
“documentation” have 78.6% and 66.7%, respectively. As the majority of
participants think those attributes are much relevant to CF10 - User
experience, they will remain part of this critical factor;
Consistent user interface moves to CF5 - Quality: The suggestion was
accepted as it is; the attribute was copied to CF5;
Parallel development moves to productivity: “Parallel development” was
rated 40.7% when ‘some relevance’ and ‘highly relevant’ were put together.
As such, it might not be at the right place. Therefore, the suggestion to move
it to “productivity” was adopted;
73
Interoperability, decoupling among components, and extensibility as part
of openness assessed as 'highly relevant': Suggestions were accepted; and
Some attributes are misplaces: in CF4 - Openness: synchronization,
security, safety, and flexibility; In CF3 - Extension: standardization
across the platform; and In CF2 - Cost: openness, licensing, and
buildability: Critical factors as attributes were removed (“openness” in CF2).
A participant said that other attributes are misplaced, but did not say where
they should go. Thus, unless other participants had discussed them, those
attributes were not moved.
5.6 Threats to Validity
Some threats to validity for this survey are related to instruments, methods,
researchers, and participants are:
A glossary with critical factors’ and their attributes’ definitions captured by
the mapping study was not available at the time of execution (available at
Appendix II). Although most of the terms are common at the literature and
participants are experts in the related topics as their characterization profile,
some participants might have slightly different conceptions of the same term
used for critical factors and attributes;
Participants were free to not assess critical factors and attributes, as some
questions missed zero, one or two answers. All participants had the same
choice of not answering some questions. Thus, the percentage used in the
results is relative to the ones who answered, since some people did not
answer a few questions. The question with the most absent values had two
missing answers compared with the total of 28 participants, then they are not
threatening to the study significance;
The survey was executed as an electronic questionnaire to reach the
international community. Interviews might help to collect more data outside
the questionnaire (informal), although the survey had questions for
comments;
It was not executed a pilot before the main study. The questionnaire could
have been improved before the main execution;

74
It could not be assured that the sample size was optimal and that they had a
high representativeness of the population; and
The scale used to assess relevance (Likert) cannot assure that participants are
using the same criteria for each relevance level.
5.7 Conclusion
After analyzing participants’ suggestions as well as consulting their respective
proposed relevance levels, the set of critical factors and their attributes was updated
after removing, including, copying or moving some attributes, as explained in this
chapter. In addition, some critical factors that appeared as attributes were removed. The
final list is presented in Table 5.8.
The majority of participants did not think that any attribute or critical factor has
‘some relevance’. The list is very generic since critical factors and attributes encompass
different SECO contexts according to some participants. However, the idea is that an IT
manager/architect chooses a subset to apply in technology selection rounds, i.e., the list
is flexible enough to have a subset that is suitable for an acquiring organization
regarding its particularities and its SECO context.
At the end, the produced list is an instrument that helped us to develop a solution
approach to support IT management activities, such as IT architecture maintenance
based on technology selection in the SECO platform. That is, technology acquisition in
this study is based on explicit criteria (not only on tacit knowledge).
Therefore, such process might be easier to justify, verify, and replicate in
different technology categories and organizational projects. Those indications are valid
and relevant for the set of participants characterized mostly as expert researchers, and
therefore they are used in the approach, still pending verification with practitioners.
Many participants raised concerns about a critical factor being an attribute of another’s.
To avoid any confusion and keep clear levels (critical factor and attributes), critical
factors that appeared as attributes were eliminated as attributes.
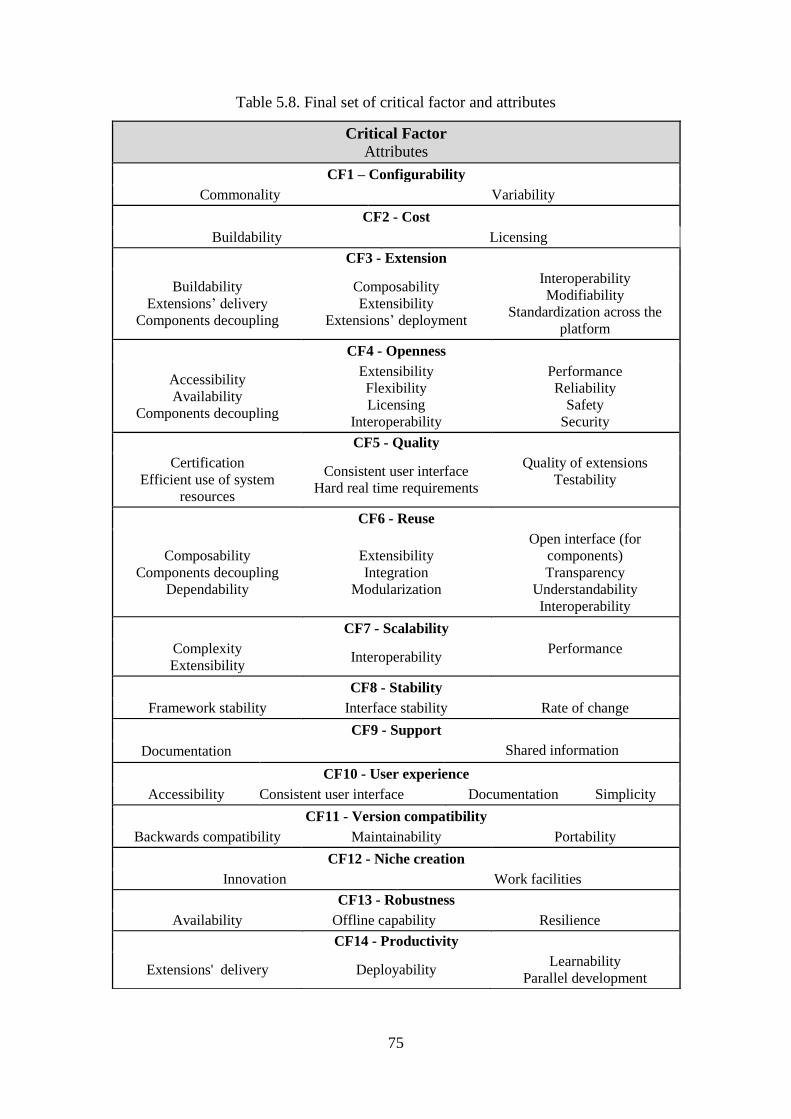
75
Table 5.8. Final set of critical factor and attributes
Critical Factor
Attributes
CF1 – Configurability
Commonality Variability
CF2 - Cost
Buildability Licensing
CF3 - Extension
Buildability
Extensions’ delivery
Components decoupling
Composability
Extensibility
Extensions’ deployment
Interoperability
Modifiability
Standardization across the
platform
CF4 - Openness
Accessibility Availability
Components decoupling
Extensibility Flexibility Licensing
Interoperability
Performance Reliability
Safety Security
CF5 - Quality
Certification Efficient use of system
resources
Consistent user interface Hard real time requirements
Quality of extensions Testability
CF6 - Reuse
Composability
Components decoupling
Dependability
Extensibility
Integration
Modularization
Open interface (for
components)
Transparency
Understandability
Interoperability
CF7 - Scalability
Complexity Extensibility
Interoperability Performance
CF8 - Stability
Framework stability Interface stability Rate of change
CF9 - Support
Documentation Shared information
CF10 - User experience
Accessibility Consistent user interface Documentation Simplicity
CF11 - Version compatibility
Backwards compatibility Maintainability Portability
CF12 - Niche creation
Innovation Work facilities
CF13 - Robustness
Availability Offline capability Resilience
CF14 - Productivity
Extensions' delivery Deployability Learnability
Parallel development
76
Chapter 6 – SECO-AM Approach
The background presented in Chapter 2 and studies described in Chapters 3, 4 and 5
based the definition of an approach for supporting IT architecture maintenance and
analysis of an organization’s ecosystem, named SECO-AM. This chapter describes
SECO-AM and a tool support used for assessing the feasibility of applying the approach
in an industrial scenario (Chapter 7).
6.1 Introduction
Analyzing a SECO network is not trivial, as its relationships are complex and
need balance similarly to natural ecosystems. In addition, it does not have enough
support according to the initial ad hoc literature review (Chapter 2). The information
available to IT managers and architects for making decisions is often tacit knowledge or
data spread through several outdated documents.
Thus, organizing information in a structured base can simplify part of the
technology selection process. It is valuable for IT managers and architects to be able to
understand how their SECO is formed and the relationships among its elements. In
other words, they require information and a visualization model that helps them to
identify connections that they missed in their analysis, e.g., system’s and technology’s
dependencies.
Once IT managers and architects comprehend how their decisions disturb the
ecosystem, they learn lessons to be considered for future decisions. The process of
making the decisions involved in the maintenance of an organization’s IT architecture
can be repeated for other candidates or even other categories, but the process can be
used in other situations as well as the selected criteria. This process of maintaining IT
architecture corresponds to acquire/discontinue/replace a technology. As such, related
data serve for future references, explanations, auditing, and reuse of criteria.
In this context, we developed a solution approach based on the principle that the
selection process data, e.g., users, technologies, categories, and analysis, is already
registered at Brechó-EcoSys platform, including technologies and systems. As
explained in Chapter 3, Brechó-EcoSys platform stores software components and
services, offering features of market platform, e.g., purchase and user profile.
77
Then, the platform was updated with sociotechnical resources, named Brechó-
EcoSys. Those resources provide information about software, communities, and
negotiation rounds. Therefore, the proposed approach is richer when used Brechó-
EcoSys’ resources. Hence, Brechó-EcoSys stores the organization’s information and
technical artifacts from the portfolio; manages SECO's analysis reports; and explores
information for each technology candidate to be discontinued or acquired.
This approach is a ‘second step’, i.e., it applies to IT architecture management
when the candidate technologies are known. Such candidates are compared based on an
analysis performed through Brechó-EcoSys resources and then the SECO is
understandable from exploring a visual support and ecosystem network measures.
This chapter is organized as follows: Section 6.2 describes the research
questions and SECO-AM requirements; Section 6.3 defines the SECO-AM approach
and its elements; Section 6.4 presents a tool support for the main features of SECO-AM;
Section 6.5 discusses the related work and compares them to the requirements defined
at Section 6.2; and Section 6.6 concludes the chapter presenting the main results from
the approach and tool support.
6.2 Research Questions and Requirements
The main goal of this research is to develop a proposal to support an IT
management team in maintaining a SECO platform based on technology selection
decisions and analysis of impacts they have on the organization’s structure and strategy
from the SECO perspective. The following research questions were defined focusing on
that goal and derived from challenges and gaps found in the literature about SECO:
RQ1: How to support IT managers and architects in selecting technologies for
maintaining IT architecture in the SECO context?
RQ2: Can a visual support for analyzing a SECO network help IT managers
and architects to understand what is happening in an ecosystem?
Chapter 3 summarized the main observations from our exploratory studies.
Considering those points, it was possible to extract features that are requirements for
our solution approach.
Information on technology communities’ activities can help IT managers and
architects to make decisions based on how much they would rely on the
community, e.g., if an open-source technology is a candidate for acquisition
78
and IT managers and architects prefers to rely on the community support
rather than buy a support plan, they can choose such technology based on
community activity level.
Requirement #1: (R1) The approach must inform IT managers and architects
about the community activity level, if available;
We observed from the mapping study’s and survey’s results that there is a
lack of architecture criteria to compare candidate solutions for acquisition
(technical perspective). Technical criteria might not be a mandatory condition
since organizations have other concerns, e.g., financial, politics, and
bureaucratic processes. Regardless of any factor, technical criteria are highly
relevant for selecting technologies, since they affect the systems they support.
Requirement #2: (R2) The approach must offer technical criteria regarding
software architecture perspective;
A sociotechnical network can represent a SECO. Its elements can be used to
support demands and solutions analysis (and then technology acquisition).
However, most organizations are not aware of how their decisions affect the
ecosystems they participate.
Requirement #3: (R3) The approach must provide different visualization
perspectives of the ecosystem in which an organization is a keystone,
monitoring its elements, e.g., technologies, systems, analysis; and
Data visualization was a concern in both exploratory studies: it helps an
acquiring organization to be aware of what is going on in negotiations, and
shows trends from a SECO monitoring support. Important network properties
such as hubs, density and connectivity are not available to an organization in
the existing SECO tool support.
Requirement #4: (R4) The approach must support technology centrality
calculation to identify hubs in a SECO as well as provide clustering measures
to have a sense of technology connectivity and ecosystem niches.
The mapping study (Chapter 4) and the survey (Chapter 5) previously described
allowed us to come up with the following requirements:
Requirement #5: (R5) The technology assessment criteria must be assessed
in the perception of IT managers and architects since it is not possible to
always have the criteria quantitative metrics;
79
Requirement #6: (R6) The approach must offer general technology
assessment criteria to be applied in different contexts; and
Requirement #7: (R7) The approach must allow IT managers and architects
to choose the most appropriate technology assessment criteria for their
specific SECO.
6.3 Approach Definition
SECO-AM (Software Ecosystems - Architecture Management) approach has
four main modules for achieving the research goal, as illustrated by Figure 6.1. SECO
Monitoring module is mainly used by IT managers and architects, since they make
decisions using the process modeled in this chapter. However, depending on the
organization IT department structure, one IT manager may use such module and then
the whole team can discuss the results at a meeting (or this task may be delegated to a
trusted IT architecture).
Monitoring consists of keeping analyzing what might affect the SECO status.
Such analysis may be external to the organization, i.e., hired consultants, external
partners or research, and advisory firms that report on IT market (consulting
companies). This type of analysis is covered by SECOGov approach (ALBERT, 2014).
SECOGov aims to support the software asset governance in ecosystems and brought to
Brechó-EcoSys the initial concept of ‘SECO analysis’.
SECO-DSA (SANTOS, 2016) allows visualization of the network before and
after the selection of solutions for the chosen demands. In SECO-AM, we refined this
mechanism by including technology comparison support and registration attached to a
given SECO analysis. The second part is to perform an internal analysis of candidates
for acquisition/ discontinuation, according to IT managers and architects’ interpretation
and perception included as SECO-AM approach feedback.
The specific task of preparing technology assessment criteria and applying them
in some candidates is performed by IT architects. As such, they use Technology
Assessment module to choose a subset of criteria, i.e., critical factors and attributes to
be used in a specific analysis. In other words, IT architects may choose the critical
factors to be considered and then the respective attributes and their weights. As a result,
each technology candidate is assessed regarding the same set of attributes so that IT
architects must insert their perceptions for the set of selected attributes.
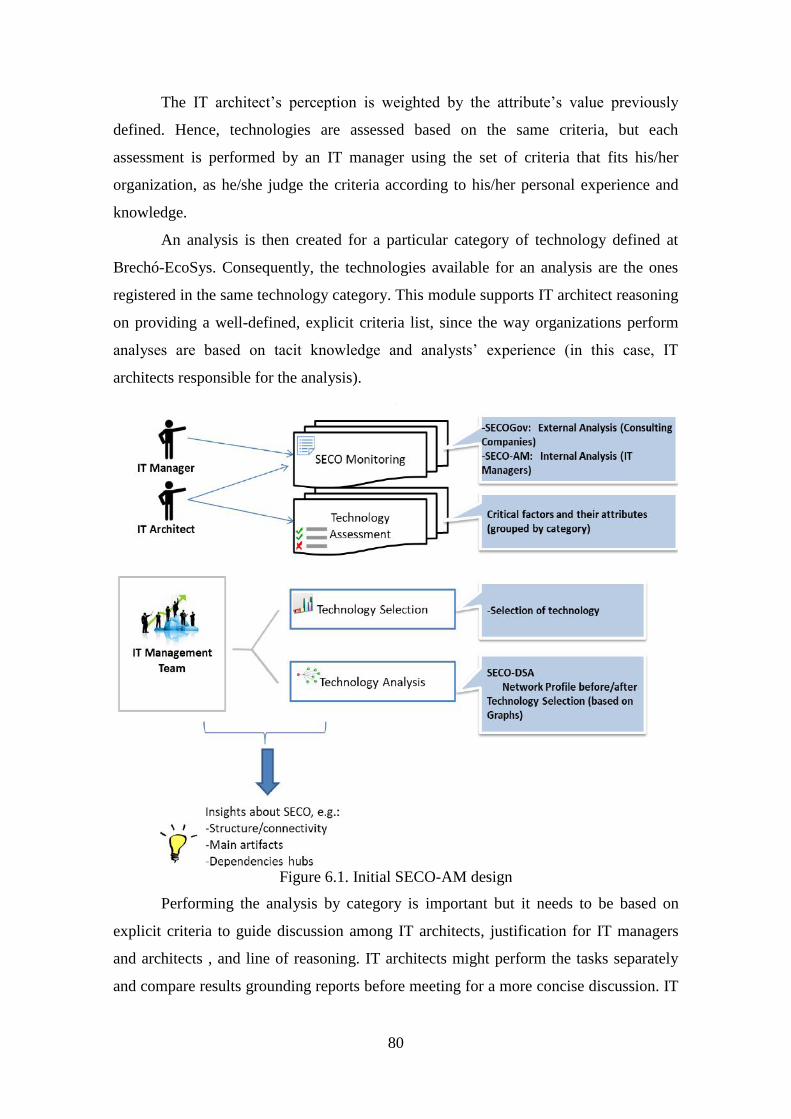
80
The IT architect’s perception is weighted by the attribute’s value previously
defined. Hence, technologies are assessed based on the same criteria, but each
assessment is performed by an IT manager using the set of criteria that fits his/her
organization, as he/she judge the criteria according to his/her personal experience and
knowledge.
An analysis is then created for a particular category of technology defined at
Brechó-EcoSys. Consequently, the technologies available for an analysis are the ones
registered in the same technology category. This module supports IT architect reasoning
on providing a well-defined, explicit criteria list, since the way organizations perform
analyses are based on tacit knowledge and analysts’ experience (in this case, IT
architects responsible for the analysis).
Figure 6.1. Initial SECO-AM design
Performing the analysis by category is important but it needs to be based on
explicit criteria to guide discussion among IT architects, justification for IT managers
and architects , and line of reasoning. IT architects might perform the tasks separately
and compare results grounding reports before meeting for a more concise discussion. IT
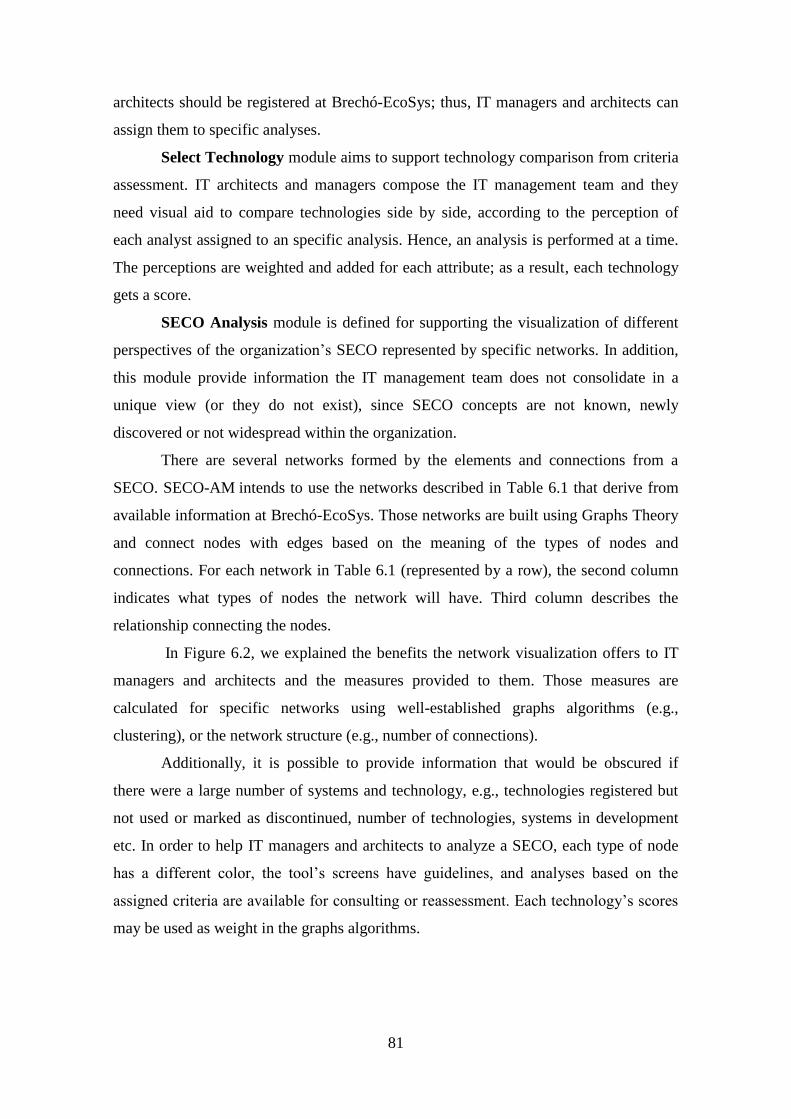
81
architects should be registered at Brechó-EcoSys; thus, IT managers and architects can
assign them to specific analyses.
Select Technology module aims to support technology comparison from criteria
assessment. IT architects and managers compose the IT management team and they
need visual aid to compare technologies side by side, according to the perception of
each analyst assigned to an specific analysis. Hence, an analysis is performed at a time.
The perceptions are weighted and added for each attribute; as a result, each technology
gets a score.
SECO Analysis module is defined for supporting the visualization of different
perspectives of the organization’s SECO represented by specific networks. In addition,
this module provide information the IT management team does not consolidate in a
unique view (or they do not exist), since SECO concepts are not known, newly
discovered or not widespread within the organization.
There are several networks formed by the elements and connections from a
SECO. SECO-AM intends to use the networks described in Table 6.1 that derive from
available information at Brechó-EcoSys. Those networks are built using Graphs Theory
and connect nodes with edges based on the meaning of the types of nodes and
connections. For each network in Table 6.1 (represented by a row), the second column
indicates what types of nodes the network will have. Third column describes the
relationship connecting the nodes.
In Figure 6.2, we explained the benefits the network visualization offers to IT
managers and architects and the measures provided to them. Those measures are
calculated for specific networks using well-established graphs algorithms (e.g.,
clustering), or the network structure (e.g., number of connections).
Additionally, it is possible to provide information that would be obscured if
there were a large number of systems and technology, e.g., technologies registered but
not used or marked as discontinued, number of technologies, systems in development
etc. In order to help IT managers and architects to analyze a SECO, each type of node
has a different color, the tool’s screens have guidelines, and analyses based on the
assigned criteria are available for consulting or reassessment. Each technology’s scores
may be used as weight in the graphs algorithms.
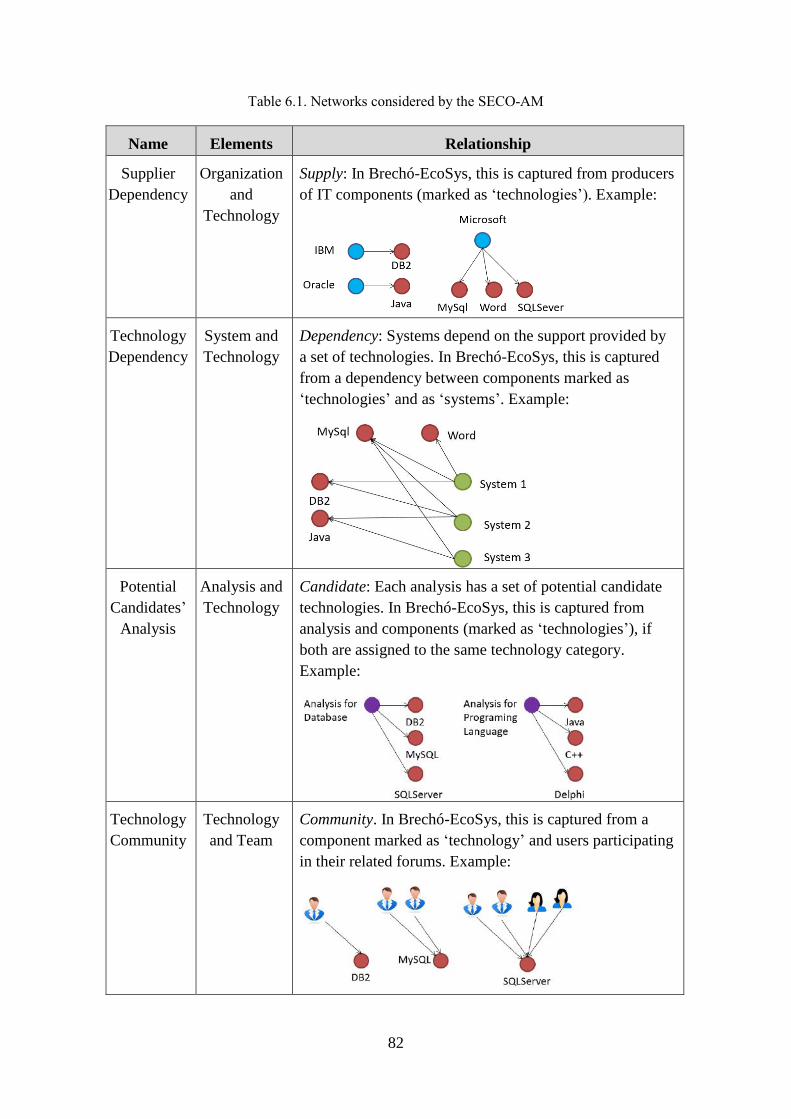
82
Table 6.1. Networks considered by the SECO-AM
Name Elements Relationship
Supplier
Dependency
Organization
and
Technology
Supply: In Brechó-EcoSys, this is captured from producers
of IT components (marked as ‘technologies’). Example:
Technology
Dependency
System and
Technology
Dependency: Systems depend on the support provided by
a set of technologies. In Brechó-EcoSys, this is captured
from a dependency between components marked as
‘technologies’ and as ‘systems’. Example:
Potential
Candidates’
Analysis
Analysis and
Technology
Candidate: Each analysis has a set of potential candidate
technologies. In Brechó-EcoSys, this is captured from
analysis and components (marked as ‘technologies’), if
both are assigned to the same technology category.
Example:
Technology
Community
Technology
and Team
Community. In Brechó-EcoSys, this is captured from a
component marked as ‘technology’ and users participating
in their related forums. Example:

83
Table 6.2. Benefits and metrics
Name Benefits Measures S
up
pli
er D
epen
den
cy
The visualization of this network offers
the capacity to find suppliers that
concentrate most technologies adopted in
the organization’s SECO. Therefore, it is
possible to identify if the organization is
captive of a supplier, or even a supplier
that controls a technology considered as
vital to the ecosystem.
Weighted number of connections: Instead
of having the sum of connections with
each technology, it can be done by the
number of systems they support. Example:
in an organization’s SECO, Microsoft
controls 3 technologies and Oracle 1, but
the 3 Microsoft technologies support 8
systems and Oracle’s supports 10; thus, we
can see such SECO more dependent on
Oracle technology.
Tec
hnolo
gy
Dep
enden
cy
This network shows how dependent on a
technology an organization is according to
the systems it supports. When analyzing
the chance of discontinuing a technology,
the impact on the ecosystem becomes
clear. We can look at how many (and
which) systems will no longer have
support. It also benefits the ecosystem
when looking at replacing technologies.
IT managers and architects can identify
if they can discontinue 2 technologies and
replace them by one that maintains the
systems previously supported by the 2 old
technologies (cost save).
Technology centrality: the HITS algorithm
calculates how central/important a node is
depending on its connections.
Clustering: The clustering algorithm finds
groups in the network. In a network that
connects systems/technologies, the more
groups it has, the more a dependency is
spread through the technologies. If many
groups exist, technology discontinuation
may affect the groups it is part of (and not
hinder others). A group means that it
elements have similarities, similar to the
niche creation concept. The more groups a
SECO has, the more niches it has and then
the more opportunities it offers.
Po
tenti
al C
andid
ates
’
Anal
ysi
s
This network makes clear the options IT
managers and architects have in an
analysis. They may discover if there is a
technology equivalent to a candidate, so
there is no need for acquisition. There is
not explicit knowledge about that before.
-
Tec
hn
olo
gy
Co
mm
un
ity
This network represents the community
around the technology with respect to
external users and internal teams. External
users can be registered in Brechó-EcoSys
to represent users, clients, and teams
characterizing the organization
departments using (or interested in) a
technology.
Community: Number of connections to a
technology. This may indicate the
community size around the node.
Community activity: Number of posts at a
Brechó-EcoSys’s forum for a technology.

84
The activities to select candidate technologies are presented in Figure 6.2. The
process starts in Brechó-EcoSys as the user creates an analysis for a category. To start
the process, it is assumed that Brechó-EcoSys is already configured for an
organization’s SECO, i.e., categories, suppliers, technologies, systems, and
dependencies are already registered at the platform. If an analysis is already registered,
a user can start from the ‘Get information on the candidates in Brechó-EcoSys’ task.
Figure 6.2. Selecting candidate technologies for an analysis
The technology assessment follows the process in Figure 6.3. The user can
select one or many critical factors and it is possible to select one or many attributes
from each critic factor so that the criteria is better suited to the organization's context.
Figure 6.3. Assessing candidate technologies
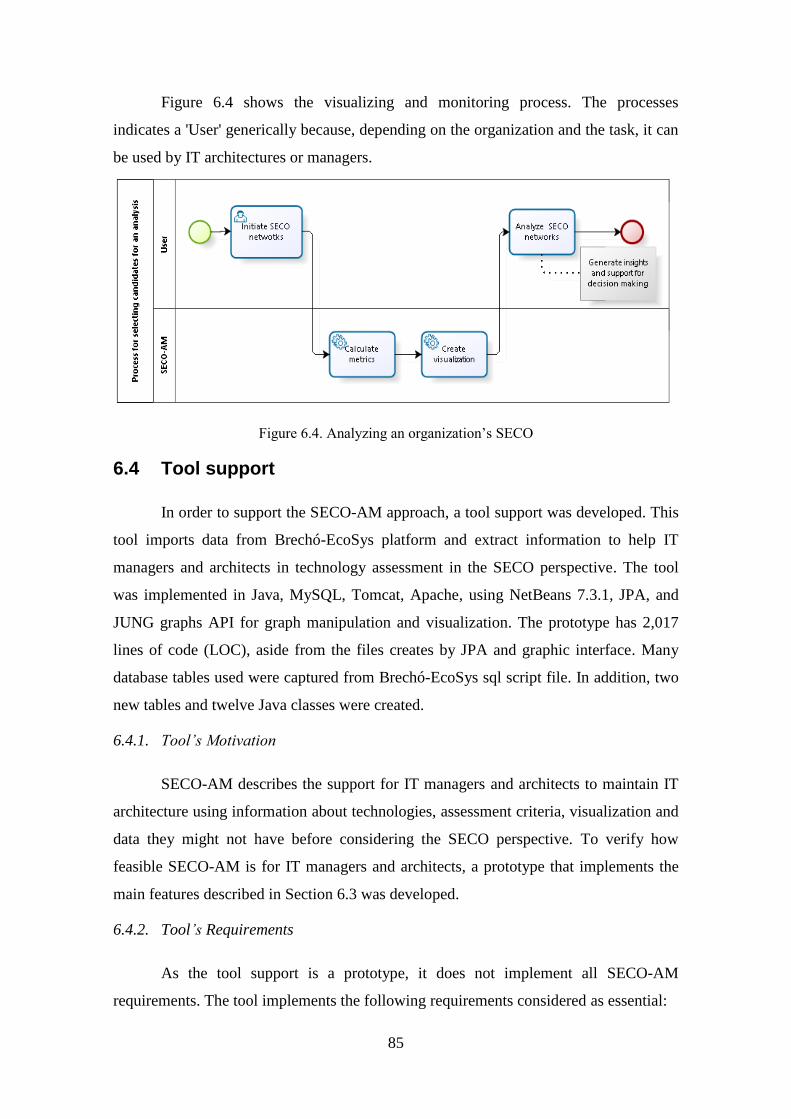
85
Figure 6.4 shows the visualizing and monitoring process. The processes
indicates a 'User' generically because, depending on the organization and the task, it can
be used by IT architectures or managers.
Figure 6.4. Analyzing an organization’s SECO
6.4 Tool support
In order to support the SECO-AM approach, a tool support was developed. This
tool imports data from Brechó-EcoSys platform and extract information to help IT
managers and architects in technology assessment in the SECO perspective. The tool
was implemented in Java, MySQL, Tomcat, Apache, using NetBeans 7.3.1, JPA, and
JUNG graphs API for graph manipulation and visualization. The prototype has 2,017
lines of code (LOC), aside from the files creates by JPA and graphic interface. Many
database tables used were captured from Brechó-EcoSys sql script file. In addition, two
new tables and twelve Java classes were created.
6.4.1. Tool’s Motivation
SECO-AM describes the support for IT managers and architects to maintain IT
architecture using information about technologies, assessment criteria, visualization and
data they might not have before considering the SECO perspective. To verify how
feasible SECO-AM is for IT managers and architects, a prototype that implements the
main features described in Section 6.3 was developed.
6.4.2. Tool’s Requirements
As the tool support is a prototype, it does not implement all SECO-AM
requirements. The tool implements the following requirements considered as essential:

86
(TR1) The tool shall provide a user with analyses previously registered;
(TR2) The tool shall allow a user to select technology candidates to be
assessed according to the analysis category;
(TR3) The tool shall allow a user to choose critical factors for an analysis;
(TR4) The tool shall allow a user to choose attributes for each critical factor
selected for an analysis;
(TR5) The tool shall allow a user to add his/her perception for selected
attributes for each technology candidate and display the final score;
(TR6) The tool shall implement the following SECO networks: Supplier
Dependency, Technology Dependency, and Potential Candidates’ Analysis;
and
(TR7) The tool shall indicate number of technologies, discontinued
technologies, centrality, and clustering measures for Technology
Dependency.
6.4.3. Tool’s Architecture
The tool’s architecture is presented in Figure 6.5. The tool imports data from
Brechó-EcoSys database to perform the main modules implementing the tool’s
requirements.
Figure 6.5. Tool’s overview
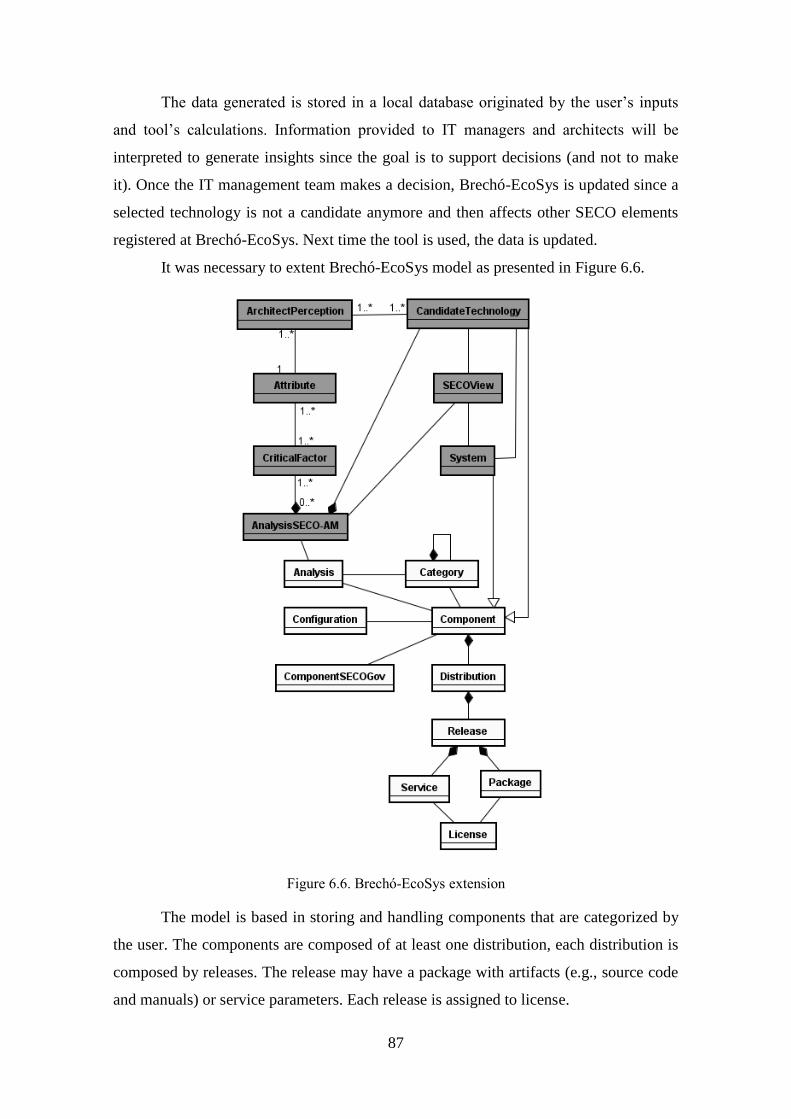
87
The data generated is stored in a local database originated by the user’s inputs
and tool’s calculations. Information provided to IT managers and architects will be
interpreted to generate insights since the goal is to support decisions (and not to make
it). Once the IT management team makes a decision, Brechó-EcoSys is updated since a
selected technology is not a candidate anymore and then affects other SECO elements
registered at Brechó-EcoSys. Next time the tool is used, the data is updated.
It was necessary to extent Brechó-EcoSys model as presented in Figure 6.6.
Figure 6.6. Brechó-EcoSys extension
The model is based in storing and handling components that are categorized by
the user. The components are composed of at least one distribution, each distribution is
composed by releases. The release may have a package with artifacts (e.g., source code
and manuals) or service parameters. Each release is assigned to license.
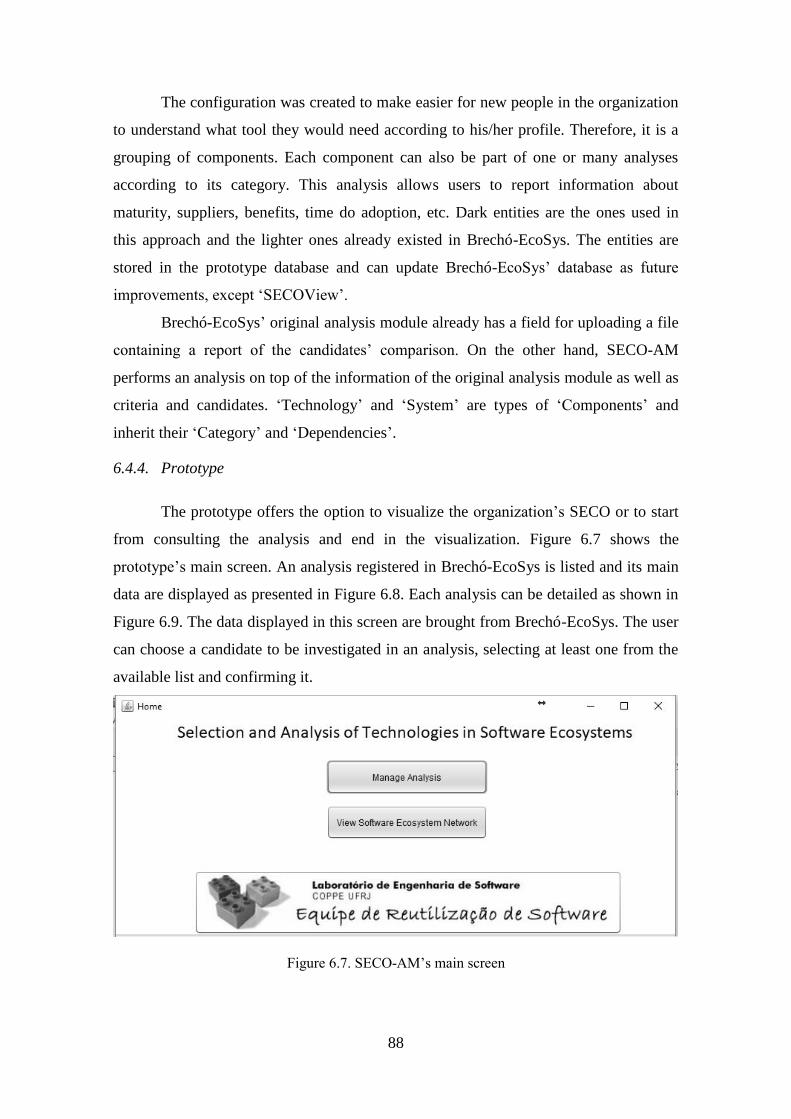
88
The configuration was created to make easier for new people in the organization
to understand what tool they would need according to his/her profile. Therefore, it is a
grouping of components. Each component can also be part of one or many analyses
according to its category. This analysis allows users to report information about
maturity, suppliers, benefits, time do adoption, etc. Dark entities are the ones used in
this approach and the lighter ones already existed in Brechó-EcoSys. The entities are
stored in the prototype database and can update Brechó-EcoSys’ database as future
improvements, except ‘SECOView’.
Brechó-EcoSys’ original analysis module already has a field for uploading a file
containing a report of the candidates’ comparison. On the other hand, SECO-AM
performs an analysis on top of the information of the original analysis module as well as
criteria and candidates. ‘Technology’ and ‘System’ are types of ‘Components’ and
inherit their ‘Category’ and ‘Dependencies’.
6.4.4. Prototype
The prototype offers the option to visualize the organization’s SECO or to start
from consulting the analysis and end in the visualization. Figure 6.7 shows the
prototype’s main screen. An analysis registered in Brechó-EcoSys is listed and its main
data are displayed as presented in Figure 6.8. Each analysis can be detailed as shown in
Figure 6.9. The data displayed in this screen are brought from Brechó-EcoSys. The user
can choose a candidate to be investigated in an analysis, selecting at least one from the
available list and confirming it.
Figure 6.7. SECO-AM’s main screen
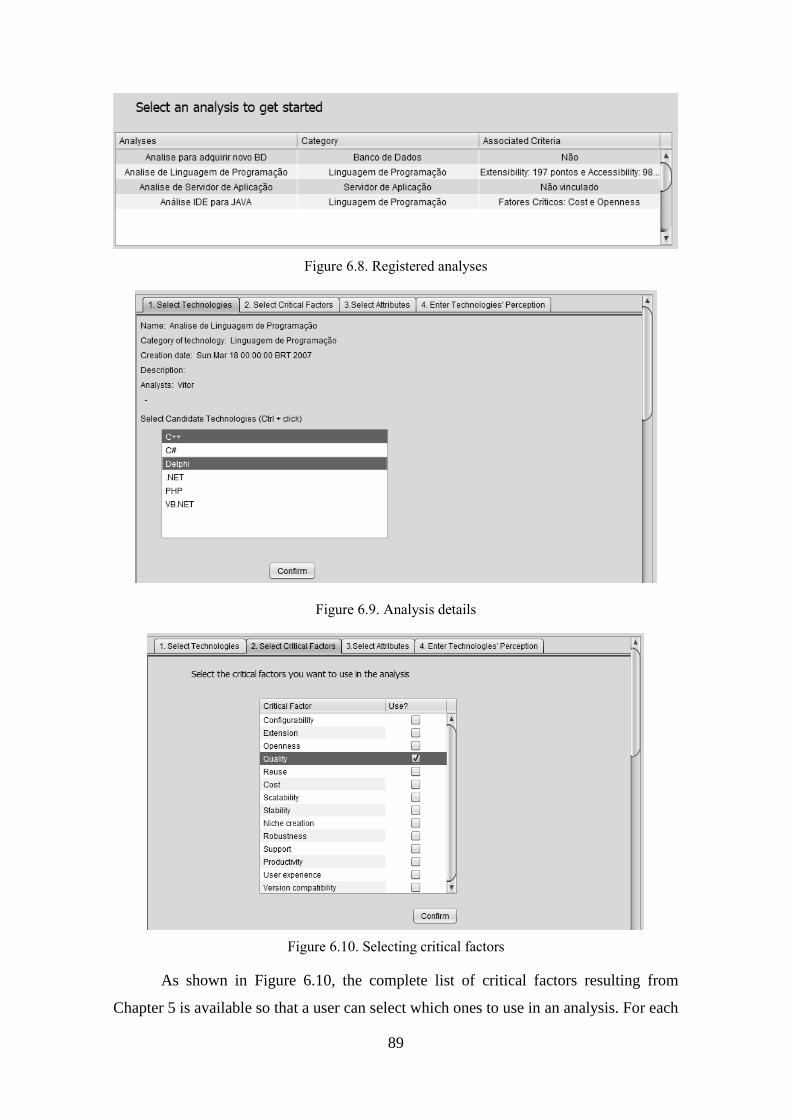
89
Figure 6.8. Registered analyses
Figure 6.9. Analysis details
Figure 6.10. Selecting critical factors
As shown in Figure 6.10, the complete list of critical factors resulting from
Chapter 5 is available so that a user can select which ones to use in an analysis. For each
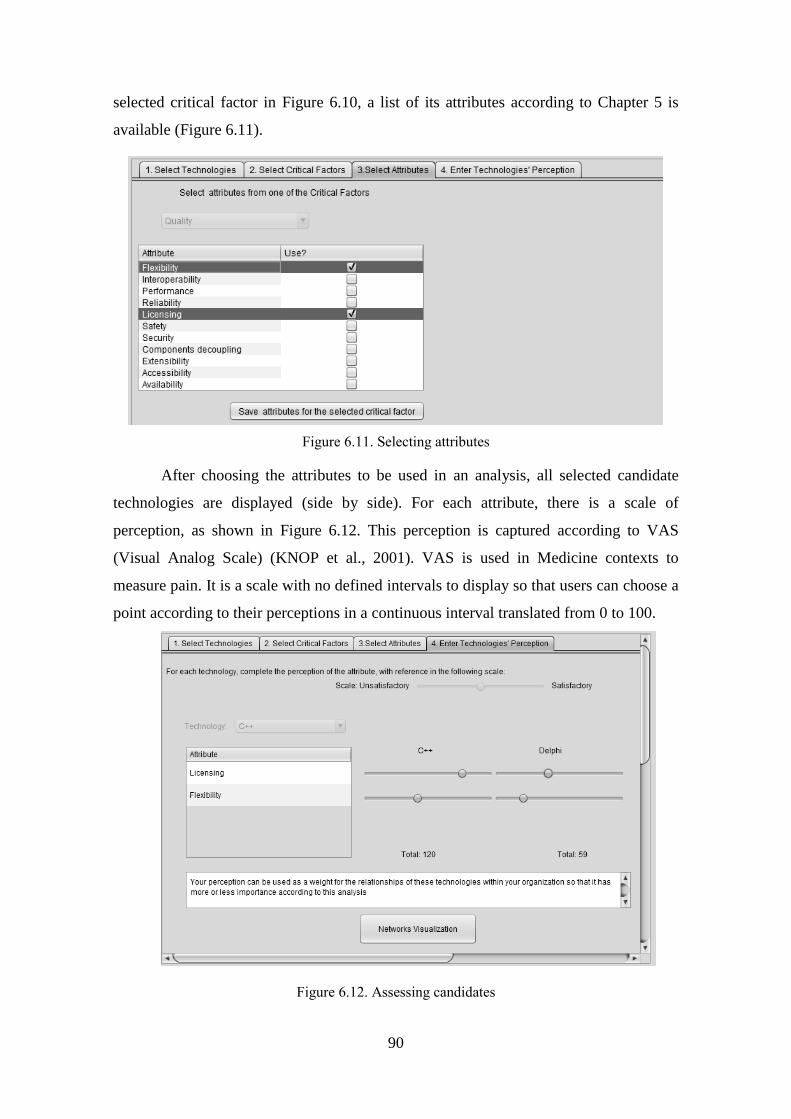
90
selected critical factor in Figure 6.10, a list of its attributes according to Chapter 5 is
available (Figure 6.11).
Figure 6.11. Selecting attributes
After choosing the attributes to be used in an analysis, all selected candidate
technologies are displayed (side by side). For each attribute, there is a scale of
perception, as shown in Figure 6.12. This perception is captured according to VAS
(Visual Analog Scale) (KNOP et al., 2001). VAS is used in Medicine contexts to
measure pain. It is a scale with no defined intervals to display so that users can choose a
point according to their perceptions in a continuous interval translated from 0 to 100.
Figure 6.12. Assessing candidates

91
SECO-AM’s prototype uses this scale to capture how satisfactory a candidate
technology is considering each attribute. The technology perception scale goes from 0
(unsatisfactory) to 100 (satisfactory). Each perception adds a value to the final score for
each candidate technology. As such, IT managers and architects can easily compare
technologies and then ground their discussion so that a consensus can be reached based
on technical analysis. The next step is to visualize the organization’s SECO including
the relationships the candidate technologies would have to complement the comparison,
not only comparing them with each other, but also observing their interaction with the
organization’s systems.
There is a tool’s screen for each network and a side panel to display a brief
textual help. This panel (Figure 6.13) explains what each network means and how it was
built. Some information is indicated since it could be lost in the network: number of
technologies, systems in development, and discontinued technologies, as they may be
analyzed differently. The centrality measure is relative to the Technology Dependency
network (it denotes how important a technology is). The selected graphs algorithm was
HITS8 because it assigns hub’s and authority’s scores for each node and the results are
influenced by the network topology.
Figure 6.13. Side panel for SECO indicatons
8 HITS algorithm description. Available at:
http://jung.sourceforge.net/doc/api/edu/uci/ics/jung/algorithms/scorin
g/HITS.html

92
The calculation results in two measures; we use ‘h’ metric provided by the
graphs API as a metric of how central is a node compared to the others in the same
network. This metric is normalized by the maximum hub value (maximum h) found
among the nodes results, so it means how central a technology is relatively to others in
the network. The more connections it has, the more central (hub) it is. The niche
creation tab calculates the number of clusters in the Technology dependency network
and the number of clusters if a specific candidate is removed from the SECO. That
helps an analysis for discontinuation, since the manager knows how the SECO
topology/niches may change if a candidate is removed.
Figure 6.14. Supplier Dependency network
The three networks SECO-AM’s prototype implements are illustrated in Figure
6.14 (Supplier Dependency), Figure 6.15 (Technology Dependency), and Figure 6.16
(Potential Candidates’ Analysis). The side panel is always shown to users and also
displays used colors (and what they represent).
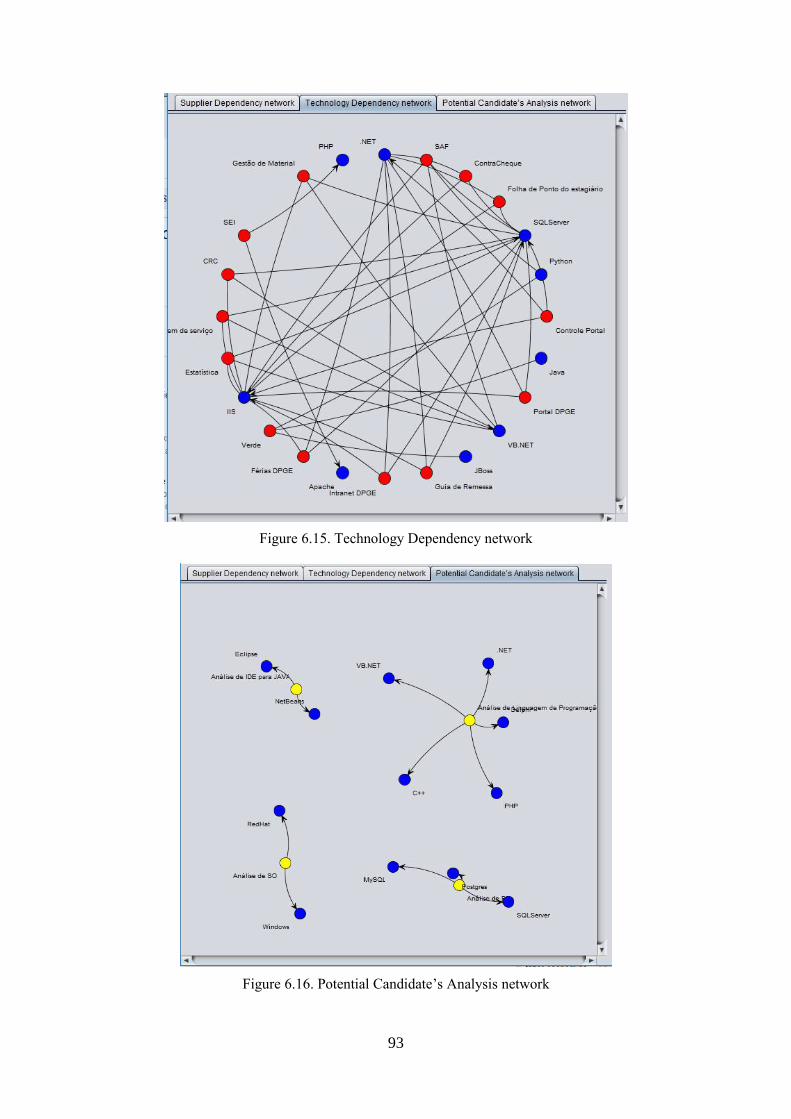
93
Figure 6.15. Technology Dependency network
Figure 6.16. Potential Candidate’s Analysis network

94
6.4.5. Discussion
During the prototype development, some improvements were uncovered and
planned for a next release, e.g., visually differentiate edges thickness according to the
type of technology (if it is candidate or not), and display more information about the
node when clicking on it.
Although we did not implement ‘Community’ network in this prototype, other
networks show potentials for making visible the overall SECO elements and its
connections. Those connections were registered at Brechó-EcoSys; however, they were
not easily analyzed in the previous version of the platform. Positive and negative points
are indicated in Figure 6.17, as well as opportunities for improvement, based on SWOT
matrix (Hill & Westbrook, 1997).
Figure 6.17. SWOT matrix
6.5 Related Work
As a result of the initial literature review and the studies performed in the
previous chapters, some related work could be mentioned aiming to compare the SECO-
AM with the existing work found in the SECO literature. Each work is described and
then compared regarding the existence of features SECO-AM offers and those ones the
related work provides, indicating Y=Yes, N=No, P=Partially.
BOUCHARAS et al. (2009) aimed at modeling software products and SECO
elements formally using UML metamodeling (Software Ecosystems Modeling – SEM).
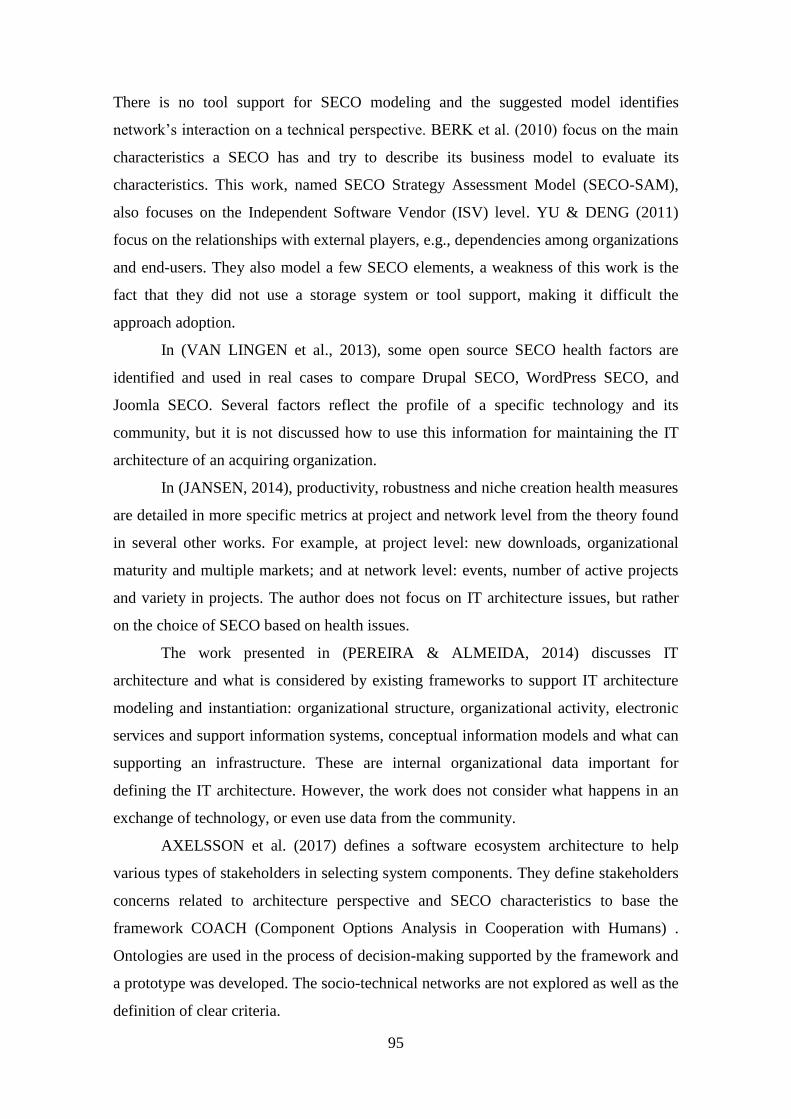
95
There is no tool support for SECO modeling and the suggested model identifies
network’s interaction on a technical perspective. BERK et al. (2010) focus on the main
characteristics a SECO has and try to describe its business model to evaluate its
characteristics. This work, named SECO Strategy Assessment Model (SECO-SAM),
also focuses on the Independent Software Vendor (ISV) level. YU & DENG (2011)
focus on the relationships with external players, e.g., dependencies among organizations
and end-users. They also model a few SECO elements, a weakness of this work is the
fact that they did not use a storage system or tool support, making it difficult the
approach adoption.
In (VAN LINGEN et al., 2013), some open source SECO health factors are
identified and used in real cases to compare Drupal SECO, WordPress SECO, and
Joomla SECO. Several factors reflect the profile of a specific technology and its
community, but it is not discussed how to use this information for maintaining the IT
architecture of an acquiring organization.
In (JANSEN, 2014), productivity, robustness and niche creation health measures
are detailed in more specific metrics at project and network level from the theory found
in several other works. For example, at project level: new downloads, organizational
maturity and multiple markets; and at network level: events, number of active projects
and variety in projects. The author does not focus on IT architecture issues, but rather
on the choice of SECO based on health issues.
The work presented in (PEREIRA & ALMEIDA, 2014) discusses IT
architecture and what is considered by existing frameworks to support IT architecture
modeling and instantiation: organizational structure, organizational activity, electronic
services and support information systems, conceptual information models and what can
supporting an infrastructure. These are internal organizational data important for
defining the IT architecture. However, the work does not consider what happens in an
exchange of technology, or even use data from the community.
AXELSSON et al. (2017) defines a software ecosystem architecture to help
various types of stakeholders in selecting system components. They define stakeholders
concerns related to architecture perspective and SECO characteristics to base the
framework COACH (Component Options Analysis in Cooperation with Humans) .
Ontologies are used in the process of decision-making supported by the framework and
a prototype was developed. The socio-technical networks are not explored as well as the
definition of clear criteria.
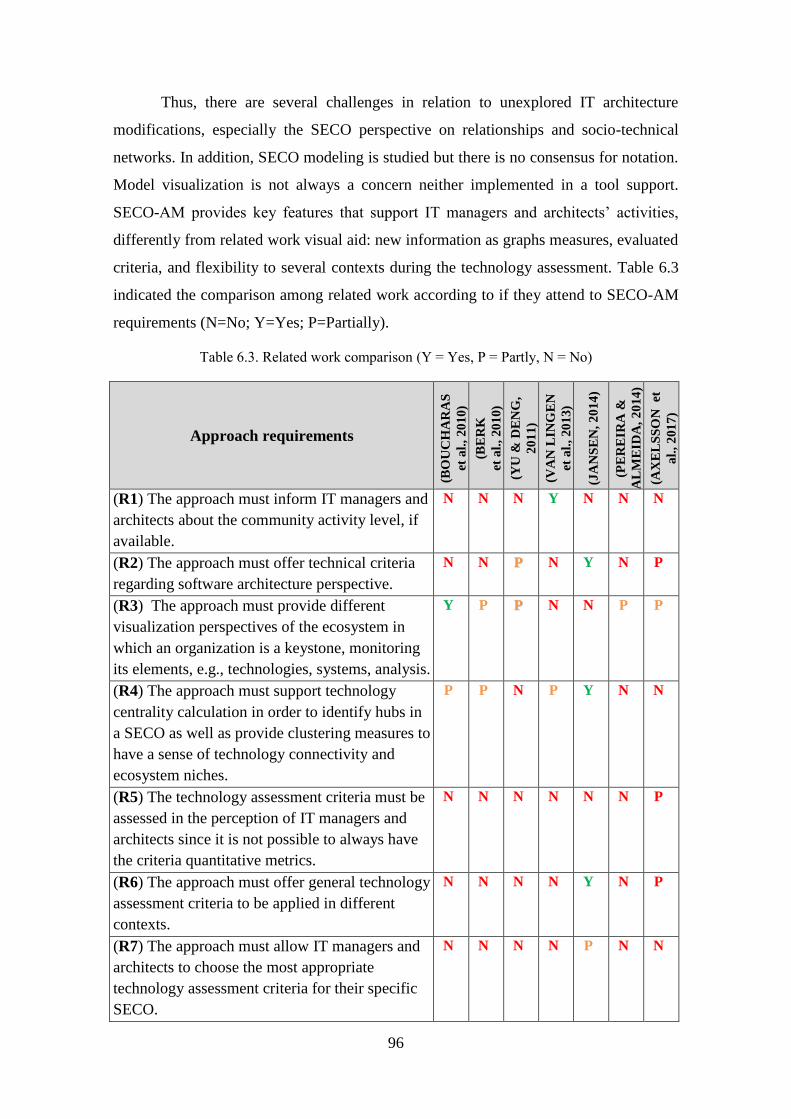
96
Thus, there are several challenges in relation to unexplored IT architecture
modifications, especially the SECO perspective on relationships and socio-technical
networks. In addition, SECO modeling is studied but there is no consensus for notation.
Model visualization is not always a concern neither implemented in a tool support.
SECO-AM provides key features that support IT managers and architects’ activities,
differently from related work visual aid: new information as graphs measures, evaluated
criteria, and flexibility to several contexts during the technology assessment. Table 6.3
indicated the comparison among related work according to if they attend to SECO-AM
requirements (N=No; Y=Yes; P=Partially).
Table 6.3. Related work comparison (Y = Yes, P = Partly, N = No)
Approach requirements (B
OU
CH
AR
AS
et a
l.,
20
10)
(BE
RK
et a
l.,
20
10)
(YU
& D
EN
G,
20
11)
(VA
N L
ING
EN
et a
l.,
20
13)
(JA
NS
EN
, 2
01
4)
(PE
RE
IRA
&
AL
ME
IDA
, 2
01
4)
(AX
EL
SS
ON
et
al.
, 2
01
7)
(R1) The approach must inform IT managers and
architects about the community activity level, if
available.
N N N Y N N N
(R2) The approach must offer technical criteria
regarding software architecture perspective.
N N PP N Y N P
(R3) The approach must provide different
visualization perspectives of the ecosystem in
which an organization is a keystone, monitoring
its elements, e.g., technologies, systems, analysis.
Y P PP N N P P
(R4) The approach must support technology
centrality calculation in order to identify hubs in
a SECO as well as provide clustering measures to
have a sense of technology connectivity and
ecosystem niches.
P P N P Y N N
(R5) The technology assessment criteria must be
assessed in the perception of IT managers and
architects since it is not possible to always have
the criteria quantitative metrics.
N N N N N N P
(R6) The approach must offer general technology
assessment criteria to be applied in different
contexts.
N N N N Y N P
(R7) The approach must allow IT managers and
architects to choose the most appropriate
technology assessment criteria for their specific
SECO.
N N N N P N N

97
6.6 Conclusion
In this chapter, SECO-AM approach was presented. It aims to support IT
managers and architects on maintaining IT architecture, considering the affect the
decision making has over the organization’s SECO. Chapter 3 resulted in some features
that are not deeply explored in the literature but has potential to aid decision making,
e.g., visualization of SECO elements and connections, sociotechnical networks
measures, and defined assessment criteria. The approach described in this chapter
contemplates some of those features and uses the assessment criteria from Chapter 5 as
starting point, so that IT managers and architects can select the most appropriate ones
according to their organization’s context and needs.
SECO-AM defines some networks involving technical elements (technology,
analysis, and systems) and social (suppliers, users, and teams). Moreover, some
measures can be calculated using Graphs Theory so that new information on the SECO
can be uncovered. The main features were implemented in a SECO-AM’s prototype as
a proof of concept. The prototype implements the analysis process, visualization of
three types of SECO networks, and some measure support. Although it is a first version,
the prototype has potential to support the approach features as discussed in Chapter 7.
In order to evaluate SECO-AM feasibility, the prototype was used in a real case
scenario to collect practitioners’ opinions. The data of an organization’s IT architecture
portfolio were registered and technology assessment and SECO analysis processes were
studied through the execution of tasks with and without the tool support. Such study has
the intention to capture indications if the tasks are better performed with the tool
support.
98
Chapter 7 – Evaluation
Chapter 6 defined the approach for aiding IT managers and architects to maintain IT
architecture based on the SECO perspective and described a prototype that implements
the main features identified in our studies. In order to assess the approach’s main
features, a feasibility study was conducted using the prototype in a concrete industry
scenario. This chapter describes its planning, execution, and results.
7.1 Introduction
The purpose of this study is to assess the feasibility of SECO-AM approach in
the opinion of industry experts (practitioners as IT managers and architects, or even
other stakeholders) who are responsible for maintaining IT architecture in the
organization’s SECO. The type of company on which this approach focuses is a
software acquiring organization. To support their main objectives/processes, such
organizations rely on technologies to support the systems on which they are based on,
even if the organization’s business is not software, e.g., an organization whose main
goal is to sell books through an online website also acquires technologies to support its
systems.
For evaluation, we used an organization’s database in which the application
portfolio is registered, as well as management of its technologies. Section 7.2 describes
the feasibility study steps and instruments. In Section 7.3, it is presented a pilot
execution to capture adjustments from a user outside the research context, simulating
the invited participants. The execution with eight participants is described in Section
7.4. Analysis of the participants' information is discussed in Section 7.5. Results of all
questions and comments are listed in Section 7.6. Section 7.7 identifies some threats to
validity. Section 7.8 gathers the main results and contributions.
7.2 Feasibility Study
7.2.1. Planning
This section describes how the evaluation was planned based on a previous
feasibility study (SANTOS, 2016). This study is an initial evaluation of SECO-AM in
the perspectives of its utility and ease of use based on TAM Model. TAM Model
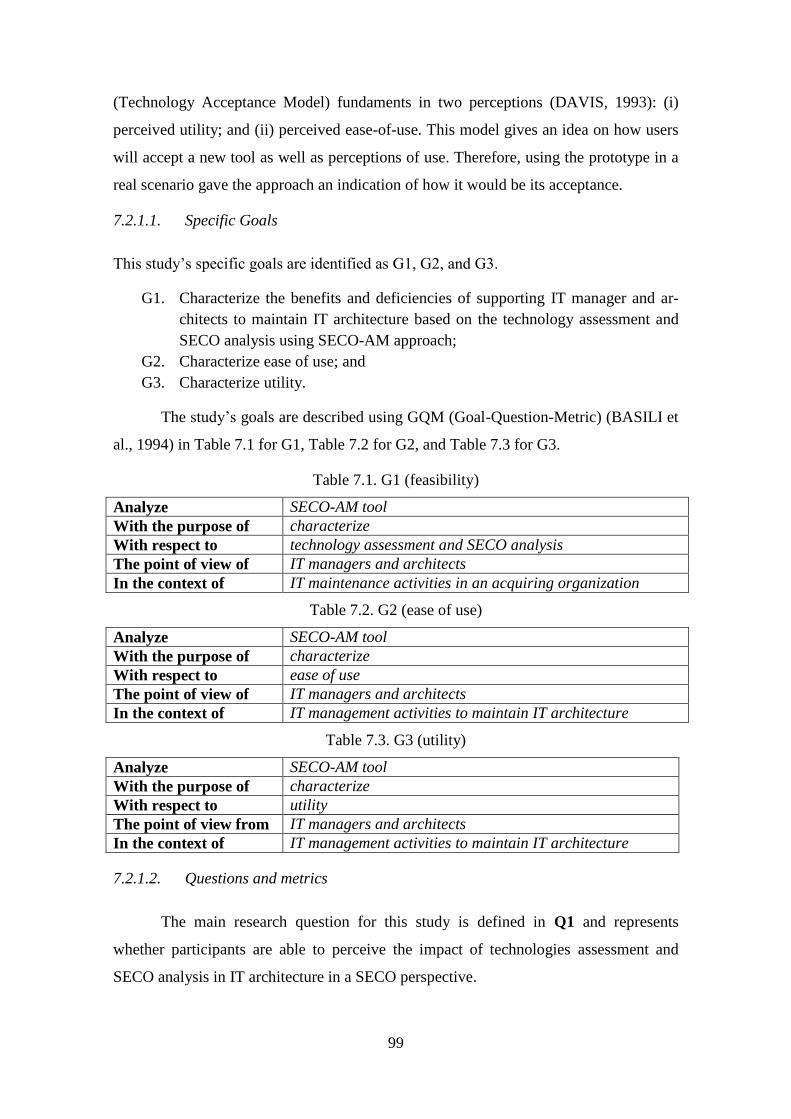
99
(Technology Acceptance Model) fundaments in two perceptions (DAVIS, 1993): (i)
perceived utility; and (ii) perceived ease-of-use. This model gives an idea on how users
will accept a new tool as well as perceptions of use. Therefore, using the prototype in a
real scenario gave the approach an indication of how it would be its acceptance.
7.2.1.1. Specific Goals
This study’s specific goals are identified as G1, G2, and G3.
G1. Characterize the benefits and deficiencies of supporting IT manager and ar-
chitects to maintain IT architecture based on the technology assessment and
SECO analysis using SECO-AM approach;
G2. Characterize ease of use; and
G3. Characterize utility.
The study’s goals are described using GQM (Goal-Question-Metric) (BASILI et
al., 1994) in Table 7.1 for G1, Table 7.2 for G2, and Table 7.3 for G3.
Table 7.1. G1 (feasibility)
Analyze SECO-AM tool
With the purpose of characterize
With respect to technology assessment and SECO analysis
The point of view of IT managers and architects
In the context of IT maintenance activities in an acquiring organization
Table 7.2. G2 (ease of use)
Analyze SECO-AM tool
With the purpose of characterize
With respect to ease of use
The point of view of IT managers and architects
In the context of IT management activities to maintain IT architecture
Table 7.3. G3 (utility)
Analyze SECO-AM tool
With the purpose of characterize
With respect to utility
The point of view from IT managers and architects
In the context of IT management activities to maintain IT architecture
7.2.1.2. Questions and metrics
The main research question for this study is defined in Q1 and represents
whether participants are able to perceive the impact of technologies assessment and
SECO analysis in IT architecture in a SECO perspective.
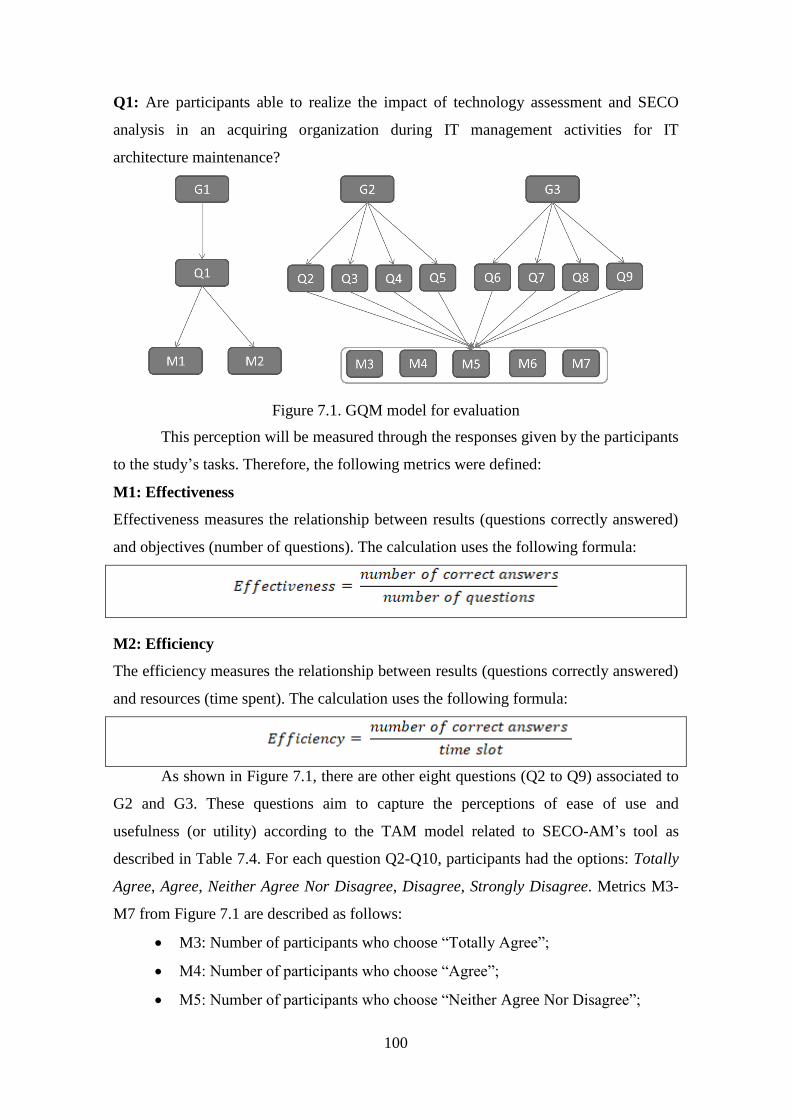
100
Q1: Are participants able to realize the impact of technology assessment and SECO
analysis in an acquiring organization during IT management activities for IT
architecture maintenance?
Figure 7.1. GQM model for evaluation
This perception will be measured through the responses given by the participants
to the study’s tasks. Therefore, the following metrics were defined:
M1: Effectiveness
Effectiveness measures the relationship between results (questions correctly answered)
and objectives (number of questions). The calculation uses the following formula:
M2: Efficiency
The efficiency measures the relationship between results (questions correctly answered)
and resources (time spent). The calculation uses the following formula:
As shown in Figure 7.1, there are other eight questions (Q2 to Q9) associated to
G2 and G3. These questions aim to capture the perceptions of ease of use and
usefulness (or utility) according to the TAM model related to SECO-AM’s tool as
described in Table 7.4. For each question Q2-Q10, participants had the options: Totally
Agree, Agree, Neither Agree Nor Disagree, Disagree, Strongly Disagree. Metrics M3-
M7 from Figure 7.1 are described as follows:
M3: Number of participants who choose “Totally Agree”;
M4: Number of participants who choose “Agree”;
M5: Number of participants who choose “Neither Agree Nor Disagree”;
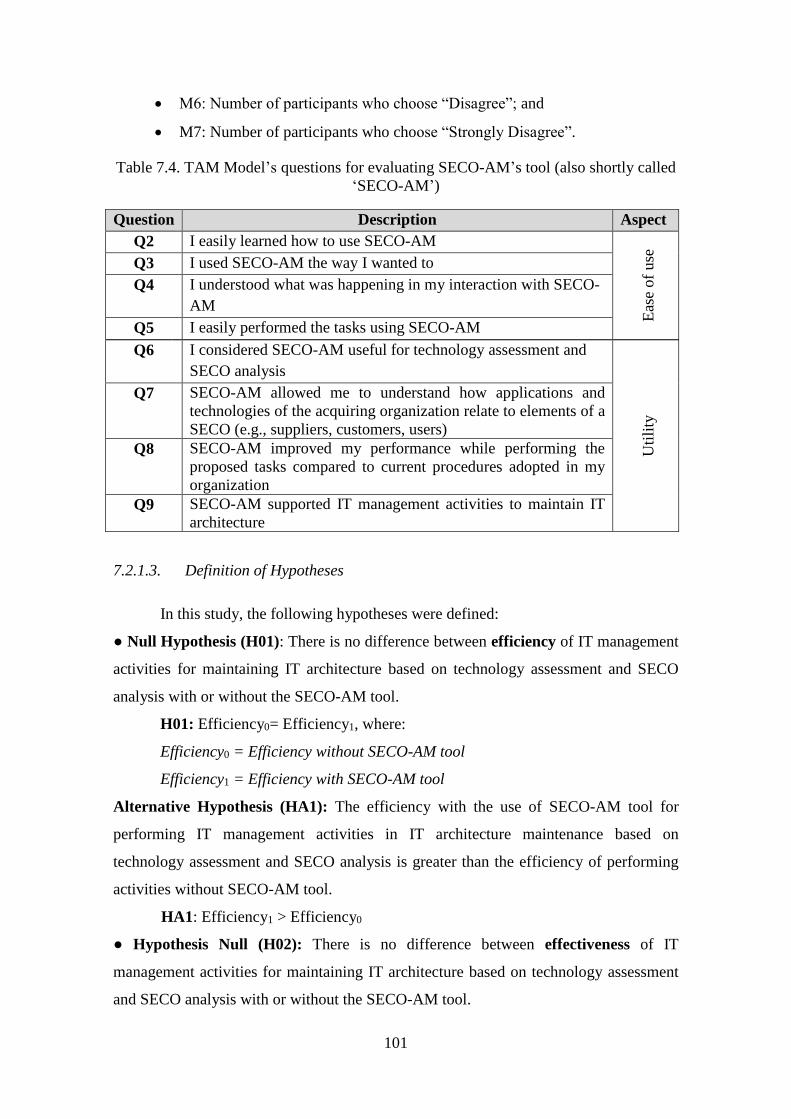
101
M6: Number of participants who choose “Disagree”; and
M7: Number of participants who choose “Strongly Disagree”.
Table 7.4. TAM Model’s questions for evaluating SECO-AM’s tool (also shortly called
‘SECO-AM’)
7.2.1.3. Definition of Hypotheses
In this study, the following hypotheses were defined:
● Null Hypothesis (H01): There is no difference between efficiency of IT management
activities for maintaining IT architecture based on technology assessment and SECO
analysis with or without the SECO-AM tool.
H01: Efficiency0= Efficiency1, where:
Efficiency0 = Efficiency without SECO-AM tool
Efficiency1 = Efficiency with SECO-AM tool
Alternative Hypothesis (HA1): The efficiency with the use of SECO-AM tool for
performing IT management activities in IT architecture maintenance based on
technology assessment and SECO analysis is greater than the efficiency of performing
activities without SECO-AM tool.
HA1: Efficiency1 > Efficiency0
● Hypothesis Null (H02): There is no difference between effectiveness of IT
management activities for maintaining IT architecture based on technology assessment
and SECO analysis with or without the SECO-AM tool.
Question Description Aspect
Q2 I easily learned how to use SECO-AM
Eas
e of
use
Q3 I used SECO-AM the way I wanted to
Q4 I understood what was happening in my interaction with SECO-
AM
Q5 I easily performed the tasks using SECO-AM
Q6 I considered SECO-AM useful for technology assessment and
SECO analysis
Uti
lity
Q7 SECO-AM allowed me to understand how applications and
technologies of the acquiring organization relate to elements of a
SECO (e.g., suppliers, customers, users)
Q8 SECO-AM improved my performance while performing the
proposed tasks compared to current procedures adopted in my
organization
Q9 SECO-AM supported IT management activities to maintain IT
architecture
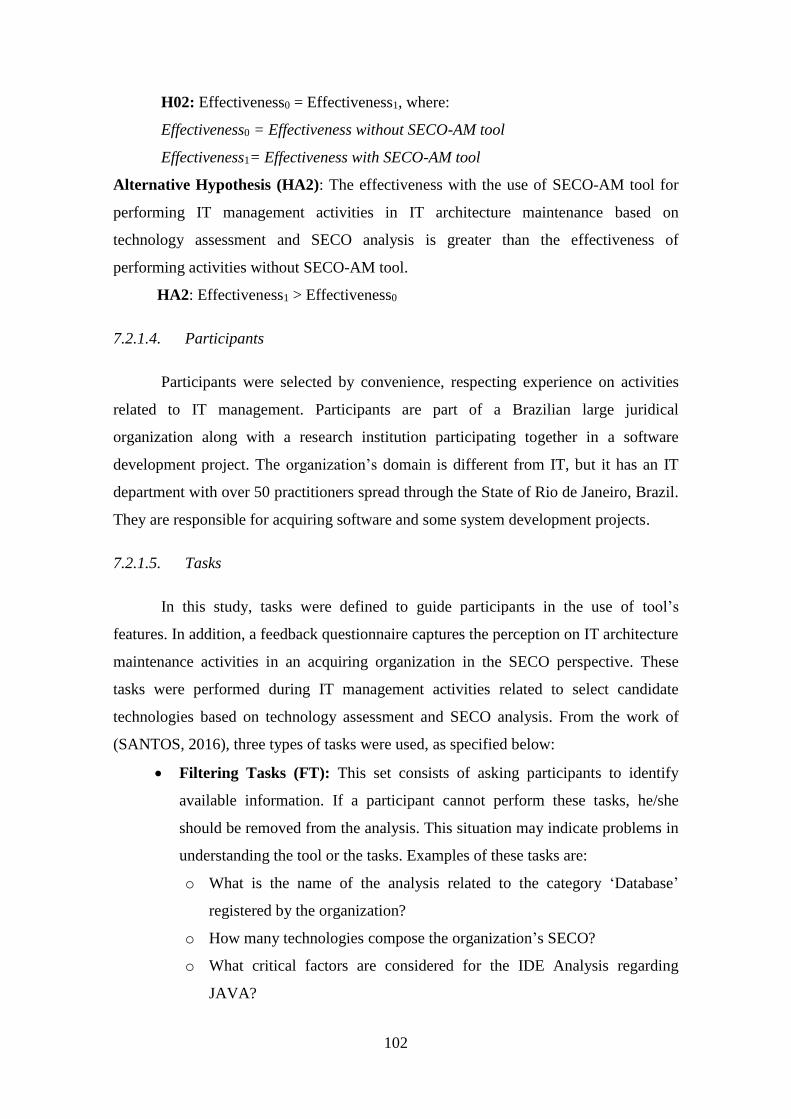
102
H02: Effectiveness0 = Effectiveness1, where:
Effectiveness0 = Effectiveness without SECO-AM tool
Effectiveness1= Effectiveness with SECO-AM tool
Alternative Hypothesis (HA2): The effectiveness with the use of SECO-AM tool for
performing IT management activities in IT architecture maintenance based on
technology assessment and SECO analysis is greater than the effectiveness of
performing activities without SECO-AM tool.
HA2: Effectiveness1 > Effectiveness0
7.2.1.4. Participants
Participants were selected by convenience, respecting experience on activities
related to IT management. Participants are part of a Brazilian large juridical
organization along with a research institution participating together in a software
development project. The organization’s domain is different from IT, but it has an IT
department with over 50 practitioners spread through the State of Rio de Janeiro, Brazil.
They are responsible for acquiring software and some system development projects.
7.2.1.5. Tasks
In this study, tasks were defined to guide participants in the use of tool’s
features. In addition, a feedback questionnaire captures the perception on IT architecture
maintenance activities in an acquiring organization in the SECO perspective. These
tasks were performed during IT management activities related to select candidate
technologies based on technology assessment and SECO analysis. From the work of
(SANTOS, 2016), three types of tasks were used, as specified below:
Filtering Tasks (FT): This set consists of asking participants to identify
available information. If a participant cannot perform these tasks, he/she
should be removed from the analysis. This situation may indicate problems in
understanding the tool or the tasks. Examples of these tasks are:
o What is the name of the analysis related to the category ‘Database’
registered by the organization?
o How many technologies compose the organization’s SECO?
o What critical factors are considered for the IDE Analysis regarding
JAVA?
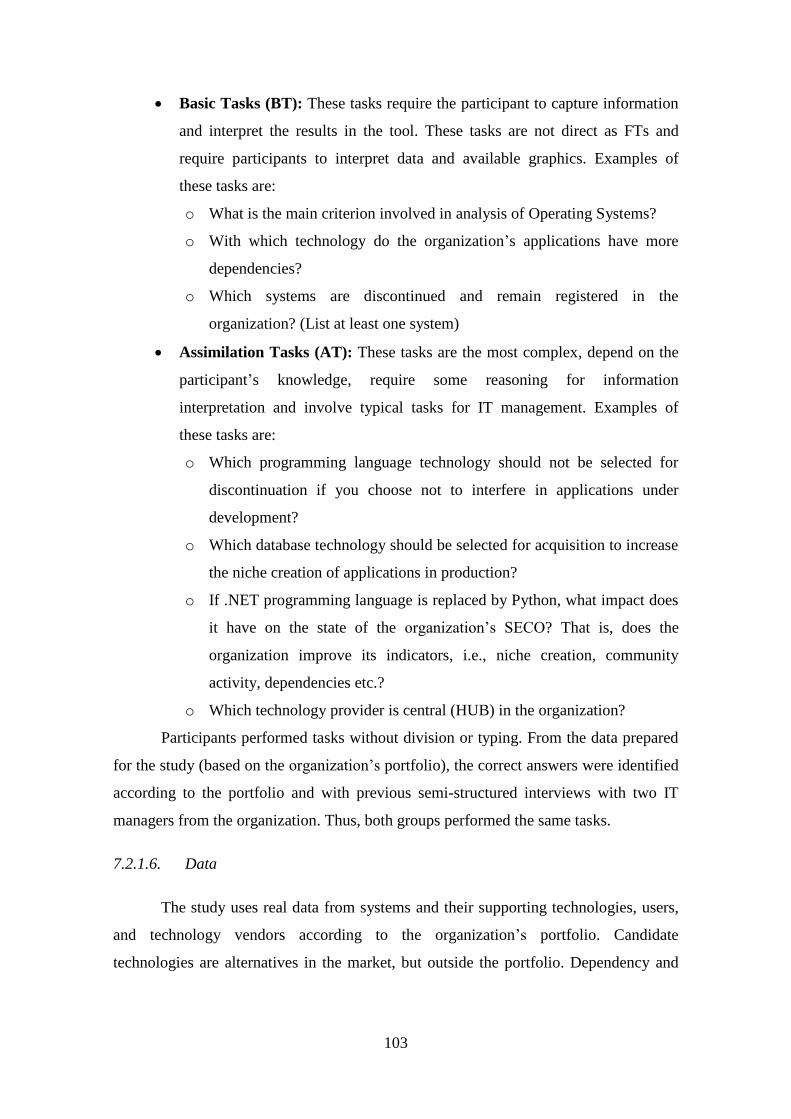
103
Basic Tasks (BT): These tasks require the participant to capture information
and interpret the results in the tool. These tasks are not direct as FTs and
require participants to interpret data and available graphics. Examples of
these tasks are:
o What is the main criterion involved in analysis of Operating Systems?
o With which technology do the organization’s applications have more
dependencies?
o Which systems are discontinued and remain registered in the
organization? (List at least one system)
Assimilation Tasks (AT): These tasks are the most complex, depend on the
participant’s knowledge, require some reasoning for information
interpretation and involve typical tasks for IT management. Examples of
these tasks are:
o Which programming language technology should not be selected for
discontinuation if you choose not to interfere in applications under
development?
o Which database technology should be selected for acquisition to increase
the niche creation of applications in production?
o If .NET programming language is replaced by Python, what impact does
it have on the state of the organization’s SECO? That is, does the
organization improve its indicators, i.e., niche creation, community
activity, dependencies etc.?
o Which technology provider is central (HUB) in the organization?
Participants performed tasks without division or typing. From the data prepared
for the study (based on the organization’s portfolio), the correct answers were identified
according to the portfolio and with previous semi-structured interviews with two IT
managers from the organization. Thus, both groups performed the same tasks.
7.2.1.6. Data
The study uses real data from systems and their supporting technologies, users,
and technology vendors according to the organization’s portfolio. Candidate
technologies are alternatives in the market, but outside the portfolio. Dependency and
104
production relationships were extracted from the portfolio. From the organization
portfolio, we extracted the following data for the study (type and quantity):
Systems: 14;
Technologies: 10;
Analysis: 4; and
Suppliers: 5.
7.2.1.7. Groups
With the intention of better understanding the influence of SECO-AM in IT
management activities, two groups were used to compare results. First group responded
to the tasks performing the activities as they carry out in their organization, and second
group using the tool support that implements SECO-AM. Participants answered a
characterization form and were ranked according to the sum of their IT management
experience and academic background score. As such, two groups with similar profiles
were created to minimize the influence of a participant’s profile in a group. Participants
ordered as even numbers were Group 1 (without tool) and the odd ones formed Group 2
(with tool).
Participants informed their experience in IT management activities in number of
years and months. Academic background could be selected from the following options,
with the corresponding scores:
8: Post-Doctorate;
7: PhD completed;
6: PhD in progress;
5: Master degree completed;
4: Master in progress;
3: Specialization completed;
2: Specialization in progress;
1: Bachelor completed; and
0: Bachelor in progress.
Each group had four participants and performed the same set of tasks with the
differentiation of the use of the tool by one group. The group that did not use the tool
performed the tasks as they use to do and with sources of information that participants
105
already had, mainly the organization’s portfolio. They should also describe how they
would obtain the information and the correct answer for each task.
7.2.1.8. Variables
In the study, there are independent and dependent variables. Independent
variables indicate study points that may influence the results; presenting the cause of the
interference (they may obscure causes of observed effects). Dependent variables
represent the result of the experimentation process (TRAVASSOS et al., 2002). These
variables are relative to the study’s objectives and observations.
The independent variables in the study are:
The tool used to support IT management activities in IT architecture
maintenance based on technology assessment and SECO analysis. This
variable can represent two treatments: (i) the use of SECO-AM tool; (ii) the
use of typical IT management tools.
The dependent variables are:
Number of correct answers for each participant; and
Time spent to perform the proposed tasks.
7.2.1.9. Instruments and Preparation
This section defines which resources were used during the evaluation and how
the evaluation was prepared. For this study, six main instruments have been designed
and can be fully verified in the Appendices (in Portuguese):
Informed consent form (see Appendix IV);
Participant characterization form (see Appendix V);
Theoretical background on SECO (see Appendix VI);
Instructions for use of SECO-AM tool (see Appendix VII);
Form for conducting the study (tasks) (see Appendix VIII); and
Study evaluation questionnaire (feedback) (see Appendix IX).
The first instrument ensures the consent of a participant to use the collected data
anonymously and confidentially. Previously to the study execution, a participant
responded to the characterization form used to compose the groups. SECO concepts
were briefly introduced for each participant (both groups). For Group 2, it was
106
presented how SECO-AM tool works; a guide for the necessary steps was available at
any time during the study.
The form containing the set of tasks and spaces for answers to collect the results
was another document. Both the researcher and the participant captured the period from
the first question in this form until the end of the last question. After completing all the
tasks, each participant responded to the study evaluation questionnaire to obtain
impressions, suggestions and other information from the participant’s perception.
7.3 Pilot
A postdoc researcher on Software Engineering at Reuse Software Lab
(COPPE/UFRJ, Brazil) conducted a trial as pilot in January 2018. This pilot aimed to
identify flaws at the questionnaires and tool’s interface. This execution followed the
planning for the group using the tool and all corresponding forms were analyzed so that
the tasks and explanations could be calibrated.
The pilot used the tool with a subset of the final data from the real scenario.
Since the participant is not part of a software organization, it was not asked to perform
the tasks as the group without the tool would. In the characterization form, the
participant informed to have 25 years of experience on IT and architecture activities.
The participant received a verbal explanation about SECO, the research goals and the
tool tutorial. In total, 10 minutes were spent for this phase. Then, the participant
performed the tasks in 22 minutes and scoring 8 out of 10 points.
The participant informed in the feedback questionnaire that he/she was able to
perform all tasks and was satisfied with the results. The biggest difficulties informed
was the understanding of new concepts coming from SECO field and SECO-AM tool,
and not being able to explore the tool for a longer period. The visualization of
dependencies was the strongest point.
There are suggestions referred to better explain SECO-AM concepts and goals;
and inform (in the tool’s screens) what is happening and the connection between the
analysis’ feature and SECO visualization. Those suggestions were added in the tool by
showing explanations for each SECO visualization and giving examples of the new
concepts.

107
7.4 Execution
Some adjustments were made according to the observations from the experience
with the pilot and received feedback. The main execution happened between January
29th, 2018 and February 1st, 2018. The execution was individual. Each group had four
participants, half of them were from the acquiring organization, and half from the
institution that works in a software development project for that same organization. A
few days before the study, as the invitees accepted to participate, they were asked to
answer the characterization form (online questionnaire), so that they could be separated
in two groups as balanced as possible considering experience/academic background.
Both groups were asked to sign a term of consent and received training on
SECO for an average of 7 minutes with the support of a presentation document. The
training duration varied according to the participant’s questions to the researcher, since
they did not know SECO concepts and the fact that their organization was part of a
SECO. G1 (without the tool) proceeded to the tasks and G2 (with the tool) received a
tutorial (see Appendix VII) spending about 8 minutes before starting the tasks.
For G1, it was provided the organization’s portfolio to make sure that they were
looking at the same version made available to the study. They were at their stations at
the organization and had access to any other document they could, but they did not look
for any extra document but the given portfolio. They said that they did not have many
records on IT management activities related to adopted technologies or IT architecture.
7.5 Analysis
This section summarizes the collected data and analyzes them considering the
participant’s profile and their answers to the questionnaire.
7.5.1. Participant’s Profile
Each participant was asked about his/her academic background and time of
experience on IT management activities. Participants are diverse in their background:
G1 had two specializations completed, one master degree completed and one PhD in
progress; and G2 has one master in progress, one bachelor in progress, one
specialization completed, and one specialization in progress. The differences between
the groups were balanced by the experience (time).
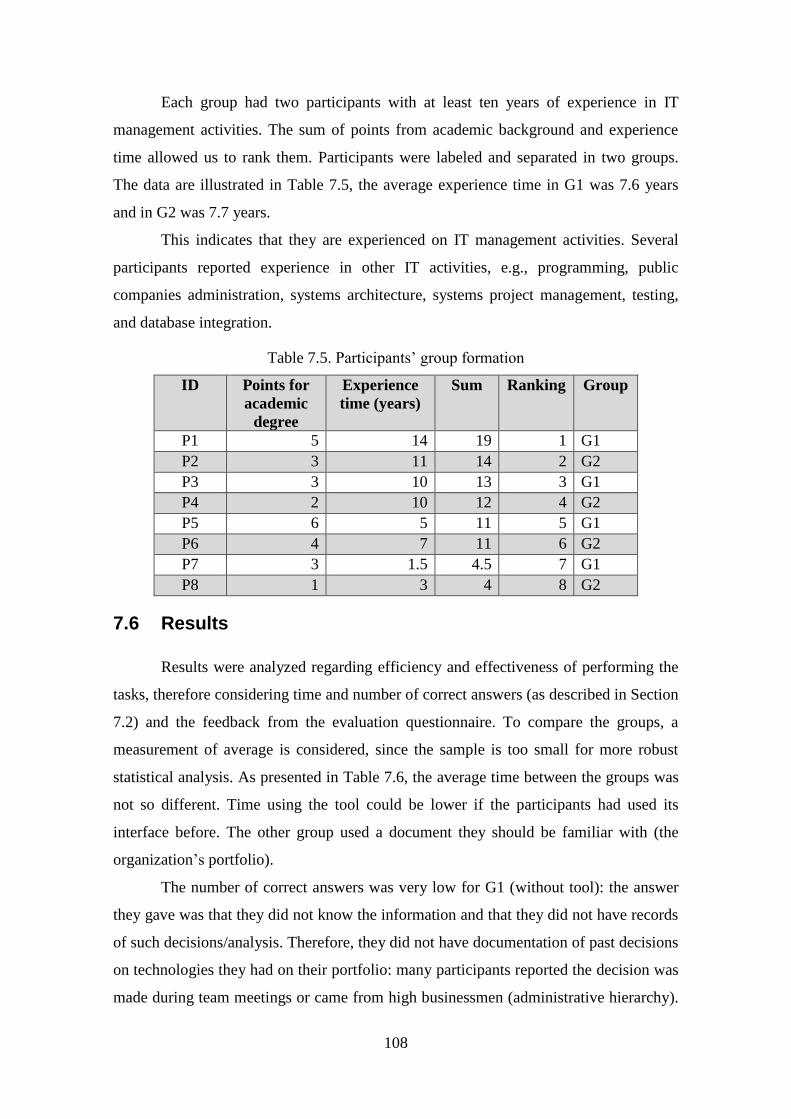
108
Each group had two participants with at least ten years of experience in IT
management activities. The sum of points from academic background and experience
time allowed us to rank them. Participants were labeled and separated in two groups.
The data are illustrated in Table 7.5, the average experience time in G1 was 7.6 years
and in G2 was 7.7 years.
This indicates that they are experienced on IT management activities. Several
participants reported experience in other IT activities, e.g., programming, public
companies administration, systems architecture, systems project management, testing,
and database integration.
Table 7.5. Participants’ group formation
ID Points for
academic
degree
Experience
time (years)
Sum Ranking Group
P1 5 14 19 1 G1
P2 3 11 14 2 G2
P3 3 10 13 3 G1
P4 2 10 12 4 G2
P5 6 5 11 5 G1
P6 4 7 11 6 G2
P7 3 1.5 4.5 7 G1
P8 1 3 4 8 G2
7.6 Results
Results were analyzed regarding efficiency and effectiveness of performing the
tasks, therefore considering time and number of correct answers (as described in Section
7.2) and the feedback from the evaluation questionnaire. To compare the groups, a
measurement of average is considered, since the sample is too small for more robust
statistical analysis. As presented in Table 7.6, the average time between the groups was
not so different. Time using the tool could be lower if the participants had used its
interface before. The other group used a document they should be familiar with (the
organization’s portfolio).
The number of correct answers was very low for G1 (without tool): the answer
they gave was that they did not know the information and that they did not have records
of such decisions/analysis. Therefore, they did not have documentation of past decisions
on technologies they had on their portfolio: many participants reported the decision was
made during team meetings or came from high businessmen (administrative hierarchy).
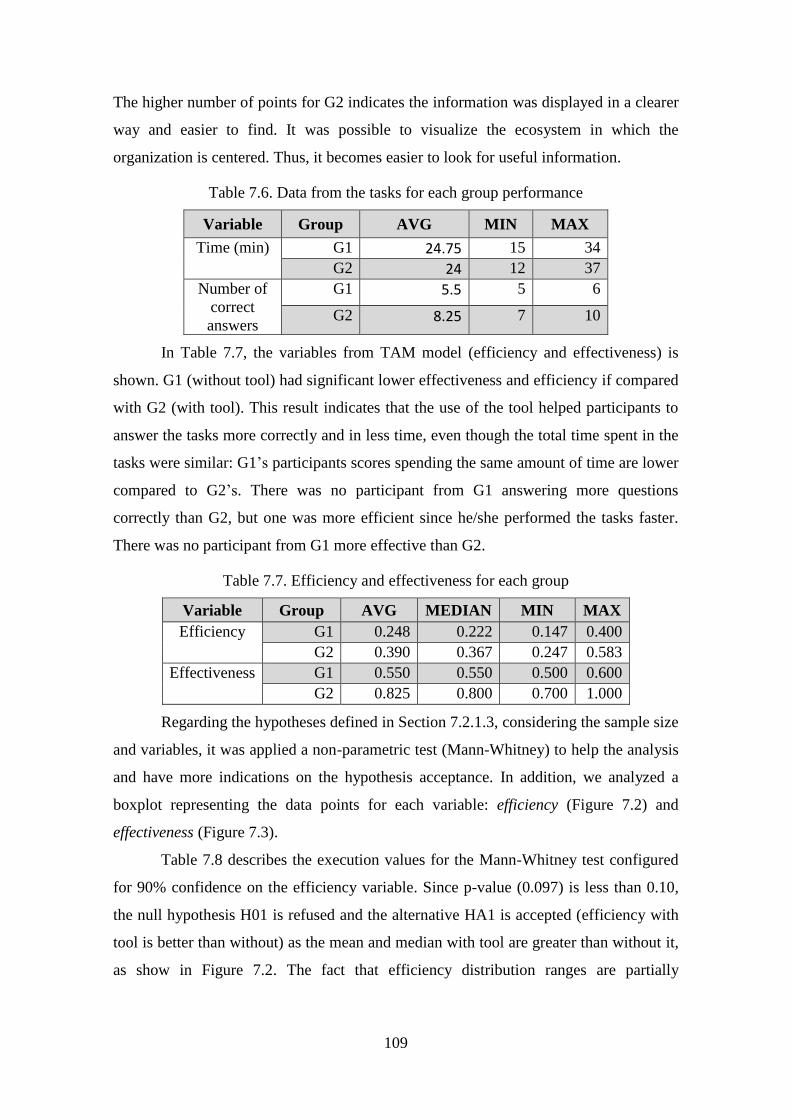
109
The higher number of points for G2 indicates the information was displayed in a clearer
way and easier to find. It was possible to visualize the ecosystem in which the
organization is centered. Thus, it becomes easier to look for useful information.
Table 7.6. Data from the tasks for each group performance
Variable Group AVG MIN MAX
Time (min) G1 24.75 15 34
G2 24 12 37
Number of
correct
answers
G1 5.5 5 6
G2 8.25 7 10
In Table 7.7, the variables from TAM model (efficiency and effectiveness) is
shown. G1 (without tool) had significant lower effectiveness and efficiency if compared
with G2 (with tool). This result indicates that the use of the tool helped participants to
answer the tasks more correctly and in less time, even though the total time spent in the
tasks were similar: G1’s participants scores spending the same amount of time are lower
compared to G2’s. There was no participant from G1 answering more questions
correctly than G2, but one was more efficient since he/she performed the tasks faster.
There was no participant from G1 more effective than G2.
Table 7.7. Efficiency and effectiveness for each group
Variable Group AVG MEDIAN MIN MAX
Efficiency G1 0.248 0.222 0.147 0.400
G2 0.390 0.367 0.247 0.583
Effectiveness G1 0.550 0.550 0.500 0.600
G2 0.825 0.800 0.700 1.000
Regarding the hypotheses defined in Section 7.2.1.3, considering the sample size
and variables, it was applied a non-parametric test (Mann-Whitney) to help the analysis
and have more indications on the hypothesis acceptance. In addition, we analyzed a
boxplot representing the data points for each variable: efficiency (Figure 7.2) and
effectiveness (Figure 7.3).
Table 7.8 describes the execution values for the Mann-Whitney test configured
for 90% confidence on the efficiency variable. Since p-value (0.097) is less than 0.10,
the null hypothesis H01 is refused and the alternative HA1 is accepted (efficiency with
tool is better than without) as the mean and median with tool are greater than without it,
as show in Figure 7.2. The fact that efficiency distribution ranges are partially
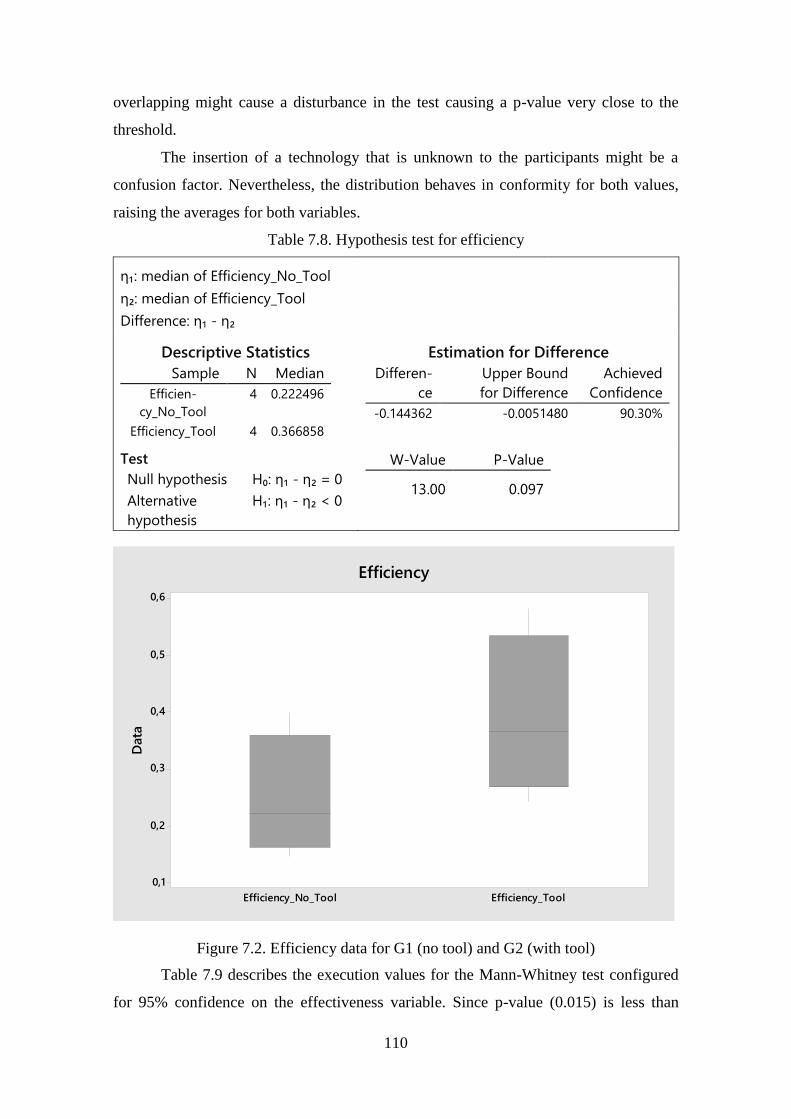
110
overlapping might cause a disturbance in the test causing a p-value very close to the
threshold.
The insertion of a technology that is unknown to the participants might be a
confusion factor. Nevertheless, the distribution behaves in conformity for both values,
raising the averages for both variables.
Table 7.8. Hypothesis test for efficiency
η₁: median of Efficiency_No_Tool
η₂: median of Efficiency_Tool
Difference: η₁ - η₂
Descriptive Statistics
Sample N Median
Efficien-
cy_No_Tool
4 0.222496
Efficiency_Tool 4 0.366858
Estimation for Difference
Differen-
ce
Upper Bound
for Difference
Achieved
Confidence
-0.144362 -0.0051480 90.30%
Test
Null hypothesis H₀: η₁ - η₂ = 0
Alternative
hypothesis
H₁: η₁ - η₂ < 0
W-Value P-Value
13.00 0.097
Efficiency_ToolEfficiency_No_Tool
0,6
0,5
0,4
0,3
0,2
0,1
Data
Efficiency
Figure 7.2. Efficiency data for G1 (no tool) and G2 (with tool)
Table 7.9 describes the execution values for the Mann-Whitney test configured
for 95% confidence on the effectiveness variable. Since p-value (0.015) is less than
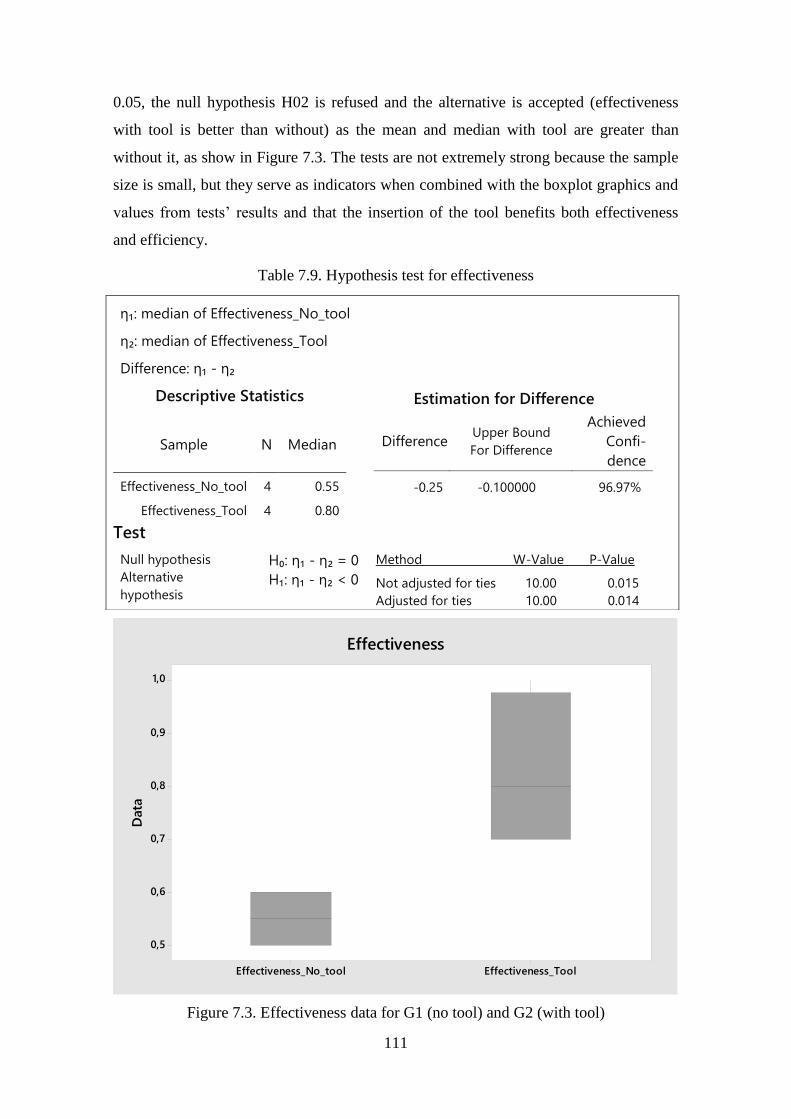
111
0.05, the null hypothesis H02 is refused and the alternative is accepted (effectiveness
with tool is better than without) as the mean and median with tool are greater than
without it, as show in Figure 7.3. The tests are not extremely strong because the sample
size is small, but they serve as indicators when combined with the boxplot graphics and
values from tests’ results and that the insertion of the tool benefits both effectiveness
and efficiency.
Table 7.9. Hypothesis test for effectiveness
Effectiveness_ToolEffectiveness_No_tool
1,0
0,9
0,8
0,7
0,6
0,5
Data
Effectiveness
Figure 7.3. Effectiveness data for G1 (no tool) and G2 (with tool)
η₁: median of Effectiveness_No_tool
η₂: median of Effectiveness_Tool
Difference: η₁ - η₂
Descriptive Statistics Estimation for Difference
Sample N Median Difference Upper Bound
For Difference
Achieved
Confi-
dence
Effectiveness_No_tool 4 0.55 -0.25 -0.100000 96.97%
Effectiveness_Tool 4 0.80
Test
Null hypothesis
Alternative
hypothesis
H₀: η₁ - η₂ = 0
H₁: η₁ - η₂ < 0
Method W-Value P-Value
Not adjusted for ties 10.00 0.015
Adjusted for ties 10.00 0.014
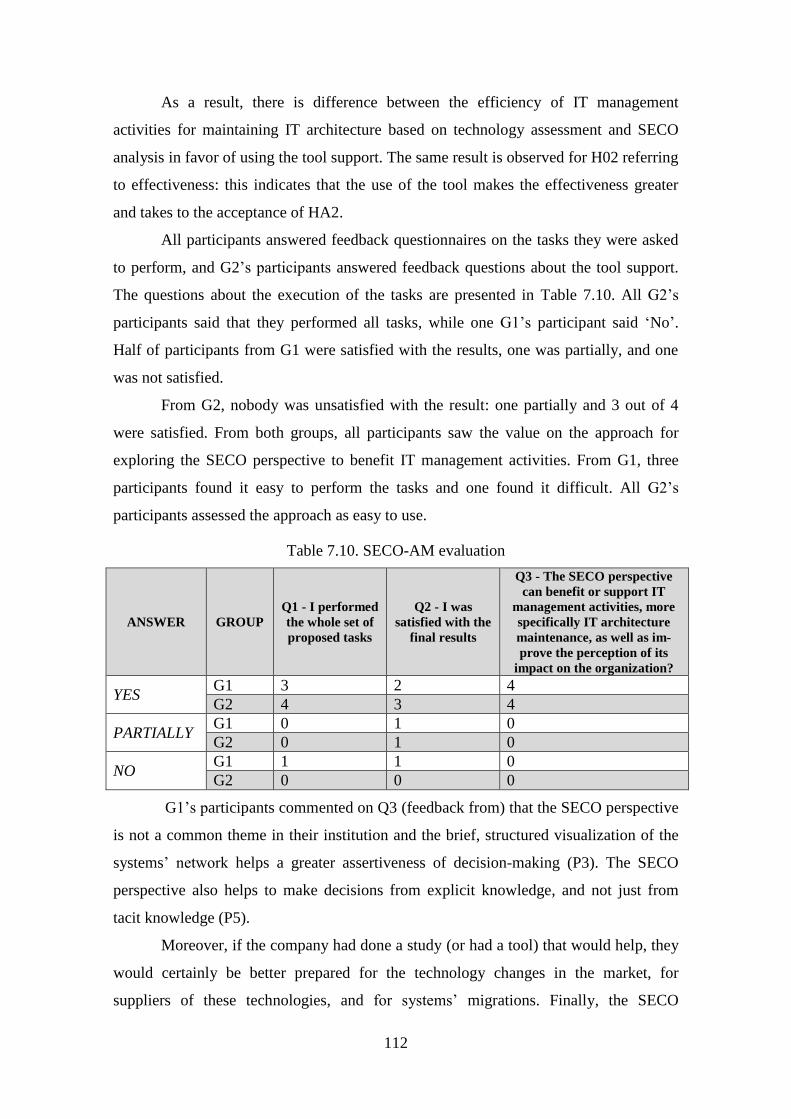
112
As a result, there is difference between the efficiency of IT management
activities for maintaining IT architecture based on technology assessment and SECO
analysis in favor of using the tool support. The same result is observed for H02 referring
to effectiveness: this indicates that the use of the tool makes the effectiveness greater
and takes to the acceptance of HA2.
All participants answered feedback questionnaires on the tasks they were asked
to perform, and G2’s participants answered feedback questions about the tool support.
The questions about the execution of the tasks are presented in Table 7.10. All G2’s
participants said that they performed all tasks, while one G1’s participant said ‘No’.
Half of participants from G1 were satisfied with the results, one was partially, and one
was not satisfied.
From G2, nobody was unsatisfied with the result: one partially and 3 out of 4
were satisfied. From both groups, all participants saw the value on the approach for
exploring the SECO perspective to benefit IT management activities. From G1, three
participants found it easy to perform the tasks and one found it difficult. All G2’s
participants assessed the approach as easy to use.
Table 7.10. SECO-AM evaluation
ANSWER GROUP
Q1 - I performed
the whole set of
proposed tasks
Q2 - I was
satisfied with the
final results
Q3 - The SECO perspective
can benefit or support IT
management activities, more
specifically IT architecture
maintenance, as well as im-
prove the perception of its
impact on the organization?
YES G1 3 2 4
G2 4 3 4
PARTIALLY G1 0 1 0
G2 0 1 0
NO G1 1 1 0
G2 0 0 0
G1’s participants commented on Q3 (feedback from) that the SECO perspective
is not a common theme in their institution and the brief, structured visualization of the
systems’ network helps a greater assertiveness of decision-making (P3). The SECO
perspective also helps to make decisions from explicit knowledge, and not just from
tacit knowledge (P5).
Moreover, if the company had done a study (or had a tool) that would help, they
would certainly be better prepared for the technology changes in the market, for
suppliers of these technologies, and for systems’ migrations. Finally, the SECO
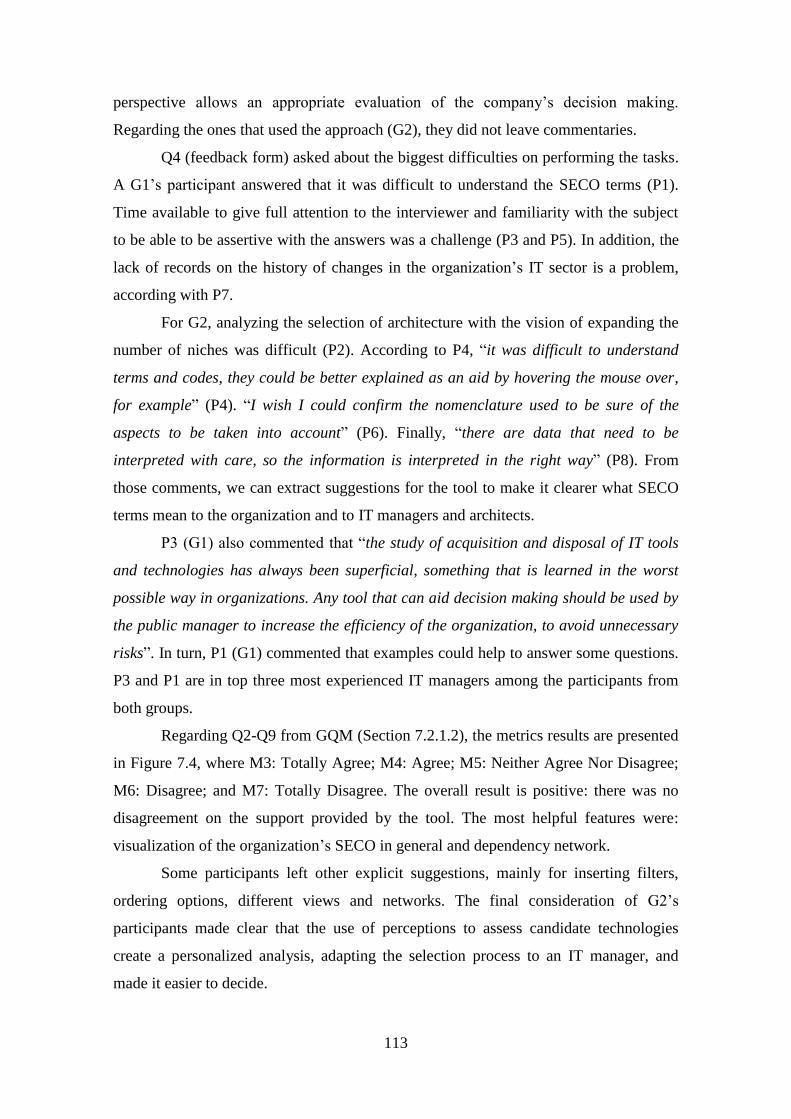
113
perspective allows an appropriate evaluation of the company’s decision making.
Regarding the ones that used the approach (G2), they did not leave commentaries.
Q4 (feedback form) asked about the biggest difficulties on performing the tasks.
A G1’s participant answered that it was difficult to understand the SECO terms (P1).
Time available to give full attention to the interviewer and familiarity with the subject
to be able to be assertive with the answers was a challenge (P3 and P5). In addition, the
lack of records on the history of changes in the organization’s IT sector is a problem,
according with P7.
For G2, analyzing the selection of architecture with the vision of expanding the
number of niches was difficult (P2). According to P4, “it was difficult to understand
terms and codes, they could be better explained as an aid by hovering the mouse over,
for example” (P4). “I wish I could confirm the nomenclature used to be sure of the
aspects to be taken into account” (P6). Finally, “there are data that need to be
interpreted with care, so the information is interpreted in the right way” (P8). From
those comments, we can extract suggestions for the tool to make it clearer what SECO
terms mean to the organization and to IT managers and architects.
P3 (G1) also commented that “the study of acquisition and disposal of IT tools
and technologies has always been superficial, something that is learned in the worst
possible way in organizations. Any tool that can aid decision making should be used by
the public manager to increase the efficiency of the organization, to avoid unnecessary
risks”. In turn, P1 (G1) commented that examples could help to answer some questions.
P3 and P1 are in top three most experienced IT managers among the participants from
both groups.
Regarding Q2-Q9 from GQM (Section 7.2.1.2), the metrics results are presented
in Figure 7.4, where M3: Totally Agree; M4: Agree; M5: Neither Agree Nor Disagree;
M6: Disagree; and M7: Totally Disagree. The overall result is positive: there was no
disagreement on the support provided by the tool. The most helpful features were:
visualization of the organization’s SECO in general and dependency network.
Some participants left other explicit suggestions, mainly for inserting filters,
ordering options, different views and networks. The final consideration of G2’s
participants made clear that the use of perceptions to assess candidate technologies
create a personalized analysis, adapting the selection process to an IT manager, and
made it easier to decide.
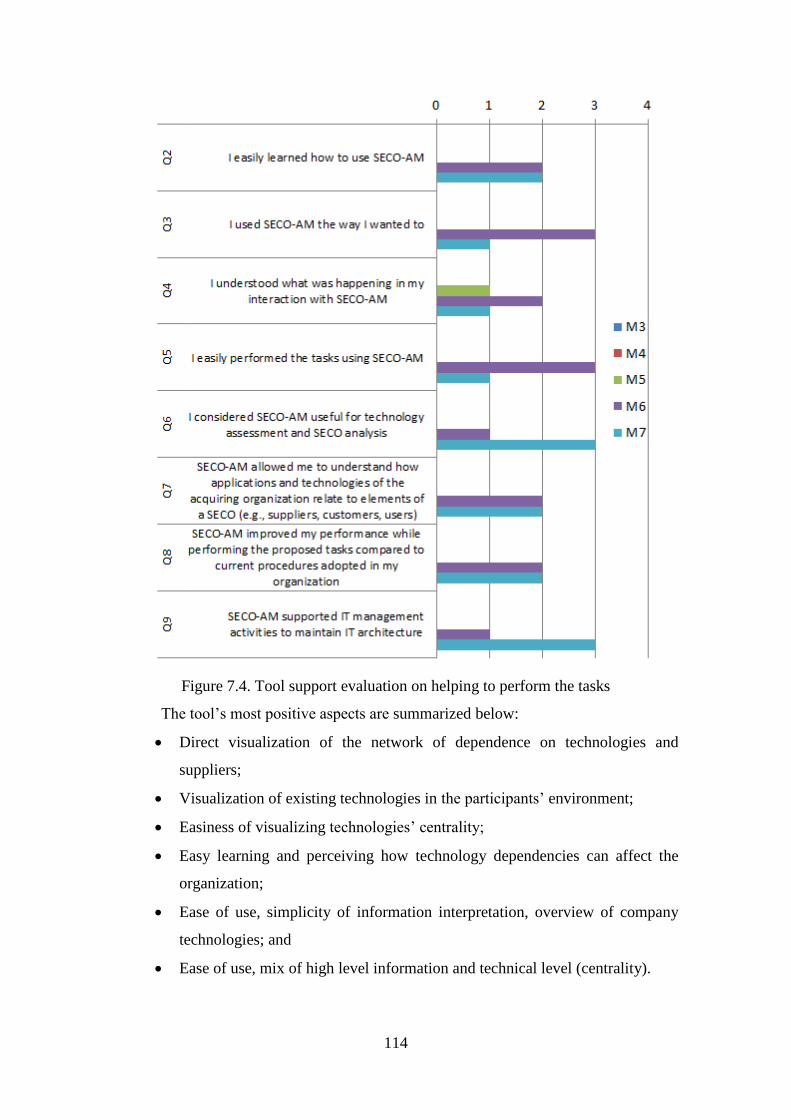
114
Figure 7.4. Tool support evaluation on helping to perform the tasks
The tool’s most positive aspects are summarized below:
Direct visualization of the network of dependence on technologies and
suppliers;
Visualization of existing technologies in the participants’ environment;
Easiness of visualizing technologies’ centrality;
Easy learning and perceiving how technology dependencies can affect the
organization;
Ease of use, simplicity of information interpretation, overview of company
technologies; and
Ease of use, mix of high level information and technical level (centrality).

115
The tool’s negative aspects are described below:
The results of the technology selection calculation was not clear;
Lack help (tool support) and ordering options for technologies according to
the selected criteria; and
It still has no filters for views by categories, types or suppliers, for example.
Regarding the SECO analysis and visualization, participants pointed out that
SECO-AM support strategic decision involving how cutting costs and investments can
affect the organization. In addition, they explicitly commented that SECO-AM makes
the work of IT managers and architects easier and adds value to the decisions: they had
a notion of technology dependency, but the visualization makes those relationships
clearer. It was pointed out that SECO-AM could be used in the process of selecting
technologies using a subset of attributes, reinforcing the research findings. This research
refers to the initial search for candidates that the market offers, and many perspectives
are considered.
7.7 Threats to validity
Typically, study’s features may influence the validity of results, termed threats
to validity. There are four types of study’s validity: internal, external, construct and
conclusion (WOHLIN et al., 1999, TRAVASSOS et al., 2002). For this study, the
following validity threats were identified:
Internal validity
The selection of study participants and division into groups may have
influenced the results, mainly because the groups had different treatments.
The use of the characterization form helped to balance the groups to have
similar profiles for each group;
The exchange of information among participants who had already completed
the study and those who had not already done could influence the results.
This can be more serious especially with the participants who used the tool,
because everyone already knows the routines of the organization. To avoid
this problem, it was explicitly requested that participants did not exchange
information about the study;
The support tool itself could influence the results if the participants faced
unforeseen difficulties in carrying out the study (slowness, server errors etc.);

116
Participants received a brief training on the use of the tool, which consisted of
reading basic information and navigability;
Participants’ understanding of the issues related to the forms was directly
influenced by the way the questions were developed; if the question were
poorly formulated, the study would be adversely affected (WOHLIN et al.,
1999); and
For the analysis of the data, the characterization information provided by the
participants themselves was used without any certification that they were
correct.
External validity
A threat to external validity is the cutting down of a small sample of the
organization’s portfolio, as well as not ensuring that other relevant
information is not available to participants;
It was not possible to represent all the possible situations of a SECO. The
execution scenario of the study tasks was based on the portfolio and other
information provided by the organization’s SECO;
Validity of construct
The measures selected to capture the results may not had been the most
appropriate to assess the validity of the approach. To minimize this risk,
measures were selected to capture the information needed to answer the study
questions;
Participants were selected by convenience, considering the organization
availability and suitability to the desired profile (IT management activities
experts). This is a threat to validity as their behavior can be altered to
influence the outcome. A random selection of participants was not possible,
since participants with an IT manager or architect profile and experience in
the industry were required and there were not many possible candidates.
Conclusion validity
Sample size was small due to the desired profile, then a small number of
participants may limit the validity of the study. Moreover, the study presents
limitations on more robust analyzes of the results. Hence, the interpretation of
the results is considered only as indications.
117
7.8 Conclusion
This chapter described a feasibility study executed to understand if SECO-AM
was feasible as well as to capture impressions from an industrial scenario through the
execution of tasks in an acquiring organization with a group of experienced
practitioners. This chapter described the planning, pilot, execution, and results. The
efficiency and effectiveness metrics were analyzed comparing a group that used the tool
support and another that performed the tasks as they usually work in their
organization/institution. Both efficiency and effectiveness were improved by using the
tool support and the perceived utility and ease of use had positive results.
Suggestions and observations captured from the feedback questionnaire revealed
several opportunities to improve the tool, mainly making the information clearer and
easier to interpret. Participants had experience in IT management activities. They
noticed that SECO is not a common perspective in their organization, but they realized
the benefits of this perspective since they understood they are in a SECO and see the
influence their decisions have in the network of dependencies, mainly reported as most
useful. Overall, the indications extracted from this study are that the use of SECO-AM
can be helpful and that they do not have a tool support currently in their organization to
aid IT architecture maintenance based on technology assessment and SECO analysis.

118
Chapter 8 – Conclusion
This chapter describes the final considerations of this Master dissertation as well as the
contributions of this research. Some limitations of this work need to be observed while
discussing the results. Some gaps and suggestions identified in the studies described in
Chapters 5 and 7 remain as future investigations and improvement points.
8.1 Contributions
A SECO platform broadly supports the use and development of software
artifacts. In this context, the adopted technologies that support a SECO platform affect
how actors enter and keep playing within a SECO. Those technologies are usually
references used by an organization and external actors. Therefore, any candidate
technology to be adopted, replaced or discontinued needs to be carefully compared to
keep or improve how well the SECO works. Hence, there is a need for a baseline of
architecture attributes for comparing technologies in the context of SECO platforms.
Managing platform’s technologies has many benefits to an organization, e.g.,
technology standardization, saving money, avoiding unnecessary acquisitions, and
supporting a controlled number of technologies. Fast technology changes, deployment
of new versions or discontinuation of technology support require frequent modification
and assessment of the SECO platform’s reference technologies.
In addition, there are repercussions for finances, users, politics, training, and
other perspectives that need to be considered when an organization is changing the
platform’s technologies. Therefore, a set of architecture attributes can aid IT managers
and architects to understand how those choices affect a SECO platform and its
technologies to take actions to mitigate the negative effect. That information was
extracted from the literature based on a systematic mapping study. As explained in
Chapter 4, 44 papers were analyzed, and 64 attributes were identified and grouped by
11 critical factors, i.e., macro attributes that encompass other specific attributes.
As considered in Chapters 1 and 2, the problem of maintaining IT architecture in
the SECO perspective is a gap found in the literature, since it is not explored much
further. Organizations that need to acquire or discontinue a technology should consider
some criteria to make their decisions. Frequently, the criteria is whatever the IT

119
management team uses according to experience and tacit knowledge. This may cause
some problems for the organization:
the decision is often not registered appropriately (or not at all);
criteria changes for each project and each IT manager/architect;
those changes are not reported and the decision criteria/process is not easily
auditable;
technical criteria are not explicit or planned in advance; and
SECO monitoring is very hard as there is no support for an overview of the
organization technical assets (software products and services).
The main contribution of this work is to support the modification of IT
architecture based on critical factors that take into account the SECO network. This
support is useful for an IT management team (stakeholders who have authority to
manipulate the organization’s IT architecture). The following secondary contributions
may be highlighted:
Exploratory studies: In order to understand what resources could be applied
in the research conception, two exploratory studies were described and some
sociotechnical features were identified and studied (Chapter 3).
Mapping study: It was executed a mapping study and results represent a
contributions to the SECO literature, mainly the list of critical factors and
attributes as well as the study protocol itself (Chapter 4);
Survey: The experts’ opinions are very important since they evaluate
information on data collected from the mapping study. The opinions, final list
of critical factors and attributes, and the study protocol are the main
contributions (Chapter 5);
SECO-AM approach: This is a contribution aiming at the support of IT
maintenance activities. SECO visualization and analysis mechanisms help to
identify and centralize information needed by the organization (Chapter 6);
Prototype tool support: The main SECO-AM’s features were implemented
in a prototype that offers a tool support for organizations (Chapter 6); and
Feasibility study: The feasibility study results and protocol are important
outcomes of this research, since the study assesses the relevance and
feasibility of applying SECO-AM’s tool in a real organization and colleting
the experience of practitioners (Chapter 7).
120
8.2 Limitations
Some limitations were identified considering the execution of the studies of
conception (exploratory, mapping study, and survey) and assessment (feasibility), as
well as the prototype developed. The main limitations are described as follows:
The research considered technical criteria for the approach definition and
prototype development. In SECO-AM approach, we argued that technical
criteria should be considered by an organization. Other criteria need to be
accounted for, e.g., institutional policies, financial regulations, market
prospections. However, they are not sustained by the approach/tool support;
The survey did not involve a number of participants for robust analysis with
statistical tools;
The tool support does not encompass all SECO-AM’s features. Some graphs
metrics and usability features are not fully developed;
The feasibility study was not repeated in other organizations (small sample).
Thus, the results are indications and cannot be generalized since it may vary
according to different organizational contexts; and
The list of critical factors and attributes could be better used if specific
scenarios were defined and a set of critical factor could be assigned to each
scenario, since some critical factors and attributes are more relevant than
others according to the organization context.
8.3 Future Work
In order to enrich this approach, some suggestions identified in the survey and
the feasibility study could be seen as future steps, such as:
The research of specific SECO contexts as well as construction of scenarios
that reflects a SECO type can help to make an analysis more adherent to the
organizational context;
The implementation of features suggested by the feasibility study’s
participants, e.g., making available a history of execution and modifications
within an analysis, filters and rankings for a user; and less technical terms in
favor of the organization equivalency so that IT managers and architects can
better understand what is changing in their SECO;
121
The snowballing analysis on the mapping studies literature base of accepted
papers can be performed; and
The execution of the feasibility study with the complete approach (and tool)
with specific scenarios that would ease criteria selection.
SECO is a new perspective when compared to others in Software Engineering.
As such, several problems are still to be discovered and researched. This work
investigated one of those problems. Moreover, it is a concrete problem since
observations from the feasibility study with experienced IT managers and architects
reported that they do not have any approach or tool support for the tasks they
performed. This approach has focused on the fact that SECO and sociotechnical
networks can aid IT management teams in their activities. Organizations are rarely
acquainted with the SECO concept (and what it can represent in their workplace). This
is another issue perhaps due to the novelty of this research and practice topic.
122
References
ADAMS, P., GOVEKAR, M., 2012, “Hype Cycle for IT Operations Management”.
Gartner Technical Professional Advice.
ALBERT, B.E., 2014, “SECOGov: A Software Ecosystem Governance Model to
Support IT Architecture Activities”. Master Thesis in Computer Science and
System Engineering. COPPE – Federal University of Rio de Janeiro, Rio de
Janeiro, Brazil, 171p. (In Portuguese)
AXELSSON, J., FRANKE, U., CARLSON, J., SENTILLES, S., CICCHETTI, A.,
2017, "Towards the architecture of a decision support ecosystem for system
component selection". In: Systems Conference (SysCon), 2017 Annual IEEE
International, pp. 1-7, Montreal, Canada, April.
BASILI, V. R., CALDIERA, G., ROMBACH, H. D., 1994, “The goal question metric
approach”. Encyclopedia of software engineering, v. 1, p. 528-532.
BERK, I., JANSEN, S., LUINENBURG, L., S., 2010, “Software Ecosystems: A
Software Ecosystem Strategy Assessment Model”. In: Proceedings of the 4th
European Conference on Software Architecture (ECSA) – 2nd International
Workshop on Software Ecosystems (IWSECO), pp. 135-142, Copenhagen,
Denmark, August.
BOUCHARAS, V., JANSEN, S., BRINKKEMPER, S., 2009, “Formalizing Software
Ecosystem Modeling”. In: Proceedings of the 1st International Workshop on
Open Component Ecosystems – ACM SIGSOFT Symposium on the Foundations
of Software Engineering (FSE), pp. 41-50, Amsterdam, The Netherlands,
August.
BOSCH, J., 2009, “From software product lines to software ecosystems”. In:
Proceedings of the 13th International Software Product Line Conference
(SPLC), pp. 111-119, San Francisco, USA, August.
BOSCH, J., BOSCH-SIJTSEMA, P., 2010a, “From integration to composition: on the
impact of software product lines, global development and ecosystems”. The
Journal of Systems and Software 83 (1): 67–76.
BOSCH, J., BOSCH-SIJTSEMA, P.., 2010b, “Software product lines, global
development and ecosystems: collaboration in software engineering”. In:
123
Mistrík, I., van der Hoek, A., Grundy, J., Whitehead, J. (Eds.), Collaborative
Software Engineering. Springer Berlin Heidelberg, pp. 77–92.
CHRISTENSEN, H.B., HANSEN, K.M., KYNG, M., MANIKAS, K., 2014, “Analysis
and design of software ecosystem architectures –towards the 4s telemedicine
ecosystem”. Information and Software Technology 56 (11): 1476–1492.
DAVIS, F. D., 1993, "User acceptance of information technology: system
characteristics, user perceptions and behavioral impacts". International Journal
of Man-Machine Studies, 38(3): 475–487.
DHUNGANA, D., GROHER, I., SCHLUDERMANN, E., BIFFL, S., 2010, “Software
Ecosystems vs. Natural Ecosystems: Learning from the Ingenious Mind of
Nature”. In: Proceedings of the 4th European Conference on Software
Architecture (ECSA) – 2nd International Workshop on Software Ecosystems
(IWSECO), pp. 96-102, Copenhagen, Denmark, August.
DURRANI, T. S., FORBES, S. M., BROADFOOT, C., CARRIE, A. S., 1998,
“Managing the technology acquisition process”. Technovation 18(8-9): 523-
528.
FINKELSTEIN, A., 2014, “Rethinking Software: Business Change and the
Consequences for Software Engineering”. In: Proceedings of the 22nd IEEE
International Requirements Engineering Conference (RE), Keynote, Karlskrona,
Sweeden, August.
FRANÇA, M., 2017, “DIRECTOR: A Cloud Microservice Selection Framework for
SECO Platform”. PhD Qualifying Exam in Computer Science and System
Engineering. COPPE – Federal University of Rio de Janeiro, Rio de Janeiro,
Brazil, 24p.
FREITAS, H., RECH, I., 2003, “Problemas e ações na adoção de novas tecnologias de
informação”. Revista de Administração Contemporânea 7(1):125-150 (In
Portuguese).
GORTON I., 2011, Essential Software Architecture. Springer, Berlin, Heidelberg
HILL, T., WESTBROOK, R., “SWOT analysis: it's time for a product recall”. Long
range planning 30(1): 46-52.

124
IANSITI, M., LEVIEN, R., 2004, The Keystone Advantage: What the New Dynamics
of Business Ecosystems Mean for Strategy, Innovation, and Sustainability.
USA/Boston: Harvard Business Review Press.
ISO/IEC 25000, 2014, “ISO/IEC 25000: Systems and software engineering – Systems
and software Quality Requirements and Evaluation (SQuaRE) – Guide to
SQuaRE”.
JANSEN, S., 2014, “Measuring the health of open source software ecosystems: Beyond
the scope of project health”. Information and Software Technology 56(11):
1508-1519.
JANSEN, S., FINKELSTEIN, A., BRINKKEMPER, S., 2009, “A Sense of
Community: A Research Agenda for Software Ecosystems”. In: Proceedings of
the 31st International Conference on Software Engineering (ICSE), New and
Emerging Research Track, pp. 187-190, Vancouver, Canada, May.
KNOP, C., OESER, M., BASTIAN, L., LANGE, U., ZDICHAVSKY, M., BLAUTH,
M., 2001, :”Development and validation of the visual analogue scale (VAS)
spine score”. Der Unfallchirurg 104(6): 488-497.
LAGERSTRÖM, R., BALDWIN, C., MACCORMACK, A., DREYFUS, D., 2014,
“Visualizing and Measuring Software Portfolio Architectures: A Flexibility
Analysis”, Journal of Modern Project Management 3(2): 14-121.
LIMA, T., BARBOSA, G., SANTOS, R., WERNER, C., 2016a, "An Infrastructure to
Support Socialization, Monitoring and Analysis of Software Ecosystems". In: X
Workshop de Desenvolvimento Distribuído de Software, Ecossistemas de
Software e Sistemas de Sistemas (WDES), X Workshop de Desenvolvimento
Distribuído de Software, Ecossistemas de Software e Sistemas de Sistemas
(WDES)/VII Congresso Brasileiro de Software: Teoria e Prática, pp. 31-40,
Maringá, Brazil, September.
LIMA, T., SANTOS, R., WERNER, C., 2013, “Apoio à Compreensão das Redes Socio-
técnicas em Ecossistemas de Software”. In: Proceedings of the XXXIII Brazilian
Computer Society Congress (CSBC) – II Brazilian Workshop on Social Network
Analysis and Mining (BraSNAM), pp. 1525-1530, Maceió, Brazil, July. (In
Portuguese)

125
LIMA, T., SANTOS, R., WERNER, C., 2015, “A survey on socio-technical resources
for software ecosystems”. In: 7th International Conference on Management of
computational and collective intElligence in Digital EcoSystems, pp. 72-79,
Caraguatatuba, Brazil, October.
LIMA, T., SANTOS, R., OLIVEIRA, J., & WERNER, C., 2016b, “The importance of
socio-technical resources for software ecosystems management”. Journal of
Innovation in Digital Ecosystems 3(2), 98-113.
LUNGU, M., LANZA, M., GÎRBA, T., ROBBES, R., 2010, “The small project
observatory: visualizing software ecosystems”. Science of Computer
Programming 75 (4): 264–275.
MANIKAS, K., 2016, “Revisiting software ecosystems research: A longitudinal
literature study”. The Journal of Systems and Software 117: 84-103.
MANIKAS, K., HANSEN, K.M., 2013, “Software ecosystems - A systematic literature
review”. The Journal of Systems and Software 86(5):1294-1306.
MARINHO, A., MURTA, L., WERNER, C., 2009, “Extending a Software Component
Repository to Provide Services”. In: Proceedings of the 11th International
Conference on Software Reuse, pp. 258-268, Falls Church, USA, September.
MESSERSCHMITT, D., SZYPERSKI, C., 2003, Software ecosystem: understanding
an indispensable technology and industry. MIT Press Books.
MIGUEL, J. P., MAURICIO, D., & RODRÍGUEZ, G., 2014, “A review of software
quality models for the evaluation of software products”. International Journal
of Software Engineering & Applications (IJSEA) 5(6): 31-53.
NULTY, D., 2008, “The adequacy of response rates to online and paper surveys: What
can be done?”. Assessment & Evaluation in Higher Education 33(3): 301-314.
PEREIRA, D.C., ALMEIDA, J.P.A., 2014, “Representing organizational structures in
an enterprise architecture language”. In: Workshop on Formal Ontologies Meet
Industry (FOMI), pp. 7-15, Rio de Janeiro, Brazil, September.
PETERSEN, K., VAKKALANKA, S., KUZNIARZ, L., 2015, "Guidelines for
conducting systematic mapping studies in software engineering: An update".
Information and Software Technology 64(August 2015):1-18.
126
RODRIGUES, S., SILVA, T., PIVOTTO, C., GIRAO, A., SOUZA, J., ROCHA, E.,
2011, “Integrating Web and Mobile Knowledge Management Tools to Improve
Negotiations”. In: Proceedings of the IEEE International Conference on
Systems, Man, and Cybernetics, pp. 3035-3040, Anchorage, USA, October.
ROSS, J., 2003, “Creating a Strategic it Architecture Competency: Learning in Stages”.
MIS Quarterly Executive 2 (1): 31-43.
SADI, H., YU M., 2015, “Designing Software Ecosystems: How Can Modeling
Techniques Help?”. In: Gaaloul K., Schmidt R., Nurcan S., Guerreiro S., Ma Q.
(eds) Enterprise, Business-Process and Information Systems Modeling. CAISE
2015. Lecture Notes in Business Information Processing, vol. 214. Springer,
Cham.
SANTOS, R., 2016, “Managing and Monitoring Software Ecosystem to Support
Demand and Solution Analysis”. PhD Thesis in Computer Science and System
Engineering. COPPE – Federal University of Rio de Janeiro, Rio de Janeiro,
Brazil, 246p.
SANTOS, R.P., ESTEVES, M.G.P., FREITAS, G., SOUZA, J.M., 2014, “Using Social
Networks to Support Software Ecosystems Comprehension and Evolution”.
Social Networking 3(2):108-118.
SANTOS, R., LIMA, T., WERNER, C., TOSTES, L., BARBOSA, G., 2017, “A
Sociotechnical Negotiation Mechanism to Support Component Markets in
Software Ecosystems”. CLEI Electronic Journal 20(3):4.1-4.25.
SANTOS, R.P., OLIVEIRA, J., 2013, “Análise e Aplicações de Redes Sociais em
Ecossistemas de Software” In: Anais do IX Simpósio Brasileiro de Sistemas de
Informação, Minicursos, pp. 19-24, João Pessoa, Brasil, May. (In portuguese)
SANTOS, R., WERNER, C., 2010, “Revisiting the Concept of Components in Software
Engineering from a Software Ecosystem Perspective”. In: Proceedings of the 4th
European Conference on Software Architecture (2nd International Workshop on
Software Ecosystems), pp. 135-142, Copenhagen, Denmark, August.
SANTOS, R., WERNER, C., 2011, “Brechó-EcoSys: From a Component Library to a
Software Ecosystems Platform”. In: Proceedings of the 12th International
127
Conference on Software Reuse (Demos Session), pp. 1-4, Pohang, South Korea,
June.
SANTOS, R., WERNER, C., SILVA, M., 2010, “Brechó-VCM: A Value-Based
Approach for Component Markets”. International Transactions on Systems
Science & Applications 6(2/3): 179-199.
SANTOS, R., WERNER, C.M.L., 2012, “Treating Social Dimension in Software
Ecosystems through ReuseECOS Approach”. In: Proceedings of the 6th IEEE
International Conference on Digital Ecosystem Technologies – Complex
Environment Engineering (DEST-CEE), pp. 1-6, Campione d’Italia, Italy, June.
SANTOS, R., WERNER, C., TOSTES, L., LIMA, T., BARBOSA, G., 2016,
“Supporting negotiation and socialization for component markets in software
ecosystems context”. In: Proceedings of the XLII Latin American Informatics
Conference (CLEI), pp. 1-12, Valparaiso, Chle, October.
SEICHTER, D., DHUNGANA, D., PLEUSS, A., HAUPTMANN, B., 2010,
“Knowledge Management in Software Ecosystems: Software Artifacts as First-
class Citizens”. In: Proceedings of the 4th European Conference on Software
Architecture (ECSA) – 2nd International Workshop on Software Ecosystems
(IWSECO), pp. 119-126, Copenhagen, Denmark, August.
SHAFIA, M.A., RABADI, N.J., BABAKHAN, A.R., 2015, “The Strategies and the
Factors that Influence Technology Acquisition Channels. Case study: Iranian
die–making industries”. International Journal of Manufacturing Technology
and Management 29(1-2):48-65.
SOFTEX, 2013, ASSOCIATION FOR THE PROMOTION OF BRAZILIAN
SOFTWARE EXCELLENCE – SOFTEX. MPS.BR – Acquisition Guide.
Available at: www.softex.br. Accessed: 12/12/2017.
MENS, T., GOEMINNE, M., 2011, “Analysing the Evolution of Social Aspects of
Open Source Software Ecosystems”. In: Proceedings of the 3rd International
Workshop on Software Ecosystems (IWSECO), in conjunction with 2rd
International Conference on Software Business (ICSOB), pp. 77-88, Brussels,
Belgium, June.

128
TRAAS, V., AND HILLEGERSBERG, J., 2000, “The Software Component Market on
the Internet Current Status and Conditions for Growth”. ACM SIGSOFT
Software Engineering Notes 35(1): 114-117.
TRAVASSOS, G. H.; GUROV, D.; AMARAL, E. A. G., 2002, Introdução à
Engenharia de Software Experimental, Relatório Técnico ES-590/02, PESC-
COPPE. (In Portuguese)
VAN LINGEN, S., PALOMBA, A., LUCASSEN, G., 2013, “On the software
ecosystem health of open source content management systems”. In: Proceedings
of the 5th International Workshop on Software Ecosystems, pp. 45-56, Potsdam,
Germany, June.
YU, E., DENG, S., 2011, “Understanding Software Ecosystems: A Strategic Modeling
Approach”. In: Proceedings of the 3rd International Workshop on Software
Ecosystems (IWSECO), in conjunction with the 2rd International Conference on
Software Business (ICSOB), pp. 65-76, Brussels, Belgium, June.
WEILL, P., ROSS, J., 2004, IT Governance: How Top Performers Manage IT
Decision Rights for Superior Results. Harvard Business Press.
WERNER, C., MURTA, L., MARINHO, A., SANTOS, R., SILVA, M., 2009,
“Towards a Component and Service Marketplace with Brechó Library”, In:
Proceedings of the IADIS International Conference on WWW/Internet, pp. 567-
574, Rome, Italy.
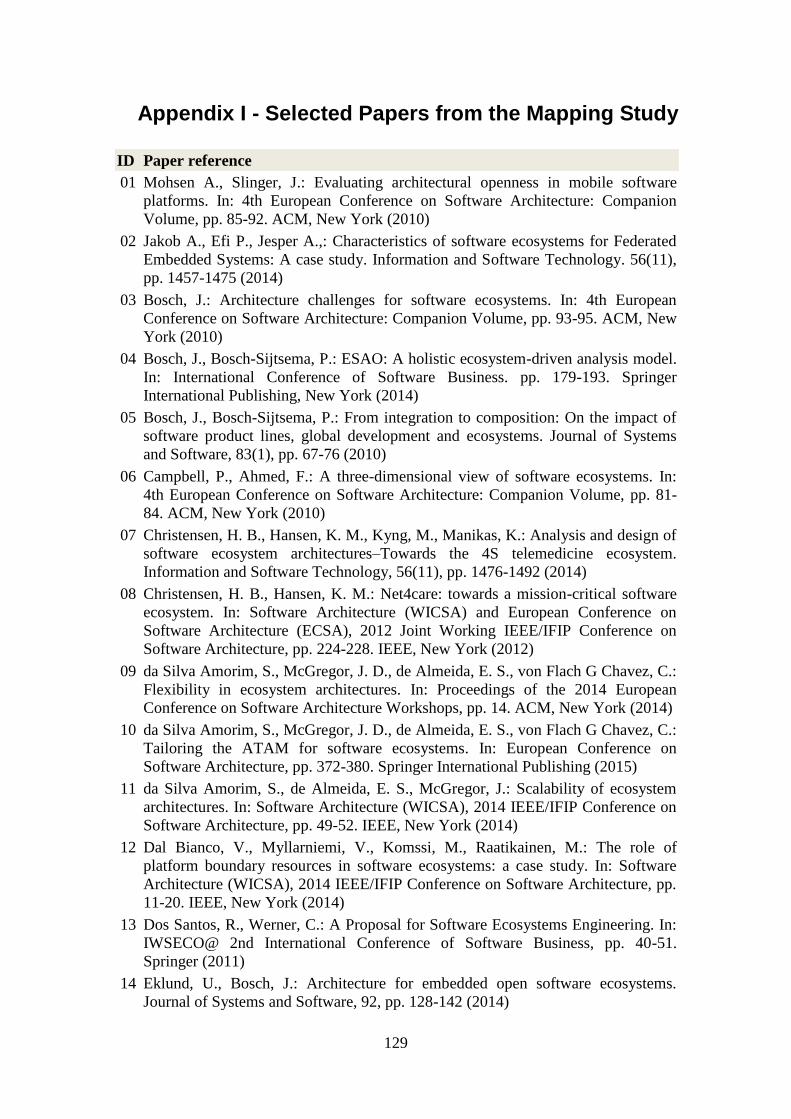
129
Appendix I - Selected Papers from the Mapping Study
ID Paper reference
01 Mohsen A., Slinger, J.: Evaluating architectural openness in mobile software
platforms. In: 4th European Conference on Software Architecture: Companion
Volume, pp. 85-92. ACM, New York (2010)
02 Jakob A., Efi P., Jesper A.,: Characteristics of software ecosystems for Federated
Embedded Systems: A case study. Information and Software Technology. 56(11),
pp. 1457-1475 (2014)
03 Bosch, J.: Architecture challenges for software ecosystems. In: 4th European
Conference on Software Architecture: Companion Volume, pp. 93-95. ACM, New
York (2010)
04 Bosch, J., Bosch-Sijtsema, P.: ESAO: A holistic ecosystem-driven analysis model.
In: International Conference of Software Business. pp. 179-193. Springer
International Publishing, New York (2014)
05 Bosch, J., Bosch-Sijtsema, P.: From integration to composition: On the impact of
software product lines, global development and ecosystems. Journal of Systems
and Software, 83(1), pp. 67-76 (2010)
06 Campbell, P., Ahmed, F.: A three-dimensional view of software ecosystems. In:
4th European Conference on Software Architecture: Companion Volume, pp. 81-
84. ACM, New York (2010)
07 Christensen, H. B., Hansen, K. M., Kyng, M., Manikas, K.: Analysis and design of
software ecosystem architectures–Towards the 4S telemedicine ecosystem.
Information and Software Technology, 56(11), pp. 1476-1492 (2014)
08 Christensen, H. B., Hansen, K. M.: Net4care: towards a mission-critical software
ecosystem. In: Software Architecture (WICSA) and European Conference on
Software Architecture (ECSA), 2012 Joint Working IEEE/IFIP Conference on
Software Architecture, pp. 224-228. IEEE, New York (2012)
09 da Silva Amorim, S., McGregor, J. D., de Almeida, E. S., von Flach G Chavez, C.:
Flexibility in ecosystem architectures. In: Proceedings of the 2014 European
Conference on Software Architecture Workshops, pp. 14. ACM, New York (2014)
10 da Silva Amorim, S., McGregor, J. D., de Almeida, E. S., von Flach G Chavez, C.:
Tailoring the ATAM for software ecosystems. In: European Conference on
Software Architecture, pp. 372-380. Springer International Publishing (2015)
11 da Silva Amorim, S., de Almeida, E. S., McGregor, J.: Scalability of ecosystem
architectures. In: Software Architecture (WICSA), 2014 IEEE/IFIP Conference on
Software Architecture, pp. 49-52. IEEE, New York (2014)
12 Dal Bianco, V., Myllarniemi, V., Komssi, M., Raatikainen, M.: The role of
platform boundary resources in software ecosystems: a case study. In: Software
Architecture (WICSA), 2014 IEEE/IFIP Conference on Software Architecture, pp.
11-20. IEEE, New York (2014)
13 Dos Santos, R., Werner, C.: A Proposal for Software Ecosystems Engineering. In:
IWSECO@ 2nd International Conference of Software Business, pp. 40-51.
Springer (2011)
14 Eklund, U., Bosch, J.: Architecture for embedded open software ecosystems.
Journal of Systems and Software, 92, pp. 128-142 (2014)

130
15 Eklund, U., Bosch, J.: Using architecture for multiple levels of access to an
ecosystem platform. In: 8th international ACM SIGSOFT conference on Quality of
Software Architectures, pp. 143-148. ACM, New York (2012)
16 Fernandez, E. B., Yoshioka, N., Washizaki, H.:. Patterns for Security and Privacy
in Cloud Ecosystems. In: 23rd IEEE International Requirements Engineering
Conference, pp. 24-28. IEEE (2015)
17 França, M., Santos, R., Werner, C.: A Roadmap for Cloud SECO: EcoData and the
New Actors in IoT Era. In: 2015 International Conference on Distributed
Computing in Sensor Systems, pp. 218-223. IEEE (2015).
18 Hartmann, H., Bosch, J.: Orchestrate your platform: architectural challenges for
different types of ecosystems for mobile devices. In: International Conference of
Software Business, pp. 163-178. Springer International Publishing (2014).
19 Hartmann, H., Trew, T., Bosch, J.: The changing industry structure of software
development for consumer electronics and its consequences for software
architectures. Journal of Systems and Software, 85(1), pp. 178-192 (2012).
20 Hess, S., Braun, S., Feldhaus, J., Hack, M., Kiefer, F., Magin, D., Naab, M.,
Richter, D., Lenhart, T., Trapp, M.: Building mobile software ecosystems-a
practical approach. In: International Conference on Human-Computer Interaction,
.pp. 165-177. Springer International Publishing, (2015).
21 Hess, S., Naab, M., Trapp, M., Magin, D., Braun, S.: The importance of mobile
software ecosystems in smart rural areas. In: Proceedings of the Second ACM
International Conference on Mobile Software Engineering and Systems. IEEE
Press, 2015. p. 164-165.
22 Jansen, S.: How quality attributes of software platform architectures influence
software ecosystems. In: Proceedings of the 2013 International Workshop on
Ecosystem Architectures, pp. 6-10. ACM, (2013)
23 Jansen, S.: Opening the Ecosystem Flood Gates: Architecture Challenges of
Opening Interfaces Within a Product Portfolio. In: European Conference on
Software Architecture, pp. 121-136. Springer International Publishing, (2015)
24 Knodel, J., Naab, M., Rost, D.: Supporting architects in mastering the complexity
of open software ecosystems. In: Proceedings of the 2014 European Conference on
Software Architecture Workshops, pp. 13. ACM, (2014).
25 Manikas, K.: Revisiting software ecosystems research: a longitudinal literature
study. Journal of Systems and Software, v. 117, p. 84-103 (2016).
26 Müller, H. A., Kienle, H. M., Stege, U.: Autonomic computing now you see it,
now you don’t. In: Software Engineering, International Summers Schools, pp. 32-
54. Springer Berlin Heidelberg, (2009)
27 Musil, J., Musil, A., Winkler, D., Biffl, S.: A first account on stigmergic
information systems and their impact on platform development. In: Proceedings of
the WICSA/ECSA 2012 Companion Volume, pp. 69-73. ACM, (2012)
28 Ostadzadeh, S. S., Shams, F., Badie, K.: An architectural model framework to
improve digital ecosystems interoperability. In: New Trends in Networking,
Computing, E-learning, Systems Sciences, and Engineering, pp. 513-520. Springer
International Publishing, (2015)
29 Pelliccione, P.: Open architectures and software evolution: the case of software
ecosystems. In: 23rd Australian Software Engineering Conference, pp. 66-69.
IEEE, (2014)
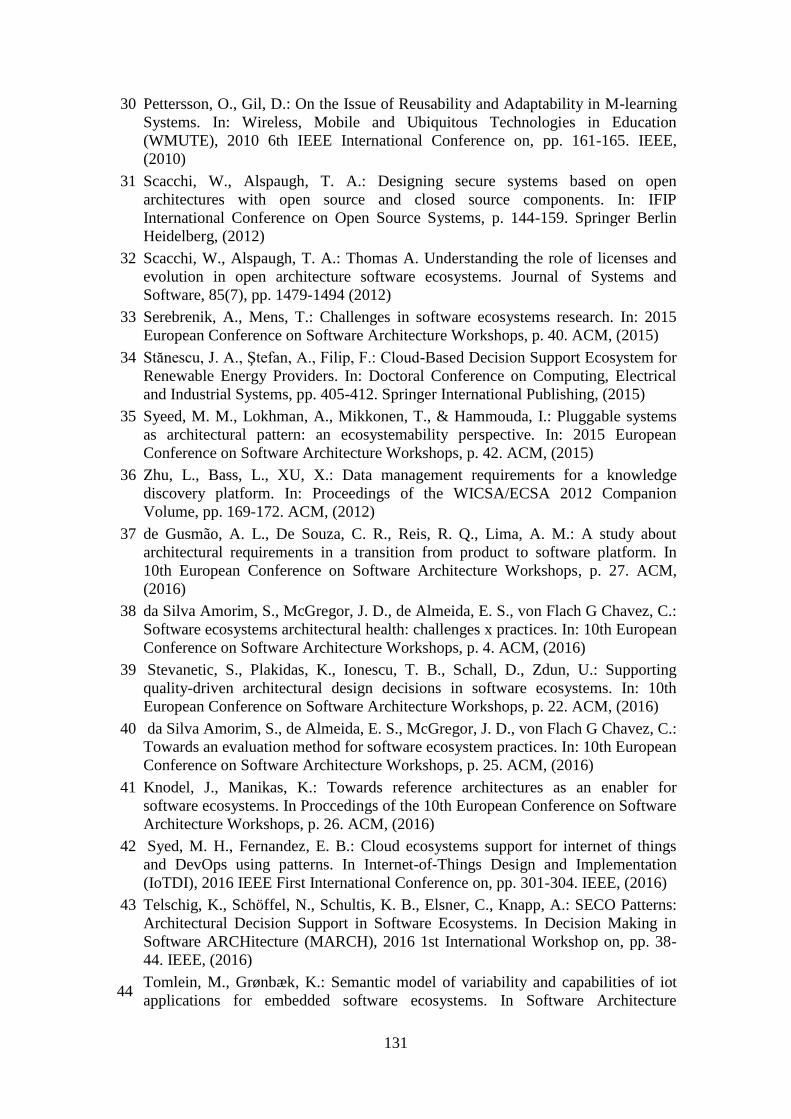
131
30 Pettersson, O., Gil, D.: On the Issue of Reusability and Adaptability in M-learning
Systems. In: Wireless, Mobile and Ubiquitous Technologies in Education
(WMUTE), 2010 6th IEEE International Conference on, pp. 161-165. IEEE,
(2010)
31 Scacchi, W., Alspaugh, T. A.: Designing secure systems based on open
architectures with open source and closed source components. In: IFIP
International Conference on Open Source Systems, p. 144-159. Springer Berlin
Heidelberg, (2012)
32 Scacchi, W., Alspaugh, T. A.: Thomas A. Understanding the role of licenses and
evolution in open architecture software ecosystems. Journal of Systems and
Software, 85(7), pp. 1479-1494 (2012)
33 Serebrenik, A., Mens, T.: Challenges in software ecosystems research. In: 2015
European Conference on Software Architecture Workshops, p. 40. ACM, (2015)
34 Stănescu, J. A., Ştefan, A., Filip, F.: Cloud-Based Decision Support Ecosystem for
Renewable Energy Providers. In: Doctoral Conference on Computing, Electrical
and Industrial Systems, pp. 405-412. Springer International Publishing, (2015)
35 Syeed, M. M., Lokhman, A., Mikkonen, T., & Hammouda, I.: Pluggable systems
as architectural pattern: an ecosystemability perspective. In: 2015 European
Conference on Software Architecture Workshops, p. 42. ACM, (2015)
36 Zhu, L., Bass, L., XU, X.: Data management requirements for a knowledge
discovery platform. In: Proceedings of the WICSA/ECSA 2012 Companion
Volume, pp. 169-172. ACM, (2012)
37 de Gusmão, A. L., De Souza, C. R., Reis, R. Q., Lima, A. M.: A study about
architectural requirements in a transition from product to software platform. In
10th European Conference on Software Architecture Workshops, p. 27. ACM,
(2016)
38 da Silva Amorim, S., McGregor, J. D., de Almeida, E. S., von Flach G Chavez, C.:
Software ecosystems architectural health: challenges x practices. In: 10th European
Conference on Software Architecture Workshops, p. 4. ACM, (2016)
39 Stevanetic, S., Plakidas, K., Ionescu, T. B., Schall, D., Zdun, U.: Supporting
quality-driven architectural design decisions in software ecosystems. In: 10th
European Conference on Software Architecture Workshops, p. 22. ACM, (2016)
40 da Silva Amorim, S., de Almeida, E. S., McGregor, J. D., von Flach G Chavez, C.:
Towards an evaluation method for software ecosystem practices. In: 10th European
Conference on Software Architecture Workshops, p. 25. ACM, (2016)
41 Knodel, J., Manikas, K.: Towards reference architectures as an enabler for
software ecosystems. In Proccedings of the 10th European Conference on Software
Architecture Workshops, p. 26. ACM, (2016)
42 Syed, M. H., Fernandez, E. B.: Cloud ecosystems support for internet of things
and DevOps using patterns. In Internet-of-Things Design and Implementation
(IoTDI), 2016 IEEE First International Conference on, pp. 301-304. IEEE, (2016)
43 Telschig, K., Schöffel, N., Schultis, K. B., Elsner, C., Knapp, A.: SECO Patterns:
Architectural Decision Support in Software Ecosystems. In Decision Making in
Software ARCHitecture (MARCH), 2016 1st International Workshop on, pp. 38-
44. IEEE, (2016)
44 Tomlein, M., Grønbæk, K.: Semantic model of variability and capabilities of iot
applications for embedded software ecosystems. In Software Architecture

132
(WICSA), 2016 13th Working IEEE/IFIP Conference on, pp. 247-252. IEEE,
(2016)

133
Appendix II – Glossary
The terms results from the mapping study (Chapter 4) are described below. If a
source paper only cites a term and not discuss it, an external source of definition is used.
1. Accessibility [01] [22]: "Platform accessibility means the methods and points
that developers can use to extend or modify the platform" [01].
2. Availability [21] [24] [26]: "The degree to which a software component is
operational and available when required for use" (MIGUEL et al., 2014).
3. Backwards compatibility [22]: "A platform is backwards compatible if it
continues to support functionalities of previous versions of itself."
4. Buildability [07]: "Buildability refers to how easy it is to construct a desired
system. It allows being open to changes during development requiring attention when
diving in modules and it is usually measured in cost and time. [07]"
5. Commonality [06][19]: "commonality management deals with the way features
and characteristic that are common across the products belong to a SECO whereas
variability management is other way round" [06].
6. Component dependency [05][22]: "One of the key features of a software
platform are the dependency and reuse mechanisms and the openness within those
mechanisms. Apple, for instance, does not allow linking of third-party libraries with
iPhone Apps, whereas Ruby on Rails does. For RoR a complete dependency
management system maintains dependencies, which enables platform extenders to
cooperatively develop shared libraries, next to regular platform extensions. Apple’s
iPhone, however, does not currently implement such a dependency management system,
reducing reusability of other applications by platform extenders (and power of
extending parties, for that matter)."
7. Composability [14][15][19][29][32]: "The software platform necessary to
support the ecosystem must fulfill a set of properties to allow the decoupling of
applications and eliminate the need for development synchronization. The architecture
should allow development, integration, and validation of applications independent of

134
other applications. Non-technical users cannot do this themselves, it must be provided
for by application and/or platform developers" [14].
8. Configurability [02][14][15][32]: "Configuration is concerned with product
instantiation and configuration that involves multiple stakeholders" [02]. "The platform
must support variability in the hardware configuration of sensors and actuators since
individual products can vary within the product family" [14].
9. Consistent user interface [14][15]: "This is often considered important by
manufacturers of embedded consumer products since much of brand recognition and
willingness to stay with the product brand lies here. The other major aspect for brand
distinction is the qualities provided by the hardware (precision, reliability, etc.)"
[14][15].
10. Complexity [11]: "An increase in the number of organizations in the ecosystem
will lead to an increase in the size of the platform code base as the new organizations
contribute new features and variants of existing features to support the extension
products they aspire to create" [11].
11. Cost [18]: "The larger the scope of the platform, the more development and
maintenance effort is required by the platform owner. When multiple parties are
involved these costs can be shared between the participants" (VAN GENUCHTEN,
2007). "Because hardware and software development is costly, this is the main reason
why ecosystems became widely adopted. Firms that aim for low costs specialize on a
few products so that tasks become routine" (BOLWIJN et al., 1990). "Consequently
products that are developed in consort by specialized firms, especially when interfaces
are pre-defined, can be made at lower costs" [18].
12. Components decoupling [05][32]: "The decoupling allows the release
groupings to be composed, with relatively few issues. This is often achieved by more
upfront work to design and publish the interface of each release group before the start of
the development cycle" [05].
13. Extensions' Delivery [22]: Delivery of extension is mentioned as a step further
from reuse, openness, and dependency mechanisms. A pattern can be applied, e.g., App
store, centralizing the control over the delivery channel and development of extensions.

135
14. Dependability [14][15]: "Many embedded domains have stringent depend-
ability requirements. These domains are probably not the first adopters of an ecosystem-
based approach to software development. However, if that was the case the embedded
platform would satisfy; real-time requirements for the execution of individual
applications, integrity requirements, high availability, and mechanisms to eliminate
undesired feature interaction if several applications interact with the same actuators"
[14].
15. Deployability [14][15][35]: "On the business side, a SECO architecture should
allow for fast and seamless deployment of different versions of the product in different
usage contexts. Easier deployment means faster time to market, which is a critical
business factor for ecosystem industrial actors" [35].
16. Extensions' deployment [22]: Deployment of extension is mentioned as a step
further from reuse, openness, and dependency mechanisms. A pattern can be applied,
e.g., App store, so the deployment of extensions follows their procedure and devices,
contrary to other open SECO in which the deployment, i.e., making the extension
available for use, can be done by a community or without certification from the
organization that controls the SECO.
17. Documentation [05][22]: "Developers complain frequently about
intransparency, poor documentation, or even missing documentation in rapidly
developing platform APIs. On the other hand, the platform extenders are positive about
platforms for which sufficient documentation exists. Undocumented features cost
developers significantly more time to work with, whereas these are typically highly
marketable features, due to their novelty. Documentation platform architecture in
general is weak in all four platforms, although it must be noted that the documentation
in some cases specifically uses the concept of patterns to illustrate platform extension to
developers" [22].
18. Efficient use of system resources [18]: "Due to the need for optimal resource
utilization and low power consumption a direct control of the hardware is required"
[18].
19. Evolution/Evolvability [03][29][32][37]: "Evolution inexorably causes it to
incorporate functionality that earlier was developed by external developers" [3].

136
20. Extensibility [01][09][10][12][23][24][29][35]: "A good SECO architecture
should allow different ecosystem actors to accommodate additions to the core
capabilities" [35].
21. Extension [13][21][23]: "allows enhancing the functionalities of components in
a layer, e.g., the evolution of Brechó platform from a component repository to a
component marketplace environment, generating Brechó-VCM" [13].
22. Flexibility [09][10][18][24][37]: "Flexibility expresses how easy, cheap, and
fast necessary changes to software systems, i.e. existing requirements, can be
accomplished" [10]. "Good architectural design helps to attract new external developers,
while a bad design can cause problems for them. Any change in the platform has an
associated cost that can affect extensions within the ecosystem. Lower costs means
more platform flexibility. To increase the degree of flexibility it is necessary to reduce
the number of dependencies and the complexity of the interfaces making them more
“translucent”" [37].
23. Framework stability [22]: "Frameworks tend to evolve through a number of
iterations, leading to new versions, due to the incorporation of new or changed
requirements, better domain understanding and fault corrections. New versions of a
framework cause high maintenance cost for the products built with the framework.
Because of this, it is important to assess the stability of a framework" (MATTSON &
BOSCH, 1999).
24. Hard real time requirements [18]: "embedded devices have hard real time
requirements, e.g. for audio playback and telephone conversations. Linux is a real time
operating system that is widely used in embedded systems. It offers the developers the
possibility to optimize on system resources and supports hard real time requirements"
[18].
25. Innovation [18]: "The optimal definition of the boundaries depends on where
the major innovation steps in the architecture take place. When innovation takes place
across the boundaries of the platform the integrity of the platform is compromised and
the complementors need to be involved thus slowing down the speed of innovation.
Therefore, a wide scope allows for larger innovation steps more easily. The introduction
of multi touch screens is such an example. Due to this innovation specialized hardware
137
was needed; the interface towards the user has changed and a new API towards the
application developers was required" [18].
26. Integration [01][03][05][07][12][13[18][19][21][29][37]: "the level of
integration between the platform and externally developed solutions. Depending on the
type of domain, the integration may be limited to a common UI framework, but
frequently the integration needs to include the workflow and the data stored in the
system. In some cases, the architecture also needs to facilitate integration between two
or more externally developed products which adds yet another layer of complexity"
[03].
27. Interface stability [03][13][18][33]: "It is required that a platform interface is
defined that external developers can use to develop against. In this case, obviously, the
interface has to be sufficiently expressive that external developers can build relevant
functionality. On the other hand, it also should decouple the platform organization from
the external developer community to the extent possible. Achieving this allows the
platform organization to release new version of the product or new products in the
product line without having to be concerned with disabling the externally developed
applications operating on top of the platform. No interface, however, can be static and
consequently the platform interface needs to evolve over time. The architectural
challenge is firstly to allow the interface to evolve in a predictable fashion and with
significant time for external developers to adjust their applications or to prepare new
functionality exploiting the new interface" [03].
28. Interoperability [24][28]: "Interoperability is about the ability of two systems
to work together according to anticipated and desired usages. Such two systems are
typically independent and fully functional systems, which provide an overall usage
benefit when interoperating" [24].
29. Licensing [01][32]: "Traditional proprietary licenses allow a company to retain
control of software it produces, and restrict the access and rights that outsiders can have.
OSS licenses, on the other hand, are designed to encourage sharing and reuse of
software, and grant access and as many rights as possible. OSS licenses are classified as
academic or reciprocal. Academic OSS licenses such as the Berkeley Software
Distribution (BSD) license, the Massachusetts Institute of Technology license, the
138
Apache Software License, and the Artistic License, grant nearly all rights to
components and their source code, and impose few obligations. Anyone can use the
software, create derivative works from it, or include it in proprietary projects. Typical
academic obligations are simply to not remove the copyright and license notices"
(ALSPAUGH et al., 2009).
30. Learnability [22][24]: "One of the main issues that affected developer
experience regarded learnability. It emerged that the platform resources did not facilitate
learning. A major example is that the third-party APIs, because of their structure, did
not aid the learning process. As a general approach developers would have preferred
that the APIs were structured in such a way that is straight-forward to perform basic
operations. The more advanced options of those operations could have been learned and
used over time. Instead, it was easy to end up using advanced options or operations,
even deprecated ones, already at the beginning" (BIANCO, 2013).
31. Maintainability [15][35][37]: "One of the major requirements for SECO
architecture is to support ecosystem actors through improving and evolving the original
platform to be able to create new business value. It should be possible to perform cost -
effective changes within the platform without inadvertently breaking extensions that
depend on it" [35]. "Conversely, changes in an extension should not require adjustments
in the platform. This is accomplished through partitioning the platform into standalone
subsystems and linking hem using standardized interfaces that do not change often over
time" [37].
32. Modifiability [01][07][13][26]: "allows replacing or modifying components in a
layer, e.g., the evolution of a component trade mechanism to support pricing models"
[13].
33. Modularization [12][13][19][37]: "Modularity consists in applying the
traditional engineering principle related to decomposing a system in manageable
modules, minimizing the technical coupling among its parts" [13].
34. Niche creation [13]: "describes the SECO capability in creating opportunities to
new and old actors to explore new business chances" [13].

139
35. Offline capability [20]: "One common and important decision we often
encounter is how to deal with limited or interrupted network connections. While it
means definitely a much better user experience to offer the complete functionality of an
app in offline mode, it has to be considered that adding this feature significantly
increases complexity of synchronizing data between the different components of the app
ecosystem. In the end this often leads to the tradeoff of reduced maintainability and
extendibility. A compromise can be to implement offline support only for specific apps
or particular features of the ecosystem, but finally it depends on the importance of the
offline capability driver which approach should be taken" [20].
36. Open interfaces (for components) [32]: "The paper examines open interface
for components in a case study analyzing Chromium. It appears that all the external
components have open interfaces (i.e. public and standardized), so that Chromium can
evolve by replacing components with others implementing the same interfaces, or
shimmed to them, as long as the replacements are also under non-propagating OSS
licenses" [32].
37. Openness [01][02][21][22][24][32][37]: "Openness is the degree to which a
platform supplier allows the platform users to interact with the platform, view, extend or
change its components and depends on different technical and commercial aspects"
[01]. "Deals with the extensibility of products and processes, including management and
the technical aspects involved" [02]. "Openness is the property of a system architecture
to enable added-value services by incorporating third party contributions (typically
unknown in advance) while retaining essential qualities. Explicit mechanisms for
openness are established at development time and third party contributions utilize such
mechanisms at runtime. The decision to open a system architecture is always based on
business rationale" [24].
38. Parallel development [35]: "Ecosystem actors typically develop their platform
additions independently. A good SECO technical platform should enable parallel
independent development" [35].
39. Performance [11][21][24]: "An increase in the number of available features
will usually result in an increase in the size of the products that extend the platform,
often due to the use of a large number of plugins, can cause runtime performance and
140
memory problems" [11]. "Open systems need to ensure that system extensions do not
prevent the system from fulfilling essential performance requirements. There might be
risks of extensions that perform long running computations prolonging the response
time of systems or allocating an inadequate amount of system resources" [24].
40. Portability [22][37]: "Portability provided by a platform makes it easy for
developers writing extension to participate in the ecosystem, regardless of the
technologies used in their applications. This means it is necessary to standardize the
interfaces responsible for interactions with the platform. Portability describes the
platforms that are required to install the main platform" [37]. "The difference between
MSCRM and its Microsoft oriented stack immediately incurs all kinds of extra license
fees, whereas Ruby can be deployed on so many different configurations, it is hard for
developers to pick which underlying technology fits their extensions best" [22].
41. Productivity [13]: "describes the SECO activity level, i.e., how much business
is created, how much value is earned and how many actors are joined" [13].
42. Quality [14][18][38]: "The overall product quality depends on the combination
of software from the different contributors and failures often occur because of
component interaction, unclearly documented Application Programming Interfaces
(API) or unknown use of the system. A firm that controls a wide scope of the
architecture can guarantee the product quality more easily. In the situation where
multiple firms are involved, and especially when the interfaces are not clearly defined,
the quality can easily break down and externally developed code could access data in
the system, causing malfunctioning or security problems" [18].
43. Quality of extensions [29]: "it is crucial for platform suppliers to have a way of
certifying the quality of extensions provided by external developers. Only in this way
they can maintain a quality standard already established or to be established with final
end-users. Moreover, only through the definition of such mechanisms platform
suppliers might have the assurance that both defective and malicious extensions will not
affect the entire ecosystem" [29].
44. Rate of change [22][37]: "As platforms are frequently updated, significant
investments are needed from extenders to stay up to date and implement new features
for the platform. Software platform developers typically fight on two fronts: on the one

141
hand developers want their platform to accommodate new technologies, on the other
hand platforms must remain stable and reliable" [22].
45. Reliability [03][24][26][33]: "Reliability of software is the capability of itself to
maintain its level of stability under specified conditions for a specified period of time.
The reliability of software is influenced by process and product factors. Among them,
the design mechanism has a considerable impact on overall quality of the software"
(SELVARANI & BHARATHI, 2017).
46. Resiliency [37]: "One defective extension should not cause the entire ecosystem
to malfunction. The key here is to ensure that extensions are weakly coupled with the
platform through the use of well-defined interfaces. This approach of keeping platform-
extension dependencies to a minimum level also contributes to the stability of the entire
ecosystem" [37].
47. Reuse [07][37]: "The lack of a common, shared, infrastructure to reuse forced
companies to build all components themselves. Thus, small to medium sized business
with expertise in e.g. home care were essentially excluded for the market due to lack of
resources to develop and host server side solutions" [07]. "Platform modularization
allows software reuse to be achieved both by the platform architecture and by external
application, e.g., Apple does not allow applications to reuse" [37].
48. Robustness [13]: "Robustness describes how a SECO can recover from a major
stress by itself, such as keystone loss, the “death” of some niche players, or a
technological advance that affect the major part (community and/or platform) of the
SECO" [13].
49. Safety [24][29]: "For certain system types, like machinery, safety is an essential
concern. In such systems, attention has to be paid that behavior induced by extensions
does not pose any threat to the safety of users or the environment" [24].
50. Scalability [09][10][11]: "Scalability is the effort required to adapt the system to
new requirement that modify the size and scope of the computation" [10].
51. Security [03][21][24][26][33][37]: "Platform security potentially influence the
increasing of confidence perceived by external developers, encouraging them to adhere
to the ecosystem. Thus, some mechanisms are important to provide more security to the
142
platform, as authentication, usage limits, among other mechanisms to control or restrict
access to applications and users" [37].
52. Shared information [38]: "This challenge concerns the kind of information that
the platform providers can share with third-party developers. For privately ecosystems
this issue involves questions about market strategies and business survival. The focus of
our study is OSS ecosystems, which main characteristic is to keep open all information
about the ecosystem. Normally, information are shared in the website and in periodical
meetings to integrate the community. However, even in OSS ecosystems, sharing
information faces challenges such as keeping website updated, organize and distribute
information by appropriate means, sharing knowledge at the right time for all working
well, manage information regarding schedule pressures and unknown needs of different
clients, and so on" [38].
53. Simplicity [37]: "The platform architecture should be simple enough to be
comprehensible at least at high level of abstraction. Interactions between the platform
and extensions should be well defined and explicit. Platform functionality reused by any
extensions should also be identifiable" [37].
54. Stability [14][37]: "As the ecosystem grows, external developers end up
developing functionalities that are later incorporated into the platform, the platform
might expose new features, some of the platform features may be underutilized, etc. In
other words, the platform architecture needs to adapt to the ecosystem evolution, but the
frequency of changes should be limited to a reasonable level" [37].
55. Standardization across the platform [22]: "Standardization across the
platform is seen as Standardized user interface across different layers in the application,
thereby providing end-users with the feeling that they are always working within one
product, whereas it may be possible that the end user uses several products
simultaneously. One other example of standardization that is frequently praised is the
use of application templates, which can easily be altered to provide extension specific
feature" [22].
56. Support [22]: "quick and high-quality support for extenders is seen as having a
major positive effect on an extender’s experience and development speed with a
platform" [22].
143
57. Synchronization [20][21]: "A crucial part of an MSE (Mobile Software
Ecosystems) is also a reliable, performant and easy-to-use synchronization mechanism
that takes care of the distribution of data between backend, apps and other involved
components" [21].
58. Testability [35]: "a good SECO technical platform should support testing
platform additions in the context of ecosystem actors" [35].
59. Transparency [13]: "Transparency consists in making all kinds of development
information available, including design and code, development tasks, defects and
interactions among SECO stakeholders" [13].
60. User experience [21][24]: "In order to provide a great user experience, the
overall system has to make sure that the right data and functionality is available at the
right point in time at the right place" [21].
61. Understandability [35]: "The ecosystem, and its underlying technological
platform, should be easily comprehended by ecosystem actors. Important aspects to
comprehend include nature of the ecosystem, business rules" [35].
62. Variability [06][11][18][19][26]: "Variability management handles the way the
variable features and characteristic are managed in different product of the same SECO.
Variability among products of a SECO is necessary because it makes them a separate
business entity" [06].
63. Version compatibility [37]: "Compatibility between platform versions is
important for extension developers stay up-to-date with the platform. Extension
developers should be able to use new features launched by each platform release.
Furthermore, the process of updating an application should occur a stable manner. A
common practice is to offer developers the option to use a version o e released (in
testing) so that they can adjust their extensions over time" [37].
64. Working facilities [38]: "Practically all members of the community are affected
by the software architecture. They need work in a coordinated way and solve several
conflicts. For this, the keystone organization must adopted different working facilities
that allows support different views including modeling, business, communication and

144
knowledge management of the software architecture. These facilities should be accepted
and used by community to facilitate the combined work in a harmonious relation" [38].
References for definitions outside the set of papers resulting of the mapping study:
ALSPAUGH, T., ASUNCION, H., SCACCHI, W., 2009, "The Role of Software
Licenses in Open Architecture Ecosystems". In: First International Workshop
on Software Ecosystems (IWSECO-2009), Citeseer (2009), pp. 4-18, Falls
Church, Virginia, USA, September.
BIANCO, V., 2013, “Third-Party Developer Experience: Using the platform boundary
resources of a software ecosystem,” Master Thesis in Software Engineering.
Degree Programme in Computer Science and Engineering from Aalto
University, Finland, 90p.
BOLWIJN, P.T., KUMPE, T.: Manufacturing in the 1990s—Productivity, flexibility
and innovation. Long Range Planning 23(4), 44–57 (1990) ISSN 0024-6301
MATTSSON, M. AND BOSCH, J., 1999, "Characterizing stability in evolving
frameworks". In: Technology of Object-Oriented Languages and Systems, pp.
118-130.
SELVARANI R., BHARATHI R., 2017, Early Detection of Software Reliability: A
Design Analysis. In: Hosseinian-Far A., Ramachandran M., Sarwar D. (eds)
Strategic Engineering for Cloud Computing and Big Data Analytics. Springer,
Cham.
VAN GENUCHTEN, M., 2007, "The Impact of Software Growth on the Electronics
Industry", Computer 40(1): 106-108.
145
Appendix III - Survey forms
TERM OF CONSENT
STUDY GOALS
This survey aims to investigate if the presented critical factors are relevant to the technology
selection in a SECO, as well as if their related attributes fairly characterize them.
AGE
I declare to be over 18 (eighteen) years of age and agree to participate in a study conducted by
Thaiana Maria Pinheiro Lima (COPPE / UFRJ) under the supervision of Prof. Rodrigo Pereira
dos Santos (DIA/UNIRIO) and Profa. Cláudia Maria Lima Werner (COPPE / UFRJ).
PROCEDURE
The research will be conducted in three stages. In the first step, we ask that you respond to your
experience on some topics. In the second step, you will answer multiple choice questions about
the topics involved in the survey. In the third step, you can provide your own impressions and
aditional comments. It is estimated that you will spend 20-30 min.
CONFIDENTIALITY
I am aware that my name will not be disclosed under any circumstances. I am also aware that
the data obtained through this study will be kept confidential, and the results will then be pre-
sented in an aggregated form, so that a participant is not associated with a specific data.
Likewise, I accept not to communicate my results while the study is not completed, as well as to
maintain confidentiality of the techniques and documents presented and that are part of the ex-
periment.
BENEFITS AND FREEDOM OF WITHDRAWAL
The benefits I will receive from this study are limited to learning the material that is distributed.
I also understand that I am free to ask questions at any time, request that any information related
to me not be included in the study or report my withdrawal from participation without any pen-
alty. Finally, I declare that I participate of my own free will with the sole purpose of contrib-
uting to the advancement and development of techniques and processes for Software Engineer-
ing.
RESPONSIBLE RESEARCHER
Thaiana Maria Pinheiro Lima ([email protected])
Computer Science and Systems Engineering Department
COPPE/ Federal University of Rio de Janeiro
RESPONSIBLE PROFESSORS
Dr. Rodrigo Pereira dos Santos ([email protected])
Department of Applied Informatics - DIA/UNIRIO
Federal University of the State of Rio de Janeiro
Dr. Cláudia Maria Lima Werner ([email protected])
Computer Science and Systems Engineering Department
COPPE/ Federal University of Rio de Janeiro

146
SURVEY QUESTIONS

147
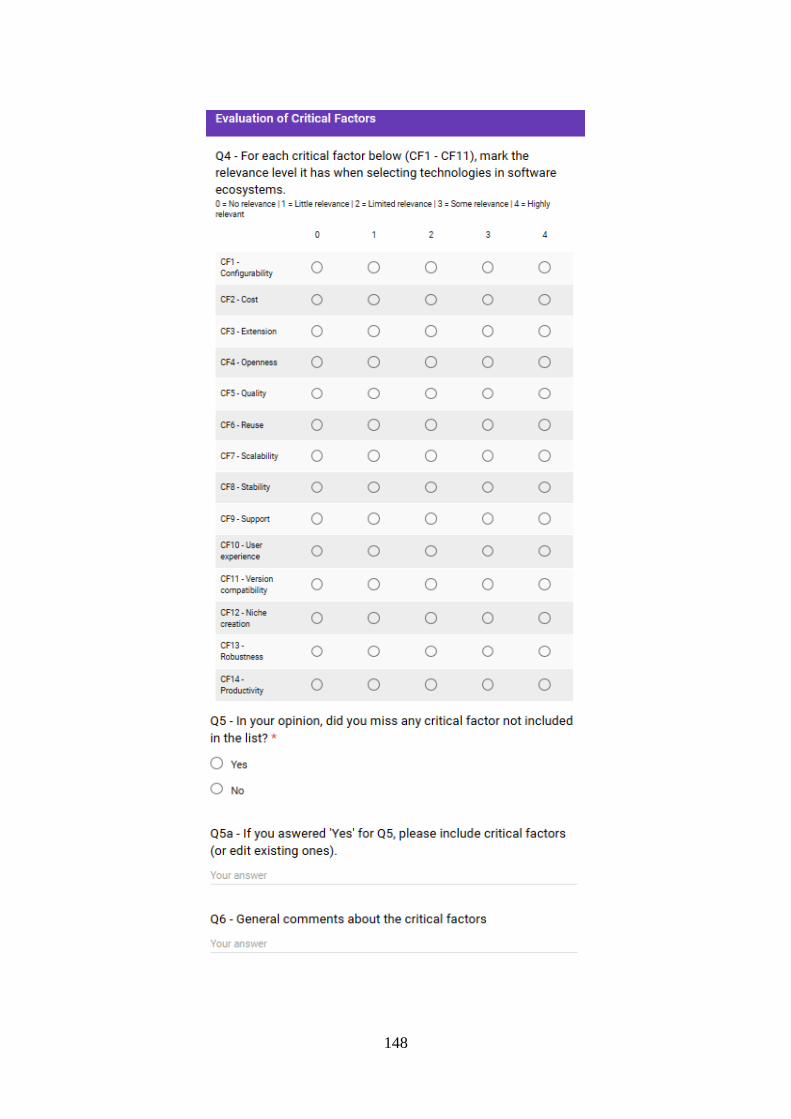
148
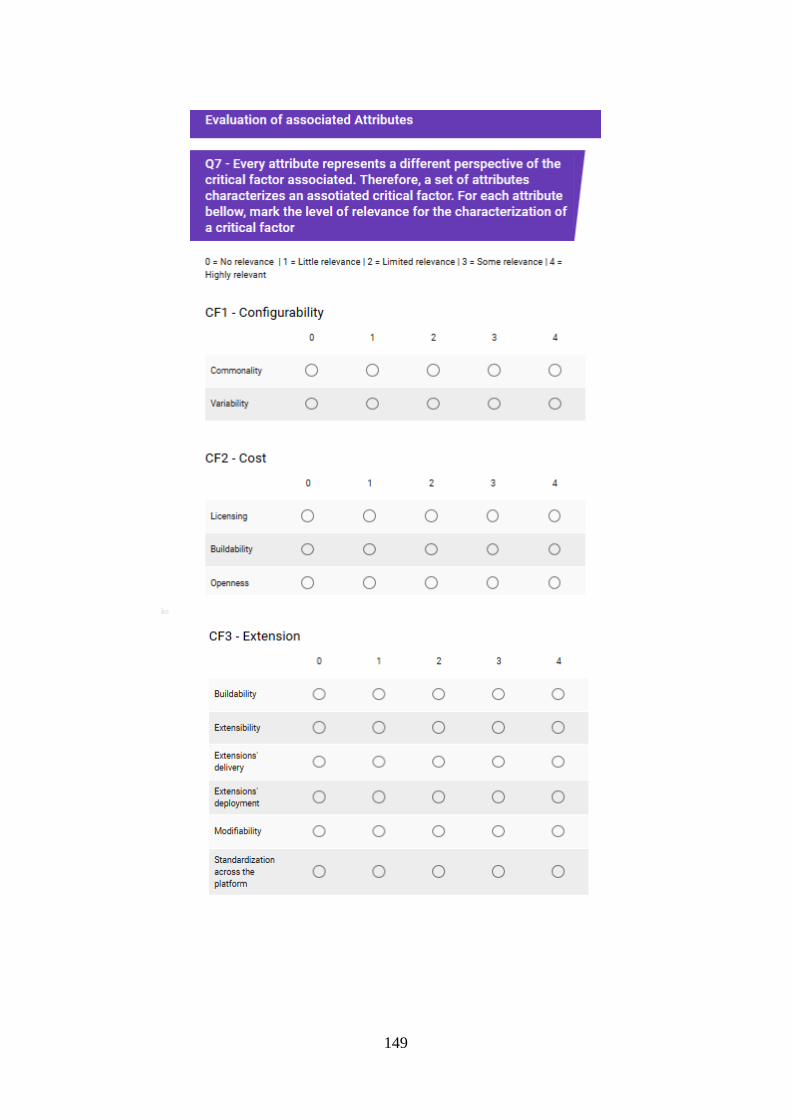
149
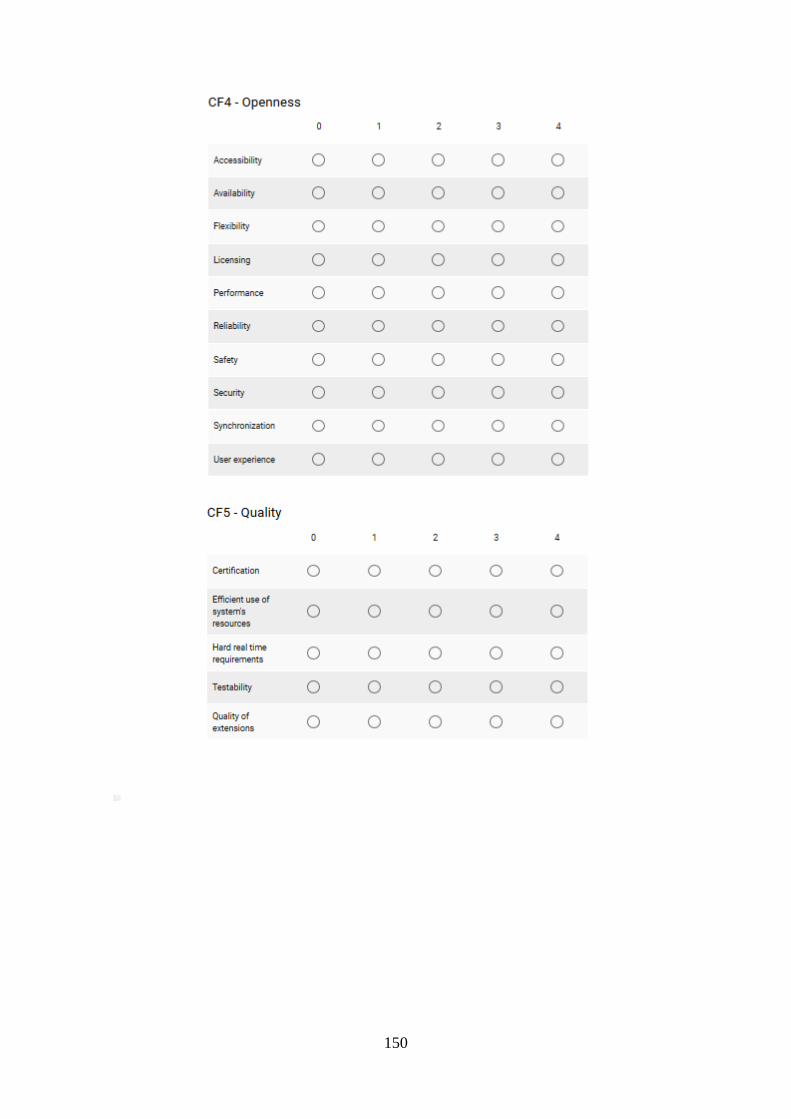
150

151

152
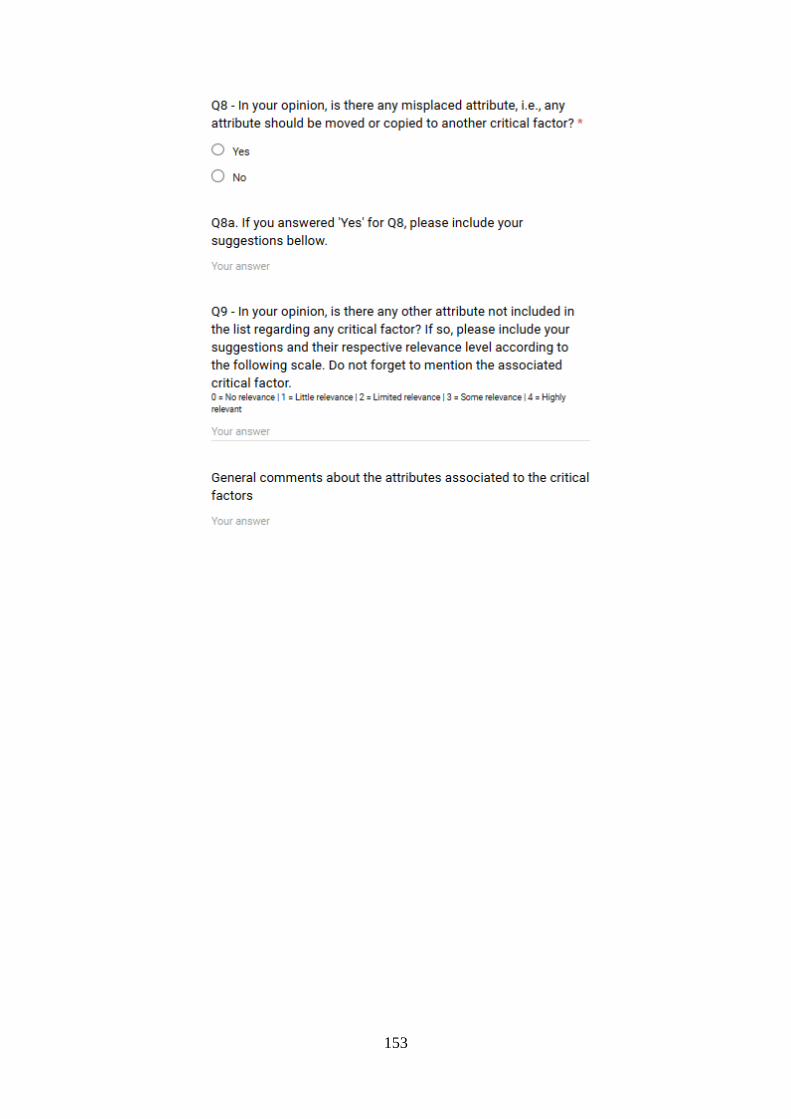
153

154
Appendix IV – Informed Consent Form (In Portuguese)
Investigação sobre Ecossistemas de Software
Termo de Consentimento Livre Esclarecido
OBJETIVO DO ESTUDO
Este estudo visa realizar uma investigação sobre Ecossistemas de Software.
IDADE
Eu declaro ter mais de 18 (dezoito) anos de idade e concordar em participar de um
estudo conduzido por Thaiana Maria Pinheiro Lima da COPPE/UFRJ, sob a orientação
do Prof. Rodrigo Pereira dos Santos e da Profa. Cláudia Maria Lima Werner.
PROCEDIMENTO
A pesquisa será realizada em duas etapas. Na primeira etapa, pedimos que você
responda sobre sua experiência em alguns temas. Assim, caso concorde em participar
do estudo, realize esta primeira etapa respondendo ao questionário enviado.
Na segunda etapa (que será agendada diretamente com você), você será convidado a
realizar algumas tarefas. Você receberá orientações sobre como realizar as atividades,
bem como os dados de acesso para realização do estudo.
Para participar deste estudo, solicitamos a sua especial colaboração em: (1) fornecer
informações sobre sua experiência; (2) permitir que os dados resultantes da sua
participação sejam estudados; (3) informar o tempo gasto nas atividades; e (4)
responder um questionário final com as suas impressões. Quando os dados forem
coletados, seu nome será removido destes e não será utilizado em nenhum momento
durante a apresentação dos resultados.
Estima-se que para realizar a primeira etapa sejam necessários cerca de 3 (cinco)
minutos e que para realizar a 2a etapa seja necessário, aproximadamente, 30 (trinta)
minutos.
CONFIDENCIALIDADE
Eu estou ciente de que meu nome não será divulgado em hipótese alguma. Também
estou ciente de que os dados obtidos por meio deste estudo serão mantidos sob
confidencialidade, e os resultados serão posteriormente apresentados de forma
agregada, de modo que um participante não seja associado a um dado específico.
Da mesma forma, me comprometo a não comunicar meus resultados enquanto o estudo
não for concluído, bem como manter sigilo das técnicas e documentos apresentados e
que fazem parte do experimento.
BENEFÍCIOS E LIBERDADE DE DESISTÊNCIA
Eu entendo que, uma vez o experimento tenha terminado, os trabalhos que desenvolvi
serão estudados visando entender a eficiência dos procedimentos e as técnicas que me
foram ensinadas.
Os benefícios que receberei deste estudo são limitados ao aprendizado do material que é
distribuído e ensinado. Também entendo que sou livre para realizar perguntas a
qualquer momento, solicitar que qualquer informação relacionada à minha pessoa não
seja incluída no estudo ou comunicar minha desistência de participação, sem qualquer
penalidade. Por fim, declaro que participo de livre e espontânea vontade com o único
155
intuito de contribuir para o avanço e desenvolvimento de técnicas e processos para a
Engenharia de Software.
PESQUISADORA RESPONSÁVEL
Thaiana Maria Pinheiro Lima ([email protected]) Programa de Engenharia de Sistemas e Computação - COPPE/UFRJ
PROFESSORES RESPONSÁVEIS
Prof. Rodrigo Pereira dos Santos ([email protected]) Programa de Pós-Graduação em Informática - PPGI/UNIRIO
Profa. Cláudia Maria Lima Werner ([email protected]) Programa de Engenharia de Sistemas e Computação - COPPE/UFRJ
Data, nome do participante e rubrica
156
Appendix V - Participant Characterization Form (In Portuguese)
Investigação sobre Ecossistemas de Software
Formulário de Caracterização do Participante
Código do
Participante:
Este formulário contém algumas perguntas sobre sua experiência acadêmica e
profissional.
1. Formação Acadêmica
( ) Pós-Doutorado
( ) Doutorado concluído
( ) Doutorado em andamento
( ) Mestrado concluído
( ) Mestrado em andamento
( ) Especialização concluída
( ) Especialização em andamento
( ) Graduação concluída
( ) Graduação em andamento
2. Experiência Profissional
a) Tempo de Experiência
Por favor, detalhe sua resposta. Inclua o número de anos e meses de experiência em
atividades da gestão de TI.
Comentários:
Desde já, agradecemos a sua colaboração.
Thaiana Maria Pinheiro Lima
Rodrigo Pereira dos Santos
Cláudia Maria Lima Werner
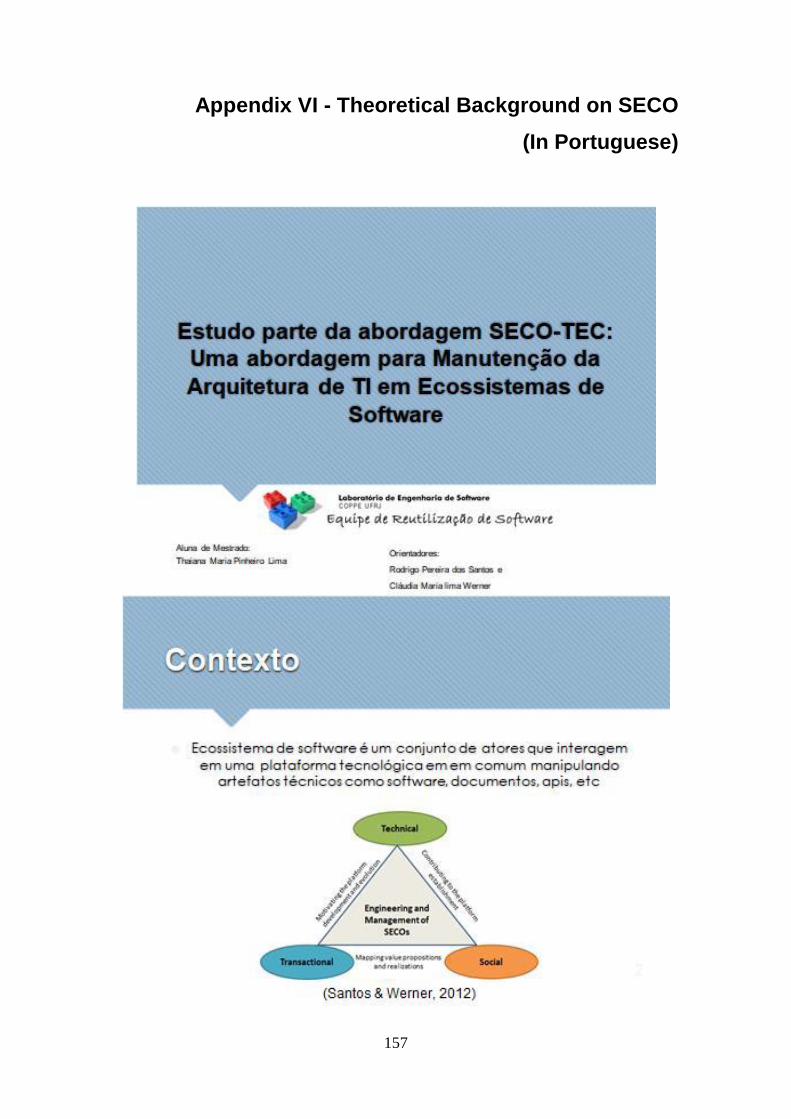
157
Appendix VI - Theoretical Background on SECO
(In Portuguese)
158
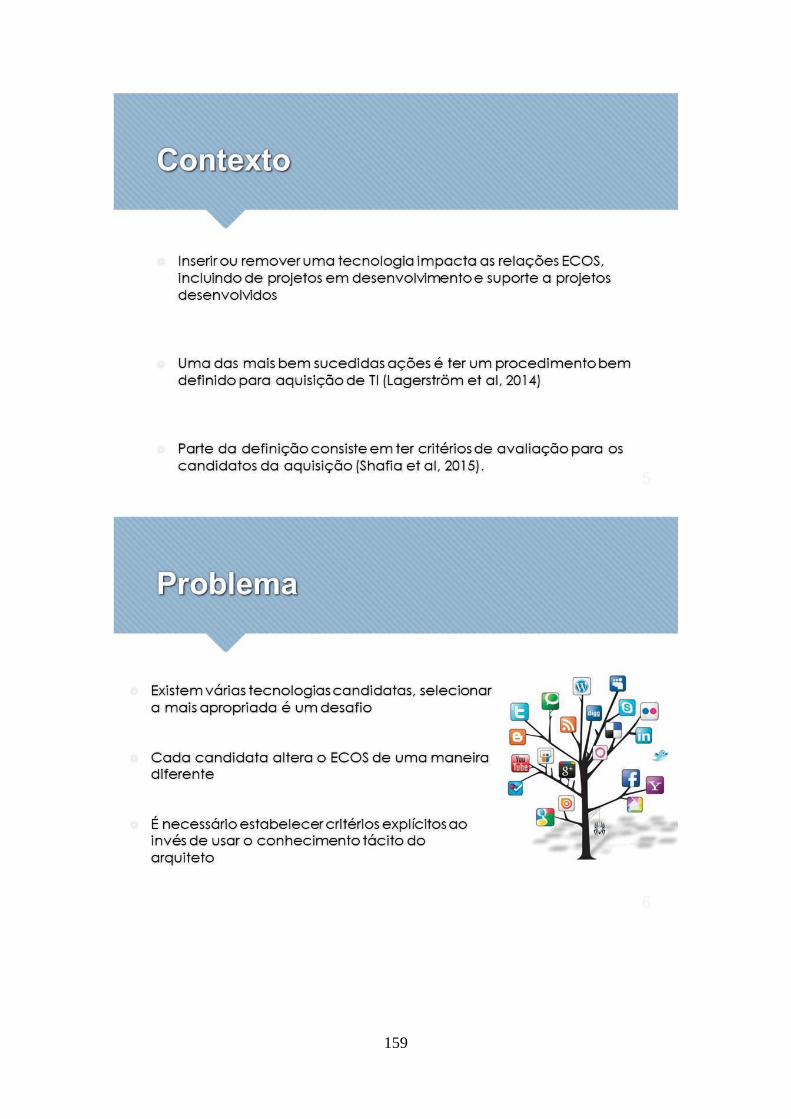
159
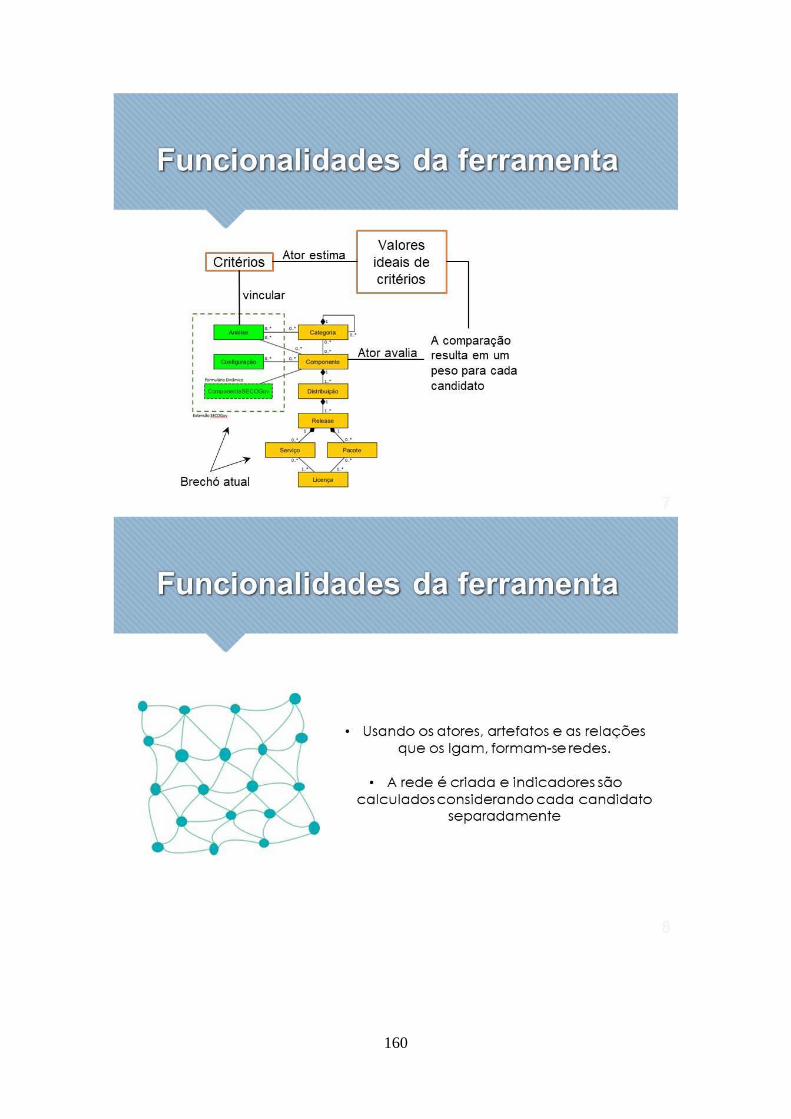
160
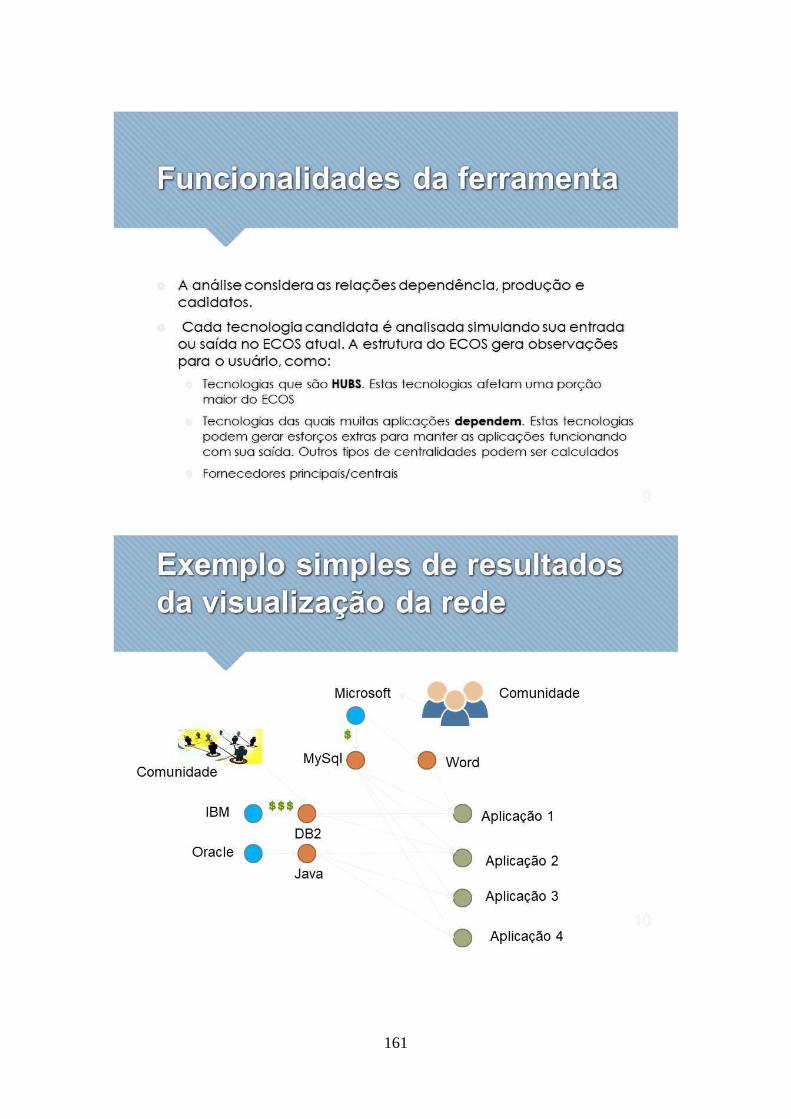
161
162

163
Appendix VII – Tool’s Instructions
(In Portuguese)
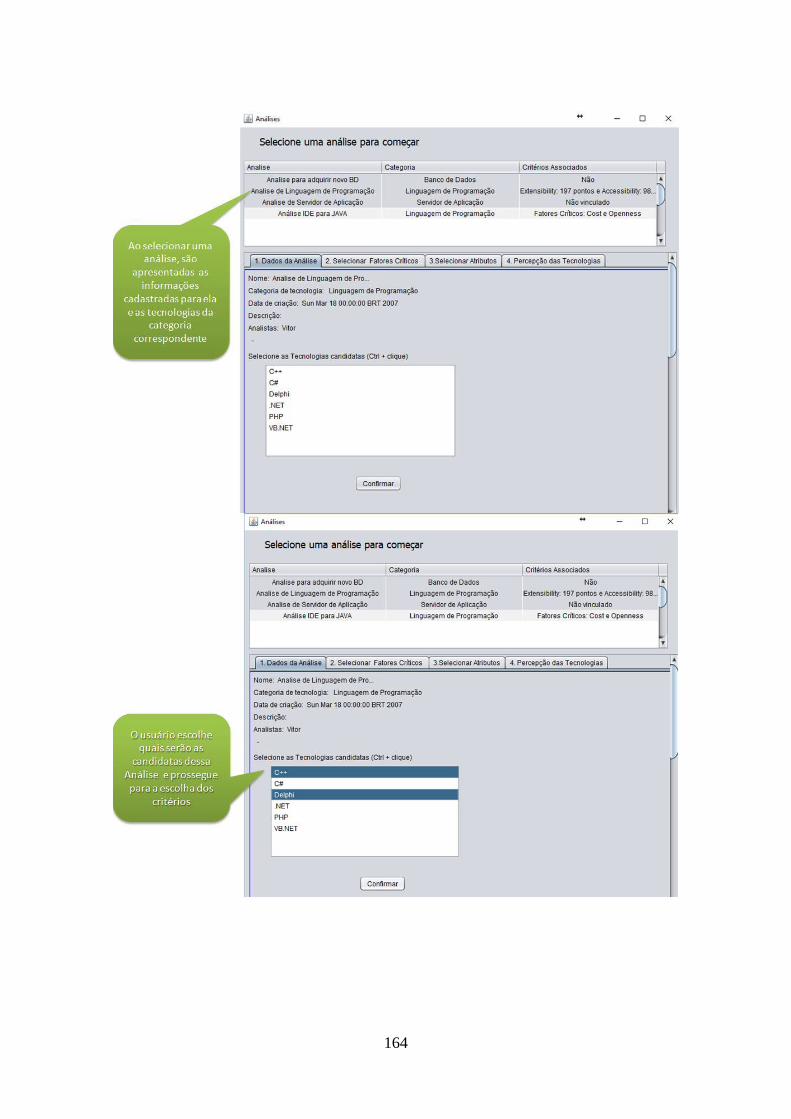
164

165
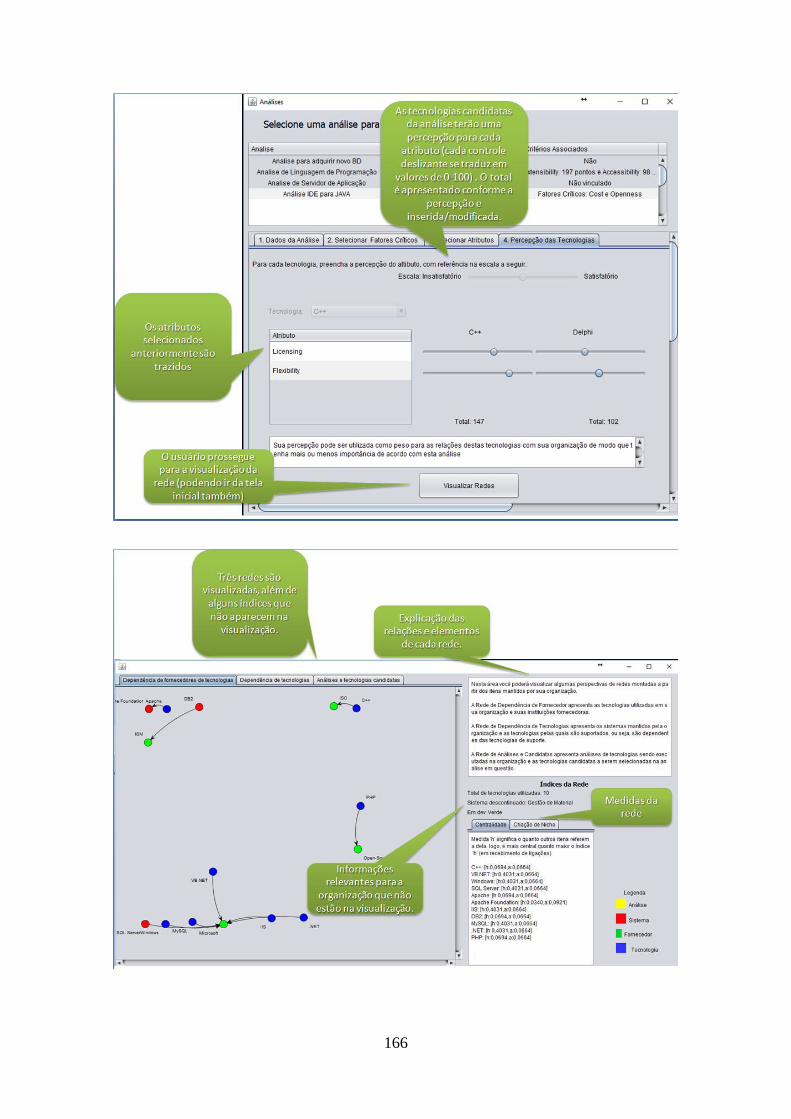
166

167
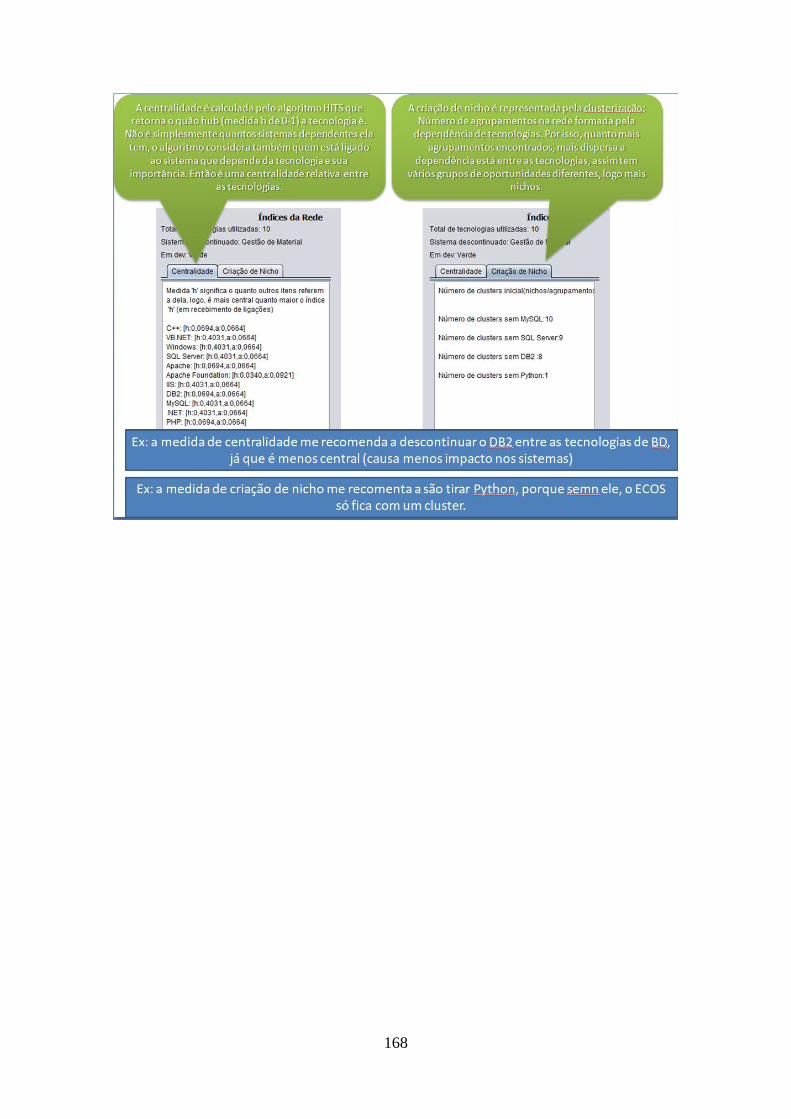
168
169
Appendix VIII - Form for Conducting the Study
(Tasks in Portuguese)
Investigação sobre Ecossistemas de Software
Formulário para Realização do Estudo
Data:
Código do
Participante:
CONTEXTUALIZAÇÃO
Você é um dos gestores de TI ou arquiteto de software/TI da sua organização, atuando
na gestão de TI no seu dia a dia, mais especificamente na manutenção da arquitetura de
TI selecionando tecnologias para inserção, descontinuidade e substituição. Sua
organização possui uma variedade de atividades executadas, visando atender aos seus
objetivos de negócio. Para tanto, ela prescinde de software do tipo sistema (e.g.,
Sistema Eletrônico de Informações – SEI, Sistema de Acompanhamento de Processos).
Os sistemas, por sua vez, dependem de outros sistemas e de tecnologia de suporte (e.g.,
Java, Windows, DB2). As tecnologias que apoiam os processos de trabalho da
organização e atendimento aos objetivos de negócio formam a arquitetura TI. A
configuração desta arquitetura é alterada a cada nova aquisição, descontinuidade ou
substituição de tecnologias de suporte.
Sua tarefa principal é avaliar a tecnologia prospectada, entre diversas candidatas,
incluindo seus fornecedores e impacto no restante da organização. Assim, você realiza
análises do ecossistema de software da organização e compara as tecnologias candidatas
em critérios previamente definidos.
INSTRUÇÕES
Para a execução desta atividade, siga as instruções abaixo.
● Resolva as tarefas do formulário na ordem em que elas são apresentadas.
● Registre o horário de início e o horário de término de cada atividade sempre
que solicitado. Se for gasto algum tempo no entendimento do modelo antes das
atividades, este tempo não deve ser contabilizado.
● Caso não consiga determinar a resposta, mas tenha uma medida de quanto
tempo levaria para executá-la, por favor, responda com o valor em questão
e com a palavra “estimativa” entre parêntesis e some as estimativas ao ho-
rário de término.
TAREFAS
TEMPO
Horário de Início:
Horário de Término:
Q1) Qual o nome da Análise da categoria Banco de dados registrados pela organização?

170
Q2) ) Qual o principal critério (atributos de qualidade/arquitetura) envolvido na Análise
de Sistemas Operacionais?
Q3) Quais fatores críticos são considerados na Análise IDE para JAVA?
Q4 Quantas tecnologias compõem o ecossistema de software da organização?
Q5) Com qual tecnologia as aplicações da organização possuem mais dependências?
Q6) Quais sistemas estão descontinuados e se mantêm registrados na organização? (Cite
ao menos um sistema)
Q7) Qual tecnologia de linguagem de programação não deve ser selecionada para
descontinuidade, caso se opte por não interferir em aplicações em desenvolvimento?
Q8) Qual tecnologia de banco de dados deve ser selecionada para aquisição para
aumentar a criação de nicho (novos grupamentos) de aplicações em produção?
Q9) Caso a tecnologia de linguagem de programação .NET seja substituída por Python,
qual o impacto gerado sobre a situação do ecossistema da empresa? Quer dizer, a
organização torna melhor seus índices, i.e., melhora a criação de nicho, melhora a
atividade da comunidade, suporta sitemas?
Q10) Qual fornecedor de tecnologia é central (HUB) na organização?
Obrigado pela sua colaboração.
Thaiana Maria Pinheiro Lima
Rodrigo Pereira dos Santos
Cláudia Maria Lima Werner

171
Appendix IX - Study Evaluation Questionnaire (In Portuguese)
FEEDBACK WITHOUT TOOL
Investigação sobre Ecossistemas de Software
Questionário de Avaliação do Estudo
Data:
Código do
Participante:
Prezado(a) participante,
Esta é a última parte do estudo. O objetivo deste questionário é obter informações
adicionais e a sua percepção sobre o estudo, a partir das respostas às questões listadas a
seguir:
1) Você conseguiu efetivamente realizar todas as tarefas propostas?
( ) Sim ( ) Não
Comentários:
2) Você ficou satisfeito com o resultado final das tarefas?
( ) Sim ( ) Parcialmente ( ) Não
Comentários:
3) No seu ponto de vista, a visão de Ecossistemas de Software pode beneficiar ou
apoiar atividades de Gestão de TI, mais especificamente a manutenção da arquite-
tura de TI e percepção do seu impacto na organização?
( ) Sim ( ) Parcialmente ( ) Não
Comentários:
4) Qual o grau de dificuldade na realização das tarefas?
( ) A execução das tarefas é muito difícil
( ) A execução das tarefas é difícil
( ) A execução das tarefas é fácil
( ) A execução das tarefas é muito fácil
Comentários:
5) Qual a maior dificuldade encontrada na realização das tarefas?
Comentários:

172
6) Este espaço é reservado para quaisquer comentários adicionais (dificuldades, críti-
cas e/ou sugestões) a respeito do estudo executado. Contamos com sua contribuição
para que o trabalho seja aprimorado.
Comentários:
Novamente, gostaríamos de agradecer pela sua disponibilidade e participação neste
estudo.
Thaiana Maria Pinheiro Lima
Rodrigo Pereira Santos
Cláudia Maria Lima Werner
173
FEEDBACK WITH TOOL
Investigação sobre Ecossistemas de Software
Questionário de Avaliação do Estudo
Data:
Código do
Participante:
Prezado(a) participante,
Esta é a última parte do estudo. O objetivo deste questionário é obter informações
adicionais e a sua percepção sobre o estudo, a partir das respostas às questões listadas a
seguir:
1) Você conseguiu efetivamente realizar todas as tarefas propostas?
( ) Sim ( ) Não
Comentários:
2) Você ficou satisfeito com o resultado final das tarefas?
( ) Sim ( ) Parcialmente ( ) Não
Comentários:
3) No seu ponto de vista, é possível perceber como atividades de Gestão de TI, mais
especificamente na seleção de tecnologias e análise do ecossistema de software, po-
dem ser beneficiadas pela visão de Ecossistemas de Software usando as informa-
ções apresentadas?
( ) Sim ( ) Parcialmente ( ) Não
Comentários:
4) Qual o grau de dificuldade na realização das tarefas?
( ) A execução das tarefas é muito difícil
( ) A execução das tarefas é difícil
( ) A execução das tarefas é fácil
( ) A execução das tarefas é muito fácil
Comentários:
5) Qual a maior dificuldade encontrada na realização das tarefas?
Comentários:
6) Ferramenta SECO-AM
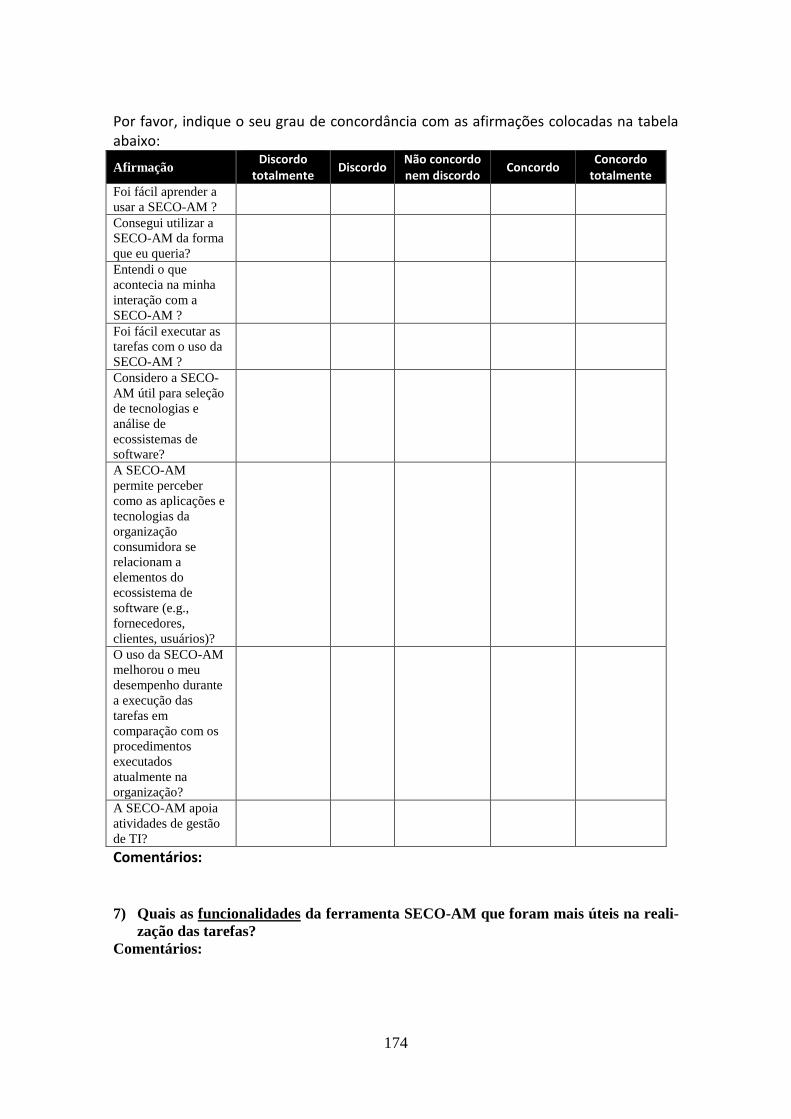
174
Por favor, indique o seu grau de concordância com as afirmações colocadas na tabela abaixo:
2.1. Afirmação Discordo
totalmente Discordo
Não concordo nem discordo
Concordo Concordo
totalmente Foi fácil aprender a
usar a SECO-AM ?
Consegui utilizar a
SECO-AM da forma
que eu queria?
Entendi o que
acontecia na minha
interação com a
SECO-AM ?
Foi fácil executar as
tarefas com o uso da
SECO-AM ?
Considero a SECO-
AM útil para seleção
de tecnologias e
análise de
ecossistemas de
software?
A SECO-AM
permite perceber
como as aplicações e
tecnologias da
organização
consumidora se
relacionam a
elementos do
ecossistema de
software (e.g.,
fornecedores,
clientes, usuários)?
O uso da SECO-AM
melhorou o meu
desempenho durante
a execução das
tarefas em
comparação com os
procedimentos
executados
atualmente na
organização?
A SECO-AM apoia
atividades de gestão
de TI?
Comentários:
7) Quais as funcionalidades da ferramenta SECO-AM que foram mais úteis na reali-
zação das tarefas?
Comentários:

175
8) De acordo com sua opinião, liste os aspectos positivos da utilização da ferramenta
SECO-AM .
Comentários:
9) De acordo com sua opinião, liste os aspectos negativos da utilização da ferramenta
SECO-AM .
Comentários:
10) Você possui alguma sugestão para melhoria da ferramenta SECO-AM ? Em caso
positivo, por favor, especifique-a(s).
( ) Sim ( ) Não
Comentários:
11) Quais conclusões ou observações você pode extrair sobre a utilização da percepção
dos gestores e arquitetos de TI sobre cada tecnologia candidata em critérios previ-
amente definidos?
Comentários:
12) Quais conclusões ou observações você pode extrair sobre a análise do ecossistema
de software da organização?
Comentários:
13) Este espaço é reservado para quaisquer comentários adicionais (dificuldades, críti-
cas e/ou sugestões) a respeito do estudo executado. Contamos com sua contribuição
para que o trabalho seja aprimorado.
Comentários:
Novamente, gostaríamos de agradecer pela sua disponibilidade e participação neste
estudo.
Thaiana Maria Pinheiro Lima
Rodrigo Pereira Santos
Cláudia Maria Lima Werner