Embed Size (px)
DESCRIPTION
Analise Estatica
Citation preview

U
FA
BC
– A
ná
lise
s E
stá
tica
em
SE
P
Edmarcio Belati
1
Prof. Edmarcio Antonio Belati
Aula 3Aula 3
26/02/2015
Banco de dados
Matpower
PowerWord
• IEEE Common Data Format
• PTI Power Flow Data Format
• PECO PSAP Format
Análises Estática em Sistemas
Elétricos de Potência

U
FA
BC
– A
ná
lise
s E
stá
tica
em
SE
P
Edmarcio Belati
2
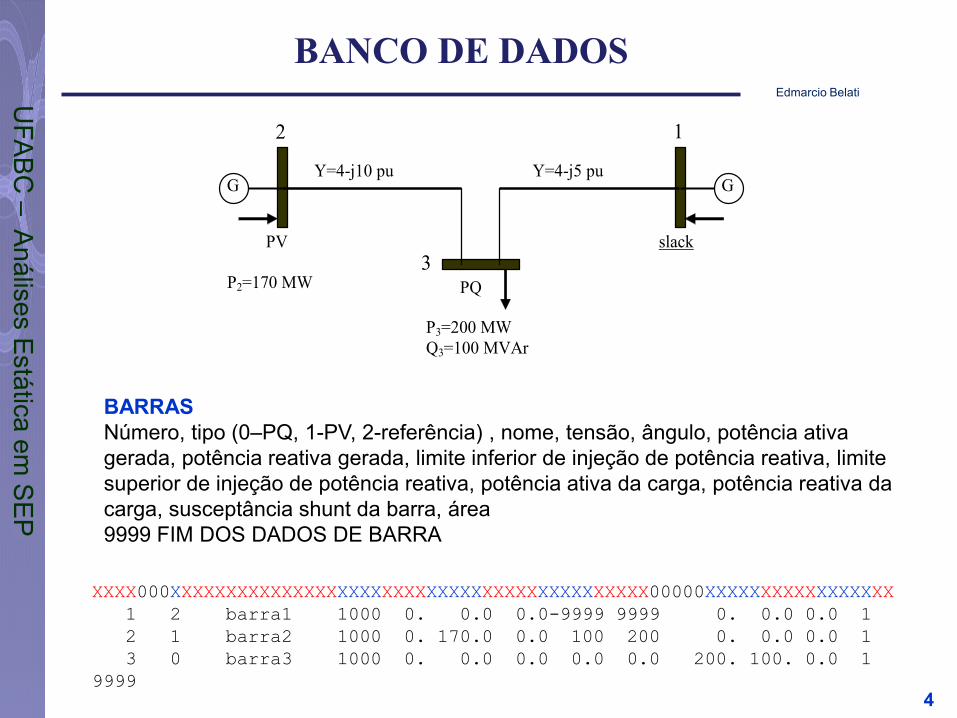
BANCO DE DADOS
O sistema de potência, tanto de distribuição como de transmissão,
podem apresentar uma grande quantidade de barras, linhas, e
componentes .
Assim, trabalhar com bancos de dados para representar o
sistema é uma prática muito usada.
O banco de dados precisa representar fielmente todos os
componentes do sistema e ainda informa os níveis de tensão ou
as bases dos sistema ( potência de base e tensão de base).
Essas informações são necessárias para o entendimento e
análise dos resultados.

U
FA
BC
– A
ná
lise
s E
stá
tica
em
SE
P
Edmarcio Belati
3
G G
PV slack
PQ
P3=200 MW
Q3=100 MVAr
P2=170 MW
Y=4-j10 pu Y=4-j5 pu
2
3
1
1 2 barra1 1000 0. 0.0 0.0-9999 9999 0. 0.0 0 1
2 1 barra2 1000 0. 0.0 0.0 100 200 -170. 0.0 0 1
3 0 barra3 1000 0. 0.0 0.0 200. 100. 0 1
9999
1 3 9.7561 12.195 0.00 0.00 0.00 999
2 3 3.4483 8.6206 0.00 0.00 0.00 999
9999
Exemplo de Banco de dados
EXEMPLO – Sistema 3 barras
BANCO DE DADOS
U
FA
BC
– A
ná
lise
s E
stá
tica
em
SE
P
Edmarcio Belati
XXXX000XXXXXXXXXXXXXXXXXXXXXXXXXXXXXXXXXXXXXXXXXXX00000XXXXXXXXXXXXXXXXX
1 2 barra1 1000 0. 0.0 0.0-9999 9999 0. 0.0 0.0 1
2 1 barra2 1000 0. 170.0 0.0 100 200 0. 0.0 0.0 1
3 0 barra3 1000 0. 0.0 0.0 0.0 0.0 200. 100. 0.0 1
9999
BARRAS
Número, tipo (0–PQ, 1-PV, 2-referência) , nome, tensão, ângulo, potência ativa
gerada, potência reativa gerada, limite inferior de injeção de potência reativa, limite
superior de injeção de potência reativa, potência ativa da carga, potência reativa da
carga, susceptância shunt da barra, área
9999 FIM DOS DADOS DE BARRA
4
BANCO DE DADOS
G G
PV slack
PQ
P3=200 MW
Q3=100 MVAr
P2=170 MW
Y=4-j10 pu Y=4-j5 pu
2
3
1

U
FA
BC
– A
ná
lise
s E
stá
tica
em
SE
P
Edmarcio Belati
XXXX0000XXXX00000XXXXXXXXXXXXXXXXXXXXXXXXXXXXXXXXX0000000000XXXX
1 3 9.7561 12.195 0.00 0.00 0.00 0.00 999
2 3 3.4483 8.6206 0.00 0.00 0.00 0.00 999
9999
LINHAS
Barra inicial, barra final, resistência (%), reatância (%), susceptância shunt da linha,
tap, tap minímo, tap máximo, limite de fluxo de potência ativa.
9999 FIM DOS DADOS DE LINHA
Susceptância: total em MVAr, “gerado” pela linha
B=BSH/(100*2) pu, onde 100 é a base em MVA.
5
BANCO DE DADOS
G G
PV slack
PQ
P3=200 MW
Q3=100 MVAr
P2=170 MW
Y=4-j10 pu Y=4-j5 pu
2
3
1

U
FA
BC
– A
ná
lise
s E
stá
tica
em
SE
P
Edmarcio Belati
http://www.ee.washington.edu/research/pstca/
No link abaixo vários bancos de dados de sistemas elétricos
utilizados para testes de algorítmos de fluxo de carga podem
ser encontrados.
Sistema de 14 barras - dados
Exemplo: Sistema de 14 barras:
IEEE Common Data Format
PTI Power Flow Data Format
PECO PSAP Format
6
BANCO DE DADOS

U
FA
BC
– A
ná
lise
s E
stá
tica
em
SE
P
Edmarcio Belati
EXEMPLO – Sistema 14 Barras 7
BANCO DE DADOS

U
FA
BC
– A
ná
lise
s E
stá
tica
em
SE
P
Edmarcio Belati
8
BANCO DE DADOS

U
FA
BC
– A
ná
lise
s E
stá
tica
em
SE
P
Edmarcio Belati
1 2 Bus 1 1059 0. 232. -17.-9999 9999 0. 0. 0.
2 1 Bus 2 1044 -5. 40. 42. -40. 50. 22. 13. 0.
3 1 Bus 3 1009-13. 0. 23. 0. 40. 94. 19. 0.
4 0 Bus 4 1019-10. 0. 0. 0. 0. 48. -4. 0.
5 0 Bus 5 1019 -9. 0. 0. 0. 0. 8. 2. 0.
6 1 Bus 6 1070-14. 0. 12. -6. 24. 11. 8. 0.
7 0 Bus 7 1062-13. 0. 0. 0. 0. 0. 0. 0.
8 1 Bus 8 1090-13. 0. 17. -6. 24. 0. 0. 0.
9 0 Bus 9 1055-15. 0. 0. 0. 0. 29. 17. 19.
10 0 Bus 10 1050-15. 0. 0. 0. 0. 9. 6. 0.
11 0 Bus 11 1057-15. 0. 0. 0. 0. 4. 2. 0.
12 0 Bus 12 1054-15. 0. 0. 0. 0. 6. 2. 0.
13 0 Bus 13 1049-15. 0. 0. 0. 0. 13. 6. 0.
14 0 Bus 14 1036-16. 0. 0. 0. 0. 15. 5. 0.
9999
1 2 1.94 5.92 5.2800.0000.0000.000 0.
1 5 5.40 22.30 4.9200.0000.0000.000 0.
2 3 4.70 19.80 4.3800.0000.0000.000 0.
2 4 5.81 17.63 3.4000.0000.0000.000 0.
2 5 5.69 17.39 3.4600.0000.0000.000 0.
3 4 6.70 17.10 1.2800.0000.0000.000 0.
4 5 1.33 4.21 0.0000.0000.0000.000 0.
4 7 0.00 20.91 0.0001.0000.1001.000 0.
4 9 0.00 55.62 0.0001.0000.1001.000 0.
5 6 0.00 25.20 0.0001.0000.1001.000 0.
6 11 9.50 19.89 0.0000.0000.0000.000 0.
6 12 12.29 25.58 0.0000.0000.0000.000 0.
6 13 6.62 13.03 0.0000.0000.0000.000 0.
7 8 0.00 17.61 0.0000.0000.0000.000 0.
7 9 0.00 11.00 0.0000.0000.0000.000 0.
9 10 3.18 8.45 0.0000.0000.0000.000 0.
9 14 12.71 27.04 0.0000.0000.0000.000 0.
10 11 8.20 19.21 0.0000.0000.0000.000 0.
12 13 22.09 19.99 0.0000.0000.0000.000 0.
13 14 17.09 34.80 0.0000.0000.0000.000 0.
9999
9
BANCO DE DADOS

U
FA
BC
– A
ná
lise
s E
stá
tica
em
SE
P
Edmarcio Belati
10
MATPOWER
MATPOWER is a package of MATLAB® M-files for
solving power flow and optimal power flow
problems. It is intended as a simulation tool for
researchers and educators that is easy to use and
modify. MATPOWER is designed to give the best
performance possible while keeping the code
simple to understand and modify.
http://www.pserc.cornell.edu/matpower/
Acessar o link e baixar o pacote (todos).

U
FA
BC
– A
ná
lise
s E
stá
tica
em
SE
P
Edmarcio Belati
BANCO DE DADOS – 14 barras
%% bus data
% bus_i type Pd Qd Gs Bs area Vm Va baseKV zone Vmax Vmin
bus = [
1 3 0 0 0 0 1 1.016 0 0 1 1.016 0.94;
2 2 21.7 12.7 0 0 1 1.045 -4.98 0 1 1.06 0.94;
3 2 94.2 19 0 0 1 1.01 -12.72 0 1 1.06 0.94;
4 1 47.8 -3.9 0 0 1 1.019 -10.33 0 1 1.06 0.94;
5 1 7.6 1.6 0 0 1 1.02 -8.78 0 1 1.06 0.94;
6 2 11.2 7.5 0 0 1 1.07 -14.22 0 1 1.06 0.94;
7 1 0 0 0 0 1 1.062 -13.37 0 1 1.06 0.94;
8 2 0 0 0 0 1 1.09 -13.36 0 1 1.06 0.94;
9 1 29.5 16.6 0 19 1 1.056 -14.94 0 1 1.06 0.94;
10 1 9 5.8 0 0 1 1.051 -15.1 0 1 1.06 0.94;
11 1 3.5 1.8 0 0 1 1.057 -14.79 0 1 1.06 0.94;
12 1 6.1 1.6 0 0 1 1.055 -15.07 0 1 1.06 0.94;
13 1 13.5 5.8 0 0 1 1.05 -15.16 0 1 1.06 0.94;
14 1 14.9 5 0 0 1 1.036 -16.04 0 1 1.06 0.94;
];
11

U
FA
BC
– A
ná
lise
s E
stá
tica
em
SE
P
Edmarcio Belati
Utilizando o Matpower .
12
BANCO DE DADOS

U
FA
BC
– A
ná
lise
s E
stá
tica
em
SE
P
Edmarcio Belati
%% generator data
% bus Pg Qg Qmax Qmin Vg mBase status Pmax Pmin
gen = [
1 232.4 -16.9 10 0 1.06 100 1 332.4 0;
2 40 42.4 50 -40 1.045 100 1 140 0;
3 0 23.4 40 0 1.01 100 1 100 0;
6 0 12.2 24 -6 1.07 100 1 100 0;
8 0 17.4 24 -6 1.09 100 1 100 0;
];
BANCO DE DADOS – 14 barras
13

U
FA
BC
– A
ná
lise
s E
stá
tica
em
SE
P
Edmarcio Belati
Generator Data Format
1 bus number
(-) (machine identifier, 0-9, A-Z)
2 Pg, real power output (MW)
3 Qg, reactive power output (MVAr)
4 Qmax, maximum reactive power output (MVAr)
5 Qmin, minimum reactive power output (MVAr)
6 Vg, voltage magnitude setpoint (p.u.)
(-) (remote controlled bus index)
7 mBase, total MVA base of this machine, defaults to baseMVA
(-) (machine impedance, p.u. on mBase)
(-) (step up transformer impedance, p.u. on mBase)
(-) (step up transformer off nominal turns ratio)
8 status, > 0 - machine in service
<= 0 - machine out of service
(-) (% of total VAr's to come from this gen in order to hold V at
remote bus controlled by several generators)
9 Pmax, maximum real power output (MW)
10 Pmin, minimum real power output (MW)
(2) 11 Pc1, lower real power output of PQ capability curve (MW)
(2) 12 Pc2, upper real power output of PQ capability curve (MW)
(2) 13 Qc1min, minimum reactive power output at Pc1 (MVAr)
(2) 14 Qc1max, maximum reactive power output at Pc1 (MVAr)
(2) 15 Qc2min, minimum reactive power output at Pc2 (MVAr)
(2) 16 Qc2max, maximum reactive power output at Pc2 (MVAr)
(2) 17 ramp rate for load following/AGC (MW/min)
(2) 18 ramp rate for 10 minute reserves (MW)
(2) 19 ramp rate for 30 minute reserves (MW)
(2) 20 ramp rate for reactive power (2 sec timescale) (MVAr/min)
(2) 21 APF, area participation factor 14

U
FA
BC
– A
ná
lise
s E
stá
tica
em
SE
P
Edmarcio Belati
%% branch data
% fbus tbus r x b rateA rateB rateC ratio angle status
branch = [
1 2 0.01938 0.05917 0.0528 9900 0 0 0 0 1;
1 5 0.05403 0.22304 0.0492 9900 0 0 0 0 1;
2 3 0.04699 0.19797 0.0438 9900 0 0 0 0 1;
2 4 0.05811 0.17632 0.034 9900 0 0 0 0 1;
2 5 0.05695 0.17388 0.0346 9900 0 0 0 0 1;
3 4 0.06701 0.17103 0.0128 9900 0 0 0 0 1;
4 5 0.01335 0.04211 0 9900 0 0 0 0 1;
4 7 0 0.20912 0 9900 0 0 0.978 0 1;
4 9 0 0.55618 0 9900 0 0 0.969 0 1;
5 6 0 0.25202 0 9900 0 0 0.932 0 1;
6 11 0.09498 0.1989 0 9900 0 0 0 0 1;
6 12 0.12291 0.25581 0 9900 0 0 0 0 1;
6 13 0.06615 0.13027 0 9900 0 0 0 0 1;
7 8 0 0.17615 0 9900 0 0 0 0 1;
7 9 0 0.11001 0 9900 0 0 0 0 1;
9 10 0.03181 0.0845 0 9900 0 0 0 0 1;
9 14 0.12711 0.27038 0 9900 0 0 0 0 1;
10 11 0.08205 0.19207 0 9900 0 0 0 0 1;
12 13 0.22092 0.19988 0 9900 0 0 0 0 1;
13 14 0.17093 0.34802 0 9900 0 0 0 0 1;
];
BANCO DE DADOS – 14 barras
15

U
FA
BC
– A
ná
lise
s E
stá
tica
em
SE
P
Edmarcio Belati
Banco de dados utilizado no programa do Matlab.
BANCO DE DADOS
16
U
FA
BC
– A
ná
lise
s E
stá
tica
em
SE
P
Edmarcio Belati
17
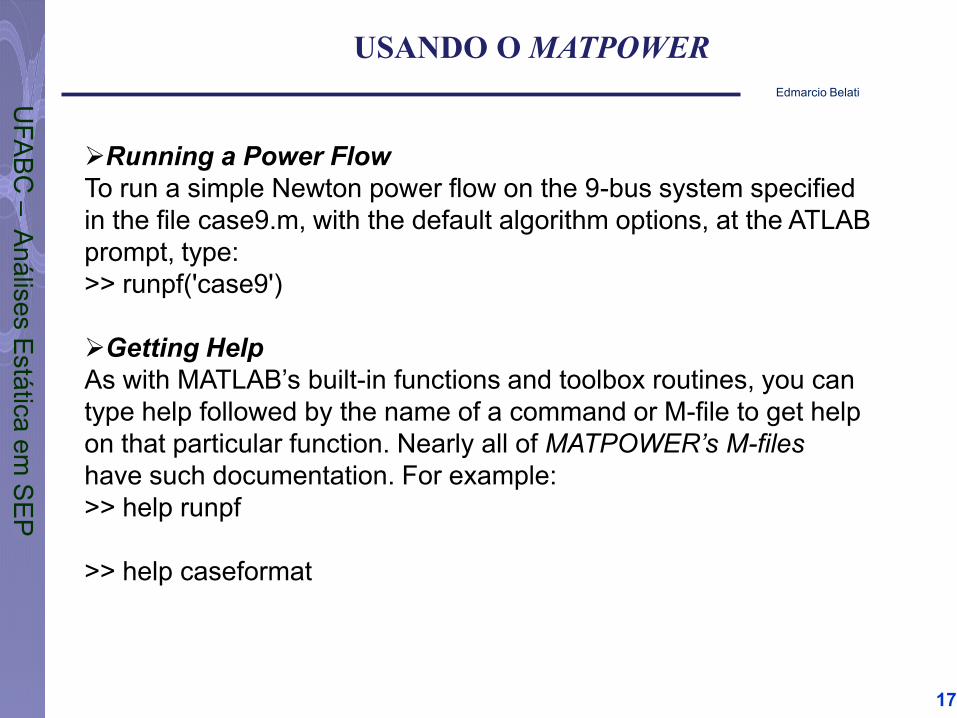
Running a Power Flow
To run a simple Newton power flow on the 9-bus system specified
in the file case9.m, with the default algorithm options, at the ATLAB
prompt, type:
>> runpf('case9')
Getting Help
As with MATLAB’s built-in functions and toolbox routines, you can
type help followed by the name of a command or M-file to get help
on that particular function. Nearly all of MATPOWER’s M-files
have such documentation. For example:
>> help runpf
>> help caseformat
USANDO O MATPOWER

U
FA
BC
– A
ná
lise
s E
stá
tica
em
SE
P
Edmarcio Belati
Resolver no Matpower – O sistema já faz parte do banco de dados do
Matpower, com pequenas alterações.
Resolver utilizando o matpower o subsistema 1 e o subsistema 2 do
sistema acima.
EXERÇÍCIO 1– RESOLVER NO MATPOWER

U
FA
BC
– A
ná
lise
s E
stá
tica
em
SE
P
Edmarcio Belati
EXERÇÍCIO 2 – RESOLVER NO MATPOWER O case14
a) Rodar o problema de 14 barras
(case14);
b) Retirar o gerador da barra 2 e rodar
novamente. Analisar as perdas do
sistema e o carregamento das linhas
em relação ao caso base.
c) Retirar a linha 2-5. Analisar as
perdas do sistema e o carregamento
das linhas em relação ao caso base..
d) Adicionar um elemento shunt de
barra no sistema para minimizar as
perdas do sistema. Qual a barra a
ser conectado, que tipo, e qual o
valor do elemento?
e) Qual a melhor barra do sistema para
colocar 50 MW de geração?

U
FA
BC
– A
ná
lise
s E
stá
tica
em
SE
P
Edmarcio Belati
PowerWorld Simulator is an interactive power system simulation
package designed to simulate high voltage power system
operation on a time frame ranging from several minutes to several
days. The software contains a highly effective power flow analysis
package capable of efficiently solving systems of up to 100.000
buses.
POWERWORD SIMULATOR
Link: http://www.powerworld.com/products/simulator/overview
Baixar a versão “demo” no link.

U
FA
BC
– A
ná
lise
s E
stá
tica
em
SE
P
Edmarcio Belati
Considerar o sistema de três barras e três linhas cujos dados são
mostrado a seguir.
barra tipo P c(p.u.) Q c(p.u.) P g(p.u.) Q g(p.u.) V (p.u) ()
1 V 0,5 0,3099 --- --- 1,00 0,00
2 PQ 1,7 1,0535 --- --- ---
3 PQ 2,0 1,2394 --- --- --- ---
4 PV 0,8 0,4958 3,18 --- 1,02 ---
linha r (p.u.) x (p.u) bsh (p.u.) *
1-2 0,01008 0,0504 0,1025
1-3 0,00744 0,0372 0,0775
2-4 0,00744 0,0372 0,0775
3-4 0,01272 0,0636 0,1275
* carregamento total.
Iniciar os cálculos com = 0,0 para as barras PV e PQ e V= 1,0 (p.u)
para as barras PQ.
Montar o sistema no PoweWord e analisar os resultados. Comparar
os resultados com o Matpower.
TRABALHO 3

U
FA
BC
– A
ná
lise
s E
stá
tica
em
SE
P
Edmarcio Belati
Detalhes do trabalho:
Trabalho individual;
Será atribuída uma nota de 0 -10 para o trabalho.
A entrega do trabalho deverá ser feita via e-mail em arquivo pdf com
a descrição (EEL-201 – TRABALHO 3).
obs: Anexar o arquivo utilizado no PowerWord
A data limite para entrega é até o dia 08/03/2015
Endereço de e-mail: [email protected]
TRABALHO 3