Embed Size (px)
Citation preview
Pesquisa Operacional para o Desenvolvimento
Vol. XX, n. YY, pp. ZZ-ZZ, ANO X
ISSN 1984-3534
______________________________ *Autor para correspondência. E-mail: [email protected] / [email protected]
DOI: 10.13140/RG.2.2.30432.51206
1Todos os autores assumem a responsabilidade pelo conteúdo do artigo.
STRATEGIES TO DEAL WITH EPIDEMICS USING A SYSTEM
DYNAMICS MODEL: A COVID-19 STUDY CASE
Alvimar de Lucena Costa Junior a*, Mischel Carmen Neyra Belderrain b
a Programa de Pós Graduação em Ciências e Tecnologias Espaciais, Gestão Tecnológica (CTE-G)
Instituto Tecnológico de Aeronáutica (ITA), São José dos Campos-SP, Brasil
b Departamento de Ciências Fundamentais, Gestão e Apoio à Decisão
Instituto Tecnológico de Aeronáutica (ITA), São José dos Campos-SP, Brasil
Recebido XX/XX/XXXX, aceito XX/XX/XXXX
RESUMO
Este artigo apresenta um modelo em Dinâmica de Sistemas que permite verificar algumas
estratégias de como lidar com a epidemia de COVID-19, usando como base o modelo clássico
epidemiológico SIR. Três estratégias foram testadas, baseadas no principal objetivo de políticas
públicas, que deve ser salvar vidas. Também foi testado o efeito do atraso na ação por parte de
autoridades. Das estratégias testadas, entre a extensão de quarentena, a quarentena vertical e a
identificação de infectados, a considerada mais promissora foi a de identificação de infectados e
a menos aconselhável é a de quarentena vertical.
Além disso, a simulação indicou que o enrijecimento da quarentena a qualquer tempo tende a
poupar vidas, mas a tomada de ação tardia de autoridades pode trazer prejuízos certos ao sistema
de saúde de um país, o que pode impactar diretamente também na letalidade da epidemia.
Palavras-chave: Dinâmica de Sistemas, COVID-19, Suporte à decisão.
ABSTRACT
This paper presents a System Dynamics Model to verify well-known strategies to deal with the
COVID-19 outbreak, based on the classical epidemiological SIR model. Three main strategies
were tested, considering the idealized main goal of public policies, to save lives. In addition, the
authorities' reaction time on implementing actions to control the pandemic is analyzed. From the
tested strategies, between quarantine extension, vertical quarantine, and identification of infected
persons, the most promising is to identify infected persons and the least suitable is vertical
quarantine.
Also, the simulations indicated that tightening quarantine at any time tends to save lives, but late
action by authorities can bring overpressure on a country's health care system, which has also
direct impact on the lethality of the epidemic.
Keywords: System Dynamics, COVID-19, Decision Support.
Lucena and Belderrain / vol (ano), pp.
1. Introduction
Severe Acute Respiratory Syndrome Coronavirus 2 (SARS-CoV-2) is the virus that causes
the new Corona Virus Disease, 2019 (COVID-19). The WHO (World Health Organization,
2020a) COVID-19 timeline indicates that the first information about the novel disease was on
Dec 31, 2019. After five months, information on the COVID-19 is still uncertain, and new
characteristics of the infection are identified every day. At the present date (May 15, 2020), WHO
statistics point to 4,248,389 cases (77,965 new cases on May 14, 2020) and 292,046 deaths (4,647
new deaths reported on May 14, 2020). Brazil is reported as the current epicenter of Latin
America, with 202,918 confirmed cases (13,944 new cases on May 14, 2020) and 13,993 deaths
(844 new deaths reported on May 14, 2020) (Ministry of Health of Brazil, 2020 ).
So far, it is known that COVID-19 is significantly more harmful when it affects the elderly,
requiring different strategies for each group.
Recently published articles indicate that the infectivity of COVID-19 (R0) is greater than
previous coronavirus outbreaks. The calculated R0 for SARS-CoV-2 ranges from 6.47 (Tang et
al., 2020) to 5.7 (Sanche et al., 2020). For comparison, the 1918 global swine flu outbreak had an
estimated R0 value between 1.4 and 2.8 (Coburn et al., 2009), for the 2009 H1N1 pandemic it
was assessed between 1.4-1.6 ( Coburn et al., 2009) and for measles, R0 is often cited as being
between 12-18 (Guerra et al. 2017).
The global spread of the disease requires action by governments around the world. Most
initiatives have focused on establishing quarantines of different levels and closing agglomeration
sites (Zhu et al., 2020). Social distancing, as defined by the American CDC (Centers for Disease
Control and Prevention, 2020), is the main strategy, i.e., to stay within two meters of each other,
not to meet in groups, to stay out of crowded places, and to suspend most economic activities
except those classified as essential. Some countries have adopted the "Lockdown", where people
are forced to stay inside their homes, leaving it only in special cases, such as to buy food or go to
the doctor. Quarantine strategies have as a common result the drastic reduction or complete
suspension of economic activities, relying on the practices of home-office when possible. A report
by the World Bank Group (Maliszewska et al., 2020) sees the world's gross domestic product
declining by 2%, with 2.5% for developing countries and 1.8% for industrialized countries, due
to restrictions associated with Social Distancing and Lockdown.
Currently, many countries are dealing with COVID-19 along with its economic effects. A
likely effect of declining GDP worldwide could be to further accentuate the health system
problems of less developed countries, which could eventually lead to an increase in the overall
mortality rate, as some studies suggest (Hone et al., 2019). Countries with little or no monetary
reserves will be more affected by the consequences of Social Distancing. Thus, strategies should
cover both economic and health aspects and be able to measure how to balance them.
In the current scenario, many countries seem to be divided into only two alternatives to
deal with the economic effects and health problems: making quarantine more restricted, to avoid
further contamination, and/or loosening it, allowing people to return to their jobs and schools.
This article presents a simulation model in System Dynamics to help find a balance in
different strategies on the COVID-19 epidemic, seeking to understand the results of changing
control variables available to State Authorities, and trying to find viable alternatives based on the
real objective pursued, i.e., saving lives. The balance between health and economic aspects is not
covered, since, under current conditions, such aspects are still unclear in academic simulation
studies.
This article is divided into five sections. This introductory section describes the problem to
be focused on in the document, and its basic context. Section two reviews the literature on
reference to epidemic models, focusing on System Dynamics, and what is known about the
numbers of OVID-19, as well as the gap that this work intends to fill. Section three describes and
justifies the use of System Dynamics on the theme and limitations of the model. Section four
brings the results and findings of the simulations. Section five lists the conclusions and
implications of the results.
Lucena and Belderrain / vol (ano), pp.
2. Review of Literature
2.1. Bibliographical Search
Mathematical epidemic behavior has long been cited in academic literature. Kermack and
McKendrick, in 1927, described most variables that define epidemic simulations currently used,
including population phases, exponential curves and rates that mathematically describe the
classical SIR model (Susceptible, Infected, and Recovered population).
This mathematical SIR model inspired a classical System Dynamics Tutorial by Sterman
(2000) and subsequent works that presented models using this basis, such as the simulation of
SARS spread in 2002 (Wang et al., 2009) and that of MERS-Cov in 2015 (Shin et al., 2017).
The development of the SIR model, also available in Kermack and McKendrick (1927), is
the SIRD model, where the stock “Dead population” (D) is included and computed, making the
recovered population smaller within each interaction.
Looking for references that worked in the same path, none showed a model with the
considerations proposed in this work. From the Scopus database (Elsevier), the terms “System
Dynamics” together with “COVID-19” returned an article (from May 18, 2020), still to be
published in Aug 2020 (Vega, 2020), which deals with the classic 2000 Sterman SIR model, and
some results related to the duration of quarantine. In another research, also using Scopus base, the
term “System Dynamics” was combined with the keywords “Coronavirus”, “SARS-CoV-2”,
“Disease Outbreak” and a total of twelve articles were found, including the 2020 Vega article
already cited. The combination of keywords limited to “System Dynamics” and “Epidemic”, did
not return any work related to the new COVID-19, although 60 papers were found, none of them
proposing a deviation from the classic System Dynamics SIR Model to study a specific behavior
of a given disease. This broader list of articles shows a total of 934 keywords of which 57 articles
cited the keyword “system dynamics” and 41 articles cited “epidemics”.
2.2. Framework
International headlines and political speeches are divided between two discourses: one of
the “Save the Economy” type, against quarantine and its economic consequences, and the other
of the “life is what matters” type, seeking an extension of quarantine and isolation policies until
the spread of infection is considered impossible. Keeney (1992) referred to this way of thinking
as “alternative-focused thinking”, where decision-makers tend to choose between some
alternatives that are clearly established rather than determine their true objective, seeking the real
value that the decision must seek and the possible ways to achieve this value. As opposed to this
way of thinking, Keeney suggested Value Focused Thinking (VFT), a detailed Problem-
Structuring Method (PSM). Applying this idea in an abbreviated form, the conclusion is that the
Goal should be “Save Lives” in a broader sense.
As a complex system, the impact of the isolation and confinement of most of the workforce
in the world economy can only be measured in small steps of interaction, using specific economic
variables such as GDP or the unemployment rate. Trying to escape any prejudice resulting from
the current heated discussions on the subject, papers have been recently published before any
news about the outbreak of COVID-19 was mentioned. According to Hone (Hone et al., 2019),
an increase in the unemployment rate of one percentage point was associated with an increase of
half a percentage point in the mortality rate (95% CI 0.09-0.91) by all causes, especially, in this
case, due to cancer and cardiovascular diseases, where most of the increase was computed in the
black and mixed race population, without significant association with the white population.
Although the proportion of changes in deaths in this study is related to the mortality rate of the
country, not its total population, it shows that a balance must be sought between the measures
taken. Taking this result into consideration, the best likely way to achieve the goal of “Saving
Lives” would be a mixed strategy, between the complete Lockdown, with an increasing impact
on the economy and mortality rates of minorities and the poorest population, and the policy of
“open doors”, which would certainly compromise the risk group of this new disease.
Lucena and Belderrain / vol (ano), pp.
Determining what this mixed strategy might look like is the goal of this document, using
simulations of System Dynamics to understand how specific strategies will work over time, and
how certain measures may affect the system in the future (Kunc and Morecroft, 2007).
3. Methodology
Based on the Kermack and McKendrick (1927) SIRD System Dynamics Model (SDM),
information gathered from updated sources guided the development of a Stock-and-Flow model,
comprehending many specific characteristics for the present disease outbreak.
3.1. Classical SIRD System Dynamics Model
Based on the mathematical description (Kermack and McKendrick 1927), the main
variables involved in an epidemic model are groups of the population, divided into susceptible,
infected, recovered, and deceased (SIRD).
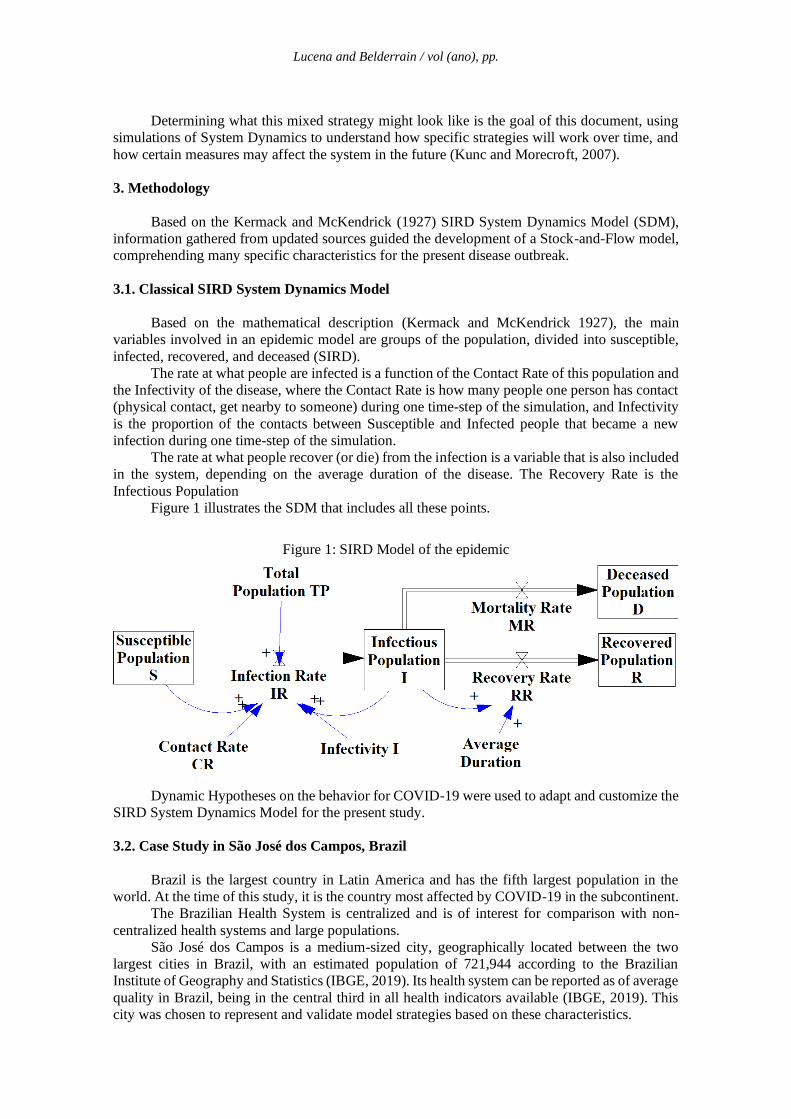
The rate at what people are infected is a function of the Contact Rate of this population and
the Infectivity of the disease, where the Contact Rate is how many people one person has contact
(physical contact, get nearby to someone) during one time-step of the simulation, and Infectivity
is the proportion of the contacts between Susceptible and Infected people that became a new
infection during one time-step of the simulation.
The rate at what people recover (or die) from the infection is a variable that is also included
in the system, depending on the average duration of the disease. The Recovery Rate is the
Infectious Population
Figure 1 illustrates the SDM that includes all these points.
Figure 1: SIRD Model of the epidemic
Dynamic Hypotheses on the behavior for COVID-19 were used to adapt and customize the
SIRD System Dynamics Model for the present study.
3.2. Case Study in São José dos Campos, Brazil
Brazil is the largest country in Latin America and has the fifth largest population in the
world. At the time of this study, it is the country most affected by COVID-19 in the subcontinent.
The Brazilian Health System is centralized and is of interest for comparison with non-
centralized health systems and large populations.
São José dos Campos is a medium-sized city, geographically located between the two
largest cities in Brazil, with an estimated population of 721,944 according to the Brazilian
Institute of Geography and Statistics (IBGE, 2019). Its health system can be reported as of average
quality in Brazil, being in the central third in all health indicators available (IBGE, 2019). This
city was chosen to represent and validate model strategies based on these characteristics.
Lucena and Belderrain / vol (ano), pp.
The data used to validate the model are from the epidemiological reports of the city of São
José dos Campos (São José dos Campos City Hall, 2020).
3.3. Customization of Classic SIRD SDM: Dynamic Hypothesis
Age
The first Dynamic Hypothesis considered for the behavior of COVID-19 is that it attacks
older people more severely. Significantly higher lethality rates were observed in the group.
US reports on patients with COVID-19 indicate that the Confirmed Death Rate (CFR) was
1% for persons under 65 years old and 6% for persons over that age (Sanche et al., 2020). In
Spain, the CFR for people under 70 years old was, until May 16, 2020, 1.72%, and the CFR for
people over 70 years old was 18.8% (Centro de Coordinación de Alerts y Emergencias Sanitarias,
2020). In Italy, according to the Italian Health Secretariat, at Mar 31, 2020, the CFR for people
under 70 years old was 3.21% and for people over 70 years old it was 24.68%. In the city of São
José dos Campos, the CFR for people under 70 years old was calculated at 3%, and for people
over 70, 23%.
The reasons why the older fraction of the population is more susceptible to complications
due to COVID-19 are not yet fully understood.
This difference in behavior of the group inspired the customization of the SIRD stocks for
each fraction of the population on this SDM proposal. In the 2019 IBGE population estimate, São
José dos Campos had 4% of the population over 70 years of age.
Infectivity (I) and Contact Rate (CR)
Scientists have tried to measure the speed of the spread of COVID-19, but a major barrier
to this measurement is effectively determining the presence of the disease. Underreporting
(Mellan et al., 2020) makes it very difficult to have correct numbers and therefore accurate
calculation of the infectivity of COVID-19 and its CFR. In addition, the effectiveness of the
available tests is an important error to be accounted for, since the rate of false negative results in
the test kits for COVID-19 was reported at 29% when compared to the sensitivity of Computed
Tomography of the Chest (Fang et al., 2020).
With respect to the SDM Infectivity variable, an epidemiological equivalent medical metric
to support it is R0 (R-nough, also known as the reproduction number), a mathematical term that
indicates how contagious an infectious disease is (Delamater et al., 2019). As the infection is
transmitted to new people, it multiplies in the population (Ramirez and Biggers, 2020). Although
there are such problems in measuring the R0 of COVID-19, the infectivity of the new disease is
considered high by publications already available.
For the current SDM, the value represented for the R0 is a composition of the Infectivity
(I) and Contact Rate (CR) variable, both proportional to R0. The values described in Sterman
(2000) for an outbreak of a respiratory disease were considered as the baseline for the Contact
Rate (CR) (10 people per person per day). The value of infectivity was adjusted by validation in
the values of São José dos Campos at the beginning of the outbreak and will be discussed later in
this article.
Recovered Population
On its Scientific Brief on 24APR2020, WHO declares that “there is currently no evidence
that people who have recovered from COVID-19 and have antibodies are protected from a second
infection” (World Health Organization, 2020b). However, recently published research (Ni et al.,
2020) indicates that recovered people keep showing antibodies after discharged from
hospitalization, which implies both that these people retain its immunity during a certain amount
of time and that an effective vaccine is possible.
Another relevant hypothesis in this paper is that data on recovered cases are less precise
than infected cases, because of the hospitalization rate and the asymptomatic fraction of the
population.
Lucena and Belderrain / vol (ano), pp.
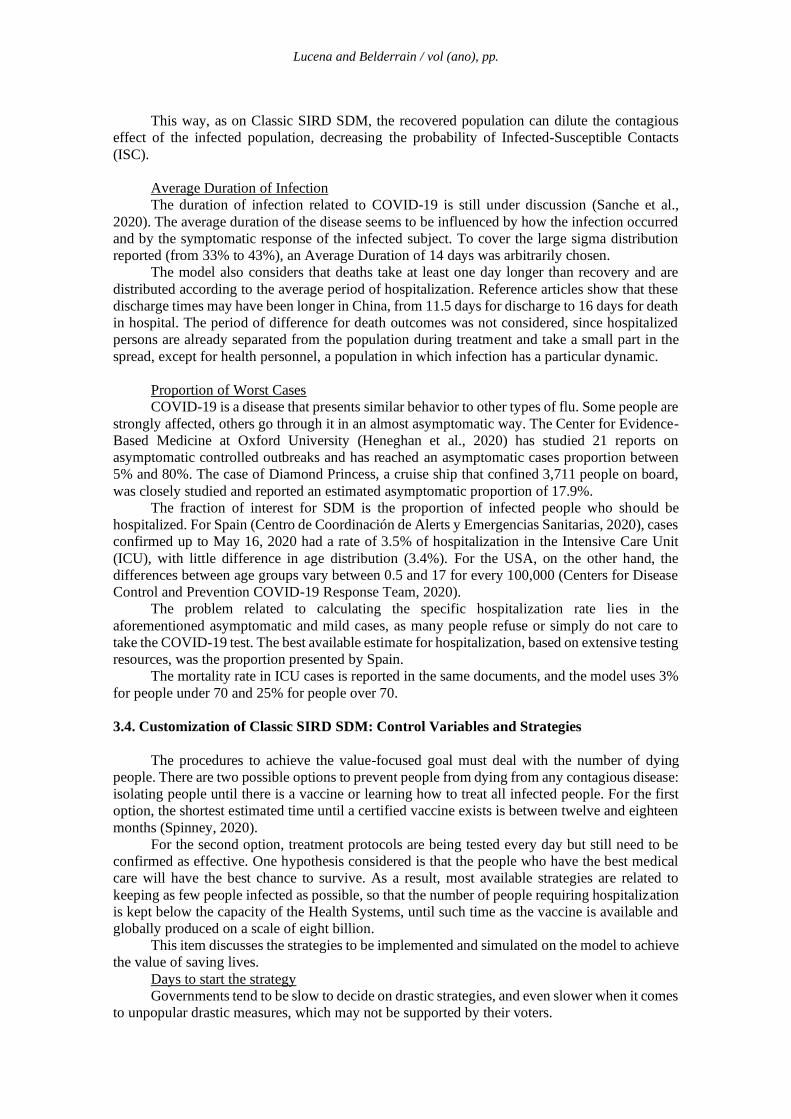
This way, as on Classic SIRD SDM, the recovered population can dilute the contagious
effect of the infected population, decreasing the probability of Infected-Susceptible Contacts
(ISC).
Average Duration of Infection
The duration of infection related to COVID-19 is still under discussion (Sanche et al.,
2020). The average duration of the disease seems to be influenced by how the infection occurred
and by the symptomatic response of the infected subject. To cover the large sigma distribution
reported (from 33% to 43%), an Average Duration of 14 days was arbitrarily chosen.
The model also considers that deaths take at least one day longer than recovery and are
distributed according to the average period of hospitalization. Reference articles show that these
discharge times may have been longer in China, from 11.5 days for discharge to 16 days for death
in hospital. The period of difference for death outcomes was not considered, since hospitalized
persons are already separated from the population during treatment and take a small part in the
spread, except for health personnel, a population in which infection has a particular dynamic.
Proportion of Worst Cases
COVID-19 is a disease that presents similar behavior to other types of flu. Some people are
strongly affected, others go through it in an almost asymptomatic way. The Center for Evidence-
Based Medicine at Oxford University (Heneghan et al., 2020) has studied 21 reports on
asymptomatic controlled outbreaks and has reached an asymptomatic cases proportion between
5% and 80%. The case of Diamond Princess, a cruise ship that confined 3,711 people on board,
was closely studied and reported an estimated asymptomatic proportion of 17.9%.
The fraction of interest for SDM is the proportion of infected people who should be
hospitalized. For Spain (Centro de Coordinación de Alerts y Emergencias Sanitarias, 2020), cases
confirmed up to May 16, 2020 had a rate of 3.5% of hospitalization in the Intensive Care Unit
(ICU), with little difference in age distribution (3.4%). For the USA, on the other hand, the
differences between age groups vary between 0.5 and 17 for every 100,000 (Centers for Disease
Control and Prevention COVID-19 Response Team, 2020).
The problem related to calculating the specific hospitalization rate lies in the
aforementioned asymptomatic and mild cases, as many people refuse or simply do not care to
take the COVID-19 test. The best available estimate for hospitalization, based on extensive testing
resources, was the proportion presented by Spain.
The mortality rate in ICU cases is reported in the same documents, and the model uses 3%
for people under 70 and 25% for people over 70.
3.4. Customization of Classic SIRD SDM: Control Variables and Strategies
The procedures to achieve the value-focused goal must deal with the number of dying
people. There are two possible options to prevent people from dying from any contagious disease:
isolating people until there is a vaccine or learning how to treat all infected people. For the first
option, the shortest estimated time until a certified vaccine exists is between twelve and eighteen
months (Spinney, 2020).
For the second option, treatment protocols are being tested every day but still need to be
confirmed as effective. One hypothesis considered is that the people who have the best medical
care will have the best chance to survive. As a result, most available strategies are related to
keeping as few people infected as possible, so that the number of people requiring hospitalization
is kept below the capacity of the Health Systems, until such time as the vaccine is available and
globally produced on a scale of eight billion.
This item discusses the strategies to be implemented and simulated on the model to achieve
the value of saving lives.
Days to start the strategy
Governments tend to be slow to decide on drastic strategies, and even slower when it comes
to unpopular drastic measures, which may not be supported by their voters.
Lucena and Belderrain / vol (ano), pp.
Newspapers reported the first blockade in Wuhan, China, which began in Jan 23, 2020, but
the Chinese government's first official communication to the World Health Organization of a new
coronavirus was on Dec 31, 2019 (World Health Organization, 2020a), meaning that the Chinese
government knew the seriousness of the problem at least 23 days before taking action.
On Dec 23, 2019, the U.S. Centers for Disease Control and Prevention (CDC) learned of
cases in China and began developing reports for the Department of Health and Human Services
(HHS) on January 1. Ohio (US State) reported a case of COVID-19 on Jan 06, 2020. Although
there were some quarantines requested by the CDC in the U.S., state and local governments began
to declare quarantines only in Mar, 2020 (Wikipedia, 2020), about 70 days after the first reported
infection in the country.
In Brazil, the first reported case was on Feb 08, 2020, in São Paulo, and the first quarantine
order was issued on Mar 13,2020, to begin on Mar 16, 2020, 37 days after the first case (São
Paulo, 2020).
Even in Brazil and the USA, countries that already had knowledge of a new outbreak of
coronavirus disease, the time to start the new strategy was an important issue, and this SDM
studied its sensitivity results.
In the current SDM, the baseline is a 20-day delay for the municipal government's reaction,
from an initial stock of an infected population of 20 people, based on data from São José dos
Campos.
Days to finish strategy
The same rationale applies to the end of some strategy. The day when a quarantine should
end is also a matter of study, as well as a change of strategy is capturable.
Decrease Infected People Contacts
The SDM infection rate variable depends on the total number of infected people among the
total susceptible population. Thus, one way to control this infection rate would be to minimize
contacts between infected and susceptible people, corresponding to minimize infected-susceptible
contacts (SIDS).
On this SIRD SDM, the strategy is translated on the Contact Frequency (CF) variable, a
component of the Contact Rate. CF varies according to how the population is free to circulate and
meet other persons. On a “lockdown” (the worst type of quarantine), each person would meet no
more than one person per day (p/p/day) on average. On a normal day, it is considered that the CF
is ten p/p/day. On a party season, like the carnival, these numbers could rise fifteen p/p/day.
The CF variation and sensibility analysis are correspondents to the study of the types of
quarantine that a State may impose.
Another way to decrease ISC would be identifying the infected people and isolating them
from the rest of the population. Testing is a way to identify infected people but is not the only
one.
On the WHO protocols for epidemic outbreaks (World Health Organization, 2014), one of
the procedures is to investigate all people who had contact with identified infected persons, and,
therefore, isolate them. The efficiency of this investigation may be very high during the early
periods of an outbreak.
The control variable WideTesting translates this search for infected persons, as a degree of
identification efficiency.
The WideTesting variable means what fraction of the infected population was identified.
This way, zero means that no infected is identified. 10% (0.10) means that the government knows
who is 10% of infected people. From the proportion of infected people identified, State should
calculate the number of tests needed, based on an initial supposition of the infected population.
Decrease Contacts among Riskier Groups
The last control variable discussed is based on the mentioned distinct lethality rates in age
groups. A control variable would be to impose a quarantine on the older group of people, which
Lucena and Belderrain / vol (ano), pp.
concentrates the individuals most at risk of, if infected, developing the most lethal form of
COVID-19. This strategy was called Vertical Quarantine.
The idea would be to restrict contacts between the infected population and older people,
thus reducing the number of deaths. This would allow the younger workforce to return to active
economic life, while the older fraction would be protected in isolation.
The critics of this Vertical Quarantine understand that in some countries, where many
parents live with their adult sons, the efficiency of this strategy is highly questionable. For
example, in Brazil, according to the newspaper Folha de São Paulo collaborating with specialists
from the Minas Gerais Federal University, 25% of the older population lives with three or more
younger family members, and 60% lives with one or more persons that would not be isolated in
a Vertical Quarantine (Barbon, 2020). This way, we might consider that only 15% of the older
population would be adequately isolated on this type of quarantine, but all range of this practice
will be analyzed using the Customized SIRD SDM
3.5. Customized SIRD SDM: Environmental Variables
The city of São José dos Campos is the baseline for the study and its numbers on COVID-
19 up to May 08, 2020.
All environmental variables, like Population, fraction over 70 years old, death rates, ICU
needs, are already defined in previous sections.
The period for simulations was established as one year (365 days). Time-step was one day.
3.6. Customized SIRD SDM: Results to be measured
The main result to be measured and compared on the Sensitivity Analysis for the
Customized SIRD SDM is the “number of deaths”, directly related to the Value Focused objective
of the listed control strategies.
The “number of Intensive Care Unit (ICU) beds needed” would be a direct function of the
“number of infected people”. This way, the peak of the number of Infected People and the time
to get to this peak is also an important number to be followed.
3.7. Limitations of Customized SIRD SDM
Given all estimates that are used on the model, and all the fast changes each variable takes,
the numbers that result from the simulation are not to be taken as directly valid. The exponential
nature of SDM tends to make small deviations of variables result in large errors after some
iterations. This way, all analysis should be focused on the tendencies of the stocks, rates, and
variables of interest.
Validation tests of SIRD SDM were conducted according to Forrester and Senge (1980)
confirming its usefulness on the Structure-Verification Test to the Sterman SIR SDM and the
Extreme-Conditions Test for the behavior on the sensibility analysis results, as well as behavior
sensitivity.
4. Findings and Results
This section will first describe the Customized SIR SDM, on item 4.1. Then, on 4.2, it will
establish the Baseline results.
After that, on items from 4.3 to 4.6, a sensibility analysis for four different Strategies are
described.
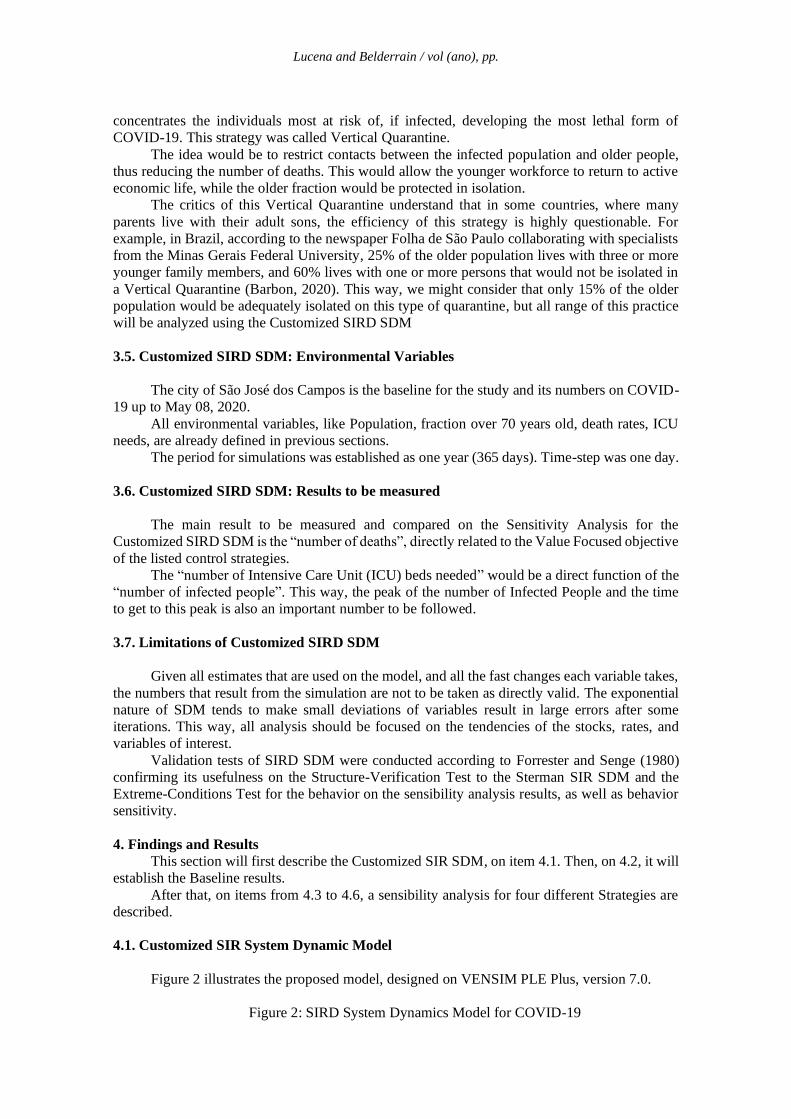
4.1. Customized SIR System Dynamic Model
Figure 2 illustrates the proposed model, designed on VENSIM PLE Plus, version 7.0.
Figure 2: SIRD System Dynamics Model for COVID-19
Lucena and Belderrain / vol (ano), pp.
4.2. Baseline results
The model was validated using baseline results based on Death Counts for São José dos
Campos only. ICU beds and infected population registered were not considered reliable for
validation purposes because testing levels are low in Brazil and São José dos Campos, and ICU
beds proportion depends on information that was not being provided by private hospitals at the
beginning of the study period. The Death Count is considered the most reliable number closer to
the reality of COVID-19 contamination.
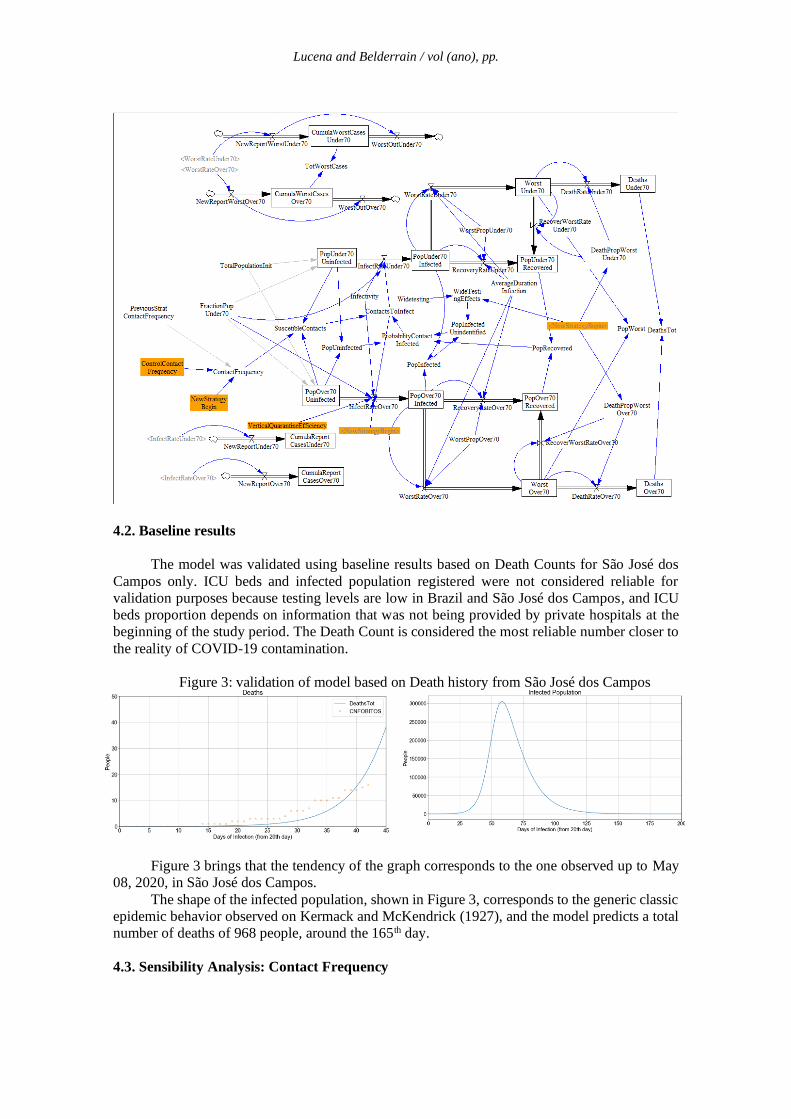
Figure 3: validation of model based on Death history from São José dos Campos
Figure 3 brings that the tendency of the graph corresponds to the one observed up to May
08, 2020, in São José dos Campos.
The shape of the infected population, shown in Figure 3, corresponds to the generic classic
epidemic behavior observed on Kermack and McKendrick (1927), and the model predicts a total
number of deaths of 968 people, around the 165th day.
4.3. Sensibility Analysis: Contact Frequency
Lucena and Belderrain / vol (ano), pp.
The Contact Frequency (CF) Strategy may be translated as levels of quarantine. It was
studied using values from 1 p/p/day (extreme lockdown) to 15 p/p/day (party events contacts),
using 0.1 contact p/p/day steps.
Analysis of graphs shows that the higher the CF variable (meaning less restrict lockdown),
the higher the total of deaths in São José dos Campos. The difference from the predicted deaths
on a CF=4 lockdown goes from 670 deaths to 968 deaths on the normal situation (CF=10), a 45%
increase. A lockdown of CF=3 would predict a death toll of 315, less than half of the result from
CF=4, and about 1 third of the CF=10 normal situation.
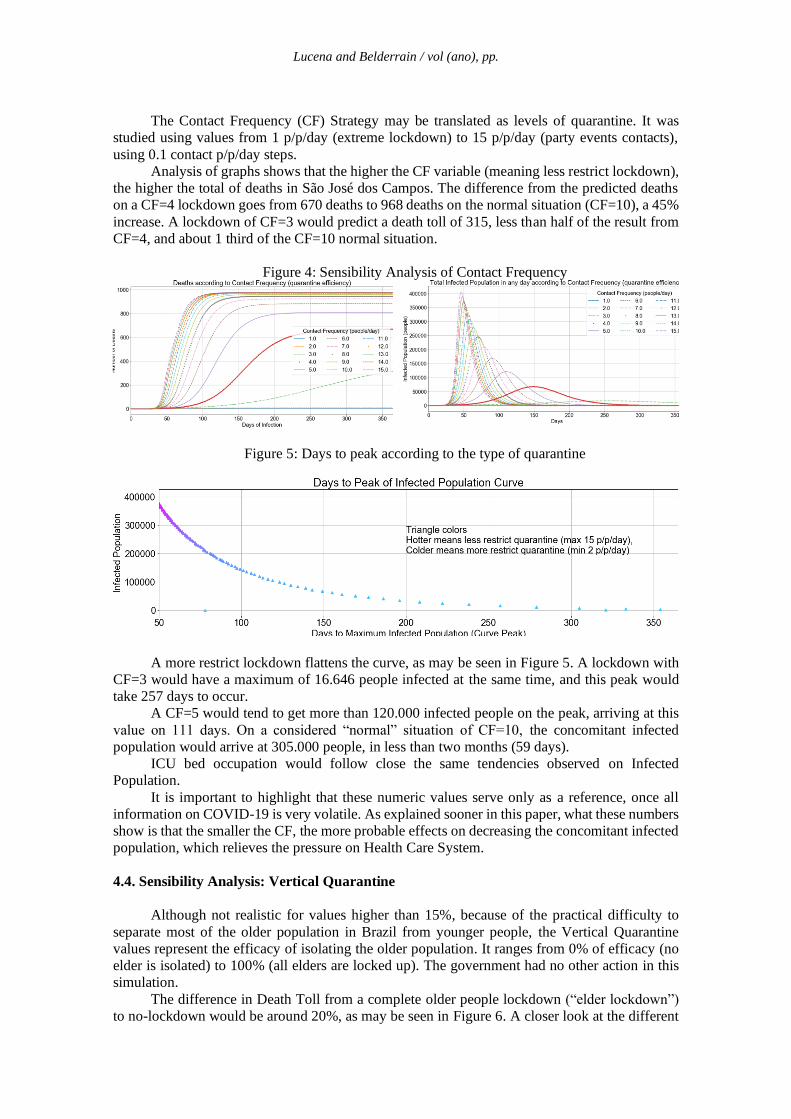
Figure 4: Sensibility Analysis of Contact Frequency
Figure 5: Days to peak according to the type of quarantine
A more restrict lockdown flattens the curve, as may be seen in Figure 5. A lockdown with
CF=3 would have a maximum of 16.646 people infected at the same time, and this peak would
take 257 days to occur.
A CF=5 would tend to get more than 120.000 infected people on the peak, arriving at this
value on 111 days. On a considered “normal” situation of CF=10, the concomitant infected
population would arrive at 305.000 people, in less than two months (59 days).
ICU bed occupation would follow close the same tendencies observed on Infected
Population.
It is important to highlight that these numeric values serve only as a reference, once all
information on COVID-19 is very volatile. As explained sooner in this paper, what these numbers
show is that the smaller the CF, the more probable effects on decreasing the concomitant infected
population, which relieves the pressure on Health Care System.
4.4. Sensibility Analysis: Vertical Quarantine
Although not realistic for values higher than 15%, because of the practical difficulty to
separate most of the older population in Brazil from younger people, the Vertical Quarantine
values represent the efficacy of isolating the older population. It ranges from 0% of efficacy (no
elder is isolated) to 100% (all elders are locked up). The government had no other action in this
simulation.
The difference in Death Toll from a complete older people lockdown (“elder lockdown”)
to no-lockdown would be around 20%, as may be seen in Figure 6. A closer look at the different
Lucena and Belderrain / vol (ano), pp.
age groups reveals that most of the saved lives come from the older group. On a 100% unrealistic
“elder lockdown”, 222 older people would be saved, but this would mean that 21 more younger
persons would die. No lockdown would correspond to the death of 745 younger persons, but
100% lockdown would mean the death of 766 younger persons. This way, the Vertical Quarantine
not only would not save younger people's lives but even worsens this situation on around 3%.
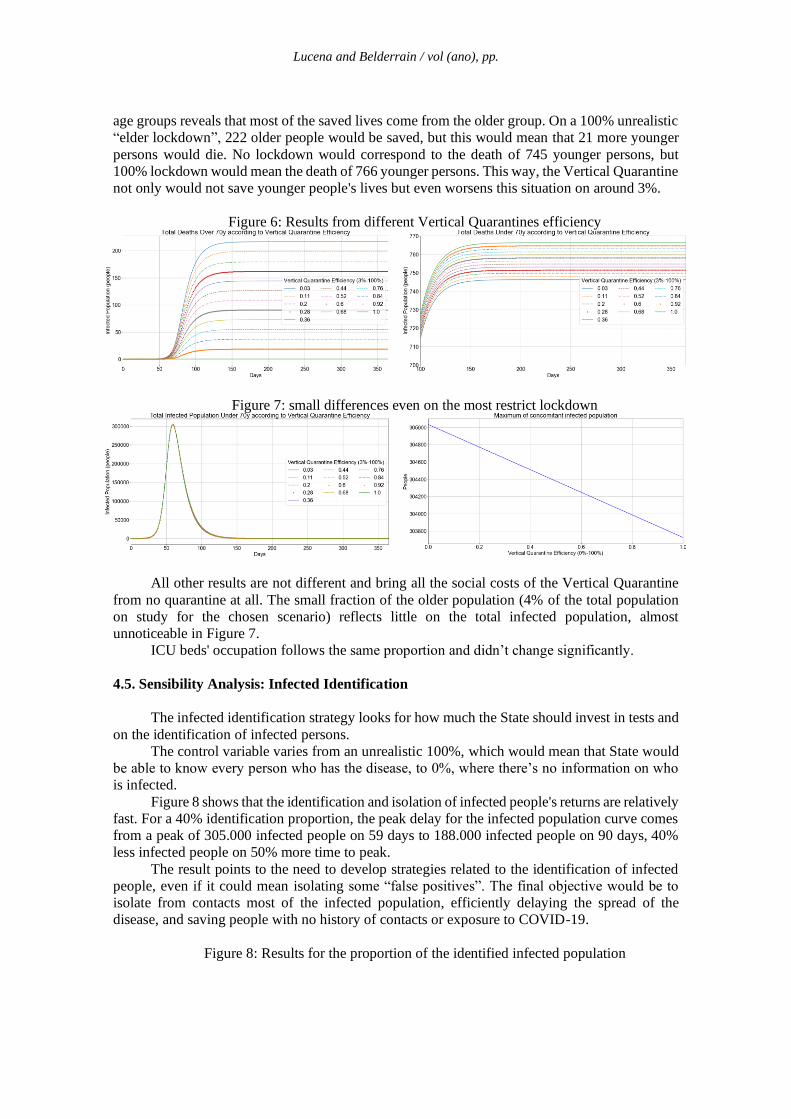
Figure 6: Results from different Vertical Quarantines efficiency
Figure 7: small differences even on the most restrict lockdown
All other results are not different and bring all the social costs of the Vertical Quarantine
from no quarantine at all. The small fraction of the older population (4% of the total population
on study for the chosen scenario) reflects little on the total infected population, almost
unnoticeable in Figure 7.
ICU beds' occupation follows the same proportion and didn’t change significantly.
4.5. Sensibility Analysis: Infected Identification
The infected identification strategy looks for how much the State should invest in tests and
on the identification of infected persons.
The control variable varies from an unrealistic 100%, which would mean that State would
be able to know every person who has the disease, to 0%, where there’s no information on who
is infected.
Figure 8 shows that the identification and isolation of infected people's returns are relatively
fast. For a 40% identification proportion, the peak delay for the infected population curve comes
from a peak of 305.000 infected people on 59 days to 188.000 infected people on 90 days, 40%
less infected people on 50% more time to peak.
The result points to the need to develop strategies related to the identification of infected
people, even if it could mean isolating some “false positives”. The final objective would be to
isolate from contacts most of the infected population, efficiently delaying the spread of the
disease, and saving people with no history of contacts or exposure to COVID-19.
Figure 8: Results for the proportion of the identified infected population
Lucena and Belderrain / vol (ano), pp.
4.6. Sensibility Analysis: Days to Strategy
The simulation shows what would be the difference in results depending on how long
authorities would last to impose a more restrict quarantine, passing from a Social Isolation with
CF=6 to a stronger lockdown where CF=2, for example.
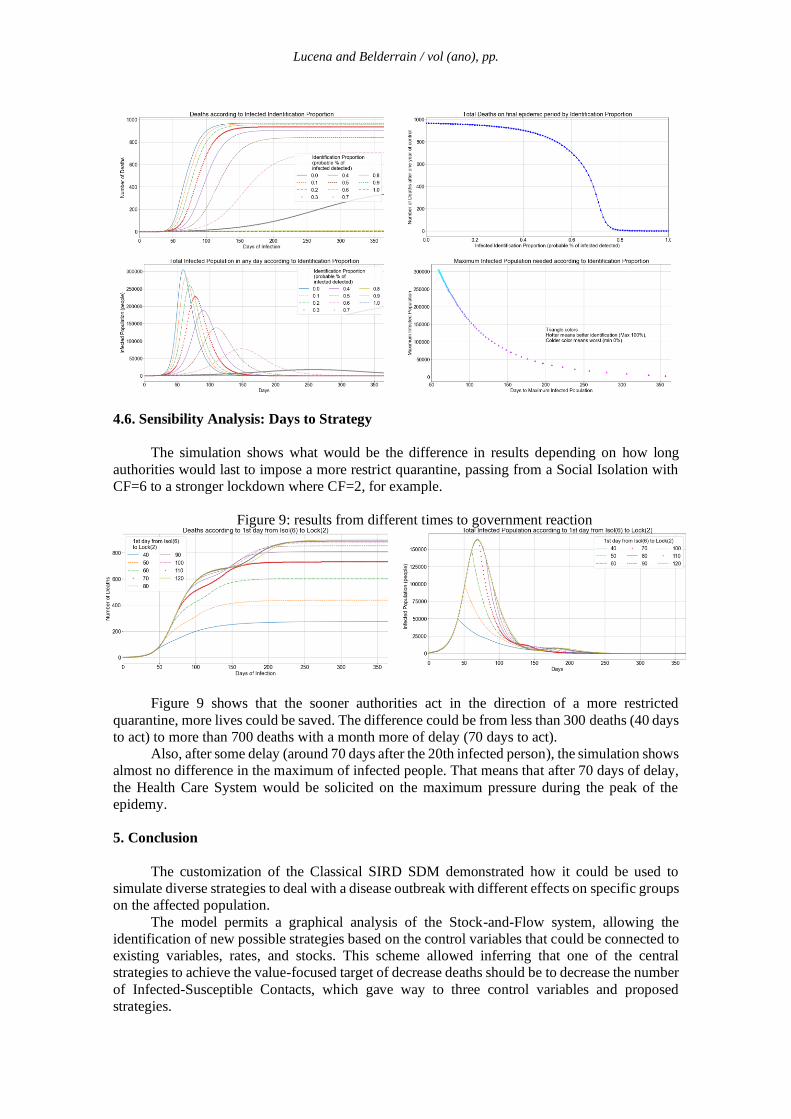
Figure 9: results from different times to government reaction
Figure 9 shows that the sooner authorities act in the direction of a more restricted
quarantine, more lives could be saved. The difference could be from less than 300 deaths (40 days
to act) to more than 700 deaths with a month more of delay (70 days to act).
Also, after some delay (around 70 days after the 20th infected person), the simulation shows
almost no difference in the maximum of infected people. That means that after 70 days of delay,
the Health Care System would be solicited on the maximum pressure during the peak of the
epidemy.
5. Conclusion
The customization of the Classical SIRD SDM demonstrated how it could be used to
simulate diverse strategies to deal with a disease outbreak with different effects on specific groups
on the affected population.
The model permits a graphical analysis of the Stock-and-Flow system, allowing the
identification of new possible strategies based on the control variables that could be connected to
existing variables, rates, and stocks. This scheme allowed inferring that one of the central
strategies to achieve the value-focused target of decrease deaths should be to decrease the number
of Infected-Susceptible Contacts, which gave way to three control variables and proposed
strategies.
Lucena and Belderrain / vol (ano), pp.
Between the three direct strategies discussed, the strength of quarantine, the vertical
quarantine, and the identification of infected people, the one that showed a faster return was the
identification strategy, where a mean identification of infected people could lead to decreases of
50% on-time t peak and 40% less infected people maximum, what corresponds to proportional
less need for ICU beds and less pressure over the country’s Health Care System.
The worst proposed strategy was the Vertical Quarantine, that, when applied, enlarges the
death toll on the younger fraction of the population and have a large social cost, besides the fact
that is unrealistic suppose that vertical quarantines could happen on higher efficiency numbers in
countries where the majority of the older population tend to live together with younger persons,
that would not be isolated and living under the same roof.
The last verification, belonging to the delay of the authorities' action, revealed that a rapid
response to an outbreak of these characteristics would result in saving lives. In addition, the
simulation indicated that, after a certain delay, deaths could still be avoided, but the pressure on
the Health System would already be inevitable, and people would probably have less access to
medical care, which could worsen the mortality rates initially considered.
The model is limited by the unknown and changing variables related to the COVID-19,
but, although the absolute numbers resulting from simulation cannot be used by its face-value,
the tendencies observed on the curves may be used, because of its validated behavior.
Other strategies that could be tested on the model for future exercises include the use of a
restricted number of ventilators and the health care workforce, and how treatments that abbreviate
time to recover could impact on the epidemic flow.
This model is available to other simulations and tests that may be of interest to COVID-19
policies.
A development of this paper could include other Infected-Susceptible Contact reduction
strategies, regarding, for example, a decrease of infectivity rate based on strategies using masks.
Another important development would be a more detailed application of Value Focused Thinking
method.
References
Barbon, J. 25% dos idosos brasileiros moram com três ou mais pessoas. 2020.
https://www1.folha.uol.com.br/cotidiano/2020/04/25-dos-idosos-brasileiros-moram-com-tres-
ou-mais-pessoas.shtml, accessed on 15/05/2020.
Brazil Health Ministry. Painel de casos de doença pelo coronavírus, 2019 (COVID-19) no Brasil
pelo Ministério da Saúde. 2020. https://covid.saude.gov.br/, accessed on 15/05/2020.
Brazilian Institute for Geography and Statistics (IBGE). IBGE - Panorama - São José dos
Campos. 2019. https://cidades.ibge.gov.br/brasil/sp/sao-jose-dos-campos/panorama, accessed on
19/05/2020.
Centers for Disease Control and Prevention. Social Distancing. 2020.
https://www.cdc.gov/coronavirus/2019-ncov/prevent-getting-sick/social-distancing.html,
accessed on 16/05/2020.
Centers for Disease Control and Prevention COVID-19 Response Team. Hospitalization Rates
and Characteristics of Patients Hospitalized with Laboratory-Confirmed Coronavirus Disease,
2019 — COVID-NET, 14 States, March 1–30, 2020.
Centro de Coordinación de Alertas y Emergencias Sanitarias. Epidemiology Bulletin 107.
CCAES, 2020.
Coburn, B. J., Wagner, B. G. and Blower, S. Modeling influenza epidemics and pandemics:
Insights into the future of swine flu (H1N1). BMC Medicine, v. 7, 2009.
Lucena and Belderrain / vol (ano), pp.
Delamater, P. L., Street, E. J., Leslie, T. F., Yang, Y. T. and Jacobsen, K. H.. Complexity of the
basic reproduction number (R0). Emerging Infectious Diseases, v. 25, n. 1, p. 1–4, 2019.
Fang, Y., Zhang, H., Xie, J., et al. Sensitivity of Chest CT for COVID-19: Comparison to RT-
PCR. Radiology, p. 200432, 2020.
Forrester, J. W. and Senge, P. M.. Tests for building confidence in system dynamics models.
TIMS Studies in the Management Sciences, 1980.
Guerra, F. M., Bolotin, S., Lim, G., et al. The basic reproduction number (R 0 ) of measles: a
systematic review. The Lancet Infectious Diseases, v. 17, n. 12, p. e420–e428, Dec 2017.
Heneghan, C., Brassey, J. and Jefferson, T. COVID-19: What proportion are asymptomatic?
https://www.cebm.net/covid-19/covid-19-what-proportion-are-asymptomatic/, accessed on
16/05/2020.
Hone, T., Mirelman, A. J., Rasella, D., et al. Effect of economic recession and impact of health
and social protection expenditures on adult mortality: a longitudinal analysis of 5565 Brazilian
municipalities. The Lancet Global Health, v. 7, n. 11, p. e1575–e1583, 2019.
Instituto Brasileiro de Geografia e Estatística (IBGE). IBGE divulga as estimativas da população
dos municípios para 2019. https://agenciadenoticias.ibge.gov.br/agencia-sala-de-imprensa/2013-
agencia-de-noticias/releases/25278-ibge-divulga-as-estimativas-da-populacao-dos-municipios-
para-2019, accessed on 19/05/2020.
Keeney, R. L. Value-Focused Thinking: A Path to Creative Decisionmaking. Harvard University
Press, 1992.
Kermack, W. O. and McKendrick, A. G. A contribution to the mathematical theory of epidemics.
Proceedings of the Royal Society of London. Series A, Containing Papers of a Mathematical and
Physical Character, v. 115, n. 772, p. 700–721, Aug 1927.
Kunc, M. and Morecroft, J. System Dynamics Modelling for Strategic Development. In: O´Brien,
F. A. and Dyson R.G. Supporting Strategy: Framework, Methods and Models. p. 157. John
Wiley&Sons Ltd, 2007.
Maliszewska, M, Mattoo A and Mensbrugghe D. The potential impact
of COVID-19 on GDP and trade: A preliminary assessment, Policy Research working
paper No. WPS 9211, World Bank Group, 2020.
Mellan, T. A., Hoeltgebaum, H. H., Mishra, S., et al. Report 21: Estimating COVID-19 cases and
reproduction number in Brazil. Imperial College COVID-19 Response Team, n. May, p. 1–24.
2020.
Ni, L., Ye, F., Cheng, M., et al. Detection of SARS-CoV-2-Specific Humoral and Cellular
Immunity in COVID-19 Convalescent Individuals. Immunity, p. 1–7. May 2020.
Prefeitura de São José dos Campos. Informe epidemiológico da Prefeitura de São José dos
Campos. https://www.sjc.sp.gov.br/servicos/saude/coronavirus/informe-epidemiologico/,
accessed on 19/05/2020.
Ramirez, V. B. and Biggers, A. What Is R0? Gauging Contagious Infections.
https://www.healthline.com/health/r-nought-reproduction-number, accessed on 18/05/2020.
Lucena and Belderrain / vol (ano), pp.
Sanche, S., Lin, Y. T., Xu, C., et al. High Contagiousness and Rapid Spread of Severe Acute
Respiratory Syndrome Coronavirus 2. Emerging Infectious Diseases, v. 26, n. 7, Jul 2020.
Shin, N., Kwag, T., Park, S. and Kim, Y. H. Effects of operational decisions on the diffusion of
epidemic disease: A system dynamics modeling of the MERS-CoV outbreak in South Korea.
Journal of Theoretical Biology, v. 421, p. 39–50, May 2017.
Spinney, L. Coronavirus vaccine: when will we have one?
https://www.theguardian.com/world/2020/apr/19/coronavirus-vaccine-when-will-we-have-one,
accessed on 15/05/2020.
Sterman, J. D. Business Dynamics: Systems Thinking and Modeling for a Complex World.
McGraw-Hill Higher Education, 2000.
Tang, B., Wang, X., Li, Q., et al. Estimation of the Transmission Risk of the, 2019-nCoV and Its
Implication for Public Health Interventions. Journal of Clinical Medicine, v. 9, n. 2, p. 462,2020.
Vega, D. I. Lockdown, one, two, none, or smart. Modeling containing covid-19 infection. A
conceptual model. Science of The Total Environment, v. 730, p. 138917, 2020.
Wang, W., Li, Y. and Zhang, J. System Dynamics Modeling of SARS Transmission - A Case
Study of Hebei Province. In 2009 International Conference on Management and Service Science.
. IEEE. https://ieeexplore.ieee.org/document/5303731/. Sep 2009.
Wikipedia. Timeline of the COVID-19 pandemic in the United States.
https://en.wikipedia.org/wiki/Timeline_of_the_COVID-19_pandemic_in_the_United_States,
accessed on 19/05/2020.
World Health Organization. Infection prevention and control of epidemic-and pandemic prone
acute respiratory infections in health care. 2014.
World Health Organization. WHO Timeline - COVID-19. https://www.who.int/news-
room/detail/27-04-2020-who-timeline---covid-19, accessed on 19/05/2020.
World Health Organization. “Immunity passports” in the context of COVID-19. 2020b.
Zhu, W., Li, X., Wu, Y., et al. Community quarantine strategy against coronavirus disease, 2019
in Anhui: An evaluation based on trauma center patients. International Journal of Infectious
Diseases, v. 96, p. 417–421 Jul 2020.