Embed Size (px)
Citation preview
DevelopmentDevelopment ofof a a StandStand--AloneAlone
Pulse Pulse OximeterOximeter
Universidade de CoimbraFaculdade de Ciências e TecnologiaMaster of Biomedical EngineeringCoimbra, September 2009
Pulse Pulse OximeterOximeterMasterMaster ThesisThesis
Ana Rita Carvalho Domingues
Electronics and Instrumentation Group
Instrumentation Center
Physics Department - FCTUC
Intelligent Sensing Anywhere
DevelopmentDevelopment ofof a a StandStand--AloneAlone
Pulse Pulse OximeterOximeter
Ana Rita Carvalho Domingues
Student Number: 2004107061
Project Coordinator: Prof. Carlos Correia
Project Supervisor: PhD João Cardoso
Dissertation presented to the University of Coimbra to obtain the
degree of Master of Biomedical Engineering
Coimbra, September 2009

Electronics and Instrumentation Group Intelligent Sensing Anywhere Instrumentation Center Physics Department - FCTUC
DEVELOPMENT OF A STAND-ALONE
PULSE OXIMETER
Ana Rita Carvalho Domingues
Student Number: 2004107061
Project Coordinator: Professor Carlos Correia
Project Supervisor: PhD João Cardoso
Dissertation presented to the University of Coimbra
to obtain the degree of Master of Biomedical Engineering
Coimbra, September 2009

Development of a Stand-Alone Pulse Oximeter ABSTRACT
- i -
ABSTRACT Nowadays, the biomedical instrumentation holds a prominent position within
medicine. Following this trend, the pulse oximeter has become an important tool to
elucidate about the functioning of the organism and wakeup for anomalies by monitoring
the heartbeat and the level of oxygen saturation in the blood that flows in the human
body. These devices are mostly used in hospitals and clinics but are gradually finding their
way into domestic use.
The goal of this thesis is to develop and test technology solutions to implement a
cheap, accurate, reliable and easy to use finger transmission pulse oximeter probe able to
interface an acquisition module and then data is sent to a processing module that will
process the signals.
Electronic circuits were developed to take measurements of light transmitted
through the finger at two different wavelengths. These circuits include three functional
modules of the oximeter probe which allow the signal acquisition: a LED driver module
which controls the amount of drive current; a photodetection module which detects light
that is transmitted through the finger and converts the electrical signal into voltage; and a
timing module which allows the LEDs to switch in order to light up alternately.
The obtained results show that the oximeter probe developed has a good
performance and is able to detect transmitted light through a human finger with
variations in the amplitude of voltage at two wavelengths, making possible to calculate
the percentage of oxygen saturation in the blood and simultaneously the heart rate.
Development of a Stand-Alone Pulse Oximeter RESUMO
- ii -
RESUMO
Hoje em dia, a instrumentação biomédica ocupa posição de destaque dentro da
medicina. Seguindo essa tendência, o oxímetro de pulso tornou-se num importante
instrumento para elucidar acerca do funcionamento do organismo e alertar para
eventuais anomalias através da monitorização do batimento cardíaco e do nível de
saturação de oxigénio do sangue que flui no corpo humano. Estes equipamentos são
maioritariamente encontrados em hospitais e clínicas mas gradualmente estão a ser cada
vez mais utilizados a partir de casa.
O objectivo desta tese é desenvolver e testar soluções tecnológicas para
implementar uma ponta oximétrica de transmissão para o dedo barata, exacta, durável e
fácil de usar que possa ser capaz de interagir com um módulo de aquisição e
posteriormente os dados são enviados para um módulo de processamento que efectuará
o processamento dos sinais.
Foram desenvolvidos circuitos electrónicos para efectuar medidas da luz
transmitida através do dedo a dois comprimentos de onda diferentes. Esses circuitos
incluem três módulos funcionais da ponta oximétrica que permitem a aquisição do sinal:
um módulo de driver dos LEDs que controla a quantidade de corrente no circuito; um
módulo de fotodetecção que detecta a luz que é transmitida através do dedo e converte o
sinal eléctrico em tensão; e um módulo de temporização dos LEDs que possibilita a
comutação destes para que acendam alternadamente.
Os resultados obtidos mostram que a ponta oximétrica desenvolvida tem um bom
desempenho e consegue detectar luz através do dedo humano com variações na
amplitude de tensão para os dois comprimentos de onda, tornando assim possível o
cálculo da percentagem de saturação do oxigénio no sangue e simultaneamente o
batimento cardíaco.

Development of a Stand-Alone Pulse Oximeter ACKNOWLEDMENTS
- iii -
ACKNOWLEDGMENTS
First of all I would like to thank the Professor Carlos Correia and Professor Miguel
Morgado for helping me to find this project.
I am very grateful to my supervisor PhD João Cardoso for his help, patience,
guidance throughout the project work and for everything he has taught me.
I also want to thank Engineer Catarina Pereira for all help and given suggestions.
To all my colleagues and friends of GEI for the good work environment; to my
partner of work, Sérgio Brás, for sharing with me the knowledge, the concerns and ideas.
To the members of “Fantastic Four” João, André and especially to Neuza my
inseparable partner of the moments of work, nighters and despair. To Carolina and
Mariana for being part of the best house of Coimbra and to Inês for all the support and
friendship especially in the writing of this thesis. To all my other friends that even though
indirectly helped in the development of this project and always believe in my capabilities.
And finally, to my family but especially to my dear parents, for being my safe
haven, for you were the best parents anyone can have and if I came here today I owe
almost everything to you. To my brother, thank you for always encouraging me and for
the pride shown in each of my conquests.

Development of a Stand-Alone Pulse Oximeter DEDICATORY
- iv -
To my family and friends
Development of a Stand-Alone Pulse Oximeter TABLE OF CONTENTS
- v -
TABLE OF CONTENTS
ABSTRACT ……………………………………………..…………….………………………………..…………… I
RESUMO ………………………………….………………………….………………………………..…………… Ii
ACKNOWLEDGMENTS ………….…………………….………………………………………..…………… Iii
DEDICATORY ………………………………….……………………………………………………..…………… Iv
TABLE OF CONTENTS ….…………………………………………………………………….…..…………… V
LIST OF FIGURES ……………………………………………………………………………….…..…………… Vii
LIST OF TABLES ………………………………………………………………………………….…..…………… Ix
ACRONYMS AND DEFINITIONS ………………………………………………………….…..…………… X
1. Introduction ………………………………………………………………………………….…..…………… 1
1.1. Motivations …………………………………………………………………………..…………… 1
1.2. Objectives …………………………………………………………………………………….…… 1
1.3. Developed Works ………………………………………………………………………………. 2
1.4. Document Structure ….………………………………………………………………………. 2
2. Theoretical and Technical Background ………………………………………………….……….. 4
2.1. Study of Hemoglobin …………………………………………………………………………. 4
2.2. Oxygen Saturation and the Absorption of Light in Tissues …………….….. 8
2.3. Pulse Oximeters – Principles of Operation …………….…..………………….….. 14
2.4. State of the Art ….…………….…..…………………………….…..………………………… 18
2.4.1. Alternative Non-Invasive Optical Methods of Oximetry ……….. 18
2.4.2. Pulse Oximeters and Oximeter Probes ………………………………….. 20
2.5. Test Procedures (ISO 9919:2005) ………………………………………………….…… 27
2.6. Commercialization of Pulse Oximeters ….…………………………………………… 28
3. System Arquitecture …….………………………………………………………………………………… 31
3.1. Project Requirements ………………………………………………………………………… 31
3.2. Work Evolution ……………………………………………………………………………….... 32
3.3. Overall Architecture of the System ……………………………………………….…… 37
3.3.1. Oximeter Probe …………………………………………………………………….. 38

Development of a Stand-Alone Pulse Oximeter TABLE OF CONTENTS
- vi -
3.3.2. Acquisition and Processing Module …………………………………..….. 39
3.4. Oximeter Probe Design ……………………………………………………………………… 40
3.4.1. Modules ……………………………………………………………………………….. 41
3.4.1.1. LED Driver Module ………………………………………………….. 42
3.4.1.2. Photodetection Module …………………………………………… 45
3.4.1.3. Timing Module ………………………………………………………… 48
3.5. Data Acquisition Platform …………………………………………………………………. 55
3.6. Data Processing Tools (Matlab) …………………………………………………………. 56
4. Results and Discussion of Results ………….……………………………………………………….. 59
4.1. Tests.…………………….……………………………………………………………………………. 59
4.2. Final Results.…………………………………………………………………………….….……. 61
4.3. Discussion of Results..……………….………………………..…………………….………. 71
5. Conclusions and Future Work …………..……………………………..……………………..……… 73
5.1. Project Status ………………………………………………………………………………….… 73
5.2. Suggestions for a Future Work …………………………………………………………… 74
5.3. Final Appreciation ………………………………………………….……………………..…… 75
6. References …………………………………….……………..………………….…………..…………..…… 76
ATTACHMENTS
ATTACHMENT A - ISO 9919:2005 ………………….………………………………………..… 80
ATTACHMENT B – FDA(510k) costs ……………………………………………..…………… 92
ATTACHMENT C – First Oximeter Probe Circuit ……………………………..……..… 93
ATTACHMENT D – Matlab Algorithm …………………………………………..…………… 95
ATTACHMENT E – Peakdet Matlab Algorithm ………………………………………..… 97
ATTACHMENT F – LEDs Driver Circuit ……………………………………………………… 99
ATTACHMENT G – LEDs Driver Circuit (Timer) ..………………………………………… 101
ATTACHMENT H - 555 Astable Frequencies ………………………………..…………… 103

Development of a Stand-Alone Pulse Oximeter LIST OF FIGURES
- vii -
LIST OF FIGURES
Figure 1 - Structure of hemoglobin ……………………………………………..……………………… 4
Figure 2 - Schematic of gas exchange in pulmonary capillaries ………………………….. 5
Figure 3 - Schematic of gas exchange in tissues capillaries ………………………………… 5
Figure 4 - Graph of the absorption curves for oxygenated and deoxygenated hemoglobin vs wavelength …………………………………………………………….……
6
Figure 5 - Absorption spectra of common forms of haemoglobin ………………………. 7
Figure 6 - Graph of transmitted light intensity through the finger ……………………… 11
Figure 7 - Empirical Ros to SPO2 curve ……………………………………………………..…………… 13
Figure 8 - Schematic block diagram of a pulse oximeter …………………………………….. 14
Figure 9 - The basic components of a pulse oximeter probe ………………………………. 14
Figure 10 - Typical transimpedance amplifier used with a photodiode ………………… 15
Figure 11 - Schematic representation of light absorption in adequately perfused tissue ………………………….………………………….………………………….……………….
17
Figure 12 - Typical pulsatile signals detected in the intensity of light when light passes through a finger………………………….………………………….…………………
17
Figure 13 - The Hewlett Packard Model 47201A ear oximeter …….………….…………… 19
Figure 14 - Portable Nonin Onyx 9500 pulse oximeter .………………………….…………….. 21
Figure 15 - Transmission vs reflectance oximeter probes .………………………..………… 22
Figure 16 - Transmission Probe .…………………………………………………………….…………… 23
Figure 17 - Reflectance Probe .…………………………………………………………….………………. 24
Figure 18 - Finger Transmission Probe ..……………………………………………………………… 25
Figure 19 - Earlobe Transmission Probe ...……………………………...………………..………… 26
Figure 20 - Forehead Reflectance Probe ...………………..…...………………..…...…………….. 26
Figure 21 - The CE marking form ...………………..…...………………..…...………………………… 28
Figure 22 - First oximeter probe prototype developed by the students ………..……… 33
Figure 23 - Oximeter probe prototyte switched on ………………………………….………..… 33
Figure 24 - Graphical representation of the data acquired with the NI-6009 DAQ, before Matlab processing ……………………………………………….…………………..
34
Figure 25 - Graphical representation of the signal acquired with NI-6009 DAQ, after Matlab processing ……………………………………………………………….……..
35
Figure 26 - System Architecture …………………………………………………………………………… 37
Figure 27 - Oximeter probe prototype switched ………………………………..………………… 40
Development of a Stand-Alone Pulse Oximeter LIST OF FIGURES
- viii -
Figure 28 - Arms of the Oximeter Probe Prototype ……………………………………………… 40
Figure 29 - Workbench at GEI ……………………………………………………….……………………… 41
Figure 30 - Breadboard containing the modules …………………….……………………………. 41
Figure 31 - Polarization circuit of the red LED ….………………………..…………………………. 42
Figure 32 - Transimpedance amplifier configuration with a photodiode ………………. 45
Figure 33 - An 8-pin 555 timer .………………………..……………………………….…………………. 49
Figure 34 - 555 astable output: a square wave ……………..……………………………..………. 49
Figure 35 - 555 astable circuit ……………………………………………………………………..………. 50
Figure 36 - 555 astable circuit operation ………………………………………………..……………. 51
Figure 37 - A 50% duty cycle square wave ……………………………………………………………. 51
Figure 38 - Digital logic AND gate with that of a NOT gate ………………..…………………. 53
Figure 39 - 2-Input NAND Gate ………………..………………….………………..…………………….. 53
Figure 40 - Signal at the output of the 555 timer and the NAND gate ………………….. 54
Figure 41 - NI-6009 DAQ ………………………………………………………………………………………. 55
Figure 42 - Flowshard of the Matlab algorithm ……………………….…………………………… 57
Figure 43 - Portion of a graphical representation focusing the arterial events ……… 61
Figure 44 - Graphical representation of the original signal acquired for the test 1A 62
Figure 45 - Graphical representation of the signal acquired for the test 1A, after Matlab processing ………………………………………………………………………………
63
Figure 46 - Graphical representation of the original signal acquired for the test 1B 63
Figure 47 - Graphical representation of the signal acquired for the test 1B, after Matlab processing ………………………………………………………………………………
64
Figure 48 - Graphical representation of the original signal acquired for the test 1C .
65
Figure 49 - Graphical representation of the original signal acquired for the test 2A 66
Figure 50 - Graphical representation of the signal acquired for the test 2A, after Matlab processing ………………………………………………………………………………
67
Figure 51 - Graphical representation of the original signal acquired to the test 2B 68
Figure 52 - Graphical representation of the signal acquired for the test 2B, after Matlab processing ………………………………………………………………………………
69
Figure 53 - Graphical representation of the original signal acquired for the test 2C .
70

Development of a Stand-Alone Pulse Oximeter LIST OF TABLES
- ix -
LIST OF TABLES
Table 1 - Main features of the photodiode SILONEX - SLCD-61N1 ………………..……… 46
Table 2 - Main features of the NATIONAL SEMICONDUCTOR - LM321MF ………..…. 46
Table 3 - Main features of the NE555-timer ………………….………….………….……………… 52
Table 4 - Truth Table of a NAND gate ………………….………….………….……………………….. 53
Table 5 - Results returned by the processing algorithm for the test 1C …….………… 66
Table 6 - Results returned by the processing algorithm for the test 2C …….………… 70
Development of a Stand-Alone Pulse Oximeter ACRONYMS AND DEFINITIONS
- x -
ACRONYMS AND DEFINITIONS 2,3-DPG 2,3-diphosphoglyceric acid
A Ampere (electric current unit)
A/W Ampere by Watt
AC Alternate Current
Bit Binary Digit
BPM Beats Per Minute
cm Centimetre (unit of length)
CPU Central Processing Unit
DAQ Data Acquisition
DC Direct Current
EC European Community
F Farad (unit of capacitance)
FDA Food and Drug Administration
FET Field Effect Transistor
GEI Electronics and Instrumentation Group
Hb Deoxygenated Hemoglobin
HbO2 Oxygenated Hemoglobin
Hz Symbol of Hertz (frequency unit)
I/O Input/Output
I2C Inter Integrated Circuit
IC Integrated Circuit
INFARMED National Authority of Medicines and Health Products (Portugal)
IR Infrared
ISA Intelligence Sensing Anywhere
ISO International Organization of Standardization
kΩ Kilohm (electrical resistance unit)
LabView Laboratory Virtual Instrument Engineering Workbench
LCD Liquid Crystal Display
LED Light Emitting Diodes
Development of a Stand-Alone Pulse Oximeter ACRONYMS AND DEFINITIONS
- xi -
ln Logarithm to the base e
mA miliampere (electric current unit)
Matlab Matrix Laboratory (Software Application Analysis)
MHz Megahertz (frequency unit)
mm Milimetre (unit of length)
mm2 Squared Milimetre (unit of area)
mm3 Cubic Millimetre (unit of volume)
mV Milivolt (unit of electromotive force)
NAND Not AND
nF Nanofarad (unit of capacitance)
NI National Instruments
nm Nanometre (unit of length)
O2 Molecule of Oxygen
ºC Degree Celsius (unit of temperature)
OP-AMP Operational Amplifier
PC Personal Computer
PCB Printed Circuit Board
pF Picofarad (unit of capacitance)
pH Potential of Hydrogen
PNP Positive-Negative-Positive
QSR Quality System Regulation
R Red
R&D Research & Development
ROS Ratio of Ratios
SaO2 Oxygen Saturation on Arterial Blood
SMD Surface-Mount Technology
SPI Synchronous Serial Interface
SPO2 Saturation of Peripheral Blood Oxygen
TTL Transistor-Transistor Logic
UART Universal Asynchronous Receiver and Transmitters
US United States (of America)

Development of a Stand-Alone Pulse Oximeter ACRONYMS AND DEFINITIONS
- xii -
USB Universal Serial Bus
V Volt (unit of electrostatic potential)
V+ op-amp positive input voltage
μA Microampere (electric current unit)
Ω Symbol of Ohm (electrical resistance unit)
Development of a Stand-Alone Pulse Oximeter INTRODUCTION
- 1 -
1. INTRODUCTION
1.1 Motivations
The measure of the oxygen saturation of a patient’s hemoglobin (Hb) in some parts
of the circulatory system can give important information about the state of vital organs as
heart and lungs and the perfusion in other ones. So, the technique of oximetry can
elucidate about the functioning of the organism and wakeup to possible anomalies.
The regular values of the blood oxygen saturation are around 97% [2] and
significant changes on those values can be associated to alarming situations. Therefore the
technique of monitoring of the oxygen saturation on blood has a wide range of medical
applications; particularly, in patients at risk of respiratory failure, it is important to have a
measure of the efficiency of the work performed by the lungs and it can be done through
the monitoring of how well the arterial blood is oxygenated. The techniques of oximetry
play also an important role in the investigation of sleep disorders.
The development of devices based on non-invasive techniques becomes quite
important due to some limitations associated of the measures on arteries of the oxygen
saturation such as the impossibility of a continuous monitoring and the loss of blood. So
this work will focus the technique of pulse oximetry based on the transmission of light in
tissues as a non-invasive optical way of monitoring the oxygen blood saturation.
1.2 Objectives
The main propose of this project is to develop a stand-alone oximeter which allows
the monitoring of oxygen saturation in a non-invasive way. To that, it is intended to
develop an oximeter probe prototype to acquire the biological signals and then a
acquisition and processing module integrates the data (through the implementation of
algorithms) in order to estimate the oxygen saturation.
The oximetry principles are well studied being described on the literature and are
already truly rooted in modern healthcare with a remarkable credibility. So the oximetry
solution of this project will not for sure revolutionize the world: what’s at stake is not to
create an entire new device but “just” optimize the actual knowledge using off-the-shelf
Development of a Stand-Alone Pulse Oximeter INTRODUCTION
- 2 -
data analyze and hardware components. The purpose is to develop a reliable, low cost and
portable oximetry device ready for clinical and domestic use.
It was also proposed interconnect the pulse oximeter with ISA projects, where the
device would be used to help in the monitoring of the vital signals. ISA (Intelligent Sensing
Anywhere) is a spin-off company of the University of Coimbra that was founded in 1990.
The technologic based company integrates a R&D unit that works on the development of
complete solutions, which include hardware, firmware and software, for a wide range of
application areas, including healthcare.
Particularly, this work will focus on the development of an oximeter probe which
will be responsible by the acquisition of the signal.
1.3 Developed Works
The present project is part of a group of works of the Electronics and
Instrumentation Group (GEI) of the Instrumentation Center, in the development of
instrumentation for the vital signals monitoring.
On the project of “Development of a Stand-Alone Pulse Oximeter”, it was very
important a previous work developed on GEI, in 1995 by Eng. Rita Jorge de Sousa Costa
Pereira, called “Projecto de um Sistema Digital de Medida para Aplicações Biomédicas”
[10]. This work provided some background knowledge about the operating of pulse
oximeters and helped the students to make some options adequate to the desired work
based on the study that had been already done.
1.4 Document Structure
The present thesis has been prepared in six chapters:
• In Chapter 1, the document is contextualized and objectives and motivations
are focused;
• In Chapter 2 it will be exposed the theoretical and technical principles of the
pulse oximetry required to the beginning of the project development and the
state of the art of oximetry, pulse oximeters and oximeter probes. On this

Development of a Stand-Alone Pulse Oximeter INTRODUCTION
- 3 -
chapter, it is also possible to find information about the legal procedure to
commercialization a medical device such as a pulse oximeter in Europe and US;
• Chapter 3 describes the overall system architecture and particularly focused
the three different modules of the oximeter probe and the hardware design;
• Chapter 4 shows the obtained results and the contextualized discussion of
them;
• Chapter 5 ends the project report with an analysis of actual status of the
project, the suggestions for a future work and the student’s final appreciation.
Development of a Stand-Alone Pulse Oximeter THEORETICAL AND TECHNICAL BACKGROUND
- 4 -
2. THEORETICAL AND TECHNICAL BACKGROUND
It was really important to the project the acquisition of theoretical and technical
background in order to be possible to accomplish it. So the first step of the project was the
acquisition of new concepts and review of other ones.
The following chapter present a general description of the research work carried
out during the development of the project for a better technical understanding of the
issues of other chapters.
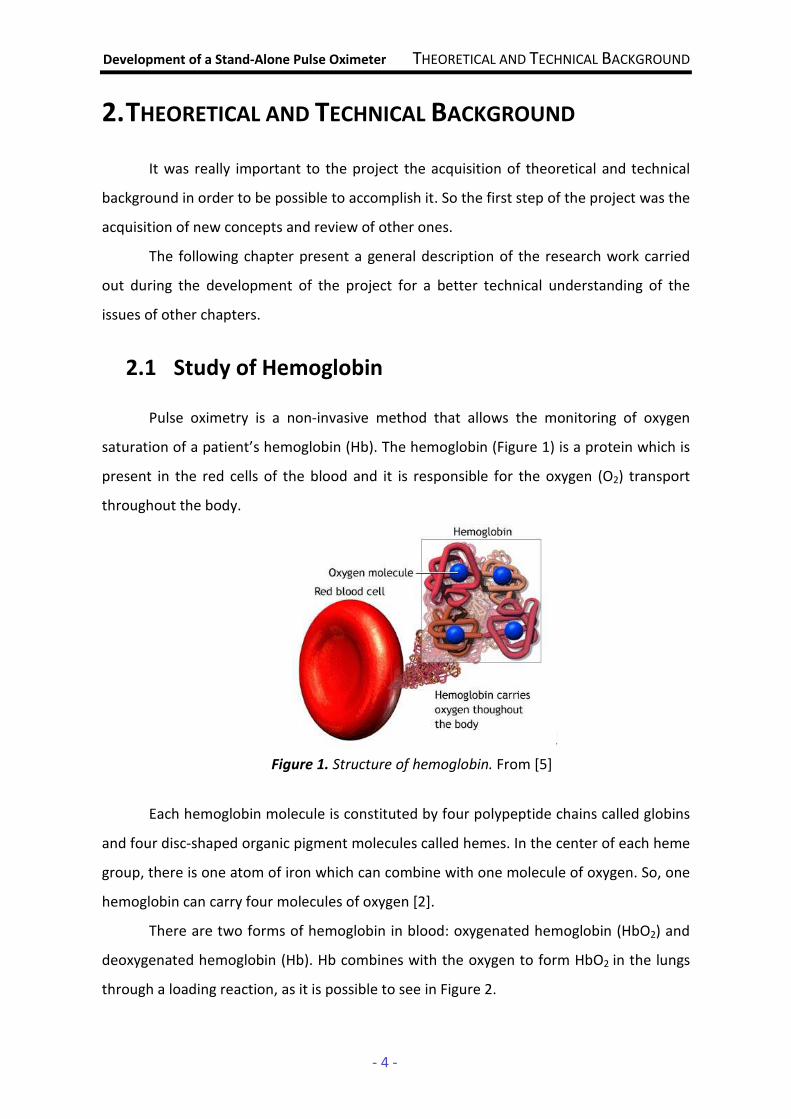
2.1 Study of Hemoglobin Pulse oximetry is a non-invasive method that allows the monitoring of oxygen
saturation of a patient’s hemoglobin (Hb). The hemoglobin (Figure 1) is a protein which is
present in the red cells of the blood and it is responsible for the oxygen (O2) transport
throughout the body.
Each hemoglobin molecule is constituted by four polypeptide chains called globins
and four disc-shaped organic pigment molecules called hemes. In the center of each heme
group, there is one atom of iron which can combine with one molecule of oxygen. So, one
hemoglobin can carry four molecules of oxygen [2].
There are two forms of hemoglobin in blood: oxygenated hemoglobin (HbO2) and
deoxygenated hemoglobin (Hb). Hb combines with the oxygen to form HbO2 in the lungs
through a loading reaction, as it is possible to see in Figure 2.
Figure 1. Structure of hemoglobin. From [5]

Development of a Stand-Alone Pulse Oximeter THEORETICAL AND TECHNICAL BACKGROUND
- 5 -
Figure 2. Schematic of gas exchange in pulmonary capillaries. Based on [2]
The HbO2 is transported to the tissues capillaries where it dissociates to yield Hb
and free O2 molecules through an unloading reaction, and oxygen is used in mitochondria
(Figure 3).
Figure 3. Schematic of gas exchange in tissues capillaries. Based on [2]
Loading and unloading reactions of hemoglobin depend on two factors [2]:
• the partial pressure of oxygen (2OP ): in the pulmonary capillaries, there is a
high value of 2OP and almost all Hb molecules combine with O2; in the
tissues capillaries a low value of 2OP promote the dissociation of HbO2;
• the affinity between hemoglobin and oxygen: a very strong bond would
favor the loading reaction while a weak bond would hinder the dissociation;
the affinity depends on several factors such as temperature, pH and
2,3-diphosphoglyceric acid (2,3-DPG).
Shortly after the discovery of this protein (in 1860 [6]), it was concluded that the
absorption of light by hemoglobin varies according the saturation in oxygen. When the
hemoglobin without oxygen bond with the oxygen to form oxygenated hemoglobin, it
becomes red; in the dissociation of oxygen hemoglobin gets darker. This difference of
O2 is inspired O2 passes to the alveoles
O2 dissolved in plasma
passes to the plasma
O2 + Hb
the most O2 bonds to the red
cells
HbO2 (oxygenated hemoglobin)
O2 is used in mitochondria
dissolved O2 passes to the plasma
O2 dissolved + Hb dissociation
into HbO2
(oxygenated hemoglobin)
passes to the cells
Development of a Stand-Alone Pulse Oximeter THEORETICAL AND TECHNICAL BACKGROUND
- 6 -
colours is because Hb and HbO2 have also a difference in the optical spectral in the range
of wavelengths between 600nm (close to red) and 1000nm (near infrared) [1], [2].
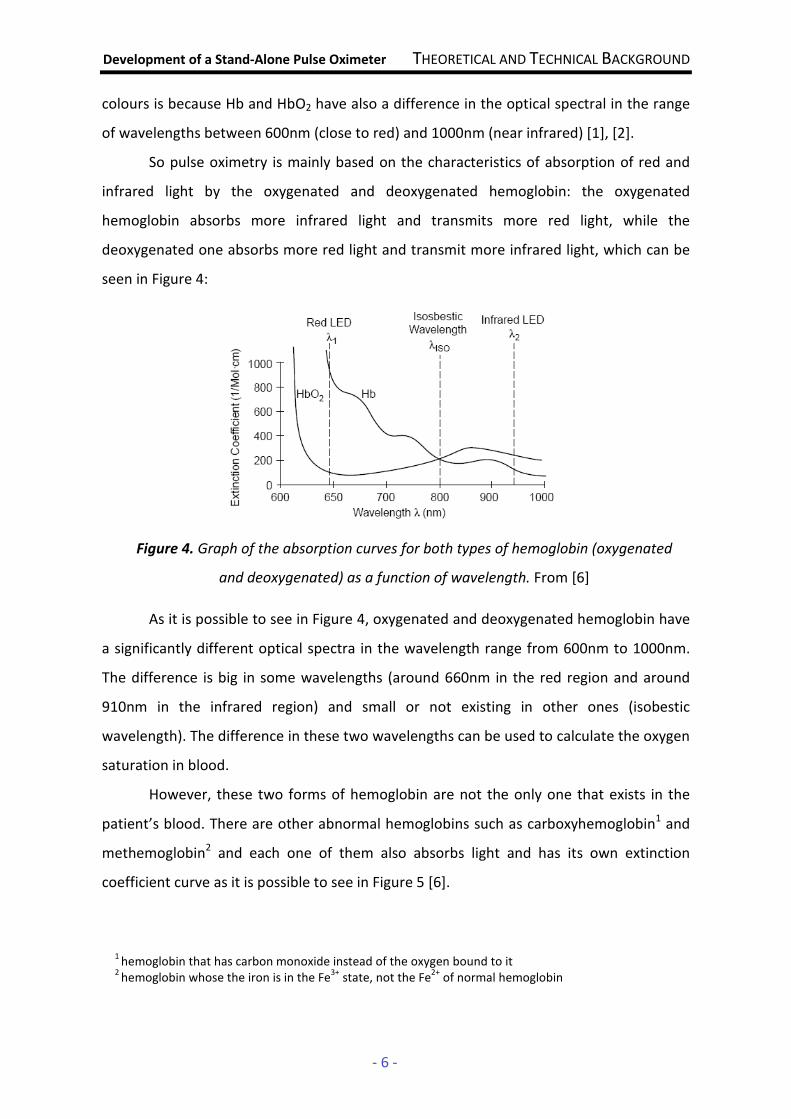
So pulse oximetry is mainly based on the characteristics of absorption of red and
infrared light by the oxygenated and deoxygenated hemoglobin: the oxygenated
hemoglobin absorbs more infrared light and transmits more red light, while the
deoxygenated one absorbs more red light and transmit more infrared light, which can be
seen in Figure 4:
As it is possible to see in Figure 4, oxygenated and deoxygenated hemoglobin have
a significantly different optical spectra in the wavelength range from 600nm to 1000nm.
The difference is big in some wavelengths (around 660nm in the red region and around
910nm in the infrared region) and small or not existing in other ones (isobestic
wavelength). The difference in these two wavelengths can be used to calculate the oxygen
saturation in blood.
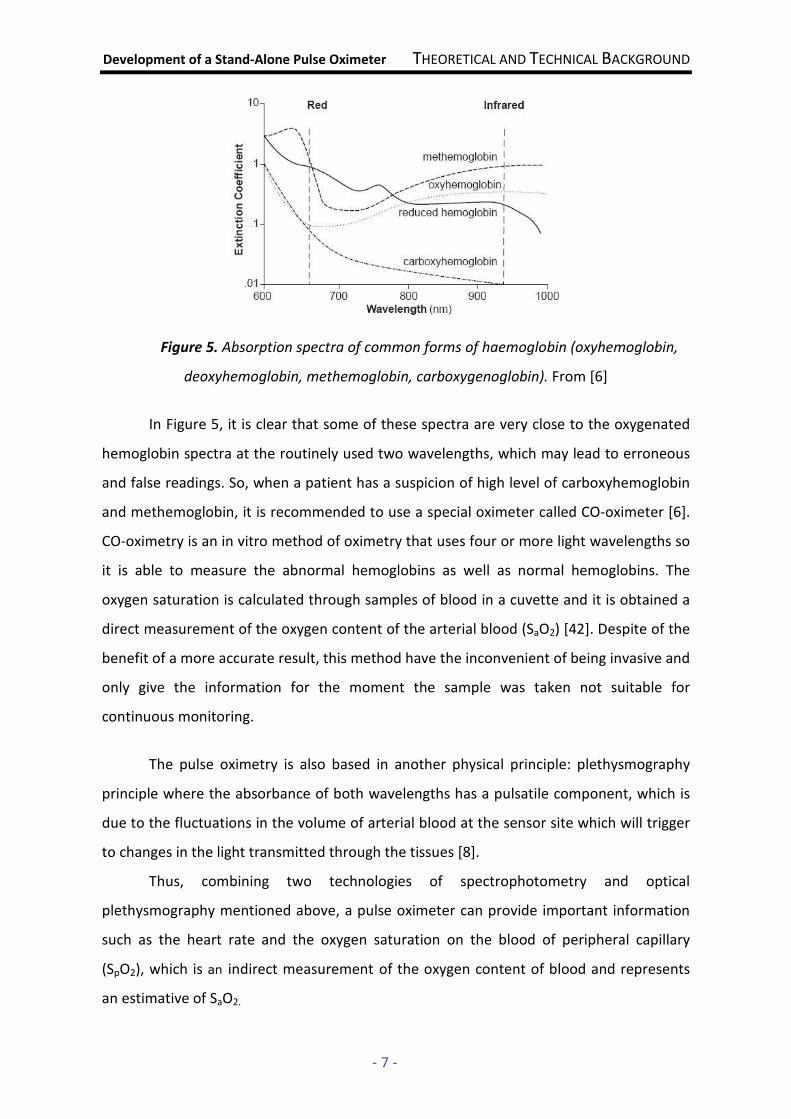
However, these two forms of hemoglobin are not the only one that exists in the
patient’s blood. There are other abnormal hemoglobins such as carboxyhemoglobin1 and
methemoglobin2 and each one of them also absorbs light and has its own extinction
coefficient curve as it is possible to see in Figure 5 [6].
Figure 4. Graph of the absorption curves for both types of hemoglobin (oxygenated
and deoxygenated) as a function of wavelength. From [6]
1 hemoglobin that has carbon monoxide instead of the oxygen bound to it
2 hemoglobin whose the iron is in the Fe
3+ state, not the Fe
2+ of normal hemoglobin
Development of a Stand-Alone Pulse Oximeter THEORETICAL AND TECHNICAL BACKGROUND
- 7 -
Figure 5. Absorption spectra of common forms of haemoglobin (oxyhemoglobin,
deoxyhemoglobin, methemoglobin, carboxygenoglobin). From [6]
In Figure 5, it is clear that some of these spectra are very close to the oxygenated
hemoglobin spectra at the routinely used two wavelengths, which may lead to erroneous
and false readings. So, when a patient has a suspicion of high level of carboxyhemoglobin
and methemoglobin, it is recommended to use a special oximeter called CO-oximeter [6].
CO-oximetry is an in vitro method of oximetry that uses four or more light wavelengths so
it is able to measure the abnormal hemoglobins as well as normal hemoglobins. The
oxygen saturation is calculated through samples of blood in a cuvette and it is obtained a
direct measurement of the oxygen content of the arterial blood (SaO2) [42]. Despite of the
benefit of a more accurate result, this method have the inconvenient of being invasive and
only give the information for the moment the sample was taken not suitable for
continuous monitoring.
The pulse oximetry is also based in another physical principle: plethysmography
principle where the absorbance of both wavelengths has a pulsatile component, which is
due to the fluctuations in the volume of arterial blood at the sensor site which will trigger
to changes in the light transmitted through the tissues [8].
Thus, combining two technologies of spectrophotometry and optical
plethysmography mentioned above, a pulse oximeter can provide important information
such as the heart rate and the oxygen saturation on the blood of peripheral capillary
(SpO2), which is an indirect measurement of the oxygen content of blood and represents
an estimative of SaO2.
Development of a Stand-Alone Pulse Oximeter THEORETICAL AND TECHNICAL BACKGROUND
- 8 -
2.2. Oxygen Saturation and the Absorption of Light in
Tissues
In pulse oximetry, the oxygen saturation in blood (SPO2) is the ratio between the
concentration of oxygenated hemoglobin and all the hemoglobin present in blood which
can be defined by the following equation [1]:
[Hb]][HbO
][HbOOS
2
22P
+= x 100 (%) (Equation 1)
where [HbO2] is the concentration of oxygenated hemoglobin and [Hb] is the
concentration of the deoxygenated form.
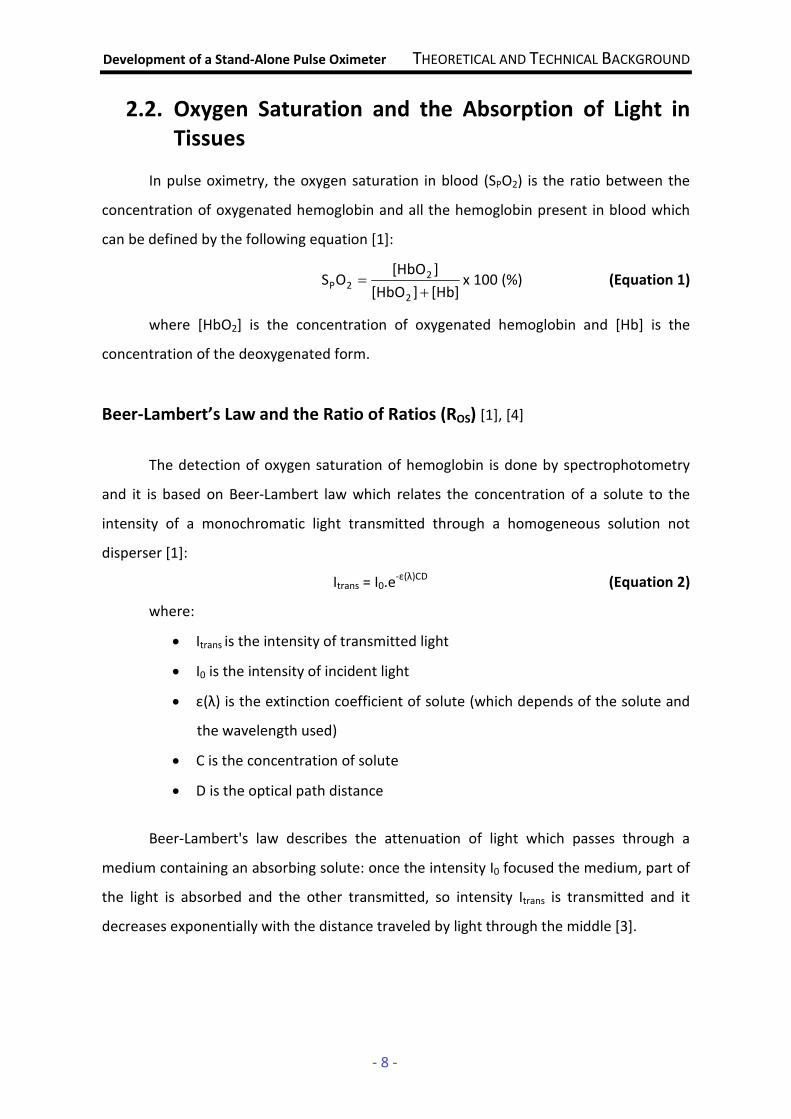
Beer-Lambert’s Law and the Ratio of Ratios (ROS) [1], [4]
The detection of oxygen saturation of hemoglobin is done by spectrophotometry
and it is based on Beer-Lambert law which relates the concentration of a solute to the
intensity of a monochromatic light transmitted through a homogeneous solution not
disperser [1]:
Itrans = I0.e-ε(λ)CD (Equation 2)
where:
• Itrans is the intensity of transmitted light
• I0 is the intensity of incident light
• ε(λ) is the extinction coefficient of solute (which depends of the solute and
the wavelength used)
• C is the concentration of solute
• D is the optical path distance
Beer-Lambert's law describes the attenuation of light which passes through a
medium containing an absorbing solute: once the intensity I0 focused the medium, part of
the light is absorbed and the other transmitted, so intensity Itrans is transmitted and it
decreases exponentially with the distance traveled by light through the middle [3].
Development of a Stand-Alone Pulse Oximeter THEORETICAL AND TECHNICAL BACKGROUND
- 9 -
Using the law of Beer-Lambert to measure oxygen saturation in blood, it is
necessary to take into account two important factors:
• due to reflection and scattering of light, it is not easy to determine the
precise intensity of the incident light applied;
• as the volume of blood at the sensor site varies with the arterial pulse (due
to systole1 and diastole2), the thickness of that place also varies slightly with
each pulse, because the physical diameters of the arteries increase and
decrease periodically due to pressure; therefore, there will be fluctuations
in the distance traveled by light that is transmitted.
So the Beer-Lambert’s law needs to be modified to eliminate the factors
mentioned above and become possible the estimation of oxygen saturation.
Thickness fluctuations caused by arterial pulse can be seen as a change of distance
D of the Beer-Lambert’s equation (Equation 2).
The human body is not composed by just one component with a concentration C at
one absorptivity ε and the intensity of the light transmitted is a function of the absorbance
coefficient of both fixed elements (bone, tissue, skin and hair) as well as variable ones
(volume of blood). So the ε(λ) term and the C term can be lumped together in one term
α(λ) as a function of wavelength:
α(λ) = ε(λ).C (Equation 3)
Assuming that a pulsation’s minimum provides a baseline intensity component I1,
Beer-Lambert’s law can be written as follows:
I1 = ).D(
0 .eI λα1− (Equation 4)
Likewise, a pulsation’s maximum provides a intensity of light I2 emerging from the
pulsatile component and it is a function of its light intensity I1 so Equation 1 can be written
as a variation of the baseline component set in Equation 4:
I2 = D)).().D(
0D).(
1 .eI.eI ∆+−∆−=
λαλαλα 212 ( (Equation 5)
where ΔD is the changing thickness of the place of measurement.
1 where the arterial blood volume is greatest
2 where the arterial blood volume is lowest
Development of a Stand-Alone Pulse Oximeter THEORETICAL AND TECHNICAL BACKGROUND
- 10 -
A change in transmission (∆T) can be defined by taking the relationship between I1
and I2 as follows:
∆TD
eI
I ∆−
−
∆+−
===).(
(
1
2 2
1
21λα
λα
λαλα
).D(0
D)).().D(0
.eI
.eI (Equation 6)
With Equation 6 it was possible to eliminate the input light intensity as a variable.
However, the equation is still a function of ∆D, which is impossible to measure. To simplify
the equation, the natural logarithmic is taken for both sides of Equation 6 yielding the
following:
- ln (ΔT) = - ln D
e∆− .2α = α2(λ).ΔD (Equation 7)
The term ∆D may be dropped by measuring the arterial transmission at two
different wavelengths. In a pulse oximeter, it is selected one red (R) and one infrared (IR)
wavelengths (λR ,λIR), which are in a range away from the approximate isobestic
wavelength that is sufficient to allow the two signals to be easily distinguish:
ln(ΔTR) = - α2(λR).ΔD (Equation 8)
ln(ΔTIR) = - α2(λIR).ΔD (Equation 9)
Assuming that the two sources are positioned at approximately the same distance
from the photodetector, the term ∆D are the same in Equations 8 and 9. For this reason,
∆D may be eliminated through the following quotient:
)(
)(
).(
).(
)ln(
)ln(
2
2
2
2
IR
R
IR
R
IR
R
D
D
T
T
λα
λα
λα
λα=
∆−
∆−=
∆
∆ (Equation 10)
Equation 10 is independent of term ∆D but does not give an accurate
measurement of oxygen saturation in blood, so it is relied to produce a variable to
calculate oxygen saturation. If the ratio of arterial absorbance at the red and infrared
wavelengths can be determined, the oxygen saturation of the blood can be calculated
using empirical derived calibration curves, independently of I0 and ΔD.
Development of a Stand-Alone Pulse Oximeter THEORETICAL AND TECHNICAL BACKGROUND
- 11 -
So, from Equation 10 is defined as the Ratio of Ratios (Ros):
)(
)(
)ln(
)ln(
2
2
IR
R
IR
R
OST
TR
λα
λα=
∆
∆= (Equation 11)
The ratio of Equation 11 is used to calculate the oxygen saturation of the patient’s
blood.
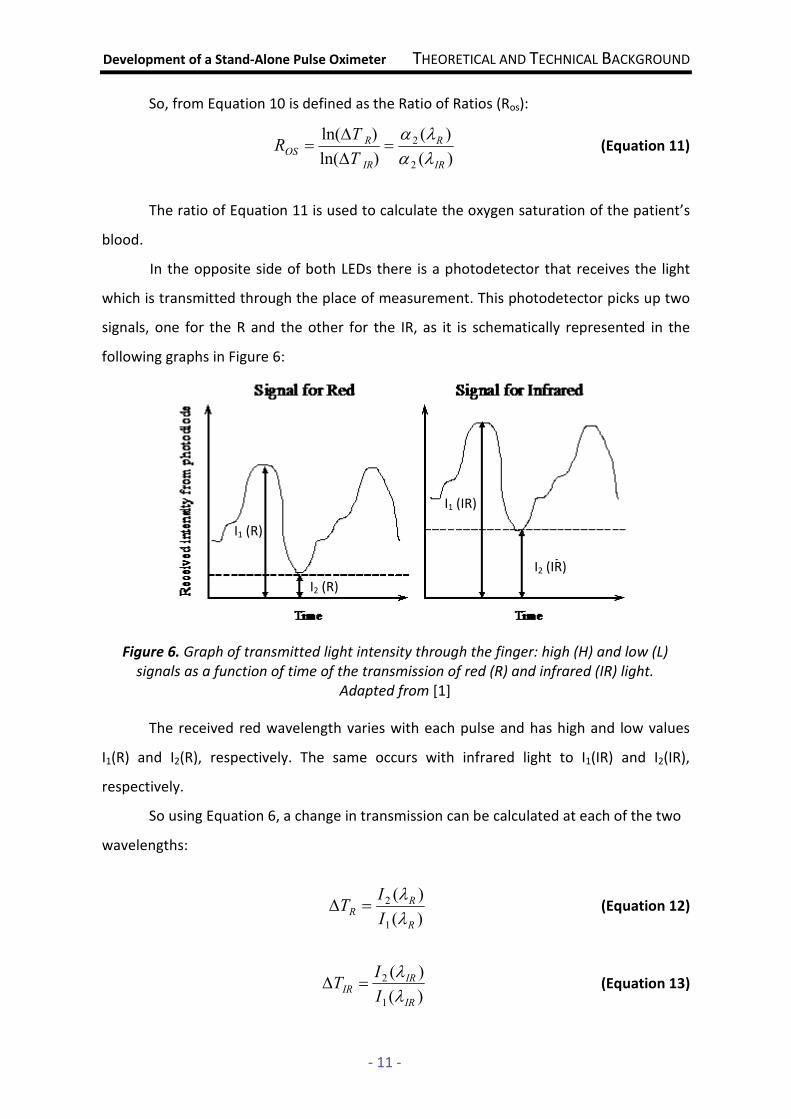
In the opposite side of both LEDs there is a photodetector that receives the light
which is transmitted through the place of measurement. This photodetector picks up two
signals, one for the R and the other for the IR, as it is schematically represented in the
following graphs in Figure 6:
The received red wavelength varies with each pulse and has high and low values
I1(R) and I2(R), respectively. The same occurs with infrared light to I1(IR) and I2(IR),
respectively.
So using Equation 6, a change in transmission can be calculated at each of the two
wavelengths:
)(
)(
1
2
R
R
RI
IT
λ
λ=∆ (Equation 12)
)(
)(
1
2
IR
IR
IRI
IT
λ
λ=∆ (Equation 13)
Figure 6. Graph of transmitted light intensity through the finger: high (H) and low (L)
signals as a function of time of the transmission of red (R) and infrared (IR) light.
Adapted from [1]
I2 (R)
I1 (R)
I2 (IR)
I1 (IR)
Development of a Stand-Alone Pulse Oximeter THEORETICAL AND TECHNICAL BACKGROUND
- 12 -
The logarithmic is taken for both sides of Equations 12 and 13 yielding the
following:
))(
)(ln()ln(
1
2
R
R
RI
IT
λ
λ=∆ (Equation 14)
))(
)(ln()ln(
1
2
IR
IR
IRI
IT
λ
λ=∆ (Equation 15)
Comparing Equation 11 with Equations 14 and 15, the Ratio of Ratios can be
written in terms of the four parameters extracted by the signals provided by the
photodetector and which are represented in Figure 6:
))(
)(ln(
))(
)(ln(
)ln(
)ln(
1
2
1
2
IR
IR
R
R
IR
R
OS
I
I
I
I
T
TR
λ
λ
λ
λ
=∆
∆= (Equation 16)
Then, empirically derived calibration curves are used to determine the oxygen
saturation based o Ros.
Calibration
The processing module receives the pulse wave, integrates and analyses the data
and calculate the Ros. But this ratio is just an empirical measurement and doesn’t provide
any accurate value of oxygen saturation. So it is necessary to elaborate a calibration
algorithm, to provide accurate readings [9].
In practice, a clinical empirical formula for the SPO2 is used [11]:
S = a – b R (Equation 17)
where a and b are coefficients that are determined when the pulse oximeter is
being calibrated, S is the variable SPO2 and R the variable Ros [11].
Development of a Stand-Alone Pulse Oximeter THEORETICAL AND TECHNICAL BACKGROUND
- 13 -
To get the values of a and b of Equation 17 that relate SPO2 with Ros, it is necessary
a volunteer data performed by a CO-oximeter or a second calibrated pulse oximeter [12].
Then it is done some experiments using different samples, which different values of SPO2,
and the value of Ros is collected to each one.
Coefficients a and b can be determined by performing the linear fit of the R values
using the least squares method with the Equations 18 and 19 [11]:
∑ ∑
∑ ∑ ∑ ∑
= =
= = = =
−
−
=n
1i
n
1i
2i
2i
n
1i
n
1i
n
1i
n
1iiii
2ii
)R(Rn
SRRRS
a (Equation 18)
(Equation 19)
where Si is the SPO2 value measured by the SPO2 CO-oximeter or a calibrated pulse
oximeter; Ri is the measured ratio ROS that corresponds to Si; and n is the number of
measurements.
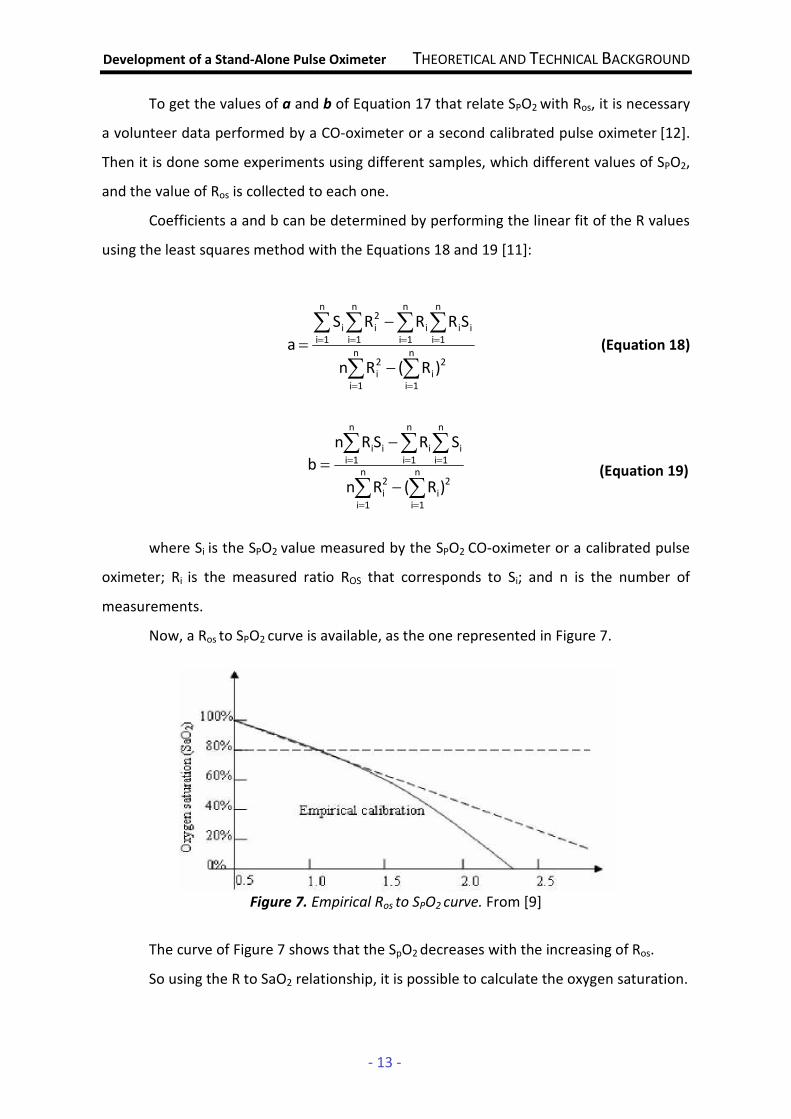
Now, a Ros to SPO2 curve is available, as the one represented in Figure 7.
Figure 7. Empirical Ros to SPO2 curve. From [9]
The curve of Figure 7 shows that the SpO2 decreases with the increasing of Ros.
So using the R to SaO2 relationship, it is possible to calculate the oxygen saturation.
∑ ∑
∑ ∑ ∑
= =
= = =
−
−
=n
1i
n
1i
2i
2i
n
1i
n
1i
n
1iiiii
)R(Rn
SRSRn
b
Development of a Stand-Alone Pulse Oximeter THEORETICAL AND TECHNICAL BACKGROUND
- 14 -
2.3. Pulse Oximeters – Principles of Operation
In this section, it will be illustrate the general design and operation of a pulse
oximeter. Oxygen saturation is determined by monitoring pulsations at two wavelengths
and then comparing the absorption spectra of oxygenated hemoglobin and deoxygenated
hemoglobin.
The biological signals have low amplitude so they can be difficult to process using
common circuits. This requires that medical equipment has a special construction in order
to avoid external noise and other interferences and need to operate with maximum
possible safety. Schematically, a pulse oximeter can be represented by the following block
diagram:
Figure 8. Schematic block diagram of a pulse oximeter. Adapted from [9]
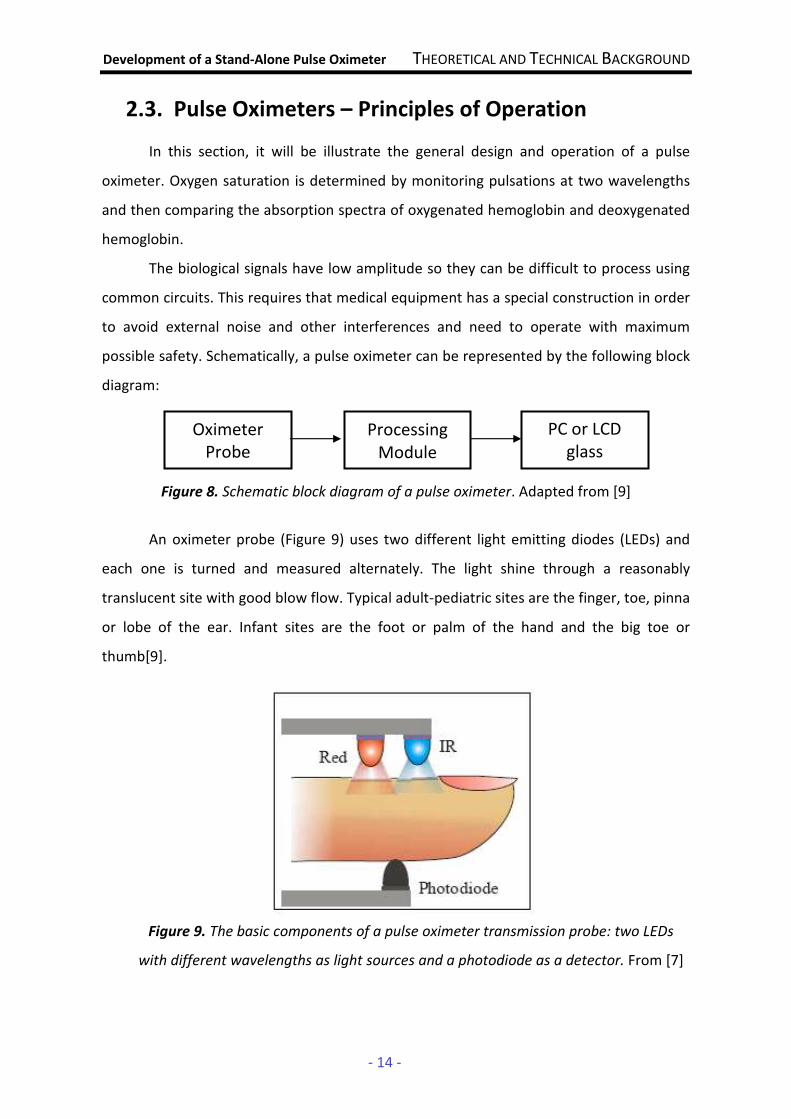
An oximeter probe (Figure 9) uses two different light emitting diodes (LEDs) and
each one is turned and measured alternately. The light shine through a reasonably
translucent site with good blow flow. Typical adult-pediatric sites are the finger, toe, pinna
or lobe of the ear. Infant sites are the foot or palm of the hand and the big toe or
thumb[9].
Figure 9. The basic components of a pulse oximeter transmission probe: two LEDs
with different wavelengths as light sources and a photodiode as a detector. From [7]
Oximeter Probe
Processing Module
PC or LCD glass
Development of a Stand-Alone Pulse Oximeter THEORETICAL AND TECHNICAL BACKGROUND
- 15 -
There are two methods of sending light thought the measuring site: transmission
method and reflectance method. The transmission method is the most common type used
on pulse oximetry applications and the method used on this project; so for this discussion
the transmission method will be implied. The reflectance method will be explained on the
next section of this chapter.
After the transmitted red and infrared signals pass thought the measuring site, a
receiver on the opposite site of the LEDs detects the output light at each wavelength.
Generally, the photodetector used is a photodiode and when the light attenuated by body
tissue is detected by it, the photodetector will generate a very low level current. To
amplify the low amplitude signal generated and convert the current to a significant
voltage, it must be used an amplifier. The most common types of amplifiers used in pulse
oximetry applications today are transimpedance amplifiers which operate as current-to-
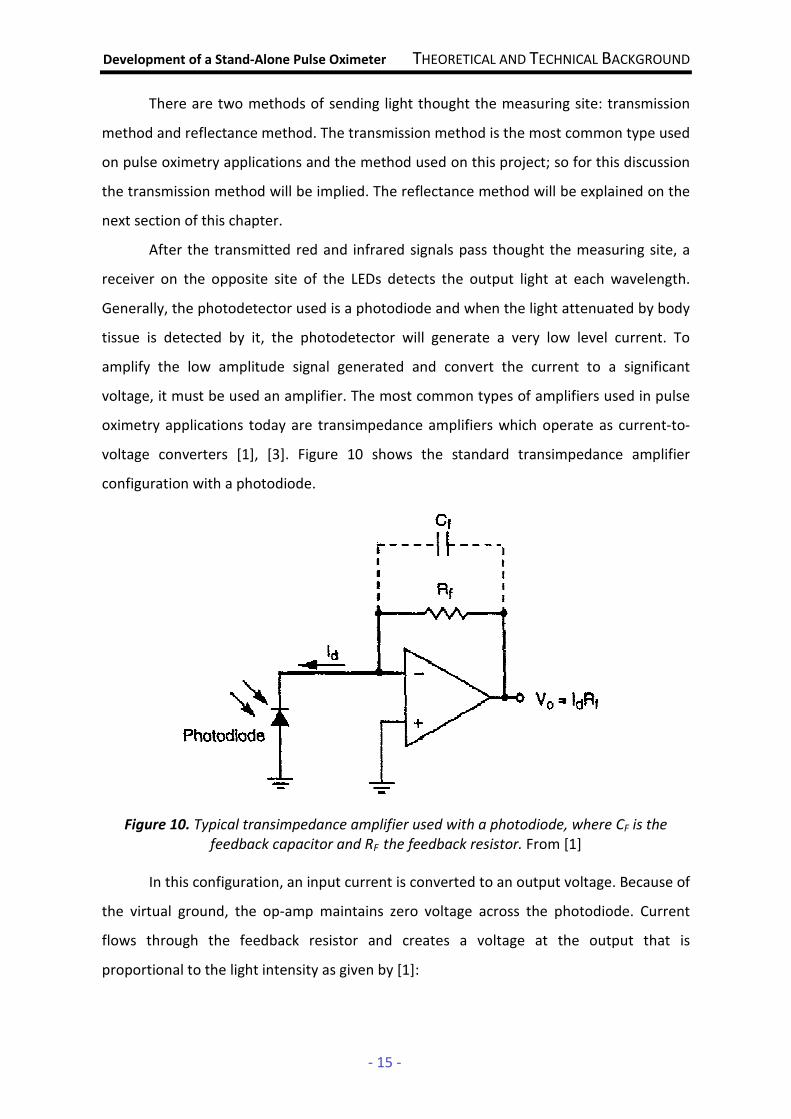
voltage converters [1], [3]. Figure 10 shows the standard transimpedance amplifier
configuration with a photodiode.
Figure 10. Typical transimpedance amplifier used with a photodiode, where CF is the
feedback capacitor and RF the feedback resistor. From [1]
In this configuration, an input current is converted to an output voltage. Because of
the virtual ground, the op-amp maintains zero voltage across the photodiode. Current
flows through the feedback resistor and creates a voltage at the output that is
proportional to the light intensity as given by [1]:
Development of a Stand-Alone Pulse Oximeter THEORETICAL AND TECHNICAL BACKGROUND
- 16 -
V0 = IdRf (Equation 20)
Then the signal is sent to a processing module. This module receives the pulse
wave of each wavelength, integrates and analyses the data and calculates the R/IR ratio
and the heart rate. Then through an elaborate calibration algorithm based on human
volunteer data it is possible to convert the ratio to pulse oxygen saturation value. Usually,
the pulse oximeters use data from CO-oximeters to empirically look up a value for SpO2.
Finally, the results can be displayed on a LCD or transferred to PC.
The pulse oximetry method detects the changes in light absorbance through the
tissues, which corresponds to the blood pulses. At each heart beat the heart contracts and
there is a surge of arterial blood, which momentarily increases the blood volume across
the measuring site. This results in more light absorption during the surge so light signals
received at the photodetector are looked as a waveform (peaks with each heartbeat and
troughs between heartbeats) [1], [6].
In the measurements of the light attenuated in the tissues, it is possible to find a
direct current (DC) component and an alternate current (AC) one (Figure 11). It is assumed
that the DC component is the result of the absorption by the body tissue and veins and
the AC component is the result of the absorption by the arteries. The pulsatile effect
occurs only in the arteries and arterioles but not in the veins. By tracking this peak-to-peak
AC component, the absorbance due to venous blood or tissue does not have any effect on
the measurement and only the part of signal that is directly related with the arterial blood
is used for the calculation of oxygen saturation [1].

Development of a Stand-Alone Pulse Oximeter THEORETICAL AND TECHNICAL BACKGROUND
- 17 -
Figure 11. Schematic representation of light absorption in adequately perfused
tissue. From [6]
Figures 12(a) and 12(b) show typical pulsatile signals detected when red or infrared
LED is shone through a finger.
Figure 12 (a) and (b). Typical pulsatile signals detected in the intensity of light when light
passes through a finger. From [12]
In this figures it is possible to see that the baseline (DC content) has been removed
from these curves. It is also possible to see that there is quite a wide variation in the shape
of the curves between different people. Particularly, in the signal of Figure 12(b) it is
possible to identify a secondary peak for each heart beat, which is known as the dicrotic
notch. This notch is a quite common physiological phenomenon and is a result of the
sudden closure of the aortic valve which causes a momentary elevated rebound in the
pressure reading, such that the smooth downward slope of the pressure waveform is
interrupted by a very brief upward movement forming a sawtooth notch [12], [38].
a)
b)
Development of a Stand-Alone Pulse Oximeter THEORETICAL AND TECHNICAL BACKGROUND
- 18 -
2.4. State of the Art
The techniques of oximetry and particularly the non-invasive methods play an
important role on healthcare field. The method of pulse oximetry is the most used today
but it is possible to find alternative optical methods which compete with it. In this section,
it will be described these existing methods.
It will be exposed also an analysis of the features of the pulse oximeters that can be
found in the market and especially what exists available for oximeter probes.
2.4.1. Alternative Non-Invasive Optical Methods of Oximetry
• Ear Oximetry
The first non-invasive oximeters that appeared were the ear oximeters, around
1935 [6], when it was proved that the transmission oximetry could be applied to the
external ear. In this oximetry, the light of one or more wavelength is transmitted through
the ear lobe or the pinna of the ear of the patient and the intensity of transmitted light is
measured on the other side of the ear lobe [10].
However, the major inconvenient of ear oximetry was revealed to be the inability
to differentiate light absorption due to arterial blood from that due to venous blood and
tissues. In order to overcome this, the newer devices also make arterialization of the
blood capillaries to dilate the vascular bed in the area of measurement and thus increase
the infusion. Moreover, the devices compare the optical properties of a "bloodless"
earlobe (by compressing it using a special device) with the optical properties using a
perfused earlobe [6], [10].
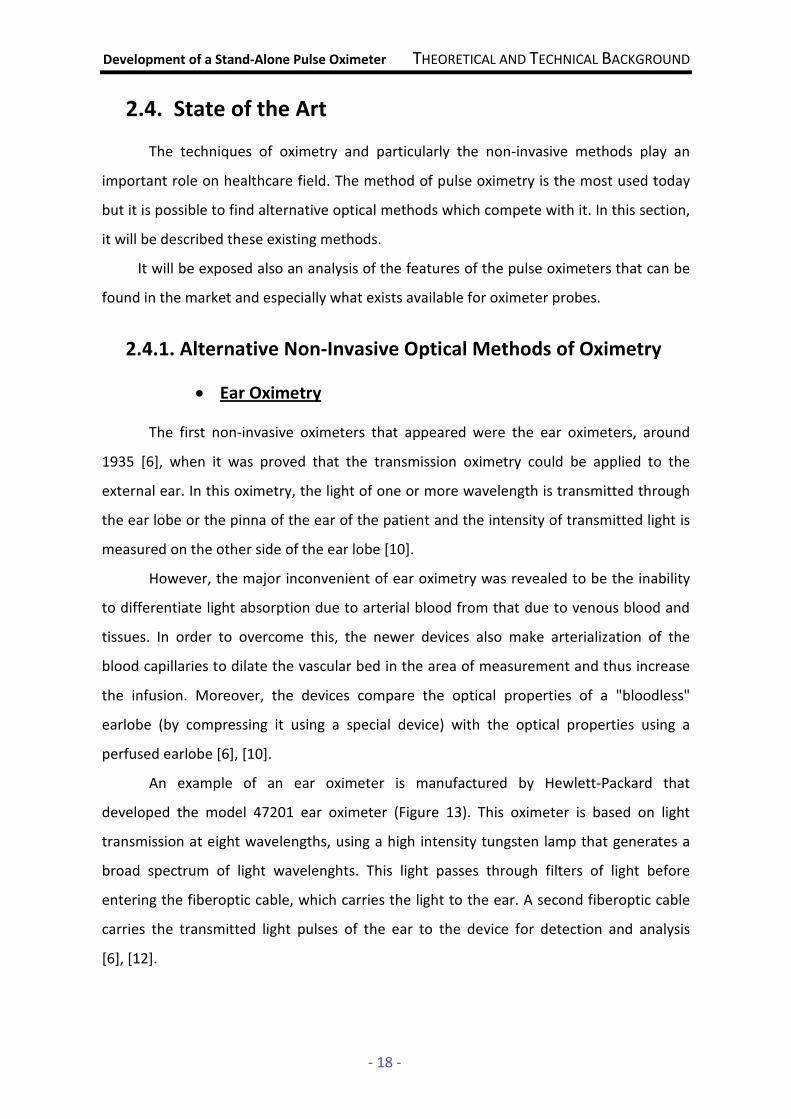
An example of an ear oximeter is manufactured by Hewlett-Packard that
developed the model 47201 ear oximeter (Figure 13). This oximeter is based on light
transmission at eight wavelengths, using a high intensity tungsten lamp that generates a
broad spectrum of light wavelenghts. This light passes through filters of light before
entering the fiberoptic cable, which carries the light to the ear. A second fiberoptic cable
carries the transmitted light pulses of the ear to the device for detection and analysis
[6], [12].
Development of a Stand-Alone Pulse Oximeter THEORETICAL AND TECHNICAL BACKGROUND
- 19 -
Figure 13. The Hewlett Packard Model 47201A ear oximeter. From [6]
The probe used in the ear is relatively large (10x10cm) and is equipped with
temperature-controlled heater, to keep the temperature at 41 ºC (ear must be at this
temperature for capillary blood arterialization), thus presenting a discomfort associated
with the warming of the ear [6], [10].
Due to the volume of the components involved, the high cost of instrumentation,
the need for measurements at eight different wavelengths and the development of
technology to solve many of these problems, the ear oximeters is no longer
commercialized [6], [9].
• Laser Oximetry [14]
Laser oximetry is a new non-invasive method to evaluate changes in tissue
perfusion and determine the oxygen saturation on targeted areas of tissue, through a
continuous wave optical spectrometer operating in the near-infrared spectrum.
Nowadays, there are small oximeter probes for measure the oxygen saturation on
extremities of human body such as finger or earlobe through the transmission of light
through a vascular bed to a detector in the opposite site of the emitter. Thus, there are
limitations on the use of these probes for larger organs or tissue structure.
Recently, the development of fiber optic array probes including multiple light
sources and one photodetector coupled to a continuous wave optical spectrometer makes
possible to penetrate a targeted volume of tissue (500 mm3) to an average depth of
5–8mm beneath the skin surface. The photodetector fiber is placed on the same side of
the source fibers and collects scattered light.

Development of a Stand-Alone Pulse Oximeter THEORETICAL AND TECHNICAL BACKGROUND
- 20 -
One of the current applications of laser oximetry is the measure of blood flow in
the fetal brain, using multiple source probes. However, it is a very recently method and its
viability for various parts of the body is not established.
2.4.2. Pulse Oximeters and Oximeter Probes
As said previously, by taking advantage of the pulsatile component of blood, the
pulse oximetry is able to overcome many of the problems of earlier technologies. Pulse
oximetry is a technique that has been for a long time developed and improved, in order to
decrease its limitations, which would lead to better patient care.
Despite the newer technologies, pulse oximeters still present some problems such
as the accuracy of the measures, which has been shown to be ≈ ±4% when compared to
arterial blood oximetry measurements (SaO2) [6]. As it was said previously, the presence of
abnormal hemoglobins such as carboxyhemoglobin and methemoglobin can lead to some
erroneous readings affecting the accuracy of the device. When the presence of either of
these hemoglobins is suspected, pulse oximetry should be supplemented by in-vitro
multiwavelength CO-oximetry. Another limitation is the response in time because there is
a delay between a change in SPO2 and the display of it [8].
In the market, there are different pulse oximeters worked out by many
manufacturers, that offer solutions with many differentiating factors between products.
However, there are common features of the pulse oximeters that can be found in the
market [40], [41]:
• the devices are specially designed to measure arterial oxygen saturation but
most of them can also measure the heart rate and the plethysmography
wave;
• they are useable in children and adults;
• the most part have small dimensions to allow a better portability and less
discomfort to the patient;
• they are wearable and non-invasive;
• most of them have very low power consumption.

Development of a Stand-Alone Pulse Oximeter THEORETICAL AND TECHNICAL BACKGROUND
- 21 -
There are pulse oximeters that provide a continuous monitoring of the vital
parameters and other ones that provide a discrete monitoring of the same parameters.
The first ones are power sourced by regular batteries with an equivalent use range of 20
hours and able to record the data equivalent to that period, useable under a relatively
broad temperature and humidity conditions range for general purposes. These ones give
the results with 2/3 digits precision. The second devices are also power sourced by regular
batteries with autonomy for approximately 20 hours, two digits precision for oxygen
saturation and are usable under a relatively broad temperature and humidity conditions
[40], [41].
The market analysis becomes clear that there are pulse oximeters whose oximeter
probe and the processing module form just a single device, which provide a better
portability.
Figure 14 shows a modern pulse oximeter designed by Nonin, which incorporates
the electronics and sensor into one single unit. This device provides information about
SpO2 and pulse rate which can be read from any angle. It operates on two alkaline
batteries for approximately 1600 spot-checks or up to 18 hours of continuous use and it
accommodates a wide range of finger thicknesses [15].
Figure 14. Portable Nonin Onyx 9500 pulse oximeter. From [15]
There are also oximeters (which is what often happens) that are integrated with
more complex systems and can be connected with a variety of oximeter probes. That is
the case of the oximetry solution of the project and this thesis particularly focuses the
Development of a Stand-Alone Pulse Oximeter THEORETICAL AND TECHNICAL BACKGROUND
- 22 -
development of an oximeter probe so it makes sense to include on the discussion the
different types of oximeter probes which can be found in the market.
There is a specific market to the oximeter probes, which can be commercialized
separately and then connected to an acquisition and processing modules. As said
previously, the oximeter probes are used to acquire the biological signal and send the data
to measure the oxygen saturation in blood. A flexible cable connects the probe to the
pulse oximeter unit, carries electric power to the LEDs and the signal from the
photodiode.
Generally, oximeter probes present some limitations such as the detection of
arterial pulse in low perfusion states (hypotension, hypothermia, cardiopulmonary bypass
or low cardiac output), where can difficult to distinguish the light absorbed by arterial
blood and tissue from that absorbed by the venous blood and tissue [6], [8]. Brown, blue
and green polish nails may affect the calculation of SPO2 too. Other problems of oximeter
probes are the motion artifacts that affect the results of oxygen saturation and the
ambient light interference.
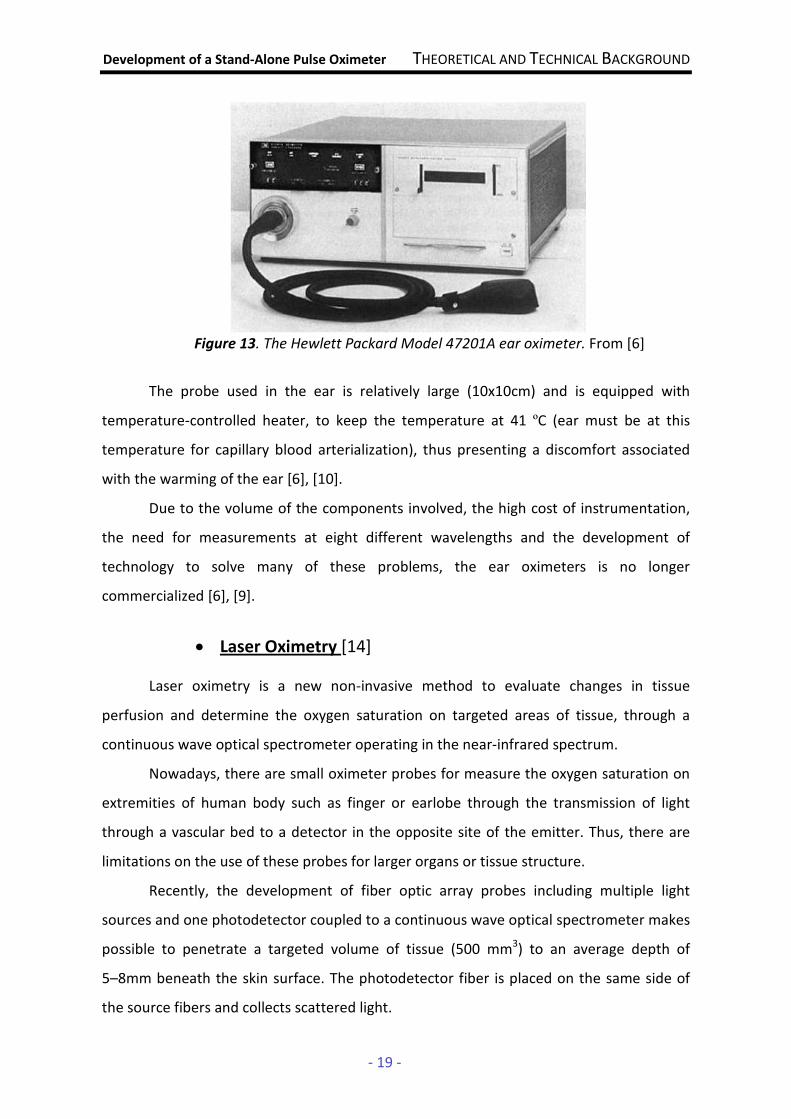
There are two main types of probes on oximetry: transmission probes and
reflectance probes. The difference is in the position of the photodetector on the probe as
is shown in Figure 15.
Figure 15. Transmission vs reflectance oximeter probes and the position of their
components. From [16]

Development of a Stand-Alone Pulse Oximeter THEORETICAL AND TECHNICAL BACKGROUND
- 23 -
The transmission probe has two LEDs on one side and the photodetector on the
other and the site of measurement is inserted between the two. So a pulse oximeter with
transmission probes uses the light transmitted through an extremity to measure the blood
oxygen saturation. Figure 16 shows a general example of a transmission probe.
Figure 16. Transmission Probe: light emitted by the LEDs passes alternately through an
extremity of the body and the transmitted light is detected by a photodetector (a
photodiode in the figure). From [1]
The LEDs of those probes are powered alternately; the light of each wavelength
will pass through the tissue and the photodetector will detect the transmitted light, which
was attenuated by the amount of blood present in the tissue. As the amount of blood
varies with the arterial pulse, transmission probes are used to give also information about
the heart rate.
The light sources and the photodetector are placed facing each other so that the
maximum amount of light can be detected. The photodiode also is positioned as close as
possible to the skin without exerting force on the tissue [1].
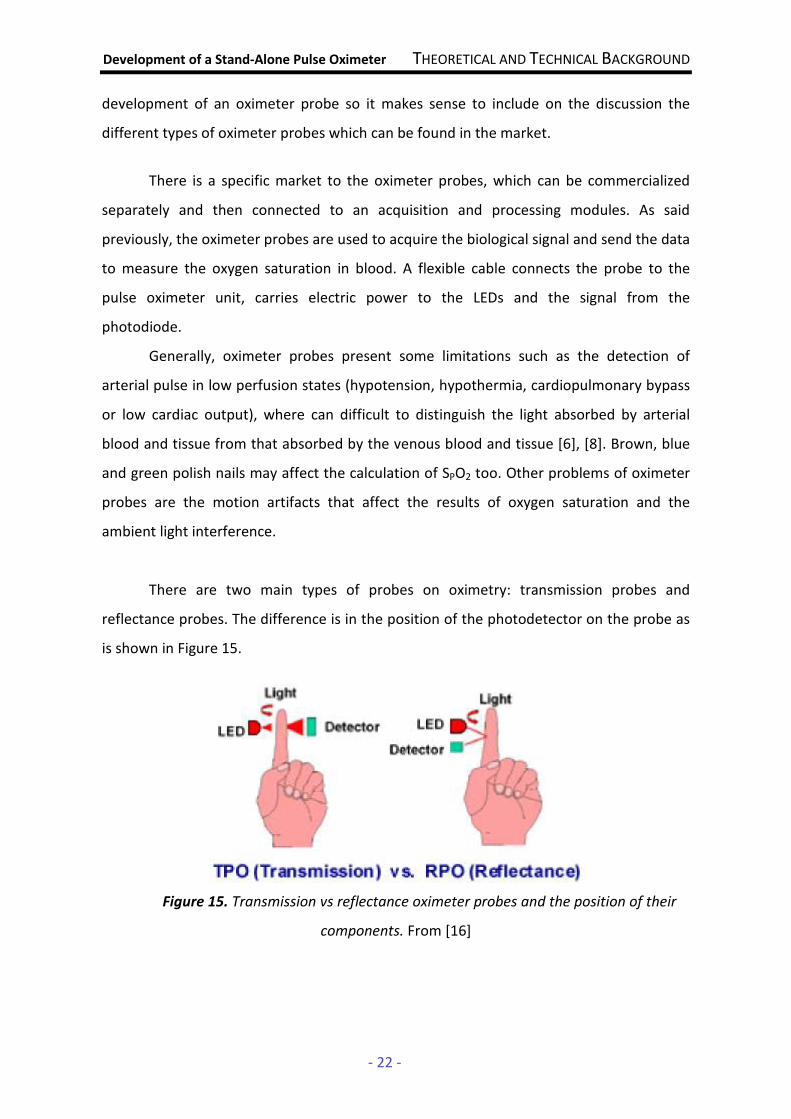
On the other hand, a reflectance probe has the LEDs and the photodetector on the
same side. It must be placed over a point with underlying bone. Figure 17 shows a general
example of a reflectance probe.
Development of a Stand-Alone Pulse Oximeter THEORETICAL AND TECHNICAL BACKGROUND
- 24 -
Figure 17. Reflectance Probe: light emitted by the LEDs enters in the tissue, is
scattered and is detected at the photodetector (a photodiode in the figure). From [1]
The LEDs are powered alternately, the light passes through tissue and blood
vessels, is scattered by moving red blood cells and nonmoving tissue and a part of this
back scattered light passes through the tissues again and is then detected by the
photodetector. The output signal is processed by the pulse oximeter unit, which measures
the SPO2 of the blood.
Comparing the both oximeter probes, it is important to refer that a significant
amount of light will reflect off the skin in the reflectance probes and this light will be
detected, which doesn’t occur in the transmission probes. Moreover, reflectance probes
have a high offset and a lower signal-to-noise ratio when compared with the transmission
probes. However, reflectance probes require a significantly greater amount of light so
either more LEDs or more photodiodes need to be used [1].
Within the oximeter probes mentioned above, there are several types used for
different parts of the body. Transmission and reflectance probes are used clinically,
though transmission probes are more common due to the simplicity of signal analysis and
the ease of attachment and remove.
Due to its principle of operation, reflectance probes can be virtually used in any
place on the human body where the probe can be placed while the transmission probes
can only be used on limited parts.
Transmission probes are more commonly placed on the finger or earlobe.
Reflectance probes can be used at multiple sites of the body, not necessarily extremities,

Development of a Stand-Alone Pulse Oximeter THEORETICAL AND TECHNICAL BACKGROUND
- 25 -
such as forehead, temple or sternum. On the next paragraphs, it will be described the
main types of reflectance and transmission probes that can be found on the market.
The finger transmission probe consists of a spring-loaded clamp which attaches to
the finger, as it is shown in Figure 18. One arm of the spring-loaded clip contains the two
LEDs and the other contains its photodetector, thus allowing the probe to measure the
light transmitted through the finger.
Figure 18. Finger Transmission Probe. From [16]
The main advantage of those probes is its ease to quickly apply it to a finger of a
patient and quickly remove it. Moreover, they do not present discomfort to the patient
and are unobtrusive. However, these probes have some limitations such as [16]:
• they present a low level of mechanical resistance, especially after multiple
uses will be under great mechanical stress which means that the probes won’t
be very durable;
• difficulty in designing a probe that can be used both for infants and adults
finger, so it depends on the patient morphology;
• physiological conditions such as a situation of low blood pressure after a loss
of blood can affect the accuracy of readings since the body reduces the blood
flow to the periphery to maintain adequate blood pressure for the vital
organs and brain.
The earlobe transmission probe consists of two prongs which would be placed on
opposite sides of the earlobe: the LEDs are placed on one prong and the photodetector on
the other one, as shown in Figure 19.

Development of a Stand-Alone Pulse Oximeter THEORETICAL AND TECHNICAL BACKGROUND
- 26 -
Figure 19. Earlobe Transmission Probe. From [16]
Unlike the transmission finger probe, the earlobe probe uses the reliable perfusion
of the head which remains perfused even in cases of severe shock, in which the patient’s
peripheral circulation may be cut off. So those probes are more suitable for patients with
severe blood loss. Those probes have also the advantage of being relatively easy to use,
requiring little or no adjustment between patients. However, the main disadvantage of
the earlobe probe is that it may need to be adjustable to be used on both adults and small
infants [16].
Within the reflectance probes the more common type is the forehead reflectance
probe. This consist on face of the disc that has two LEDs in its center, surrounded by a ring
of three or four photodiodes, as shown in Figure 20.
Figure 20. Forehead Reflectance Probe. Adapted [16]
These probes have no moving parts and present a better level of mechanical
resistance, being probably more durable. Moreover, they have the advantage that is
common in the reflectance probes: the fact of being used on both adults and infants
Photodiodes
2 LEDs
Development of a Stand-Alone Pulse Oximeter THEORETICAL AND TECHNICAL BACKGROUND
- 27 -
without problem, as they just require a relatively flat perfused tissue backed by bone. Like
earlobe transmission probe, forehead uses the reliable perfusion of the head [16].
However, the signal resolution of reflectance probes is lower, creating a higher possibility
of an inaccurate reading. Also, the probe is not well suited for spot checks; the headband
would need to be adjusted frequently between patients. Some physicians might manually
apply the probe, which could potentially result in motion artifacts. Also, with constant
readjustment, the headband would need to be periodically replaced [16].
Finally, in the market it can be found reusable and disposable probes. The reusable
probes are all probes with nonadhesive or disposable adhesive sensors and their main
advantage is obviously its low cost involved. However, reusable probes involves some
drawbacks including the inconvenient of require cleaning between different patients to
minimize the risk of cross contamination and the fact that they are more susceptible to
signal distorting motion artifacts [1].
Disposable probes are the ones that are discarded after they have been used,
eliminating the risk of cross contamination between patients. Generally, the disposable
probes are adhesives so they decrease the signal distorting motion artifacts, because it is
possible to secure the probe in the proper position [1].
2.5. Test Procedures (ISO 9919:2005)
ISO 9919:2005 is a document that presents the requirements for the basic safety
and essential performance of pulse oximeter equipment intended for use on humans.
These requirements also apply to pulse oximeter equipment, including pulse oximeter
monitors, pulse oximeter probes and probe cable extenders that has been reprocessed.
In the Attachment A, it is possible to find the first eleven pages of this document
(the remaining part should be paid to have access). ISO 9919:2005 provides a wide range
of information that represents a guideline in the manufacturing process, such as the
classification of the device, the technical description, components and its assemble,
calibration, the requirements for tests or accuracy of operating data.
Development of a Stand-Alone Pulse Oximeter THEORETICAL AND TECHNICAL BACKGROUND
- 28 -
2.6. Commercialization of Pulse Oximeters
Once the device is completed and all the tests have been passed the following step
is to register the product.
On the beginning of this project, it was proposed to the students the study of the
necessary procedures to market a medical device such as a pulse oximeter. On this
section, it will be presented the research done with the notified organisms.
For medical devices (except for custom-made and intended for clinical research) to
be available for commercial sale, they must meet the requirements of specific legislation.
In Europe if devices meet the requirements, they will have a verifying marking on the
outside, CE Marking. In US, Food and Drugs Administration (FDA) is submitting the
certificate (510k). These markings have a very specific graphical look and should be placed
by the manufacturer in a legible, visible and indelible way.
• CE Marking
Figure 21. The CE marking design. From [17]
The CE marking is like a mark of product quality and it is a declaration that the
product meets all of the appropriate provisions of the relevant legislation required to
implement specific European Directives. Focusing in pulse oximeters, they should respect
Medical Devices Directive 2007/47/EC [17].
The approved medical devices present the CE Marking and in addition a code of
four digits which is the identification number of the notified body chosen by the
manufacturer for evaluation. This notified body is responsible to check if the device is
Development of a Stand-Alone Pulse Oximeter THEORETICAL AND TECHNICAL BACKGROUND
- 29 -
according with the requirements and carries out the procedures for conformity
assessment. Finally, in case of assent, the notified body issuing the CE certificate of
conformity which would allow the manufacturer to affix the CE marking on its medical
devices [17], [18].
The entity which regulates the certification of medical devices in Portugal is
INFARMED - Portuguese regulatory authority that evaluates, authorizes, regulates and
controls medical devices, according the procedures in Directive 2007/47/EC [18].
In order to initiate the medical device certification process, the manufacturer
should compile a file with the necessary documentation: an application, a statement of
commitment that the manufacturer did not request the evaluation to another notified
body and all the necessary scientific technical documentation in accordance with the
procedure chosen from those provided by Directive 93/42/EEC (the device specifications,
technical tests to the device, the construction techniques employed and a technical
description) [14]. The documentation to fill and the information about the organization of
the dossier is possible to find in the Infarmed web page [18].
• FDA(510k)
FDA(510k) is a certificate that allows the marketing of products and medical
equipment in the US. The agency responsible for this issue is the Food and Drug
Administration (FDA, US), which is dependent on the Government’s health area.
Generally, manufacturers/importers of some Class 1 and Class 3, and most Class 2 medical
devices, are required to file a 510k. So it is important to determine the classification of the
new device using the database online at FDA site. To FDA an oximeter is a Class 2 medical
device and belongs to the cardiovascular monitoring devices [19].
A 510(k) requires demonstration of substantial equivalence to another legally US
marketed device which means that the new device is at least as safe and effective as the
predicate. A device is substantially equivalent if, in comparison to a predicate it has the
same intended use and has the same technological characteristics as the predicate or has
different technological characteristics and the information submitted to FDA
demonstrates that the device is at least as safe and effective as the legally marketed
device [19], [20].

Development of a Stand-Alone Pulse Oximeter THEORETICAL AND TECHNICAL BACKGROUND
- 30 -
In order to regulate the medical device it’s necessary to be subject to a number of
steps. First it is necessary to compile the information needed and prepare the submission,
thought the organization of a file which includes a list of specific information that will be
required in the application, such as an executive summary, an intended use and a
technical description of the device [20].
FDA does not have a template for 510(k) submission, so the company needs to
figure out how to meet their requirements in submitting all of this information, which is
proving not always easily accomplished.
Once the company has submitted the file, the FDA reviews the 510(k) application,
which can last up to 90 days. During this period they may ask for additional information at
which time the "clock" is stopped and then resumed upon the FDA's receipt of the answer
to their questions. If approved, the FDA will send a letter, with an assigned 510(k) number,
that says they "have determined that your device is substantially equivalent to legally
marketed predicate devices...and you may therefore market the device subject to general
controls provisions of the (Food, Drug and Cosmetics) Act" [20]. This letter means that the
device is much the same as the predicates already approved by the FDA. The letter will be
available on the FDA database as proof to the future customers that the device is
approved for sale in the US. This order "clears" the device for commercial distribution.
Finally, once the company has received the FDA 510(k) "clearance" letter it is
necessary to complete the FDA device listing and establishment registration using a
system in the FDA website and then the company and the device are registered with the
FDA. There are also certain fees that must be paid [20].
As said previously, the FDA does not provide a 510(k) template to follow and that is
why many people find them very difficult to complete properly. This is also why it is very
difficult to reach to a fixed price of how much costs to prepare and submit your 510(k)
application to the US Food and Drug Administration.
In the Attachment B, it is possible to find information of a consulting group called
EMERGO, that mediate the process and, because they have completed many applications,
they are able to offer a fixed price to prepare and submit a 510(k) application to the US
Food and Drug Administration.
Development of a Stand-Alone Pulse Oximeter ARCHITECTURE OF THE SYSTEM
- 31 -
3. ARCHITECTURE OF THE SYSTEM
3.1. Project Requirements
In the logic of the work and under the guidelines of the project suggested by ISA
and GEI, the students intend to develop a finger transmission oximeter probe. This probe
should be simple, reliable, robust, economic and ensure the correct switching between
red and infrared channels through a simple analog control signal (square wave), and
ensure also the correct detection of the transmitted light spectra for both producing a
consistent signal amplified. The sampling frequency (repetition rate at which the red and
infrared LEDs drivers) should be well above the maximum frequency present in the
arterial pulse (around few Hz). Keeping in mind the future portability of the device, the
circuits should be powered at 5V because the commercial batteries are around this
voltage.
The oximeter probe should interface with a pulse oximeter portable unit, which
includes an acquisition and processing module. The acquisition module must have an
acquisition rate that is at least twice the sampling frequency, according to the sampling
theorem so that the events could be detected. The processing module must have a
processing and memory capacity that allows the implementation of algorithms for
determining the heart rate and oxygen saturation in the blood. This module should also
have accessories processes which provide some noise reduction, avoid erroneous
readings. The processing module must return results in a discrete way. As the oximeter
probe, this modules should be powered at 5V due to the portability and ensure the least
possible power consumption.
Development of a Stand-Alone Pulse Oximeter ARCHITECTURE OF THE SYSTEM
- 32 -
3.2. Work Evolution
On the beginning of the project and after the study of the Theoretical and Technical
Background, the students developed an oximeter probe in order to start reading signals
since the main objective of the project was the development of a portable pulse oximeter
unit. That oximeter probe was assembled based on the circuit presented in the
Attachment C.
The circuit includes SMD components: an infrared LED, a red LED, two polarization
resistors, a decoupling capacitor, a photodiode, a transimpedance amplifier, a feedback
resistor, a feedback capacitor and two other resistors in the voltage divider. It is also used
a Darlington driver which has the function of control the current that passes to the LEDs.
So, in unusual cases, where the circuit sinks too much current which can damage its
components, the Darlington driver protects the circuit.
The project team did some research that allows choosing the most appropriate
values for resistors and capacitors, taking into account the bandwidth required and ensure
the smooth functioning of the probe.
It was chosen LEDs that operate in the range specified in the absorption curve of
the Figure 4. It was used red LEDs of 635nm and infrared LEDs of 950nm. The LEDs have an
internal system of lenses that provide high-brightness output, to get better results.
Several tests were done to choose the values of polarization resistors so that the
light from the LEDs which passes through the finger is enough to be detected by the
photodiode. Thus, these resistors have a value of 100Ω.
The decoupling capacitor is just to prevent an eventual coupling between
components via the power supply connections, so its choice is not really important and it
was chosen the value of 10nF as an acceptable value.
The detection of the light transmitted through the finger was done using a
photodiode with a transimpedance amplifier configuration. Although it is the most
frequently configuration used in pulse oximetry applications, the transimpedance
configuration has a number of multidimensional constraints so important considerations
must be taken into account on the choice of the components. These considerations are
essential in the choice of the values of feedback resistor and feedback capacitor and a

Development of a Stand-Alone Pulse Oximeter ARCHITECTURE OF THE SYSTEM
- 33 -
detailed discussion of it can be found in Section 3.4.1.2. That study led to the choice of the
values of 33KΩ to the feedback resistor and 10nF to the feedback capacitor.
The resistors of the voltage divider have the value of 1KΩ in order to ensure that
the voltage in V+ is 2,5V and the signal is around this value.
The circuits were assembled in a black box in order to build a prototype of the
oximeter probe, as shown in Figure 22 and Figure 23.
Figure 22. First oximeter probe prototype developed
Figure 23. Oximeter probe prototyte on; a – photodiode; b – red and infrared LEDs (red one
in operation)
Development of a Stand-Alone Pulse Oximeter ARCHITECTURE OF THE SYSTEM
- 34 -
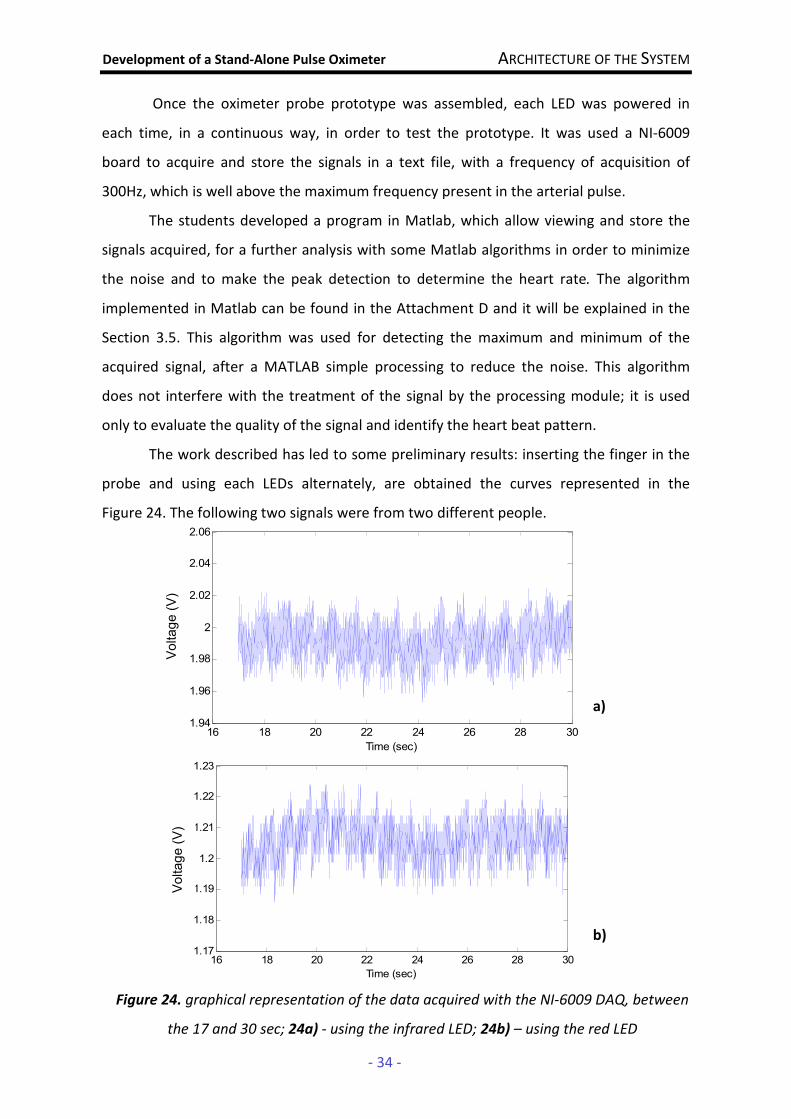
Once the oximeter probe prototype was assembled, each LED was powered in
each time, in a continuous way, in order to test the prototype. It was used a NI-6009
board to acquire and store the signals in a text file, with a frequency of acquisition of
300Hz, which is well above the maximum frequency present in the arterial pulse.
The students developed a program in Matlab, which allow viewing and store the
signals acquired, for a further analysis with some Matlab algorithms in order to minimize
the noise and to make the peak detection to determine the heart rate. The algorithm
implemented in Matlab can be found in the Attachment D and it will be explained in the
Section 3.5. This algorithm was used for detecting the maximum and minimum of the
acquired signal, after a MATLAB simple processing to reduce the noise. This algorithm
does not interfere with the treatment of the signal by the processing module; it is used
only to evaluate the quality of the signal and identify the heart beat pattern.
The work described has led to some preliminary results: inserting the finger in the
probe and using each LEDs alternately, are obtained the curves represented in the
Figure 24. The following two signals were from two different people.
16 18 20 22 24 26 28 301.94
1.96
1.98
2
2.02
2.04
2.06
Time (sec)
Tension (V)
16 18 20 22 24 26 28 301.17
1.18
1.19
1.2
1.21
1.22
1.23
Time (sec)
Tension (V)
Figure 24. graphical representation of the data acquired with the NI-6009 DAQ, between
the 17 and 30 sec; 24a) - using the infrared LED; 24b) – using the red LED
a)
b)
Voltage (V)
Voltage (V)
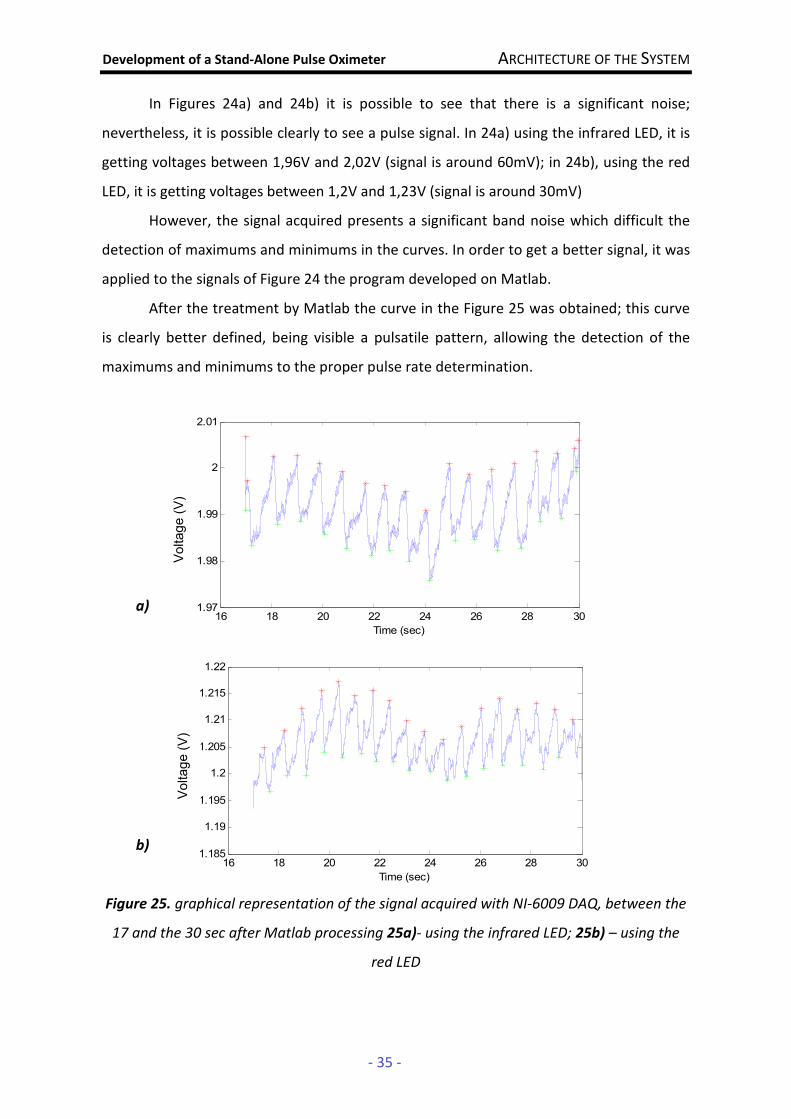
Development of a Stand-Alone Pulse Oximeter ARCHITECTURE OF THE SYSTEM
- 35 -
In Figures 24a) and 24b) it is possible to see that there is a significant noise;
nevertheless, it is possible clearly to see a pulse signal. In 24a) using the infrared LED, it is
getting voltages between 1,96V and 2,02V (signal is around 60mV); in 24b), using the red
LED, it is getting voltages between 1,2V and 1,23V (signal is around 30mV)
However, the signal acquired presents a significant band noise which difficult the
detection of maximums and minimums in the curves. In order to get a better signal, it was
applied to the signals of Figure 24 the program developed on Matlab.
After the treatment by Matlab the curve in the Figure 25 was obtained; this curve
is clearly better defined, being visible a pulsatile pattern, allowing the detection of the
maximums and minimums to the proper pulse rate determination.
a)
b)
Figure 25. graphical representation of the signal acquired with NI-6009 DAQ, between the
17 and the 30 sec after Matlab processing 25a)- using the infrared LED; 25b) – using the
red LED
16 18 20 22 24 26 28 301.185
1.19
1.195
1.2
1.205
1.21
1.215
1.22
Time (sec)
Tension (V)
16 18 20 22 24 26 28 301.97
1.98
1.99
2
2.01
Time (sec)
Tension (V)
Voltage (V)
Voltage (V)

Development of a Stand-Alone Pulse Oximeter ARCHITECTURE OF THE SYSTEM
- 36 -
In Figure 25 a) and b), it is possible to see a pulsatile signal with less noise than the
previous where is possible to detect the maximums at red and the minimums at green,
through the algorithm of peak detection implemented in Matlab; this detection allows the
heart beats counting and consequently the heart rate. In the signal of Figure 25 a) the
heart rate returned by the program is 72 BPM while the signal of Figure 25 b) the heart
rate determined is 84 BPM.
However, several tests were done and the results became clear that the probe
architecture was not the most convenient due the absence of consistent results and data
repeatability. So it was necessary to test different solutions, the SMD platform in use was
not suitable to perform different components and circuits so it was decided to implement
the new probe development on a breadboard. The new work orientation coincided with
the ISA wakeup to the useful interconnection of our project with their, this reinforced
collaboration allowed the project team to use ISA platforms, and at the moment the stand
alone device was bypassed.
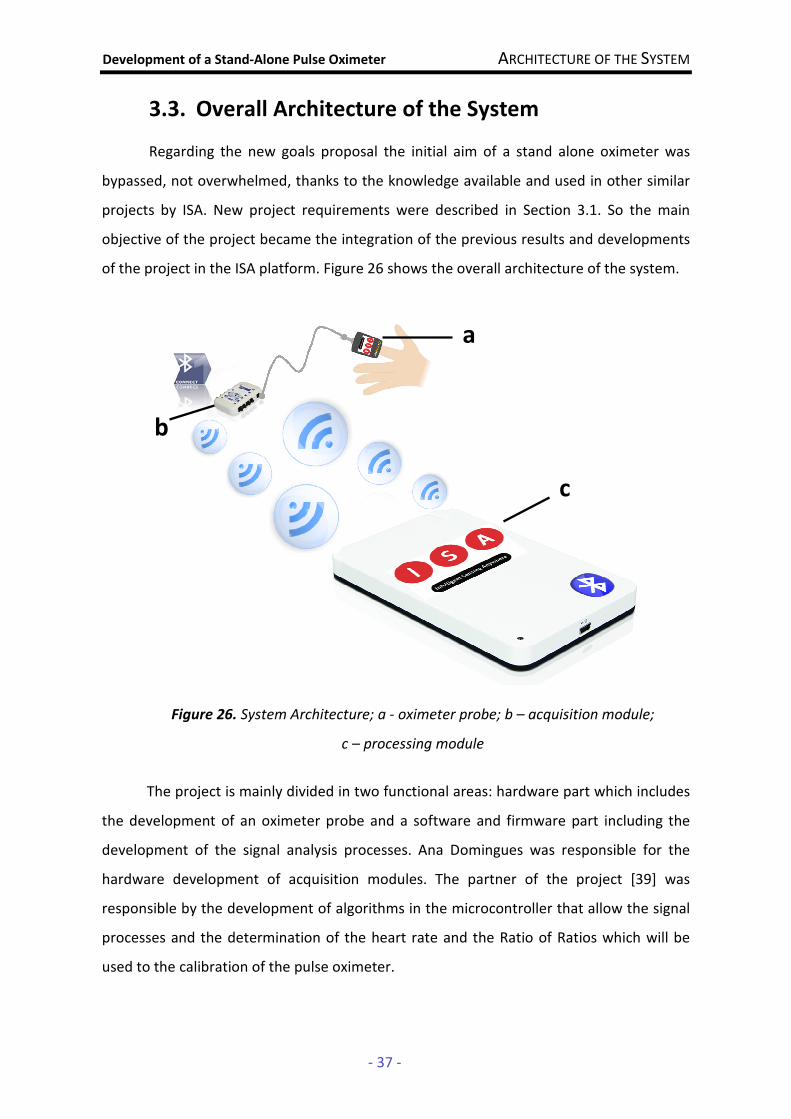
Development of a Stand-Alone Pulse Oximeter ARCHITECTURE OF THE SYSTEM
- 37 -
3.3. Overall Architecture of the System
Regarding the new goals proposal the initial aim of a stand alone oximeter was
bypassed, not overwhelmed, thanks to the knowledge available and used in other similar
projects by ISA. New project requirements were described in Section 3.1. So the main
objective of the project became the integration of the previous results and developments
of the project in the ISA platform. Figure 26 shows the overall architecture of the system.
Figure 26. System Architecture; a - oximeter probe; b – acquisition module;
c – processing module
The project is mainly divided in two functional areas: hardware part which includes
the development of an oximeter probe and a software and firmware part including the
development of the signal analysis processes. Ana Domingues was responsible for the
hardware development of acquisition modules. The partner of the project [39] was
responsible by the development of algorithms in the microcontroller that allow the signal
processes and the determination of the heart rate and the Ratio of Ratios which will be
used to the calibration of the pulse oximeter.
a
b
c
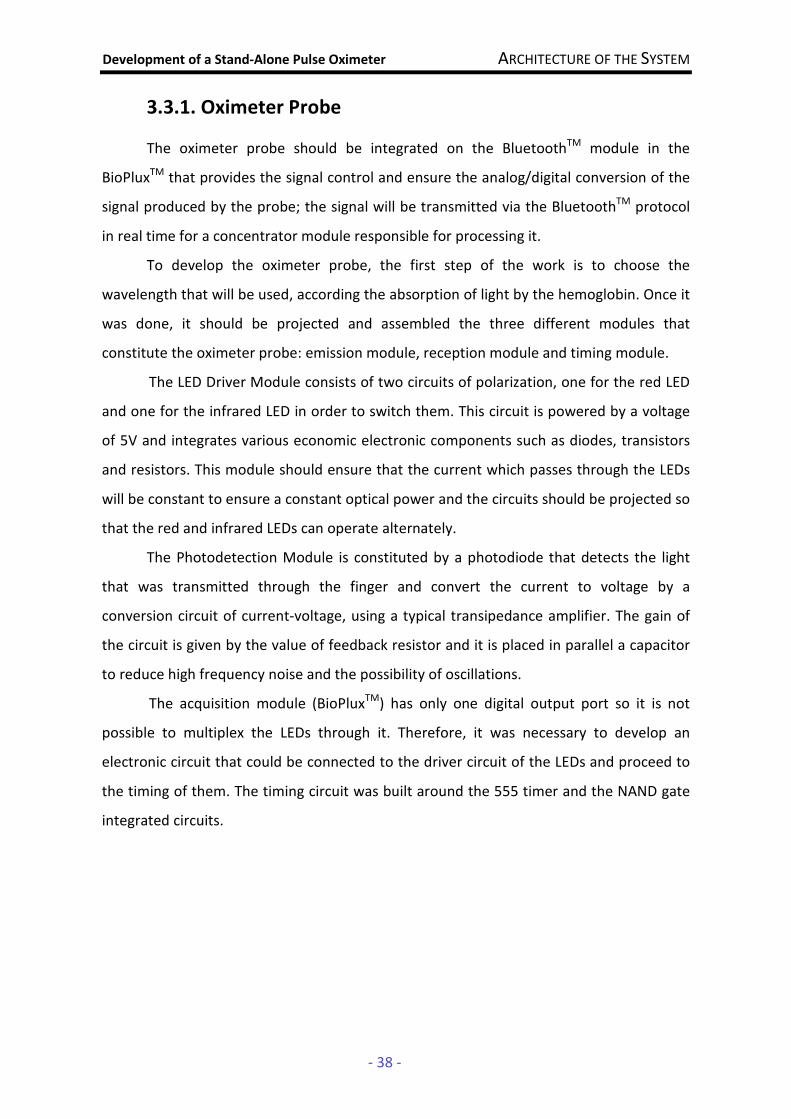
Development of a Stand-Alone Pulse Oximeter ARCHITECTURE OF THE SYSTEM
- 38 -
3.3.1. Oximeter Probe
The oximeter probe should be integrated on the BluetoothTM module in the
BioPluxTM that provides the signal control and ensure the analog/digital conversion of the
signal produced by the probe; the signal will be transmitted via the BluetoothTM protocol
in real time for a concentrator module responsible for processing it.
To develop the oximeter probe, the first step of the work is to choose the
wavelength that will be used, according the absorption of light by the hemoglobin. Once it
was done, it should be projected and assembled the three different modules that
constitute the oximeter probe: emission module, reception module and timing module.
The LED Driver Module consists of two circuits of polarization, one for the red LED
and one for the infrared LED in order to switch them. This circuit is powered by a voltage
of 5V and integrates various economic electronic components such as diodes, transistors
and resistors. This module should ensure that the current which passes through the LEDs
will be constant to ensure a constant optical power and the circuits should be projected so
that the red and infrared LEDs can operate alternately.
The Photodetection Module is constituted by a photodiode that detects the light
that was transmitted through the finger and convert the current to voltage by a
conversion circuit of current-voltage, using a typical transipedance amplifier. The gain of
the circuit is given by the value of feedback resistor and it is placed in parallel a capacitor
to reduce high frequency noise and the possibility of oscillations.
The acquisition module (BioPluxTM) has only one digital output port so it is not
possible to multiplex the LEDs through it. Therefore, it was necessary to develop an
electronic circuit that could be connected to the driver circuit of the LEDs and proceed to
the timing of them. The timing circuit was built around the 555 timer and the NAND gate
integrated circuits.
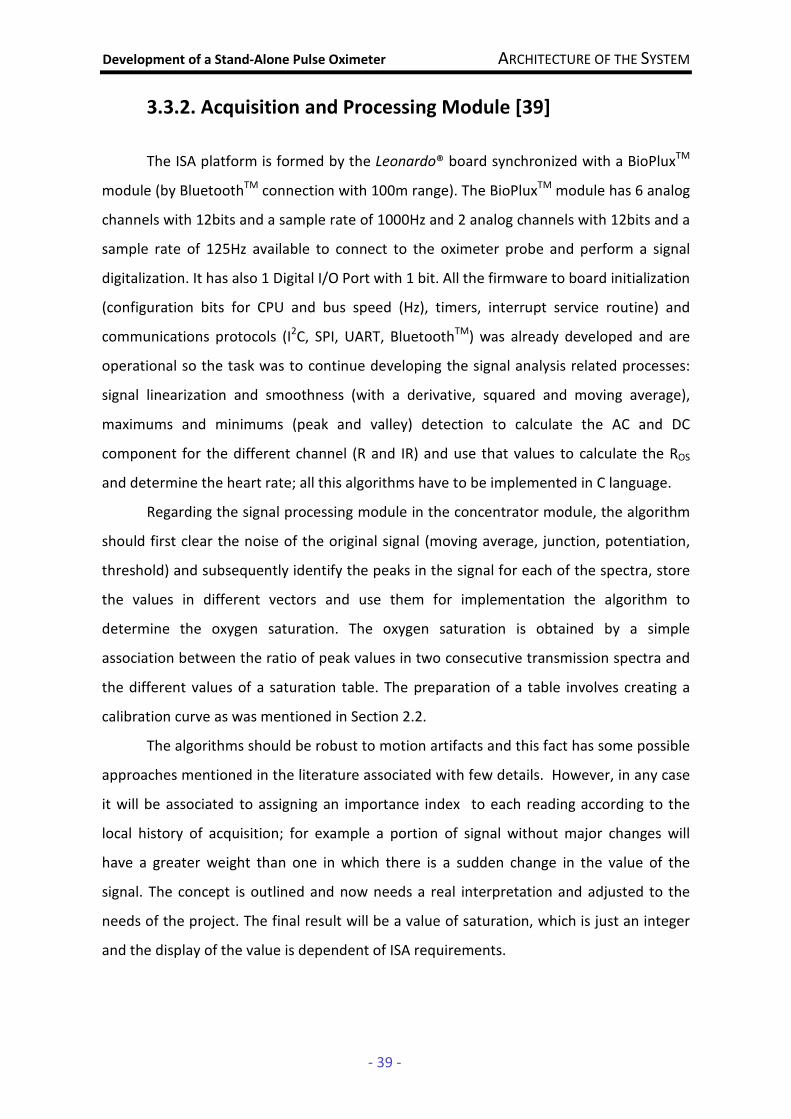
Development of a Stand-Alone Pulse Oximeter ARCHITECTURE OF THE SYSTEM
- 39 -
3.3.2. Acquisition and Processing Module [39]
The ISA platform is formed by the Leonardo® board synchronized with a BioPluxTM
module (by BluetoothTM connection with 100m range). The BioPluxTM module has 6 analog
channels with 12bits and a sample rate of 1000Hz and 2 analog channels with 12bits and a
sample rate of 125Hz available to connect to the oximeter probe and perform a signal
digitalization. It has also 1 Digital I/O Port with 1 bit. All the firmware to board initialization
(configuration bits for CPU and bus speed (Hz), timers, interrupt service routine) and
communications protocols (I2C, SPI, UART, BluetoothTM) was already developed and are
operational so the task was to continue developing the signal analysis related processes:
signal linearization and smoothness (with a derivative, squared and moving average),
maximums and minimums (peak and valley) detection to calculate the AC and DC
component for the different channel (R and IR) and use that values to calculate the ROS
and determine the heart rate; all this algorithms have to be implemented in C language.
Regarding the signal processing module in the concentrator module, the algorithm
should first clear the noise of the original signal (moving average, junction, potentiation,
threshold) and subsequently identify the peaks in the signal for each of the spectra, store
the values in different vectors and use them for implementation the algorithm to
determine the oxygen saturation. The oxygen saturation is obtained by a simple
association between the ratio of peak values in two consecutive transmission spectra and
the different values of a saturation table. The preparation of a table involves creating a
calibration curve as was mentioned in Section 2.2.
The algorithms should be robust to motion artifacts and this fact has some possible
approaches mentioned in the literature associated with few details. However, in any case
it will be associated to assigning an importance index to each reading according to the
local history of acquisition; for example a portion of signal without major changes will
have a greater weight than one in which there is a sudden change in the value of the
signal. The concept is outlined and now needs a real interpretation and adjusted to the
needs of the project. The final result will be a value of saturation, which is just an integer
and the display of the value is dependent of ISA requirements.
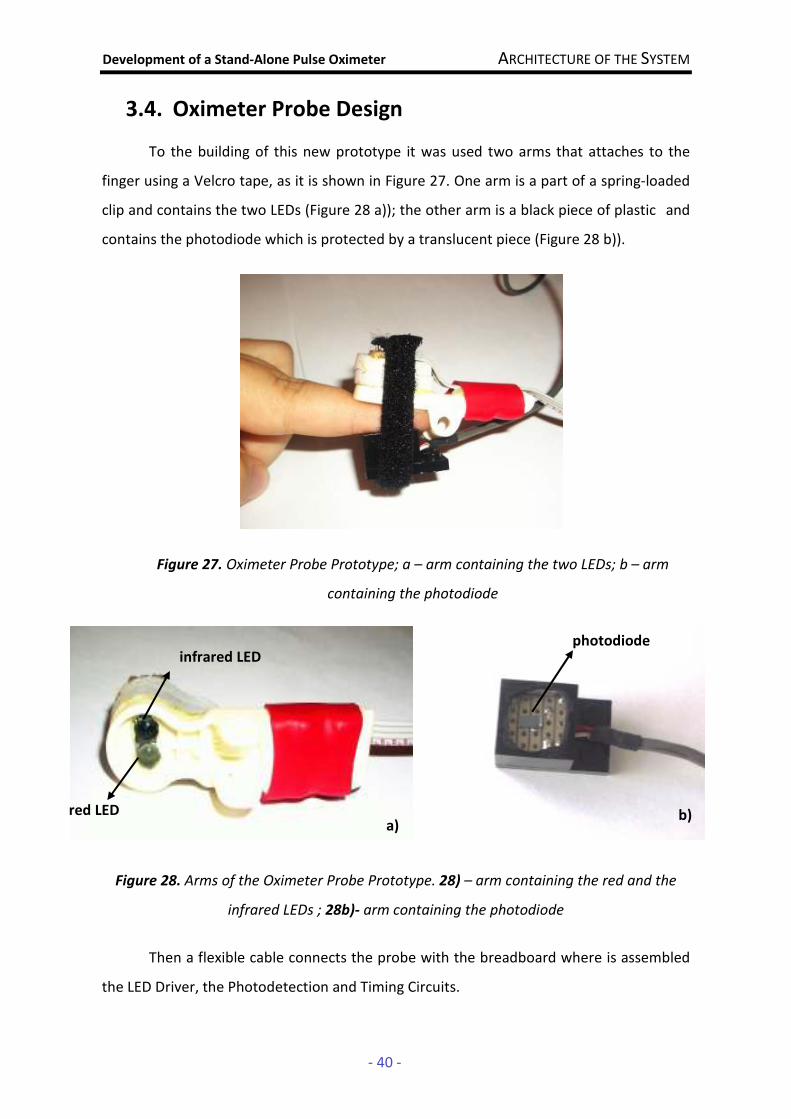
Development of a Stand-Alone Pulse Oximeter ARCHITECTURE OF THE SYSTEM
- 40 -
3.4. Oximeter Probe Design
To the building of this new prototype it was used two arms that attaches to the
finger using a Velcro tape, as it is shown in Figure 27. One arm is a part of a spring-loaded
clip and contains the two LEDs (Figure 28 a)); the other arm is a black piece of plastic and
contains the photodiode which is protected by a translucent piece (Figure 28 b)).
Figure 27. Oximeter Probe Prototype; a – arm containing the two LEDs; b – arm
containing the photodiode
Figure 28. Arms of the Oximeter Probe Prototype. 28) – arm containing the red and the
infrared LEDs ; 28b)- arm containing the photodiode
Then a flexible cable connects the probe with the breadboard where is assembled
the LED Driver, the Photodetection and Timing Circuits.
a
b
b) a)
photodiode infrared LED
red LED
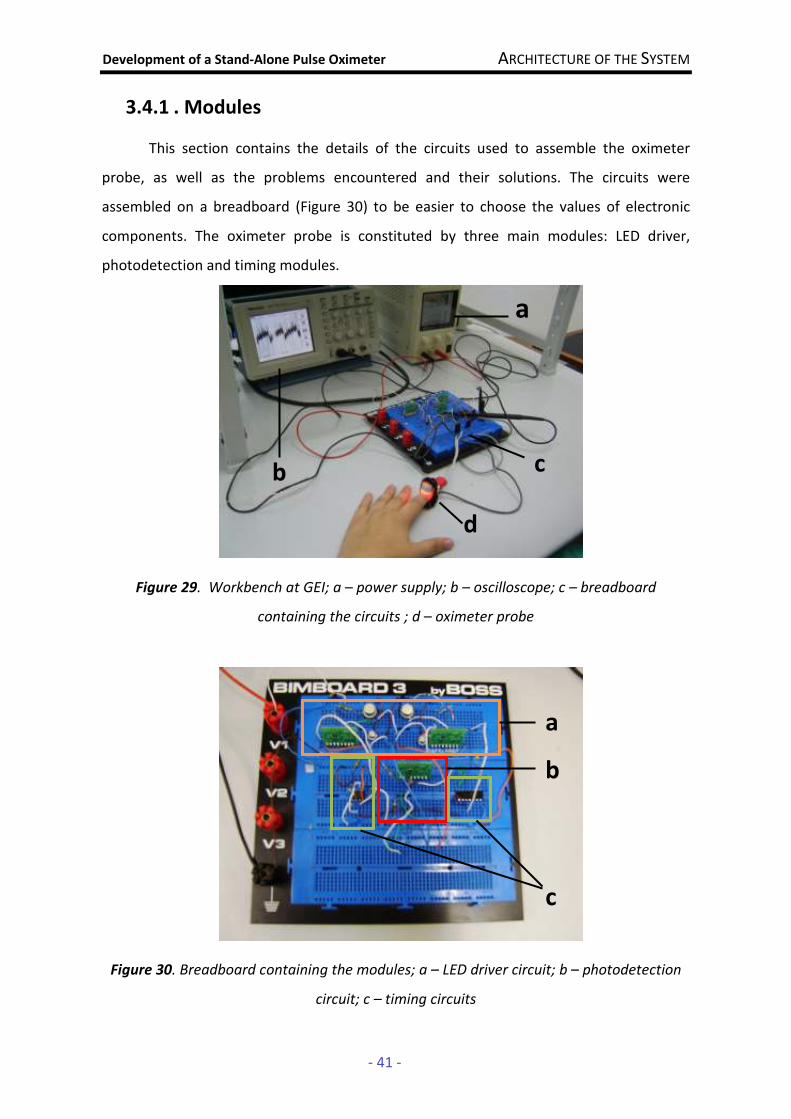
Development of a Stand-Alone Pulse Oximeter ARCHITECTURE OF THE SYSTEM
- 41 -
3.4.1 . Modules
This section contains the details of the circuits used to assemble the oximeter
probe, as well as the problems encountered and their solutions. The circuits were
assembled on a breadboard (Figure 30) to be easier to choose the values of electronic
components. The oximeter probe is constituted by three main modules: LED driver,
photodetection and timing modules.
Figure 29. Workbench at GEI; a – power supply; b – oscilloscope; c – breadboard
containing the circuits ; d – oximeter probe
Figure 30. Breadboard containing the modules; a – LED driver circuit; b – photodetection
circuit; c – timing circuits
a
b c
d
a
b
c
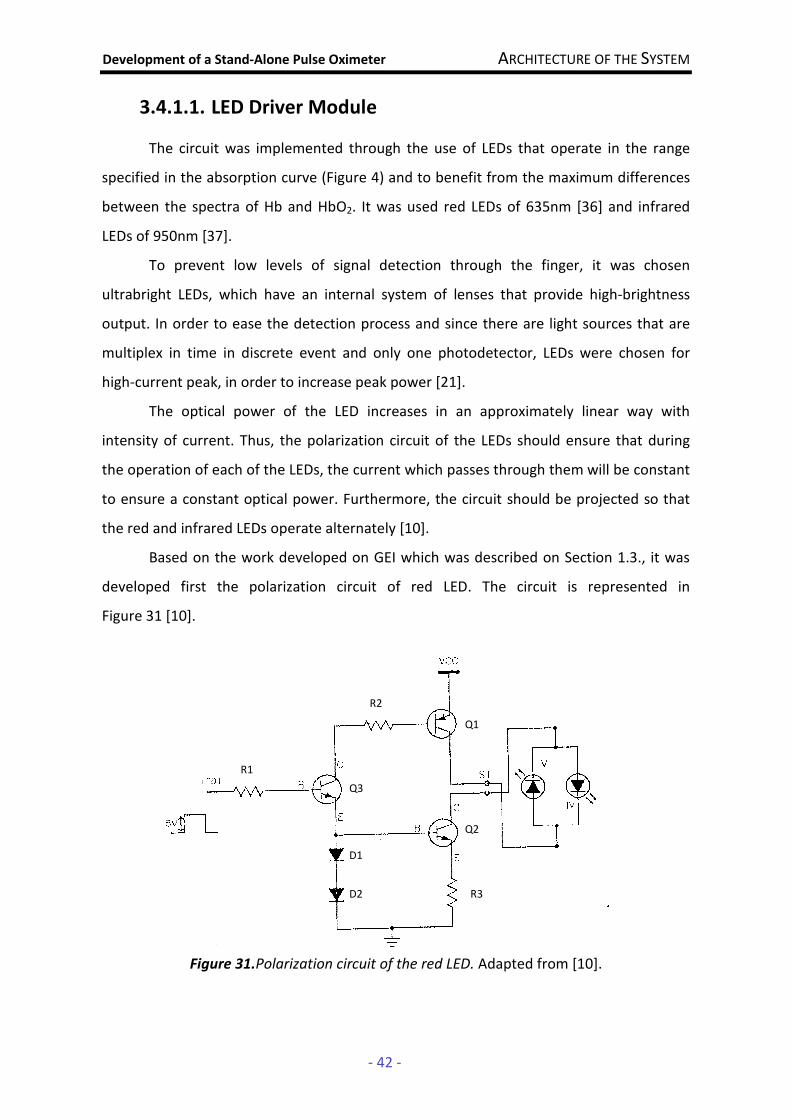
Development of a Stand-Alone Pulse Oximeter ARCHITECTURE OF THE SYSTEM
- 42 -
3.4.1.1. LED Driver Module
The circuit was implemented through the use of LEDs that operate in the range
specified in the absorption curve (Figure 4) and to benefit from the maximum differences
between the spectra of Hb and HbO2. It was used red LEDs of 635nm [36] and infrared
LEDs of 950nm [37].
To prevent low levels of signal detection through the finger, it was chosen
ultrabright LEDs, which have an internal system of lenses that provide high-brightness
output. In order to ease the detection process and since there are light sources that are
multiplex in time in discrete event and only one photodetector, LEDs were chosen for
high-current peak, in order to increase peak power [21].
The optical power of the LED increases in an approximately linear way with
intensity of current. Thus, the polarization circuit of the LEDs should ensure that during
the operation of each of the LEDs, the current which passes through them will be constant
to ensure a constant optical power. Furthermore, the circuit should be projected so that
the red and infrared LEDs operate alternately [10].
Based on the work developed on GEI which was described on Section 1.3., it was
developed first the polarization circuit of red LED. The circuit is represented in
Figure 31 [10].
Figure 31.Polarization circuit of the red LED. Adapted from [10].
D1
D2
Q3
Q1
Q2
R1
R2
R3
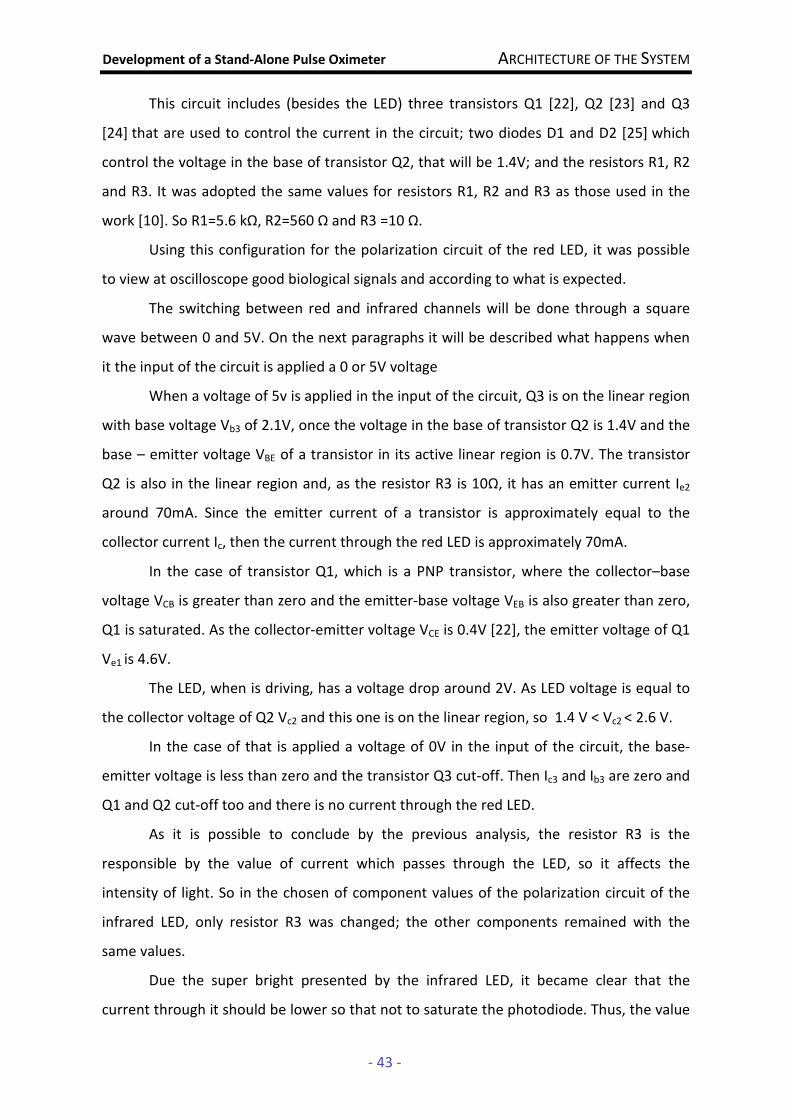
Development of a Stand-Alone Pulse Oximeter ARCHITECTURE OF THE SYSTEM
- 43 -
This circuit includes (besides the LED) three transistors Q1 [22], Q2 [23] and Q3
[24] that are used to control the current in the circuit; two diodes D1 and D2 [25] which
control the voltage in the base of transistor Q2, that will be 1.4V; and the resistors R1, R2
and R3. It was adopted the same values for resistors R1, R2 and R3 as those used in the
work [10]. So R1=5.6 kΩ, R2=560 Ω and R3 =10 Ω.
Using this configuration for the polarization circuit of the red LED, it was possible
to view at oscilloscope good biological signals and according to what is expected.
The switching between red and infrared channels will be done through a square
wave between 0 and 5V. On the next paragraphs it will be described what happens when
it the input of the circuit is applied a 0 or 5V voltage
When a voltage of 5v is applied in the input of the circuit, Q3 is on the linear region
with base voltage Vb3 of 2.1V, once the voltage in the base of transistor Q2 is 1.4V and the
base – emitter voltage VBE of a transistor in its active linear region is 0.7V. The transistor
Q2 is also in the linear region and, as the resistor R3 is 10Ω, it has an emitter current Ie2
around 70mA. Since the emitter current of a transistor is approximately equal to the
collector current Ic, then the current through the red LED is approximately 70mA.
In the case of transistor Q1, which is a PNP transistor, where the collector–base
voltage VCB is greater than zero and the emitter-base voltage VEB is also greater than zero,
Q1 is saturated. As the collector-emitter voltage VCE is 0.4V [22], the emitter voltage of Q1
Ve1 is 4.6V.
The LED, when is driving, has a voltage drop around 2V. As LED voltage is equal to
the collector voltage of Q2 Vc2 and this one is on the linear region, so 1.4 V < Vc2 < 2.6 V.
In the case of that is applied a voltage of 0V in the input of the circuit, the base-
emitter voltage is less than zero and the transistor Q3 cut-off. Then Ic3 and Ib3 are zero and
Q1 and Q2 cut-off too and there is no current through the red LED.
As it is possible to conclude by the previous analysis, the resistor R3 is the
responsible by the value of current which passes through the LED, so it affects the
intensity of light. So in the chosen of component values of the polarization circuit of the
infrared LED, only resistor R3 was changed; the other components remained with the
same values.
Due the super bright presented by the infrared LED, it became clear that the
current through it should be lower so that not to saturate the photodiode. Thus, the value
Development of a Stand-Alone Pulse Oximeter ARCHITECTURE OF THE SYSTEM
- 44 -
of the resistor has been gradually increased until it is possible to see good signals at the
oscilloscope. It occurs for a resistance of 50 Ω.
Repeating the analysis done to the red LED, when in the input of the infrared LED
polarization circuit is applied a voltage of 5V, as the voltage in the base of transistor Q2
still is 1.4V, the current through the infrared LED is approximately 14mA. When the input
of the circuit is applied a voltage of 0V, the situation is the same of red LED circuit and
there is no current through the LED.
Both circuits described above which constitute the LED Driver Module were tested
on the tool Multisim and are represented on the Attachment E. With this circuit it will be
possible to switch the LEDs, through a timing module developed on the Section 3.4.1.3:
when in the input of the polarization circuit of the red LED is applied a voltage of 5V, the
red LED is on; when the voltage passes from 5 to 0V, the LED turn off and in the input of
the polarization circuit of the infrared LED the voltage passes from 0 to 5V and the
infrared LED is on.
By the analysis of the circuit on the Attachment F and through experimental
measurements, it is possible to conclude that:
• the current which passes through red LED is around 70mA (when the LED is
on)
• the current which passes through infrared LED is around 14mA (when the LED
is on)
• at the moment that the polarization circuit of each LED stops driving the
respective LED, there is no current passing to the other one
Development of a Stand-Alone Pulse Oximeter ARCHITECTURE OF THE SYSTEM
- 45 -
3.4.1.2. Photodetection Module
The main components of the photodetection module are the photodiode and the
op-amp used as current-voltage converter. According to the literature and using part of
the circuit of the Attachment C (that was used on the development of the first oximeter
probe of the project), Figure 32 represents the transimpedance amplifier configuration
with a photodiode of the photodetection module:
Figure 32. Transipedance amplifier configuration with a photodiode
The configuration of Figure 32 has a difference from the presented on the Figure
10 because the input 1 is not connected to the ground. The resistors R1 and R2 have the
same value to ensure that the voltage in V+ is 2,5V and the signal is around this value. If
the input was grounded, it would be possible to see only the positive part of the signal
detected since the op-amp is powered to 0-5V. Thus, it is "up" the level of reference from
0V (ground) to 2.5V and so the signal is seen around this value. So R1 and R2 have the
same value which is 10KΩ.
The photodiode used should have satisfactory answers to both wavelength (red
and infrared), since it will use only one photodiode for both wavelengths, so it should has
a sensitivity spectral range that includes the wavelengths used [21].
RF
CF
R1
R2
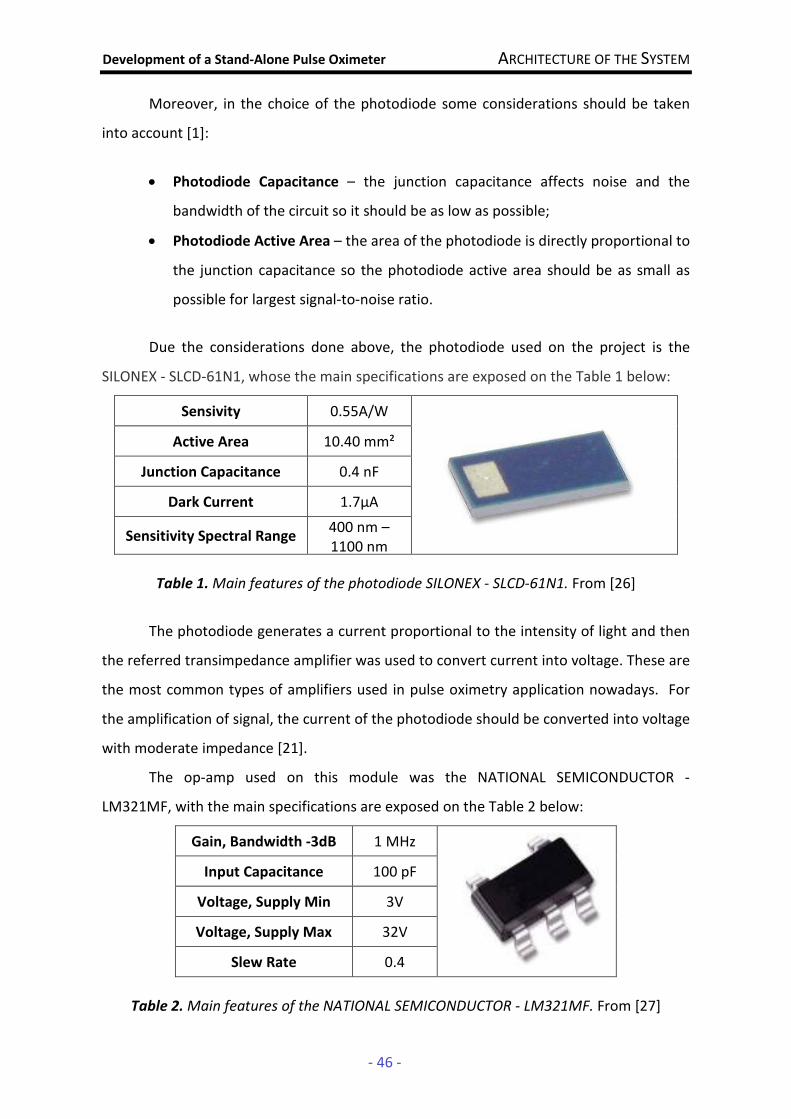
Development of a Stand-Alone Pulse Oximeter ARCHITECTURE OF THE SYSTEM
- 46 -
Moreover, in the choice of the photodiode some considerations should be taken
into account [1]:
• Photodiode Capacitance – the junction capacitance affects noise and the
bandwidth of the circuit so it should be as low as possible;
• Photodiode Active Area – the area of the photodiode is directly proportional to
the junction capacitance so the photodiode active area should be as small as
possible for largest signal-to-noise ratio.
Due the considerations done above, the photodiode used on the project is the
SILONEX - SLCD-61N1, whose the main specifications are exposed on the Table 1 below:
Sensivity 0.55A/W
Active Area 10.40 mm²
Junction Capacitance 0.4 nF
Dark Current 1.7µA
Sensitivity Spectral Range 400 nm – 1100 nm
Table 1. Main features of the photodiode SILONEX - SLCD-61N1. From [26]
The photodiode generates a current proportional to the intensity of light and then
the referred transimpedance amplifier was used to convert current into voltage. These are
the most common types of amplifiers used in pulse oximetry application nowadays. For
the amplification of signal, the current of the photodiode should be converted into voltage
with moderate impedance [21].
The op-amp used on this module was the NATIONAL SEMICONDUCTOR -
LM321MF, with the main specifications are exposed on the Table 2 below:
Gain, Bandwidth -3dB 1 MHz
Input Capacitance 100 pF
Voltage, Supply Min 3V
Voltage, Supply Max 32V
Slew Rate 0.4
Table 2. Main features of the NATIONAL SEMICONDUCTOR - LM321MF. From [27]
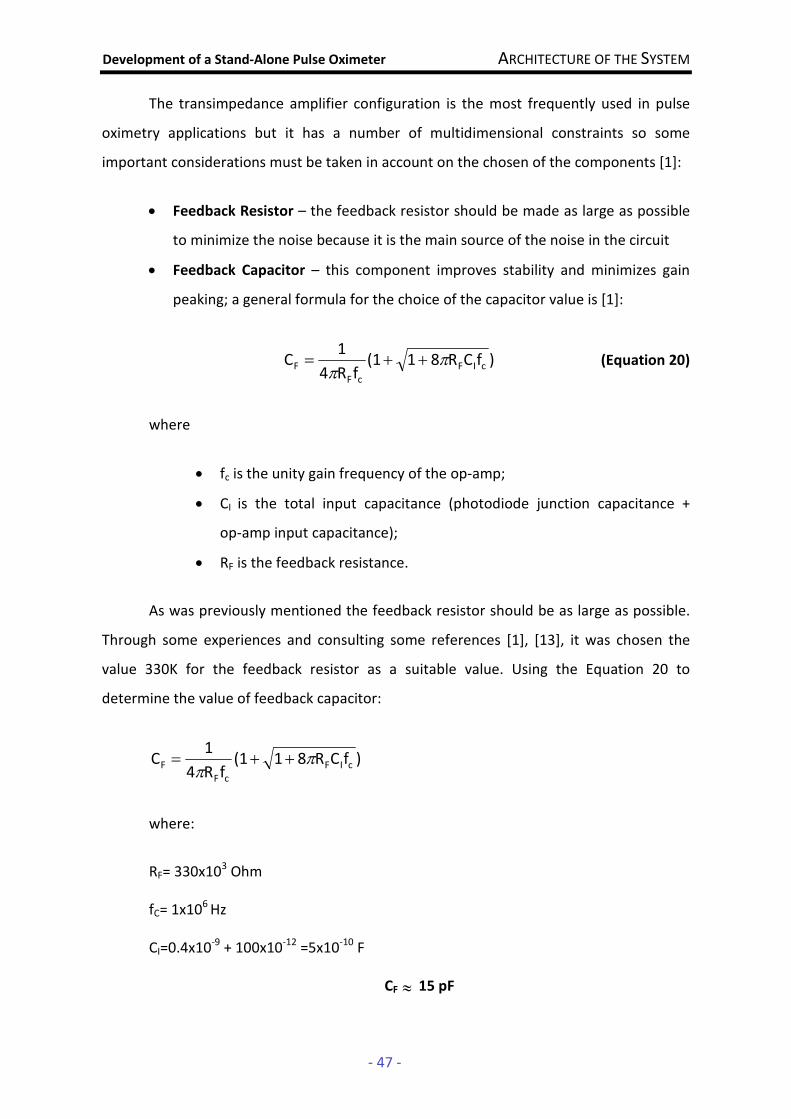
Development of a Stand-Alone Pulse Oximeter ARCHITECTURE OF THE SYSTEM
- 47 -
The transimpedance amplifier configuration is the most frequently used in pulse
oximetry applications but it has a number of multidimensional constraints so some
important considerations must be taken in account on the chosen of the components [1]:
• Feedback Resistor – the feedback resistor should be made as large as possible
to minimize the noise because it is the main source of the noise in the circuit
• Feedback Capacitor – this component improves stability and minimizes gain
peaking; a general formula for the choice of the capacitor value is [1]:
)fCR81(1fR4
1C cIF
cF
F ππ
++= (Equation 20)
where
• fc is the unity gain frequency of the op-amp;
• CI is the total input capacitance (photodiode junction capacitance +
op-amp input capacitance);
• RF is the feedback resistance.
As was previously mentioned the feedback resistor should be as large as possible.
Through some experiences and consulting some references [1], [13], it was chosen the
value 330K for the feedback resistor as a suitable value. Using the Equation 20 to
determine the value of feedback capacitor:
)fCR81(1fR4
1C cIF
cF
F ππ
++=
where:
RF= 330x103 Ohm
fC= 1x10⁶ Hz
CI=0.4x10⁻⁹ + 100x10-12 =5x10⁻¹⁰ F
CF ≈ 15 pF
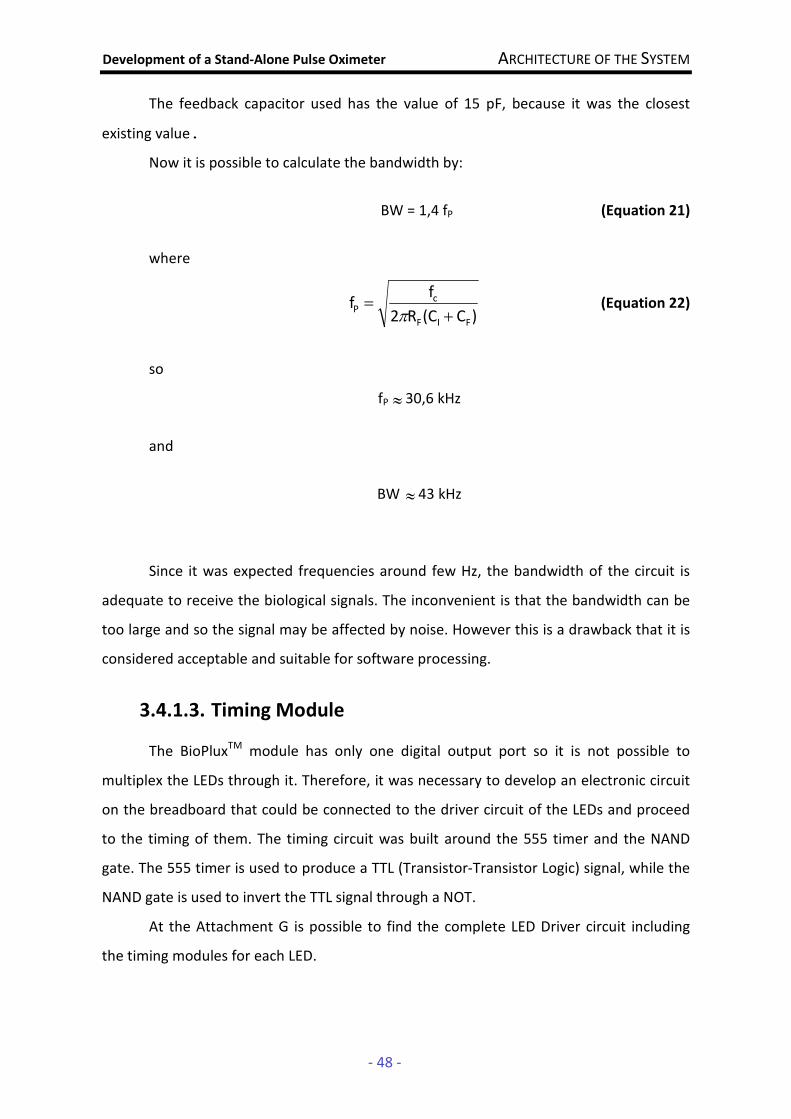
Development of a Stand-Alone Pulse Oximeter ARCHITECTURE OF THE SYSTEM
- 48 -
The feedback capacitor used has the value of 15 pF, because it was the closest
existing value.
Now it is possible to calculate the bandwidth by:
BW = 1,4 fP (Equation 21)
where
)C(CR2
ff
FIF
cP
+=
π (Equation 22)
so
fP ≈ 30,6 kHz
and
BW ≈ 43 kHz
Since it was expected frequencies around few Hz, the bandwidth of the circuit is
adequate to receive the biological signals. The inconvenient is that the bandwidth can be
too large and so the signal may be affected by noise. However this is a drawback that it is
considered acceptable and suitable for software processing.
3.4.1.3. Timing Module
The BioPluxTM module has only one digital output port so it is not possible to
multiplex the LEDs through it. Therefore, it was necessary to develop an electronic circuit
on the breadboard that could be connected to the driver circuit of the LEDs and proceed
to the timing of them. The timing circuit was built around the 555 timer and the NAND
gate. The 555 timer is used to produce a TTL (Transistor-Transistor Logic) signal, while the
NAND gate is used to invert the TTL signal through a NOT.
At the Attachment G is possible to find the complete LED Driver circuit including
the timing modules for each LED.
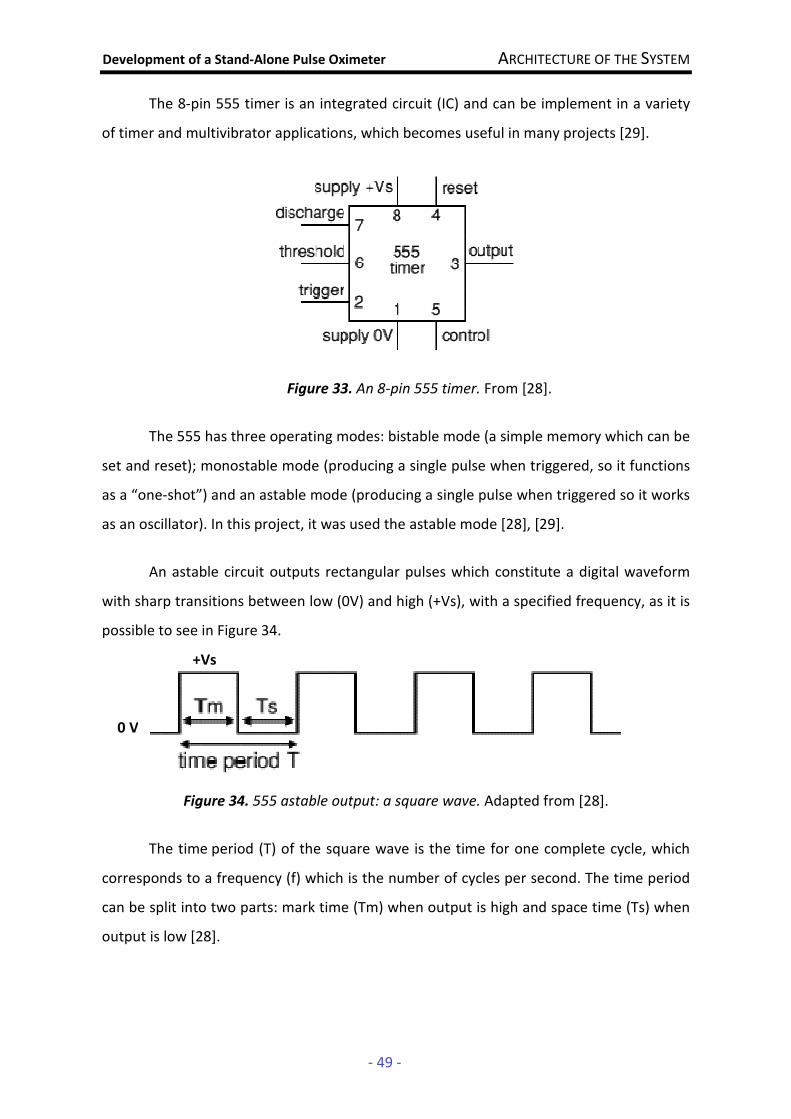
Development of a Stand-Alone Pulse Oximeter ARCHITECTURE OF THE SYSTEM
- 49 -
The 8-pin 555 timer is an integrated circuit (IC) and can be implement in a variety
of timer and multivibrator applications, which becomes useful in many projects [29].
Figure 33. An 8-pin 555 timer. From [28].
The 555 has three operating modes: bistable mode (a simple memory which can be
set and reset); monostable mode (producing a single pulse when triggered, so it functions
as a “one-shot”) and an astable mode (producing a single pulse when triggered so it works
as an oscillator). In this project, it was used the astable mode [28], [29].
An astable circuit outputs rectangular pulses which constitute a digital waveform
with sharp transitions between low (0V) and high (+Vs), with a specified frequency, as it is
possible to see in Figure 34.
Figure 34. 555 astable output: a square wave. Adapted from [28].
The time period (T) of the square wave is the time for one complete cycle, which
corresponds to a frequency (f) which is the number of cycles per second. The time period
can be split into two parts: mark time (Tm) when output is high and space time (Ts) when
output is low [28].
+Vs
0 V

Development of a Stand-Alone Pulse Oximeter ARCHITECTURE OF THE SYSTEM
- 50 -
In Figure 35, it is represented a standard 555 timer circuit.
Figure 35. 555 astable circuit. From [28]
The resistor R1 is connected between Vs and the discharge pin (7) and R2 is
connected between the discharge pin (7) and the trigger and threshold pins (2 and 6
respectively) that share a common node.
In this circuit [28]:
T = 0,7 (R1 + 2R2) C1 (Equation 23)
f = 2R2).C1(R1
1,4
+ (Equation 24)
where:
• T is the time period in seconds (s)
• f is the frequency in Hertz (Hz)
• R1 is the resistance in Ohms (Ω)
• R2 is the resistance in Ohms (Ω)
• C1 is the capacitance in Farads (F)
The 555 astable circuit operation is represented in Figure 36. With the output high,
the capacitor C1 is charged by the current flowing through R1 and R2. The threshold and
trigger inputs monitor the capacitor voltage and when it reaches 2/3 Vs (threshold
voltage) the output becomes low and the discharge pin is connected to 0V. The capacitor
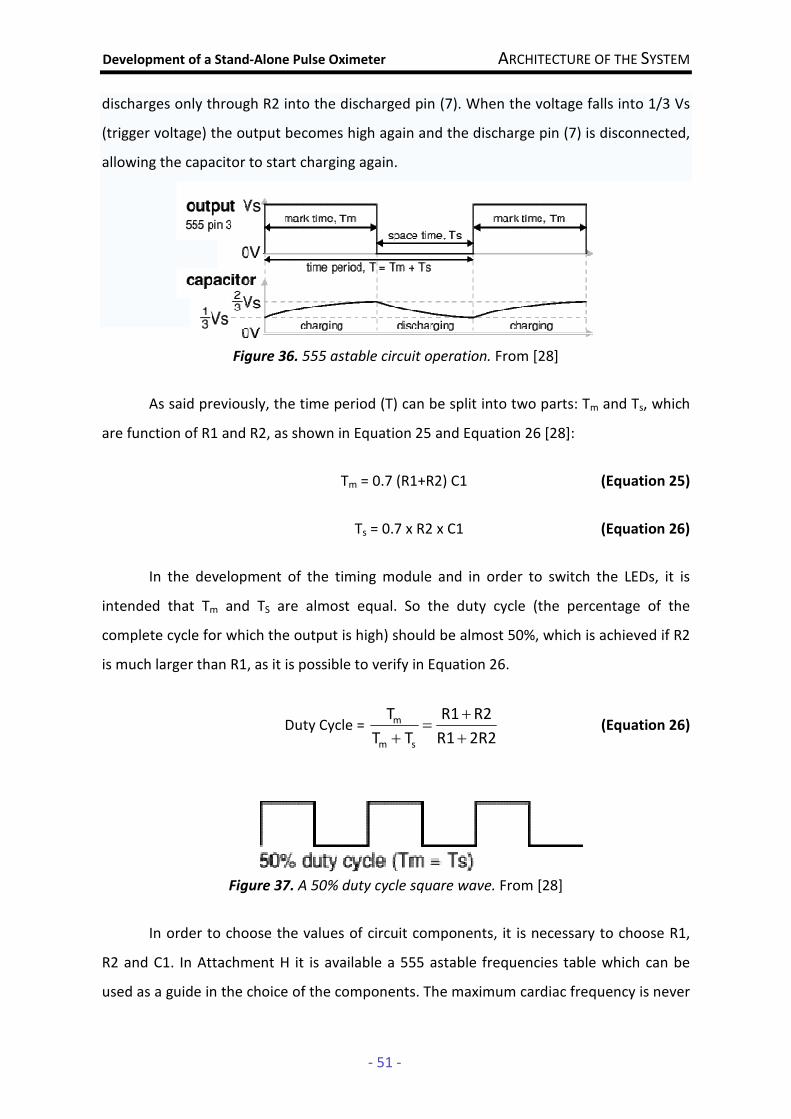
Development of a Stand-Alone Pulse Oximeter ARCHITECTURE OF THE SYSTEM
- 51 -
discharges only through R2 into the discharged pin (7). When the voltage falls into 1/3 Vs
(trigger voltage) the output becomes high again and the discharge pin (7) is disconnected,
allowing the capacitor to start charging again.
Figure 36. 555 astable circuit operation. From [28]
As said previously, the time period (T) can be split into two parts: Tm and Ts, which
are function of R1 and R2, as shown in Equation 25 and Equation 26 [28]:
Tm = 0.7 (R1+R2) C1 (Equation 25)
Ts = 0.7 x R2 x C1 (Equation 26)
In the development of the timing module and in order to switch the LEDs, it is
intended that Tm and TS are almost equal. So the duty cycle (the percentage of the
complete cycle for which the output is high) should be almost 50%, which is achieved if R2
is much larger than R1, as it is possible to verify in Equation 26.
Duty Cycle = 2R2R1
R2R1
TT
T
sm
m
+
+=
+ (Equation 26)
Figure 37. A 50% duty cycle square wave. From [28]
In order to choose the values of circuit components, it is necessary to choose R1,
R2 and C1. In Attachment H it is available a 555 astable frequencies table which can be
used as a guide in the choice of the components. The maximum cardiac frequency is never

Development of a Stand-Alone Pulse Oximeter ARCHITECTURE OF THE SYSTEM
- 52 -
going to be more than a few Hz. The sampling frequency should be well above the
maximum cardiac frequency present in the arterial pulse to get a better defined curve
where can be detected the events and because the curve of the arterial pulse has much
more components (besides the heartbeat) with higher frequencies. So, taken into account
the expected frequencies of the biological signal and after experimental tests, it was
concluded that a frequency around 680Hz is suitable so it was chosen C1=1nF and
R2=1MΩ. Using Equation 24 and admitting that R2 is much larger than R1 (because it is
intended Tm=Ts), the frequency f can be written as:
f=C1 x R2
0.7 (Equation 27)
so,
f = 700 Hz
R1 should be about a tenth of R2 in order to be ignored. So it was chosen the value
of 100 kΩ.
Now, using Equation 26, it could be calculated the exact value of duty cycle:
Duty Cycle = 52,4% ≈ 50%
In the next table, it is presented the specifications apply to the 555 timer used in
the project.
Supply voltage (VCC) 5 to 15 V
Supply current (VCC = +5 V) 4.5 to 16 V
Output current (maximum) 200 mA
Operating Temperature 0 to 70 °C
Power dissipation 600 mW
Table 3. Main features of the NE555-timer. From [30]
The astable circuit was connected with the red LED driver circuit. In order to allow
that the infrared LED flash off when red LED flash on and vice versa, the output of the
astable circuit was connected to a NAND gate.
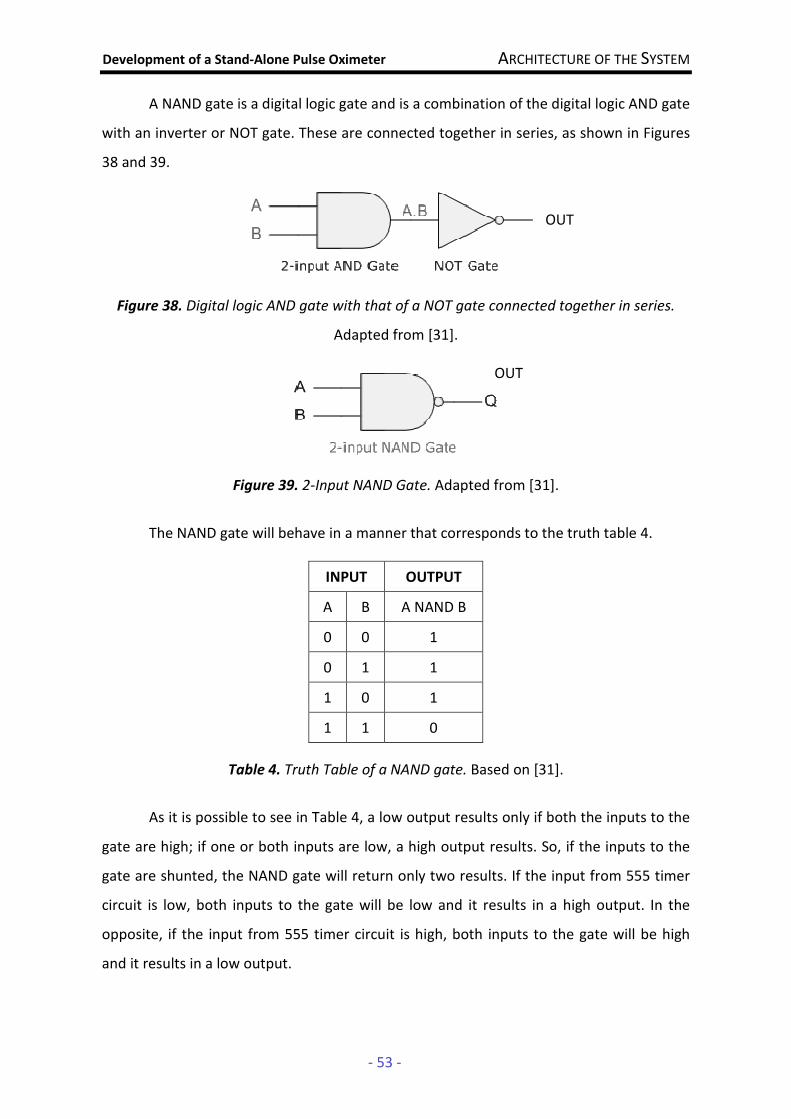
Development of a Stand-Alone Pulse Oximeter ARCHITECTURE OF THE SYSTEM
- 53 -
A NAND gate is a digital logic gate and is a combination of the digital logic AND gate
with an inverter or NOT gate. These are connected together in series, as shown in Figures
38 and 39.
Figure 38. Digital logic AND gate with that of a NOT gate connected together in series.
Adapted from [31].
Figure 39. 2-Input NAND Gate. Adapted from [31].
The NAND gate will behave in a manner that corresponds to the truth table 4.
Table 4. Truth Table of a NAND gate. Based on [31].
As it is possible to see in Table 4, a low output results only if both the inputs to the
gate are high; if one or both inputs are low, a high output results. So, if the inputs to the
gate are shunted, the NAND gate will return only two results. If the input from 555 timer
circuit is low, both inputs to the gate will be low and it results in a high output. In the
opposite, if the input from 555 timer circuit is high, both inputs to the gate will be high
and it results in a low output.
INPUT OUTPUT
A B A NAND B
0 0 1
0 1 1
1 0 1
1 1 0
OUT
OUT
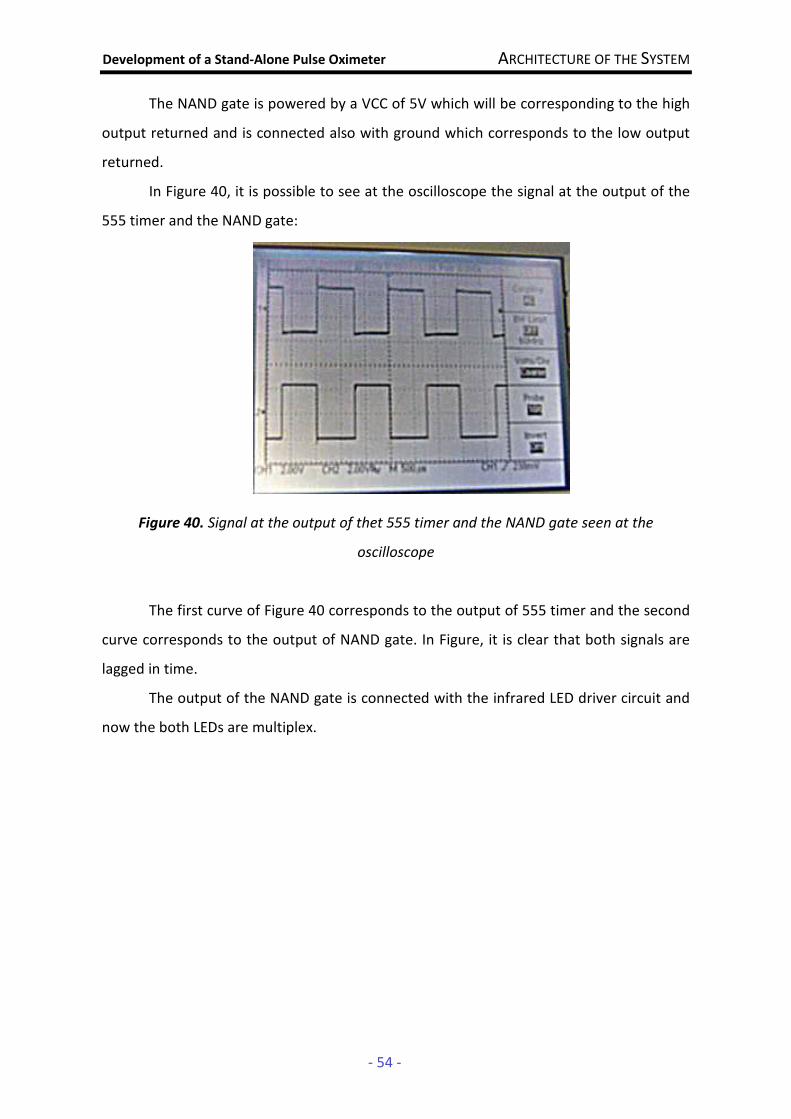
Development of a Stand-Alone Pulse Oximeter ARCHITECTURE OF THE SYSTEM
- 54 -
The NAND gate is powered by a VCC of 5V which will be corresponding to the high
output returned and is connected also with ground which corresponds to the low output
returned.
In Figure 40, it is possible to see at the oscilloscope the signal at the output of the
555 timer and the NAND gate:
Figure 40. Signal at the output of thet 555 timer and the NAND gate seen at the
oscilloscope
The first curve of Figure 40 corresponds to the output of 555 timer and the second
curve corresponds to the output of NAND gate. In Figure, it is clear that both signals are
lagged in time.
The output of the NAND gate is connected with the infrared LED driver circuit and
now the both LEDs are multiplex.
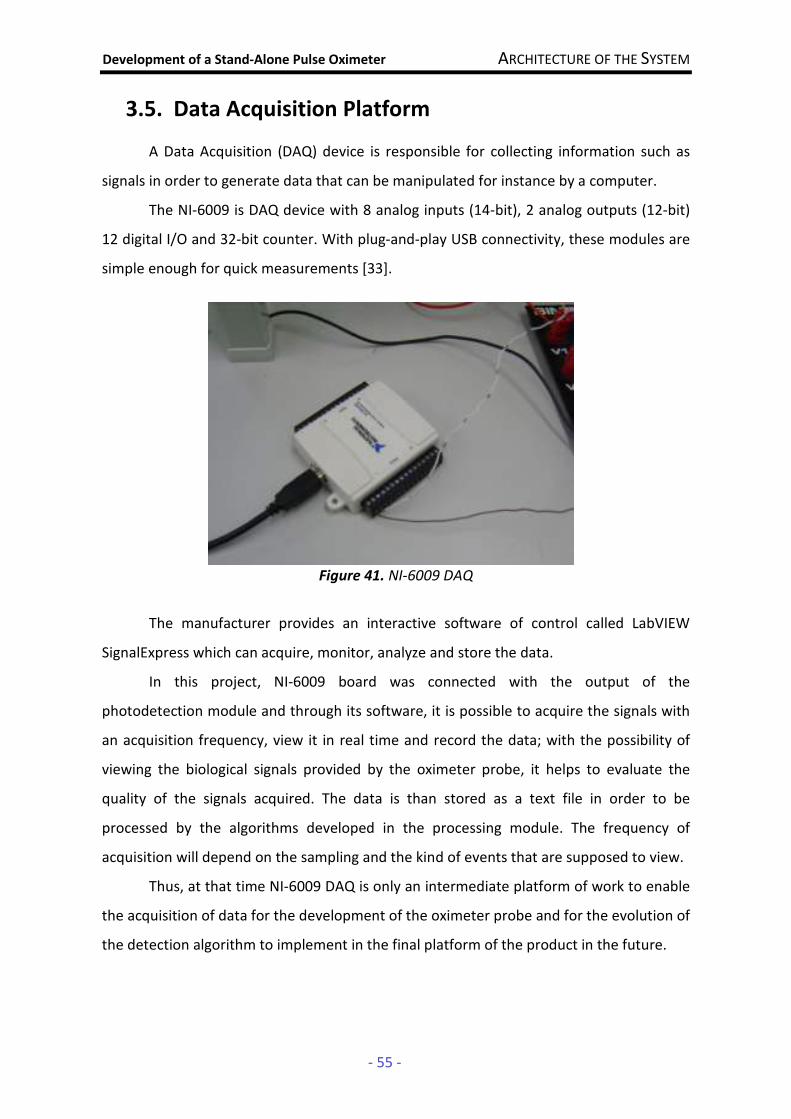
Development of a Stand-Alone Pulse Oximeter ARCHITECTURE OF THE SYSTEM
- 55 -
3.5. Data Acquisition Platform
A Data Acquisition (DAQ) device is responsible for collecting information such as
signals in order to generate data that can be manipulated for instance by a computer.
The NI-6009 is DAQ device with 8 analog inputs (14-bit), 2 analog outputs (12-bit)
12 digital I/O and 32-bit counter. With plug-and-play USB connectivity, these modules are
simple enough for quick measurements [33].
Figure 41. NI-6009 DAQ
The manufacturer provides an interactive software of control called LabVIEW
SignalExpress which can acquire, monitor, analyze and store the data.
In this project, NI-6009 board was connected with the output of the
photodetection module and through its software, it is possible to acquire the signals with
an acquisition frequency, view it in real time and record the data; with the possibility of
viewing the biological signals provided by the oximeter probe, it helps to evaluate the
quality of the signals acquired. The data is than stored as a text file in order to be
processed by the algorithms developed in the processing module. The frequency of
acquisition will depend on the sampling and the kind of events that are supposed to view.
Thus, at that time NI-6009 DAQ is only an intermediate platform of work to enable
the acquisition of data for the development of the oximeter probe and for the evolution of
the detection algorithm to implement in the final platform of the product in the future.
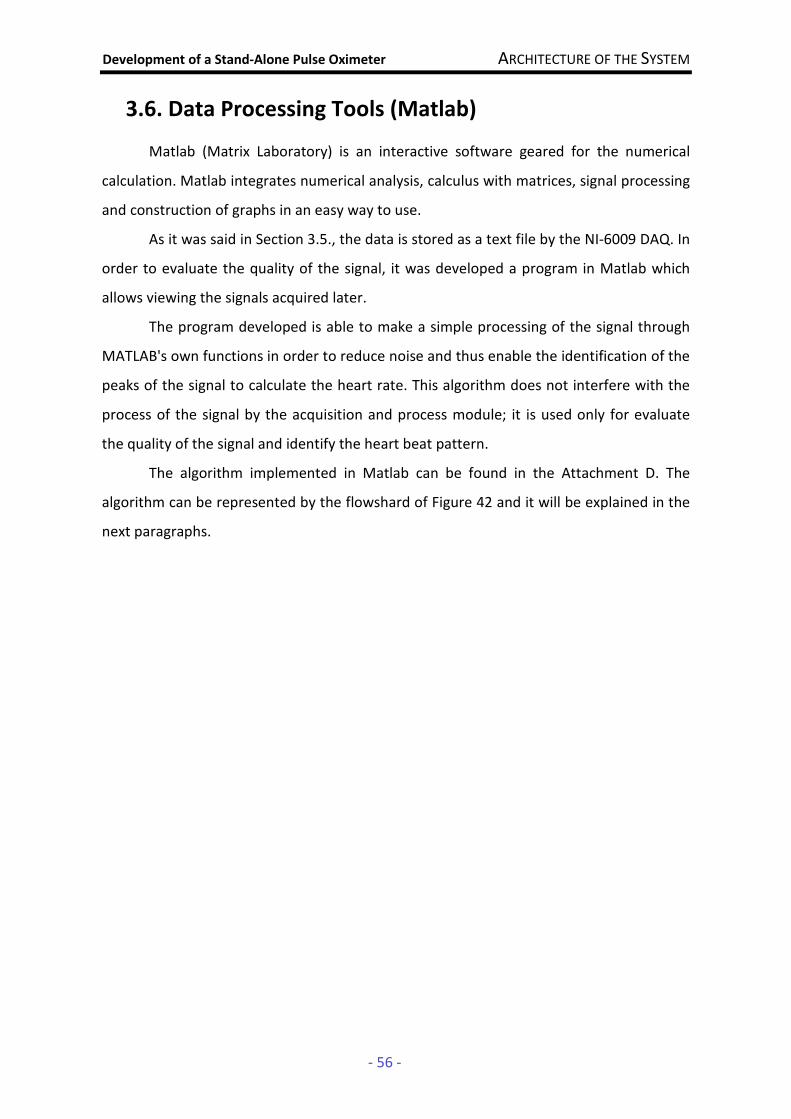
Development of a Stand-Alone Pulse Oximeter ARCHITECTURE OF THE SYSTEM
- 56 -
3.6. Data Processing Tools (Matlab)
Matlab (Matrix Laboratory) is an interactive software geared for the numerical
calculation. Matlab integrates numerical analysis, calculus with matrices, signal processing
and construction of graphs in an easy way to use.
As it was said in Section 3.5., the data is stored as a text file by the NI-6009 DAQ. In
order to evaluate the quality of the signal, it was developed a program in Matlab which
allows viewing the signals acquired later.
The program developed is able to make a simple processing of the signal through
MATLAB's own functions in order to reduce noise and thus enable the identification of the
peaks of the signal to calculate the heart rate. This algorithm does not interfere with the
process of the signal by the acquisition and process module; it is used only for evaluate
the quality of the signal and identify the heart beat pattern.
The algorithm implemented in Matlab can be found in the Attachment D. The
algorithm can be represented by the flowshard of Figure 42 and it will be explained in the
next paragraphs.
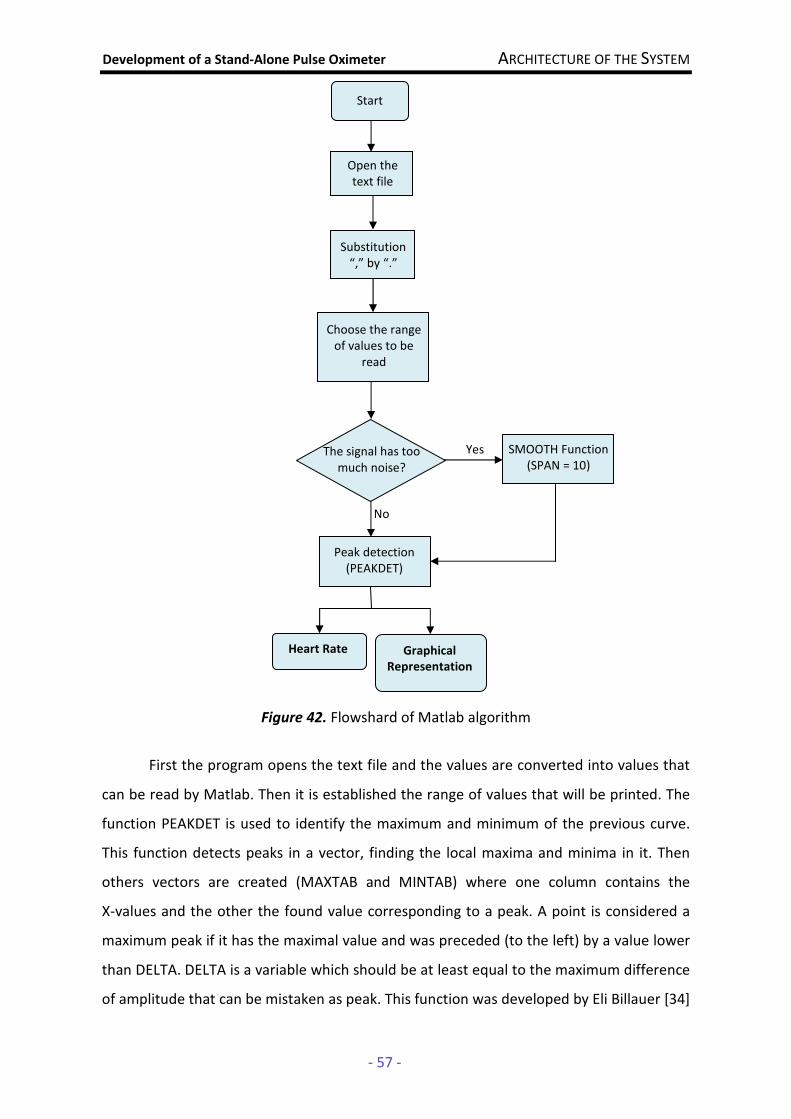
Development of a Stand-Alone Pulse Oximeter ARCHITECTURE OF THE SYSTEM
- 57 -
Figure 42. Flowshard of Matlab algorithm
First the program opens the text file and the values are converted into values that
can be read by Matlab. Then it is established the range of values that will be printed. The
function PEAKDET is used to identify the maximum and minimum of the previous curve.
This function detects peaks in a vector, finding the local maxima and minima in it. Then
others vectors are created (MAXTAB and MINTAB) where one column contains the
X-values and the other the found value corresponding to a peak. A point is considered a
maximum peak if it has the maximal value and was preceded (to the left) by a value lower
than DELTA. DELTA is a variable which should be at least equal to the maximum difference
of amplitude that can be mistaken as peak. This function was developed by Eli Billauer [34]
The signal has too much noise?
Start
Open the text file
Substitution “,” by “.”
Choose the range of values to be
read
SMOOTH Function (SPAN = 10)
Yes
No
Peak detection (PEAKDET)
Heart Rate Graphical
Representation
Development of a Stand-Alone Pulse Oximeter ARCHITECTURE OF THE SYSTEM
- 58 -
and it is possible to find it in the Attachment E. In order to avoid the detection of false
peaks, the value of DELTA is chosen according to the signal acquired and through the
visual analysis of the graphical representation of it.
Then it is calculated the length of the vector returned by the function PEAKDET
using 10s of the signal detected and the result is multiplied by 6 in order to estimate the
number of maximum in one minute that which corresponding to the heart rate.
However, many times the original signal presents a lot of noise, so it is done a
simple processing of the signal through the Smooth (Y, SPAN) function of Matlab, which is
based in the moving average method. This function works as a filter since it smooths data
Y using SPAN as the number of points used to compute each element of the new data. In
the project, where it was necessary to apply the Smooth function, it was used a span of
10, which means that the moving average method is applied with span 10.
As in the case of the original signal, the algorithm to detect peaks can be applied to
this new signal and thus it is possible to calculate the heart rate in a similar way to that
described above.
Finally, the graphs are represented and the peaks are detected with the maximums
at red and the minimums at green.
Development of a Stand-Alone Pulse Oximeter RESULTS/DISCUSSION OF RESULTS
- 59 -
4. RESULTS/ DISCUSSION OF RESULTS
4.1. Tests
Three tests were done to evaluate the performance of the probe developed and
the implemented algorithms. The tests were performed on a 23 years old female patient,
weighing 63kg and 1.70m tall. The patient does not practice sport regularly and has no
history of cardiovascular or respiratory diseases.
The signals were acquired by the NI-DAQ and stored as a file text. The frequency of
acquisition used depends of the test that was done. In the case of a test where the LEDs
are used in a continuous way and taking in account that the frequency present in the
arterial blood is around few Hz, it is used the frequency of acquisition of 800Hz. This value
is well above the maximum frequency present and experimental tests proved that this
frequency of acquisition is suitable to detect the events
In a case that the LEDs are multiplexed with a sampling frequency of 700Hz
(Section 3.4.1.3.), the frequency of acquisition could be chosen according the Sampling
Theorem [6], [35]:
facq ≥ 2 fs (Equation 28)
where,
• facq is the frequency of acquisition of the signals
• fs is the sampling frequency
This condition is necessary to ensure that the expected events will be possible to
see and no important information will be lost. So, as the sampling is 700Hz, in the project
it was used a frequency of acquisition of 1.4 kHz.
The first test was performed in a situation where the patient was at rest before the
measurements. In order to assess the signal quality and performance of the oximeter, it
was done some variants on the tests:
• 1A - inserting the finger in the oximeter probe and using only the red LED in a
continuous way;
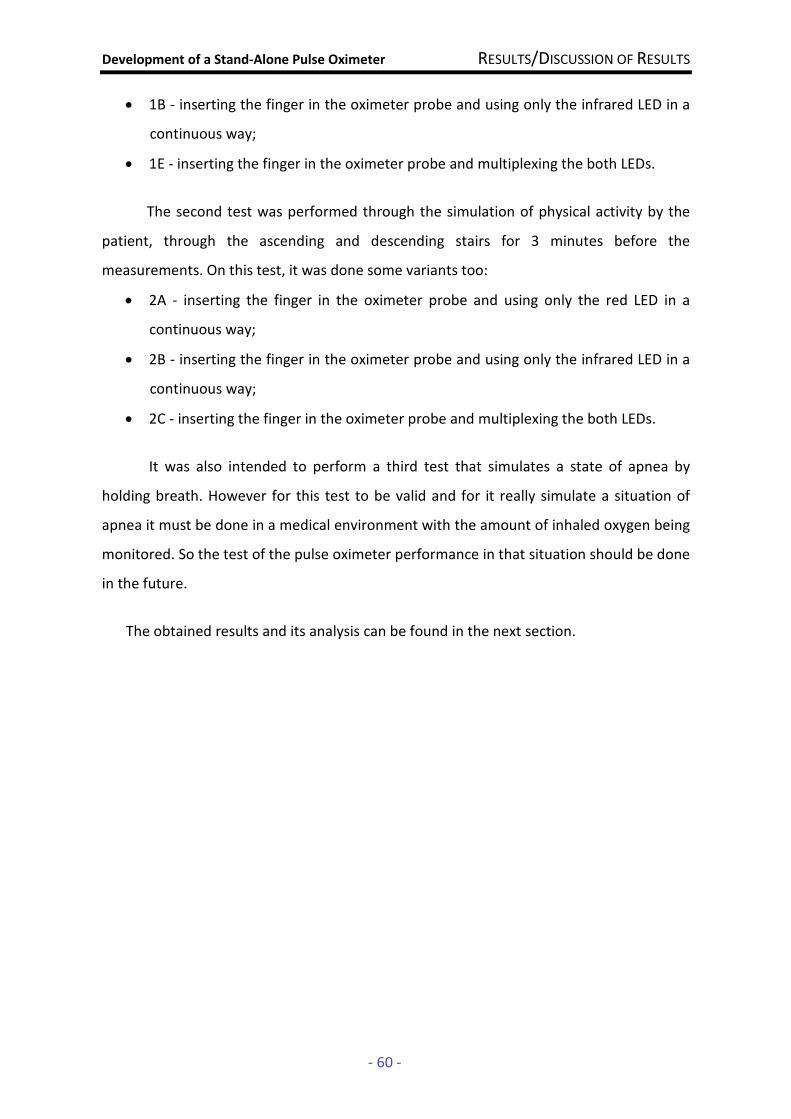
Development of a Stand-Alone Pulse Oximeter RESULTS/DISCUSSION OF RESULTS
- 60 -
• 1B - inserting the finger in the oximeter probe and using only the infrared LED in a
continuous way;
• 1E - inserting the finger in the oximeter probe and multiplexing the both LEDs.
The second test was performed through the simulation of physical activity by the
patient, through the ascending and descending stairs for 3 minutes before the
measurements. On this test, it was done some variants too:
• 2A - inserting the finger in the oximeter probe and using only the red LED in a
continuous way;
• 2B - inserting the finger in the oximeter probe and using only the infrared LED in a
continuous way;
• 2C - inserting the finger in the oximeter probe and multiplexing the both LEDs.
It was also intended to perform a third test that simulates a state of apnea by
holding breath. However for this test to be valid and for it really simulate a situation of
apnea it must be done in a medical environment with the amount of inhaled oxygen being
monitored. So the test of the pulse oximeter performance in that situation should be done
in the future.
The obtained results and its analysis can be found in the next section.
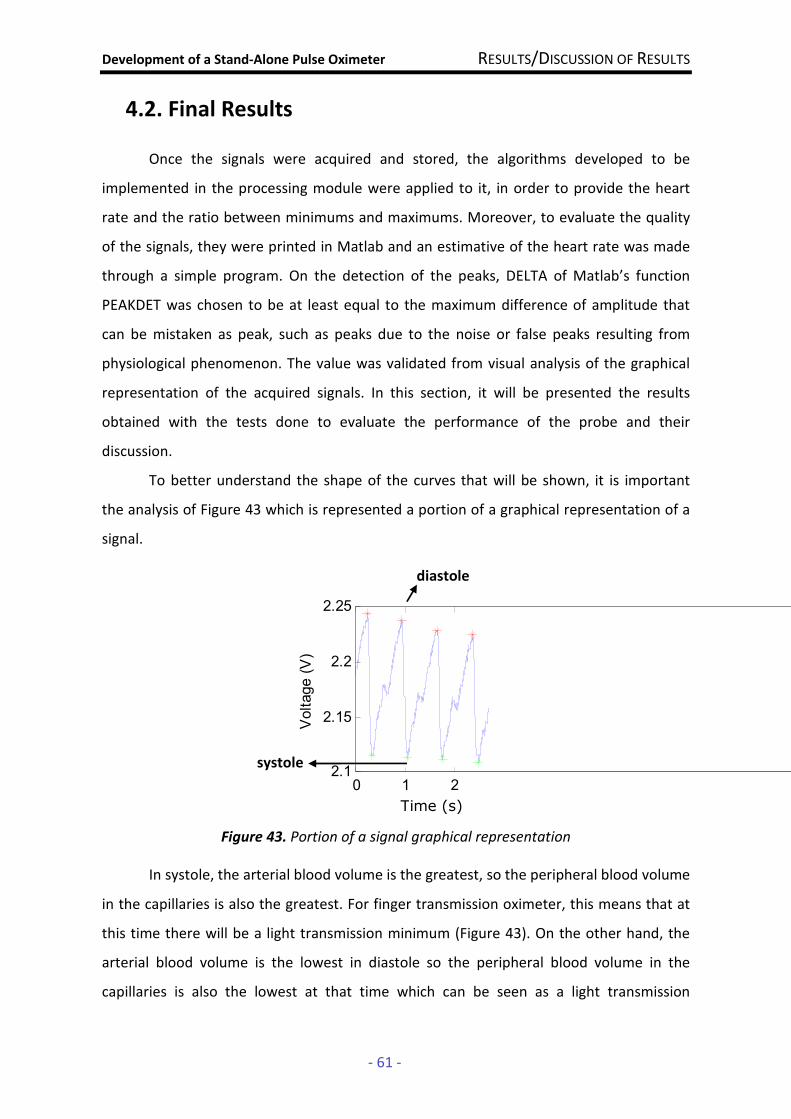
Development of a Stand-Alone Pulse Oximeter RESULTS/DISCUSSION OF RESULTS
- 61 -
4.2. Final Results
Once the signals were acquired and stored, the algorithms developed to be
implemented in the processing module were applied to it, in order to provide the heart
rate and the ratio between minimums and maximums. Moreover, to evaluate the quality
of the signals, they were printed in Matlab and an estimative of the heart rate was made
through a simple program. On the detection of the peaks, DELTA of Matlab’s function
PEAKDET was chosen to be at least equal to the maximum difference of amplitude that
can be mistaken as peak, such as peaks due to the noise or false peaks resulting from
physiological phenomenon. The value was validated from visual analysis of the graphical
representation of the acquired signals. In this section, it will be presented the results
obtained with the tests done to evaluate the performance of the probe and their
discussion.
To better understand the shape of the curves that will be shown, it is important
the analysis of Figure 43 which is represented a portion of a graphical representation of a
signal.
Figure 43. Portion of a signal graphical representation
In systole, the arterial blood volume is the greatest, so the peripheral blood volume
in the capillaries is also the greatest. For finger transmission oximeter, this means that at
this time there will be a light transmission minimum (Figure 43). On the other hand, the
arterial blood volume is the lowest in diastole so the peripheral blood volume in the
capillaries is also the lowest at that time which can be seen as a light transmission
0 1 22.1
2.15
2.2
2.25
Voltage (V)
Time (s)
diastole
systole

Development of a Stand-Alone Pulse Oximeter RESULTS/DISCUSSION OF RESULTS
- 62 -
maximum in the graphical representation of the signal (Figure 43). The sawtooth notch
that is possible to see in Figure 43 can be assumed as the dicrotic notch that occurs
between systole and diastole.
• 1A
In Figure 44 it is possible to see the first ten seconds of the signal acquired using a
red LED in a continuous way.
Figure 44. graphical representation of the original signal acquired with NI-6009
DAQ, between the 0 and 10 sec using for the test 1A
The signal of Figure 44 has an acceptable noise and it is clearly possible to see a
pulse signal. It is getting voltages between 2.1V and 2.25V (signal is around 150 mV).
It is important to note that the trace in Figure 44 has a structure that was assumed
as the dicrotic notch. As said in Section 2.3., it can cause signal processing problems with
the erroneous detection of another peaks. So, analyzing the graphical representation, the
occurrence of this phenomenon is the main criterion to the choice of the value of DELTA
which is 0.06V.
In Figure 44 is possible to see the detection of the maximums at red and the
minimums at green. Based on it, the algorithm developed in Matlab returns a value of
heart rate 78bmp, for this test.
In order to get a better signal and the algorithm of peak detection works better, it
was applied to the signal of Figure 44, the program developed in Matlab based on function
Smooth (Span = 10) . After the treatment by Matlab it is obtained the curve of Figure 45.
0 1 2 3 4 5 6 7 8 9 102
2.1
2.2
2.3
Time (sec)
Voltage (V)
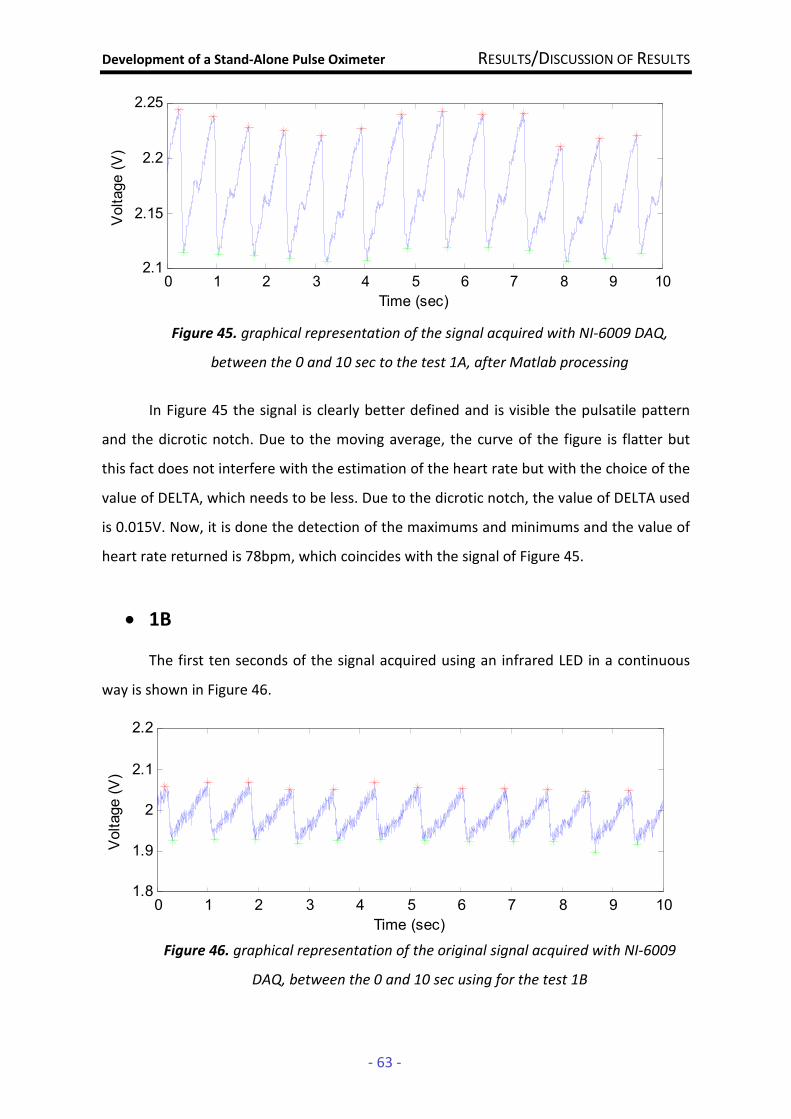
Development of a Stand-Alone Pulse Oximeter RESULTS/DISCUSSION OF RESULTS
- 63 -
Figure 45. graphical representation of the signal acquired with NI-6009 DAQ,
between the 0 and 10 sec to the test 1A, after Matlab processing
In Figure 45 the signal is clearly better defined and is visible the pulsatile pattern
and the dicrotic notch. Due to the moving average, the curve of the figure is flatter but
this fact does not interfere with the estimation of the heart rate but with the choice of the
value of DELTA, which needs to be less. Due to the dicrotic notch, the value of DELTA used
is 0.015V. Now, it is done the detection of the maximums and minimums and the value of
heart rate returned is 78bpm, which coincides with the signal of Figure 45.
• 1B
The first ten seconds of the signal acquired using an infrared LED in a continuous
way is shown in Figure 46.
Figure 46. graphical representation of the original signal acquired with NI-6009
DAQ, between the 0 and 10 sec using for the test 1B
0 1 2 3 4 5 6 7 8 9 102.1
2.15
2.2
2.25
Time (sec)
Voltage (V)
0 1 2 3 4 5 6 7 8 9 101.8
1.9
2
2.1
2.2
Time (sec)
Voltage (V)
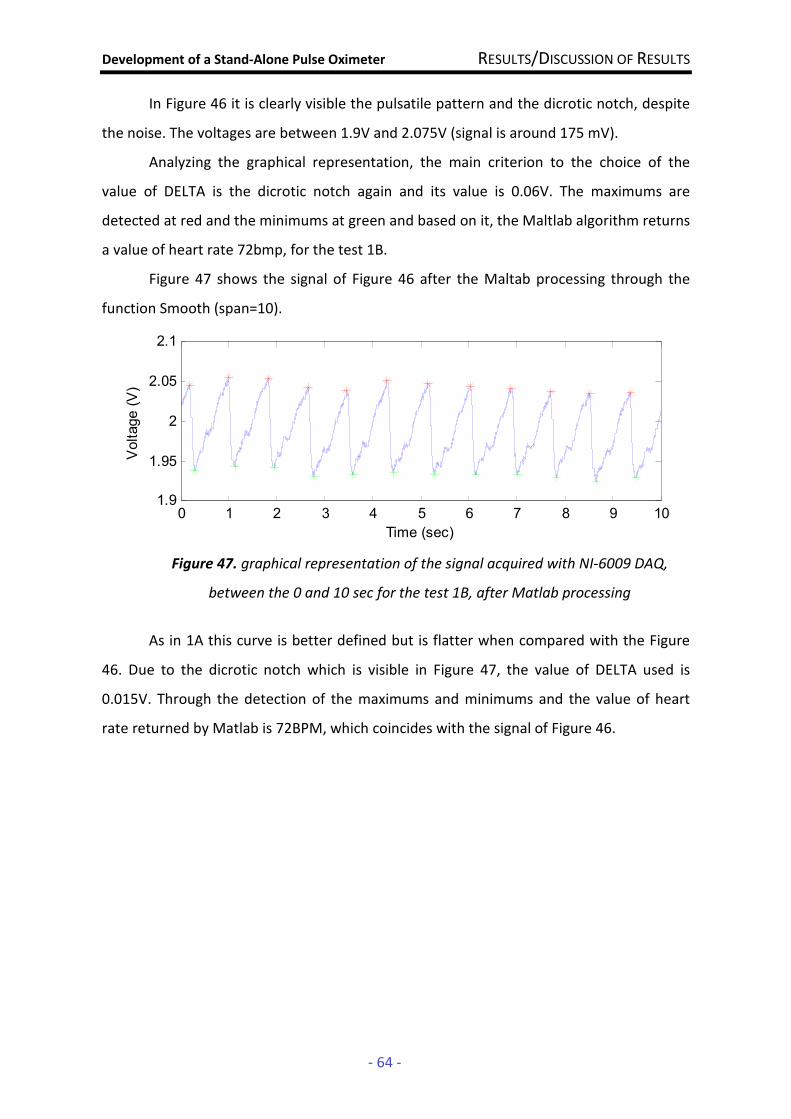
Development of a Stand-Alone Pulse Oximeter RESULTS/DISCUSSION OF RESULTS
- 64 -
In Figure 46 it is clearly visible the pulsatile pattern and the dicrotic notch, despite
the noise. The voltages are between 1.9V and 2.075V (signal is around 175 mV).
Analyzing the graphical representation, the main criterion to the choice of the
value of DELTA is the dicrotic notch again and its value is 0.06V. The maximums are
detected at red and the minimums at green and based on it, the Maltlab algorithm returns
a value of heart rate 72bmp, for the test 1B.
Figure 47 shows the signal of Figure 46 after the Maltab processing through the
function Smooth (span=10).
Figure 47. graphical representation of the signal acquired with NI-6009 DAQ,
between the 0 and 10 sec for the test 1B, after Matlab processing
As in 1A this curve is better defined but is flatter when compared with the Figure
46. Due to the dicrotic notch which is visible in Figure 47, the value of DELTA used is
0.015V. Through the detection of the maximums and minimums and the value of heart
rate returned by Matlab is 72BPM, which coincides with the signal of Figure 46.
0 1 2 3 4 5 6 7 8 9 101.9
1.95
2
2.05
2.1
Time (sec)
Voltage (V)
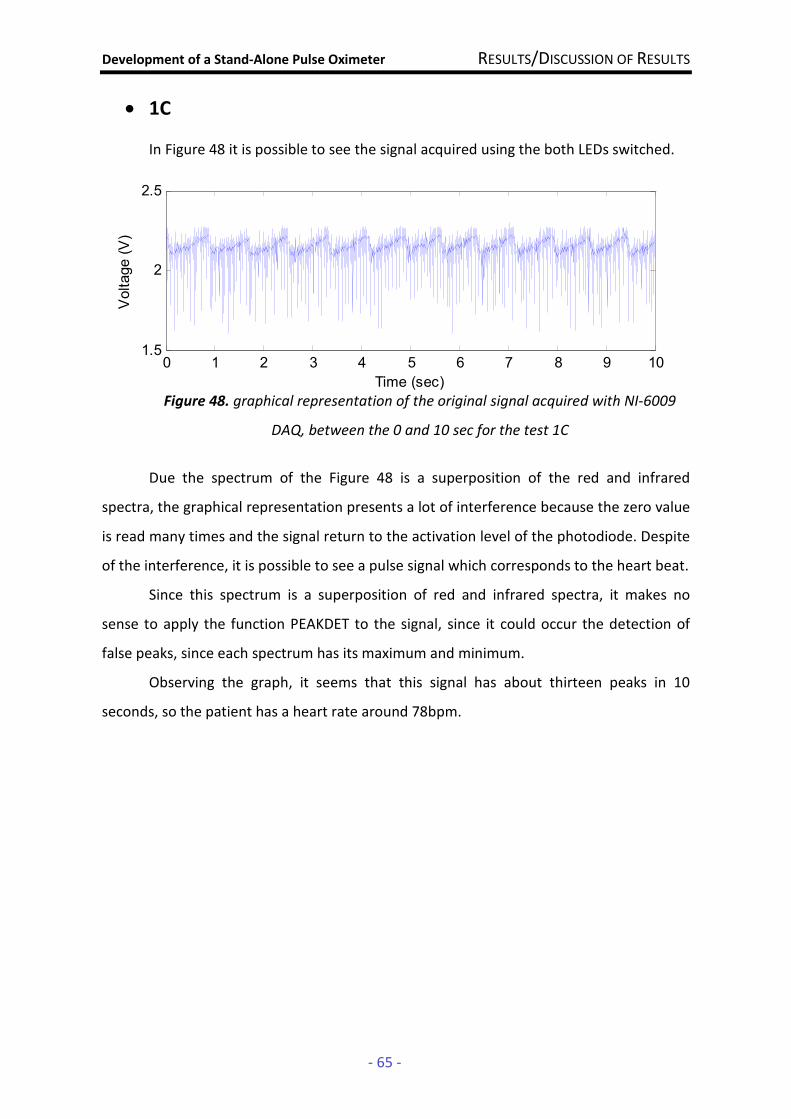
Development of a Stand-Alone Pulse Oximeter RESULTS/DISCUSSION OF RESULTS
- 65 -
0 1 2 3 4 5 6 7 8 9 101.5
2
2.5
Time (sec)
Voltage (V)
• 1C
In Figure 48 it is possible to see the signal acquired using the both LEDs switched.
Figure 48. graphical representation of the original signal acquired with NI-6009
DAQ, between the 0 and 10 sec for the test 1C
Due the spectrum of the Figure 48 is a superposition of the red and infrared
spectra, the graphical representation presents a lot of interference because the zero value
is read many times and the signal return to the activation level of the photodiode. Despite
of the interference, it is possible to see a pulse signal which corresponds to the heart beat.
Since this spectrum is a superposition of red and infrared spectra, it makes no
sense to apply the function PEAKDET to the signal, since it could occur the detection of
false peaks, since each spectrum has its maximum and minimum.
Observing the graph, it seems that this signal has about thirteen peaks in 10
seconds, so the patient has a heart rate around 78bpm.
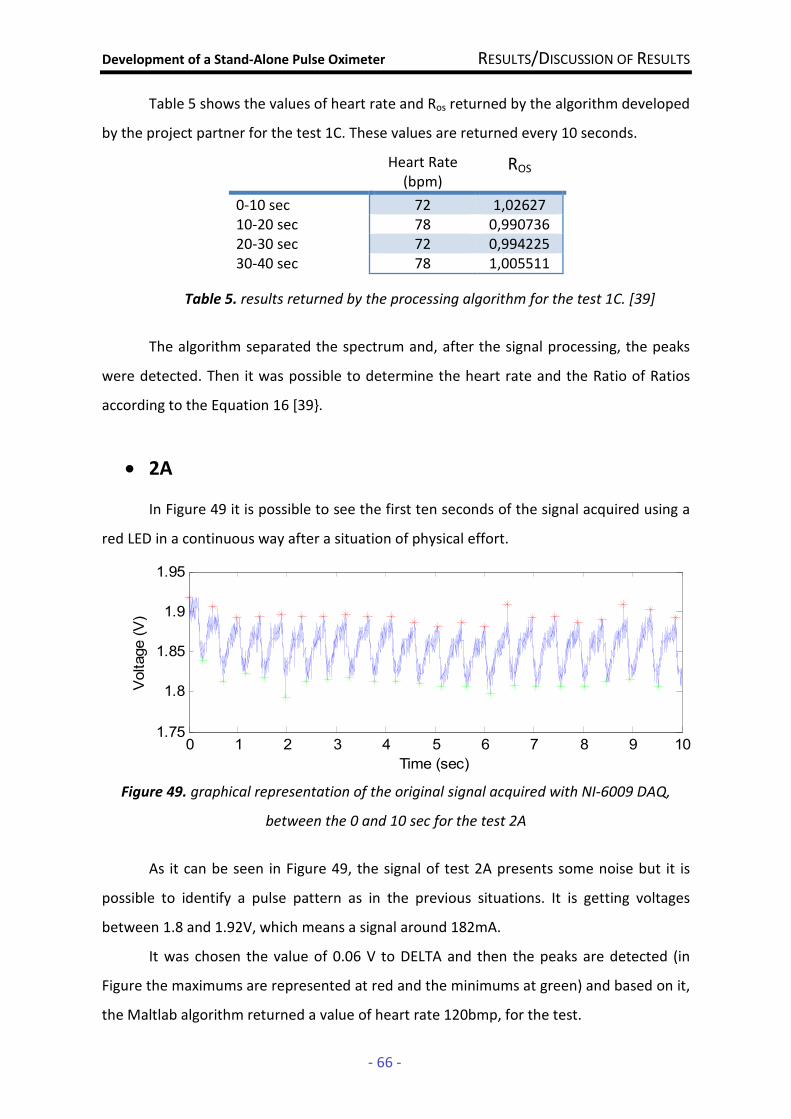
Development of a Stand-Alone Pulse Oximeter RESULTS/DISCUSSION OF RESULTS
- 66 -
Table 5 shows the values of heart rate and Ros returned by the algorithm developed
by the project partner for the test 1C. These values are returned every 10 seconds.
Heart Rate (bpm)
ROS
0-10 sec 72 1,02627 10-20 sec 78 0,990736 20-30 sec 72 0,994225 30-40 sec 78 1,005511
Table 5. results returned by the processing algorithm for the test 1C. [39]
The algorithm separated the spectrum and, after the signal processing, the peaks
were detected. Then it was possible to determine the heart rate and the Ratio of Ratios
according to the Equation 16 [39.
• 2A
In Figure 49 it is possible to see the first ten seconds of the signal acquired using a
red LED in a continuous way after a situation of physical effort.
Figure 49. graphical representation of the original signal acquired with NI-6009 DAQ,
between the 0 and 10 sec for the test 2A
As it can be seen in Figure 49, the signal of test 2A presents some noise but it is
possible to identify a pulse pattern as in the previous situations. It is getting voltages
between 1.8 and 1.92V, which means a signal around 182mA.
It was chosen the value of 0.06 V to DELTA and then the peaks are detected (in
Figure the maximums are represented at red and the minimums at green) and based on it,
the Maltlab algorithm returned a value of heart rate 120bmp, for the test.
0 1 2 3 4 5 6 7 8 9 101.75
1.8
1.85
1.9
1.95
Time (sec)
Voltage (V)

Development of a Stand-Alone Pulse Oximeter RESULTS/DISCUSSION OF RESULTS
- 67 -
To see a better defined curve, the signal is processing by a simple program in
Matlab using the function Smooth (span = 10) and the Figure 50 shows the obtained
signal.
Figure 50. graphical representation of the signal acquired with NI-6009 DAQ, between the
0 and 10 sec for the test 2A, after Matlab processing
In Figure 50 is possible to see that although the curve is flatter than the curve of
Figure 49 the dicrotic notch is still visible. The peak detection is applied to the signal and
then the program returns the value of heart rate which is 120bpm. This value is consistent
with the heart rate to the signal of Figure 49.
0 1 2 3 4 5 6 7 8 9 101.8
1.85
1.9
1.95
2
Time (sec)
Voltage (V)
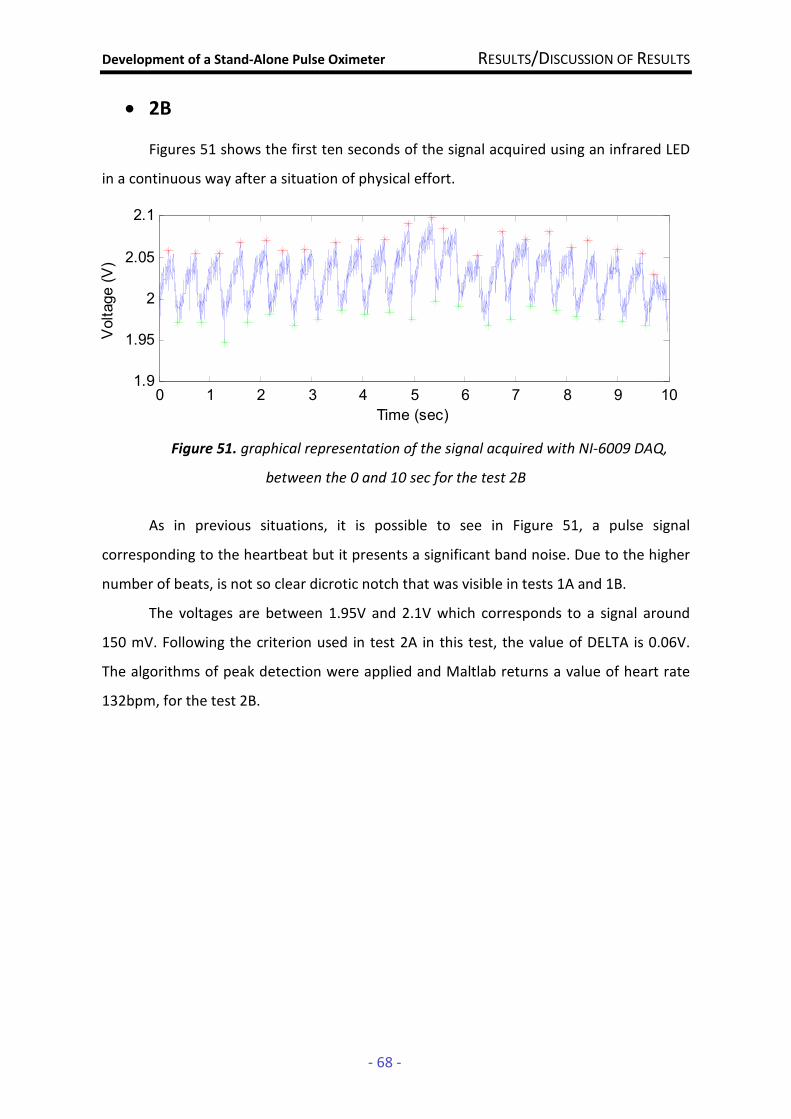
Development of a Stand-Alone Pulse Oximeter RESULTS/DISCUSSION OF RESULTS
- 68 -
• 2B
Figures 51 shows the first ten seconds of the signal acquired using an infrared LED
in a continuous way after a situation of physical effort.
Figure 51. graphical representation of the signal acquired with NI-6009 DAQ,
between the 0 and 10 sec for the test 2B
As in previous situations, it is possible to see in Figure 51, a pulse signal
corresponding to the heartbeat but it presents a significant band noise. Due to the higher
number of beats, is not so clear dicrotic notch that was visible in tests 1A and 1B.
The voltages are between 1.95V and 2.1V which corresponds to a signal around
150 mV. Following the criterion used in test 2A in this test, the value of DELTA is 0.06V.
The algorithms of peak detection were applied and Maltlab returns a value of heart rate
132bpm, for the test 2B.
0 1 2 3 4 5 6 7 8 9 101.9
1.95
2
2.05
2.1
Time (sec)
Voltage (V)
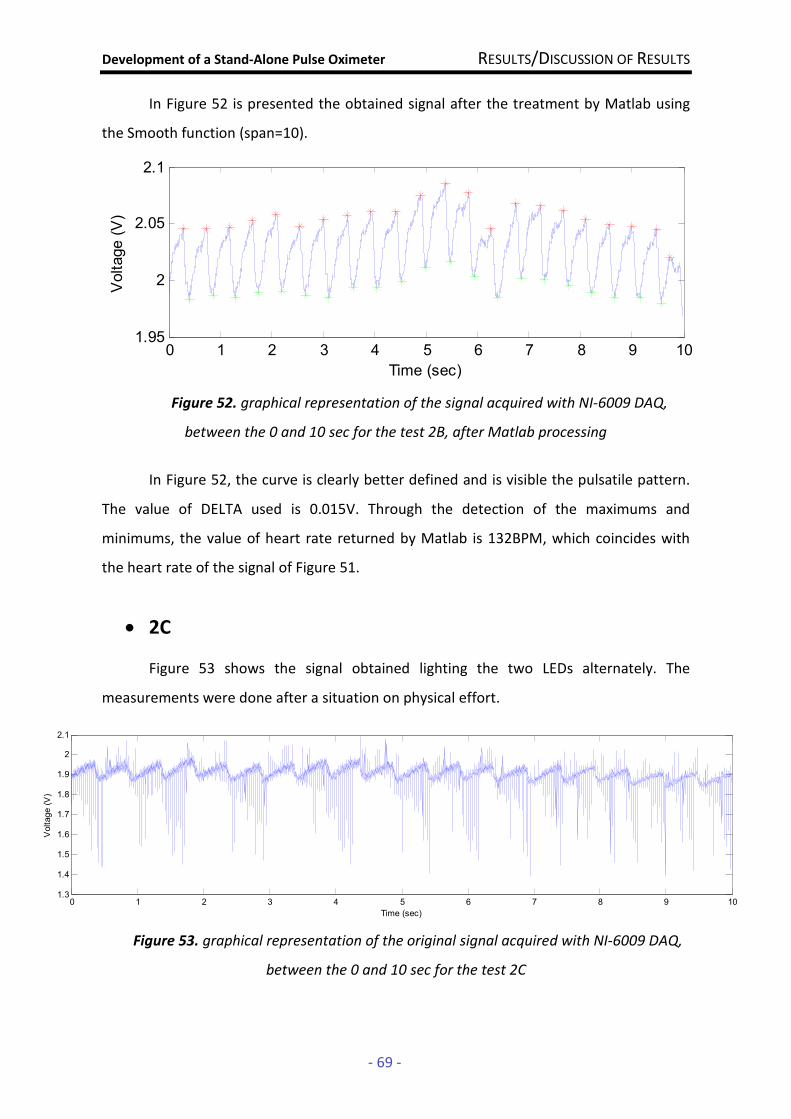
Development of a Stand-Alone Pulse Oximeter RESULTS/DISCUSSION OF RESULTS
- 69 -
In Figure 52 is presented the obtained signal after the treatment by Matlab using
the Smooth function (span=10).
Figure 52. graphical representation of the signal acquired with NI-6009 DAQ,
between the 0 and 10 sec for the test 2B, after Matlab processing
In Figure 52, the curve is clearly better defined and is visible the pulsatile pattern.
The value of DELTA used is 0.015V. Through the detection of the maximums and
minimums, the value of heart rate returned by Matlab is 132BPM, which coincides with
the heart rate of the signal of Figure 51.
• 2C
Figure 53 shows the signal obtained lighting the two LEDs alternately. The
measurements were done after a situation on physical effort.
Figure 53. graphical representation of the original signal acquired with NI-6009 DAQ,
between the 0 and 10 sec for the test 2C
0 1 2 3 4 5 6 7 8 9 101.95
2
2.05
2.1
Time (sec)
Voltage (V)
0 1 2 3 4 5 6 7 8 9 101.3
1.4
1.5
1.6
1.7
1.8
1.9
2
2.1
Time (sec)
Voltage (V)
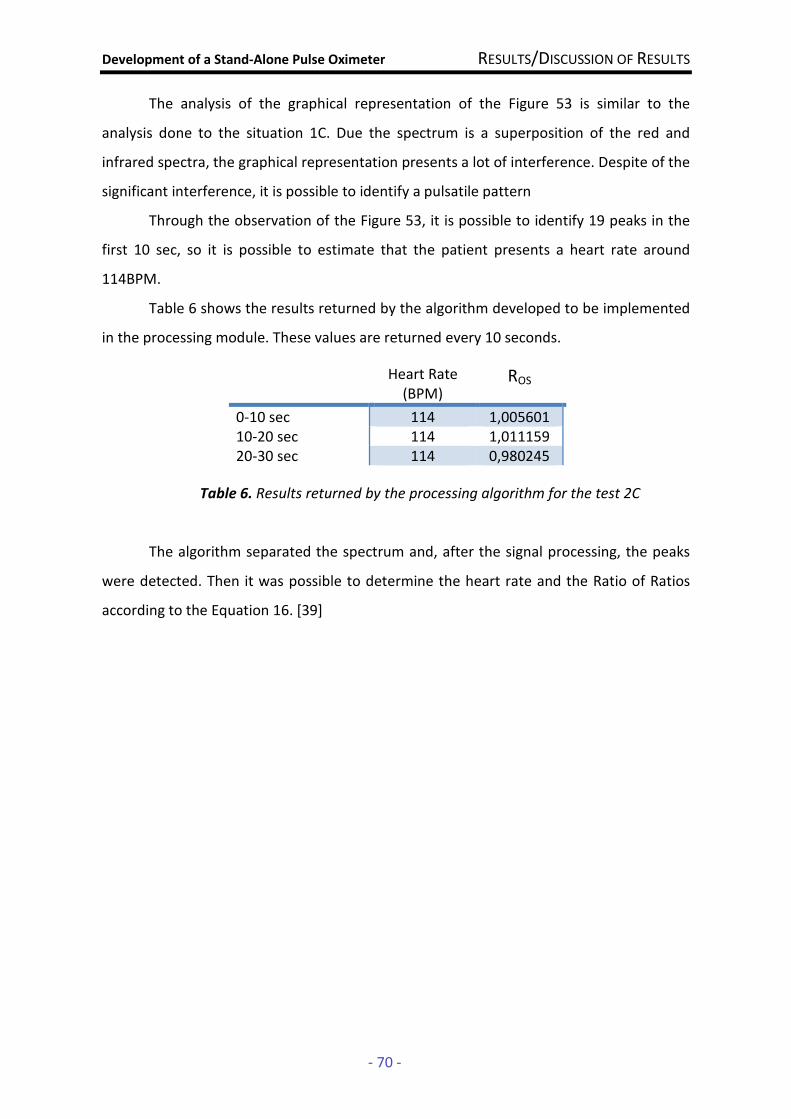
Development of a Stand-Alone Pulse Oximeter RESULTS/DISCUSSION OF RESULTS
- 70 -
The analysis of the graphical representation of the Figure 53 is similar to the
analysis done to the situation 1C. Due the spectrum is a superposition of the red and
infrared spectra, the graphical representation presents a lot of interference. Despite of the
significant interference, it is possible to identify a pulsatile pattern
Through the observation of the Figure 53, it is possible to identify 19 peaks in the
first 10 sec, so it is possible to estimate that the patient presents a heart rate around
114BPM.
Table 6 shows the results returned by the algorithm developed to be implemented
in the processing module. These values are returned every 10 seconds.
Table 6. Results returned by the processing algorithm for the test 2C
The algorithm separated the spectrum and, after the signal processing, the peaks
were detected. Then it was possible to determine the heart rate and the Ratio of Ratios
according to the Equation 16. [39]
Heart Rate (BPM)
ROS
0-10 sec 114 1,005601 10-20 sec 114 1,011159 20-30 sec 114 0,980245
Development of a Stand-Alone Pulse Oximeter RESULTS/DISCUSSION OF RESULTS
- 71 -
4.3. Discussion of Results The results presented allow a comprehensive assessment of the performance and
efficiency of the probe developed and a comparison with the results obtained by the
algorithm developed in C to implement in the processing module, which will return the
values of oxygen saturation in blood and the heart rate.
Looking at the graphical representation of the obtained signals and despite the
noise, it is possible to indentify clearly a visible pulse signal corresponding to the
heartbeat and the physiological phenomenon of dicrotic notch. So it is possible to
conclude that the probe and the frequencies used are suitable for signal acquisition in
oximetry without loss of relevant information.
For the test carried done at rest (Test 1), the heart rate calculated using Matlab
and which can be detected by observation of the curves is between 72bpm and 78bpm.
Thus, it is possible to conclude that these values are within normal parameters for
situations of absence of physical activity, since the patient does not practice exercise
regularly [2].
In a situation of physical activity such as Test 2, it is identifiable a significant
increase in heart rate by observing the graphical representations of signals, which has
values between 114 and 13bpm. Therefore, it is possible to conclude that the probe is
sensitive to these changes in the heart rate caused by physical exercise.
The project partner developed some algorithms in C to be implemented in the
acquisition platform [39]. These algorithms allow the reduction of the noise, the
separation of red and infrared spectra and then a detection of the signal peaks. For this
comparison will only interest tests 1C and 2C which are those in which the algorithm can
be applied since the LEDs are switched. Table 5 and 6 show the values of heart rate and
Ros returned by the program every 10 seconds in order to compare with the values
obtained in Matlab and with what is expected.
Regarding to the heart rate between the 0 and 40sec to the test 1C, the program
returned values between 72 and 78bpm (Table 5) what is in agreement with the expected
values, since the signal analysis in Matlab allows to estimate a heart rate around 78bpm
(Figure 48).
Development of a Stand-Alone Pulse Oximeter RESULTS/DISCUSSION OF RESULTS
- 72 -
For the test 2C, the program returned values of heart rate around the 114bpm
(Table 6), coinciding with that ones that were estimated by the analysis of the graphical
representation in Matlab (Figure 53).
Comparing Tables 5 and 6, it is possible to verify that the values of Ros are quite
similar between Test 1 and Test 2. Since with the physical activity the SpO2 decreases [4], it
was expected than the values of Ros of Table 6 are higher than the values of Table 5.
Actually, despite the great changes that occur in oxygen consumption and production of
carbon dioxide during exercise the mean values of 2OP and pH of the blood remain
constant and near the values at rest since the exercise is aerobic [35], as the case of
Test 2, where the effort of up and down stairs for three minutes may not be significant to
induce changes in the values of saturation.
Comparing the tests using the LEDs on a continuous way with the tests in which
the LEDs were powered alternately, it is possible to verify that the last ones have a much
noisier signal. This happens because there is not an intermediate state where both LEDs
are turned off between the moments in which each LED is lit. Then, the spectrum for each
wavelength may have interference caused by light from the other wavelength, which will
affect the separation of the spectra and signal processing.
The probe has also proved to be very sensitive to finger movements, a factor which
introduced noise in signals acquired, thus affecting the processing of them. Thus, as the
probe is not very robust yet, movements of the finger where the oxygen saturation was
measured, affect the acquisition by the introducing of noise.
Development of a Stand-Alone Pulse Oximeter CONCLUSIONS AND FUTURE WORK
- 73 -
5. CONCLUSIONS AND FUTURE WORK
The Development of a Stand-Alone Pulse Oximeter has been described in the
present thesis as a project carried throughout the past academic year.
The technical design of a system able to acquire and process physiological data
accurately was the main goal of the project and the central theme of this thesis. Following,
the project status is described and analyzed, preceding the presentation of some ideas
and suggestions to develop and improve the system’s features. Finally a personal
appreciation of the overall project is done.
5.1. Project Status
Initially the main objective of the project was to develop a portable pulse oximeter
unit that receives data from a probe and processes it in order to return the values of heart
rate and oxygen saturation in blood, thus allowing a continuous monitoring of these
parameters. As already mentioned in this thesis, the project gained new guidelines and
thus the main objectives become the development of an oximeter probe whose data is
acquired by BioPluxTM module, which communicate with a platform that would have
implemented algorithms in order to perform the signal processing.
At this moment, it is available an efficient probe prototype constituted by
economic components which is sensitive to the changes of light that occurs during the
arterial pulse. Different measuring conditions such as a situation of physical activity are
also detected by the oximeter probe. The oximeter probe developed is able to acquire
biological signals to determine the heart rate and Sp02. However, the prototype is not
robust yet which introduces some artifacts of movement and ambient light that will affect
the results.
The functional modules that allow the LEDs driver and switching and the detection
of light are also designed, developed and tested. The results show that these circuits are
efficient, but still needed several improvements. The circuits were assembled on a
breadboard, using a lot of jumpers which will introduce noise in the system.
The BioPluxTM module is ready to acquired data from the probe but it is necessary
to adjust acquisition frequency. However, this module has not been tested. This module

Development of a Stand-Alone Pulse Oximeter CONCLUSIONS AND FUTURE WORK
- 74 -
communicates via BluetoothTM with the processing platform, whose the firmware to board
initialization and communications protocols was already developed and operational.
The signal processing algorithms were developed in C. They have the ability to
apply a filter to the signal in order to reduce noise and then apply a criterion of detection
that allows the separation of the spectra, the detection of peaks and thus determine the
values of heart rate and the Ratio of Ratios [39].
5.2. Suggestions for a Future Work
In this section some ideas are suggested to continue the project improvement,
which can be used as an initial orientation for future developers.
In a short-term, it is really important to assemble a more robust oximeter probe,
using the same mechanism of a spring-loaded clip, which allows a better isolation of light
and another external noise and decreases the motion artifacts. In order to reduce its size,
the new oximeter probe should be assembled with SMD components and have
incorporated the operational module circuits (LED driver, photodetection and timing). The
construction of the circuit of functional modules in a printed circuit board (PCB) will help
eliminate the harmful effects associated with the jumpers used in breadboard.
As it is possible to see in the results obtained, they are affected by some noise so it
can be important to develop an electronic filter, which will become the signal processing
easier and reliable.
Keeping the energy consumption of the probe in mind, the timing module may be
improved by reducing the duration of the duty cycle of each LED, adding a state where the
two LEDs are off which will also improve the processing of the signal because the
interference caused by the light from the other LED will be reduced.
The system developed must be calibrated so that the results have clinical validity.
Thus, it is necessary to perform several tests and from these develop a valid algorithm
calibration.
Returning to the original purpose of the work, it seems interesting to the student
to take advantage of the hardware and software developed, and design a portable pulse
oximeter unit with more autonomy that this one.

Development of a Stand-Alone Pulse Oximeter CONCLUSIONS AND FUTURE WORK
- 75 -
5.3. Final Appreciation The final appreciation of this document regards both the project status and the
developed work throughout the academic year.
Regarding the actual status of the project, the student knows that there are a lot of
work to do in the future but despite of it, the student thinks that it was done a good work
and a low cost oximeter probe was developed and it presents a good performance even
though it needs several improvements.
The personal final appreciation of this work is very positive. Technically speaking
the student acquired some primarily experience in the electronics field and particularly in
circuit construction. As this is a group project, the student acquired a good work team
spirit, distributing tasks, sharing ideas and conciliating different perspectives into a final
result.
The overall project development allowed a global and practical use of the
knowledge acquired though the academic pathway, in such a way that the student hopes
to be now more prepared to use her professional and personal skills in the work market.
Development of a Stand-Alone Pulse Oximeter REFERENCES
- 76 -
6. REFERENCES [1] Design of Pulse Oximeters. J. G. Webster ed. New York: Taylor & Francis Group, 1997. [2] Fox,Stuart Ira. Human Physiology. Ninth ed. ISBN 0-07-111584-6. New York: McGraw-
Hill, 2006.
[3] Amoore, J. N. Pulse Oximetry: An Equipment Management Perspective. IEE. Pulse Oximetry: A Critical Appraisal, IEE Colloquium on 29 May 1996.
[4] Gupta, R. C., et al. Design and Development of Pulse Oximeter. IEEE Proceedings: 14th Conference Biomedical Engineering Society of India. 15-18. February 1996. pg. 1/13 – 1/16.
[5] ADAM, "Bloodless Medicine." http://www.sjhsyr.org/sjhhc/hidc07/CareGuides/28/000218.htm (accessed July 18, 2009). [6] Oximetry. In J. G. Ebster (ed), Encyclopedia of Medical Devices and Instrumentation (pp. 469-476). New York: Wiley and Sons. [7] Li, Yun-Thai. "Pulse OximetrySEPS Undergraduate Research Journal 2. 1751-4436 (2007), 11-15, http://personal.ph.surrey.ac.uk/~phs3ps/surj/v2/li.pdf. (accessed June 14, 2009). [8] Kamat, Dr. Vijaylakshmi. "Pulse OximetryIndian J. Anaesth 46. 4 (2002), 261-268, http://medind.nic.in/iad/t02/i4/iadt02i4p261.pdf. (accessed July 1, 2009). [9] Di, Guowei, Xiaoying Tang,, and Weifeng Liu. "A Reflectance Pulse Oximeter Design Using the MSP430F149." Complex Medical Engineering, 2007. CME 2007. IEEE/ICME
International Conference on (2007): 1081-1084. http://ieeexplore.ieee.org/xpl/freeabs_all.jsp?arnumber=4381907 (accessed September 22, 2008). [10] Pereira, R. J. Projecto de um Sistema Digital de Medida para Aplicações Biomédicas. Departamento de Física da Faculdade de Ciências e Tecnologia da Universidade de Coimbra. 1995 [11] Matviyenko, S. Cypress Semiconducter. Pulse Oximeter - Standard - Application Note 2313 (2005): http://www.cypress.com/?rID=2696 (accessed July 20, 2009). [12] Júnior, R. C., & Moraes, J. C. (Novembro de 2005). Grupo Calibração . Obtido de CALIBRAÇÃO DE OXÍMETROS DE PULSO NA VISÃO DA NORMA ISO 9919:2005 (November, 2005) http://www.grupocalibracao.com.br/download.aspx?idAttribute=artigo_arquivo&idContent=962

Development of a Stand-Alone Pulse Oximeter REFERENCES
- 77 -
[13] Townsend, Dr. Neil (2001). Pulse Oximetry. “Medical Electronics”. Michaelmas Term [14] Choi et al. "Measurement of Penile Hemodynamics by Laser Oximetry." Journal of
Andrology 23. 2 (March/April 2002): 278-283. http://www.andrologyjournal.org/cgi/reprint/23/2/278.pdf (accessed July 15, 2009). [15] NONIN, "The Original All-In-One Digital Fingertip Pulse Oximeter." 2007.http://www.nonin.com/products/9500-original-all-in-one-digital-fingertip-pulse-oximeter/ (accessed August 18, 2009). [16] Parlato, Matthew B.; Meyer, Jonathan; Dzyubak, Bogdan; Helfenberger, Joseph . "Low Cost Pulse Oximeter Probe." March 13, 2009.http://homepages.cae.wisc.edu/~bme300/pulse_oximeter_s09/reports/Pulse_oximeter_midsemester_report.pdf (accessed July 24, 2009) [17] "CE-Marking." http://www.ce-marking.org (accessed September 22, 2008). [18] Infarmed, "Dispositivos Médicos." http://www.infarmed.pt/portal/page/portal/INFARMED/DISPOSITIVOS_MEDICOS (accessed September 22, 2008). [19] FDA U.S. Food and Drug Admnistration, "Medical Devices." http://www.fda.gov/MedicalDevices/default.htm (accessed September 22, 2008). [20] EMERGO Group, "FDA 510(k) Submissions for Obtaining FDA Approval (Clearance)." http://www.emergogroup.com/services/us/fda-510k-consulting (accessed September 22, 2008). [21] Pereira, Anderson L.. "Desenvolvimento de um Oxímetro de Pulso para Medidas Não Invasivas de Saturação de Oxigénio no Sangue." December, 2006.http://www2.ele.ufes.br/~projgrad/documentos/PG2006_2/andersonluizpereira.pdf (accessed July 6, 2009). [22] STMicroelectronics, "2N2907A - TRANSISTOR." http://www.st.com/stonline/products/literature/ds/9037.pdf accessed April (accessed 16, 2009). [23] Multicomp, "BC141-16 - TRANSISTOR." http://www.farnell.com/datasheets/296684.pdf (accessed April 16, 2009). [24] ON Semiconductor, "MMBT3904LT1G - TRANSISTOR." http://www.onsemi.com/pub_link/Collateral/MMBT3904LT1-D.PDF (accessed April 16, 2009). [25] Vishay Semiconductors, "1N4148 - DIODE." http://www.vishay.com/docs/81857/1n4148.pdf (accessed April 16, 2009).

Development of a Stand-Alone Pulse Oximeter REFERENCES
- 78 -
[26]Silonex, "SILONEX - SLCD-61N1." http://www1.silonex.com/datasheets/specs/images/pdf/104117.pdf (accessed October 6, 2008).
[27] National Semiconductor, "NATIONAL SEMICONDUCTOR - LM321MF." http://www.national.com/ds/LM/LM321.pdf (accessed October 6, 2008) [28] The Electronics Club, "555 and 556 Timer Circuits." http://www.kpsec.freeuk.com/555timer.htm (accessed July 20, 2009). [29] Son, William. "http://www.williamson-labs.com/480_555.htm." http://www.williamson-labs.com/480_555.htm (accessed August 10, 2009). [30] Texas Instruments, "Clocks and Timers." http://focus.ti.com/lit/ds/symlink/ne555.pdf (accessed May 24, 2009). [31] Electronics-Tutorials, "Logic "NAND" Gate." http://www.electronics-tutorials.ws/logic/logic_5.html (accessed July 20, 2009). [32] National Instruments, "NI USB-6009." http://sine.ni.com/nips/cds/view/p/lang/en/nid/14605 (accessed November 12, 2008).
[33] Billauer, Eli. "peakdet: Peak detection using MATLAB." September 6, 2008.http://www.billauer.co.il/peakdet.html (accessed December 9, 2008). [34] Centro Universitário da FEI, "Teorema da Amostragem Mínima." http://www.fei.edu.br/eletrica/vparro/TELECO/Microsoft%20Word%20-%20TA.pdf (accessed 20 August, 2009).
[35] Seeley, Rod R., Trent D. Stephens, and Philip Tate. Anatomia & Fisiologia. 6ª ed. Lusociência. Lisboa: Professor Doutor Diogo Pais, 2003.
[36] AVAGO Technologies, "T-1 3/4 (5 mm) Precision Optical Performance." http://www.avagotech.com/docs/AV02-0373EN (accessed October 6, 2008)
[37] Vishay Semiconductors, "High Power Infrared Emitting Diode,." http://www.vishay.com/docs/81008/tsal5300.pdf (accessed October 6, 2008). [38] Merriam-Webster, "Dicrotic Notch." http://www.merriam-webster.com/medical/dicrotic%20notch (accessed September 1, 2009).
[39] Brás, Sérgio. Development of a Stand-Alone Pulse Oximeter. Departamento de Física da Faculdade de Ciências e Tecnologia da Universidade de Coimbra. September 2009
[40] Medical News Today, "Pulse Oximeters Market ." http://www.medicalnewstoday.com/articles/104945.php (accessed September 25, 2008).

Development of a Stand-Alone Pulse Oximeter REFERENCES
- 79 -
[41] HomeCare, "Pulse Oximetry Market." http://homecaremag.com/news/pulse-oximetry-market/ (accessed September 24, 2008).
[42] McGovern, Jeffrey P., Scott A. Sasse, and David W. Stansbury. "Comparison of Oxygen Saturation by Pulse Oximetry and Co-oximetry During Exercise Testing in Patients With COPD." CHEST 109, 5 (1996): 1151-1156. http://www.watersmed.com/downloads/Research_pulseOX_coOX.pdf. (accessed September 4, 2009).
[43] Johnston, W. S., and Y. Mendelson. "Investigation of Signal Processing Algorithms for an Embedded Microcontroller-Based Wearable Pulse Oximeter," Engineering in Medicine
and Biology Society, 2006. EMBS '06. 28th Annual International Conference of the IEEE (2006): 5888-5891. http://ieeexplore.ieee.org/xpl/freeabs_all.jsp?arnumber=4463147 (accessed August 14, 2009).

Development of a Stand-Alone Pulse Oximeter ATTACHMENT A
- 80 -
Attachment A
The first eleven pages of ISO 9919:2005, containing the Contents, List of Figures,
Foreword, Introduction, Scope and Normative References
Reference numberISO 9919:2005(E)
© ISO 2005
INTERNATIONAL STANDARD
ISO9919
Second edition2005-03-15
Medical electrical equipment — Particular requirements for the basic safety and essential performance of pulse oximeter equipment for medical use
Appareils électromédicaux — Règles particulières de sécurité et performances essentielles du matériel utilisé pour les oxymètres de pouls à usage médical
ISO 9919:2005(E)
PDF disclaimer This PDF file may contain embedded typefaces. In accordance with Adobe's licensing policy, this file may be printed or viewed but shall not be edited unless the typefaces which are embedded are licensed to and installed on the computer performing the editing. In downloading this file, parties accept therein the responsibility of not infringing Adobe's licensing policy. The ISO Central Secretariat accepts no liability in this area.
Adobe is a trademark of Adobe Systems Incorporated.
Details of the software products used to create this PDF file can be found in the General Info relative to the file; the PDF-creation parameters were optimized for printing. Every care has been taken to ensure that the file is suitable for use by ISO member bodies. In the unlikely event that a problem relating to it is found, please inform the Central Secretariat at the address given below.
© ISO 2005 All rights reserved. Unless otherwise specified, no part of this publication may be reproduced or utilized in any form or by any means, electronic or mechanical, including photocopying and microfilm, without permission in writing from either ISO at the address below or ISO's member body in the country of the requester.
ISO copyright office Case postale 56 • CH-1211 Geneva 20 Tel. + 41 22 749 01 11 Fax + 41 22 749 09 47 E-mail [email protected] Web www.iso.org
Published in Switzerland
ii © ISO 2005 – All rights reserved
ISO 9919:2005(E)
© ISO 2005 – All rights reserved iii
Contents Page
Foreword........................................................................................................................................................... vii Introduction ..................................................................................................................................................... viii 1 Scope...................................................................................................................................................... 1 2 Normative references ........................................................................................................................... 1 3 Terms and definitions........................................................................................................................... 2 4 General requirements and requirements for tests ............................................................................ 7 4.101 Other test methods ............................................................................................................................... 7 4.102 Acceptance criteria ............................................................................................................................... 8 4.103 Pulse oximeter equipment, parts and accessories ........................................................................... 8 5 Classification......................................................................................................................................... 8 6 Identification, marking and documents .............................................................................................. 8 6.1 Marking on the outside of equipment or equipment parts ............................................................... 8 6.8.1 General ................................................................................................................................................... 9 6.8.2 Instructions for use............................................................................................................................... 9 6.8.3 Technical description ......................................................................................................................... 11 7 Power input.......................................................................................................................................... 11 8 Basic safety categories ...................................................................................................................... 11 9 Removable protective means ............................................................................................................ 11 10 Environmental conditions .................................................................................................................. 12 10.1 Transport and storage ........................................................................................................................ 12 11 Not used............................................................................................................................................... 12 12 Not used............................................................................................................................................... 12 13 General ................................................................................................................................................. 12 14 Requirements related to classification ............................................................................................. 12 14.6 Types B, BF and CF equipment......................................................................................................... 12 15 Limitation of voltage and/or energy .................................................................................................. 12 16 Enclosures and protective covers .................................................................................................... 12 17 Separation............................................................................................................................................ 12 18 Protective earthing, functional earthing and potential equalization ............................................. 12 19 Continuous leakage currents and patient auxiliary currents ......................................................... 13 19.4 Tests ..................................................................................................................................................... 13 20 Dielectric strength............................................................................................................................... 13 20.4 Tests ..................................................................................................................................................... 13 21 * Mechanical strength ........................................................................................................................ 13 21.5 13 21.101 * Shock and vibration ........................................................................................................................ 13 21.102 * Shock and vibration for transport.................................................................................................. 14 22 Moving parts........................................................................................................................................ 15 23 Surfaces, corners and edges............................................................................................................. 15 24 Stability in normal use........................................................................................................................ 15
ISO 9919:2005(E)
iv © ISO 2005 – All rights reserved
25 Expelled parts ......................................................................................................................................15 26 Vibration and noise .............................................................................................................................16 27 Pneumatic and hydraulic power ........................................................................................................16 28 Suspended masses.............................................................................................................................16 29 X-Radiation...........................................................................................................................................16 30 Alpha, beta, gamma, neutron radiation and other particle radiation .............................................16 31 Microwave radiation............................................................................................................................16 32 Light radiation (including lasers).......................................................................................................16 33 Infra-red radiation................................................................................................................................16 34 Ultraviolet radiation.............................................................................................................................16 35 Acoustical energy (including ultrasonics)........................................................................................16 36 * Electromagnetic compatibility........................................................................................................17 37 Locations and basic requirements ....................................................................................................17 38 Marking, accompanying documents .................................................................................................17 39 Common requirements for category AP and category APG equipment .......................................17 40 Requirements and tests for category AP equipment, parts and components thereof ................17 41 Requirements and tests for category APG equipment, parts and components thereof .............17 42 Excessive temperatures .....................................................................................................................18 43 Fire prevention.....................................................................................................................................18 43.101 * Pulse oximeter equipment used in conjunction with oxidants...................................................18 43.101.1 Ignitable material .........................................................................................................................18 43.101.2 Sparking........................................................................................................................................19 44 Overflow, spillage, leakage, humidity, ingress of liquids, cleaning, sterilization,
disinfection and compatibility............................................................................................................19 44.6 * Ingress of liquids .............................................................................................................................19 44.7 Cleaning, sterilization and disinfection ............................................................................................19 45 Pressure vessels and parts subject to pressure .............................................................................19 46 Human errors .......................................................................................................................................20 47 Electrostatic charges ..........................................................................................................................20 48 Biocompatibility...................................................................................................................................20 49 Interruption of the power supply .......................................................................................................20 49.101 Power-failure alarm condition............................................................................................................20 49.102 Pulse oximeter equipment operation following interruption of the power supply.......................20 49.102.1 Settings and data storage following short interruptions or automatic switchover..............20 49.102.2 Operation following long interruptions .....................................................................................20 50 Accuracy of operating data ................................................................................................................21 50.101 * SpO2 accuracy of pulse oximeter equipment ...............................................................................21 50.101.1 * Specification .............................................................................................................................21 50.101.2 Determination of SpO2 accuracy................................................................................................21 50.102 Accuracy under conditions of motion...............................................................................................22 50.103 Accuracy under conditions of low perfusion ...................................................................................22 50.104 Pulse rate accuracy.............................................................................................................................23 51 Protection against hazardous output................................................................................................23 51.101 * Data update period ..........................................................................................................................23 51.102 Detection of pulse oximeter probe and probe cable extender fault...............................................23
ISO 9919:2005(E)
© ISO 2005 – All rights reserved v
52 Abnormal operation and fault-conditions ........................................................................................ 23 53 Environmental tests............................................................................................................................ 24 54 General ................................................................................................................................................. 24 55 Enclosures and covers....................................................................................................................... 24 56 Components and general assembly ................................................................................................. 24 57 Mains parts, components and layout................................................................................................ 24 58 Protective earthing — Terminals and connections ......................................................................... 24 59 Construction and layout..................................................................................................................... 24 101 * Signal inadequacy ........................................................................................................................... 24 102 * Pulse oximeter probes and probe cable extenders ..................................................................... 25 102.1 General ................................................................................................................................................. 25 102.2 Labelling............................................................................................................................................... 25 103 Saturation pulse information signal.................................................................................................. 25 104 Alarm systems..................................................................................................................................... 25 201.1.2 * Assignment of priority .................................................................................................................... 25 201.5.4 * Default alarm preset ........................................................................................................................ 26 201.8 Alarm signal inactivation states ........................................................................................................ 26 201.8.3 Indication and access......................................................................................................................... 26 105 Appendices of IEC 60601-1:1988....................................................................................................... 26 Annex AA (informative) Rationale................................................................................................................... 27 Annex BB (informative) Skin temperature at the pulse oximeter probe ..................................................... 38 Annex CC (informative) Determination of accuracy...................................................................................... 42 Annex DD (informative) Calibration standards.............................................................................................. 50 Annex EE (informative) Guideline for evaluating and documenting SpO2 accuracy in human
subjects................................................................................................................................................ 51 Annex FF (informative) Simulators, calibrators and functional testers for pulse oximeter
equipment ............................................................................................................................................ 58 Annex GG (informative) Concepts of equipment response time................................................................. 68 Annex HH (informative) Reference to the Essential Principles ................................................................... 72 Annex II (informative) Environmental aspects............................................................................................... 74 Annex JJ (informative) Index of defined terms.............................................................................................. 76 Bibliography ..................................................................................................................................................... 78
Tables
Table AA.1 — Qualitative assessment of pulse oximeter equipment shock and vibration environment......................................................................................................................................... 28
Table AA.2 — Allowable maximum temperatures for skin contact with medical electrical equipment applied parts (adapted from Table 22, IEC/CDV 60601-1:2004) .................................. 30
Table BB.1 — Pulse oximeter probe safe application time and source ..................................................... 40 Table EE.1 — Example of target plateaus and ranges ................................................................................. 54 Table HH.1 — Correspondence between this International Standard and the Essential Principles....... 72 Table II.1 — Environmental aspects addressed by clauses of this International Standard..................... 75
ISO 9919:2005(E)
vi © ISO 2005 – All rights reserved
Figures
Figure CC.1 — Synthesized calibration data (base case) ............................................................................43 Figure CC.2 — Constant offset has been added to base case ....................................................................44 Figure CC.3 — Tilt has been added to base case .........................................................................................45 Figure CC.4 — Graphical representation for the definition of local bias (Test sensor SpO2 as a function of reference SR) .................................................................................................................................46
Figure CC.5 — Graphical representation for the definition of local bias and mean bias (Test sensor SpO2 as a function of reference SR) ..................................................................................................46
Figure EE.1 — Example of desaturation-time profile ...................................................................................54 Figure FF.1 — Sample calibration curve for pulse oximeter equipment ....................................................60 Figure FF.2 — Interface of a functional tester that uses a photodiode and LED to interact with a pulse oximeter probe .......................................................................................................................................61 Figure FF.3 — Interface of a functional tester that uses a dye mixture......................................................62 Figure FF.4 — Interface of a functional tester that uses a liquid crystal modulator.................................63 Figure FF.5 — Absorbency of blue bandage material (measured in reflection) used in a special test pulse oximeter probe with great patient-to-patient variability of calibration .....................................65 Figure FF.6 — Calibration of high-variability pulse oximeter probe in controlled desaturation study on five test subjects ..............................................................................................................................66 Figure FF.6 — Calibration of high-variability pulse oximeter probe in controlled desaturation study on five test subjects (continued)..........................................................................................................67 Figure GG.1 — Illustration of fidelity of pulse oximeter equipment performance in tracking saturation changes...........................................................................................................................................68 Figure GG.2 — Illustration of effect of different averaging times on fidelity .............................................69 Figure GG.3 — Graphic representation of components of alarm system delay........................................70 Figure GG.4 — Illustration of the effects of different averaging times on a more rapid and noisier desaturation signal...........................................................................................................................................71
ISO 9919:2005(E)
© ISO 2005 – All rights reserved vii
Foreword
ISO (the International Organization for Standardization) is a worldwide federation of national standards bodies (ISO member bodies). The work of preparing International Standards is normally carried out through ISO technical committees. Each member body interested in a subject for which a technical committee has been established has the right to be represented on that committee. International organizations, governmental and non-governmental, in liaison with ISO, also take part in the work. ISO collaborates closely with the International Electrotechnical Commission (IEC) on all matters of electrotechnical standardization.
International Standards are drafted in accordance with the rules given in the ISO/IEC Directives, Part 2.
The main task of technical committees is to prepare International Standards. Draft International Standards adopted by the technical committees are circulated to the member bodies for voting. Publication as an International Standard requires approval by at least 75 % of the member bodies casting a vote.
Attention is drawn to the possibility that some of the elements of this document may be the subject of patent rights. ISO shall not be held responsible for identifying any or all such patent rights.
ISO 9919 (IEC 60601-2-54) was prepared jointly by Technical Committee ISO/TC 121, Anaesthetic and respiratory equipment, Subcommittee SC 3, Lung ventilators and related equipment and Technical Committee IEC/TC 62, Electrical equipment in medical practice, Subcommittee SC D, Electromedical equipment. The draft was circulated for voting to the national bodies of both ISO and IEC.
This second edition cancels and replaces the first edition (ISO 9919:1992), which has been technically revised.
ISO 9919:2005(E)
viii © ISO 2005 – All rights reserved
Introduction
The approximation of arterial haemoglobin saturation and pulse rate using pulse oximetry is common practice in many areas of medicine. This International Standard covers basic safety and essential performance requirements achievable within the limits of existing technology.
Annex AA contains a rationale for some of the requirements. It is included to provide additional insight into the committee’s reasoning that led to a requirement and identifying the hazards that the requirement addresses.
Annex BB is a literature survey relevant to the determination of the maximum safe temperature of the interface between a pulse oximeter probe and a patient’s tissue.
Annex CC discusses both the formulae used to evaluate the SpO2 accuracy of pulse oximeter equipment measurements, and the names that are assigned to those formulae.
Annex DD presents guidance on when in vitro blood calibration of pulse oximeter equipment is needed.
Annex EE presents a guideline for controlled desaturation study for the calibration of pulse oximeter equipment.
Annex FF is a tutorial introduction to several kinds of testers used in pulse oximetry.
Annex GG describes concepts of pulse oximeter equipment response time.
This International Standard is a Particular Standard, based on IEC 60601-1:1988, including Amendments 1 (1991) and 2 (1995), hereafter referred to as the General Standard. The General Standard is the basic standard for the safety of all medical electrical equipment used by or under the supervision of qualified personnel in the general medical and patient environment; it also contains certain requirements for reliable operation to ensure safety.
The General Standard has associated Collateral Standards and Particular Standards. The Collateral Standards include requirements for specific technologies and/or hazards and apply to all applicable equipment, such as medical systems, EMC, radiation protection in diagnostic X-ray equipment, software, etc. The Particular Standards apply to specific equipment types, such as medical electron accelerators, high frequency surgical equipment, hospital beds, etc.
NOTE Definitions of Collateral Standard and Particular Standard can be found in IEC 60601-1:1988, 1.5 and A.2, respectively.
To facilitate the use of this International Standard, the following drafting conventions have been applied.
The changes to the text of IEC 60601-1:1988, the General Standard, as supplemented by the Collateral Standards, are specified by the use of the following words.
“Replacement” means that the indicated clause or subclause of the General Standard is replaced completely by the text of this Particular Standard.
“Addition” means that the relevant text of this Particular Standard is a new element (e.g. subclause, list element, note, table, figure) additional to the General Standard.
“Amendment” means that existing text of the General Standard is partially modified by deletion and/or addition as indicated by the text of this Particular Standard.

ISO 9919:2005(E)
© ISO 2005 – All rights reserved ix
To avoid confusion with any amendments to the General Standard itself, a particular numbering has been employed for elements added by this International Standard: clauses, subclauses, tables and figures are numbered starting from 101; additional list items are lettered aa), bb), etc. and additional annexes are lettered AA, BB, etc.
In this International Standard, the following print types are used:
requirements, compliance with which can be tested, and definitions: roman type;
notes and examples: smaller roman type;
description of type of document change, and test specifications: italic type;
terms defined in Clause 2 of the General Standard IEC 60601-1:1988 or in this Particular Standard: bold type.
Throughout this Particular Standard, text for which a rationale is provided in Annex AA is indicated by an asterisk (*).
INTERNATIONAL STANDARD ISO 9919:2005(E)
© ISO 2005 – All rights reserved 1
Medical electrical equipment — Particular requirements for the basic safety and essential performance of pulse oximeter equipment for medical use
1 Scope
IEC 60601-1:1988, Clause 1 applies, except as follows.
Amendment (add at the end of 1.1):
This International Standard specifies particular requirements for the basic safety and essential performance of pulse oximeter equipment intended for use on humans. This includes any part necessary for normal use, e.g. the pulse oximeter monitor, pulse oximeter probe, probe cable extender.
These requirements also apply to pulse oximeter equipment, including pulse oximeter monitors, pulse oximeter probes and probe cable extenders, that has been reprocessed.
The intended use of pulse oximeter equipment includes, but is not limited to, the estimation of arterial oxygen haemoglobin saturation and pulse rate on patients in healthcare institutions as well as on patients in home care.
* This International Standard is not applicable to pulse oximeter equipment intended for use in laboratory research applications nor to oximeters that requires a blood sample from the patient.
This International Standard is not applicable to pulse oximeter equipment solely intended for foetal use.
This International Standard is not applicable to remote or slave (secondary) devices that display SpO2 values that are located outside of the patient environment.
The requirements of this International Standard which replace or modify requirements of IEC 60601-1:1988 and its Amendments 1 (1991) and 2 (1995) are intended to take precedence over the corresponding general requirements.
2 Normative references
The following referenced documents are indispensable for the application of this document. For dated references, only the edition cited applies. For undated references, the latest edition of the referenced document (including any amendments) applies.
ISO 7000/IEC 60417:2004, Graphical symbols for use on equipment — Index and synopsis
ISO 14155-1:2003, Clinical investigation of medical devices for human subjects — Part 1: General requirements
ISO 14155-2:2003, Clinical investigation of medical devices for human subjects — Part 2: Clinical investigation plans

ISO 9919:2005(E)
2 © ISO 2005 – All rights reserved
ISO 14937:2000, Sterilization of health care products — General requirements for characterization of a sterilizing agent and the development, validation and routine control of a sterilization process for medical devices
ISO 15223:2000, Medical devices — Symbols to be used with medical device labels, labelling and information to be supplied Amendment 1:2002. Amendment 2:2004.
IEC 60068-2-6:1995, Environmental testing — Part 2-6: Tests — Test Fc. Vibration (sinusoidal)
IEC 60068-2-27:1987, Environmental testing — Part 2-27: Tests — Test Ea and guidance. Shock
IEC 60068-2-32:1975, Environmental testing — Part 2-32: Tests — Test Ed. Free fall Amendment 1:1982 Amendment 2:1990
IEC 60068-2-64:1993, Environmental testing — Part 2-64: Test methods — Test Fh. Vibration, broad-band random (digital control) and guidance
IEC 60079-4:1975, Electrical apparatus for explosive gas atmospheres — Part 4: Method of test for ignition temperature Amendment 1:1995
IEC 60529:2001, Degrees of protection provided by enclosures (IP code)
IEC 60601-1:19881), Medical electrical equipment — Part 1: General requirements for safety Amendment 1:1991 Amendment 2:1995
IEC 60601-1-1:2000, Medical electrical equipment — Part 1-1: General requirements for safety — Collateral standard: Safety requirements for medical electrical systems
IEC 60601-1-2:2001, Medical electrical equipment — Part 1-2: General requirements for safety — Collateral standard: Electromagnetic compatibility — Requirements and tests
IEC 60601-1-4:1996, Medical electrical equipment — Part 1-4: General requirements for safety — Collateral Standard: Programmable electrical medical systems Amendment 1:1999
IEC 60601-1-6:2004, Medical electrical equipment — Part 1-6: General requirements for safety — Collateral standard: Usability
IEC 60601-1-8:2003, Medical electrical equipment — Part 1-8: General requirements for safety — Collateral standard: General requirements, tests and guidance for alarm systems in medical electrical equipment and medical electrical systems
IEC 60825-1:2001, Safety of laser products — Part 1: Equipment classification, requirements and user's guide
IEC 60825-2:2000, Safety of laser products — Part 2: Safety of optical fibre communication systems (OFCS)
3 Terms and definitions
For the purposes of this International Standard, the terms and definitions given in IEC 60601-1:1988, Clause 2, as amended by the Collateral Standards, and the following apply.
NOTE For convenience, the sources of all defined terms used in this International Standard are given in Annex JJ.
1) Currently under revision as IEC/CDV 60601-1:2004.

Development of a Stand-Alone Pulse Oximeter ATTACHMENT B
- 92 -
Attachment B – FDA (510k) Costs [20]
Emergo Group has been helping medical device and companies with international
regulatory and quality assurance issues since 1997. The company assists the manufacturer
with everything from USA FDA Quality System Regulation*** (QSR) compliance and audits,
to 510(k) preparation and distributor qualification.
Shown below are the user fees the FDA charges to review 510(k) applications. An
annual fee for Establishment Registration is also charged to all companies. The number in
(brackets) is the discount given to “small businesses” with less than US$100,000,000 in
annual sales. The fiscal year for the FDA starts on October 1 and ends September 30 each
year. All prices are in USD.
FDA 510(k) Application Review Fee
Payable to the FDA to have them review a new 510(k) application. Note that the US
Government fiscal year ends on September 30.
2009 - $3693 ($1847 for small businesses)
2010 - $4007 ($2004 for small businesses)
2011 - $4348 ($2174 for small businesses)
2012 - $4717 ($2359 for small businesses)
FDA Establishment Registration Fee
Payable once per year by every registered medical device company. No discount is
provided to small businesses for the FDA Establishment Registration fee.
2009 - $1851
2010 - $2008
2011 - $2179
2012 - $2364
Development of a Stand-Alone Pulse Oximeter ATTACHMENT C
- 93 -
Attachment C
The first oximeter probe circuit (September, 2008)
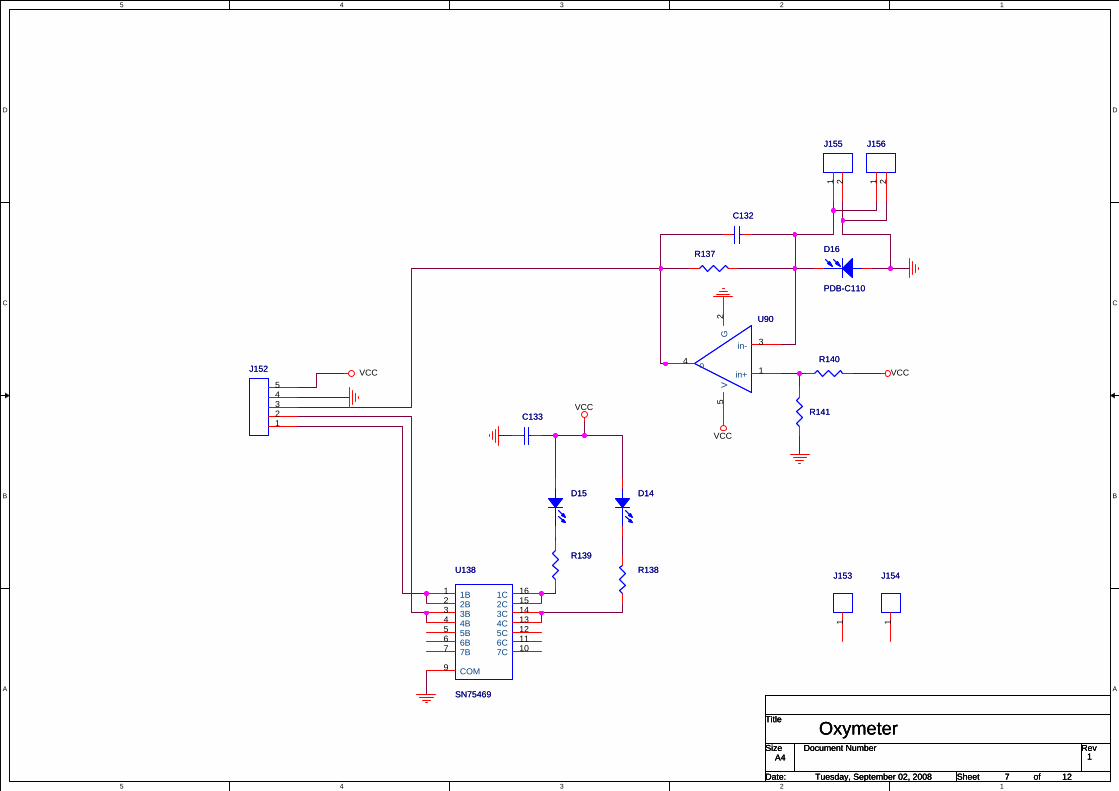
5
5
4
4
3
3
2
2
1
1
D D
C C
B B
A A
VCC
VCC
VCC
VCC
Title
Size Document Number Rev
Date: Sheet of
1
OxymeterA4
7 12Tuesday, September 02, 2008
Title
Size Document Number Rev
Date: Sheet of
1
OxymeterA4
7 12Tuesday, September 02, 2008
Title
Size Document Number Rev
Date: Sheet of
1
OxymeterA4
7 12Tuesday, September 02, 2008
R141R141
J155J155
1 2
J152J152
12345
R139R139
U90U90
in+ 1
in- 3
o4
G2
V5
J156J156
1 2
R137R137
C133C133
D14D14
J154J154
1
R138R138
D15D15
C132C132
R140R140
U138
SN75469
U138
SN75469
1B12B23B34B45B56B67B7
1C 162C 153C 144C 135C 126C 117C 10
COM9
D16
PDB-C110
D16
PDB-C110
J153J153
1
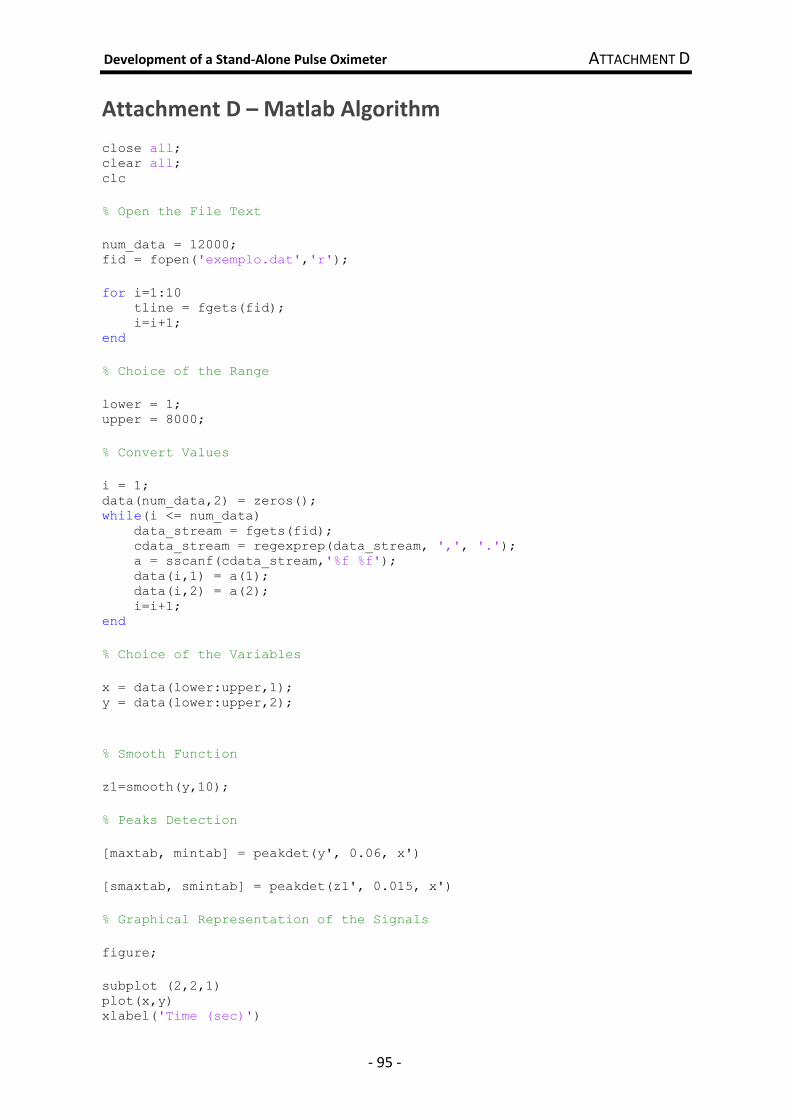
Development of a Stand-Alone Pulse Oximeter ATTACHMENT D
- 95 -
Attachment D – Matlab Algorithm
close all; clear all; clc % Open the File Text num_data = 12000; fid = fopen('exemplo.dat','r'); for i=1:10 tline = fgets(fid); i=i+1; end % Choice of the Range lower = 1; upper = 8000; % Convert Values i = 1; data(num_data,2) = zeros(); while(i <= num_data) data_stream = fgets(fid); cdata_stream = regexprep(data_stream, ',', '.'); a = sscanf(cdata_stream,'%f %f'); data(i,1) = a(1); data(i,2) = a(2); i=i+1; end % Choice of the Variables x = data(lower:upper,1); y = data(lower:upper,2); % Smooth Function z1=smooth(y,10); % Peaks Detection [maxtab, mintab] = peakdet(y', 0.06, x') [smaxtab, smintab] = peakdet(z1', 0.015, x') % Graphical Representation of the Signals figure; subplot (2,2,1) plot(x,y) xlabel('Time (sec)')

Development of a Stand-Alone Pulse Oximeter ATTACHMENT D
- 96 -
ylabel('Voltage (V)') subplot (2,2,2) plot(x,z1) xlabel('Time (sec)') ylabel('Voltage (V)') subplot (2,2,3) plot(x,y,'b-',... mintab(:,1), mintab(:,2), 'g*',... maxtab(:,1), maxtab(:,2), 'r*'); xlabel('Time (sec)') ylabel('Voltage (V)') subplot (2,2,4) plot(x,z1,... smintab(:,1), smintab(:,2), 'g*',... smaxtab(:,1), smaxtab(:,2), 'r*'); xlabel('Time (sec)') ylabel('Voltage (V)')
fclose(fid);
% Heart Rate heartbeat1= length (maxtab)*6 heartbeat2= length (smaxtab)*6
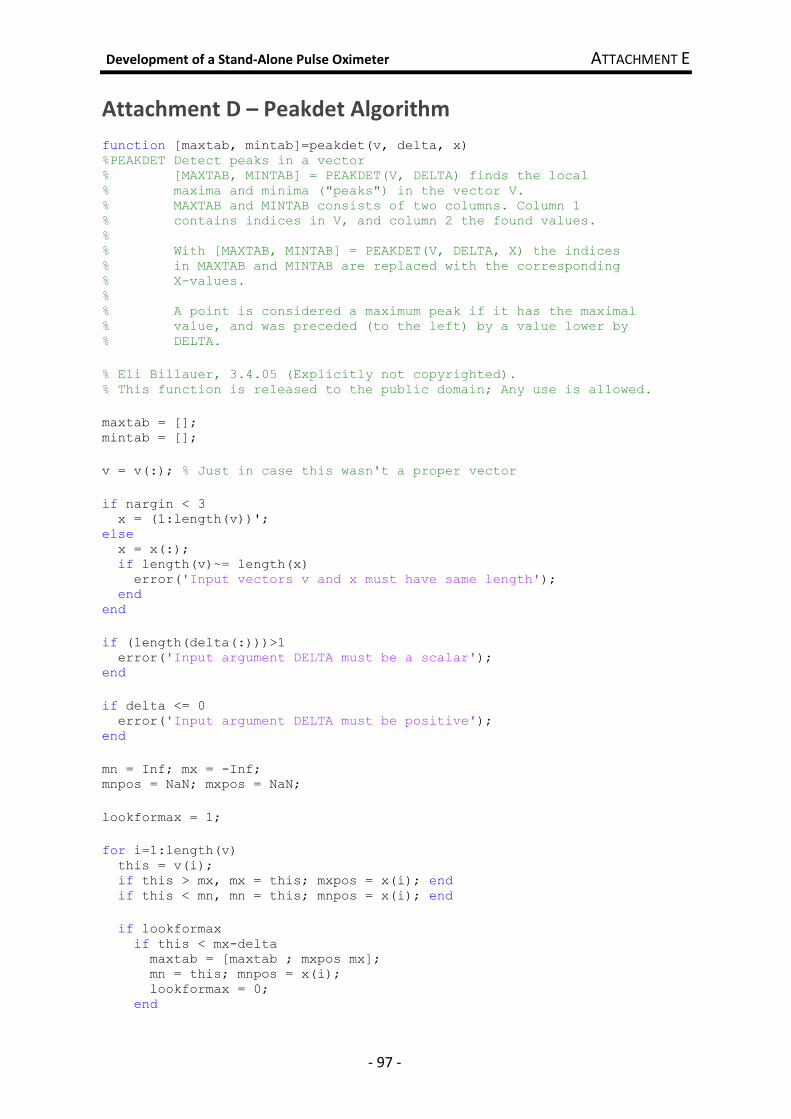
Development of a Stand-Alone Pulse Oximeter ATTACHMENT E
- 97 -
Attachment D – Peakdet Algorithm
function [maxtab, mintab]=peakdet(v, delta, x) %PEAKDET Detect peaks in a vector % [MAXTAB, MINTAB] = PEAKDET(V, DELTA) finds the local % maxima and minima ("peaks") in the vector V. % MAXTAB and MINTAB consists of two columns. Column 1 % contains indices in V, and column 2 the found values. % % With [MAXTAB, MINTAB] = PEAKDET(V, DELTA, X) the indices % in MAXTAB and MINTAB are replaced with the corresponding % X-values. % % A point is considered a maximum peak if it has the maximal % value, and was preceded (to the left) by a value lower by % DELTA. % Eli Billauer, 3.4.05 (Explicitly not copyrighted). % This function is released to the public domain; Any use is allowed. maxtab = []; mintab = []; v = v(:); % Just in case this wasn't a proper vector if nargin < 3 x = (1:length(v))'; else x = x(:); if length(v)~= length(x) error('Input vectors v and x must have same length'); end end if (length(delta(:)))>1 error('Input argument DELTA must be a scalar'); end if delta <= 0 error('Input argument DELTA must be positive'); end mn = Inf; mx = -Inf; mnpos = NaN; mxpos = NaN; lookformax = 1; for i=1:length(v) this = v(i); if this > mx, mx = this; mxpos = x(i); end if this < mn, mn = this; mnpos = x(i); end if lookformax if this < mx-delta maxtab = [maxtab ; mxpos mx]; mn = this; mnpos = x(i); lookformax = 0; end

Development of a Stand-Alone Pulse Oximeter ATTACHMENT E
- 98 -
else if this > mn+delta mintab = [mintab ; mnpos mn]; mx = this; mxpos = x(i); lookformax = 1; end end end

Development of a Stand-Alone Pulse Oximeter ATTACHMENT G
- 99 -
Attachment F
LED’s Driver Circuit

0
0
1
1
2
2
3
3
4
4
5
5
6
6
7
7
8
8
A A
B B
C C
D D
E E
F F
G G
R3
10Ω R6
50Ω
R1
5.6kΩ
R2
560Ω
R5
560Ω
R4
5.6kΩQ2
SMBTA05
Q5
SMBTA05
Q3
SMBT3904
Q6
SMBT3904
Q1
SMBTA55
Q4
SMBTA55
LED1 LED2
3
4
5
8
11
12
13
14
VCC
5V
VCC
5V
D3
1N4148
D4
1N4148
10
0
6
D1
1N4148
D2
1N4148
0
VCC
2
VCC
1

Development of a Stand-Alone Pulse Oximeter ATTACHMENT G
- 101 -
Attachment G
LED’s Driver Circuit (including timing)

0
0
1
1
2
2
3
3
4
4
5
5
6
6
7
7
8
8
A A
B B
C C
D D
E E
F F
G G
R3
10Ω R6
50Ω
R1
5.6kΩ
R2
560Ω
R5
560Ω
R4
5.6kΩQ2
SMBTA05
Q5
SMBTA05
Q3
SMBT3904
Q6
SMBT3904
Q1
SMBTA55
Q4
SMBTA55
LED1 LED2
3
4
5
8
11
12
13
14
VCC
5V
VCC
5V
VCC
5V
U1
LM555CM
GND
1
DIS7
OUT3
RST4
VCC
8
THR6
CON5
TRI2
R7
100kΩ
R8
1MΩ
C1
1nF
C2
10nF
7
VCC
9
15
U2A
74F00D
D3
1N4148
D4
1N4148
10
0
6
D1
1N4148
D2
1N4148
0
0
17
16
VCC
2
VCC
1
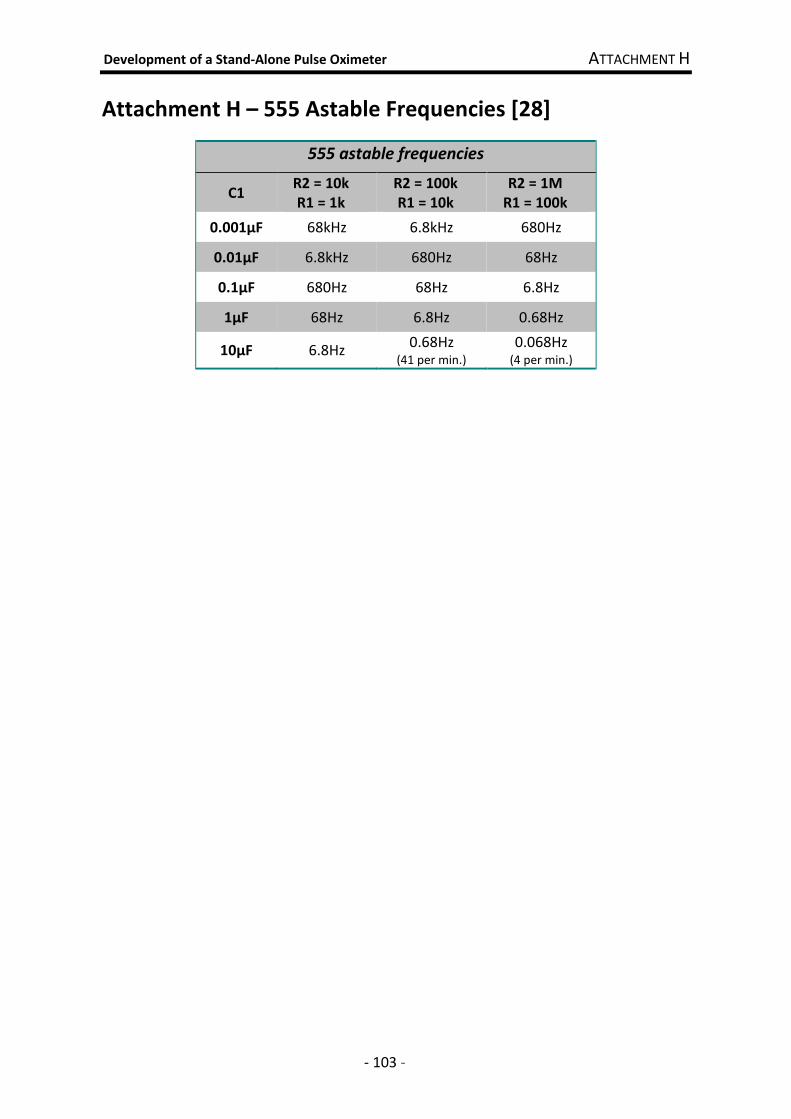
Development of a Stand-Alone Pulse Oximeter ATTACHMENT H
- 103 -
Attachment H – 555 Astable Frequencies [28]
555 astable frequencies
C1 R2 = 10k
R1 = 1k
R2 = 100k
R1 = 10k
R2 = 1M
R1 = 100k
0.001µF 68kHz 6.8kHz 680Hz
0.01µF 6.8kHz 680Hz 68Hz
0.1µF 680Hz 68Hz 6.8Hz
1µF 68Hz 6.8Hz 0.68Hz
10µF 6.8Hz 0.68Hz
(41 per min.) 0.068Hz
(4 per min.)