CARINA DE FÁTIMA RODRIGUES
FATORES QUE CONTRIBUEM PARA A VARIAÇÃO DOS NÍVEIS
PLASMÁTICOS DE BILIRRUBINA NA POPULAÇÃO PORTUGUESA
Dissertação de candidatura ao grau de Doutor apresentada à
Faculdade de Farmácia da Universidade do Porto
Orientação
Prof.ª Doutora Elsa Bronze da Rocha
Prof. Doutor Elísio Costa
Prof.ª Doutora Alice Santos Silva
Faculdade de Farmácia
Universidade do Porto
Outubro 2014

| ii
| iii
Este trabalho foi realizado no Laboratório de Bioquímica, Departamento de Ciências
Biológicas da Faculdade de Farmácia e na Escola Superior de Saúde de Bragança (Instituto
Politécnico de Bragança) em colaboração com a consulta de Gastrenterologia do Centro
Hospitalar de Vila Nova de Gaia/Espinho e com o laboratório de Genética Molecular do Instituto
Nacional Dr. Ricardo Jorge, Centro Hospitalar do Porto. A bolsa de doutoramento
(SFRH/BD/42791/2008), da Fundação para a Ciência e Tecnologia (FCT) e Fundo Social
Europeu (FSE), foi atribuída a Carina de Fátima Rodrigues.
| iv
DECLARAÇÕES
É AUTORIZADA A REPRODUÇÃO INTEGRAL DESTA DISSERTAÇÃO/TESE APENAS PARA EFEITOS
DE INVESTIGAÇÃO, MEDIANTE DECLARAÇÃO ESCRITA DO INTERESSADO, QUE A TAL SE
COMPROMETE.
AO ABRIGO DO ARTIGO 8º DO DECRETO-LEI Nº 388/70, DECLARA-SE QUE FAZEM PARTE
INTEGRANTE DESTA DISSERTAÇÃO OS SEGUINTES TRABALHOS JÁ PUBLICADOS OU EM
PUBLICAÇÃO:
Artigos em revistas de circulação internacional com arbitragem científica:
Rodrigues C, Costa E, Vieira E, Carvalho J, Santos R, Rocha-Pereira P, Santos-Silva A,
Bronze-da-Rocha E. Bilirubin is mainly dependent on UGT1A1 polymorphisms,
hemoglobin, fasting time and body mass index. Am J Med Sci. 2011; 343(2):114-8.
Rodrigues C, Costa E, Vieira E, Carvalho J, Santos R, Santos-Silva A, Bronze-da-Rocha E.
Impact of UGT1A1 gene variants on total bilirubin levels in Gilbert Syndrome patients and
in healthy subjects. Blood Cell Mol and Diseases. 2012: 48:166-172.
Rodrigues C, Rocha S, Nascimento H, Vieira E, Carvalho J, Santos R, Santos-Silva A, Costa
E, Bronze-da-Rocha E. Bilirubin levels and redox status in a young healthy population. Acta
Hematol. 2013; 130:57-60.
Rodrigues C, Costa E, Vieira E, Carvalho J, Santos R, Santos-Silva A, Bronze-da-Rocha E.
Performance of in silico tools for evaluating UGT1A1 missense variants (submetido para
publicação).
Resumos em atas de conferências científicas em revistas indexadas
Rodrigues C, Costa E, Santos-Silva A, Santos R, Bronze-da-Rocha E. Genetic and acquired
factors that modulate serum bilirubin levels. Haematologica 2009; 94, [suppl.2]: 508 abs.
1277.
Rodrigues C, Costa E, Santos R, Santos-Silva A, Bronze-da-Rocha, E. Contribution of red
cell mass and UGT1A1 alleles in serum bilirubin levels of the Portuguese population. Mol
Genet Metab 2009; 98, Issues1-2, abs. 662.
| v
Rodrigues C, Costa E, Santos R, Santos-Silva A, Bronze-da-Rocha E. Genetic and acquired
factors that modulate serum bilirubin levels Mol Genet Metab 2009; 98, Issues 1-2, abs.
661.
Artigos em revistas de circulação nacional com arbitragem científica:
Rodrigues C, Vieira R, Santos R, Carvalho, R, Santos-Silva A, Costa E, Bronze-da-Rocha E.
Variação inter-individual nos níveis de bilirrubina: o papel dos fatores genéticos e
adquiridos. Bioanálise. (Ano VIII) 2011; 1: 5-13.
Comunicações em congressos nacionais
Rodrigues C, Costa E, Santos R, Santos-Silva A, Bronze-da-Rocha E. Fatores genéticos e
ambientais que afetam os níveis séricos de bilirrubina na população Portuguesa.
Comunicação apresentada no VII Congresso de Análises Clínicas e Saúde Pública
organizado pela Sociedade Portuguesa de Bioanalistas Clínicos, Porto. Bioanálise. (Ano
VIII) 2009; 1: 26-27.
Rodrigues C, Vieira R, Santos R, Carvalho, R, Santos-Silva A, Costa E, Bronze-da-Rocha E.
Variação inter-individual nos níveis de bilirrubina: o papel dos fatores genéticos e
adquiridos Comunicação apresentada no IX Congresso de Análises Clínicas e Saúde Pública
organizado pela Sociedade Portuguesa de Bioanalistas Clínicos, Costa da Caparica. (Ano VI)
Bioanálise. 2011; 1:41.

| vi
| vii
AGRADECIMENTOS
As minhas primeiras palavras de agradecimento são endereçadas à Professora Elsa
Bronze da Rocha, orientadora desta dissertação, para lhe agradecer o facto de me ter dado
a privilégio de trabalhar com ela e pela sua disponibilidade, pelo seu profissionalismo e
dedicação ao trabalho, para além de toda a ajuda concedida e paciência nos momentos mais
difíceis.
Ao Professor Elísio Costa que possibilitou, desde a primeira hora, a concretização
deste projeto, sem a sua orientação não teria sido possível. Gostaria ainda de sublinhar o
entusiasmo demonstrado e a ajuda facultada.
À Professora Alice Santos-Silva, gostaria de lhe agradecer ter aceite ser minha
coorientadora e agradecer-lhe a disponibilidade, os conhecimentos que me transmitiu.
A todos os colegas, colaboradores e funcionários do Laboratório de Bioquímica da
Faculdade de Farmácia da Universidade do Porto em geral, com quem partilhei o
Laboratório, gostaria de lhes agradecer toda a ajuda e apoio concedidos.
À minha amiga Emília Vieira pelo apoio incondicional, e pela ajuda na realização das
análises no Laboratório de Biologia Molecular.
À Doutora Rosário Santos pela disponibilização de meios no Laboratório de Biologia
Molecular do Serviço de Genética Média (Instituto Nacional Dr. Ricardo Jorge) e a todos os
técnicos que lá trabalham, sempre tiveram uma palavra amiga e de incentivo.
Ao Doutor João de Carvalho gostaria de agradecer toda a informação e ajuda que me
facultou na avaliação clínica dos doentes com Síndrome de Gilbert.
À Profª Helena Pimentel, Diretora da Escola Superior de Saúde do Instituto
Politécnico de Bragança, gostaria de agradecer a disponibilização de meios para a realização
da colheita de dados e os dias de ausência que me, sem os quais, não teria sido possível
desenvolver esta dissertação.
Agradeço ainda à Fundação para a Ciência e Tecnologia a bolsa de doutoramento que
me atribuiu (SFRH/BD/42791/2008).
Ao Dr. Adam Hospital da Universidade de Barcelona (PMUT) e ao Dr. Ivan Adzhubey
(Polyphen2), da escola de Medicina de Harvard gostaria de agradecer a prontidão com que
me ajudaram na aplicação dos algoritmos que eles próprios desenvolveram.
A todos os meus amigos e familiares, gostaria de lhes agradecer a compreensão e apoio
ao longo destes anos de trabalho.

| viii
| ix
RESUMO
A bilirrubina (BL) é um pigmento biliar que resulta do catabolismo das hemeproteínas
e um importante marcador bioquímico utilizado no diagnóstico e monitorização de doenças
hepáticas e hematológicas. A elevada concentração deste metabolito no plasma pode estar
associada a perturbações na sua produção, metabolismo e/ou excreção. A enzima que
catalisa a conjugação da BL, a uridina difosfato glicuronil transferase 1A1 (UGT1A1)
promove a ligação da BL, lipossolúvel, a duas moléculas de ácido glicurónico, tornando-a
hidrossolúvel para ser excretada através dos canalículos biliares. A alteração metabólica
mais prevalente na população caucasiana é a Síndrome de Gilbert (SG), uma patologia
benigna, caraterizada por hiperbilirrubinémia moderada, na ausência de hemólise ou
disfunção hepática. A variante mais frequente associada a esta síndrome é a duplicação TA
na posição c.-41_-40dupTA (variante UGT1A1*28) localizada na região promotora do gene
UGT1A1. O alelo normal apresenta seis repetições, A[TA]6TAA, e o alelo mutado sete,
A[TA]7TAA, o que causa uma redução na transcrição do gene em cerca 30% do normal e,
consequentemente, um aumento da concentração de BL não conjugada. Em concentrações
muito elevadas, como é observado nas crianças com síndrome de Crigler-Najjar tipo I (SCN-
I) ou tipo II (SCN-II), a BL pode ser extremamente tóxica. No entanto, é a sua capacidade
antioxidante, anti-inflamatória e anti-carcinogénica que, nos últimos 20 anos, tem
motivado os investigadores a realizar inúmeros estudos epidemiológicos e experimentais no
sentido de esclarecerem quais os mecanismos envolvidos no seu potencial efeito protetor.
Na população em geral, há vários fatores que se sabe influenciarem os níveis
plasmáticos de bilirrubina (NPB), incluindo fatores genéticos e não genéticos. Assim, o
objetivo deste estudo foi analisar a contribuição de variáveis ambientais, assim como
alterações no gene UGT1A1 (região reguladora) na variação dos NPB. Foi também objetivo
deste estudo avaliar o impacto de outras variantes no UGT1A1 (tanto na região reguladora
e como na codificante) nos níveis de bilirrubina de indivíduos normais e com SG, assim
como a influência da hiperbilirrubinémia ligeira em alguns biomarcadores de stress
oxidativo.
Foram incluídos neste trabalho 186 jovens estudantes da região Norte de Portugal,
selecionados aleatoriamente, e 45 indivíduos com diagnóstico clínico de SG. Foram
avaliados na amostra de indivíduos sem SG, variáveis não genéticas, nomeadamente hábitos
tabágicos, consumo de álcool, aporte calórico, índices antropométricos, parâmetros
bioquímicos e hematológicos, perfil lipídico e marcadores de stress oxidativo, assim como
variáveis genéticas, nomeadamente, a pesquisa da duplicação TA no promotor do UGT1A1.
Nos 45 indivíduos com diagnóstico clínico de SG e em 161 indivíduos sem SG, para além da
pesquisa da duplicação TA no promotor do gene, foram ainda sequenciados diretamente os
| x
5 exões e a região gtPBREM (c.-3576 a c.-3209) do UGT1A1. Adicionalmente, foi
determinada a capacidade preditiva de 15 ferramentas bioinformáticas para avaliarem a
patogenicidade de mutações pontuais não sinonímias (nsSNP) neste gene. A partir desta
informação foi possível predizer o fenótipo das novas variantes do gene UGT1A1 descritas
pela primeira vez neste estudo e de outras previamente publicadas mas sem estudos
funcionais.
Os resultados obtidos demonstraram que na população em geral, a presença da
duplicação TA (c.-41_40dupTA), a concentração de hemoglobina, o índice de massa
corporal e o tempo de jejum noturno são variáveis independentes, significativamente
associadas a variações da concentração de BL total. Foi confirmado o papel antioxidante da
bilirrubina na população em geral, uma vez que os indivíduos com hiperbilirrubinémia
ligeira apresentavam uma redução na lipoperoxidação e na lesão oxidativa dos eritrócitos.
Nos indivíduos com SG, os níveis de bilirrubina foram maioritariamente condicionados pela
presença de homozigotia para a variante c.-41_-40dupTA, e a variante c.-3279T>G estava
associada a níveis de bilirrubina mais elevados nestes doentes. Foram identificados 9
nsSNPs no gene UGT1A1, 2 já descritos na literatura (c.674T>G e c.923G>A) e 7 novos
(c.538G>C, c.643A>G, c.814A>G, c.1156G>A; c.1211T>C; c.1423C>T; c.1475T>C). A
deteção de mutações na região codificante do UGT1A1, em indivíduos com SG, estava
associada a NPB mais elevados. Da análise in silico, verificou-se que o método com melhor
desempenho foi o MutPred, seguido do SIFT, executado com um alinhamento múltiplo de
sequências (MSA) de ortólogos.
Em resumo, este trabalho permitiu estabelecer o polimorfismo c.-41_40dupTA, a
hemoglobina, o IMC e o jejum noturno como variáveis independentes associadas à variação
dos NPB na população em geral. Nos indivíduos com SG as concentrações de BL são
maioritariamente determinadas pela presença do polimorfismo c.-41_40dupTA, e que a
presença concomitante de outras mutações na região promotora e/ou nas regiões
codificantes contribuem para o agravamento da hiperbilirrubinémia. Verificou-se que a
capacidade preditiva dos métodos utilizados pode variar de acordo com as informações
estruturais disponíveis para uma dada proteína e do MSA usado.
Palavras-chave: bilirrubina, UGT1A1, síndrome de Gilbert, fatores ambientais, fatores genéticos, SNPs.
| xi
ABSTRACT
Bilirubin (BL) is a bile pigment that arises from the catabolism of hemeproteins and
it is an important biochemical marker for diagnosis and monitoring of hepatic and
hematologic diseases. The high concentration of this metabolite in plasma may be
associated with disturbances in production, metabolism and/or excretion. The enzyme that
catalyzes the conjugation of BL, the uridine diphosphate glucuronyl transferase 1A1
(UGT1A1) allows the BL, lipid soluble, to binds two molecules of glucuronic acid, rendering
it water soluble to be excreted via the bile canaliculi. The greatest prevalent metabolic
disorder, in the Caucasian population, is Gilbert's syndrome (GS), a benign condition,
characterized by moderate hyperbilirubinemia in the absence of hemolysis or liver
dysfunction. The most common variant associated with this syndrome is the TA duplication
at position c.-41_-40dupTA (variant UGT1A1*28) positioned in the promoter region of the
UGT1A1 gene. The normal allele has six repeats, A[TA]6TAA, and the mutated allele seven,
A[TA]7TAA, causing a decrease in the transcription of the gene in approximately 30% of
normal and, consequently, an increase in the concentration of unconjugated BL. At very
high concentrations, as described in children with Crigler-Najjar syndrome type I (SCN-I)
or type II (SCN-II), BL can be extremely toxic. However, the antioxidant, anti-inflammatory
and anti-carcinogenicity properties of bilirubin have, in the past 20 years, motivated
researchers to conduct numerous epidemiological and experimental studies to clarify the
mechanisms involved in its potential protective effect.
In the general population, there are several known factors that influence plasma levels
of bilirubin (NPB), including genetic and nongenetic. The objective of this study was to
analyze the contribution of environmental variables as well as changes in UGT1A1 gene
(regulatory region) on the variation of the NPB. It was further evaluated the impact of other
UGT1A1 variants (in the regulatory and coding regions) in bilirubin levels in normal and SG
individuals, as well as the influence of mild hyperbilirubinemia in some biomarkers of
oxidative stress.
This work included 186 young students from the northern region of Portugal,
randomly selected, and 45 individuals with a clinical diagnosis of GS. In the sample of
individuals without SG were evaluated the nongenetic variables, that included smoking
habits, alcohol consumption, calorie intake, anthropometric indices, biochemical and
hematological parameters, lipid profile and markers of oxidative stress, as well as genetic,
namely the TA duplication in the UGT1A1 promoter region. In the 45 patients clinically
diagnosed with GS and in the 161 individuals without SG, in addition to TA repeats, the 5
exons and gtPBREM region (C-3576 C.-3209) of UGT1A1 were also sequenced. Additionally,
the ability of 15 bioinformatics tools to assess the pathogenicity nonsynonymous single
| xii
nucleotide polymorphism (nsSNP) in this gene was determined, and from this information
it was possible to predict the phenotype of the new variants of the UGT1A1 described for the
first time in this study and others previously published but without functional studies.
The results showed that in the general population, the presence of TA duplication (c.-
41_40dupTA), hemoglobin concentration, the body mass index and fasting the night time
are independent variables significantly associated with variations in the concentration of
total BL. The antioxidant role of bilirubin, in the general population, has been confirmed,
since subjects with mild hyperbilirubinemia showed a reduction in lipid peroxidation and
oxidative damage of erythrocytes. In patients with SG, bilirubin levels were mostly
conditioned by the presence of homozygosity for the variant C-41_-40dupTA, and that the
variant C-3279T> G was associated with higher levels of bilirubin in these patients. From
the 9 nsSNPs identified in the UGT1A1, 2 were already described in the literature (c.674T>
C and c.923G> A) and 7 were new (c.538G> C, c.643A> G, c.814A> G, c. 1156G> A; c.1211T>
C; c.1423C> T; c.1475T> C). Detection of mutations in the coding region of the UGT1A1, in
patients with SG, was associated with higher NPB. The in silico analysis showed that the
method with best performing was MutPred, followed by the SIFT performed with a multiple
sequence alignment (MSA) of orthologs.
In summary, this study established that the polymorphism c.-41_40dupTA,
hemoglobin, BMI and an overnight fast are independent variables associated with variation
in the NPB in the general population. In individuals with SG, concentrations of BL are
mainly determined by the presence of the c.-41_40dupTA polymorphism, and the
concomitant presence of other mutations in the promoter and/or region in the coding
regions contribute to the worsening of hyperbilirubinemia. It was found that the predictive
value of the methods employed can vary with structural information available for a given
protein and MSA employed.
Keywords: bilirubin, UGT1A1, Gilbert's syndrome, environmental factors, genetic factors,
SNPs.
| xiii
ÍNDICE
RESUMO ix
ABSTRACT xi
ÍNDICE DE FIGURAS xv
ÍNDICE DE TABELAS xvi
ABREVIATURAS xvii
CAPÍTULO I – INTRODUÇÃO 1 1. A bilirrubina 3
1.1 Propriedades químicas 3
1.1.1 Estrutura química 3
1.1.2 Fotoisómeros 4
1.1.3 Diferentes frações plasmáticas e métodos de quantificação 5
1.1.4 Transporte e ligação a diferentes proteínas 6
1.2 Metabolismo 6
1.2.1 Formação da bilirrubina 6
1.2.2 Metabolismo hepático 8
1.2.3 Excreção renal e intestinal 12 2. Fatores não genéticos que condicionam os níveis de bilirrubina 12
2.1 Género, idade e etnia 13
2.2 Fatores adquiridos 13
2.3 Outras variáveis associadas a variação da bilirrubina 14 3. Fatores genéticos 15
3.1 Doenças hereditárias da conjugação e transporte da bilirrubina 15
3.1.1 Síndrome de Gilbert 16
3.1.2 Síndromes de Crigler-Najjar 17
3.1.3 Síndrome de Durbin-Johnson 18
3.1.4 Síndrome de Rotor 19
3.1.5 Outros genes associados a variação plasmática da bilirrubina 20
| xiv
3.3 Implicações da Síndrome de Gilbert noutras patologias 21
3.3.1 Monitorização de doenças 21
3.3.2 Tratamento farmacológico: farmacogenética 22
3.4 A enzima UGT1A1 23
3.4.1 Organização genómica das UGTAs 24
3.3.3 Análises in silico da proteína 27 4. Abordagem clínica 29
4.1 Hiperbilirrubinémia não conjugada 29
4.2 Hiperbilirrubinémia conjugada 31
4.3 Diagnóstico diferencial 32 5. Propriedades da bilirrubina 34
5.1 Efeito protetor 34
5.1.1 Mecanismos bioquímicos/moleculares 34
5.1.2 Estudos epidemiológicos e clínicos 37
5.2 Toxicidade da bilirrubina 40
CAPÍTULO II – Objetivos 43
CAPÍTULO III – Publicações 47
Artigo I 49
Artigo II 57
Artigo III 67
Artigo IV 73
CAPÍTULO IV – Discussão Geral e Conclusões 95
REFERÊNCIA BIBLIOGRÁFICAS 109
ANEXOS 145
| xv
ÍNDICE DE FIGURAS
Figura 1. Estrutura química da molécula de bilirrubina. 4
Figura 2. Os 5 fotoisómeros e as suas vias fotoquímicas de inter-conversão 4
Figura 3. Fontes de bilirrubina. 7
Figura 4. Etapas do metabolismo da BL até à sua excreção e reabsorção no
intestino. 9
Figura 5. Representação esquemática da regulação do transporte e
conjugação da BL pelas proteínas do hepatócito. 10
Figura 6. Estrutura química da bilirrubina diglucoronídeo. 11
Figura 7. Localização do defeito molecular das síndromes de Gilbert,
Crigler-Najjar, Durbin-Johnson e Rotor. 15
Figura 8. Organização estrutural do complexo do gene UGT1A1 humano. 24
Figura 9. Representação esquemática da proteína UGT1A1 na membrana
do REL. 25
Figura 10. Polimorfismos mais frequentes localizados no promotor e no
exão 1 do gene UGT1A1. 27
Figura 11. Modelos tridimensionais da UGT1A1. 28
Figura 12. Algoritmo para uma abordagem sistemática do doente adulto
com) hiperbilirrubinémia. 33
Figura 13. Mecanismos que podem explicar o papel protetor de bilirrubina
na progressão e inibição do processo aterosclerótico. 35
| xvi
ÍNDICE DE TABELAS
Tabela 1: Caraterísticas fisiopatológicas e clínicas das hiperbilirrubinémias
hereditárias. 16
Tabela 2.Classificação fisiológica da hiperbilirrubinémia não conjugada. 30
Tabela 3. Classificação fisiológica da hiperbilirrubinémia conjugada. 31
Tabela 4. Associação dos NPB e o risco para várias doenças. 38
| xvii
ABREVIATURAS
aa Aminoácido
Alb Albumina
ABCC3 ATP-Binding Cassette, Sub-Family C (CFTR/MRP), Member 3
ABCG2 ATP-Binding Cassette sub-family G member 2
A-GVGD Align Grantham Variance/Grantham Difference
ALT Alanina Transaminase
AST Aspartato Transaminase
BD Bilirrubina Direta
BI Bilirrubina Indireta
BC Bilirrubina Conjugada
BL Bilirrubina
BLV Biliverdina
BDG Bilirrubina Diglucoronídeo
BMG Bilirrubina Monoglucorunídeo
BNC Bilirrubina não conjugada
BR Biliverdina Redutase
BT Bilirrubina Total
BVR Biliverdina Redutase
CMHG Concentração Média de Hemoglobina Globular
CONDEL Consensus deleteriousness
CT Colesterol Total
DAC Doença Arterial Coronária
DCV Doença Cardiovascular
DNA Ácido Desoxirribonucleico
ECO Ecografia
FA Fosfatase Alcalina
FATHMM Functional Analysis through Hidden Markov models
GB Glóbulos Brancos
GT Gama Glutamil Transferase
GV Glóbulos Vermelhos
GWAS Genome Wide Association Studies
Hansa Prediction of neutral mutations
Hb Hemoglobina
Ht Hematócrito
HDL-C Lipoproteína de Alta Densidade-Colesterol
HGM Hemoglobina Globular Média
HO Heme Oxigenase
HPLC Cromatografia Líquida de Alta Eficiência
| xviii
ID Número de identificação na base de dados
IMC Índice de Massa Corporal
INR Relação Normalizada Internacional
LDL-C Lipoproteína de Baixa Densidade-Colesterol
LGH Fator de Crescimento Hepático
MAPK Mitogen Activated Protein Kinase
MAPP Multivariate analysis of protein polymorphism
MCP-1 Proteína Quimiotáxica do monócito 1
MRP2 Multidrug Resistance-associated Protein 2
mRNA RNA mensageiro
MutPred Classify an amino acid substitution
NADPH Dinucleótido de Dicotinamida e Adenina
NOS Espécies Reativas de Nitrogénio
NPB Níveis Plasmáticos de Bilirrubina
nSNP non Synonymous Single Nucleotide Polymorphism
OATP1B1 Organic Anion-Transporting Polypeptide Protein B1
PANTHER Protein analysis through evolutionary relationships
PARP Poly ADP Ribose Polymerase
PBREM Phenobarbital (PB)-responsive Enhancer Module
PCR Proteína C Reativa
PGC Percentagem de Gordura Corporal
PhD-SNP Predictor of human deleterious SNPs
Polyphen Polymorphism Phenotyping
PMUT Prediction of pathological mutations on proteins
RDW Coeficiente de distribuição do eritrócito
REL Retículo Endoplasmático Liso
RNA Ácido Ribonucleico
ROS Espécies Reativas de Oxigénio
SCN-I Síndrome Crigler-Najjar tipo I
SCN-II Síndrome Crigler-Najjar tipo II
SIFT Sorting Intolerant From Tolerant
SDJ Síndrome de Dubin-Johnson
SG Síndrome de Gilbert
SLCO1B1 Organic Anion-Transporting Polypeptide OATP1B1
SRE Sistema Retículo Endotelial
SNAP Screening for nonaceptable polymorphisms
SNP Single Nucleotide Polymorphism
SNPeffect Molecular phenotyping of coding non-synonymous SNPs
SNPs&GO Gene Ontology (GO) database, in the form of a GO-based score
SRT Síndrome de Rotor
| xix
TAS Estado de Antioxidantes Total
TBARS Espécies Reativas do Ácido Tiobarbitúrico
TC Tomografia Computadorizada
TNF-α Fator de Necrose Tumoral
UGTs Uridina Glutamil Transferases
UGT1A1 Uridina Difosfato Glicuronil Transferase Polipeptídeo 1A1
Urob Urobilinogénio
VLDL-C Lipoproteína de Muito Baixa Densidade
VSMC Células de Músculo Liso Vascular
Xvar Mutation Assessor

CAPÍTULO I – INTRODUÇÃO

Fatores que contribuem para a variação dos níveis plasmáticos de bilirrubina
| 2
Fatores que contribuem para a variação dos níveis plasmáticos de bilirrubina
| 3
1. A Bilirrubina
A bilirrubina (BL) é um pigmento amarelo-alaranjado que resulta do catabolismo das
hemeproteínas (1). Este metabolito pertence à superfamília de compostos tetrapirrólicos,
um dos grupos de moléculas mais conservados em organismos vivos. A BL tem vindo a ser
alvo de estudo há mais de três séculos por químicos, bioquímicos, biólogos e investigadores
das mais diversas áreas. A determinação da concentração deste metabolito tem sido usada
no diagnóstico clínico para a avaliação da função hepática e monitorização de algumas
doenças hepáticas e hematológicas (2). Muitas doenças hereditárias, relacionadas com a
hiperbilirrubinémia continuam a ser alvo de pesquisa, no sentido de avançar no seu
diagnóstico e tratamento (3, 4).
A concentração de BL no plasma constitui um “dualismo bioquímico”, dado que em
elevadas concentrações é um produto tóxico e em concentrações moderadas é um potente
antioxidante. Apesar de ser um marcador bioquímico muito utilizado, o seu significado
biológico não está, ainda, totalmente esclarecido.
1.1 Propriedades químicas
1.1.1 Estrutura química
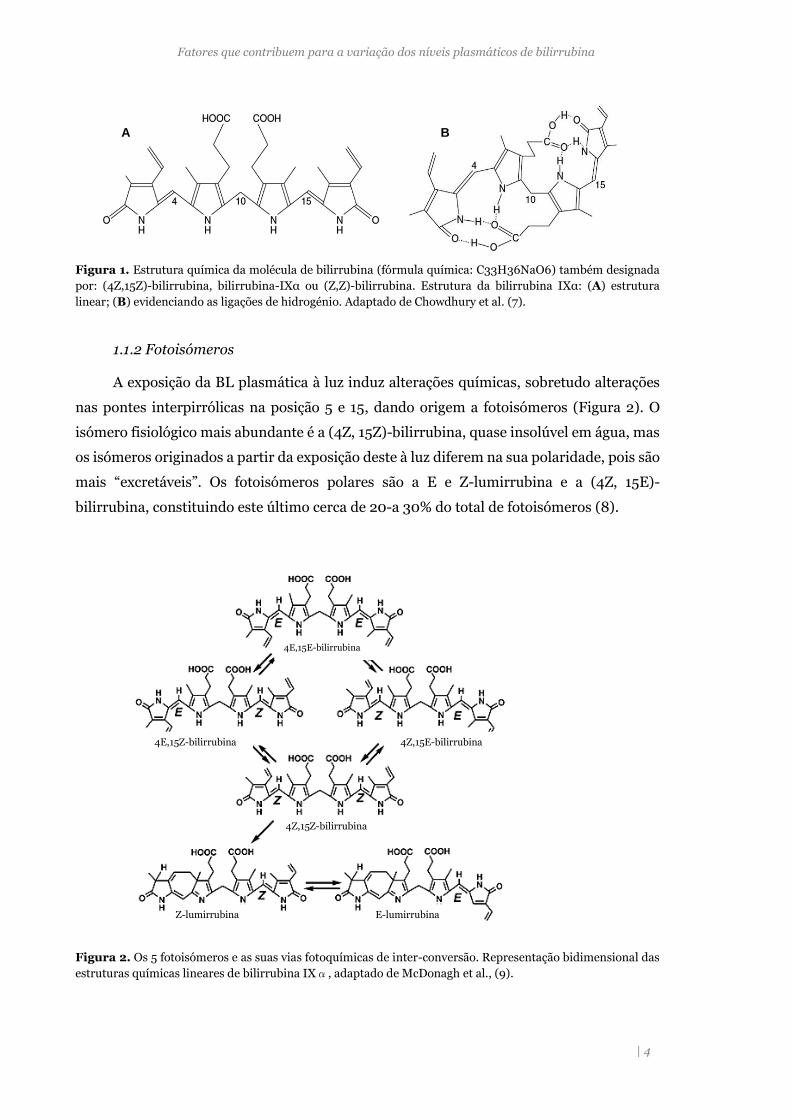
A BL é constituída por quatro anéis pirrol, ligados por dois grupos de metileno (-CH=)
e um grupo meteno (-CH2=), cujo peso molecular é 584 Kd. A fórmula química desta
molécula é 1,8-dioxo-1,3,6, tetrametil-2,8-divinilbiladieno-a, c-ácido dipropiónico
(C33H36NaO6) (5). A forma biossintética é conhecida por bilirrubina-IXα (Figura 1A) que
tem uma conformação Z-Z trans, para duas duplas ligações entre carbonos 4 e 5, 15 e 16
(bilirrubina-4Z,15Z). Apresenta uma estrutura curvada (figura 1B), na qual os grupos
carboxílicos do ácido propiónico estão ligados por pontes de hidrogénio aos nitrogénios dos
anéis pirrólicos.
O estudo da sua estrutura cristalográfica evidenciou que, apesar da presença do ácido
propiónico, dos aminoácidos e do oxigénio, a união destes grupos polares faz com que a BL
seja uma molécula insolúvel em água, a pH neutro, necessitando de modificação química
para poder ser excretada.
No seu estado cristalino a BL não apresenta a forma linear, mas uma configuração de
telha (6). Trabalhos posteriores mostraram que a conformação em telha ocorre em solução,
embora a molécula de BL se possa interconverter entre os dois enantiómeros (P ou M),
mantendo a rede de ligações de hidrogénio interna (6).
Fatores que contribuem para a variação dos níveis plasmáticos de bilirrubina
| 4
Figura 1. Estrutura química da molécula de bilirrubina (fórmula química: C33H36NaO6) também designada
por: (4Z,15Z)-bilirrubina, bilirrubina-IXα ou (Z,Z)-bilirrubina. Estrutura da bilirrubina IXα: (A) estrutura
linear; (B) evidenciando as ligações de hidrogénio. Adaptado de Chowdhury et al. (7).
1.1.2 Fotoisómeros
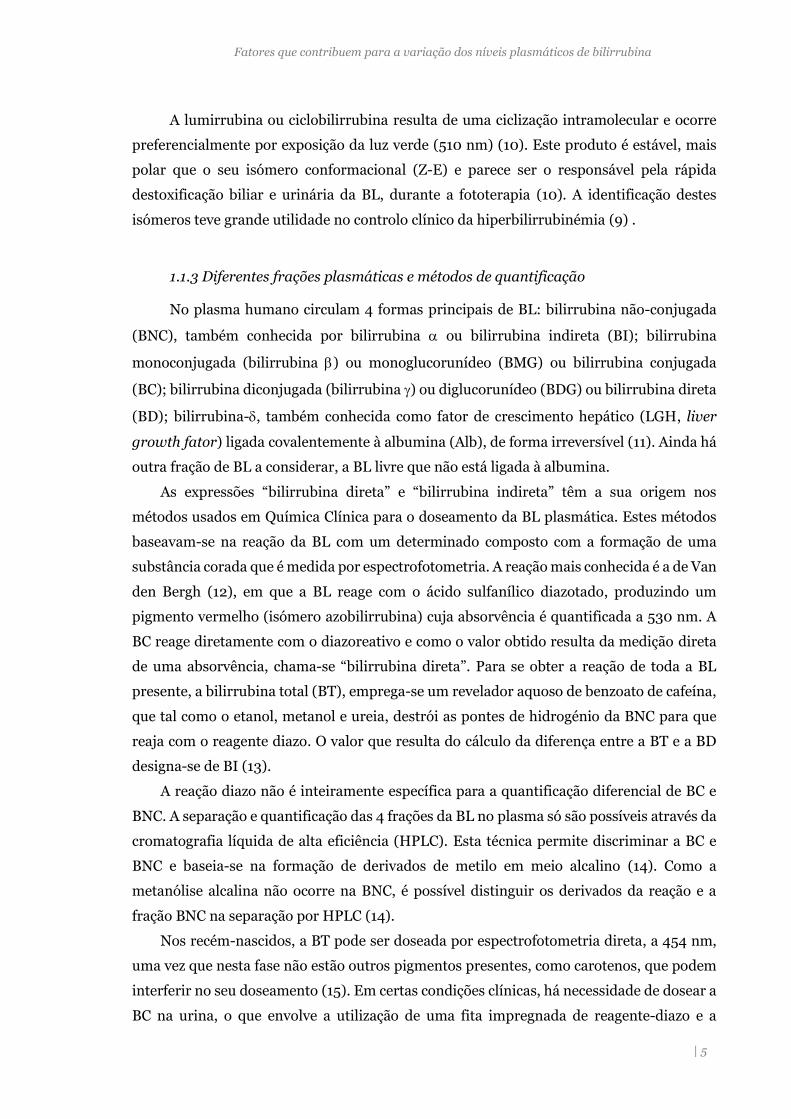
A exposição da BL plasmática à luz induz alterações químicas, sobretudo alterações
nas pontes interpirrólicas na posição 5 e 15, dando origem a fotoisómeros (Figura 2). O
isómero fisiológico mais abundante é a (4Z, 15Z)-bilirrubina, quase insolúvel em água, mas
os isómeros originados a partir da exposição deste à luz diferem na sua polaridade, pois são
mais “excretáveis”. Os fotoisómeros polares são a E e Z-lumirrubina e a (4Z, 15E)-
bilirrubina, constituindo este último cerca de 20-a 30% do total de fotoisómeros (8).
Figura 2. Os 5 fotoisómeros e as suas vias fotoquímicas de inter-conversão. Representação bidimensional das
estruturas químicas lineares de bilirrubina IXα, adaptado de McDonagh et al., (9).
4E,15E-bilirrubina
4Z,15E-bilirrubina
4Z,15Z-bilirrubina
4E,15Z-bilirrubina
Z-lumirrubina E-lumirrubina
A
B
Fatores que contribuem para a variação dos níveis plasmáticos de bilirrubina
| 5
A lumirrubina ou ciclobilirrubina resulta de uma ciclização intramolecular e ocorre
preferencialmente por exposição da luz verde (510 nm) (10). Este produto é estável, mais
polar que o seu isómero conformacional (Z-E) e parece ser o responsável pela rápida
destoxificação biliar e urinária da BL, durante a fototerapia (10). A identificação destes
isómeros teve grande utilidade no controlo clínico da hiperbilirrubinémia (9) .
1.1.3 Diferentes frações plasmáticas e métodos de quantificação
No plasma humano circulam 4 formas principais de BL: bilirrubina não-conjugada
(BNC), também conhecida por bilirrubina ou bilirrubina indireta (BI); bilirrubina
monoconjugada (bilirrubina ) ou monoglucorunídeo (BMG) ou bilirrubina conjugada
(BC); bilirrubina diconjugada (bilirrubina ) ou diglucorunídeo (BDG) ou bilirrubina direta
(BD); bilirrubina-, também conhecida como fator de crescimento hepático (LGH, liver
growth fator) ligada covalentemente à albumina (Alb), de forma irreversível (11). Ainda há
outra fração de BL a considerar, a BL livre que não está ligada à albumina.
As expressões “bilirrubina direta” e “bilirrubina indireta” têm a sua origem nos
métodos usados em Química Clínica para o doseamento da BL plasmática. Estes métodos
baseavam-se na reação da BL com um determinado composto com a formação de uma
substância corada que é medida por espectrofotometria. A reação mais conhecida é a de Van
den Bergh (12), em que a BL reage com o ácido sulfanílico diazotado, produzindo um
pigmento vermelho (isómero azobilirrubina) cuja absorvência é quantificada a 530 nm. A
BC reage diretamente com o diazoreativo e como o valor obtido resulta da medição direta
de uma absorvência, chama-se “bilirrubina direta”. Para se obter a reação de toda a BL
presente, a bilirrubina total (BT), emprega-se um revelador aquoso de benzoato de cafeína,
que tal como o etanol, metanol e ureia, destrói as pontes de hidrogénio da BNC para que
reaja com o reagente diazo. O valor que resulta do cálculo da diferença entre a BT e a BD
designa-se de BI (13).
A reação diazo não é inteiramente específica para a quantificação diferencial de BC e
BNC. A separação e quantificação das 4 frações da BL no plasma só são possíveis através da
cromatografia líquida de alta eficiência (HPLC). Esta técnica permite discriminar a BC e
BNC e baseia-se na formação de derivados de metilo em meio alcalino (14). Como a
metanólise alcalina não ocorre na BNC, é possível distinguir os derivados da reação e a
fração BNC na separação por HPLC (14).
Nos recém-nascidos, a BT pode ser doseada por espectrofotometria direta, a 454 nm,
uma vez que nesta fase não estão outros pigmentos presentes, como carotenos, que podem
interferir no seu doseamento (15). Em certas condições clínicas, há necessidade de dosear a
BC na urina, o que envolve a utilização de uma fita impregnada de reagente-diazo e a
Fatores que contribuem para a variação dos níveis plasmáticos de bilirrubina
| 6
alteração da sua cor é proporcional à concentração da BC na urina. Este doseamento serve,
para avaliar a presença de BC, uma vez que a BNC não é excretada por esta via (16), e
também o urobilinogénio.
1.1.4 Transporte e ligação a diferentes proteínas
Uma das características importantes da bilirrubina-IX é a capacidade de ligação à
Alb e a outras proteínas que têm um papel importante no seu metabolismo. A BNC é
transportada no plasma ligada à Alb, com uma união de alta afinidade para o local de ligação
primário (17). A BL livre apresenta-se numa concentração nanomolar muito baixa que
aumenta quando a concentração molar de BL excede a da Alb, por saturação do local de
ligação (18). A ligação da BL à Alb aumenta com a idade, mas pode ser reduzida na presença
de certos fármacos (19). A BL livre correlaciona-se melhor com toxicidade da BL do que
qualquer outra fração, pelo que tem sido usada como o melhor marcador de diagnóstico e
monitorização de hiperbilirrubinémias (20). A BL também se liga a proteínas como a α-
fetoproteína, ligandina, proteínas citoplasmáticas do hepatócito (21), globalmente
designadas de glutationa-S-transferases, lipoproteínas e à membrana dos eritrócitos. A
ligação destas proteínas à BL evita que esta fique na forma livre, que é, potencialmente, mais
tóxica (22).
1.2 Metabolismo
1.2.1 Formação da bilirrubina
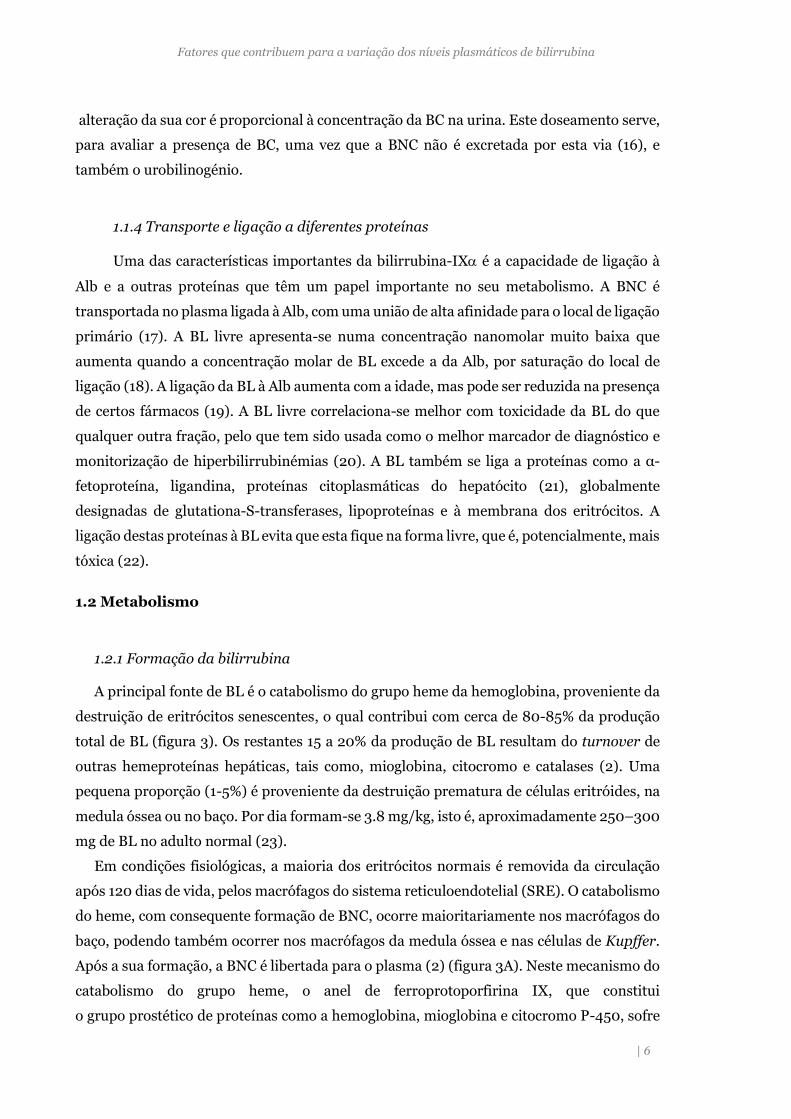
A principal fonte de BL é o catabolismo do grupo heme da hemoglobina, proveniente da
destruição de eritrócitos senescentes, o qual contribui com cerca de 80-85% da produção
total de BL (figura 3). Os restantes 15 a 20% da produção de BL resultam do turnover de
outras hemeproteínas hepáticas, tais como, mioglobina, citocromo e catalases (2). Uma
pequena proporção (1-5%) é proveniente da destruição prematura de células eritróides, na
medula óssea ou no baço. Por dia formam-se 3.8 mg/kg, isto é, aproximadamente 250–300
mg de BL no adulto normal (23).
Em condições fisiológicas, a maioria dos eritrócitos normais é removida da circulação
após 120 dias de vida, pelos macrófagos do sistema reticuloendotelial (SRE). O catabolismo
do heme, com consequente formação de BNC, ocorre maioritariamente nos macrófagos do
baço, podendo também ocorrer nos macrófagos da medula óssea e nas células de Kupffer.
Após a sua formação, a BNC é libertada para o plasma (2) (figura 3A). Neste mecanismo do
catabolismo do grupo heme, o anel de ferroprotoporfirina IX, que constitui
o grupo prostético de proteínas como a hemoglobina, mioglobina e citocromo P-450, sofre
Fatores que contribuem para a variação dos níveis plasmáticos de bilirrubina
| 7
a ação catalítica da heme oxigenase (HO). Esta enzima consome 3 moléculas de oxigénio e
requer um agente redutor, nicotinamida adenina dinucletídeo fosfato (NADPH) (figura 3B).
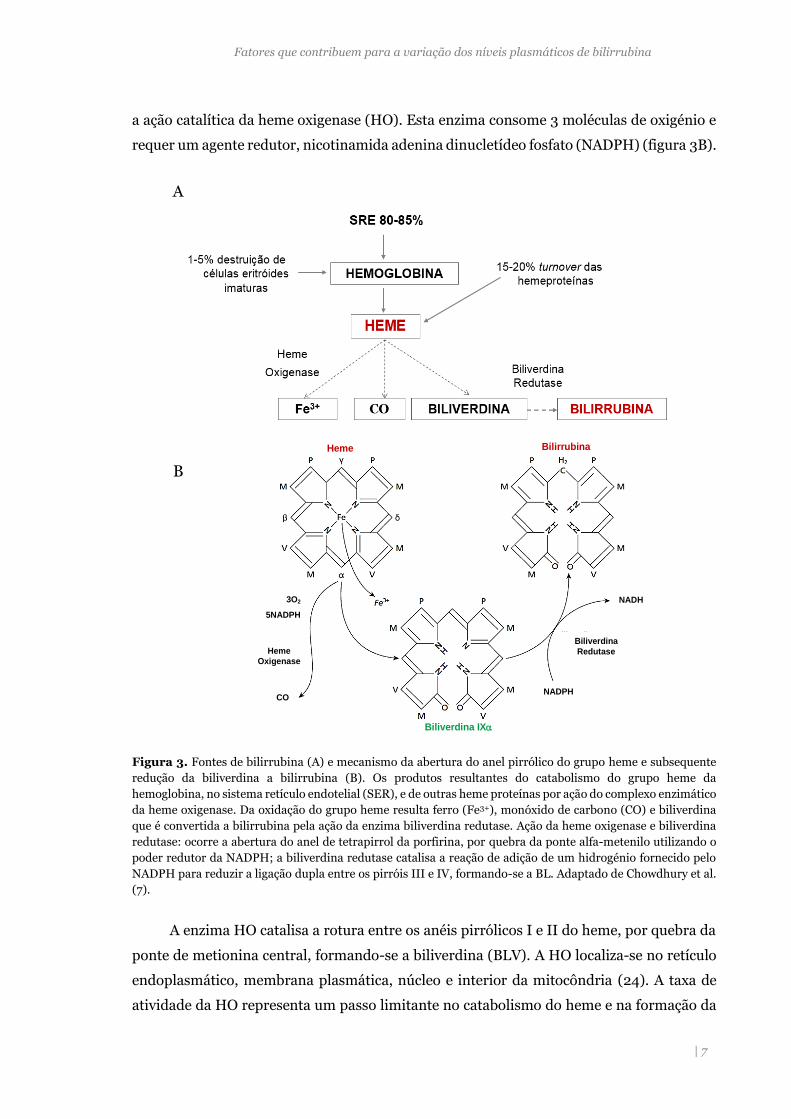
Figura 3. Fontes de bilirrubina (A) e mecanismo da abertura do anel pirrólico do grupo heme e subsequente
redução da biliverdina a bilirrubina (B). Os produtos resultantes do catabolismo do grupo heme da
hemoglobina, no sistema retículo endotelial (SER), e de outras heme proteínas por ação do complexo enzimático
da heme oxigenase. Da oxidação do grupo heme resulta ferro (Fe3+), monóxido de carbono (CO) e biliverdina
que é convertida a bilirrubina pela ação da enzima biliverdina redutase. Ação da heme oxigenase e biliverdina
redutase: ocorre a abertura do anel de tetrapirrol da porfirina, por quebra da ponte alfa-metenilo utilizando o
poder redutor da NADPH; a biliverdina redutase catalisa a reação de adição de um hidrogénio fornecido pelo
NADPH para reduzir a ligação dupla entre os pirróis III e IV, formando-se a BL. Adaptado de Chowdhury et al.
(7).
A enzima HO catalisa a rotura entre os anéis pirrólicos I e II do heme, por quebra da
ponte de metionina central, formando-se a biliverdina (BLV). A HO localiza-se no retículo
endoplasmático, membrana plasmática, núcleo e interior da mitocôndria (24). A taxa de
atividade da HO representa um passo limitante no catabolismo do heme e na formação da
Biliverdina IX
Bilirrubina
IX
Biliverdina
Redutase
Heme
CO
Heme
Oxigenase
3O2
5NADPH
NADH
NADPH
A
B
Fatores que contribuem para a variação dos níveis plasmáticos de bilirrubina
| 8
BL nos macrófagos do SRE (25). Constitui um fator importante na regulação dos níveis de
BL. A síntese de HO é induzida pelo stress oxidativo, devido à produção de radicais livres
do oxigénio, por lipopolissacarídeos bacterianos (26, 27), e ainda, pelo aumento da
concentração intracelular de heme hepática, que pode ser induzida por vários fármacos,
compostos naturais, citoquinas e fatores de crescimento (28). A BLV é reduzida a BL, numa
reação catalisada pela biliverdina redutase (BVR), também dependente do NADPH (29). A
BL formada, diz-se não conjugada (BNC), é lipossolúvel e circula no sangue ligada à
albumina, o que aumenta muito a sua solubilidade devido a dois locais de ligação para esta
molécula e também impede que seja excretada para a urina. Em indivíduos saudáveis, cerca
de 99,9% da BNC circula sob a forma deste complexo com a albumina (21).
1.2.2 Metabolismo hepático
O fígado tem uma função central no metabolismo da BL, sendo responsável pela sua
captação, armazenamento, conjugação e excreção (figura 4). A descoberta do mecanismo
da conjugação da BL foi um dos marcos mais importantes na investigação desta molécula
(30) pois permitiu que pudesse ser usada no diagnóstico e tratamento de várias patologias.
A bilirrubina é uma substância que faz parte dos sais biliares que são excretados na bílis.
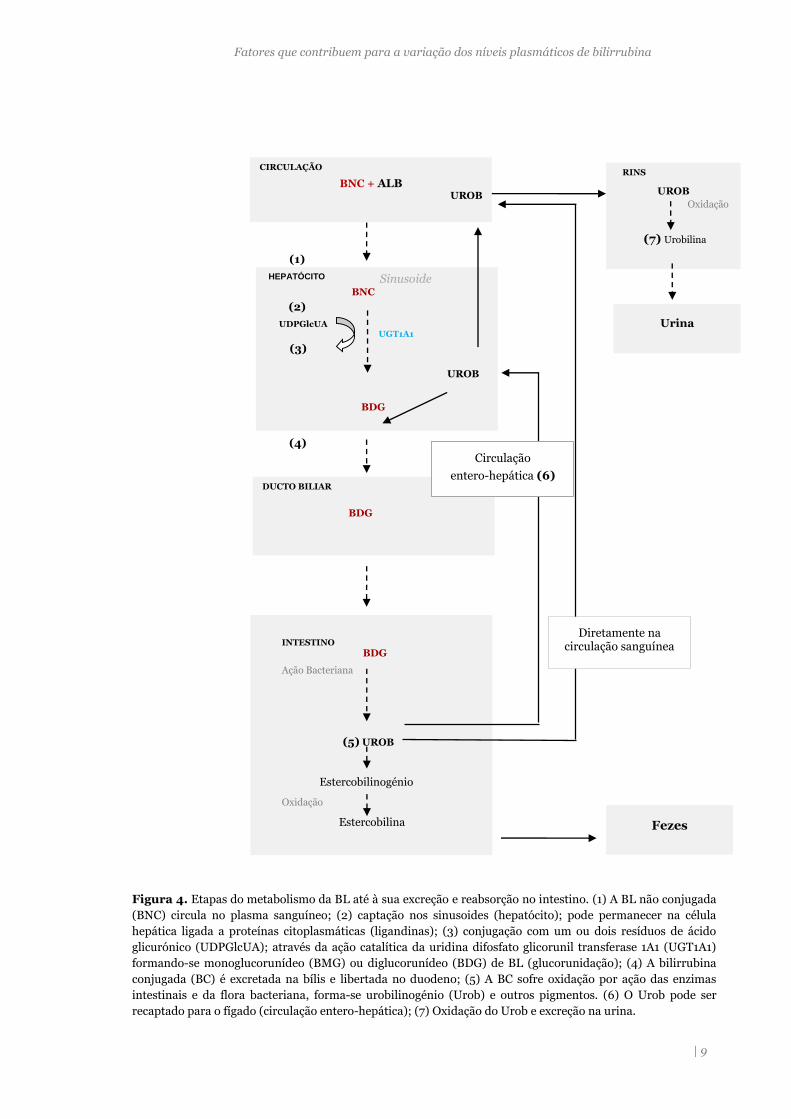
A figura 4 apresenta as várias etapas do metabolismo da BL até à sua excreção e
reabsorção no intestino. A BNC, que circula no plasma sanguíneo, é captada na superfície
sinusoidal do hepatócito onde pode permanecer ligada a proteínas citoplasmáticas. Ao
deslocar-se para o retículo endoplasmático liso (REL) sofre conjugação com um ou dois
resíduos de ácido glicurónico (UDPGlcUA) através da ação catalítica da uridina difosfato
glucorunil transferase 1A1 (UGT1A1) formando-se monoglucorunídeo (BMG) ou
diglucorunídeo (BDG) de BL (glucuronidação). No intestino, a BC formada sofre oxidação,
por ação das enzimas intestinais e da flora bacteriana e forma-se urobilinogénio (Urob) e
outros pigmentos. A maior parte do Urob vai ser excretado nas fezes, quer sobre a forma
não alterada, quer oxidado. O restante entra na circulação entero-hepática e re-excretado
pelo fígado. Uma pequena fração pode ser expelida na urina.
Como já foi referido, a BNC circula no plasma num complexo ligada à Alb (BL+Alb),
que entra no hepatócito pela sua superfície sinusoidal (figura 5). O complexo passa pelas
células finas e descontínuas, com poros, que revestem os sinusóides endoteliais e atingem o
espaço de Disse, onde têm contato direto com a superfície sinusoidal basolateral do
hepatócito (31). Considerando que a BNC é lipossolúvel deveria, facilmente, atravessar por
difusão a camada lipídica da membrana do hepatócito. Contudo, este mecanismo não
Fatores que contribuem para a variação dos níveis plasmáticos de bilirrubina
| 9
Figura 4. Etapas do metabolismo da BL até à sua excreção e reabsorção no intestino. (1) A BL não conjugada
(BNC) circula no plasma sanguíneo; (2) captação nos sinusoides (hepatócito); pode permanecer na célula
hepática ligada a proteínas citoplasmáticas (ligandinas); (3) conjugação com um ou dois resíduos de ácido
glicurónico (UDPGlcUA); através da ação catalítica da uridina difosfato glicorunil transferase 1A1 (UGT1A1)
formando-se monoglucorunídeo (BMG) ou diglucorunídeo (BDG) de BL (glucorunidação); (4) A bilirrubina
conjugada (BC) é excretada na bílis e libertada no duodeno; (5) A BC sofre oxidação por ação das enzimas
intestinais e da flora bacteriana, forma-se urobilinogénio (Urob) e outros pigmentos. (6) O Urob pode ser
recaptado para o fígado (circulação entero-hepática); (7) Oxidação do Urob e excreção na urina.
HEPATÓCITO
BNC
RINS
UROB
(7) Urobilina
Urina
UDPGlcUA UGT1A1
UROB
BDG
(1)
Sinusoide
(2)
(3)
(4)
INTESTINO
BDG
Ação Bacteriana
(5) UROB
Estercobilinogénio
Oxidação
Estercobilina
Fezes
CIRCULAÇÃO
BNC + ALB UROB
DUCTO BILIAR
BDG
Circulação
entero-hepática (6)
Diretamente na circulação sanguínea
Oxidação
Fatores que contribuem para a variação dos níveis plasmáticos de bilirrubina
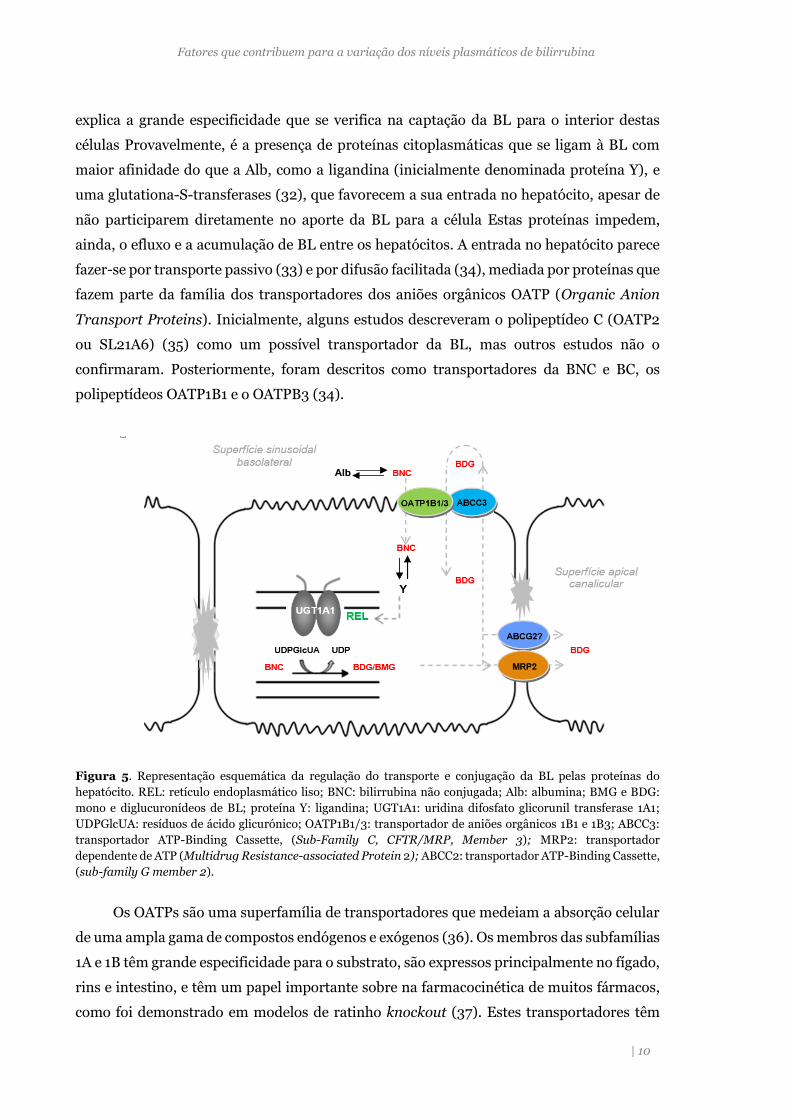
| 10
explica a grande especificidade que se verifica na captação da BL para o interior destas
células Provavelmente, é a presença de proteínas citoplasmáticas que se ligam à BL com
maior afinidade do que a Alb, como a ligandina (inicialmente denominada proteína Y), e
uma glutationa-S-transferases (32), que favorecem a sua entrada no hepatócito, apesar de
não participarem diretamente no aporte da BL para a célula Estas proteínas impedem,
ainda, o efluxo e a acumulação de BL entre os hepatócitos. A entrada no hepatócito parece
fazer-se por transporte passivo (33) e por difusão facilitada (34), mediada por proteínas que
fazem parte da família dos transportadores dos aniões orgânicos OATP (Organic Anion
Transport Proteins). Inicialmente, alguns estudos descreveram o polipeptídeo C (OATP2
ou SL21A6) (35) como um possível transportador da BL, mas outros estudos não o
confirmaram. Posteriormente, foram descritos como transportadores da BNC e BC, os
polipeptídeos OATP1B1 e o OATPB3 (34).
Figura 5. Representação esquemática da regulação do transporte e conjugação da BL pelas proteínas do
hepatócito. REL: retículo endoplasmático liso; BNC: bilirrubina não conjugada; Alb: albumina; BMG e BDG:
mono e diglucuronídeos de BL; proteína Y: ligandina; UGT1A1: uridina difosfato glicorunil transferase 1A1;
UDPGlcUA: resíduos de ácido glicurónico; OATP1B1/3: transportador de aniões orgânicos 1B1 e 1B3; ABCC3:
transportador ATP-Binding Cassette, (Sub-Family C, CFTR/MRP, Member 3); MRP2: transportador
dependente de ATP (Multidrug Resistance-associated Protein 2); ABCC2: transportador ATP-Binding Cassette,
(sub-family G member 2).
Os OATPs são uma superfamília de transportadores que medeiam a absorção celular
de uma ampla gama de compostos endógenos e exógenos (36). Os membros das subfamílias
1A e 1B têm grande especificidade para o substrato, são expressos principalmente no fígado,
rins e intestino, e têm um papel importante sobre na farmacocinética de muitos fármacos,
como foi demonstrado em modelos de ratinho knockout (37). Estes transportadores têm
Fatores que contribuem para a variação dos níveis plasmáticos de bilirrubina
| 11
sido alvo de uma pesquisa intensa no sentido de identificar os seus substratos e
compreender a forma como atuam (38).
No citosol do hepatócito, a BNC associada à ligandina, tem uma solubilidade
aumentada (22) e é transportada até ao retículo endoplasmático liso, onde vai ser conjugada
com uma ou duas moléculas de ácido glicurónico, uridino difosfato de ácido glicurónico
(UDPGlucUA), que deriva da UDP glucose, podendo formar-se BMG e BDG,
respetivamente.
A enzima que catalisa esta conjugação é a uridina difosfato glicuronil transferase,
polipeptídeo 1A1 (UGT1A1), codificada pelo gene UGT1A1, que apresenta várias isoformas,
sendo a isoforma 1A1 a mais relevante na conjugação da BL (39). A UGT1A1 é uma proteína
transmembranar, com localização preferencial no REL, possuindo um local de ligação para
BL e outro para o UDPGlucUA, na face inferior do REL (figura 5). A caraterização
bioquímica e molecular desta enzima, bem como o efeito das suas variantes génicas, serão
posteriormente abordadas.
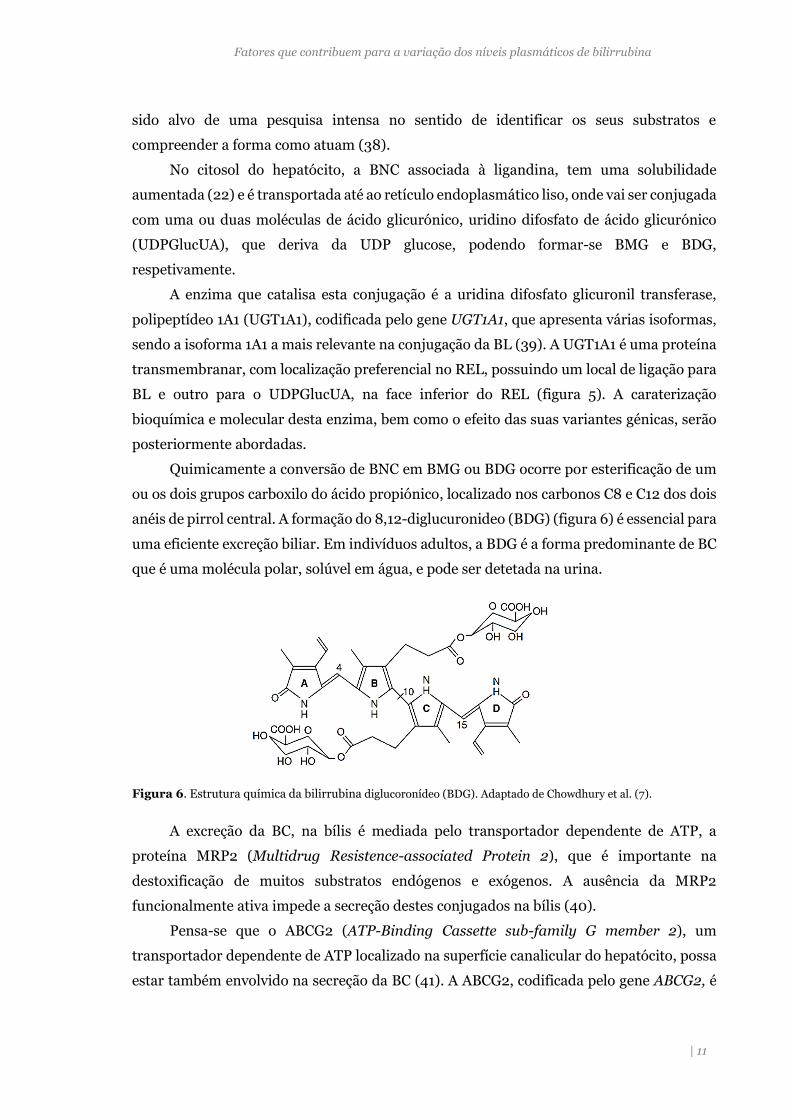
Quimicamente a conversão de BNC em BMG ou BDG ocorre por esterificação de um
ou os dois grupos carboxilo do ácido propiónico, localizado nos carbonos C8 e C12 dos dois
anéis de pirrol central. A formação do 8,12-diglucuronideo (BDG) (figura 6) é essencial para
uma eficiente excreção biliar. Em indivíduos adultos, a BDG é a forma predominante de BC
que é uma molécula polar, solúvel em água, e pode ser detetada na urina.
Figura 6. Estrutura química da bilirrubina diglucoronídeo (BDG). Adaptado de Chowdhury et al. (7).
A excreção da BC, na bílis é mediada pelo transportador dependente de ATP, a
proteína MRP2 (Multidrug Resistence-associated Protein 2), que é importante na
destoxificação de muitos substratos endógenos e exógenos. A ausência da MRP2
funcionalmente ativa impede a secreção destes conjugados na bílis (40).
Pensa-se que o ABCG2 (ATP-Binding Cassette sub-family G member 2), um
transportador dependente de ATP localizado na superfície canalicular do hepatócito, possa
estar também envolvido na secreção da BC (41). A ABCG2, codificada pelo gene ABCG2, é
Fatores que contribuem para a variação dos níveis plasmáticos de bilirrubina
| 12
expressa, em condições fisiológicas, na membrana apical canalicular dos hepatócitos e em
menor quantidade no rim, duodeno, íleon, cérebro e placenta (42).
Uma fração substancial dos glicuronídeos de BL pode ser reencaminhada para o pólo
sinusoidal e ser novamente excretada para o plasma por outro transportador, o ABCC3
[ATP-Binding Cassette, Sub-Family C (CFTR/MRP), Member 3 ou MRP3] (37); a BC pode
voltar para o interior do hepatócito via OATP1B1/3. (43). Tem sido proposto que este
processo de “recaptação” a montante, ou seja, perto da área portal, previna o efeito tóxico
de alguns metabolitos presentes nesses hepatócitos (37).
1.2.3 Excreção renal e intestinal
Quando os conjugados de BL atingem a porção terminal do íleon e o intestino grosso,
pode ocorrer desconjugação por ação de enzimas do intestino, no entanto, a redução da BL
é essencialmente devida à ação de beta-glicuronosidases produzidas pela flora intestinal
(44), sendo o urobilinogénio (Urob) o catabolito principal (figura 4). O Urob pode seguir
três vias: entrar na circulação sanguínea e ser reconvertido no fígado a BC, para ser
excretada de novo na bílis (ciclo enteropático do Urob; 10-20%) (45); ingressar na
circulação sanguínea e filtrado para o rim, onde é convertido a urobilina, um pigmento
amarelo que dá cor à urina (1-5%); continuar a ser degradado pela flora intestinal, sendo
oxidado a estercobilina, um pigmento castanho-avermelhado que dá cor às fezes (80-90%).
No rim, BC que passa para o filtrado glomerular, é secretada ou reabsorvida a nível
tubular (46). O facto de a BC se associar à Alb, com uma ligação menos forte do que a BNC,
faz com que a excreção renal seja apenas de 0,5 % do total de BL circulante (46). Na ausência
de glucuronidação, uma fração BL é excretada como hidróxido (47), provavelmente pela
ação do citocromo P-450 microssomal e da oxidase mitocondrial ou de outros tecidos (48).
2. Fatores não genéticos que condicionam os níveis de bilirrubina
Estão descritos na literatura inúmeros fatores que contribuem para a variação da BL
no plasma. Neste subcapítulo iremos abordar os fatores não genéticos, nomeadamente os
relacionados com estilo de vida. O impacto destes fatores foi analisado, na sua maioria
isoladamente.
Variáveis como hábitos tabágicos e a interação com fármacos e compostos dietéticos
têm sido amplamente estudados. Alguns deles estão, no entanto, dependentes de fatores
genéticos, que abordaremos posteriormente.
Fatores que contribuem para a variação dos níveis plasmáticos de bilirrubina
| 13
2.1 Género, idade e etnia
Foi demonstrado que há uma significativa diferença nos níveis plasmáticos de BL em
diferentes faixas etárias e entre homens e mulheres (49). As variações observadas entre
género têm sido atribuídas a diferenças hormonais (49) pelo facto da testosterona diminuir
a atividade da UGT1A1 e dos estrogénios e/ou progestogénios aumentarem a atividade da
mesma (50). O efeito da testosterona pode, também, explicar o facto de a Síndrome de
Gilbert (SG), uma hiperbilirrubinémia hereditária, ser mais frequentemente detetada
durante a puberdade em indivíduos do sexo masculino (50). As diferenças entre género
podem também ser devidas ao facto de os homens apresentarem maior massa eritrocitária
e, portanto, a um maior turnover da Hb (51).
Os níveis de BL atingem um valor máximo entre os 19 e 24 anos, decrescendo,
continuamente, ao longo da vida (52, 53). Mas é no período neonatal onde se observam
variações mais significativas dos níveis de BL. A maioria dos os recém-nascidos têm níveis
de BL mais elevados nos primeiros dias de vida (54) e em alguns casos podem aumentar
drasticamente. Estes valores devem ser vigiados, uma vez que a BL é neurotóxica e pode
provocar encefalopatias (kernicterus) com sequelas irreversíveis e, se necessário, realizar
tratamento com fototerapia.
Verifica-se uma diferença significativa nos NPB entre etnias. Um dos primeiros
estudos efetuados para avaliar estas diferenças foi realizado numa amostra de 1538
americanos que mostrou que os afro-americanos apresentavam níveis mais baixos de BL do
que os latinos, asiáticos e caucasianos de origem europeia (55). Etas diferenças raciais
revelaram-se mais acentuadas nas mulheres do que nos homens (55). Para as diferenças
inter-raciais observadas muito contribuem os fatores genéticos, como está descrito num
subcapítulo seguinte.
2.2 Fatores adquiridos
Está descrito que os fumadores apresentam NPB mais baixos do que os não
fumadores. Um estudo mostrou que após cessação de hábitos tabágicos há um aumento na
concentração de todas frações de BL (56). A BL está inversamente associada à duração da
exposição tabágica e à quantidade de cigarros consumidos por dia (57). Alguns autores
sugerem que a diminuição dos NPB poderá explicar-se pela indução da expressão do gene
UGT1A1, por substâncias presentes no tabaco, o que se traduz numa taxa aumentada de
glucuronidação de BL e no aumento da sua excreção (58). Outra explicação, assenta
capacidade antioxidante da BL. Segundo Schwertner num estudo que incluiu doentes com
doença arterial coronária, foi proposto que a diminuição dos NPB podia ser consequência
Fatores que contribuem para a variação dos níveis plasmáticos de bilirrubina
| 14
de um “consumo” excessivo de BL (como substrato redutor das peroxidases) para a
destoxificação de radicais livres presentes no fumo do tabaco (59).
A relação entre o consumo de álcool e os NPB é controversa, alguns estudos referem
que a BL aumenta com o consumo de álcool (60, 61), enquanto outros não observam uma
associação clara com este fator (62, 63).
Num estudo feito em homens e mulheres para determinar o impacto que o exercício
físico tinha sobre a função hepática, perfil lipídico e adiposidade, não foi encontrada
nenhuma associação entre os NPB e o exercício físico (64). Houve outro estudo em que se
avaliou o efeito da intensidade de exercício sobre os níveis de BL, em mulheres no período
pós-menopausa, (65), foi detetado um aumento na concentração de BL quando a
intensidade do treino aumentou em 150% (66). Os efeitos imediatos do exercício aeróbico
intenso avaliados do em 11 atletas masculinos, incluiram um aumento na concentração de
ácido úrico, BL e ácido ascórbico (155).
2.3 Outras variáveis associadas a variação da bilirrubina
Outros fatores que estão associados com a variação dos NPB são o jejum e a restrição
calórica. O jejum ou uma dieta com menos de 400 calorias por dia pode levar a um aumento
da concentração de BNC. Têm sido propostos vários mecanismos para explicar este
aumento de BL não conjugada durante o jejum, nomeadamente, a inibição do transportador
de aniões orgânicos na membrana celular do hepatócitos (67); a inibição competitiva da
captação da BL por ácidos gordos livres que aumentam no plasma durante o período de
jejum; a diminuição da motilidade intestinal com subsequente acumulação de pigmentos
biliares (68); o aumento da circulação entero-hepática e o refluxo para o plasma (68).
Fármacos e outras substâncias que competem com a BL para a glucuronidação
contribuem também para elevar os seus níveis. Alguns extratos de plantas medicinais
podem mesmo exercer efeitos inibitórios da atividade da UGT1A1 e, consequentemente,
aumentar os níveis de BL (69).
Há constituintes dietéticos que aumentam atividade enzimática da UGT1A1, como é o
caso dos citrinos (70) e de um constituinte derivado de vegetais crucíferos (repolho,
brócolos) (71), que induzem um aumento da expressão do gene UGT1A1 (72). Estudos em
modelos animais, comprovaram que a proteína de soja e as isoflavonas de soja aumentam
a atividade de UGT hepática (73) e que os alil sulfetos da cebola e do alho também
apresentam o mesmo efeito em diferentes enzimas da família UGT (74).
Está também descrito que a concentração de BL é inferior em mulheres sob
terapêutica de estrogénios, o que parece estar relacionado com a excreção aumentada de
bilirrubina por indução da expressão hepática de UGT1A1 (75). Estudos que avaliaram
diversos tipos de contracetivos demonstram uma redução da concentração de BL (76).
Fatores que contribuem para a variação dos níveis plasmáticos de bilirrubina
| 15
3. Fatores genéticos
O primeiro gene “candidato” para explicar a presença de hiperbilirrubinémias
hereditárias é o UGT1A1. Este gene codifica para a enzima responsável pela glucuronidação
da BL, a uridina difosfato glicorunil transferase 1A1 (UGT1A1), que promove a sua excreção
biliar. As variantes deste gene explicam a fisiopatologia nas síndromes de Gilbert e Crigler-
Najjar tipo I e II. Contudo, diversos estudos têm demonstrado que mutações nos genes que
codificam as proteínas transportadoras MRPs e OATPs podem constituir também fatores
genéticos associados a hiperbilirrubinémia.
3.1 Doenças hereditárias da conjugação e transporte da bilirrubina
As hiperbilirrubinémias hereditárias podem agrupar-se em formas
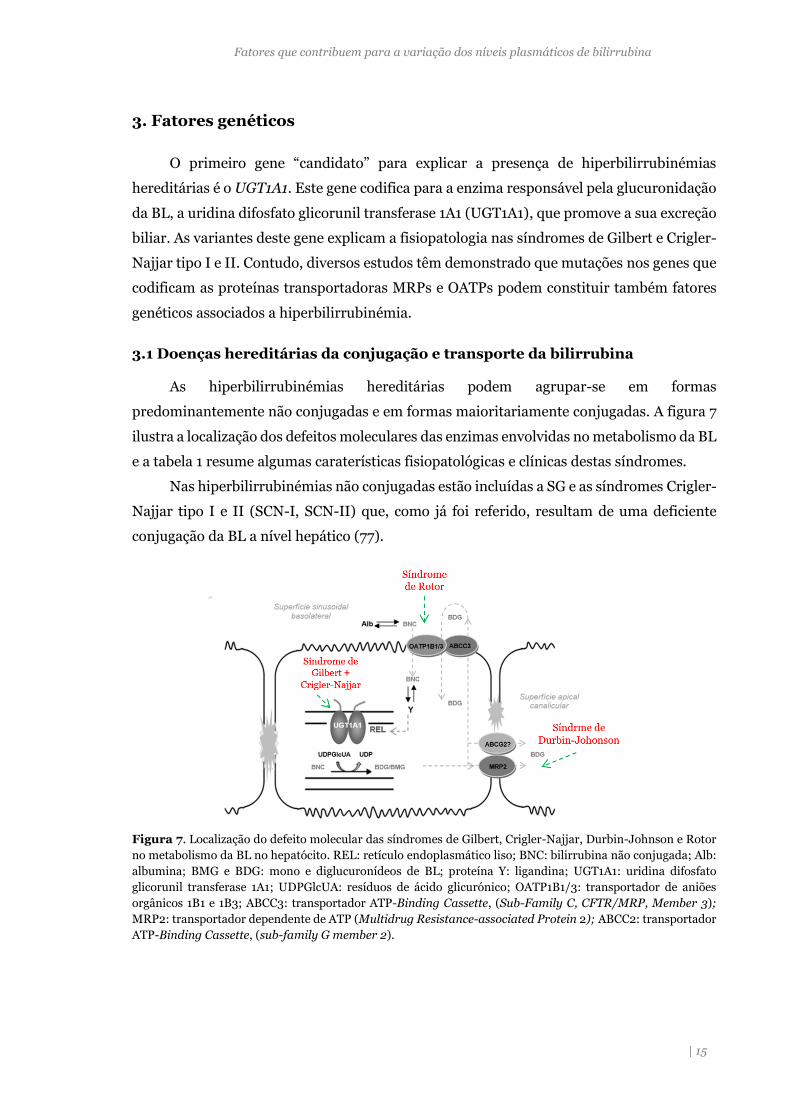
predominantemente não conjugadas e em formas maioritariamente conjugadas. A figura 7
ilustra a localização dos defeitos moleculares das enzimas envolvidas no metabolismo da BL
e a tabela 1 resume algumas caraterísticas fisiopatológicas e clínicas destas síndromes.
Nas hiperbilirrubinémias não conjugadas estão incluídas a SG e as síndromes Crigler-
Najjar tipo I e II (SCN-I, SCN-II) que, como já foi referido, resultam de uma deficiente
conjugação da BL a nível hepático (77).
Figura 7. Localização do defeito molecular das síndromes de Gilbert, Crigler-Najjar, Durbin-Johnson e Rotor
no metabolismo da BL no hepatócito. REL: retículo endoplasmático liso; BNC: bilirrubina não conjugada; Alb:
albumina; BMG e BDG: mono e diglucuronídeos de BL; proteína Y: ligandina; UGT1A1: uridina difosfato
glicorunil transferase 1A1; UDPGlcUA: resíduos de ácido glicurónico; OATP1B1/3: transportador de aniões
orgânicos 1B1 e 1B3; ABCC3: transportador ATP-Binding Cassette, (Sub-Family C, CFTR/MRP, Member 3);
MRP2: transportador dependente de ATP (Multidrug Resistance-associated Protein 2); ABCC2: transportador
ATP-Binding Cassette, (sub-family G member 2).
Fatores que contribuem para a variação dos níveis plasmáticos de bilirrubina
| 16
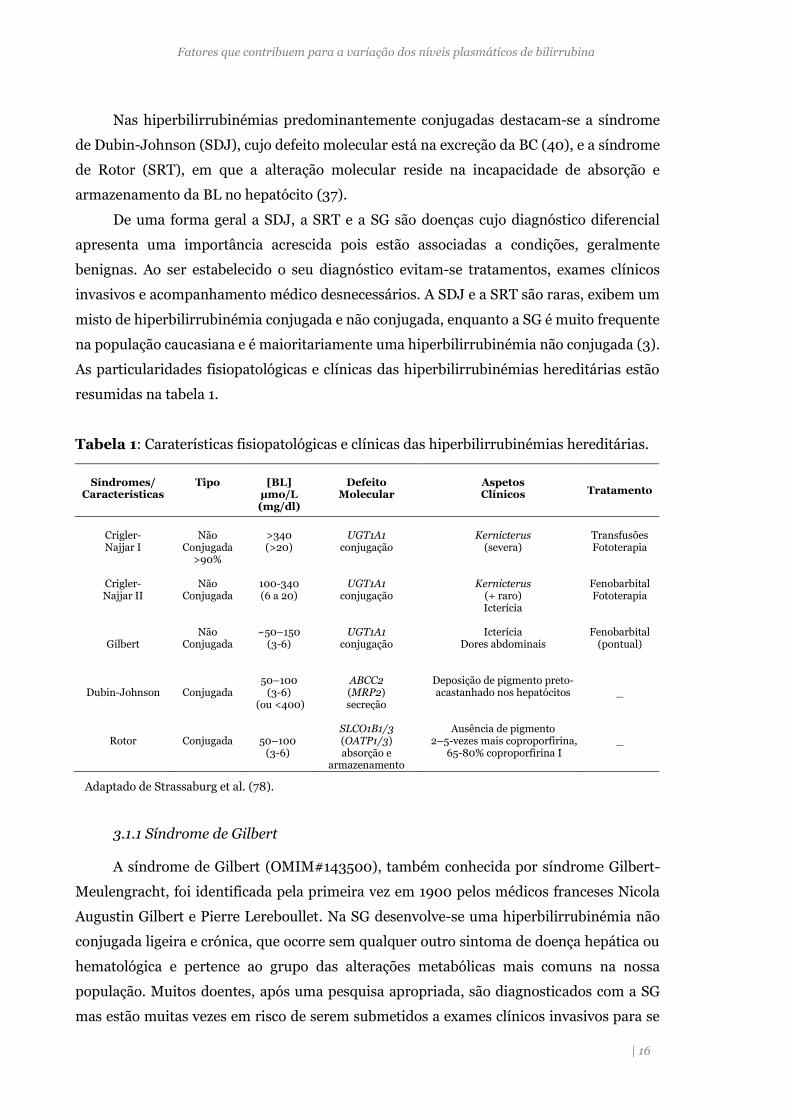
Nas hiperbilirrubinémias predominantemente conjugadas destacam-se a síndrome
de Dubin-Johnson (SDJ), cujo defeito molecular está na excreção da BC (40), e a síndrome
de Rotor (SRT), em que a alteração molecular reside na incapacidade de absorção e
armazenamento da BL no hepatócito (37).
De uma forma geral a SDJ, a SRT e a SG são doenças cujo diagnóstico diferencial
apresenta uma importância acrescida pois estão associadas a condições, geralmente
benignas. Ao ser estabelecido o seu diagnóstico evitam-se tratamentos, exames clínicos
invasivos e acompanhamento médico desnecessários. A SDJ e a SRT são raras, exibem um
misto de hiperbilirrubinémia conjugada e não conjugada, enquanto a SG é muito frequente
na população caucasiana e é maioritariamente uma hiperbilirrubinémia não conjugada (3).
As particularidades fisiopatológicas e clínicas das hiperbilirrubinémias hereditárias estão
resumidas na tabela 1.
Tabela 1: Caraterísticas fisiopatológicas e clínicas das hiperbilirrubinémias hereditárias.
Adaptado de Strassaburg et al. (78).
3.1.1 Síndrome de Gilbert
A síndrome de Gilbert (OMIM#143500), também conhecida por síndrome Gilbert-
Meulengracht, foi identificada pela primeira vez em 1900 pelos médicos franceses Nicola
Augustin Gilbert e Pierre Lereboullet. Na SG desenvolve-se uma hiperbilirrubinémia não
conjugada ligeira e crónica, que ocorre sem qualquer outro sintoma de doença hepática ou
hematológica e pertence ao grupo das alterações metabólicas mais comuns na nossa
população. Muitos doentes, após uma pesquisa apropriada, são diagnosticados com a SG
mas estão muitas vezes em risco de serem submetidos a exames clínicos invasivos para se
Síndromes/
Características
Tipo
[BL]
µmo/L (mg/dl)
Defeito
Molecular
Aspetos Clínicos
Tratamento
Crigler- Najjar I
Não
Conjugada >90%
>340 (>20)
UGT1A1
conjugação
Kernicterus
(severa)
Transfusões Fototerapia
Crigler- Najjar II
Não
Conjugada
100-340 (6 a 20)
UGT1A1
conjugação
Kernicterus
(+ raro) Icterícia
Fenobarbital Fototerapia
Gilbert
Não
Conjugada
~50–150
(3-6)
UGT1A1
conjugação
Icterícia
Dores abdominais
Fenobarbital
(pontual)
Dubin-Johnson
Conjugada
50–100
(3-6) (ou <400)
ABCC2 (MRP2) secreção
Deposição de pigmento preto-acastanhado nos hepatócitos
_
Rotor
Conjugada
50–100 (3-6)
SLCO1B1/3 (OATP1/3) absorção e
armazenamento
Ausência de pigmento
2–5-vezes mais coproporfirina, 65-80% coproporfirina I
_
Fatores que contribuem para a variação dos níveis plasmáticos de bilirrubina
| 17
determinar a causa da hiperbilirrubinémia. A SG é uma doença autossómica recessiva (79).
O primeiro mecanismo molecular que permitiu explicar a fisiopatologia de SG foi a presença
de um polimorfismo no promotor do gene UGT1A1, que contém a sequência de repetição
A[TA]nTAA (na TATA box do promotor) envolvida na modulação da transcrição do gene, em
que o dinucleotídeo TA pode estar repetido de 5 a 8 vezes. A atividade normal da enzima
UGT1A1 está associada à presença do alelo A[TA]6TAA, mas a expressão do gene diminui,
consideravelmente, com o aumento do número de repetições TA. A presença do alelo [TA]7
(c.-41_-40dupTA; UGT1A1*28) constitui a causa mais comum desta síndrome (80).
Embora a hiperbilirrubinémia em indivíduos com SG seja mais suave do que em outras
formas de hiperbilirrubinémia, atinge cerca de 5%-10% da população em geral (81) e é mais
frequente, numa proporção de 4:1, no sexo masculino do que no sexo feminino (50). As
outras variantes genéticas associadas a esta síndrome e as diferenças entre populações serão
abordadas posteriormente na caracterização da enzima UGT1A1.
Como já foi referido, a SG é uma condição benigna em que pode não ser necessário
tratamento. Em geral, é detetada num exame de rotina em que a análise de sangue revela
um nível elevado de BL, mas, frequentemente, estes casos só são resolvidos através da
análise genética. A síndrome de Gilbert é caracterizada por um fenótipo muito mais leve do
que as SCN, dado que a atividade da enzima só está reduzida em cerca de 30 % do normal
(79).
3.1.2 Síndromes de Crigler-Najjar
A síndrome de Crigler Najjar tipo I (OMIM #218800) é uma patologia hereditária,
muito rara, causada pela deficiência completa, ou quase completa, da UGT1A1. A síndrome
de Crigler Najjar tipo II (OMIM #606785) apresenta uma deficiência parcial desta enzima
(82). Estas patologias são, em geral, autossómicas recessivas (77).
Na SCN-I, os doentes morrem habitualmente no primeiro ano de vida devido à
acumulação de BNC no cérebro e sistema nervoso. Esta acumulação causa encefalopatia
bilirrubínica, denominada por kernicterus, uma vez que a região mais atingida do cérebro
é a região nuclear (kern); podem ocorrer défices neurológicos, lesões dos gânglios basais e
do cerebelo irreversíveis (77).
O diagnóstico é feito com base na concentração de BL plasmática, superior a 20
mg/dL e pela presença vestigial de glicuronídeos da bilirrubina na bílis. Deve fazer-se o
diagnóstico diferencial com outras doenças que apresentam uma produção excessiva de BL
(hemólise) e infeções e ser confirmado pela análise do DNA, o que evita a realização de
biópsia hepática.
Fatores que contribuem para a variação dos níveis plasmáticos de bilirrubina
| 18
Hoje em dia está disponível o diagnóstico pré-natal, em amostra de vilosidades
coriónicas, assim como o diagnóstico genético de pré-implantação. O aconselhamento
genético é recomendado quando os pais têm uma história familiar de SCN (83).
O tratamento é feito por fototerapia (10-12 horas por dia), para manter os níveis de
BNC não conjugada abaixo do limiar neurotóxico e uma razão molar BL/Alb inferior a 0,5,
em recém-nascidos, e inferior a 0,7, em crianças e adultos (83). O transplante hepático pode
ser uma alternativa a considerar para estes doentes (84), dado que a SCN-I pode ser letal,
como resultado do kernicterus (83).
A síndrome de Crigler-Najjar tipo-II ou síndrome de Arias (85) é uma
hiperbilirrubinémia não conjugada hereditária causada pela atividade reduzida da UGT1A1.
É uma forma mais ligeira de SCN e raramente apresenta kernicterus (86). Apesar de ser
considerada de transmissão autossómica recessiva, como a SCN-I, foram descritas algumas
variantes que parecem ter um padrão autossómico dominante (87). As primeiras
manifestações clínicas aparecem, geralmente, logo após o nascimento e os doentes com
SCN-II sofrem de icterícia menos grave do que os doentes com SCN-I e têm bílis pigmentada
devido aos glicuronídeos de BL (160). A encefalopatia bilirrubinémica pode desenvolver-se
mais tarde na vida do doente em determinadas condições.
O diagnóstico é baseado nos valores de BT, que variam entre 6 a 20 mg/dL e a
presença de glicuronídeos de BL na bílis. O diagnóstico é confirmado pela análise do DNA,
evitando a necessidade de biópsia hepática e ajuda a distiguir os dois tipos de SCN, porque
as mutações são diferentes (88). Deve fazer-se o diferencial com doenças com produção
excessiva de bilirrubina (hemólise), hepatite e síndrome de Gilbert. A SCN-II pode ser
diferenciada da SCN-I pela resposta terapêutica ao fenobarbital, que induz a expressão da
UGT1A1, permitindo discriminar estes doentes, uma vez que os portadores de SCN-I não
respondem ao fenobarbital (89). No entanto, a melhor forma de diferenciar estas duas
patologias é a análise genética (88).
A prevalência da doença de Crigler-Najjar está estimada em 0,6-1 por milhão de
nascidos vivos. As mutações em qualquer um dos 5 exões, ou raramente em intrões e/ou na
região promotora, podem causar as síndrome de Crigler-Najjar tipo I ou II. Foram
identificadas cerca de 110 mutações (mutações pontuais, deleções, inserções) no gene
UGT1A1 associadas a estas síndromes (90, 91), o que indica que as síndromes de Crigler-
Najjar são geneticamente heterogéneas. As suas apresentações clínicas são, no entanto,
bastante homogéneas.
3.1.3 Síndrome de Durbin-Johnson
Na síndrome de Durbin-Johnson, a hiperbilirrubinémia é fundamentalmente
conjugada ou mista. Quando a SDJ foi descrita pela primeira vez (92), os autores referiram
Fatores que contribuem para a variação dos níveis plasmáticos de bilirrubina
| 19
que o fígado destes doentes, embora não revelasse alterações da sua estrutura, continha um
pigmento negro (92). A SDJ é transmitida de forma autossómica recessiva e é causado por
mutações, em homozigotia, no gene ABCC2 (ATP-Binding Cassette, sub-family C), que
codifica para um transportador da membrana apical dependente de ATP, o MRP2 (40). Este
transportador controla o efluxo de bilirrubina-glucuronídeos e de outros aniões orgânicos,
conjugados no hepatócito, para a bílis.
O diagnóstico desta síndrome é estabelecido em doentes que exibem
hiperbilirrubinémia conjugada isolada (sem alterações nas atividades das enzimas
hepáticas, nem hemólise), na ausência de qualquer condição séptica, anomalia ecográfica
hepática ou medicação potencialmente interferente. Apesar dos estudos histológicos
permitirem um diagnóstico definitivo, a biopsia hepática não é sistematicamente realizada
uma vez que é um procedimento invasivo e se trata de uma condição benigna. O diagnóstico
definitivo pode ser obtido através da análise molecular do gene ABCC2 (93).
3.1.4 Síndrome de Rotor
Em 1948, Rotor & colaboradores descreveram um caso clínico (94), semelhante ao
descrito posteriormente por Dubin e Johnson, mas no qual o fígado não apresenta
pigmentação negra (95). Os doentes com hiperbilirrubinémias hereditárias do tipo
conjugado ou misto passaram a ser distinguidos pela presença ou ausência destes
pigmentos no fígado e a entidade clínica passou a chamar-se Síndrome de Rotor (SRT). A
SRT é uma doença autossómica recessiva muito rara e benigna, decorrente de mutações no
gene ABCC2 e caracterizada por hiperbilirrubinémia, predominantemente conjugada, não-
hemolítica crónica (95) (tabela 1). A hemólise não é uma característica desta síndrome mas
foi descrita a co-hereditariedade com patologias hemolíticas, como a deficiência da glucose-
6-fosfato-desidrogenase (G-6-PD) e -talassemia, com histologia normal do fígado (78).
Como o defeito genético desta síndrome está associado um transportador que é
responsável pelo transporte da BL para o hepatócito, podia antever-se que resultaria
predominantemente em hiperbilirrubinémia não conjugada, isto é, de um defeito de
captação. A BL não chegaria a entrar no hepatócito aumentando a concentração de BNC no
plasma. No entanto, a maioria dos defeitos de captação resultam em hiperbilirrubinémia
que é predominantemente conjugada, pois o defeito é sobretudo no mecanismo de
“recaptação” da BC, via OATP1B1/3 (37).
Habitualmente a SRT é identificada em crianças e adolescentes, mas verifica-se
frequentemente uma icterícia ligeira, desde o nascimento, o que constitui uma indicação
importante no diagnóstico diferencial da SDJ. Assim, a principal diferença, como foi
referido, é a presença de pigmentos negros no fígado e de frações de isómeros de
Fatores que contribuem para a variação dos níveis plasmáticos de bilirrubina
| 20
coproporfirina (I e III) encontrados na urina de indivíduos com SDJ. Em indivíduos
saudáveis, a percentagem de coproporfirina I que é excretada em relação a coproporfirina
total é aproximadamente 20% a 45%. Nas síndromes de DJS e de Rotor há retenção de
coproporfirina III (95). Consequentemente, a percentagem de coproporfirina I excretada na
urina excede o intervalo de referência (95). Na SRT, a excreção urinária da coproporfirina I
é elevada e na ordem dos 60% a 80%, enquanto na SDJ é superior a 80%, mas o valor total
é normal (78). Na SRT, a colecistografia, que avalia a capacidade funcional do fígado para
remover o meio de contraste da corrente sanguínea e a sua excreção biliar, é normal,
enquanto na SDJ pode sofrer alterações (4). Se a biopsia hepática não for viável, tanto a
cintigrafia biliar com tecnecium 99mTc, que revela a excreção renal na SRT, como a análise
molecular, que deteta as mutações no gene ABCC2 nos doentes com SDJ, podem ser úteis
na distinção entre SRT e SDJ (78). A SRT é uma doença muito rara, tem uma prevalência
desconhecida mas foram descritos mais de 50 casos na literatura até ao momento (96).
3.1.5 Outros genes associados a variação plasmática da bilirrubina
As alterações no gene UGT1A1, assim como os genes que codificam as proteínas
transportadoras (OATPs e MRPs) podem condicionar os níveis de BL. No entanto, no
metabolismo da BL há outros genes que codificam proteínas cujas variantes podem também
determinar variações na BL plasmática. Têm sido realizados estudos de associação genética
(GWAS: genome wide association studies) que identificaram loci significativamente
associados à variação da BL. Um desses estudos foi realizado em 9464 indivíduos e
identificou uma forte associação entre os níveis de BL e os genes UGT1A1 e SLCO1B1
(organic anion-transporting polypeptide OATP1B1) (97). O SNP rs6742078 localizado
perto da região TATA do promotor do gene UGT1A1 foi o que apresentou maior associação
e uma contribuição de 18% para a variação observada na BL. Adicionalmente, para o gene
SLCO1B1, o SNP (rs4149056), localizado no exão 6, que resulta na troca do resíduo V174A,
estava associado e determinou 0.6 % da variação total da BL. Esta variante tem sido
apontada em alguns estudos clínicos como responsável pelas alterações na função de
transporte e, consequentemente, pela elevação de BL (98).
Outro estudo GWAS identificou a associação dos níveis de BL , não só com a região
promotora com a região promotora do UGT1A1, mas também com o gene SLCO1B1 e com o
G6PD, embora com menor significância (96). Os eritrócitos de indivíduos com deficiência
em G6PD, a enzima chave da via das pentoses fosfato, apresentam uma semivida reduzida,
por hemólise prematura, conduzindo à produção aumentada de BL. A deficiência da G-6-
PD é bem conhecida por estar associada à hiperbilirrubinémia, de causa hemolítica (99).
Também se verificaram alterações da concentração de BL em adultos devido a variantes
Fatores que contribuem para a variação dos níveis plasmáticos de bilirrubina
| 21
presentes neste gene (100). Outro gene recentemente identificado por GWAS foi o NUP153,
que codifica uma proteína de 153 kDa, a nucleoporina (101), importante no transporte
bidirecional de moléculas do núcleo para o citoplasma(102). Esta proteína tem sido
associada ao transporte da enzima biliverdina redutase (BVR), que como já foi referido
catalisa a formação de BL a partir de BLV. O gene BLVRA (biliverdina redutase A), que
modula esta enzima, é também apontado como potencial interferente na variação dos níveis
de BL. Há, no entanto, controvérsia, pois outro referem não haver associação entre as
variantes deste gene e os NPB (103).
O gene HOMOX que codifica a HO-1, responsável pela produção de BL, apresenta um
polimorfismo de repetição (GT) na região promotora do HOMOX, que também modula a
expressão HO-1 em resposta ao stress oxidativo. Esta variante foi associada à presença de
doenças cardiovasculares (DCV) mas o seu efeito nos níveis de BL foram inconclusivos (104)
(105).
Pelo exposto, há outros genes que podem modular os níveis de BL, mas com menor
impacto do que o UGT1A1. Apesar de terem sido realizados poucos rastreios de mutações
nesses genes, os estudos de associação génica mostram claramente o contributo dos defeitos
de glucuronidação para explicar as diferenças inter-individuais de BL.
3.3 Implicações da Síndrome de Gilbert noutras patologias
A presença de hiperbilirrubinémia, associada a SG, pode levar ao agravamento do
quadro clínico dos indivíduos que apresentam doenças hemolíticas crónicas (106) ). Por
outro lado, os doentes com SG são mais sensíveis aos efeitos adversos dos antineoplásicos e
de outros fármacos que sofrem a glucorunidação hepática, pelo que o seu diagnóstico ganha
importância ao nível do tratamento de muitas patologias.
3.3.1 Monitorização de doenças
Um dos primeiros estudos onde se observou o efeito negativo da associação da SG
com as doenças hemolíticas foi na esferocitose hereditária (106). Esta doença hemolítica
crónica e hereditária, é comum no norte da Europa (107). É caraterizada pela presença de
anemia, esplenomegalia e icterícia. Os indivíduos afetados apresentam os eritrócitos com a
forma esférica (esferócitos) devido a defeitos estruturais nas proteínas de membrana (108).
Os esferócitos anómalos são destruídos no baço, sendo esta a principal causa de hemólise.
Um dos parâmetros que define a gravidade desta anemia é a concentração de BL, que
estando aumentada, pode levar ao desenvolvimento de litíase biliar (109). Verificou-se que
os indivíduos que eram afetados por esta doença e que co-herdavam a variante UGT1A1*28
apresentavam um aumento significativo dos níveis de BL, com agravamento do fenótipo
Fatores que contribuem para a variação dos níveis plasmáticos de bilirrubina
| 22
(106). Este aspeto foi particularmente evidente em alguns casos de esferocitose mais suave,
onde a concentração de BL plasmática era inesperadamente alta, o que dificultou a sua
classificação de acordo com os parâmetros clínicos (110).
Na anemia falciforme é frequente observarem-se complicações como crises vaso-
oclusivas que promovem a hemólise e a hiperbilirrubinémia crónica e que podem também
conduzir a litíase biliar (111). A presença do polimorfismo UGT1A1*28, associado à SG,
parece constituir um fator de risco para esta complicação clínica na anemia falciforme (111).
A associação entre a presença de litíase e a variante TA tem sido descrita noutras doenças
hemolíticas crónicas, como por exemplo na talassemia minor, (112), deficiência da G-6-PD
(113).
Antes de se identificar o defeito molecular responsável pelo SG, colocou-se a hipótese
de que a SG poderia alterar os níveis de BL no período neonatal. Posteriormente, provou-se
que a SG contribuía para a hiperbilirrubinémia do recém-nascido (114). A análise genética
revelou que homozigóticos para o alelo [TA]7 apresentavam níveis de BL mais elevados e
persistentes (223>mol/L) do que os heterozigóticos ou homozigóticos para o alelo normal,
o que se traduzia numa icterícia neonatal prolongada (115).
A hiperbilirrubinémia não conjugada prolongada, associada à alimentação com leite
materno, no final do período neonatal, por volta dos 4 meses de idade, causa ansiedade aos
familiares e pediatras, uma vez que nesta idade ainda pode representar risco de
encefalopatia (116). A hiperbilirrubinémia diminui quando o leite materno é substituído
pela fórmula infantil comercial. A causa desta hiperbilirrubinémia ainda não está
completamente esclarecida, mas a presença de variantes do gene UGT1A1, que estão na base
da SG, poderá condicionar icterícia associada à ingestão de leite materno (117).
3.3.2 Tratamento farmacológico: farmacogenética
Muitas substâncias exógenas, xenobióticos e fármacos são substratos da enzima
UGT1A1 (118). As variações genéticas que alteram a atividade da UGT1A1 podem constituir
um perigo de toxicidade aumentada para os portadores. A variante mais estudada nesta
interação corresponde ao polimorfismo UGT1A1*28 no promotor, responsável pela SG (86)
(119). São exemplos de substratos da UGT1A1, o irinotecano (SN-38), o acetaminofeno
(paracetamol) e a sinvastatina (118, 120). Também existem muitos fármacos que podem
induzir ou inibir a atividade da UGT1A1 (86). A rifampina e o fenobarbital são exemplos de
fármacos indutores (86), (121).
O estudo do impacto das variantes génicas na metabolização dos fármacos constitui
uma importante área de investigação, permitindo uma terapêutica mais individualizada
(farmacogenética). A toxicidade para o irinotecano (camptotecina) é um exemplo bem
Fatores que contribuem para a variação dos níveis plasmáticos de bilirrubina
| 23
estudado neste domínio, dado que este fármaco representa uma opção de tratamento
padronizada para cancro colorectal metastizado e para outros tumores sólidos, atuando
como inibidor da topoisomerase (122). O irinotecano é convertido em 7-etil-10-
hydroxicamptotecina (SN-38) pelas enzimas carboxilesterases, que apresentam 100 vezes
maior atividade anti-tumoral (123). Porém, o irinotecano tem uma faixa terapêutica estreita
e conduz a efeitos colaterais, como a mielossupressão (principalmente leucopenia e
trombocitopenia) e diarreia severa (124), o que implica muitas vezes a interrupção ou a
diminuição da dose administrada. O SN-38 é maioritariamente inativado pela proteína
UGT1A1, que gera um glicuronídeo de SN-38 que depois é eliminado através da bílis e urina
(124). Os doentes com SG têm, portanto, maior propensão para a toxicidade pelo
irinotecano.
Outro fármaco que pode ter a sua atividade condicionada, em caso de SG, é o
atazanavir, atualmente recomendado para o tratamento da infeção por HIV-1. O atazanavir
inibe a enzima UGT1A1 conduzindo ao aparecimento de hiperbilirrubinémia (125). Os
indivíduos portadores do alelo UGT1A1*28 podem desenvolver mais facilmente icterícia
clinicamente significativa (126). Alguns autores sugerem que a BL possa ser usada como um
marcador da adesão à terapia com atazanavir, permitindo prever o resultado terapêutico e
respetiva toxicidade (127).
Como a UGT1A1 é capaz de glucorunidar estrogénios (128), tem sido proposto que os
portadores da variante polimórfica UGT1A1*28 tenham uma propensão diferente para o
desenvolvimento de doenças cancerígenas com transformação neoplásica (129).
O desenvolvimento de novas terapias farmacológicas deve ter em conta a presença de
alterações no gene UGT1A1, que condicionam simultaneamente a presença de SG e
toxicidade aumentada para vários fármacos.
3.4 A enzima UGT1A1
A família das uridinas glucorunosiltransferases (UGTs) é responsável pela
glucorunidação de muitos substratos e pela maior parte do metabolismo hepátic0 da fase II
(130, 131). É constituída por dois grupos de genes principais, UGT1 e UGT2 (subdividido
em 2A e 2B) (131), classificação baseada na identidade de sequência nucleotídica das suas
isoformas (86, 118, 120, 132). A UGT1A1 (NM_000463.2), com 533 aminoácidos (aa), é a
principal isoforma responsável pela glucuronidação da BL e também pela conjugação de
antraquinonas antraquinonas, fenóis, flavonóides e uma variedade de fármacos e seus
metabolitos (133). É expressa em tecido biliar, cólon, fígado, intestino e estômago (111).
A nomenclatura dos genes UGT1A e das respetivas proteínas é baseada na comparação
de sequências e na divergência evolutiva (134). Cada gene humano é denominado pela
abreviatura UGT (Ugt, no rato), seguido por um número árabe, que representa a família,
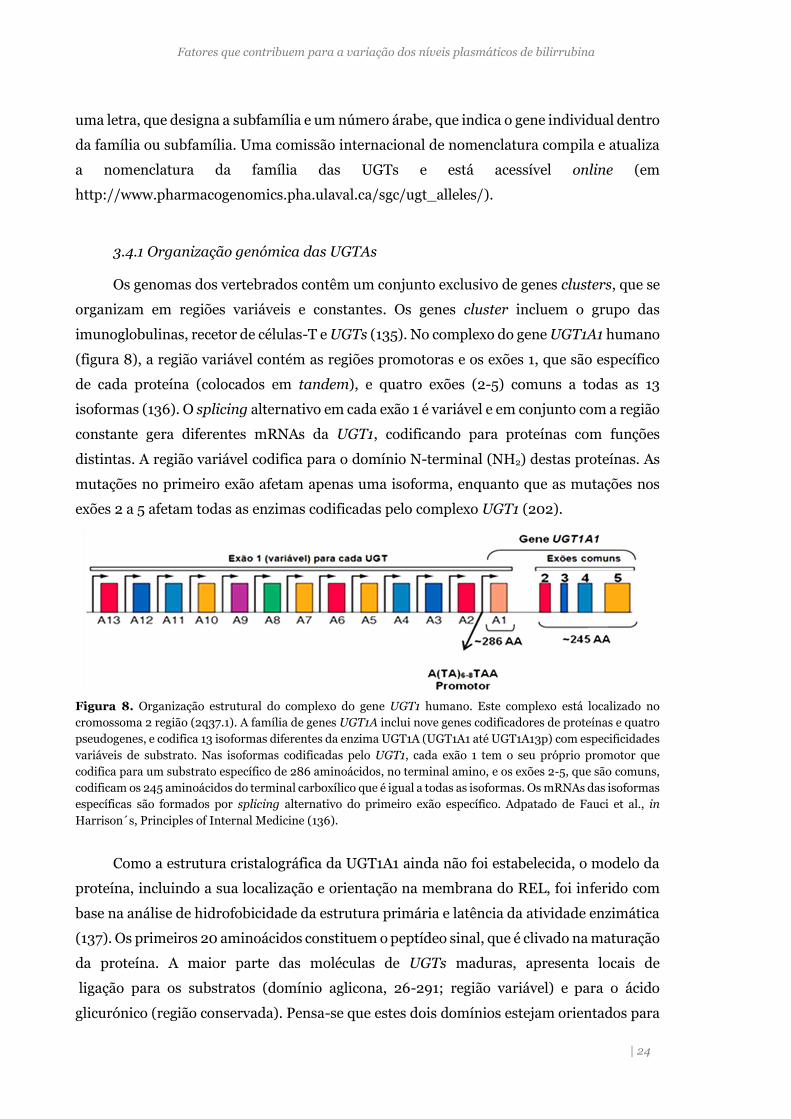
Fatores que contribuem para a variação dos níveis plasmáticos de bilirrubina
| 24
uma letra, que designa a subfamília e um número árabe, que indica o gene individual dentro
da família ou subfamília. Uma comissão internacional de nomenclatura compila e atualiza
a nomenclatura da família das UGTs e está acessível online (em
http://www.pharmacogenomics.pha.ulaval.ca/sgc/ugt_alleles/).
3.4.1 Organização genómica das UGTAs
Os genomas dos vertebrados contêm um conjunto exclusivo de genes clusters, que se
organizam em regiões variáveis e constantes. Os genes cluster incluem o grupo das
imunoglobulinas, recetor de células-T e UGTs (135). No complexo do gene UGT1A1 humano
(figura 8), a região variável contém as regiões promotoras e os exões 1, que são específico
de cada proteína (colocados em tandem), e quatro exões (2-5) comuns a todas as 13
isoformas (136). O splicing alternativo em cada exão 1 é variável e em conjunto com a região
constante gera diferentes mRNAs da UGT1, codificando para proteínas com funções
distintas. A região variável codifica para o domínio N-terminal (NH2) destas proteínas. As
mutações no primeiro exão afetam apenas uma isoforma, enquanto que as mutações nos
exões 2 a 5 afetam todas as enzimas codificadas pelo complexo UGT1 (202).
Figura 8. Organização estrutural do complexo do gene UGT1 humano. Este complexo está localizado no
cromossoma 2 região (2q37.1). A família de genes UGT1A inclui nove genes codificadores de proteínas e quatro
pseudogenes, e codifica 13 isoformas diferentes da enzima UGT1A (UGT1A1 até UGT1A13p) com especificidades
variáveis de substrato. Nas isoformas codificadas pelo UGT1, cada exão 1 tem o seu próprio promotor que
codifica para um substrato específico de 286 aminoácidos, no terminal amino, e os exões 2-5, que são comuns,
codificam os 245 aminoácidos do terminal carboxílico que é igual a todas as isoformas. Os mRNAs das isoformas
específicas são formados por splicing alternativo do primeiro exão específico. Adpatado de Fauci et al., in
Harrison´s, Principles of Internal Medicine (136).
Como a estrutura cristalográfica da UGT1A1 ainda não foi estabelecida, o modelo da
proteína, incluindo a sua localização e orientação na membrana do REL, foi inferido com
base na análise de hidrofobicidade da estrutura primária e latência da atividade enzimática
(137). Os primeiros 20 aminoácidos constituem o peptídeo sinal, que é clivado na maturação
da proteína. A maior parte das moléculas de UGTs maduras, apresenta locais de
ligação para os substratos (domínio aglicona, 26-291; região variável) e para o ácido
glicurónico (região conservada). Pensa-se que estes dois domínios estejam orientados para
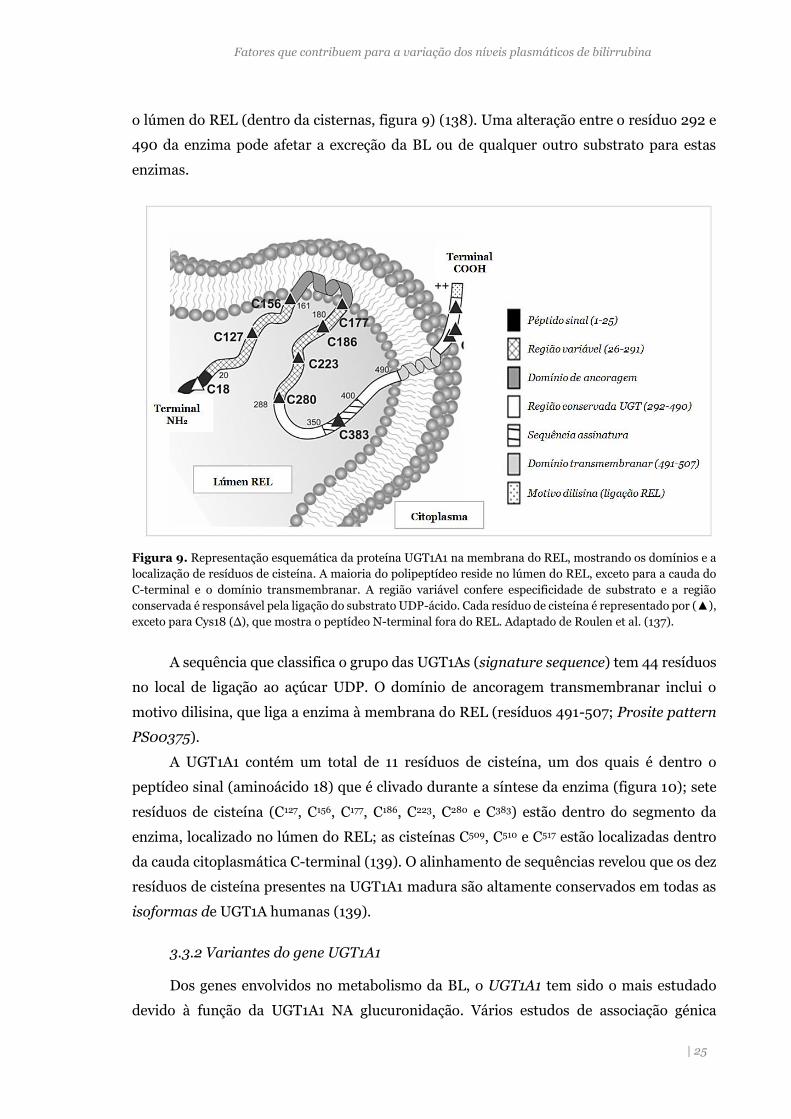
Fatores que contribuem para a variação dos níveis plasmáticos de bilirrubina
| 25
o lúmen do REL (dentro da cisternas, figura 9) (138). Uma alteração entre o resíduo 292 e
490 da enzima pode afetar a excreção da BL ou de qualquer outro substrato para estas
enzimas.
Figura 9. Representação esquemática da proteína UGT1A1 na membrana do REL, mostrando os domínios e a
localização de resíduos de cisteína. A maioria do polipeptídeo reside no lúmen do REL, exceto para a cauda do
C-terminal e o domínio transmembranar. A região variável confere especificidade de substrato e a região
conservada é responsável pela ligação do substrato UDP-ácido. Cada resíduo de cisteína é representado por (▲),
exceto para Cys18 (∆), que mostra o peptídeo N-terminal fora do REL. Adaptado de Roulen et al. (137).
A sequência que classifica o grupo das UGT1As (signature sequence) tem 44 resíduos
no local de ligação ao açúcar UDP. O domínio de ancoragem transmembranar inclui o
motivo dilisina, que liga a enzima à membrana do REL (resíduos 491-507; Prosite pattern
PS00375).
A UGT1A1 contém um total de 11 resíduos de cisteína, um dos quais é dentro o
peptídeo sinal (aminoácido 18) que é clivado durante a síntese da enzima (figura 10); sete
resíduos de cisteína (C127, C156, C177, C186, C223, C280 e C383) estão dentro do segmento da
enzima, localizado no lúmen do REL; as cisteínas C509, C510 e C517 estão localizadas dentro
da cauda citoplasmática C-terminal (139). O alinhamento de sequências revelou que os dez
resíduos de cisteína presentes na UGT1A1 madura são altamente conservados em todas as
isoformas de UGT1A humanas (139).
3.3.2 Variantes do gene UGT1A1
Dos genes envolvidos no metabolismo da BL, o UGT1A1 tem sido o mais estudado
devido à função da UGT1A1 NA glucuronidação. Vários estudos de associação génica

Fatores que contribuem para a variação dos níveis plasmáticos de bilirrubina
| 26
(GWAS) e de segregação (97) mostraram que havia um gene major determinante na
variação dos níveis de BL. A maior parte destes trabalhos foi realizada no contexto das DCV,
para identificar os genes que influenciavam os níveis de BL, tendo em conta que esta pode
ser um marcador de risco para esse tipo de doenças. Como referido, as mutações no UGT1A1
são responsáveis pelas síndromes hereditárias da conjugação (SG, SCN-I e SCN-II) (88) e
condicionam a via para excreção de outras substâncias de origem dietética, ambiental e
farmacêutica.
As mais recentes atualizações de bases de dados e revisões bibliográficas (90) (91),
mostraram que o gene UGT1A1 é muito polimórfico. Na base de dados Ensemble estão
anotadas 1097 variantes para este gene (ENSG00000242366), entre as quais 338 estão
localizadas na região codificante. Muitas destas variantes foram identificadas no projeto
COSMIC (Catalogue of Somatic Cell Mutation in Cancer), por sequenciação. Até à presente
data foram descritas 130 variantes associadas a hiperbilirrubinémia não conjugada (SG,
SCN-I e SCN-II). Destas, 91 são mutações de um único nucleótido ou SNP, em que 77
alteram o aminoácido (não-sinonímias: nsSNP), 14 introduzem um codão stop, 21 são
pequenas deleções, 10 são inserções e 8 são mutações que afetam a região promotora e
intrões (90). Estas mutações também estão associadas à icterícia neonatal e à
hiperbilirrubinémia causada pela terapia com irinotecano. Estão descritos mais 15 nsSNPs
que não foram incluídos na revisão acima referida mas que estão relatados (tabela do
suplemento S1; do artigo 4).
Verificou-se que as mutações associadas à SCN-I e SCN-II podem, em heterozigotia,
dar origem ao fenótipo SG. Assim, estas 3 patologias podem não ser entidades clínico-
genéticas mutuamente exclusivas, mas corresponder a diferentes zonas do espetro
quantitativo de hiperbilirrubinémia não conjugada (78).
Existem outros polimorfismos descritos, sendo que 4 deles se destacam pela
frequência com que ocorrem nas diferentes populações (figura 10). Um dos polimorfismos
mais estudado é a duplicação no A[TA]nTAA no promotor do gene UGT1A1, c.-41_-
40dupTA ou UGT1A1*28, que é o defeito molecular mais frequentemente associado a SG na
população caucasiana. Outra variante, no promotor do gene UGT1A1, é substituição do
nucleótido T por G na posição -3279, localizada no módulo de resposta ao fenobarbital
(PBREM-Phenobarbital -Responsive Enhancer Module). Este polimorfismo, também
conhecido por UGT1A1*60, parece reduzir a atividade transcricional da UGT1A1 (140) e está
descrito que se encontra em desequilíbrio de ligação com o polimorfismo TA (141). Ainda
na região PBREM, há outro polimorfismo, com a substituição c.-3156G>A, que também se
encontra em desequilíbrio com os dois anteriores (140), mas parece ter menos influência na
variação da BL. Existem dois SNPs localizados no exão 1, o primeiro resulta da substituição
de um G por A no nucleótido 211 (G71R; UGT1A1*6) e o segundo da troca de um C por A na
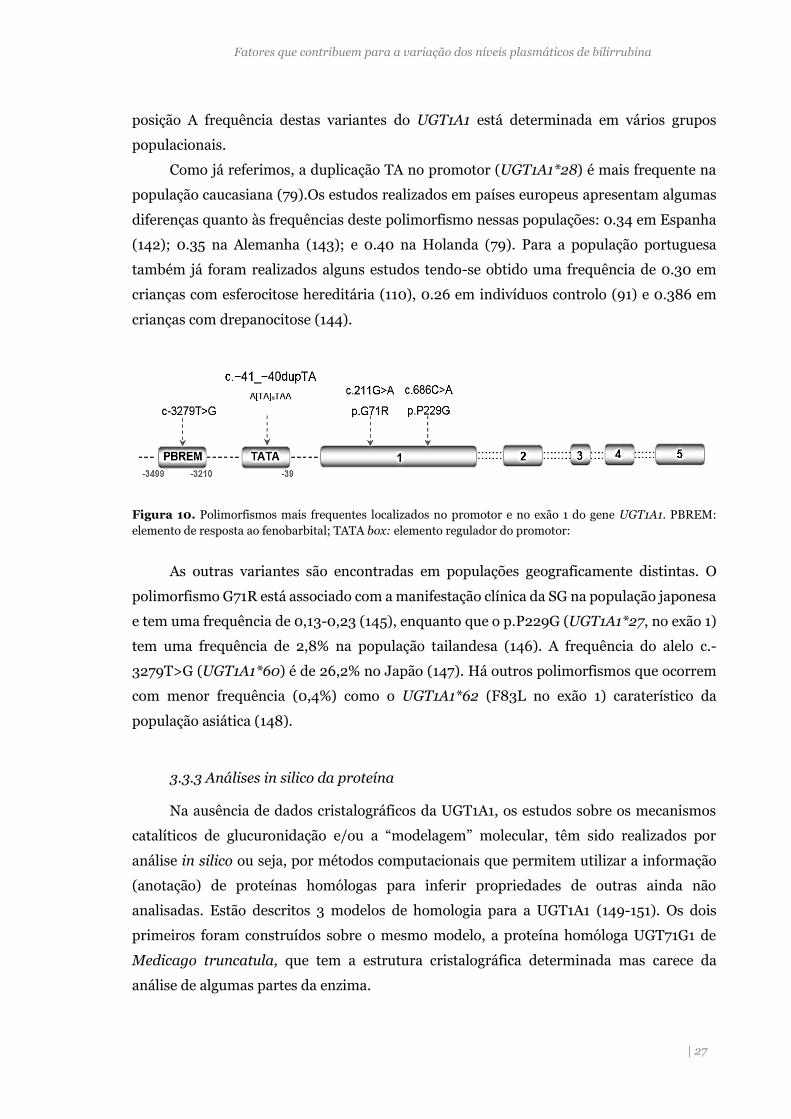
Fatores que contribuem para a variação dos níveis plasmáticos de bilirrubina
| 27
posição A frequência destas variantes do UGT1A1 está determinada em vários grupos
populacionais.
Como já referimos, a duplicação TA no promotor (UGT1A1*28) é mais frequente na
população caucasiana (79).Os estudos realizados em países europeus apresentam algumas
diferenças quanto às frequências deste polimorfismo nessas populações: 0.34 em Espanha
(142); 0.35 na Alemanha (143); e 0.40 na Holanda (79). Para a população portuguesa
também já foram realizados alguns estudos tendo-se obtido uma frequência de 0.30 em
crianças com esferocitose hereditária (110), 0.26 em indivíduos controlo (91) e 0.386 em
crianças com drepanocitose (144).
Figura 10. Polimorfismos mais frequentes localizados no promotor e no exão 1 do gene UGT1A1. PBREM:
elemento de resposta ao fenobarbital; TATA box: elemento regulador do promotor:
As outras variantes são encontradas em populações geograficamente distintas. O
polimorfismo G71R está associado com a manifestação clínica da SG na população japonesa
e tem uma frequência de 0,13-0,23 (145), enquanto que o p.P229G (UGT1A1*27, no exão 1)
tem uma frequência de 2,8% na população tailandesa (146). A frequência do alelo c.-
3279T>G (UGT1A1*60) é de 26,2% no Japão (147). Há outros polimorfismos que ocorrem
com menor frequência (0,4%) como o UGT1A1*62 (F83L no exão 1) caraterístico da
população asiática (148).
3.3.3 Análises in silico da proteína
Na ausência de dados cristalográficos da UGT1A1, os estudos sobre os mecanismos
catalíticos de glucuronidação e/ou a “modelagem” molecular, têm sido realizados por
análise in silico ou seja, por métodos computacionais que permitem utilizar a informação
(anotação) de proteínas homólogas para inferir propriedades de outras ainda não
analisadas. Estão descritos 3 modelos de homologia para a UGT1A1 (149-151). Os dois
primeiros foram construídos sobre o mesmo modelo, a proteína homóloga UGT71G1 de
Medicago truncatula, que tem a estrutura cristalográfica determinada mas carece da
análise de algumas partes da enzima.
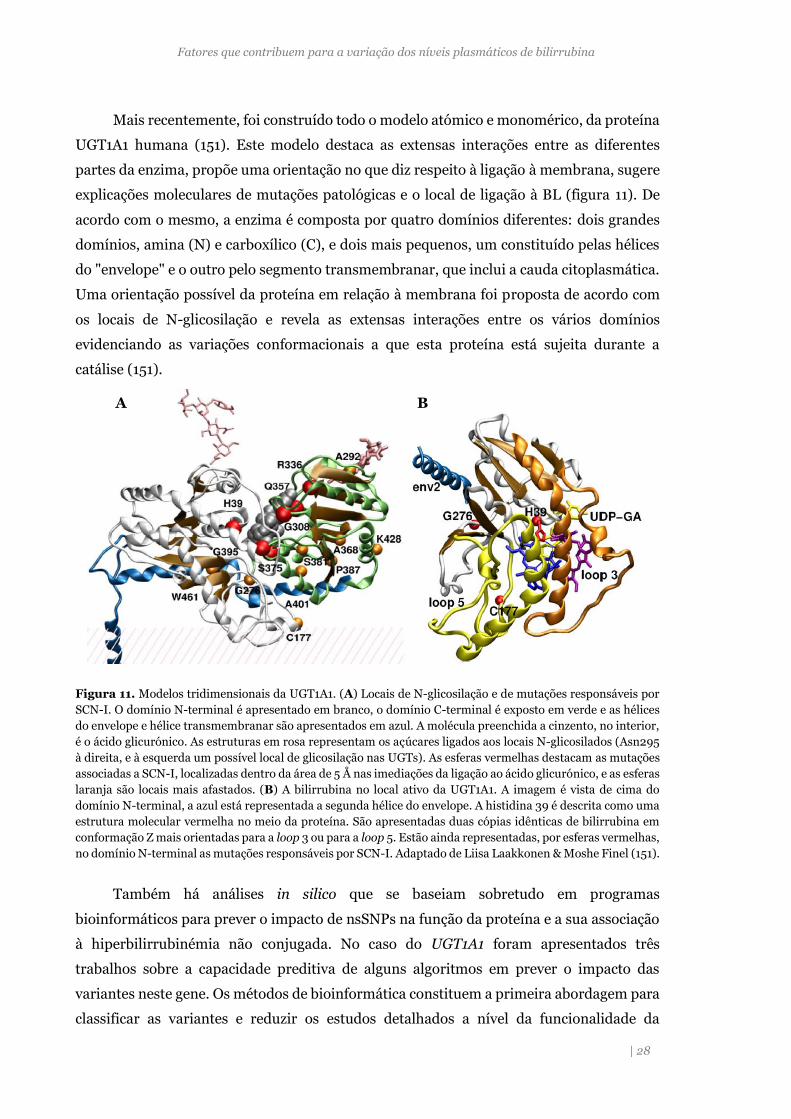
Fatores que contribuem para a variação dos níveis plasmáticos de bilirrubina
| 28
Mais recentemente, foi construído todo o modelo atómico e monomérico, da proteína
UGT1A1 humana (151). Este modelo destaca as extensas interações entre as diferentes
partes da enzima, propõe uma orientação no que diz respeito à ligação à membrana, sugere
explicações moleculares de mutações patológicas e o local de ligação à BL (figura 11). De
acordo com o mesmo, a enzima é composta por quatro domínios diferentes: dois grandes
domínios, amina (N) e carboxílico (C), e dois mais pequenos, um constituído pelas hélices
do "envelope" e o outro pelo segmento transmembranar, que inclui a cauda citoplasmática.
Uma orientação possível da proteína em relação à membrana foi proposta de acordo com
os locais de N-glicosilação e revela as extensas interações entre os vários domínios
evidenciando as variações conformacionais a que esta proteína está sujeita durante a
catálise (151).
Figura 11. Modelos tridimensionais da UGT1A1. (A) Locais de N-glicosilação e de mutações responsáveis por
SCN-I. O domínio N-terminal é apresentado em branco, o domínio C-terminal é exposto em verde e as hélices
do envelope e hélice transmembranar são apresentados em azul. A molécula preenchida a cinzento, no interior,
é o ácido glicurónico. As estruturas em rosa representam os açúcares ligados aos locais N-glicosilados (Asn295
à direita, e à esquerda um possível local de glicosilação nas UGTs). As esferas vermelhas destacam as mutações
associadas a SCN-I, localizadas dentro da área de 5 Å nas imediações da ligação ao ácido glicurónico, e as esferas
laranja são locais mais afastados. (B) A bilirrubina no local ativo da UGT1A1. A imagem é vista de cima do
domínio N-terminal, a azul está representada a segunda hélice do envelope. A histidina 39 é descrita como uma
estrutura molecular vermelha no meio da proteína. São apresentadas duas cópias idênticas de bilirrubina em
conformação Z mais orientadas para a loop 3 ou para a loop 5. Estão ainda representadas, por esferas vermelhas,
no domínio N-terminal as mutações responsáveis por SCN-I. Adaptado de Liisa Laakkonen & Moshe Finel (151).
Também há análises in silico que se baseiam sobretudo em programas
bioinformáticos para prever o impacto de nsSNPs na função da proteína e a sua associação
à hiperbilirrubinémia não conjugada. No caso do UGT1A1 foram apresentados três
trabalhos sobre a capacidade preditiva de alguns algoritmos em prever o impacto das
variantes neste gene. Os métodos de bioinformática constituem a primeira abordagem para
classificar as variantes e reduzir os estudos detalhados a nível da funcionalidade da
A B
Fatores que contribuem para a variação dos níveis plasmáticos de bilirrubina
| 29
proteína. Estes métodos podem ser divididos em duas categorias principais: os baseados na
conservação de sequência, que utilizam vários alinhamentos de sequência e incorporam
diferentes abordagens para medir a conservação de resíduos (152) e os que combinam a
análise da homologia das sequências com as propriedades estruturais da proteína (153)
(154).
Num dos estudos publicados sobre variantes na UGT1A1 fez-se a análise de mutações
utilizando apenas dois algoritmos (155), o método sorting intolerant from tolerant (SIFT)
e o polymorphism phenotyping (PolyPhen), obtendo-se uma taxa de predição correta de
57.1% para o SIFT e de 66.7% para o Polyphen. Outro estudo incluiu mais 4 algoritmos e 59
SNPs associados à SCN (156), o que permitiu a construção de um modelo matemático que
utilizou simultaneamente o valor preditivo das ferramentas de bioinformática (157).
4. Abordagem clínica
Num adulto saudável, os valores de BL plasmática variam entre os 5 e os 17.1 μmol/L.
Um excesso de BL no plasma sanguíneo, com valores superiores a 17.1 μmol/L (1 mg/dl), é
uma situação clínica é de hiperbilirrubinémia (86). Quando os níveis de BL no plasma
atingem os 3 mg/dL (51.3 μmol/L) originam um quadro clínico de icterícia. Nesta
concentração, a BL difunde-se nos tecidos e dá origem à coloração amarelada da pele,
mucosas e escleróticas do olho (158). Os níveis de BL no plasma são o reflexo do catabolismo
do grupo heme, como resultado destruição dos eritrócitos (produção de BL), da capacidade
do hepatócito para processar a bilirrubina (absorção, armazenamento e conjugação), ou
decorrente do anormal funcionamento do sistema de drenagem biliar que transporta a bílis
para o duodeno. Assim, dependendo da fração de bilirrubina que está predominantemente
alterada, a hiperbilirrubinémia pode ser do tipo não conjugada ou do tipo conjugada.
4.1 Hiperbilirrubinémia não conjugada
As anemias hemolíticas constituem um exemplo de hiperbilirrubinémia não
conjugada em que há uma produção aumentada de BNC (tabela 2). Resultam da diminuição
dos eritrócitos e podem ocorrer devido a alterações nas proteínas de membrana (ex.
esferocitose hereditária), défices enzimáticos (ex. deficiência de glicose-6-fosfato
desidrogenass) e alterações da molécula hemoglobina (drepanocitose ou talassemias) (159).
Outra importante causa deste tipo de hiperbilirrubinémia é a icterícia neonatal que
pode resultar de: 1) aumento da síntese de bilirrubina, devido ao maior número de
eritrócitos e à menor semi-vida destes nos recém-nascidos; 2) diminuição da capacidade de
ligação e transporte da bilirrubina, pelo facto das concentrações séricas de albumina nos
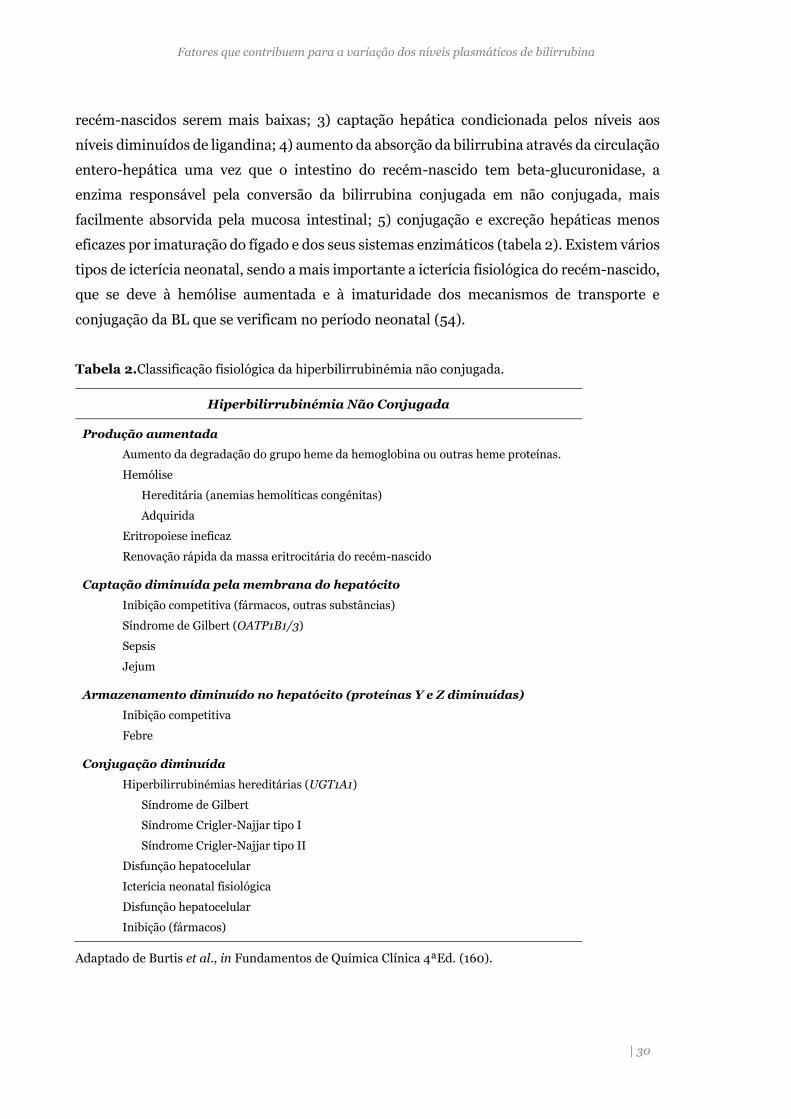
Fatores que contribuem para a variação dos níveis plasmáticos de bilirrubina
| 30
recém-nascidos serem mais baixas; 3) captação hepática condicionada pelos níveis aos
níveis diminuídos de ligandina; 4) aumento da absorção da bilirrubina através da circulação
entero-hepática uma vez que o intestino do recém-nascido tem beta-glucuronidase, a
enzima responsável pela conversão da bilirrubina conjugada em não conjugada, mais
facilmente absorvida pela mucosa intestinal; 5) conjugação e excreção hepáticas menos
eficazes por imaturação do fígado e dos seus sistemas enzimáticos (tabela 2). Existem vários
tipos de icterícia neonatal, sendo a mais importante a icterícia fisiológica do recém-nascido,
que se deve à hemólise aumentada e à imaturidade dos mecanismos de transporte e
conjugação da BL que se verificam no período neonatal (54).
Tabela 2.Classificação fisiológica da hiperbilirrubinémia não conjugada.
Adaptado de Burtis et al., in Fundamentos de Química Clínica 4ªEd. (160).
Hiperbilirrubinémia Não Conjugada
Produção aumentada
Aumento da degradação do grupo heme da hemoglobina ou outras heme proteínas.
Hemólise
Hereditária (anemias hemolíticas congénitas)
Adquirida
Eritropoiese ineficaz
Renovação rápida da massa eritrocitária do recém-nascido
Captação diminuída pela membrana do hepatócito
Inibição competitiva (fármacos, outras substâncias)
Síndrome de Gilbert (OATP1B1/3)
Sepsis
Jejum
Armazenamento diminuído no hepatócito (proteínas Y e Z diminuídas)
Inibição competitiva
Febre
Conjugação diminuída
Hiperbilirrubinémias hereditárias (UGT1A1)
Síndrome de Gilbert
Síndrome Crigler-Najjar tipo I
Síndrome Crigler-Najjar tipo II
Disfunção hepatocelular
Icterícia neonatal fisiológica
Disfunção hepatocelular
Inibição (fármacos)
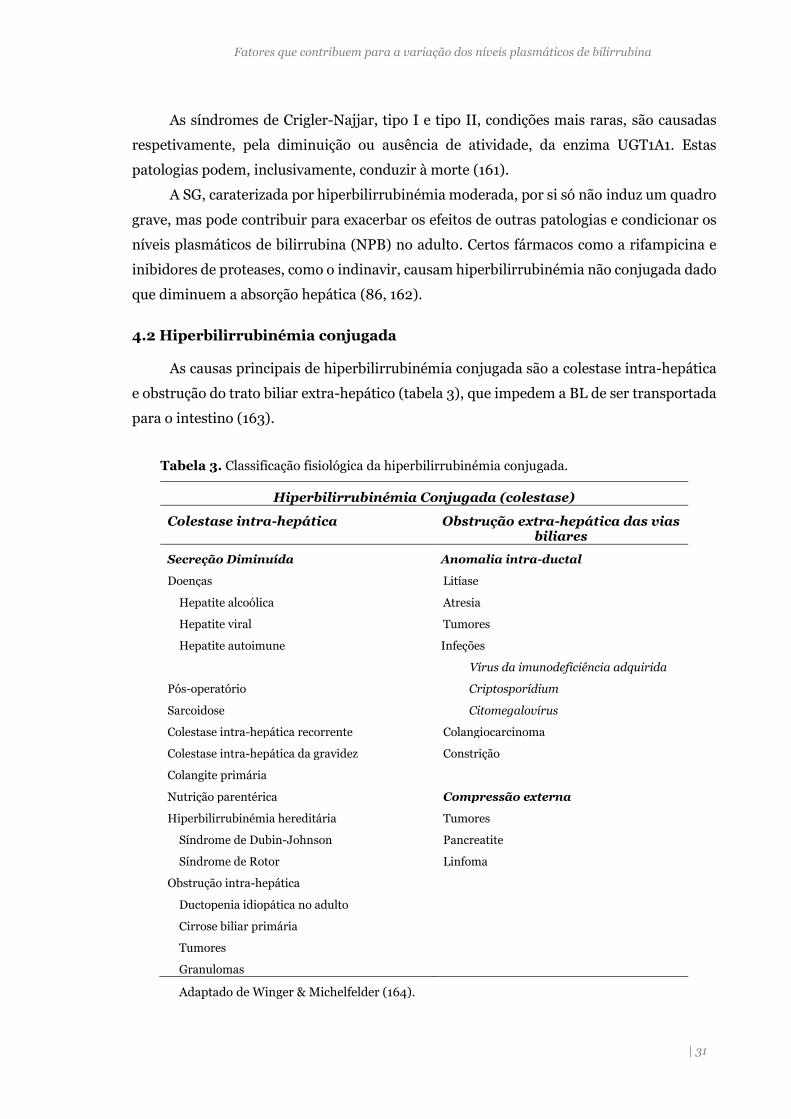
Fatores que contribuem para a variação dos níveis plasmáticos de bilirrubina
| 31
As síndromes de Crigler-Najjar, tipo I e tipo II, condições mais raras, são causadas
respetivamente, pela diminuição ou ausência de atividade, da enzima UGT1A1. Estas
patologias podem, inclusivamente, conduzir à morte (161).
A SG, caraterizada por hiperbilirrubinémia moderada, por si só não induz um quadro
grave, mas pode contribuir para exacerbar os efeitos de outras patologias e condicionar os
níveis plasmáticos de bilirrubina (NPB) no adulto. Certos fármacos como a rifampicina e
inibidores de proteases, como o indinavir, causam hiperbilirrubinémia não conjugada dado
que diminuem a absorção hepática (86, 162).
4.2 Hiperbilirrubinémia conjugada
As causas principais de hiperbilirrubinémia conjugada são a colestase intra-hepática
e obstrução do trato biliar extra-hepático (tabela 3), que impedem a BL de ser transportada
para o intestino (163).
Tabela 3. Classificação fisiológica da hiperbilirrubinémia conjugada.
Hiperbilirrubinémia Conjugada (colestase)
Colestase intra-hepática Obstrução extra-hepática das vias biliares
Secreção Diminuída Anomalia intra-ductal
Doenças Litíase
Hepatite alcoólica Atresia
Hepatite viral Tumores
Hepatite autoimune Infeções
Vírus da imunodeficiência adquirida
Pós-operatório
Sarcoidose
Criptosporídium
Citomegalovírus
Colestase intra-hepática recorrente Colangiocarcinoma
Colestase intra-hepática da gravidez Constrição
Colangite primária
Nutrição parentérica Compressão externa
Hiperbilirrubinémia hereditária Tumores
Síndrome de Dubin-Johnson Pancreatite
Síndrome de Rotor Linfoma
Obstrução intra-hepática
Ductopenia idiopática no adulto
Cirrose biliar primária
Tumores
Granulomas
Adaptado de Winger & Michelfelder (164).
Fatores que contribuem para a variação dos níveis plasmáticos de bilirrubina
| 32
Os sistemas de transporte hépato-biliares são essenciais para a absorção e a excreção
de vários compostos, incluindo ácidos biliares. A interrupção ou desregulação desta via
excretora resulta em colestase, levando à acumulação de ácidos biliares e outros compostos
tóxicos com a progressão da patologia hepática (165).
A colestase induzida por inflamação é uma complicação comum em doentes com
infeções extra-hepática ou processos inflamatórios, geralmente referidos como colestase
associada à sepsies (165). A infeção vírica, álcoolismo e doenças autoimunes são as causas
mais comuns de hepatite. O processo inflamatório associado, interrompe o transporte de
BC e causa a hiperbilirrubinémia. As hepatites B e C não causam icterícia frequentemente
durante as fases iniciais, mas podem levar a icterícia progressiva, quando a infeção crónica
progride para cirrose hepática (163, 166). Outro exemplo deste tipo de hiperbilirrubinémia,
é a colangite esclerosante, uma doença inflamatória crónica das vias biliares, caraterizada
por fadiga, icterícia e prurido.
4.3 Diagnóstico diferencial
Uma análise cuidada da história clínica de um doente e o exame físico são, geralmente,
suficientes para indicarem se a origem da icterícia é hepato-biliar ou secundária à presença
de outras doenças, como por exemplo, a hemólise ou infeção (164).
A avaliação laboratorial poderá ser necessária no diagnóstico diferencial do tipo de
hiperbilirrubinémia, nomeadamente, para distinguir se a origem é pré-hepática,
hepatocelular ou obstrutiva. Para tal, são importantes as seguintes determinações
analíticas: hemograma completo (incluindo por vezes reticulócitos e pesquisa de
esquisócitos no esfregaço de sangue periférico), função hepática (aspartato transaminase
(AST); alanina transaminase (ALT); fosfatase alcalina (FA); gama glutamil transferase
(GT), proteínas totais, albumina e avaliação da coagulação (tempo de protrombina e
tromboplastina parcial ativada) (167, 168). As frações de BT, BD e BI são primordiais para
direcionar o diagnóstico na fase inicial (167).
O hemograma é essencial para detetar se há diminuição da concentração de
hemoglobina, a contagem de reticulócitos para avaliar a atividade eritropoiética, que poderá
aumentar em caso de aumento de distribuição eritrocitária, e análise do esfregaço
sanguíneo para pesquisa de alterações morfológicas associadas a anemias hemolíticas.
Na função hepática, a ALT e a AST verificam a integridade do hepatócito (171). A ALT
é específica do parênquima hepático e a AST é também encontrada nos rins, cérebro, tecido
músculo-esquelético e cardíaco. A GT localiza-se nos hepatócitos e nas células epiteliais
biliares (169) está elevada na doença pancreática, enfarte do miocárdio, insuficiência renal,
doença pulmonar obstrutiva crónica, diabetes e alcoolismo (167). A FA está presente na
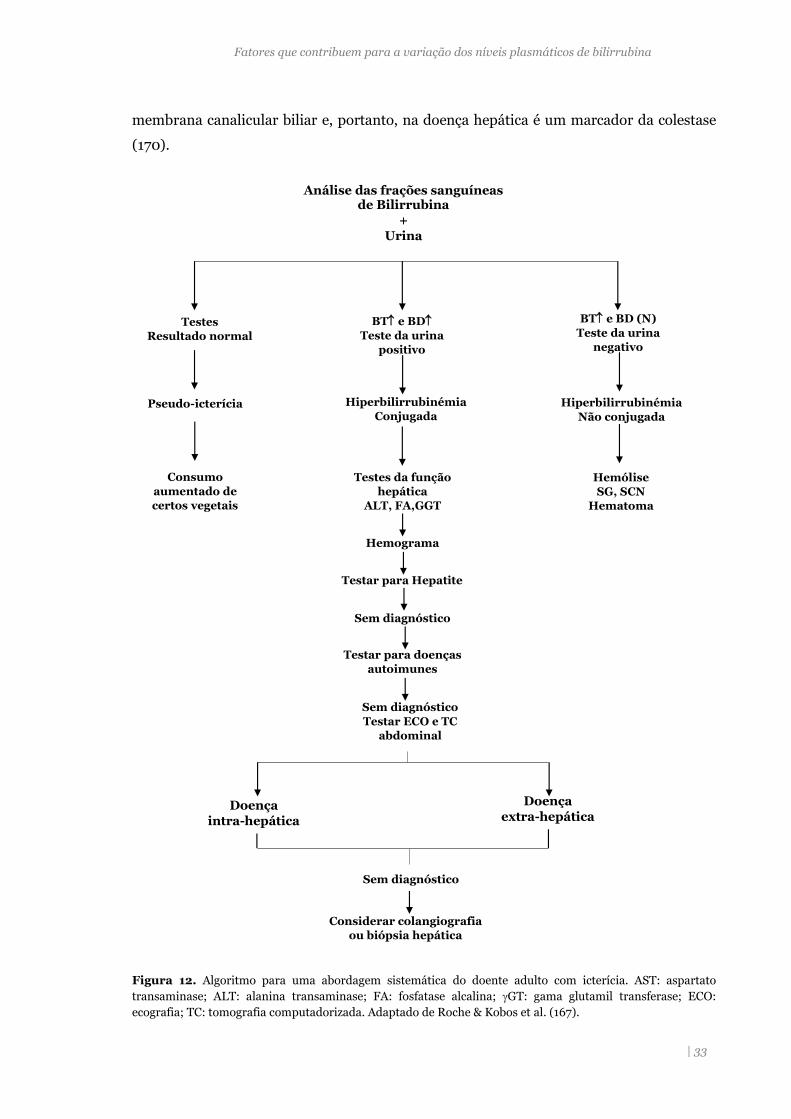
Fatores que contribuem para a variação dos níveis plasmáticos de bilirrubina
| 33
membrana canalicular biliar e, portanto, na doença hepática é um marcador da colestase
(170).
Figura 12. Algoritmo para uma abordagem sistemática do doente adulto com icterícia. AST: aspartato
transaminase; ALT: alanina transaminase; FA: fosfatase alcalina; GT: gama glutamil transferase; ECO:
ecografia; TC: tomografia computadorizada. Adaptado de Roche & Kobos et al. (167).
Análise das frações sanguíneas de Bilirrubina
+
Urina
Testes
Resultado normal
Pseudo-icterícia
Consumo
aumentado de
certos vegetais
BT e BD
Teste da urina
positivo
Hemólise
SG, SCN
Hematoma
BT e BD (N)
Teste da urina
negativo
Hiperbilirrubinémia
Conjugada Hiperbilirrubinémia
Não conjugada
Testes da função
hepática
ALT, FA,GGT
Hemograma
Sem diagnóstico
Testar para Hepatite
Testar para doenças
autoimunes
Doença
intra-hepática
Doença
extra-hepática
Sem diagnóstico
Testar ECO e TC
abdominal
Sem diagnóstico
Considerar colangiografia
ou biópsia hepática
Fatores que contribuem para a variação dos níveis plasmáticos de bilirrubina
| 34
As proteínas totais, a Alb e a maioria dos fatores da coagulação são sintetizados no fígado e,
portanto, os seus níveis plasmáticos diminuem quando há alterações na função hepática,
que afetam a sua síntese (167). Uma análise de urina, que seja positiva para a bilirrubina
indica a presença de hiperbilirrubinémia conjugada (167).
Dependendo dos resultados dos testes descritos, podem ser requeridos,
posteriormente, testes serológicos ou estudos de imagem. Nesta segunda abordagem podem
incluir-se testes para a deteção de antigénios da hepatite A e B, antigénios nucleares,
marcadores autoimunes e anticorpos microssomais do fígado e rim (167).
5. Propriedades da bilirrubina
A BL é um composto endógeno que, em determinadas concentrações, pode ser tóxico,
especialmente no período neonatal (171). Porém, há diversos estudos que têm reconhecido
a sua forte capacidade antioxidante, tanto em níveis fisiológicos como em níveis
moderadamente elevados (ex. Síndrome de Gilbert) com efeitos positivos para a saúde.
5.1 Efeito protetor
A capacidade antioxidante da BL foi demonstrada pela primeira vez por Stoker em
1987 (172). Em 1994, Schwertner e colaboradores mostraram que os níveis plasmáticos de
bilirrubina estavam inversamente relacionados com a presença de doença arterial coronária
(DAC) e foi sugerido que poderia atuar como fator protetor para as doenças
cardiovasculares e outras patologias relacionadas com stress oxidativo (173). As duas
abordagens desenvolvidas até hoje englobam por um lado, estudos de
bioquímicos/moleculares, no sentido de perceber qual o mecanismos pelo qual a BL exerce
o seu efeito protetor e, por outro, estudos epidemiológicos que pretendem estabelecer a
associação entre o risco de doença e os níveis de BL.
5.1.1 Mecanismos bioquímicos/moleculares
Está bem estabelecido que espécies reativas de oxigénio (ROS), espécies reativas de
nitrogénio (NOS) e outros radicais contribuem para o desenvolvimento de várias patologias
relacionadas com o envelhecimento através da indução de stress oxidativo. O stress
oxidativo é definido como uma perturbação no equilíbrio entre substâncias pró-oxidantes e
substâncias antioxidantes que conduz a alterações oxidativas nos lipídios, proteínas e ácidos
nucleicos (174). Este desequilíbrio pode resultar de baixos níveis de antioxidantes e/ou de
um aumento da produção de espécies reativas (175).
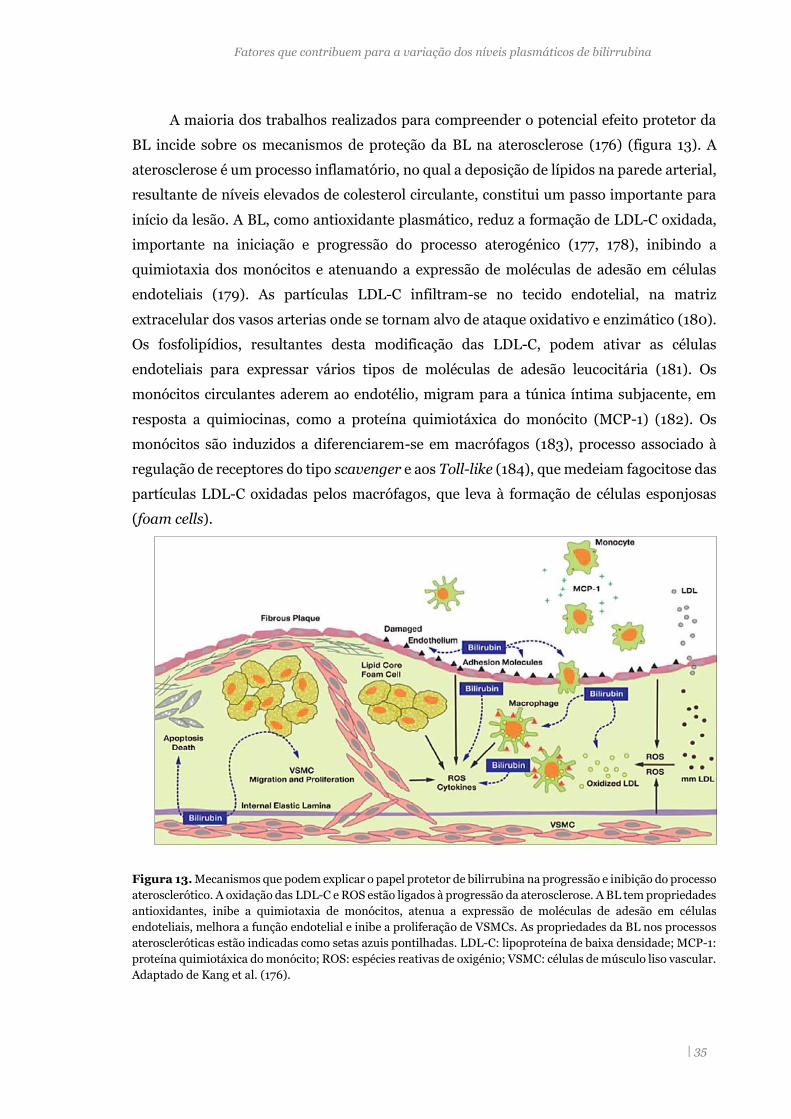
Fatores que contribuem para a variação dos níveis plasmáticos de bilirrubina
| 35
A maioria dos trabalhos realizados para compreender o potencial efeito protetor da
BL incide sobre os mecanismos de proteção da BL na aterosclerose (176) (figura 13). A
aterosclerose é um processo inflamatório, no qual a deposição de lípidos na parede arterial,
resultante de níveis elevados de colesterol circulante, constitui um passo importante para
início da lesão. A BL, como antioxidante plasmático, reduz a formação de LDL-C oxidada,
importante na iniciação e progressão do processo aterogénico (177, 178), inibindo a
quimiotaxia dos monócitos e atenuando a expressão de moléculas de adesão em células
endoteliais (179). As partículas LDL-C infiltram-se no tecido endotelial, na matriz
extracelular dos vasos arterias onde se tornam alvo de ataque oxidativo e enzimático (180).
Os fosfolipídios, resultantes desta modificação das LDL-C, podem ativar as células
endoteliais para expressar vários tipos de moléculas de adesão leucocitária (181). Os
monócitos circulantes aderem ao endotélio, migram para a túnica íntima subjacente, em
resposta a quimiocinas, como a proteína quimiotáxica do monócito (MCP-1) (182). Os
monócitos são induzidos a diferenciarem-se em macrófagos (183), processo associado à
regulação de receptores do tipo scavenger e aos Toll-like (184), que medeiam fagocitose das
partículas LDL-C oxidadas pelos macrófagos, que leva à formação de células esponjosas
(foam cells).
Figura 13. Mecanismos que podem explicar o papel protetor de bilirrubina na progressão e inibição do processo
aterosclerótico. A oxidação das LDL-C e ROS estão ligados à progressão da aterosclerose. A BL tem propriedades
antioxidantes, inibe a quimiotaxia de monócitos, atenua a expressão de moléculas de adesão em células
endoteliais, melhora a função endotelial e inibe a proliferação de VSMCs. As propriedades da BL nos processos
ateroscleróticas estão indicadas como setas azuis pontilhadas. LDL-C: lipoproteína de baixa densidade; MCP-1:
proteína quimiotáxica do monócito; ROS: espécies reativas de oxigénio; VSMC: células de músculo liso vascular.
Adaptado de Kang et al. (176).
Fatores que contribuem para a variação dos níveis plasmáticos de bilirrubina
| 36
Os receptores Toll-like dão início às cascatas de sinalização que levam à ativação
inflamatória, p0dendo causar a libertação de moléculas vasoativas como óxido nítrico,
endotelinas e vários eicosanóides (184).
As propriedades anti-inflamatórias da BL foram demonstradas pela capacidade em
inibir o fator de necrose tumoral (TNF-α), responsável pela indução da expressão de
moléculas de adesão (185). Num estudo que avaliou a redução da incidência de doença
cardiovascular em portadores da síndrome de Gilbert verificou-se uma associação negativa
entre os NPB e os valores de formas solúveis do ligando CD40 e P-selectina, dois marcadores
do processo inflamatório e de ativação a aterosclerose (186). Outros trabalhos mostraram
que a BL reduzia a proliferação das células endoteliais através da inibição de vias
metabólicas relacionadas com o crescimento celular, como por exemplo a fosforilação da
p38 MAPK (Mitogen Activated Protein Kinase) (187, 188).
As propriedades da BL como antioxidante foram comprovadas no modelo animal de
rato Gunn, com uma deficiência autossómica recessiva da enzima UGT1A1 e, portanto, com
hiperbilirrubinémia. Os animais homozigotos eram hiperbilirrubinémicos e os
heterozigóticos apresentavam níveis normais de BL (189). A utilização deste mesmo modelo
animal mostrou, in vivo, que a bilirrubina sérica exercia um efeito protetor contra os danos
oxidativos durante os primeiros dias de vida em ratos Gunn expostos a hipoxia e com
icterícia neonatal (85). Também se verificou noutro estudo, que a BL, in vitro, podia ter
uma ação inibidora da peroxidação lipídica nos eritrócitos do cordão umbilical (190).
Outro efeito protetor da bilirrubina é a sua atividade anti-carcinogénica (191), como
se verificou em células Caco2 (células epiteliais humanas de adenocarcinoma colorectal) e
HepG2 (células hepáticas), onde a adição de compostos tetraprirrólicos, como a
protoporfirina, urobilina ou estercobilina, induzia lesões no DNA e a apoptose de células
tumorais (191).
A albumina é outro importante antioxidante do plasma e contribui em cerca de 70%,
na eliminação de radicais livres, devido ao seu grupo tiol e à sua elevada concentração
plasmática (192). A atividade antioxidante indireta da albumina parece deocorrer da sua
capacidade para transportar a BL, que se liga com alta afinidade à Alb no resíduo de lisina
(p.L240) (193). Além disso, como ligando do radical de cobre (CuII) com a Alb previne a
formação de ROS induzida por este metal (194). Vários estudos populacionais de meta-
análise sobre a Alb e doença arterial coronária mostraram uma associação inversa entre a
concentração de albumina no plasma e o risco para a DAC (195) e a mortalidade (196). A
Alb transporta ainda os ácidos gordos livres na circulação sanguínea e, pensa-se que o
complexo BL-Alb tenha uma ação sinérgica para evitar a oxidação desses ácidos gordos,
inibindo o início da peroxidação lipídica (197). Também se verificou que este complexo
protegia o -tocoferol celular dos danos provocados pelos radicas peróxido (198). A
Fatores que contribuem para a variação dos níveis plasmáticos de bilirrubina
| 37
bilirrubina- ou seja, a BL covalentemente ligada à Alb, obtida sinteticamente, parece
prolongar a sobrevivência dos miócitos ventriculares humanos contra radicais livres (199).
5.1.2 Estudos epidemiológicos e clínicos
Atualmente há vários estudos que estabeleceram uma associação entre baixos NPB e
a presença e gravidade de doenças cardiovasculares (200, 201) e com as respetivas
comorbilidades, como, por exemplo, a diabetes mellitus tipo 2 (202), hipertensão síndrome
metabólica (203), doença renal crónica (204) e albuminúria (205). A tabela 4 apresenta
uma revisão da bibliografia sobre a associação de baixos níveis de NPB com o risco ou a
presença de várias patologias. Verifica-se que existem muitos estudos transversais e
longitudinais sobre a associação dos níveis de BL com diferentes patologias, a maior parte
está relacionada com doenças cardiovasculares. Foi observada associação com outras
situações patológicas cuja fisiopatologia também está relacionada com stress oxidativo,
como a artrite reumatóide (206), esclerose múltipla (207), cancro (208, 209) e mortalidade
em geral (61). Do mesmo modo, foi feita a análise da relação entre os NPB e outros fatores
de risco para estas doenças crónicas, como por exemplo perfil lipídico (210, 211), índices
antropométricos (212, 213) e proteína C reativa (214).
Muitos dos estudos apresentados foram realizados em amostras que incluíam
indivíduos com a SG, caracterizada por hiperbilirrubinémia moderada, e têm servido como
modelo para pesquisar os pretensos benefícios de NPB mais elevados (215). Como o
polimorfismo c.-41_-40dupTA, em homozigotia, é considerado a principal causa de SG,
muitos trabalhos de investigação são realizados com base na associação do genótipo e a
presença de doença ou com os seus fatores de risco (211, 216).
Em vários estudos epidemiológicos foi identificada uma associação negativa entre o
índice de massa corporal (IMC) e a concentração da BL (66, 203, 217, 218). Foi observada
uma associação positiva entre a concentração de HDL-C e a BL plasmática, enquanto que
com as outras frações de colesterol, não-HDL-C, se verificou uma associação inversa (219).
A baixa incidência de DCV em pessoas com elevadas concentrações de BNC foi,
inicialmente, atribuída apenas à capacidade antioxidante da BL. Estas observações sugerem
que a BL é também um agente hipolipidémico fisiológico que protege contra doenças
cardiovasculares (201).
Como a produção de BL é dependente da atividade da enzima HO, tem sido sugerido
que esta enzima possa constituir um potencial alvo terapêutico em doenças
vasculares(220). Por exemplo, a isoforma indutível, HO-1, desempenha um papel na
reparação vascular, aumentando a circulação de células progenitoras endoteliais (221).
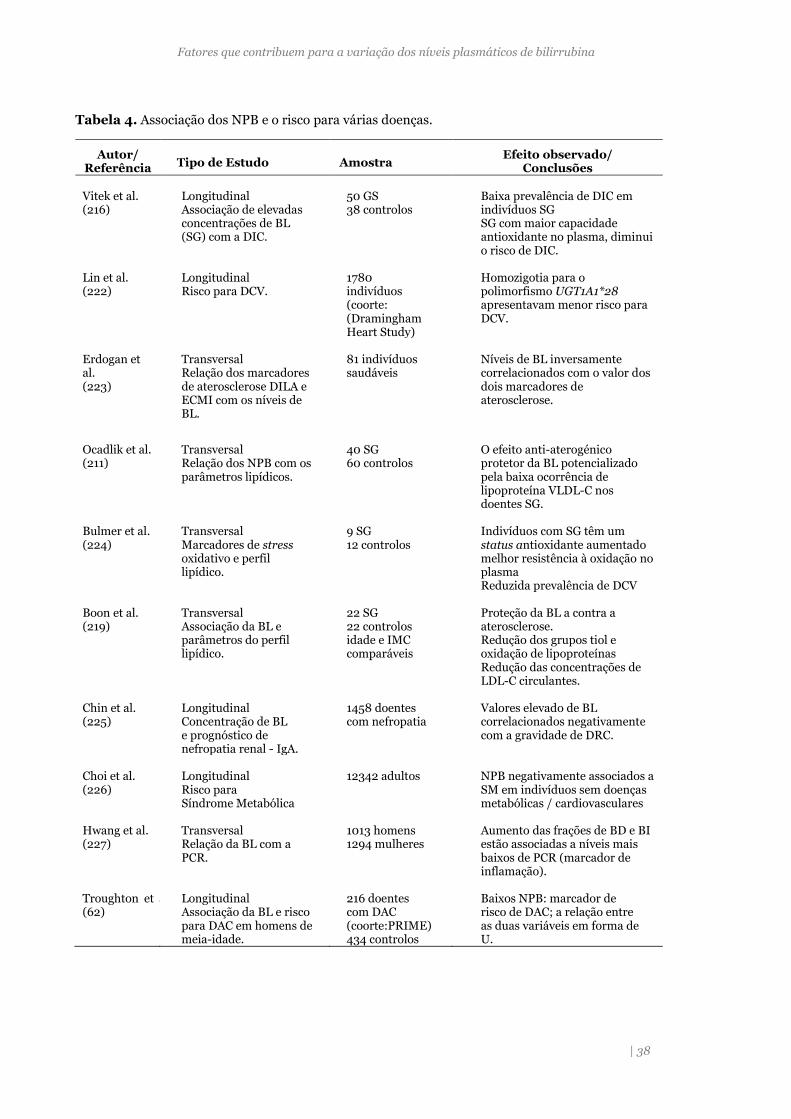
Fatores que contribuem para a variação dos níveis plasmáticos de bilirrubina
| 38
Tabela 4. Associação dos NPB e o risco para várias doenças.
Autor/ Referência Tipo de Estudo Amostra
Efeito observado/ Conclusões
Vitek et al. (216)
Longitudinal Associação de elevadas concentrações de BL (SG) com a DIC.
50 GS 38 controlos
Baixa prevalência de DIC em indivíduos SG SG com maior capacidade antioxidante no plasma, diminui o risco de DIC.
Lin et al. (222)
Longitudinal Risco para DCV.
1780 indivíduos (coorte: (Dramingham Heart Study)
Homozigotia para o polimorfismo UGT1A1*28 apresentavam menor risco para DCV.
Erdogan et al. (223)
Transversal Relação dos marcadores de aterosclerose DILA e ECMI com os níveis de BL.
81 indivíduos saudáveis
Níveis de BL inversamente correlacionados com o valor dos dois marcadores de aterosclerose.
Ocadlik et al. (211)
Transversal Relação dos NPB com os parâmetros lipídicos.
40 SG 60 controlos
O efeito anti-aterogénico protetor da BL potencializado pela baixa ocorrência de lipoproteína VLDL-C nos doentes SG.
Bulmer et al. (224)
Transversal Marcadores de stress oxidativo e perfil lipídico.
9 SG 12 controlos
Indivíduos com SG têm um status antioxidante aumentado melhor resistência à oxidação no plasma Reduzida prevalência de DCV
Boon et al. (219)
Transversal Associação da BL e parâmetros do perfil lipídico.
22 SG 22 controlos idade e IMC comparáveis
Proteção da BL a contra a aterosclerose. Redução dos grupos tiol e oxidação de lipoproteínas Redução das concentrações de LDL-C circulantes.
Chin et al. (225)
Longitudinal Concentração de BL e prognóstico de nefropatia renal - IgA.
1458 doentes com nefropatia
Valores elevado de BL correlacionados negativamente com a gravidade de DRC.
Choi et al. (226)
Longitudinal Risco para Síndrome Metabólica
12342 adultos
NPB negativamente associados a SM em indivíduos sem doenças metabólicas / cardiovasculares
Hwang et al. (227)
Transversal Relação da BL com a PCR.
1013 homens 1294 mulheres
Aumento das frações de BD e BI estão associadas a níveis mais baixos de PCR (marcador de inflamação).
Troughton et al. (62)
Longitudinal Associação da BL e risco para DAC em homens de meia-idade.
216 doentes com DAC (coorte:PRIME) 434 controlos
Baixos NPB: marcador de risco de DAC; a relação entre as duas variáveis em forma de U.
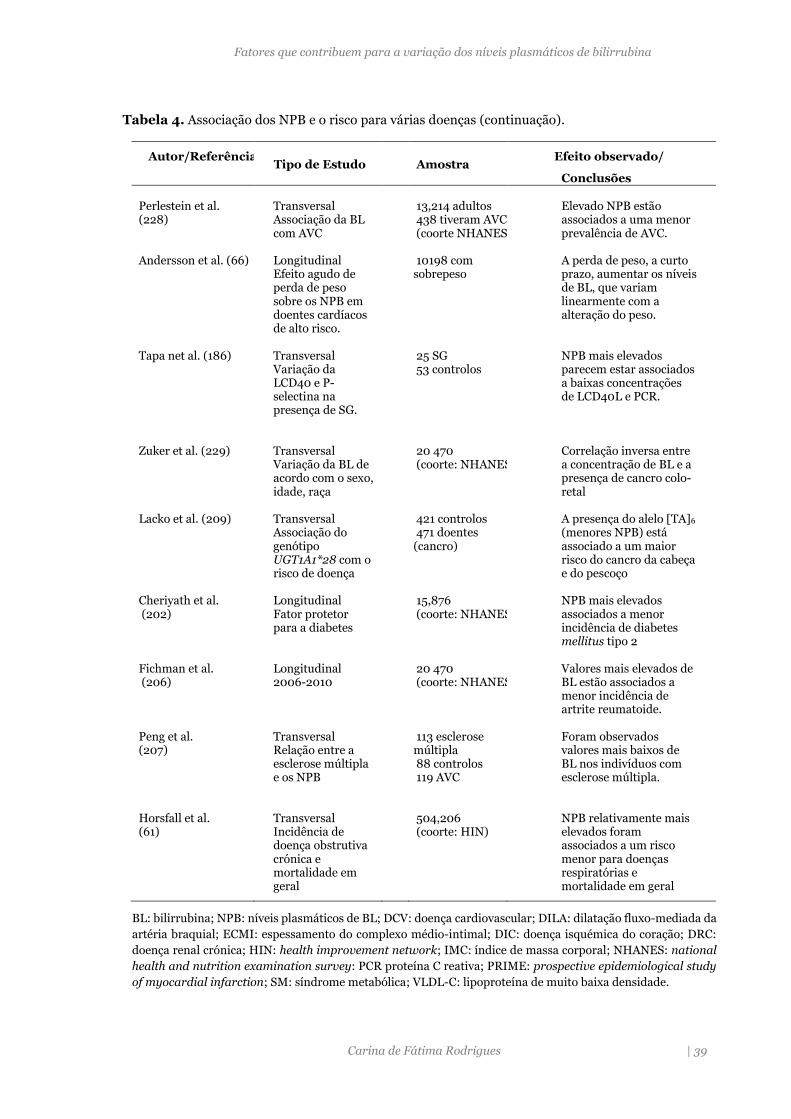
Fatores que contribuem para a variação dos níveis plasmáticos de bilirrubina
Carina de Fátima Rodrigues | 39
Tabela 4. Associação dos NPB e o risco para várias doenças (continuação).
BL: bilirrubina; NPB: níveis plasmáticos de BL; DCV: doença cardiovascular; DILA: dilatação fluxo-mediada da
artéria braquial; ECMI: espessamento do complexo médio-intimal; DIC: doença isquémica do coração; DRC:
doença renal crónica; HIN: health improvement network; IMC: índice de massa corporal; NHANES: national
health and nutrition examination survey: PCR proteína C reativa; PRIME: prospective epidemiological study
of myocardial infarction; SM: síndrome metabólica; VLDL-C: lipoproteína de muito baixa densidade.
Autor/Referência Tipo de Estudo Amostra
Efeito observado/
Conclusões Perlestein et al. (228)
Transversal Associação da BL com AVC
13,214 adultos 438 tiveram AVC (coorte NHANES)
Elevado NPB estão associados a uma menor prevalência de AVC.
Andersson et al. (66)
Longitudinal Efeito agudo de perda de peso sobre os NPB em doentes cardíacos de alto risco.
10198 com sobrepeso
A perda de peso, a curto prazo, aumentar os níveis de BL, que variam linearmente com a alteração do peso.
Tapa net al. (186)
Transversal Variação da LCD40 e P-selectina na presença de SG.
25 SG 53 controlos
NPB mais elevados parecem estar associados a baixas concentrações de LCD40L e PCR.
Zuker et al. (229)
Transversal Variação da BL de acordo com o sexo, idade, raça
20 470 (coorte: NHANES)
Correlação inversa entre a concentração de BL e a presença de cancro colo-retal
Lacko et al. (209)
Transversal Associação do genótipo UGT1A1*28 com o risco de doença
421 controlos 471 doentes (cancro)
A presença do alelo [TA]6
(menores NPB) está associado a um maior risco do cancro da cabeça e do pescoço
Cheriyath et al. (202)
Longitudinal Fator protetor para a diabetes
15,876 (coorte: NHANES)
NPB mais elevados associados a menor incidência de diabetes mellitus tipo 2
Fichman et al. (206)
Longitudinal 2006-2010
20 470 (coorte: NHANES)
Valores mais elevados de BL estão associados a menor incidência de artrite reumatoide.
Peng et al. (207)
Transversal Relação entre a esclerose múltipla e os NPB
113 esclerose múltipla 88 controlos 119 AVC
Foram observados valores mais baixos de BL nos indivíduos com esclerose múltipla.
Horsfall et al. (61)
Transversal Incidência de doença obstrutiva crónica e mortalidade em geral
504,206 (coorte: HIN)
NPB relativamente mais elevados foram associados a um risco menor para doenças respiratórias e mortalidade em geral
Fatores que contribuem para a variação dos níveis plasmáticos de bilirrubina
Carina de Fátima Rodrigues | 40
Mais recentemente, utilizando como modelo animal de rato, verificou-se que a
administração exógena de BL impedia a oxidação da cardiolipina e diminuía a extensão do
enfarte do miocárdio durante a isquemia (230). Estes dados apontam para a oportunidade
de delinear novos tratamentos para estas doenças.
5.2 Toxicidade da bilirrubina
São bem conhecidas as consequências de elevados níveis plasmáticos de BL circulante
no recém-nascido (171, 231), nomeadamente na encefalopatia bilirrubínica (kernicterus)
em que a bilirrubina é citotóxica. Apesar de se ter verificado que níveis normais da BNC
conferem proteção contra danos oxidativos no cérebro (232), a sua elevada concentração
pode causar alterações neurológicas e, inclusivamente, provocar a morte (171, 231). Para
compreender os eventuais mecanismos da toxicidade da BL no cérebro e noutros tecidos
foram realizados vários trabalhos experimentais em modelos animais e estudos in vitro. A
célula neuronal e o eritrócito são modelos muito utilizados nestes estudos. Os primeiros
trabalhos realizados indicaram como mecanismo básico, subjacente à toxicidade da BL, a
inibição da fosforilação oxidativa (171). Verificou-se que a BL provocava a morte por
apoptose nas células endoteliais microvasculares cerebrais de bovino, através da indução
de marcadores apoptóticos, como a fragmentação de DNA e a clivagem da PARP (poly ADP
ribose polymerase) (233). Rodrigues e colaboradores (234), demonstraram que a morte de
neurónios cultivados na presença de BL, ocorria através de um mecanismo apoptótico,
mediado pela mitocôndria, com perda de assimetria dos fosfolípidos. Mais recentemente, o
mesmo grupo de trabalho verificou que a BL inibia seletivamente a atividade da citocromo
c oxidase e induzia a apoptose em neurónios corticais imaturos (235). Tal como se observou
para o seu efeito antioxidante, a toxicidade da BL ocorre a concentrações muito pequenas,
na ordem dos micromoles (171). Os estudos sobre a toxicidade da BL foram também
realizados em eritrócitos devido à sua acessibilidade, ausência de organelos intracelulares e
as semelhanças de alguns componentes de membrana com outros tipos de células (236).
Dada esta dualidade da BL, pretendeu-se determinar a concentração a partir da qual
a BL seria tóxica. A BL, em concentrações fisiológicas, protege os eritrócitos dos recém-
nascidos contra o stress oxidativo, na presença de concentrações normais de Alb (237). Mas
quando o valor de BL atinge os 30 mg/dL e a razão molar de BNC /albumina (BL/Alb)
excede o valor de 1.0, há uma elevada toxicidade associada, dado que, nestas condições,
aumenta a fração de BL livre, fração que pode facilmente inserir-se nas células e causar
toxicidade (238). Uma revisão bibliográfica sobre a toxicidade da BNC no eritrócito mostrou
que: a ligação da BNC aos eritrócitos humanos, durante a icterícia neonatal, provocava
toxicidade; os eritrócitos neonatais eram mais propensos à toxicidade induzida por BNC do
Fatores que contribuem para a variação dos níveis plasmáticos de bilirrubina
Carina de Fátima Rodrigues | 41
que os eritrócitos de adultos; a BNC aumentava a formação de vesículas intracelulares em
eritrócitos neonatais; a BNC lesava as propriedades dinâmicas da membrana, havendo um
agravamento em condições de acidose (239).
Tal como se observa na toxicidade induzida pela elevada concentração de BL, que
promove alterações na dinâmica da membrana do eritrócito, também há outras substâncias
que podem induzir este tipo de perturbações. As modificações moleculares subjacentes à
“desorganização” da membrana celular do eritrócito, na presença de substâncias tóxicas
(240, 241), têm sido avaliadas através de estudos na proteína da banda 3, uma proteína
transmembranar, que atua como trocador aniónico e constitui um elemento chave na
manutenção da integridade da membrana (242). Apresenta um domínio externo,
enriquecido em cadeias glicosil que, provavelmente, permite que a proteína seja
reconhecida como um antigénio específico (242). Esta proteína, quer por clivagem
proteolítica, agregação ou exposição de epítopos invulgares, induz a ligação de anticorpos
naturais anti-banda 3 que desencadeiam ativação do sistema complemento (marcando a
célula para morte), seguindo-se a opsonização e o reconhecimento final pelos macrófagos
(243). A proteína banda 3 é, por isso, conhecida como neoantigénio de senescência.
Em eritrócitos humanos, a atividade de fosforilação da tirosina (P-tyr) de proteínas
da membrana envolve principalmente a proteína banda 3 (244). Tem sido sugerido que a
análise da atividade P-tyr possa servir como marcador do status da membrana em situações
de toxicidade causadas pelo fármaco dapsona (240). Nestes trabalhos também foram
analisadas as alterações moleculares na banda 3 (90, 240), os agregados de alto peso
molecular e as formas monoméricas ou fragmentos proteolític0s, que são marcadores
utilizados para estudar o dano oxidativo no eritrócito (245). A proteína banda 3 pode
constituir, no futuro, um marcador poderoso de toxicidade e dano oxidativo.

Carina de Fátima Rodrigues | 43
CAPÍTULO II – Objetivos

Objetivos
Carina de Fátima Rodrigues | 45
A constatação de que a bilirrubina tem actividade antioxidante, assim como anti-
inflamatória e anti-carcinogénica, veio enfatizar a importância de avaliar os fatores que
possam modular os seus níveis plasmáticos, tanto na população em geral como em
indivíduos com SG. Há vários fatores que se sabe terem influência nos níveis plasmáticos
de bilirrubina, designadamente genéticos e não genéticos. Deste modo, o objetivo deste
estudo foi analisar a contribuição de variáveis ambientais e das alterações no gene UGT1A1
(região reguladora e codificante) na modificação dos níveis plasmáticos de bilirrubina
(artigo 1 e 2):
Artigo 1: Bilirubin is mainly dependent on UGT1A1 polymorphisms, hemoglobin, fasting time
and body mass index. Am J Med Sci 343(2):114-8; 2012.
Artigo 2: Impact of UGT1A1 gene variants on total bilirubin levels in Gilbert Syndrome patients
and in healthy subjects. Blood Cells Mol Dis. 2012; 48(3):166-72; 2012.
Durante muitos anos a bilirrubina foi considerada apenas um produto de excreção,
sem qualquer significado biológico. No entanto, no final da década de 80 foi comprovada a
capacidade antioxidante da bilirrubina e, no início da década de 90, foi demonstrado que os
níveis plasmáticos de bilirrubina estavam inversamente relacionados com o risco de doença
arterial coronária. Estes conhecimentos justificaram o desenvolvimento de vários trabalhos
que apontam para o efeito protetor da bilirrubina nas doenças cardiovasculares e noutras
patologias associadas com stress oxidativo. Assim, foi também objetivo deste trabalho
confirmar o potencial antioxidante da bilirrubina, através da avaliação do impacto de níveis
de bilirrubina ligeiramente aumentados, presente em indivíduos homozigóticos e
heterozigóticos para a duplicação TA no promotor do gene UGT1A1, em diferentes
marcadores sanguíneos de stress oxidativo, nomeadamente, utilizando o eritrócito como
modelo de acumulação de danos oxidativos e quantificação de alguns parâmetros
plasmáticos. Os resultados obtidos estão descritos no artigo 3:
Artigo 3: Bilirubin levels and redox status in a young healthy population. Acta Hematol
130:57-60; 2013.
Os estudos genéticos efetuados permitiram identificar 9 nsSNPs no gene UGT1A1, 2
já descritos na literatura e 7 detetados pela primeira vez neste estudo. Para avaliar a
patogenicidade das variantes no gene UGT1A1 usaram-se várias ferramentas
Objetivos
Carina de Fátima Rodrigues | 46
bioinformáticas que têm a capacidade de predizer o fenótipo das novas variantes sem
estudos funcionais. Os resultados obtidos são descritos no artigo 4:
Artigo 4: Performance of in silico tools for evaluating UGT1A1 missense variants
(submetido para publicação).
CAPÍTULO III – Publicações


Artigo I
_____________________________________________________________________

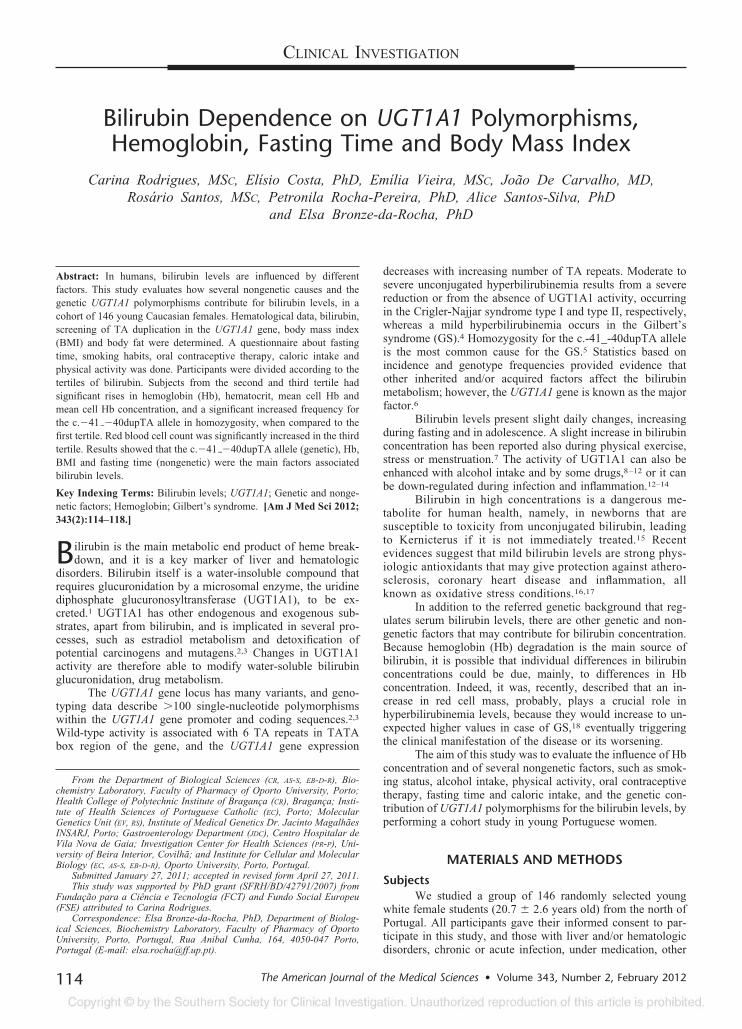
CLINICAL INVESTIGATION
Bilirubin Dependence on UGT1A1 Polymorphisms,Hemoglobin, Fasting Time and Body Mass Index
Carina Rodrigues, MSC, Elísio Costa, PhD, Emília Vieira, MSC, Joao De Carvalho, MD,Rosario Santos, MSC, Petronila Rocha-Pereira, PhD, Alice Santos-Silva, PhD
and Elsa Bronze-da-Rocha, PhD
Abstract: In humans, bilirubin levels are influenced by differentfactors. This study evaluates how several nongenetic causes and thegenetic UGT1A1 polymorphisms contribute for bilirubin levels, in acohort of 146 young Caucasian females. Hematological data, bilirubin,screening of TA duplication in the UGT1A1 gene, body mass index(BMI) and body fat were determined. A questionnaire about fastingtime, smoking habits, oral contraceptive therapy, caloric intake andphysical activity was done. Participants were divided according to thetertiles of bilirubin. Subjects from the second and third tertile hadsignificant rises in hemoglobin (Hb), hematocrit, mean cell Hb andmean cell Hb concentration, and a significant increased frequency forthe c.�41 ��40dupTA allele in homozygosity, when compared to thefirst tertile. Red blood cell count was significantly increased in the thirdtertile. Results showed that the c.�41 ��40dupTA allele (genetic), Hb,BMI and fasting time (nongenetic) were the main factors associatedbilirubin levels.
Key Indexing Terms: Bilirubin levels; UGT1A1; Genetic and nonge-netic factors; Hemoglobin; Gilbert’s syndrome. [Am J Med Sci 2012;343(2):114–118.]
Bilirubin is the main metabolic end product of heme break-down, and it is a key marker of liver and hematologic
disorders. Bilirubin itself is a water-insoluble compound thatrequires glucuronidation by a microsomal enzyme, the uridinediphosphate glucuronosyltransferase (UGT1A1), to be ex-creted.1 UGT1A1 has other endogenous and exogenous sub-strates, apart from bilirubin, and is implicated in several pro-cesses, such as estradiol metabolism and detoxification ofpotential carcinogens and mutagens.2,3 Changes in UGT1A1activity are therefore able to modify water-soluble bilirubinglucuronidation, drug metabolism.
The UGT1A1 gene locus has many variants, and geno-typing data describe �100 single-nucleotide polymorphismswithin the UGT1A1 gene promoter and coding sequences.2,3
Wild-type activity is associated with 6 TA repeats in TATAbox region of the gene, and the UGT1A1 gene expression
decreases with increasing number of TA repeats. Moderate tosevere unconjugated hyperbilirubinemia results from a severereduction or from the absence of UGT1A1 activity, occurringin the Crigler-Najjar syndrome type I and type II, respectively,whereas a mild hyperbilirubinemia occurs in the Gilbert’ssyndrome (GS).4 Homozygosity for the c.-41_-40dupTA alleleis the most common cause for the GS.5 Statistics based onincidence and genotype frequencies provided evidence thatother inherited and/or acquired factors affect the bilirubinmetabolism; however, the UGT1A1 gene is known as the majorfactor.6
Bilirubin levels present slight daily changes, increasingduring fasting and in adolescence. A slight increase in bilirubinconcentration has been reported also during physical exercise,stress or menstruation.7 The activity of UGT1A1 can also beenhanced with alcohol intake and by some drugs,8–12 or it canbe down-regulated during infection and inflammation.12–14
Bilirubin in high concentrations is a dangerous me-tabolite for human health, namely, in newborns that aresusceptible to toxicity from unconjugated bilirubin, leadingto Kernicterus if it is not immediately treated.15 Recentevidences suggest that mild bilirubin levels are strong phys-iologic antioxidants that may give protection against athero-sclerosis, coronary heart disease and inflammation, allknown as oxidative stress conditions.16,17
In addition to the referred genetic background that reg-ulates serum bilirubin levels, there are other genetic and non-genetic factors that may contribute for bilirubin concentration.Because hemoglobin (Hb) degradation is the main source ofbilirubin, it is possible that individual differences in bilirubinconcentrations could be due, mainly, to differences in Hbconcentration. Indeed, it was, recently, described that an in-crease in red cell mass, probably, plays a crucial role inhyperbilirubinemia levels, because they would increase to un-expected higher values in case of GS,18 eventually triggeringthe clinical manifestation of the disease or its worsening.
The aim of this study was to evaluate the influence of Hbconcentration and of several nongenetic factors, such as smok-ing status, alcohol intake, physical activity, oral contraceptivetherapy, fasting time and caloric intake, and the genetic con-tribution of UGT1A1 polymorphisms for the bilirubin levels, byperforming a cohort study in young Portuguese women.
MATERIALS AND METHODS
SubjectsWe studied a group of 146 randomly selected young
white female students (20.7 � 2.6 years old) from the north ofPortugal. All participants gave their informed consent to par-ticipate in this study, and those with liver and/or hematologicdisorders, chronic or acute infection, under medication, other
From the Department of Biological Sciences (CR, AS-S, EB-D-R), Bio-chemistry Laboratory, Faculty of Pharmacy of Oporto University, Porto;Health College of Polytechnic Institute of Braganca (CR), Braganca; Insti-tute of Health Sciences of Portuguese Catholic (EC), Porto; MolecularGenetics Unit (EV, RS), Institute of Medical Genetics Dr. Jacinto MagalhaesINSARJ, Porto; Gastroenterology Department (JDC), Centro Hospitalar deVila Nova de Gaia; Investigation Center for Health Sciences (PR-P), Uni-versity of Beira Interior, Covilha; and Institute for Cellular and MolecularBiology (EC, AS-S, EB-D-R), Oporto University, Porto, Portugal.
Submitted January 27, 2011; accepted in revised form April 27, 2011.This study was supported by PhD grant (SFRH/BD/42791/2007) from
Fundacao para a Ciencia e Tecnologia (FCT) and Fundo Social Europeu(FSE) attributed to Carina Rodrigues.
Correspondence: Elsa Bronze-da-Rocha, PhD, Department of Biolog-ical Sciences, Biochemistry Laboratory, Faculty of Pharmacy of OportoUniversity, Porto, Portugal, Rua Anibal Cunha, 164, 4050-047 Porto,Portugal (E-mail: [email protected]).
The American Journal of the Medical Sciences • Volume 343, Number 2, February 2012114
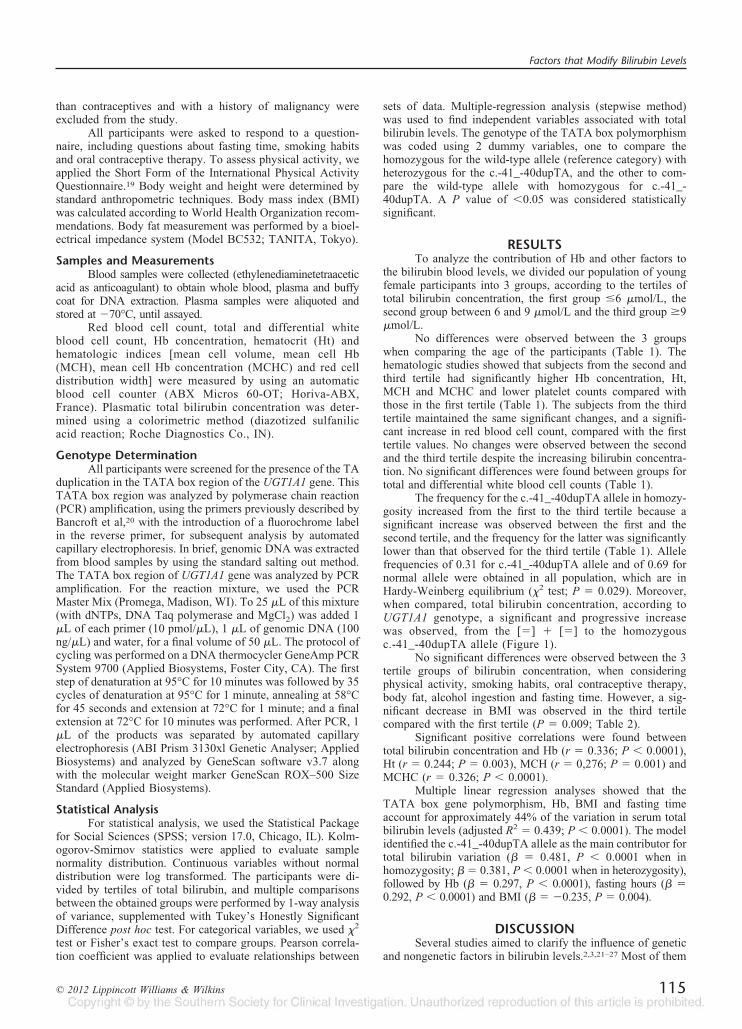
than contraceptives and with a history of malignancy wereexcluded from the study.
All participants were asked to respond to a question-naire, including questions about fasting time, smoking habitsand oral contraceptive therapy. To assess physical activity, weapplied the Short Form of the International Physical ActivityQuestionnaire.19 Body weight and height were determined bystandard anthropometric techniques. Body mass index (BMI)was calculated according to World Health Organization recom-mendations. Body fat measurement was performed by a bioel-ectrical impedance system (Model BC532; TANITA, Tokyo).
Samples and MeasurementsBlood samples were collected (ethylenediaminetetraacetic
acid as anticoagulant) to obtain whole blood, plasma and buffycoat for DNA extraction. Plasma samples were aliquoted andstored at �70°C, until assayed.
Red blood cell count, total and differential whiteblood cell count, Hb concentration, hematocrit (Ht) andhematologic indices [mean cell volume, mean cell Hb(MCH), mean cell Hb concentration (MCHC) and red celldistribution width] were measured by using an automaticblood cell counter (ABX Micros 60-OT; Horiva-ABX,France). Plasmatic total bilirubin concentration was deter-mined using a colorimetric method (diazotized sulfanilicacid reaction; Roche Diagnostics Co., IN).
Genotype DeterminationAll participants were screened for the presence of the TA
duplication in the TATA box region of the UGT1A1 gene. ThisTATA box region was analyzed by polymerase chain reaction(PCR) amplification, using the primers previously described byBancroft et al,20 with the introduction of a fluorochrome labelin the reverse primer, for subsequent analysis by automatedcapillary electrophoresis. In brief, genomic DNA was extractedfrom blood samples by using the standard salting out method.The TATA box region of UGT1A1 gene was analyzed by PCRamplification. For the reaction mixture, we used the PCRMaster Mix (Promega, Madison, WI). To 25 �L of this mixture(with dNTPs, DNA Taq polymerase and MgCl2) was added 1�L of each primer (10 pmol/�L), 1 �L of genomic DNA (100ng/�L) and water, for a final volume of 50 �L. The protocol ofcycling was performed on a DNA thermocycler GeneAmp PCRSystem 9700 (Applied Biosystems, Foster City, CA). The firststep of denaturation at 95°C for 10 minutes was followed by 35cycles of denaturation at 95°C for 1 minute, annealing at 58°Cfor 45 seconds and extension at 72°C for 1 minute; and a finalextension at 72°C for 10 minutes was performed. After PCR, 1�L of the products was separated by automated capillaryelectrophoresis (ABI Prism 3130xl Genetic Analyser; AppliedBiosystems) and analyzed by GeneScan software v3.7 alongwith the molecular weight marker GeneScan ROX–500 SizeStandard (Applied Biosystems).
Statistical AnalysisFor statistical analysis, we used the Statistical Package
for Social Sciences (SPSS; version 17.0, Chicago, IL). Kolm-ogorov-Smirnov statistics were applied to evaluate samplenormality distribution. Continuous variables without normaldistribution were log transformed. The participants were di-vided by tertiles of total bilirubin, and multiple comparisonsbetween the obtained groups were performed by 1-way analysisof variance, supplemented with Tukey’s Honestly SignificantDifference post hoc test. For categorical variables, we used �2
test or Fisher’s exact test to compare groups. Pearson correla-tion coefficient was applied to evaluate relationships between
sets of data. Multiple-regression analysis (stepwise method)was used to find independent variables associated with totalbilirubin levels. The genotype of the TATA box polymorphismwas coded using 2 dummy variables, one to compare thehomozygous for the wild-type allele (reference category) withheterozygous for the c.-41_-40dupTA, and the other to com-pare the wild-type allele with homozygous for c.-41_-40dupTA. A P value of �0.05 was considered statisticallysignificant.
RESULTSTo analyze the contribution of Hb and other factors to
the bilirubin blood levels, we divided our population of youngfemale participants into 3 groups, according to the tertiles oftotal bilirubin concentration, the first group �6 �mol/L, thesecond group between 6 and 9 �mol/L and the third group �9�mol/L.
No differences were observed between the 3 groupswhen comparing the age of the participants (Table 1). Thehematologic studies showed that subjects from the second andthird tertile had significantly higher Hb concentration, Ht,MCH and MCHC and lower platelet counts compared withthose in the first tertile (Table 1). The subjects from the thirdtertile maintained the same significant changes, and a signifi-cant increase in red blood cell count, compared with the firsttertile values. No changes were observed between the secondand the third tertile despite the increasing bilirubin concentra-tion. No significant differences were found between groups fortotal and differential white blood cell counts (Table 1).
The frequency for the c.-41_-40dupTA allele in homozy-gosity increased from the first to the third tertile because asignificant increase was observed between the first and thesecond tertile, and the frequency for the latter was significantlylower than that observed for the third tertile (Table 1). Allelefrequencies of 0.31 for c.-41_-40dupTA allele and of 0.69 fornormal allele were obtained in all population, which are inHardy-Weinberg equilibrium (�2 test; P � 0.029). Moreover,when compared, total bilirubin concentration, according toUGT1A1 genotype, a significant and progressive increasewas observed, from the [�] � [�] to the homozygousc.-41_-40dupTA allele (Figure 1).
No significant differences were observed between the 3tertile groups of bilirubin concentration, when consideringphysical activity, smoking habits, oral contraceptive therapy,body fat, alcohol ingestion and fasting time. However, a sig-nificant decrease in BMI was observed in the third tertilecompared with the first tertile (P � 0.009; Table 2).
Significant positive correlations were found betweentotal bilirubin concentration and Hb (r � 0.336; P � 0.0001),Ht (r � 0.244; P � 0.003), MCH (r � 0,276; P � 0.001) andMCHC (r � 0.326; P � 0.0001).
Multiple linear regression analyses showed that theTATA box gene polymorphism, Hb, BMI and fasting timeaccount for approximately 44% of the variation in serum totalbilirubin levels (adjusted R2 � 0.439; P � 0.0001). The modelidentified the c.-41_-40dupTA allele as the main contributor fortotal bilirubin variation (� � 0.481, P � 0.0001 when inhomozygosity; � � 0.381, P � 0.0001 when in heterozygosity),followed by Hb (� � 0.297, P � 0.0001), fasting hours (� �0.292, P � 0.0001) and BMI (� � �0.235, P � 0.004).
DISCUSSIONSeveral studies aimed to clarify the influence of genetic
and nongenetic factors in bilirubin levels.2,3,21–27 Most of them
Factors that Modify Bilirubin Levels
© 2012 Lippincott Williams & Wilkins 115
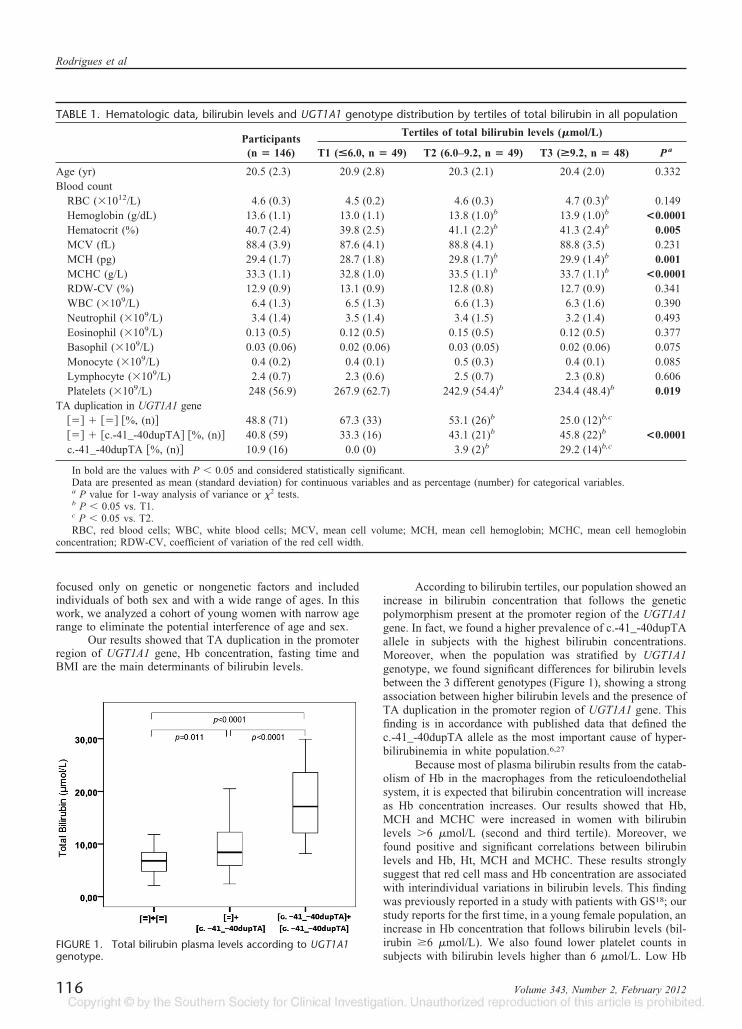
focused only on genetic or nongenetic factors and includedindividuals of both sex and with a wide range of ages. In thiswork, we analyzed a cohort of young women with narrow agerange to eliminate the potential interference of age and sex.
Our results showed that TA duplication in the promoterregion of UGT1A1 gene, Hb concentration, fasting time andBMI are the main determinants of bilirubin levels.
According to bilirubin tertiles, our population showed anincrease in bilirubin concentration that follows the geneticpolymorphism present at the promoter region of the UGT1A1gene. In fact, we found a higher prevalence of c.-41_-40dupTAallele in subjects with the highest bilirubin concentrations.Moreover, when the population was stratified by UGT1A1genotype, we found significant differences for bilirubin levelsbetween the 3 different genotypes (Figure 1), showing a strongassociation between higher bilirubin levels and the presence ofTA duplication in the promoter region of UGT1A1 gene. Thisfinding is in accordance with published data that defined thec.-41_-40dupTA allele as the most important cause of hyper-bilirubinemia in white population.6,27
Because most of plasma bilirubin results from the catab-olism of Hb in the macrophages from the reticuloendothelialsystem, it is expected that bilirubin concentration will increaseas Hb concentration increases. Our results showed that Hb,MCH and MCHC were increased in women with bilirubinlevels �6 �mol/L (second and third tertile). Moreover, wefound positive and significant correlations between bilirubinlevels and Hb, Ht, MCH and MCHC. These results stronglysuggest that red cell mass and Hb concentration are associatedwith interindividual variations in bilirubin levels. This findingwas previously reported in a study with patients with GS18; ourstudy reports for the first time, in a young female population, anincrease in Hb concentration that follows bilirubin levels (bil-irubin �6 �mol/L). We also found lower platelet counts insubjects with bilirubin levels higher than 6 �mol/L. Low Hb
TABLE 1. Hematologic data, bilirubin levels and UGT1A1 genotype distribution by tertiles of total bilirubin in all population
Participants(n � 146)
Tertiles of total bilirubin levels (�mol/L)
T1 (<6.0, n � 49) T2 (6.0–9.2, n � 49) T3 (>9.2, n � 48) P a
Age (yr) 20.5 (2.3) 20.9 (2.8) 20.3 (2.1) 20.4 (2.0) 0.332Blood count
RBC (�1012/L) 4.6 (0.3) 4.5 (0.2) 4.6 (0.3) 4.7 (0.3)b 0.149Hemoglobin (g/dL) 13.6 (1.1) 13.0 (1.1) 13.8 (1.0)b 13.9 (1.0)b <0.0001Hematocrit (%) 40.7 (2.4) 39.8 (2.5) 41.1 (2.2)b 41.3 (2.4)b 0.005MCV (fL) 88.4 (3.9) 87.6 (4.1) 88.8 (4.1) 88.8 (3.5) 0.231MCH (pg) 29.4 (1.7) 28.7 (1.8) 29.8 (1.7)b 29.9 (1.4)b 0.001MCHC (g/L) 33.3 (1.1) 32.8 (1.0) 33.5 (1.1)b 33.7 (1.1)b <0.0001RDW-CV (%) 12.9 (0.9) 13.1 (0.9) 12.8 (0.8) 12.7 (0.9) 0.341WBC (�109/L) 6.4 (1.3) 6.5 (1.3) 6.6 (1.3) 6.3 (1.6) 0.390Neutrophil (�109/L) 3.4 (1.4) 3.5 (1.4) 3.4 (1.5) 3.2 (1.4) 0.493Eosinophil (�109/L) 0.13 (0.5) 0.12 (0.5) 0.15 (0.5) 0.12 (0.5) 0.377Basophil (�109/L) 0.03 (0.06) 0.02 (0.06) 0.03 (0.05) 0.02 (0.06) 0.075Monocyte (�109/L) 0.4 (0.2) 0.4 (0.1) 0.5 (0.3) 0.4 (0.1) 0.085Lymphocyte (�109/L) 2.4 (0.7) 2.3 (0.6) 2.5 (0.7) 2.3 (0.8) 0.606Platelets (�109/L) 248 (56.9) 267.9 (62.7) 242.9 (54.4)b 234.4 (48.4)b 0.019
TA duplication in UGT1A1 gene�� � �� �%, (n) 48.8 (71) 67.3 (33) 53.1 (26)b 25.0 (12)b,c
�� � �c.-41_-40dupTA �%, (n) 40.8 (59) 33.3 (16) 43.1 (21)b 45.8 (22)b <0.0001c.-41_-40dupTA �%, (n) 10.9 (16) 0.0 (0) 3.9 (2)b 29.2 (14)b,c
In bold are the values with P � 0.05 and considered statistically significant.Data are presented as mean (standard deviation) for continuous variables and as percentage (number) for categorical variables.a P value for 1-way analysis of variance or �2 tests.b P � 0.05 vs. T1.c P � 0.05 vs. T2.RBC, red blood cells; WBC, white blood cells; MCV, mean cell volume; MCH, mean cell hemoglobin; MCHC, mean cell hemoglobin
concentration; RDW-CV, coefficient of variation of the red cell width.
FIGURE 1. Total bilirubin plasma levels according to UGT1A1genotype.
Rodrigues et al
116 Volume 343, Number 2, February 2012
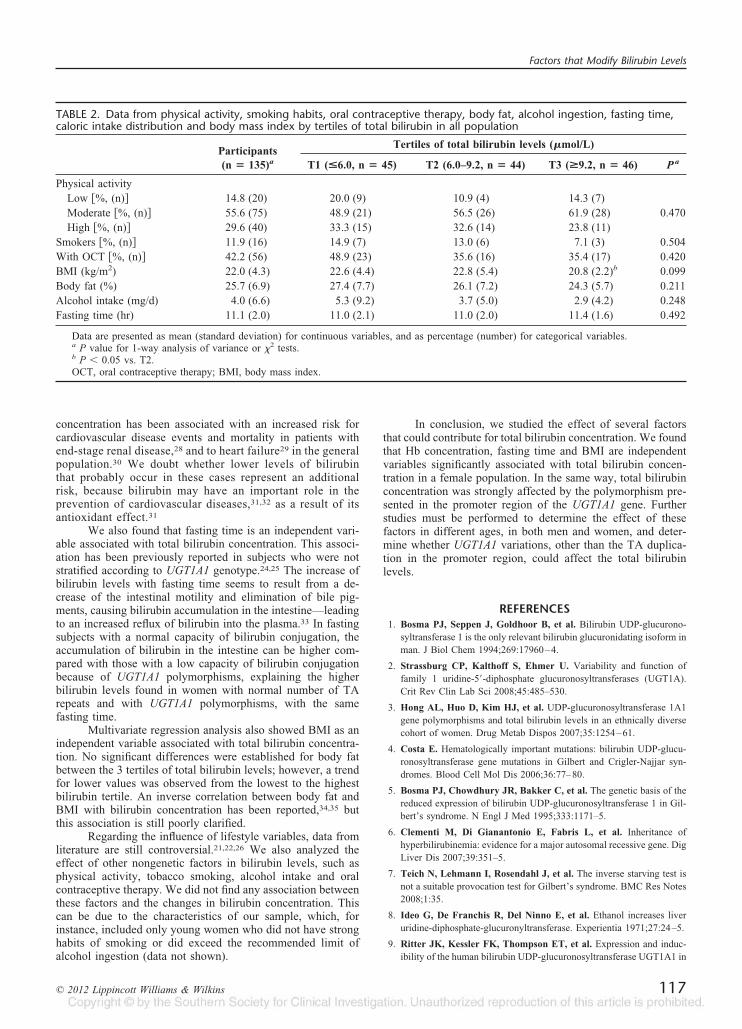
concentration has been associated with an increased risk forcardiovascular disease events and mortality in patients withend-stage renal disease,28 and to heart failure29 in the generalpopulation.30 We doubt whether lower levels of bilirubinthat probably occur in these cases represent an additionalrisk, because bilirubin may have an important role in theprevention of cardiovascular diseases,31,32 as a result of itsantioxidant effect.31
We also found that fasting time is an independent vari-able associated with total bilirubin concentration. This associ-ation has been previously reported in subjects who were notstratified according to UGT1A1 genotype.24,25 The increase ofbilirubin levels with fasting time seems to result from a de-crease of the intestinal motility and elimination of bile pig-ments, causing bilirubin accumulation in the intestine—leadingto an increased reflux of bilirubin into the plasma.33 In fastingsubjects with a normal capacity of bilirubin conjugation, theaccumulation of bilirubin in the intestine can be higher com-pared with those with a low capacity of bilirubin conjugationbecause of UGT1A1 polymorphisms, explaining the higherbilirubin levels found in women with normal number of TArepeats and with UGT1A1 polymorphisms, with the samefasting time.
Multivariate regression analysis also showed BMI as anindependent variable associated with total bilirubin concentra-tion. No significant differences were established for body fatbetween the 3 tertiles of total bilirubin levels; however, a trendfor lower values was observed from the lowest to the highestbilirubin tertile. An inverse correlation between body fat andBMI with bilirubin concentration has been reported,34,35 butthis association is still poorly clarified.
Regarding the influence of lifestyle variables, data fromliterature are still controversial.21,22,26 We also analyzed theeffect of other nongenetic factors in bilirubin levels, such asphysical activity, tobacco smoking, alcohol intake and oralcontraceptive therapy. We did not find any association betweenthese factors and the changes in bilirubin concentration. Thiscan be due to the characteristics of our sample, which, forinstance, included only young women who did not have stronghabits of smoking or did exceed the recommended limit ofalcohol ingestion (data not shown).
In conclusion, we studied the effect of several factorsthat could contribute for total bilirubin concentration. We foundthat Hb concentration, fasting time and BMI are independentvariables significantly associated with total bilirubin concen-tration in a female population. In the same way, total bilirubinconcentration was strongly affected by the polymorphism pre-sented in the promoter region of the UGT1A1 gene. Furtherstudies must be performed to determine the effect of thesefactors in different ages, in both men and women, and deter-mine whether UGT1A1 variations, other than the TA duplica-tion in the promoter region, could affect the total bilirubinlevels.
REFERENCES1. Bosma PJ, Seppen J, Goldhoor B, et al. Bilirubin UDP-glucurono-
syltransferase 1 is the only relevant bilirubin glucuronidating isoform inman. J Biol Chem 1994;269:17960–4.
2. Strassburg CP, Kalthoff S, Ehmer U. Variability and function offamily 1 uridine-5-diphosphate glucuronosyltransferases (UGT1A).Crit Rev Clin Lab Sci 2008;45:485–530.
3. Hong AL, Huo D, Kim HJ, et al. UDP-glucuronosyltransferase 1A1gene polymorphisms and total bilirubin levels in an ethnically diversecohort of women. Drug Metab Dispos 2007;35:1254–61.
4. Costa E. Hematologically important mutations: bilirubin UDP-glucu-ronosyltransferase gene mutations in Gilbert and Crigler-Najjar syn-dromes. Blood Cell Mol Dis 2006;36:77–80.
5. Bosma PJ, Chowdhury JR, Bakker C, et al. The genetic basis of thereduced expression of bilirubin UDP-glucuronosyltransferase 1 in Gil-bert’s syndrome. N Engl J Med 1995;333:1171–5.
6. Clementi M, Di Gianantonio E, Fabris L, et al. Inheritance ofhyperbilirubinemia: evidence for a major autosomal recessive gene. DigLiver Dis 2007;39:351–5.
7. Teich N, Lehmann I, Rosendahl J, et al. The inverse starving test isnot a suitable provocation test for Gilbert’s syndrome. BMC Res Notes2008;1:35.
8. Ideo G, De Franchis R, Del Ninno E, et al. Ethanol increases liveruridine-diphosphate-glucuronyltransferase. Experientia 1971;27:24–5.
9. Ritter JK, Kessler FK, Thompson ET, et al. Expression and induc-ibility of the human bilirubin UDP-glucuronosyltransferase UGT1A1 in
TABLE 2. Data from physical activity, smoking habits, oral contraceptive therapy, body fat, alcohol ingestion, fasting time,caloric intake distribution and body mass index by tertiles of total bilirubin in all population
Participants(n � 135)a
Tertiles of total bilirubin levels (�mol/L)
T1 (<6.0, n � 45) T2 (6.0–9.2, n � 44) T3 (>9.2, n � 46) P a
Physical activityLow �%, (n) 14.8 (20) 20.0 (9) 10.9 (4) 14.3 (7)Moderate �%, (n) 55.6 (75) 48.9 (21) 56.5 (26) 61.9 (28) 0.470High �%, (n) 29.6 (40) 33.3 (15) 32.6 (14) 23.8 (11)
Smokers �%, (n) 11.9 (16) 14.9 (7) 13.0 (6) 7.1 (3) 0.504With OCT �%, (n) 42.2 (56) 48.9 (23) 35.6 (16) 35.4 (17) 0.420BMI (kg/m2) 22.0 (4.3) 22.6 (4.4) 22.8 (5.4) 20.8 (2.2)b 0.099Body fat (%) 25.7 (6.9) 27.4 (7.7) 26.1 (7.2) 24.3 (5.7) 0.211Alcohol intake (mg/d) 4.0 (6.6) 5.3 (9.2) 3.7 (5.0) 2.9 (4.2) 0.248Fasting time (hr) 11.1 (2.0) 11.0 (2.1) 11.0 (2.0) 11.4 (1.6) 0.492
Data are presented as mean (standard deviation) for continuous variables, and as percentage (number) for categorical variables.a P value for 1-way analysis of variance or �2 tests.b P � 0.05 vs. T2.OCT, oral contraceptive therapy; BMI, body mass index.
Factors that Modify Bilirubin Levels
© 2012 Lippincott Williams & Wilkins 117
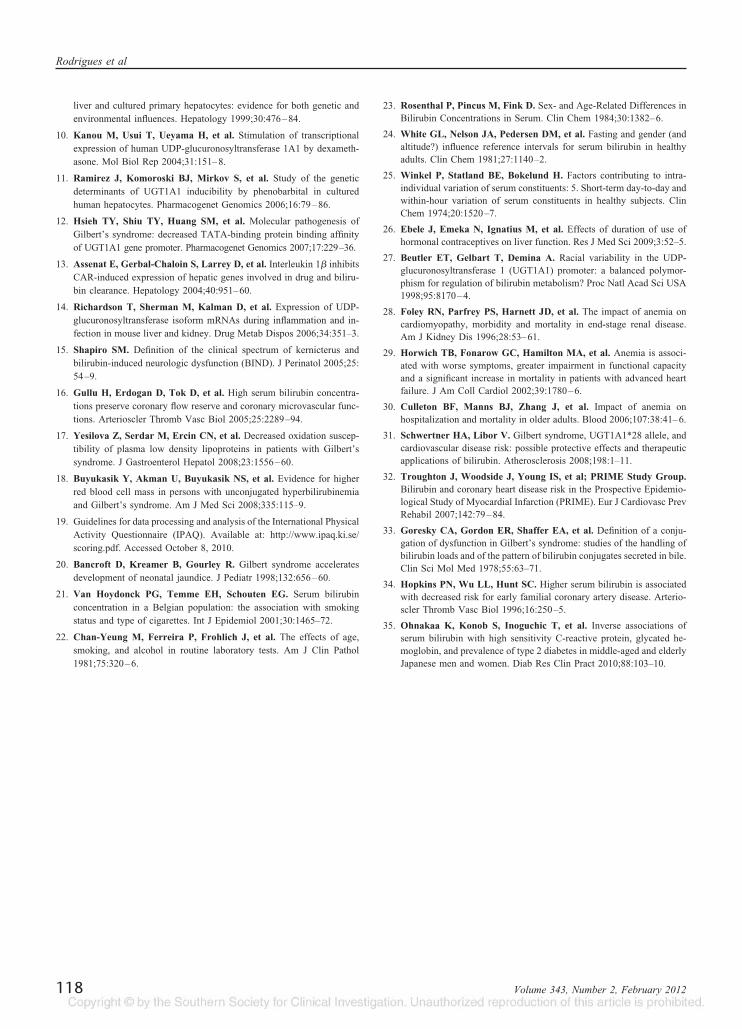
liver and cultured primary hepatocytes: evidence for both genetic andenvironmental influences. Hepatology 1999;30:476–84.
10. Kanou M, Usui T, Ueyama H, et al. Stimulation of transcriptionalexpression of human UDP-glucuronosyltransferase 1A1 by dexameth-asone. Mol Biol Rep 2004;31:151–8.
11. Ramirez J, Komoroski BJ, Mirkov S, et al. Study of the geneticdeterminants of UGT1A1 inducibility by phenobarbital in culturedhuman hepatocytes. Pharmacogenet Genomics 2006;16:79–86.
12. Hsieh TY, Shiu TY, Huang SM, et al. Molecular pathogenesis ofGilbert’s syndrome: decreased TATA-binding protein binding affinityof UGT1A1 gene promoter. Pharmacogenet Genomics 2007;17:229–36.
13. Assenat E, Gerbal-Chaloin S, Larrey D, et al. Interleukin 1� inhibitsCAR-induced expression of hepatic genes involved in drug and biliru-bin clearance. Hepatology 2004;40:951–60.
14. Richardson T, Sherman M, Kalman D, et al. Expression of UDP-glucuronosyltransferase isoform mRNAs during inflammation and in-fection in mouse liver and kidney. Drug Metab Dispos 2006;34:351–3.
15. Shapiro SM. Definition of the clinical spectrum of kernicterus andbilirubin-induced neurologic dysfunction (BIND). J Perinatol 2005;25:54–9.
16. Gullu H, Erdogan D, Tok D, et al. High serum bilirubin concentra-tions preserve coronary flow reserve and coronary microvascular func-tions. Arterioscler Thromb Vasc Biol 2005;25:2289–94.
17. Yesilova Z, Serdar M, Ercin CN, et al. Decreased oxidation suscep-tibility of plasma low density lipoproteins in patients with Gilbert’ssyndrome. J Gastroenterol Hepatol 2008;23:1556–60.
18. Buyukasik Y, Akman U, Buyukasik NS, et al. Evidence for higherred blood cell mass in persons with unconjugated hyperbilirubinemiaand Gilbert’s syndrome. Am J Med Sci 2008;335:115–9.
19. Guidelines for data processing and analysis of the International PhysicalActivity Questionnaire (IPAQ). Available at: http://www.ipaq.ki.se/scoring.pdf. Accessed October 8, 2010.
20. Bancroft D, Kreamer B, Gourley R. Gilbert syndrome acceleratesdevelopment of neonatal jaundice. J Pediatr 1998;132:656–60.
21. Van Hoydonck PG, Temme EH, Schouten EG. Serum bilirubinconcentration in a Belgian population: the association with smokingstatus and type of cigarettes. Int J Epidemiol 2001;30:1465–72.
22. Chan-Yeung M, Ferreira P, Frohlich J, et al. The effects of age,smoking, and alcohol in routine laboratory tests. Am J Clin Pathol1981;75:320–6.
23. Rosenthal P, Pincus M, Fink D. Sex- and Age-Related Differences inBilirubin Concentrations in Serum. Clin Chem 1984;30:1382–6.
24. White GL, Nelson JA, Pedersen DM, et al. Fasting and gender (andaltitude?) influence reference intervals for serum bilirubin in healthyadults. Clin Chem 1981;27:1140–2.
25. Winkel P, Statland BE, Bokelund H. Factors contributing to intra-individual variation of serum constituents: 5. Short-term day-to-day andwithin-hour variation of serum constituents in healthy subjects. ClinChem 1974;20:1520–7.
26. Ebele J, Emeka N, Ignatius M, et al. Effects of duration of use ofhormonal contraceptives on liver function. Res J Med Sci 2009;3:52–5.
27. Beutler ET, Gelbart T, Demina A. Racial variability in the UDP-glucuronosyltransferase 1 (UGT1A1) promoter: a balanced polymor-phism for regulation of bilirubin metabolism? Proc Natl Acad Sci USA1998;95:8170–4.
28. Foley RN, Parfrey PS, Harnett JD, et al. The impact of anemia oncardiomyopathy, morbidity and mortality in end-stage renal disease.Am J Kidney Dis 1996;28:53–61.
29. Horwich TB, Fonarow GC, Hamilton MA, et al. Anemia is associ-ated with worse symptoms, greater impairment in functional capacityand a significant increase in mortality in patients with advanced heartfailure. J Am Coll Cardiol 2002;39:1780–6.
30. Culleton BF, Manns BJ, Zhang J, et al. Impact of anemia onhospitalization and mortality in older adults. Blood 2006;107:38:41–6.
31. Schwertner HA, Libor V. Gilbert syndrome, UGT1A1*28 allele, andcardiovascular disease risk: possible protective effects and therapeuticapplications of bilirubin. Atherosclerosis 2008;198:1–11.
32. Troughton J, Woodside J, Young IS, et al; PRIME Study Group.Bilirubin and coronary heart disease risk in the Prospective Epidemio-logical Study of Myocardial Infarction (PRIME). Eur J Cardiovasc PrevRehabil 2007;142:79–84.
33. Goresky CA, Gordon ER, Shaffer EA, et al. Definition of a conju-gation of dysfunction in Gilbert’s syndrome: studies of the handling ofbilirubin loads and of the pattern of bilirubin conjugates secreted in bile.Clin Sci Mol Med 1978;55:63–71.
34. Hopkins PN, Wu LL, Hunt SC. Higher serum bilirubin is associatedwith decreased risk for early familial coronary artery disease. Arterio-scler Thromb Vasc Biol 1996;16:250–5.
35. Ohnakaa K, Konob S, Inoguchic T, et al. Inverse associations ofserum bilirubin with high sensitivity C-reactive protein, glycated he-moglobin, and prevalence of type 2 diabetes in middle-aged and elderlyJapanese men and women. Diab Res Clin Pract 2010;88:103–10.
Rodrigues et al
118 Volume 343, Number 2, February 2012

Artigo II
_____________________________________________________________________

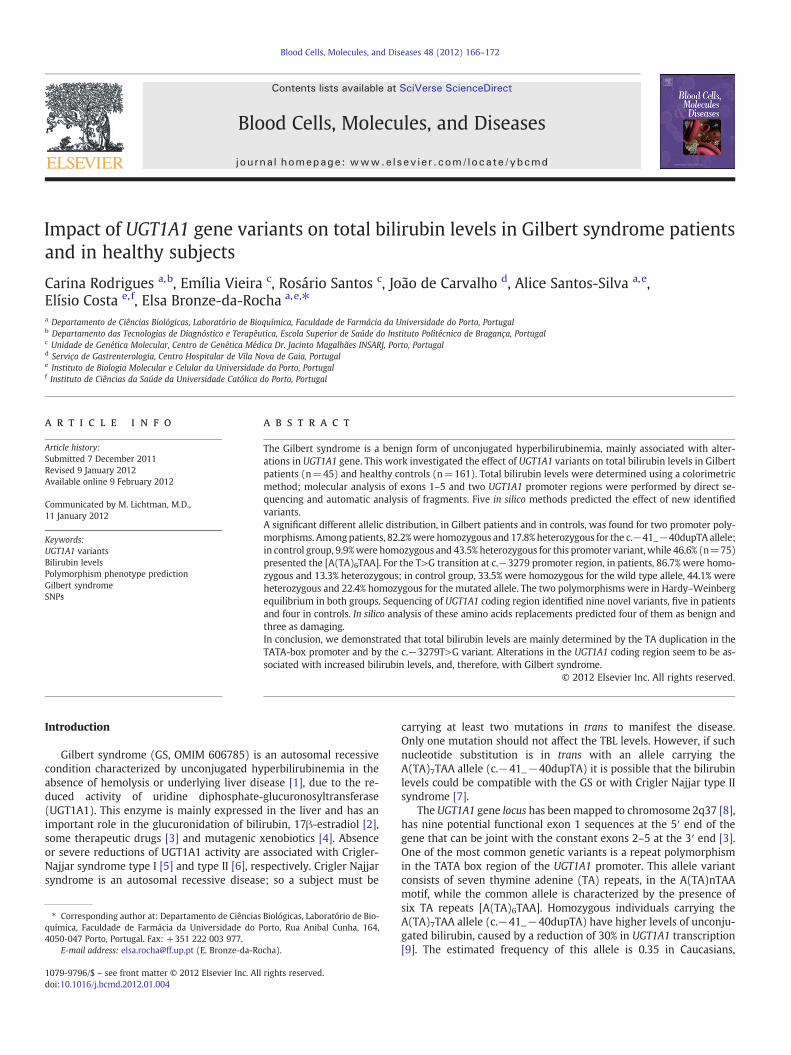
Blood Cells, Molecules, and Diseases 48 (2012) 166–172
Contents lists available at SciVerse ScienceDirect
Blood Cells, Molecules, and Diseases
j ourna l homepage: www.e lsev ie r .com/ locate /ybcmd
Impact of UGT1A1 gene variants on total bilirubin levels in Gilbert syndrome patientsand in healthy subjects
Carina Rodrigues a,b, Emília Vieira c, Rosário Santos c, João de Carvalho d, Alice Santos-Silva a,e,Elísio Costa e,f, Elsa Bronze-da-Rocha a,e,⁎a Departamento de Ciências Biológicas, Laboratório de Bioquímica, Faculdade de Farmácia da Universidade do Porto, Portugalb Departamento das Tecnologias de Diagnóstico e Terapêutica, Escola Superior de Saúde do Instituto Politécnico de Bragança, Portugalc Unidade de Genética Molecular, Centro de Genética Médica Dr. Jacinto Magalhães INSARJ, Porto, Portugald Serviço de Gastrenterologia, Centro Hospitalar de Vila Nova de Gaia, Portugale Instituto de Biologia Molecular e Celular da Universidade do Porto, Portugalf Instituto de Ciências da Saúde da Universidade Católica do Porto, Portugal
⁎ Corresponding author at: Departamento de Ciênciasquímica, Faculdade de Farmácia da Universidade do P4050-047 Porto, Portugal. Fax: +351 222 003 977.
E-mail address: [email protected] (E. Bronze-da-Ro
1079-9796/$ – see front matter © 2012 Elsevier Inc. Alldoi:10.1016/j.bcmd.2012.01.004
a b s t r a c t
a r t i c l e i n f oArticle history:Submitted 7 December 2011Revised 9 January 2012Available online 9 February 2012
Communicated by M. Lichtman, M.D.,11 January 2012
Keywords:UGT1A1 variantsBilirubin levelsPolymorphism phenotype predictionGilbert syndromeSNPs
The Gilbert syndrome is a benign form of unconjugated hyperbilirubinemia, mainly associated with alter-ations in UGT1A1 gene. This work investigated the effect of UGT1A1 variants on total bilirubin levels in Gilbertpatients (n=45) and healthy controls (n=161). Total bilirubin levels were determined using a colorimetricmethod; molecular analysis of exons 1–5 and two UGT1A1 promoter regions were performed by direct se-quencing and automatic analysis of fragments. Five in silico methods predicted the effect of new identifiedvariants.A significant different allelic distribution, in Gilbert patients and in controls, was found for two promoter poly-morphisms. Amongpatients, 82.2%were homozygous and 17.8% heterozygous for the c.−41_−40dupTA allele;in control group, 9.9%were homozygous and 43.5% heterozygous for this promoter variant, while 46.6% (n=75)presented the [A(TA)6TAA]. For the T>G transition at c.−3279 promoter region, in patients, 86.7% were homo-zygous and 13.3% heterozygous; in control group, 33.5% were homozygous for the wild type allele, 44.1% wereheterozygous and 22.4% homozygous for the mutated allele. The two polymorphisms were in Hardy–Weinbergequilibrium in both groups. Sequencing of UGT1A1 coding region identified nine novel variants, five in patientsand four in controls. In silico analysis of these amino acids replacements predicted four of them as benign andthree as damaging.In conclusion, we demonstrated that total bilirubin levels are mainly determined by the TA duplication in theTATA-box promoter and by the c.−3279T>G variant. Alterations in the UGT1A1 coding region seem to be as-sociated with increased bilirubin levels, and, therefore, with Gilbert syndrome.
© 2012 Elsevier Inc. All rights reserved.
Introduction
Gilbert syndrome (GS, OMIM 606785) is an autosomal recessivecondition characterized by unconjugated hyperbilirubinemia in theabsence of hemolysis or underlying liver disease [1], due to the re-duced activity of uridine diphosphate-glucuronosyltransferase(UGT1A1). This enzyme is mainly expressed in the liver and has animportant role in the glucuronidation of bilirubin, 17β-estradiol [2],some therapeutic drugs [3] and mutagenic xenobiotics [4]. Absenceor severe reductions of UGT1A1 activity are associated with Crigler-Najjar syndrome type I [5] and type II [6], respectively. Crigler Najjarsyndrome is an autosomal recessive disease; so a subject must be
Biológicas, Laboratório de Bio-orto, Rua Anibal Cunha, 164,
cha).
rights reserved.
carrying at least two mutations in trans to manifest the disease.Only one mutation should not affect the TBL levels. However, if suchnucleotide substitution is in trans with an allele carrying theA(TA)7TAA allele (c.−41_−40dupTA) it is possible that the bilirubinlevels could be compatible with the GS or with Crigler Najjar type IIsyndrome [7].
The UGT1A1 gene locus has beenmapped to chromosome 2q37 [8],has nine potential functional exon 1 sequences at the 5′ end of thegene that can be joint with the constant exons 2–5 at the 3′ end [3].One of the most common genetic variants is a repeat polymorphismin the TATA box region of the UGT1A1 promoter. This allele variantconsists of seven thymine adenine (TA) repeats, in the A(TA)nTAAmotif, while the common allele is characterized by the presence ofsix TA repeats [A(TA)6TAA]. Homozygous individuals carrying theA(TA)7TAA allele (c.−41_−40dupTA) have higher levels of unconju-gated bilirubin, caused by a reduction of 30% in UGT1A1 transcription[9]. The estimated frequency of this allele is 0.35 in Caucasians,
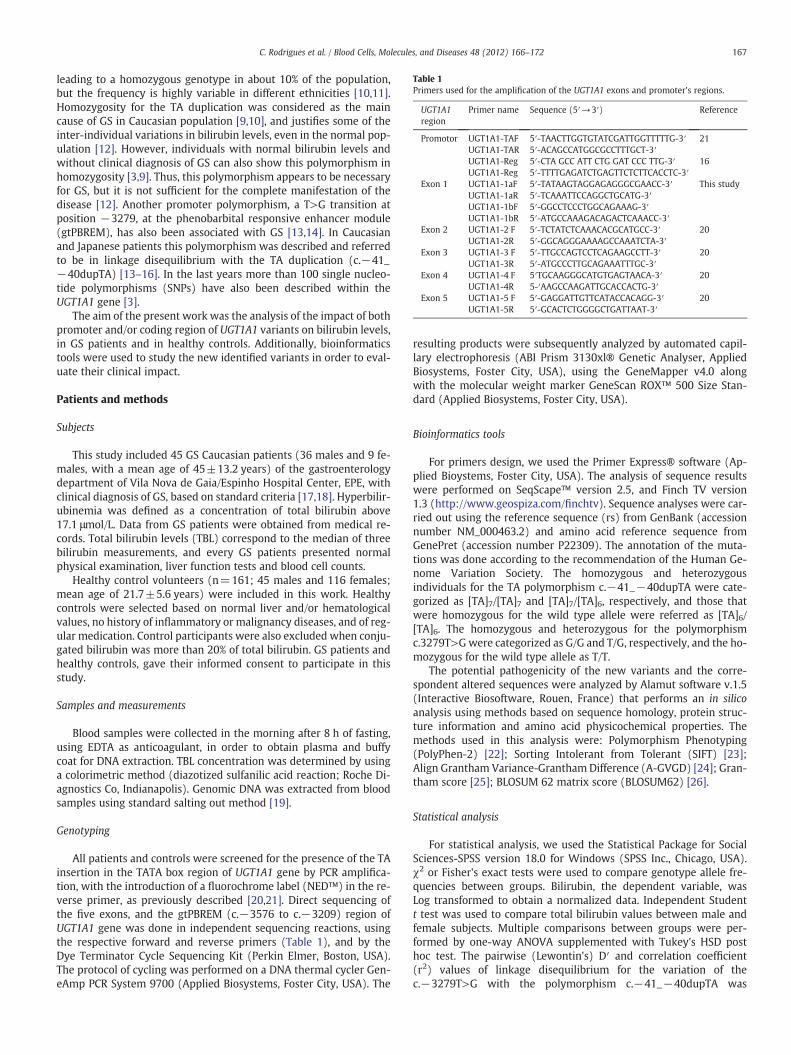
Table 1Primers used for the amplification of the UGT1A1 exons and promoter's regions.
UGT1A1region
Primer name Sequence (5′→3′) Reference
Promotor UGT1A1-TAF 5′-TAACTTGGTGTATCGATTGGTTTTTG-3′ 21UGT1A1-TAR 5′-ACAGCCATGGCGCCTTTGCT-3′UGT1A1-Reg 5′-CTA GCC ATT CTG GAT CCC TTG-3′ 16UGT1A1-Reg 5′-TTTTGAGATCTGAGTTCTCTTCACCTC-3′
Exon 1 UGT1A1-1aF 5′-TATAAGTAGGAGAGGGCGAACC-3′ This studyUGT1A1-1aR 5′-TCAAATTCCAGGCTGCATG-3′UGT1A1-1bF 5′-GGCCTCCCTGGCAGAAAG-3′UGT1A1-1bR 5′-ATGCCAAAGACAGACTCAAACC-3′
Exon 2 UGT1A1-2 F 5′-TCTATCTCAAACACGCATGCC-3′ 20UGT1A1-2R 5′-GGCAGGGAAAAGCCAAATCTA-3′
Exon 3 UGT1A1-3 F 5′-TTGCCAGTCCTCAGAAGCCTT-3′ 20UGT1A1-3R 5′-ATGCCCTTGCAGAAATTTGC-3′
Exon 4 UGT1A1-4 F 5′TGCAAGGGCATGTGAGTAACA-3′ 20UGT1A1-4R 5-′AAGCCAAGATTGCACCACTG-3′
Exon 5 UGT1A1-5 F 5′-GAGGATTGTTCATACCACAGG-3′ 20UGT1A1-5R 5′-GCACTCTGGGGCTGATTAAT-3′
167C. Rodrigues et al. / Blood Cells, Molecules, and Diseases 48 (2012) 166–172
leading to a homozygous genotype in about 10% of the population,but the frequency is highly variable in different ethnicities [10,11].Homozygosity for the TA duplication was considered as the maincause of GS in Caucasian population [9,10], and justifies some of theinter-individual variations in bilirubin levels, even in the normal pop-ulation [12]. However, individuals with normal bilirubin levels andwithout clinical diagnosis of GS can also show this polymorphism inhomozygosity [3,9]. Thus, this polymorphism appears to be necessaryfor GS, but it is not sufficient for the complete manifestation of thedisease [12]. Another promoter polymorphism, a T>G transition atposition −3279, at the phenobarbital responsive enhancer module(gtPBREM), has also been associated with GS [13,14]. In Caucasianand Japanese patients this polymorphism was described and referredto be in linkage disequilibrium with the TA duplication (c.−41_−40dupTA) [13–16]. In the last years more than 100 single nucleo-tide polymorphisms (SNPs) have also been described within theUGT1A1 gene [3].
The aim of the present work was the analysis of the impact of bothpromoter and/or coding region of UGT1A1 variants on bilirubin levels,in GS patients and in healthy controls. Additionally, bioinformaticstools were used to study the new identified variants in order to eval-uate their clinical impact.
Patients and methods
Subjects
This study included 45 GS Caucasian patients (36 males and 9 fe-males, with a mean age of 45±13.2 years) of the gastroenterologydepartment of Vila Nova de Gaia/Espinho Hospital Center, EPE, withclinical diagnosis of GS, based on standard criteria [17,18]. Hyperbilir-ubinemia was defined as a concentration of total bilirubin above17.1 μmol/L. Data from GS patients were obtained from medical re-cords. Total bilirubin levels (TBL) correspond to the median of threebilirubin measurements, and every GS patients presented normalphysical examination, liver function tests and blood cell counts.
Healthy control volunteers (n=161; 45 males and 116 females;mean age of 21.7±5.6 years) were included in this work. Healthycontrols were selected based on normal liver and/or hematologicalvalues, no history of inflammatory or malignancy diseases, and of reg-ular medication. Control participants were also excluded when conju-gated bilirubin was more than 20% of total bilirubin. GS patients andhealthy controls, gave their informed consent to participate in thisstudy.
Samples and measurements
Blood samples were collected in the morning after 8 h of fasting,using EDTA as anticoagulant, in order to obtain plasma and buffycoat for DNA extraction. TBL concentration was determined by usinga colorimetric method (diazotized sulfanilic acid reaction; Roche Di-agnostics Co, Indianapolis). Genomic DNA was extracted from bloodsamples using standard salting out method [19].
Genotyping
All patients and controls were screened for the presence of the TAinsertion in the TATA box region of UGT1A1 gene by PCR amplifica-tion, with the introduction of a fluorochrome label (NED™) in the re-verse primer, as previously described [20,21]. Direct sequencing ofthe five exons, and the gtPBREM (c.−3576 to c.−3209) region ofUGT1A1 gene was done in independent sequencing reactions, usingthe respective forward and reverse primers (Table 1), and by theDye Terminator Cycle Sequencing Kit (Perkin Elmer, Boston, USA).The protocol of cycling was performed on a DNA thermal cycler Gen-eAmp PCR System 9700 (Applied Biosystems, Foster City, USA). The
resulting products were subsequently analyzed by automated capil-lary electrophoresis (ABI Prism 3130xl® Genetic Analyser, AppliedBiosystems, Foster City, USA), using the GeneMapper v4.0 alongwith the molecular weight marker GeneScan ROX™ 500 Size Stan-dard (Applied Biosystems, Foster City, USA).
Bioinformatics tools
For primers design, we used the Primer Express® software (Ap-plied Bioystems, Foster City, USA). The analysis of sequence resultswere performed on SeqScape™ version 2.5, and Finch TV version1.3 (http://www.geospiza.com/finchtv). Sequence analyses were car-ried out using the reference sequence (rs) from GenBank (accessionnumber NM_000463.2) and amino acid reference sequence fromGenePret (accession number P22309). The annotation of the muta-tions was done according to the recommendation of the Human Ge-nome Variation Society. The homozygous and heterozygousindividuals for the TA polymorphism c.−41_−40dupTA were cate-gorized as [TA]7/[TA]7 and [TA]7/[TA]6, respectively, and those thatwere homozygous for the wild type allele were referred as [TA]6/[TA]6. The homozygous and heterozygous for the polymorphismc.3279T>Gwere categorized as G/G and T/G, respectively, and the ho-mozygous for the wild type allele as T/T.
The potential pathogenicity of the new variants and the corre-spondent altered sequences were analyzed by Alamut software v.1.5(Interactive Biosoftware, Rouen, France) that performs an in silicoanalysis using methods based on sequence homology, protein struc-ture information and amino acid physicochemical properties. Themethods used in this analysis were: Polymorphism Phenotyping(PolyPhen-2) [22]; Sorting Intolerant from Tolerant (SIFT) [23];Align Grantham Variance-Grantham Difference (A-GVGD) [24]; Gran-tham score [25]; BLOSUM 62 matrix score (BLOSUM62) [26].
Statistical analysis
For statistical analysis, we used the Statistical Package for SocialSciences-SPSS version 18.0 for Windows (SPSS Inc., Chicago, USA).χ2 or Fisher's exact tests were used to compare genotype allele fre-quencies between groups. Bilirubin, the dependent variable, wasLog transformed to obtain a normalized data. Independent Studentt test was used to compare total bilirubin values between male andfemale subjects. Multiple comparisons between groups were per-formed by one-way ANOVA supplemented with Tukey's HSD posthoc test. The pairwise (Lewontin's) D′ and correlation coefficient(r2) values of linkage disequilibrium for the variation of thec.−3279T>G with the polymorphism c.−41_−40dupTA was
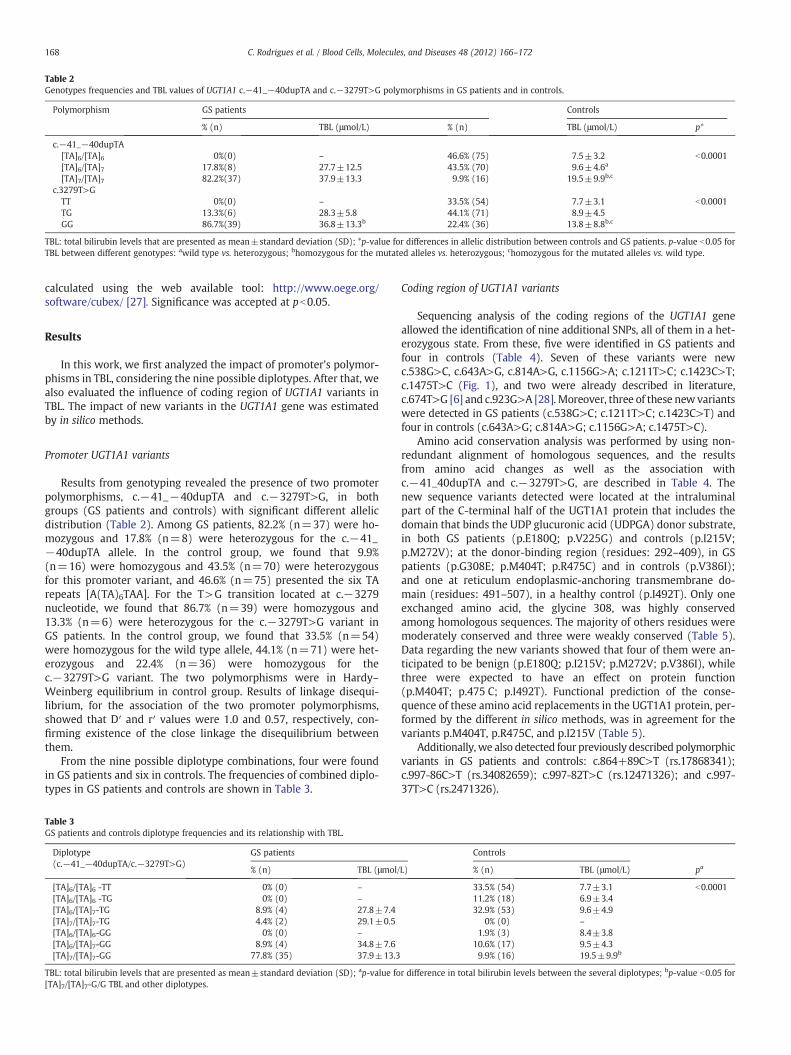
Table 2Genotypes frequencies and TBL values of UGT1A1 c.−41_−40dupTA and c.−3279T>G polymorphisms in GS patients and in controls.
Polymorphism GS patients Controls
% (n) TBL (μmol/L) % (n) TBL (μmol/L) p*
c.−41_−40dupTA[TA]6/[TA]6 0%(0) – 46.6% (75) 7.5±3.2 b0.0001[TA]6/[TA]7 17.8%(8) 27.7±12.5 43.5% (70) 9.6±4.6a
[TA]7/[TA]7 82.2%(37) 37.9±13.3 9.9% (16) 19.5±9.9b,c
c.3279T>GTT 0%(0) – 33.5% (54) 7.7±3.1 b0.0001TG 13.3%(6) 28.3±5.8 44.1% (71) 8.9±4.5GG 86.7%(39) 36.8±13.3b 22.4% (36) 13.8±8.8b,c
TBL: total bilirubin levels that are presented as mean±standard deviation (SD); *p-value for differences in allelic distribution between controls and GS patients. p-value b0.05 forTBL between different genotypes: awild type vs. heterozygous; bhomozygous for the mutated alleles vs. heterozygous; chomozygous for the mutated alleles vs. wild type.
168 C. Rodrigues et al. / Blood Cells, Molecules, and Diseases 48 (2012) 166–172
calculated using the web available tool: http://www.oege.org/software/cubex/ [27]. Significance was accepted at pb0.05.
Results
In this work, we first analyzed the impact of promoter's polymor-phisms in TBL, considering the nine possible diplotypes. After that, wealso evaluated the influence of coding region of UGT1A1 variants inTBL. The impact of new variants in the UGT1A1 gene was estimatedby in silico methods.
Promoter UGT1A1 variants
Results from genotyping revealed the presence of two promoterpolymorphisms, c.−41_−40dupTA and c.−3279T>G, in bothgroups (GS patients and controls) with significant different allelicdistribution (Table 2). Among GS patients, 82.2% (n=37) were ho-mozygous and 17.8% (n=8) were heterozygous for the c.−41_−40dupTA allele. In the control group, we found that 9.9%(n=16) were homozygous and 43.5% (n=70) were heterozygousfor this promoter variant, and 46.6% (n=75) presented the six TArepeats [A(TA)6TAA]. For the T>G transition located at c.−3279nucleotide, we found that 86.7% (n=39) were homozygous and13.3% (n=6) were heterozygous for the c.−3279T>G variant inGS patients. In the control group, we found that 33.5% (n=54)were homozygous for the wild type allele, 44.1% (n=71) were het-erozygous and 22.4% (n=36) were homozygous for thec.−3279T>G variant. The two polymorphisms were in Hardy–Weinberg equilibrium in control group. Results of linkage disequi-librium, for the association of the two promoter polymorphisms,showed that D′ and r′ values were 1.0 and 0.57, respectively, con-firming existence of the close linkage the disequilibrium betweenthem.
From the nine possible diplotype combinations, four were foundin GS patients and six in controls. The frequencies of combined diplo-types in GS patients and controls are shown in Table 3.
Table 3GS patients and controls diplotype frequencies and its relationship with TBL.
Diplotype(c.−41_−40dupTA/c.−3279T>G)
GS patients
% (n) TBL (μmol/
[TA]6/[TA]6 -TT 0% (0) –
[TA]6/[TA]6 -TG 0% (0) –
[TA]6/[TA]7-TG 8.9% (4) 27.8±7.4[TA]7/[TA]7-TG 4.4% (2) 29.1±0.5[TA]6/[TA]6-GG 0% (0) –
[TA]6/[TA]7-GG 8.9% (4) 34.8±7.6[TA]7/[TA]7-GG 77.8% (35) 37.9±13.3
TBL: total bilirubin levels that are presented as mean±standard deviation (SD); ap-value fo[TA]7/[TA]7-G/G TBL and other diplotypes.
Coding region of UGT1A1 variants
Sequencing analysis of the coding regions of the UGT1A1 geneallowed the identification of nine additional SNPs, all of them in a het-erozygous state. From these, five were identified in GS patients andfour in controls (Table 4). Seven of these variants were newc.538G>C, c.643A>G, c.814A>G, c.1156G>A; c.1211T>C; c.1423C>T;c.1475T>C (Fig. 1), and two were already described in literature,c.674T>G [6] and c.923G>A [28]. Moreover, three of these new variantswere detected in GS patients (c.538G>C; c.1211T>C; c.1423C>T) andfour in controls (c.643A>G; c.814A>G; c.1156G>A; c.1475T>C).
Amino acid conservation analysis was performed by using non-redundant alignment of homologous sequences, and the resultsfrom amino acid changes as well as the association withc.−41_40dupTA and c.−3279T>G, are described in Table 4. Thenew sequence variants detected were located at the intraluminalpart of the C-terminal half of the UGT1A1 protein that includes thedomain that binds the UDP glucuronic acid (UDPGA) donor substrate,in both GS patients (p.E180Q; p.V225G) and controls (p.I215V;p.M272V); at the donor-binding region (residues: 292–409), in GSpatients (p.G308E; p.M404T; p.R475C) and in controls (p.V386I);and one at reticulum endoplasmic-anchoring transmembrane do-main (residues: 491–507), in a healthy control (p.I492T). Only oneexchanged amino acid, the glycine 308, was highly conservedamong homologous sequences. The majority of others residues weremoderately conserved and three were weakly conserved (Table 5).Data regarding the new variants showed that four of them were an-ticipated to be benign (p.E180Q; p.I215V; p.M272V; p.V386I), whilethree were expected to have an effect on protein function(p.M404T; p.475 C; p.I492T). Functional prediction of the conse-quence of these amino acid replacements in the UGT1A1 protein, per-formed by the different in silico methods, was in agreement for thevariants p.M404T, p.R475C, and p.I215V (Table 5).
Additionally, we also detected four previously described polymorphicvariants in GS patients and controls: c.864+89C>T (rs.17868341);c.997-86C>T (rs.34082659); c.997-82T>C (rs.12471326); and c.997-37T>C (rs.2471326).
Controls
L) % (n) TBL (μmol/L) pa
33.5% (54) 7.7±3.1 b0.000111.2% (18) 6.9±3.432.9% (53) 9.6±4.9
0% (0) –
1.9% (3) 8.4±3.810.6% (17) 9.5±4.39.9% (16) 19.5±9.9b
r difference in total bilirubin levels between the several diplotypes; bp-value b0.05 for
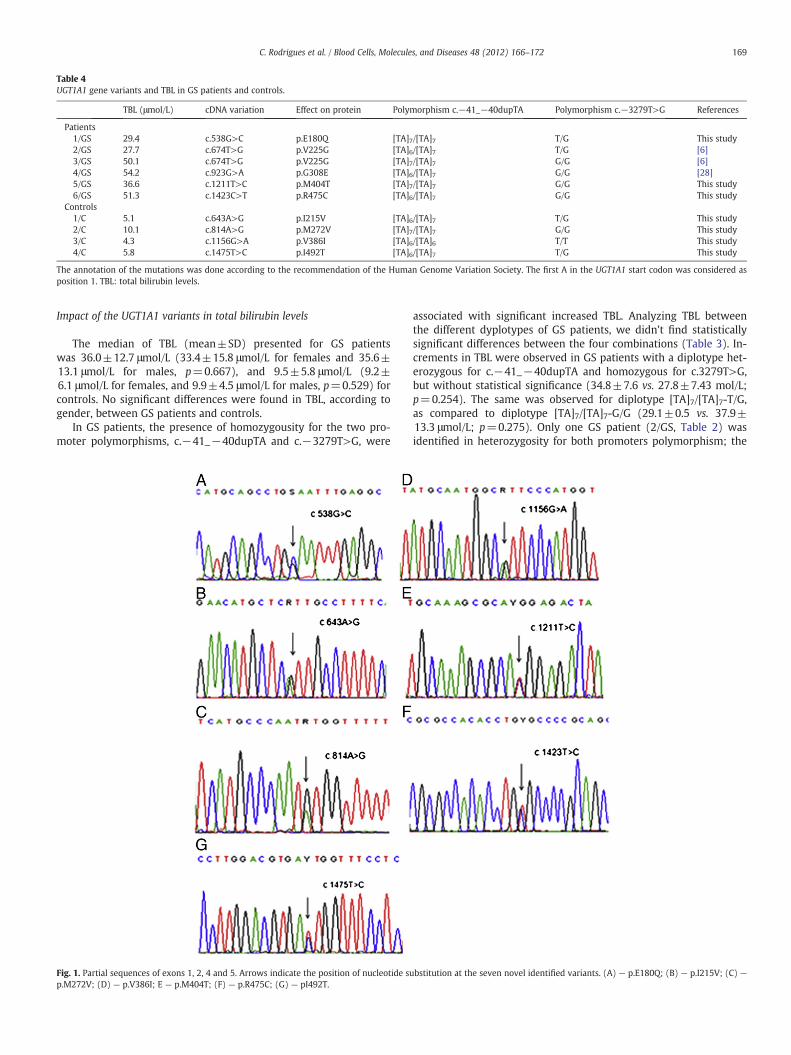
Table 4UGT1A1 gene variants and TBL in GS patients and controls.
TBL (μmol/L) cDNA variation Effect on protein Polymorphism c.−41_−40dupTA Polymorphism c.−3279T>G References
Patients1/GS 29.4 c.538G>C p.E180Q [TA]7/[TA]7 T/G This study2/GS 27.7 c.674T>G p.V225G [TA]6/[TA]7 T/G [6]3/GS 50.1 c.674T>G p.V225G [TA]7/[TA]7 G/G [6]4/GS 54.2 c.923G>A p.G308E [TA]6/[TA]7 G/G [28]5/GS 36.6 c.1211T>C p.M404T [TA]7/[TA]7 G/G This study6/GS 51.3 c.1423C>T p.R475C [TA]6/[TA]7 G/G This study
Controls1/C 5.1 c.643A>G p.I215V [TA]6/[TA]7 T/G This study2/C 10.1 c.814A>G p.M272V [TA]7/[TA]7 G/G This study3/C 4.3 c.1156G>A p.V386I [TA]6/[TA]6 T/T This study4/C 5.8 c.1475T>C p.I492T [TA]6/[TA]7 T/G This study
The annotation of the mutations was done according to the recommendation of the Human Genome Variation Society. The first A in the UGT1A1 start codon was considered asposition 1. TBL: total bilirubin levels.
169C. Rodrigues et al. / Blood Cells, Molecules, and Diseases 48 (2012) 166–172
Impact of the UGT1A1 variants in total bilirubin levels
The median of TBL (mean±SD) presented for GS patientswas 36.0±12.7 μmol/L (33.4±15.8 μmol/L for females and 35.6±13.1 μmol/L for males, p=0.667), and 9.5±5.8 μmol/L (9.2±6.1 μmol/L for females, and 9.9±4.5 μmol/L for males, p=0.529) forcontrols. No significant differences were found in TBL, according togender, between GS patients and controls.
In GS patients, the presence of homozygousity for the two pro-moter polymorphisms, c.−41_−40dupTA and c.−3279T>G, were
Fig. 1. Partial sequences of exons 1, 2, 4 and 5. Arrows indicate the position of nucleotide sup.M272V; (D) — p.V386I; E — p.M404T; (F) — p.R475C; (G) — pI492T.
associated with significant increased TBL. Analyzing TBL betweenthe different dyplotypes of GS patients, we didn't find statisticallysignificant differences between the four combinations (Table 3). In-crements in TBL were observed in GS patients with a diplotype het-erozygous for c.−41_−40dupTA and homozygous for c.3279T>G,but without statistical significance (34.8±7.6 vs. 27.8±7.43 mol/L;p=0.254). The same was observed for diplotype [TA]7/[TA]7-T/G,as compared to diplotype [TA]7/[TA]7-G/G (29.1±0.5 vs. 37.9±13.3 μmol/L; p=0.275). Only one GS patient (2/GS, Table 2) wasidentified in heterozygosity for both promoters polymorphism; the
bstitution at the seven novel identified variants. (A) — p.E180Q; (B) — p.I215V; (C) —
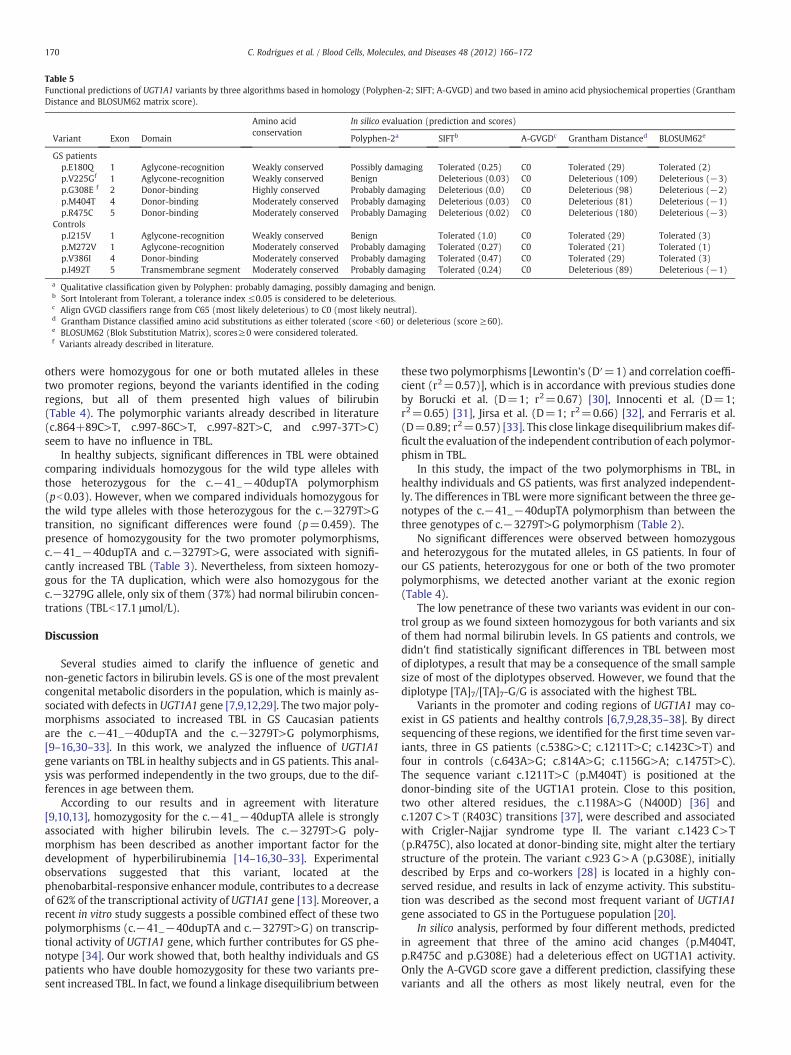
Table 5Functional predictions of UGT1A1 variants by three algorithms based in homology (Polyphen-2; SIFT; A-GVGD) and two based in amino acid physiochemical properties (GranthamDistance and BLOSUM62 matrix score).
Amino acidconservation
In silico evaluation (prediction and scores)
Variant Exon Domain Polyphen-2a SIFTb A-GVGDc Grantham Distanced BLOSUM62e
GS patientsp.E180Q 1 Aglycone-recognition Weakly conserved Possibly damaging Tolerated (0.25) C0 Tolerated (29) Tolerated (2)p.V225Gf 1 Aglycone-recognition Weakly conserved Benign Deleterious (0.03) C0 Deleterious (109) Deleterious (−3)p.G308E f 2 Donor-binding Highly conserved Probably damaging Deleterious (0.0) C0 Deleterious (98) Deleterious (−2)p.M404T 4 Donor-binding Moderately conserved Probably damaging Deleterious (0.03) C0 Deleterious (81) Deleterious (−1)p.R475C 5 Donor-binding Moderately conserved Probably Damaging Deleterious (0.02) C0 Deleterious (180) Deleterious (−3)
Controlsp.I215V 1 Aglycone-recognition Weakly conserved Benign Tolerated (1.0) C0 Tolerated (29) Tolerated (3)p.M272V 1 Aglycone-recognition Moderately conserved Probably damaging Tolerated (0.27) C0 Tolerated (21) Tolerated (1)p.V386I 4 Donor-binding Moderately conserved Probably damaging Tolerated (0.47) C0 Tolerated (29) Tolerated (3)p.I492T 5 Transmembrane segment Moderately conserved Probably damaging Tolerated (0.24) C0 Deleterious (89) Deleterious (−1)
a Qualitative classification given by Polyphen: probably damaging, possibly damaging and benign.b Sort Intolerant from Tolerant, a tolerance index ≤0.05 is considered to be deleterious.c Align GVGD classifiers range from C65 (most likely deleterious) to C0 (most likely neutral).d Grantham Distance classified amino acid substitutions as either tolerated (score b60) or deleterious (score ≥60).e BLOSUM62 (Blok Substitution Matrix), scores≥0 were considered tolerated.f Variants already described in literature.
170 C. Rodrigues et al. / Blood Cells, Molecules, and Diseases 48 (2012) 166–172
others were homozygous for one or both mutated alleles in thesetwo promoter regions, beyond the variants identified in the codingregions, but all of them presented high values of bilirubin(Table 4). The polymorphic variants already described in literature(c.864+89C>T, c.997-86C>T, c.997-82T>C, and c.997-37T>C)seem to have no influence in TBL.
In healthy subjects, significant differences in TBL were obtainedcomparing individuals homozygous for the wild type alleles withthose heterozygous for the c.−41_−40dupTA polymorphism(pb0.03). However, when we compared individuals homozygous forthe wild type alleles with those heterozygous for the c.−3279T>Gtransition, no significant differences were found (p=0.459). Thepresence of homozygousity for the two promoter polymorphisms,c.−41_−40dupTA and c.−3279T>G, were associated with signifi-cantly increased TBL (Table 3). Nevertheless, from sixteen homozy-gous for the TA duplication, which were also homozygous for thec.−3279G allele, only six of them (37%) had normal bilirubin concen-trations (TBLb17.1 μmol/L).
Discussion
Several studies aimed to clarify the influence of genetic andnon-genetic factors in bilirubin levels. GS is one of the most prevalentcongenital metabolic disorders in the population, which is mainly as-sociated with defects in UGT1A1 gene [7,9,12,29]. The twomajor poly-morphisms associated to increased TBL in GS Caucasian patientsare the c.−41_−40dupTA and the c.−3279T>G polymorphisms,[9–16,30–33]. In this work, we analyzed the influence of UGT1A1gene variants on TBL in healthy subjects and in GS patients. This anal-ysis was performed independently in the two groups, due to the dif-ferences in age between them.
According to our results and in agreement with literature[9,10,13], homozygosity for the c.−41_−40dupTA allele is stronglyassociated with higher bilirubin levels. The c.−3279T>G poly-morphism has been described as another important factor for thedevelopment of hyperbilirubinemia [14–16,30–33]. Experimentalobservations suggested that this variant, located at thephenobarbital-responsive enhancer module, contributes to a decreaseof 62% of the transcriptional activity of UGT1A1 gene [13]. Moreover, arecent in vitro study suggests a possible combined effect of these twopolymorphisms (c.−41_−40dupTA and c.−3279T>G) on transcrip-tional activity of UGT1A1 gene, which further contributes for GS phe-notype [34]. Our work showed that, both healthy individuals and GSpatients who have double homozygosity for these two variants pre-sent increased TBL. In fact, we found a linkage disequilibrium between
these two polymorphisms [Lewontin's (D′=1) and correlation coeffi-cient (r2=0.57)], which is in accordance with previous studies doneby Borucki et al. (D=1; r2=0.67) [30], Innocenti et al. (D=1;r2=0.65) [31], Jirsa et al. (D=1; r2=0.66) [32], and Ferraris et al.(D=0.89; r2=0.57) [33]. This close linkage disequilibriummakes dif-ficult the evaluation of the independent contribution of each polymor-phism in TBL.
In this study, the impact of the two polymorphisms in TBL, inhealthy individuals and GS patients, was first analyzed independent-ly. The differences in TBL were more significant between the three ge-notypes of the c.−41_−40dupTA polymorphism than between thethree genotypes of c.−3279T>G polymorphism (Table 2).
No significant differences were observed between homozygousand heterozygous for the mutated alleles, in GS patients. In four ofour GS patients, heterozygous for one or both of the two promoterpolymorphisms, we detected another variant at the exonic region(Table 4).
The low penetrance of these two variants was evident in our con-trol group as we found sixteen homozygous for both variants and sixof them had normal bilirubin levels. In GS patients and controls, wedidn't find statistically significant differences in TBL between mostof diplotypes, a result that may be a consequence of the small samplesize of most of the diplotypes observed. However, we found that thediplotype [TA]7/[TA]7-G/G is associated with the highest TBL.
Variants in the promoter and coding regions of UGT1A1 may co-exist in GS patients and healthy controls [6,7,9,28,35–38]. By directsequencing of these regions, we identified for the first time seven var-iants, three in GS patients (c.538G>C; c.1211T>C; c.1423C>T) andfour in controls (c.643A>G; c.814A>G; c.1156G>A; c.1475T>C).The sequence variant c.1211T>C (p.M404T) is positioned at thedonor-binding site of the UGT1A1 protein. Close to this position,two other altered residues, the c.1198A>G (N400D) [36] andc.1207 C>T (R403C) transitions [37], were described and associatedwith Crigler-Najjar syndrome type II. The variant c.1423 C>T(p.R475C), also located at donor-binding site, might alter the tertiarystructure of the protein. The variant c.923 G>A (p.G308E), initiallydescribed by Erps and co-workers [28] is located in a highly con-served residue, and results in lack of enzyme activity. This substitu-tion was described as the second most frequent variant of UGT1A1gene associated to GS in the Portuguese population [20].
In silico analysis, performed by four different methods, predictedin agreement that three of the amino acid changes (p.M404T,p.R475C and p.G308E) had a deleterious effect on UGT1A1 activity.Only the A-GVGD score gave a different prediction, classifying thesevariants and all the others as most likely neutral, even for the
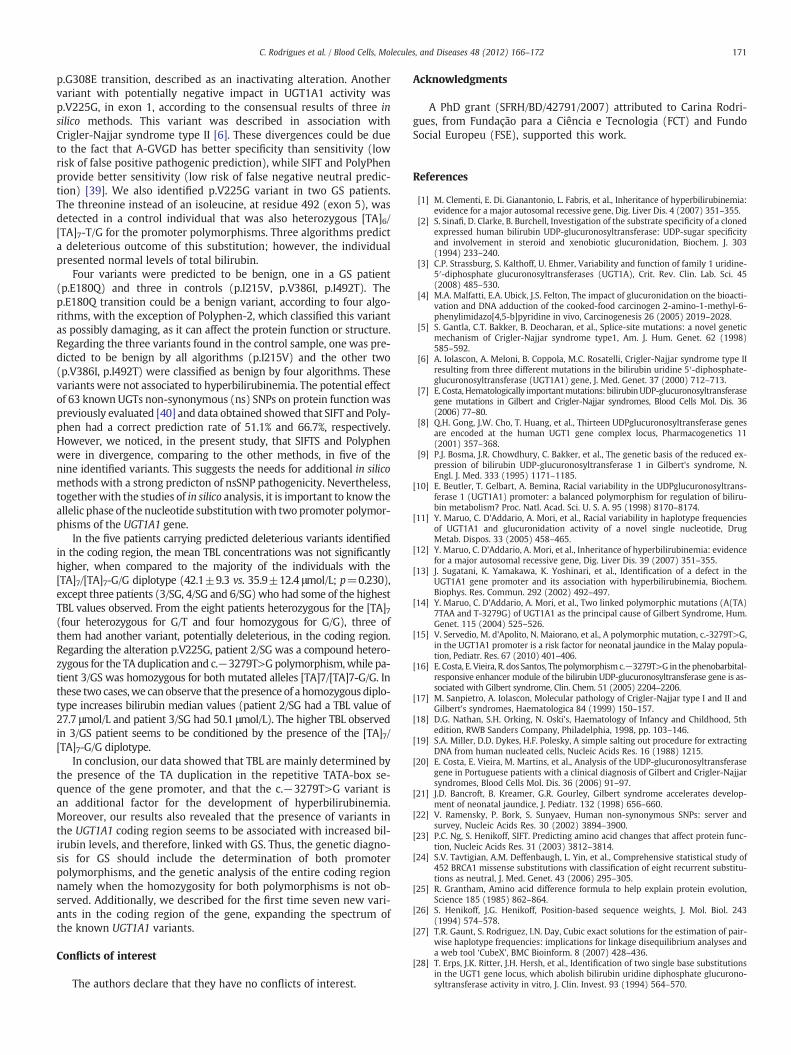
171C. Rodrigues et al. / Blood Cells, Molecules, and Diseases 48 (2012) 166–172
p.G308E transition, described as an inactivating alteration. Anothervariant with potentially negative impact in UGT1A1 activity wasp.V225G, in exon 1, according to the consensual results of three insilico methods. This variant was described in association withCrigler-Najjar syndrome type II [6]. These divergences could be dueto the fact that A-GVGD has better specificity than sensitivity (lowrisk of false positive pathogenic prediction), while SIFT and PolyPhenprovide better sensitivity (low risk of false negative neutral predic-tion) [39]. We also identified p.V225G variant in two GS patients.The threonine instead of an isoleucine, at residue 492 (exon 5), wasdetected in a control individual that was also heterozygous [TA]6/[TA]7-T/G for the promoter polymorphisms. Three algorithms predicta deleterious outcome of this substitution; however, the individualpresented normal levels of total bilirubin.
Four variants were predicted to be benign, one in a GS patient(p.E180Q) and three in controls (p.I215V, p.V386I, p.I492T). Thep.E180Q transition could be a benign variant, according to four algo-rithms, with the exception of Polyphen-2, which classified this variantas possibly damaging, as it can affect the protein function or structure.Regarding the three variants found in the control sample, one was pre-dicted to be benign by all algorithms (p.I215V) and the other two(p.V386I, p.I492T) were classified as benign by four algorithms. Thesevariants were not associated to hyperbilirubinemia. The potential effectof 63 known UGTs non-synonymous (ns) SNPs on protein function waspreviously evaluated [40] and data obtained showed that SIFT and Poly-phen had a correct prediction rate of 51.1% and 66.7%, respectively.However, we noticed, in the present study, that SIFTS and Polyphenwere in divergence, comparing to the other methods, in five of thenine identified variants. This suggests the needs for additional in silicomethods with a strong predicton of nsSNP pathogenicity. Nevertheless,together with the studies of in silico analysis, it is important to know theallelic phase of the nucleotide substitutionwith two promoter polymor-phisms of the UGT1A1 gene.
In the five patients carrying predicted deleterious variants identifiedin the coding region, the mean TBL concentrations was not significantlyhigher, when compared to the majority of the individuals with the[TA]7/[TA]7-G/G diplotype (42.1±9.3 vs. 35.9±12.4 μmol/L; p=0.230),except three patients (3/SG, 4/SG and 6/SG)who had some of the highestTBL values observed. From the eight patients heterozygous for the [TA]7(four heterozygous for G/T and four homozygous for G/G), three ofthem had another variant, potentially deleterious, in the coding region.Regarding the alteration p.V225G, patient 2/SG was a compound hetero-zygous for the TA duplication and c.−3279T>Gpolymorphism,while pa-tient 3/GS was homozygous for both mutated alleles [TA]7/[TA]7-G/G. Inthese two cases,we can observe that the presence of a homozygous diplo-type increases bilirubin median values (patient 2/SG had a TBL value of27.7 μmol/L and patient 3/SG had 50.1 μmol/L). The higher TBL observedin 3/GS patient seems to be conditioned by the presence of the [TA]7/[TA]7-G/G diplotype.
In conclusion, our data showed that TBL are mainly determined bythe presence of the TA duplication in the repetitive TATA-box se-quence of the gene promoter, and that the c.−3279T>G variant isan additional factor for the development of hyperbilirubinemia.Moreover, our results also revealed that the presence of variants inthe UGT1A1 coding region seems to be associated with increased bil-irubin levels, and therefore, linked with GS. Thus, the genetic diagno-sis for GS should include the determination of both promoterpolymorphisms, and the genetic analysis of the entire coding regionnamely when the homozygosity for both polymorphisms is not ob-served. Additionally, we described for the first time seven new vari-ants in the coding region of the gene, expanding the spectrum ofthe known UGT1A1 variants.
Conflicts of interest
The authors declare that they have no conflicts of interest.
Acknowledgments
A PhD grant (SFRH/BD/42791/2007) attributed to Carina Rodri-gues, from Fundação para a Ciência e Tecnologia (FCT) and FundoSocial Europeu (FSE), supported this work.
References
[1] M. Clementi, E. Di. Gianantonio, L. Fabris, et al., Inheritance of hyperbilirubinemia:evidence for a major autosomal recessive gene, Dig. Liver Dis. 4 (2007) 351–355.
[2] S. Sinafi, D. Clarke, B. Burchell, Investigation of the substrate specificity of a clonedexpressed human bilirubin UDP-glucuronosyltransferase: UDP-sugar specificityand involvement in steroid and xenobiotic glucuronidation, Biochem. J. 303(1994) 233–240.
[3] C.P. Strassburg, S. Kalthoff, U. Ehmer, Variability and function of family 1 uridine-5′-diphosphate glucuronosyltransferases (UGT1A), Crit. Rev. Clin. Lab. Sci. 45(2008) 485–530.
[4] M.A. Malfatti, E.A. Ubick, J.S. Felton, The impact of glucuronidation on the bioacti-vation and DNA adduction of the cooked-food carcinogen 2-amino-1-methyl-6-phenylimidazo[4,5-b]pyridine in vivo, Carcinogenesis 26 (2005) 2019–2028.
[5] S. Gantla, C.T. Bakker, B. Deocharan, et al., Splice-site mutations: a novel geneticmechanism of Crigler-Najjar syndrome type1, Am. J. Hum. Genet. 62 (1998)585–592.
[6] A. Iolascon, A. Meloni, B. Coppola, M.C. Rosatelli, Crigler-Najjar syndrome type IIresulting from three different mutations in the bilirubin uridine 5′-diphosphate-glucuronosyltransferase (UGT1A1) gene, J. Med. Genet. 37 (2000) 712–713.
[7] E. Costa, Hematologically importantmutations: bilirubinUDP-glucuronosyltransferasegene mutations in Gilbert and Crigler-Najjar syndromes, Blood Cells Mol. Dis. 36(2006) 77–80.
[8] Q.H. Gong, J.W. Cho, T. Huang, et al., Thirteen UDPglucuronosyltransferase genesare encoded at the human UGT1 gene complex locus, Pharmacogenetics 11(2001) 357–368.
[9] P.J. Bosma, J.R. Chowdhury, C. Bakker, et al., The genetic basis of the reduced ex-pression of bilirubin UDP-glucuronosyltransferase 1 in Gilbert's syndrome, N.Engl. J. Med. 333 (1995) 1171–1185.
[10] E. Beutler, T. Gelbart, A. Bemina, Racial variability in the UDPglucuronosyltrans-ferase 1 (UGT1A1) promoter: a balanced polymorphism for regulation of biliru-bin metabolism? Proc. Natl. Acad. Sci. U. S. A. 95 (1998) 8170–8174.
[11] Y. Maruo, C. D'Addario, A. Mori, et al., Racial variability in haplotype frequenciesof UGT1A1 and glucuronidation activity of a novel single nucleotide, DrugMetab. Dispos. 33 (2005) 458–465.
[12] Y. Maruo, C. D'Addario, A. Mori, et al., Inheritance of hyperbilirubinemia: evidencefor a major autosomal recessive gene, Dig. Liver Dis. 39 (2007) 351–355.
[13] J. Sugatani, K. Yamakawa, K. Yoshinari, et al., Identification of a defect in theUGT1A1 gene promoter and its association with hyperbilirubinemia, Biochem.Biophys. Res. Commun. 292 (2002) 492–497.
[14] Y. Maruo, C. D'Addario, A. Mori, et al., Two linked polymorphic mutations (A(TA)7TAA and T-3279G) of UGT1A1 as the principal cause of Gilbert Syndrome, Hum.Genet. 115 (2004) 525–526.
[15] V. Servedio, M. d'Apolito, N. Maiorano, et al., A polymorphic mutation, c.-3279T>G,in the UGT1A1 promoter is a risk factor for neonatal jaundice in the Malay popula-tion, Pediatr. Res. 67 (2010) 401–406.
[16] E. Costa, E. Vieira, R. dos Santos, Thepolymorphism c.−3279T>G in thephenobarbital-responsive enhancer module of the bilirubin UDP-glucuronosyltransferase gene is as-sociated with Gilbert syndrome, Clin. Chem. 51 (2005) 2204–2206.
[17] M. Sanpietro, A. Iolascon, Molecular pathology of Crigler-Najjar type I and II andGilbert's syndromes, Haematologica 84 (1999) 150–157.
[18] D.G. Nathan, S.H. Orking, N. Oski's, Haematology of Infancy and Childhood, 5thedition, RWB Sanders Company, Philadelphia, 1998, pp. 103–146.
[19] S.A. Miller, D.D. Dykes, H.F. Polesky, A simple salting out procedure for extractingDNA from human nucleated cells, Nucleic Acids Res. 16 (1988) 1215.
[20] E. Costa, E. Vieira, M. Martins, et al., Analysis of the UDP-glucuronosyltransferasegene in Portuguese patients with a clinical diagnosis of Gilbert and Crigler-Najjarsyndromes, Blood Cells Mol. Dis. 36 (2006) 91–97.
[21] J.D. Bancroft, B. Kreamer, G.R. Gourley, Gilbert syndrome accelerates develop-ment of neonatal jaundice, J. Pediatr. 132 (1998) 656–660.
[22] V. Ramensky, P. Bork, S. Sunyaev, Human non-synonymous SNPs: server andsurvey, Nucleic Acids Res. 30 (2002) 3894–3900.
[23] P.C. Ng, S. Henikoff, SIFT. Predicting amino acid changes that affect protein func-tion, Nucleic Acids Res. 31 (2003) 3812–3814.
[24] S.V. Tavtigian, A.M. Deffenbaugh, L. Yin, et al., Comprehensive statistical study of452 BRCA1 missense substitutions with classification of eight recurrent substitu-tions as neutral, J. Med. Genet. 43 (2006) 295–305.
[25] R. Grantham, Amino acid difference formula to help explain protein evolution,Science 185 (1985) 862–864.
[26] S. Henikoff, J.G. Henikoff, Position-based sequence weights, J. Mol. Biol. 243(1994) 574–578.
[27] T.R. Gaunt, S. Rodriguez, I.N. Day, Cubic exact solutions for the estimation of pair-wise haplotype frequencies: implications for linkage disequilibrium analyses anda web tool ‘CubeX’, BMC Bioinform. 8 (2007) 428–436.
[28] T. Erps, J.K. Ritter, J.H. Hersh, et al., Identification of two single base substitutionsin the UGT1 gene locus, which abolish bilirubin uridine diphosphate glucurono-syltransferase activity in vitro, J. Clin. Invest. 93 (1994) 564–570.
172 C. Rodrigues et al. / Blood Cells, Molecules, and Diseases 48 (2012) 166–172
[29] C. Rodrigues, E. Costa, E. Vieira, et al., in press. Bilirubin is mainly dependent onUGT1A1 polymorphisms, hemoglobin, fasting time and body mass index, Am. J.Med. Sci.
[30] K. Borucki, C. Weikert, E. Fisher, et al., Haplotypes in the UGT1A1 gene and theirrole as genetic determinants of bilirubin concentration in healthy German volun-teers, Clin. Biochem. 42 (2009) 1635–1641.
[31] F. Innocenti, C. Grimsley, S. Das, et al., Haplotype structure of the UDP- glucurono-syltransferase 1A1 promoter in different ethnic groups, Pharmacogenetics 12(2002) 725–733.
[32] M. Jirsa, J. Petrasek, L. Vitek, Linkage between A(TA)7TAA and −3279TNG muta-tions in UGT1A1 is not essential for pathogenesis of Gilbert syndrome, Liver Int.26 (2006) 1302–1303.
[33] A. Ferraris, G. D'Amato, V. Nobili, et al., Combined test for UGT1A1-3279TNG andA(TA)nTAA polymorphisms best predicts Gilbert's syndrome in Italian pediatricpatients, Genet. Test. 10 (2006) 121–125.
[34] K. Matsui, Y. Maruo, H. Sato, Y. Takeuchi, Combined effect of regulatory polymor-phisms on transcription of UGT1A1 as a cause of Gilbert syndrome, BMC Gastro-enterol. 10 (2010) 57–68.
[35] N. Kaniwa, K. Kurose, H. Jinno, et al., Racial variability in haplotype frequencies ofUGT1A1 and glucuronidation activity of a novel single nucleotide polymorphism686CNT (P229L) found in an African-American, Drug Metab. Dispos. 33 (2005)458–465.
[36] H. Sato, Y. Adachi, O. Koiwai, The genetic basis of Gilbert's syndrome, Lancet 34(1996) 557–558.
[37] P. Labrune, A. Myara, J. Chalas, et al., Association of a homozygous (TA)8 promoterpolymorphism and a N400D mutation of UGT1A1 in a child with Crigler-Najjartype II syndrome, Hum. Mutat. 20 (2002) 399–401.
[38] V. Servedio, M. d'Apolito, N. Maiorano, et al., Spectrum of UGT1A1 mutations inCrigler-Najjar (CN) syndrome patients: identification of twelve novel allelesand genotype-phenotype correlation, Hum. Mutat. 25 (2005) 325–334.
[39] S.V. Tavtigan, M.S. Greenblatt, F. Lesueur, et al., In silico analysis of missense sub-stitutions using sequence-alignment based methods, Hum. Mutat. 29 (2008)1327–1336.
[40] Y.M. Di, E. Chan, M.Q. Wei, J.P. Liu, et al., Prediction of deleterious non-synonymoussingle-nucleotide polymorphisms of human uridine diphosphate glucuronosyl-transferase genes, AAPS J. 11 (2009) 469–480.

Artigo III
_____________________________________________________________________

E-Mail [email protected]
Brief Communication
Acta Haematol 2013;130:57–60 DOI: 10.1159/000346429
Bilirubin Levels and Redox Status in a Young Healthy Population
Carina Rodrigues a, d Susana Rocha a, b Henrique Nascimento a, b Emília Vieira c Rosário Santos c Alice Santos-Silva a, b Elísio Costa a, b Elsa Bronze-da-Rocha a, b
a Laboratório de Bioquímica, Departamento de Ciências Biológicas, Faculdade de Farmácia and b Instituto de Biologia Molecular e Celular, Universidade do Porto, and c Unidade de Genética Molecular, Centro de Genética Médica Dr. Jacinto Magalhães INSARJ, Porto , and d Departamento das Tecnologias de Diagnóstico e Terapêutica,Escola Superior de Saúde, Instituto Politécnico de Bragança, Bragança , Portugal
oxidative stress conditions, as ischemia-re-lated injuries [4] .
During their life span the red blood cells (RBC) may suffer oxidative stress. When its antioxidant capacity is over-whelmed, Hb is oxidized and links to the membrane, inducing the aggregation of the membrane protein band 3, which will trigger the binding of natural anti-band 3 antibodies (IgGs) to the band 3 aggregates, and this marks the cell for removal by mac-rophages [5] . As the RBC is not able to syn-thesize proteins, it is a good model to study oxidative stress damage. When the RBC becomes senescent (or oxidatively dam-aged) there is an increase in high-molecu-lar-weight aggregates of band 3 (HMWAg) and a decrease in its monomers and pro-teolytic fragments [4–6] ; this band 3 pro-file has been reported in oxidative stress conditions, such as in cardiovascular dis-eases [6] .
In the present work we studied the an-tioxidant properties of bilirubin, by evalu-ating the impact of mild hyperbilirubine-mia presented by homozygous and hetero-zygous (TA) 7 allele carriers, in different blood markers of oxidative stress. We used the RBC as a good model of cumulative ox-
The additional TA repeat (c.-41_-40dupTA) in the promoter of the uri-dine diphosphate glucuronosyltransferase(UGT1A1) gene is associated with a de-crease in gene transcription, a decline in bilirubin conjugation and, therefore, with an increase in circulating unconjugated bil-irubin (UCB) [1] . The TA repeat polymor-phism is remarkably prevalent in the Cau-casian white population and is the main cause of Gilbert’s syndrome [1] .
Bilirubin, the key metabolic product of hemoglobin (Hb) catabolism, has antioxi-dant properties that seem to have a protec-tive effect in oxidative stress conditions, such as in atherosclerosis, coronary heart disease, inflammation, and cancer [2] . Some studies showed that high levels of bil-irubin can be toxic to neurons in newborn infants. Actually, in fetuses and newborn babies the UCB can reach neurons through the immature hematoencephalic barrier [3] . In the cerebral tissue, UCB impairs the membrane dynamic properties, by altering the phospholipid packing and the polarity of membrane, inducing neurotoxicity [3] . However, in other tissues, bilirubin pro-vides a primary antioxidant protection in newborns against damage resulting from
Received: August 27, 2012 Accepted after revision: November 21, 2012 Published online: March 6, 2013
Assist. Prof. Elsa Bronze-da-Rocha Laboratório de Bioquímica, Departamento de Ciências Biológicas Faculdade de Farmácia, Universidade do Porto Rua Jorge Viterbo Ferreira 228, PT–4050-313 Porto (Portugal) E-Mail elsa.rocha @ ff.up.pt
© 2013 S. Karger AG, Basel0001–5792/13/1301–0057$38.00/0
www.karger.com/aha
idative stress and evaluated some plasmatic markers of oxidative stress.
We analyzed a group of 77 individuals (18 males and 59 females) randomly select-ed from young students of the north of Por-tugal (20.7 ± 2.6 years old). All participants gave their informed consent, and those with liver and/or hematologic disorders, chronic or acute infection, under medica-tion and with a history of malignancy were excluded. The analytical studies included a basic erythrocyte study, the evaluation of the erythrocyte membrane protein band 3 profile (band 3 monomer, HMWAg, and proteolytic fragments %), total antioxidant status (TAS), plasma lipid peroxidation (thiobarbituric acid, TBA), total serum bil-irubin, total cholesterol, triglycerides, low-density lipoprotein cholesterol, high-den-sity lipoprotein cholesterol, albumin levels, and TA duplication (c.-41_-40dupTA). To study the band 3 profile, RBC membranes were isolated and prepared as described elsewhere [6] ; RBC membrane proteins were separated by SDS-PAGE, transferred by electrophoresis to nitrocellulose sheets and band 3 was developed by immunoblot-ting [6] . The erythrocyte count, Hb con-centration, hematocrit, red cell distribu-
Dow
nloa
ded
by: C
. 221
997
193.
136.
231.
240
- 7/
21/2
014
1:07
:17
PM
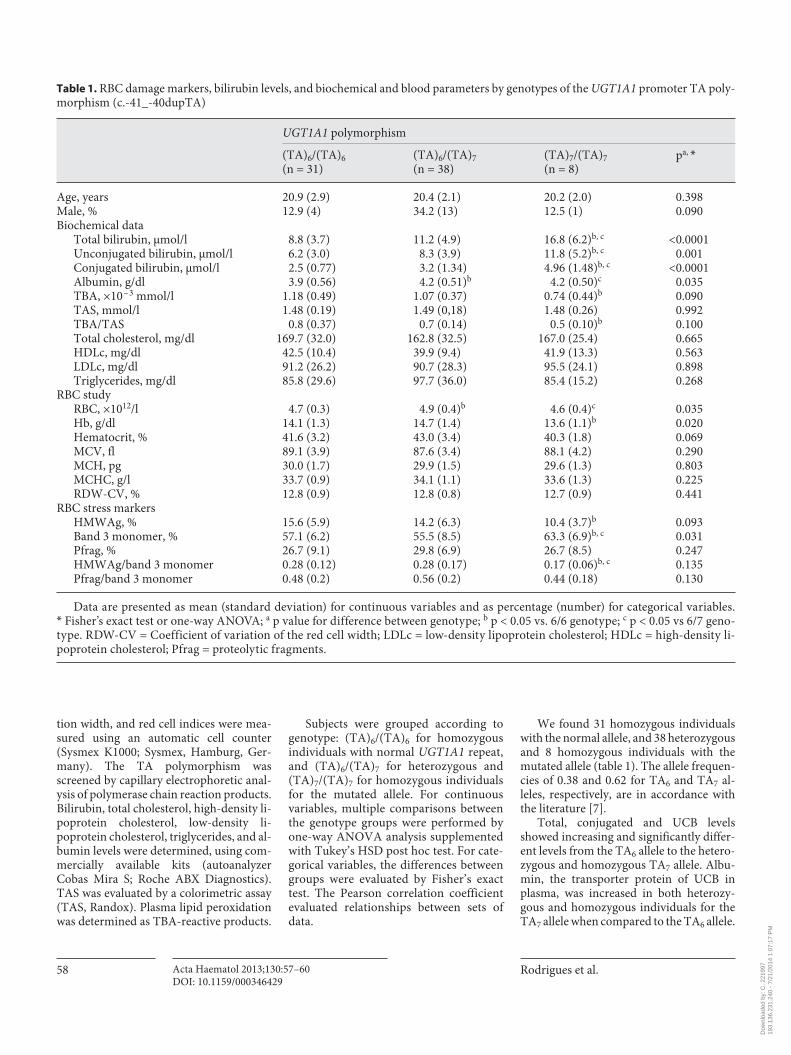
Rodrigues et al. Acta Haematol 2013;130:57–60 DOI: 10.1159/000346429
58
tion width, and red cell indices were mea-sured using an automatic cell counter (Sysmex K1000; Sysmex, Hamburg, Ger-many). The TA polymorphism was screened by capillary electrophoretic anal-ysis of polymerase chain reaction products. Bilirubin, total cholesterol, high-density li-poprotein cholesterol, low-density li-poprotein cholesterol, triglycerides, and al-bumin levels were determined, using com-mercially available kits (autoanalyzer Cobas Mira S; Roche ABX Diagnostics). TAS was evaluated by a colorimetric assay (TAS, Randox). Plasma lipid peroxidation was determined as TBA-reactive products.
Subjects were grouped according to genotype: (TA) 6 /(TA) 6 for homozygous individuals with normal UGT1A1 repeat, and (TA) 6 /(TA) 7 for heterozygous and (TA) 7 /(TA) 7 for homozygous individuals for the mutated allele. For continuous variables, multiple comparisons between the genotype groups were performed by one-way ANOVA analysis supplemented with Tukey’s HSD post hoc test. For cate-gorical variables, the differences between groups were evaluated by Fisher’s exact test. The Pearson correlation coefficient evaluated relationships between sets of data.
We found 31 homozygous individuals with the normal allele, and 38 heterozygous and 8 homozygous individuals with the mutated allele ( table 1 ). The allele frequen-cies of 0.38 and 0.62 for TA 6 and TA 7 al-leles, respectively, are in accordance with the literature [7] .
Total, conjugated and UCB levels showed increasing and significantly differ-ent levels from the TA 6 allele to the hetero-zygous and homozygous TA 7 allele. Albu-min, the transporter protein of UCB in plasma, was increased in both heterozy-gous and homozygous individuals for the TA 7 allele when compared to the TA 6 allele.
Table 1. RBC damage markers, bilirubin levels, and biochemical and blood parameters by genotypes of the UGT1A1 promoter TA poly-morphism (c.-41_-40dupTA)
UGT1A1 polymorphism
(TA)6/(TA)6(n = 31)
(TA)6/(T A)7(n = 38)
(TA)7/(TA)7(n = 8)
pa, *
Age, years 20.9 (2.9) 20.4 (2.1) 20.2 (2.0) 0.398Male, % 12.9 (4) 34.2 (13) 12.5 (1) 0.090Biochemical data
Total bilirubin, μmol/l 8.8 (3.7) 11.2 (4.9) 16.8 (6.2)b, c <0.0001Unconjugated bilirubin, μmol/l 6.2 (3.0) 8.3 (3.9) 11.8 (5.2)b, c 0.001Conjugated bilirubin, μmol/lAlbumin, g/dlTBA, ×10
– 3 mmol/l
TAS, mmol/lTBA/TASTotal cholesterol, mg/dlHDLc, mg/dlLDLc, mg/dlTriglycerides, mg/dl
2.5 (0.77)3.9 (0.56)
1.18 (0.49)1.48 (0.19)
0.8 (0.37)169.7 (32.0)
42.5 (10.4)91.2 (26.2)85.8 (29.6)
3.2 (1.34)4.2 (0.51)b
1.07 (0.37)1.49 (0,18)
0.7 (0.14)162.8 (32.5)
39.9 (9.4)90.7 (28.3)97.7 (36.0)
4.96 (1.48)b, c
4.2 (0.50)c
0.74 (0.44)b
1.48 (0.26)0.5 (0.10)b
167.0 (25.4)41.9 (13.3)95.5 (24.1)85.4 (15.2)
<0.00010.0350.0900.9920.1000.6650.5630.8980.268
RBC studyRBC, ×1012/l 4.7 (0.3) 4.9 (0.4)b 4.6 (0.4)c 0.035Hb, g/dl 14.1 (1.3) 14.7 (1.4) 13.6 (1.1)b 0.020Hematocrit, % 41.6 (3.2) 43.0 (3.4) 40.3 (1.8) 0.069MCV, fl 89.1 (3.9) 87.6 (3.4) 88.1 (4.2) 0.290MCH, pg 30.0 (1.7) 29.9 (1.5) 29.6 (1.3) 0.803MCHC, g/l 33.7 (0.9) 34.1 (1.1) 33.6 (1.3) 0.225RDW-CV, % 12.8 (0.9) 12.8 (0.8) 12.7 (0.9) 0.441
RBC stress markersHMWAg, %Band 3 monomer, %
15.6 (5.9)57.1 (6.2)
14.2 (6.3)55.5 (8.5)
10.4 (3.7)b
63.3 (6.9)b, c0.0930.031
Pfrag, % 26.7 (9.1) 29.8 (6.9) 26.7 (8.5) 0.247HMWAg/band 3 monomer 0.28 (0.12) 0.28 (0.17) 0.17 (0.06)b, c 0.135Pfrag/band 3 monomer 0.48 (0.2) 0.56 (0.2) 0.44 (0.18) 0.130
Data are presented as mean (standard deviation) for continuous variables and as percentage (number) for categorical variables.* Fisher’s exact test or one-way ANOVA; a p value for difference between genotype; b p < 0.05 vs. 6/6 genotype; c p < 0.05 vs 6/7 geno-type. RDW-CV = Coefficient of variation of the red cell width; LDLc = low-density lipoprotein cholesterol; HDLc = high-density li-poprotein cholesterol; Pfrag = proteolytic fragments.
Dow
nloa
ded
by: C
. 221
997
193.
136.
231.
240
- 7/
21/2
014
1:07
:17
PM
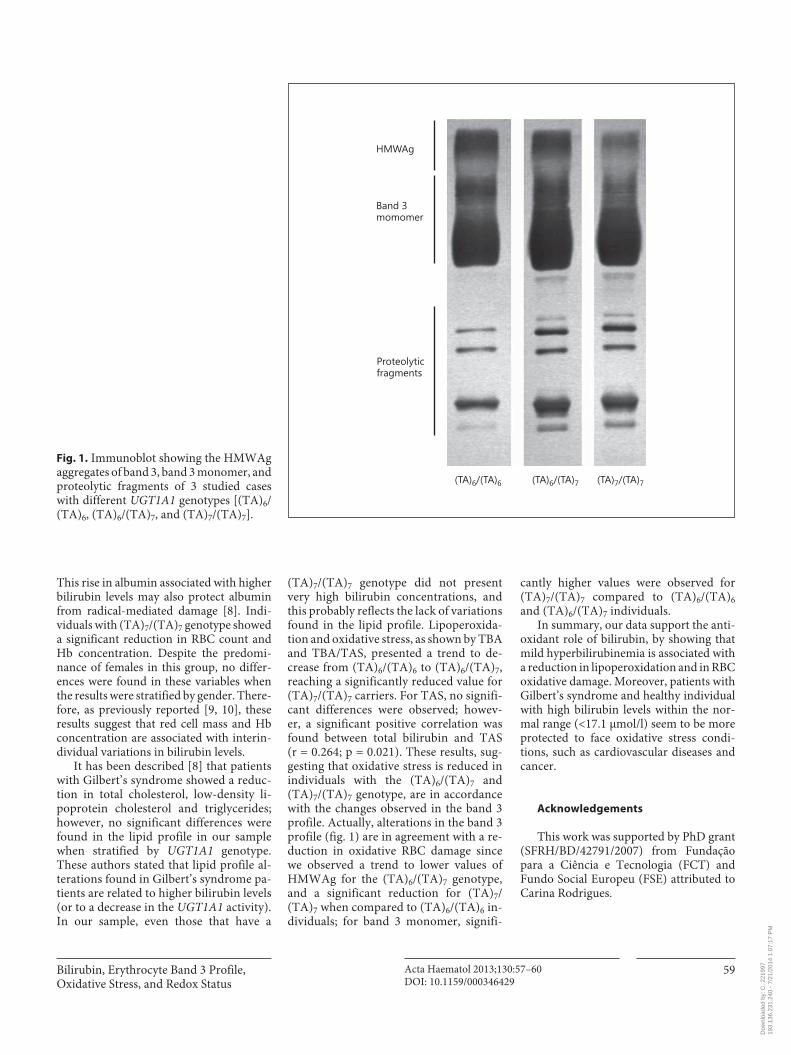
Bilirubin, Erythrocyte Band 3 Profile, Oxidative Stress, and Redox Status
Acta Haematol 2013;130:57–60 DOI: 10.1159/000346429
59
This rise in albumin associated with higher bilirubin levels may also protect albumin from radical-mediated damage [8] . Indi-viduals with (TA) 7 /(TA) 7 genotype showed a significant reduction in RBC count and Hb concentration. Despite the predomi-nance of females in this group, no differ-ences were found in these variables when the results were stratified by gender. There-fore, as previously reported [9, 10] , these results suggest that red cell mass and Hb concentration are associated with interin-dividual variations in bilirubin levels.
It has been described [8] that patients with Gilbert’s syndrome showed a reduc-tion in total cholesterol, low-density li-poprotein cholesterol and triglycerides; however, no significant differences were found in the lipid profile in our sample when stratified by UGT1A1 genotype. These authors stated that lipid profile al-terations found in Gilbert’s syndrome pa-tients are related to higher bilirubin levels (or to a decrease in the UGT1A1 activity). In our sample, even those that have a
(TA) 7 /(TA) 7 genotype did not present very high bilirubin concentrations, and this probably reflects the lack of variations found in the lipid profile. Lipoperoxida-tion and oxidative stress, as shown by TBA and TBA/TAS, presented a trend to de-crease from (TA) 6 /(TA) 6 to (TA) 6 /(TA) 7 , reaching a significantly reduced value for (TA) 7 /(TA) 7 carriers. For TAS, no signifi-cant differences were observed; howev-er, a significant positive correlation was found between total bilirubin and TAS(r = 0.264; p = 0.021). These results, sug-gesting that oxidative stress is reduced in individuals with the (TA) 6 /(TA) 7 and (TA) 7 /(TA) 7 genotype, are in accordance with the changes observed in the band 3 profile. Actually, alterations in the band 3 profile ( fig. 1 ) are in agreement with a re-duction in oxidative RBC damage sincewe observed a trend to lower values of HMWAg for the (TA) 6 /(TA) 7 genotype, and a significant reduction for (TA) 7 /(TA) 7 when compared to (TA) 6 /(TA) 6 in-dividuals; for band 3 monomer, signifi-
cantly higher values were observed for (TA) 7 /(TA) 7 compared to (TA) 6 /(TA) 6 and (TA) 6 /(TA) 7 individuals.
In summary, our data support the anti-oxidant role of bilirubin, by showing that mild hyperbilirubinemia is associated with a reduction in lipoperoxidation and in RBC oxidative damage. Moreover, patients with Gilbert’s syndrome and healthy individual with high bilirubin levels within the nor-mal range (<17.1 μmol/l) seem to be more protected to face oxidative stress condi-tions, such as cardiovascular diseases and cancer.
Acknowledgements
This work was supported by PhD grant (SFRH/BD/42791/2007) from Fundação para a Ciência e Tecnologia (FCT) and Fundo Social Europeu (FSE) attributed to Carina Rodrigues.
HMWAg
Band 3momomer
Proteolyticfragments
(TA)7/(TA)7(TA)6/(TA)7(TA)6/(TA)6
Fig. 1. Immunoblot showing the HMWAg aggregates of band 3, band 3 monomer, and proteolytic fragments of 3 studied cases with different UGT1A1 genotypes [(TA) 6 /(TA) 6 , (TA) 6 /(TA) 7 , and (TA) 7 /(TA) 7 ].
Dow
nloa
ded
by: C
. 221
997
193.
136.
231.
240
- 7/
21/2
014
1:07
:17
PM
Rodrigues et al. Acta Haematol 2013;130:57–60 DOI: 10.1159/000346429
60
References
1 Bosma PJ, Chowdhury JR, Bakker C, Gantla S, de Boer A, Oostra BA, Lindhout D, Tytgat GN, Jansen PL, Oude Elferink RP, Chowd-hury NR: The genetic basis of the reduced ex-pression of bilirubin UDP-glucuronosyl-transferase 1 in Gilbert’s syndrome. N Engl J Med 1995; 333: 1171–1175.
2 Bulmer AC, Blanchfield JT, Toth I, Fassett RG, Coornbes JS: Improved resistance to se-rum oxidation in Gilbert’s syndrome: a mech-anism for cardiovascular protection. Athero-sclerosis 2008; 199: 390–396.
3 Brito A, Silva RF, Brites D: Bilirubin induces loss of membrane lipids and exposure of phosphatidylserine in human erythrocytes. Cell Biol Toxicol 2002; 18: 181–192.
4 Gopinathan V, Miller NJ, Milner AD, Rice-Evans CA: Bilirubin and ascorbate antioxi-dant activity in neonatal plasma. FEBS Lett 1994; 349: 197–200.
5 Arese P, Turrini F, Schwarzer E: Band 3/com-plement-mediated recognition and removal of normally senescent and pathological hu-man erythrocytes. Cell Physiol Biochem 2005; 16: 133–146.
6 Costa E, Rocha S, Rocha-Pereira P, Castro E, Miranda V, Sameiro-Faria S, Loureiro A, Quintanilha A, Belo L, Santos-Silva A: Band 3 profile as a marker of erythrocyte changes in chronic kidney disease patients. Open Clin Chem J 2008; 1: 57–63.
7 Costa E, Vieira E, Dos Santos R: The polymor-phism c.-3279T>G in the phenobarbital-re-sponsive enhancer module of the bilirubin UDP-glucuronosyltransferase gene is associ-ated with Gilbert syndrome. Clin Chem 2005; 51: 2204–2206.
8 Boon AC, Hawkins CL, Bisht K, Coombes JS, Bakrania B, Wagner KH, Bulmer AC: Re-duced circulating LDL is associated with hy-pocholesterolemia and enhanced thiol status in Gilbert syndrome. Free Radic Biol Med 2012; 52: 2120–2127.
9 Rodrigues C, Costa E, Vieira E, Carvalho J, Santos R, Rocha-Pereira P, Santos-Silva A, Bonze-da-Rocha E: Bilirubin is mainly de-pendent on UGT1A1 polymorphisms, hemo-globin, fasting time and body mass index. Am J Med Sci 2012; 343: 114–118.
10 Buyukasik Y, Akman U, Buyukasik NS, Go-ker H, Kilicarslan A, Shorbagi AI, Hascelik G, Haznedaroglu IC: Evidence for higher red blood cell mass in persons with unconjugated hyperbilirubinemia and Gilbert’s syndrome. Am J Med Sci 2008; 335: 115–119.
Dow
nloa
ded
by: C
. 221
997
193.
136.
231.
240
- 7/
21/2
014
1:07
:17
PM

Artigo IV
_____________________________________________________________________

Performance of in silico tools for evaluating UGT1A1 missense variants
Carina Rodrigues1,2, Alice Santos-Silva1,3, Elísio Costa 1,3 and Elsa Bronze-da-Rocha1,3,*
1 Laboratório de Bioquímica, Departamento de Ciências Biológicas, Faculdade de Farmácia, Universidade do
Porto, Portugal; 2 Escola Superior de Saúde, Instituto Politécnico de Bragança, Bragança, Portugal; 3 Instituto
de Biologia Molecular e Celular, Universidade do Porto, Portugal
* Correspondence to: Elsa Bronze-da-Rocha, Departamento de Ciências Biológicas, Laboratório de
Bioquímica, Faculdade de Farmácia da Universidade do Porto, Rua Jorge Viterbo Ferreira 228, 4050-313
Porto, Portugal; Tel: 00 351 220 428 568; Fax: 00 351 226 093 390; email: [email protected]
ABSTRACT
Variations in the gene encoding the uridine diphosphate glucuronosyltransferase 1A1
(UGT1A1) are particularly important since they have been associated to hyperbilirubinemia
in Gilbert’s and Crigler-Najjar syndromes, and changes in drug metabolism. Several variants
associated with those phenotypes are nonsynonymous single nucleotide polymorphisms
SNPs (nsSNPs). Bioinformatics approaches have gained an increased importance to predict
the functional significance of these variants. This study was focused in the prediction ability
of bioinformatics approaches to determine the pathogenicity of human UGT1A1 nsSNPs,
previously characterized, at protein level, by in vivo and in vitro studies. Using fifteen web
algorithms, we evaluated 48 nsSNPs described in literature and databases. Seven of them
reached or exceeded 90% of sensitivity and five presented Mathew’s correlation coefficient
above 0.45. The best performing method was MutPred, followed by SIFT. The prediction
measures vary significantly when predictors such us SIFT, Polyphen-2 and PMUT run with
their native alignment, generated by the tool, or with an input alignment, strictly build with
UGT1A1 orthologs and manually curated. Results showed that prediction performance of
some methods, based on sequence conservation analysis, can be negatively affected when
nsSNPs are positioned at the hipervariable or constant regions of UGT1A1 orthologs
sequences.
KEYWORDS: UGT1A1 gene, nsSNPs, bioinformatic web-tools, genotype, phenotype,
protein function.
Introduction
The uridine diphosphate glucuronosyltransferase (UGT1A1) is an enzyme involved in the
metabolism and detoxification of numerous xenobiotic and endogenous compounds,
including bilirubin (246). Until now, more than 300 single nucleotide polymorphisms
(SNPs) within the UGT1A1 gene (emsemble database) were identified. Some of them have
been associated with Gilbert’s syndrome (SG) (91, 146, 247,248)and with Crigler-Najjar
syndrome (CNS) type I and II (88, 247-249), as well as with changes in drug clearance and/or
response (250). Many of these variants have been implicated in human diseases but, in some
cases, in the absence of functional studies, its pathogenicity remains unclear. Similarly to
other genes, UGT1A1 presents many nsSNPs in which genotype-phenotype correlations are
not established. The functional evaluation of SNPs is time consuming and expensive. By this
reason, bioinformatics tools have gained increasing importance and have been used to select
additional functional studies. These methods can be divided into two main categories,
sequence-based approaches and sequence and structure-based methods. The first one uses
multiple sequence alignments (MSA) and incorporates different methodologies to measure
residue conservation, namely Sorting Intolerant from Tolerant (SIFT) (152), Prediction of
Pathological Mutations on Proteins (PMUT) (251) and Multivariate Analysis of Protein
Polymorphism (MAPP) (252). These tools assume that the functional SNP occurs at
evolutionary conserved sites and that the majority of SNP are functionally neutral (253)
(254). Thus, prediction of the functional effect of a SNP is created based on conservation
and variation in a specific position. The second group uses sequence and structure features
which predicts possible impact of an amino acid substitution, like Polymorphism
Phenotyping, version-2 (Polyphen-2) (153) and Molecular Phenotyping of Coding nsSNPs
(SNPeffect) (154). Some of structure based methods are generally more reliable because
they take into account the three-dimensional (3D) structure of the protein and classify the
SNP based on changes in the size, polarity and protein stability, but their use could be limited
due to the lack of protein structural information. However, these prediction methods can, in
same extent, analyze one sequence and modulate substitutions on the structure of a
homologous protein rather than in the exact protein structure of interest. The nsSNPs
functional prediction methods can also incorporate annotations that come from the Swiss-
Prot database or use information from others prediction programs namely those that identify
transmembrane regions or secondary structures (255). Moreover, Consensus Deleteriousness
(CONDEL) tool combines different web-tools outputs into a unified
classification (256). Most of the sequence-based amino acid substitution prediction methods
accept as input, a protein sequence or protein identifier (ID) and then search it against a
system databases to find homologous sequences and produce a multiple sequencing
alignment (257, 258). To automatically generate MSAs, the homologous sequences are
selected from several databases such as SWISS-PROT or NCBI's non-redundant protein
databases. The obtained MSAs contain orthologs, paralogs and multiple versions of the same
sequence that can potentially alter conservation profiles. On average, between two paralogs,
the amino acid sequence identity is only 30% (259). Ideally, only orthologous sequences
should be used in a MSA, but paralogs have been widely used probably due to the
insufficiency number of orthologous sequences. Some observations point out that a MSA
constructed only with orthologous sequences can lead to a more reliable evolutionary
analysis which improves predictor’s performance (253, 260). However, these computational
tools require computer skills, are time-consuming for users and involve a great effort to
select the most appropriate method.
The aim of the present study was to investigate the prediction ability of 15 web available
algorithms to assign biological or biochemical roles to a set of UGT1A1 phenotypically well
characterized nsSNPs, by in vivo and in vitro studies.
Methods
Variants Search
To define a set of well characterized UGT1A1 SNPs, we performed a literature review and
a search for variants among databases: http://www.polydoms.cchmc.org/polydoms,
http://www.ensembl.org, http://www.ncbi.nlm.nih.gov/SNP; http://www.genecards.org.
We obtained information from the specific site of UGT nomenclature
(http://www.pharmacogenomics.pha.ulaval.ca/cms/ugt_alleles/) in order to find UGT1A1
variants related with unconjugated hyperbilirubinemia in GS and CNS. Despite being
described over 300 SNPs in the database, this study only included 87 variants, which are
described in literature as associated or not with hyperbilirubinemia. Among those, 38 were
classified as deleterious based on in vitro or in vivo studies, that include site-directed
mutagenesis, expression studies, assay of liver biopsy specimen, administration of
phenobarbital and duodenal bile pattern, and 10 which were associated to normal bilirubin
levels. These two groups of variants represent the gold standard for this study. The remaining
39 nsSNPs were also described as associated to unconjugated hyperbilirubinemia but the
functional impact at protein level was not yet determined (see online supporting information:
S1).
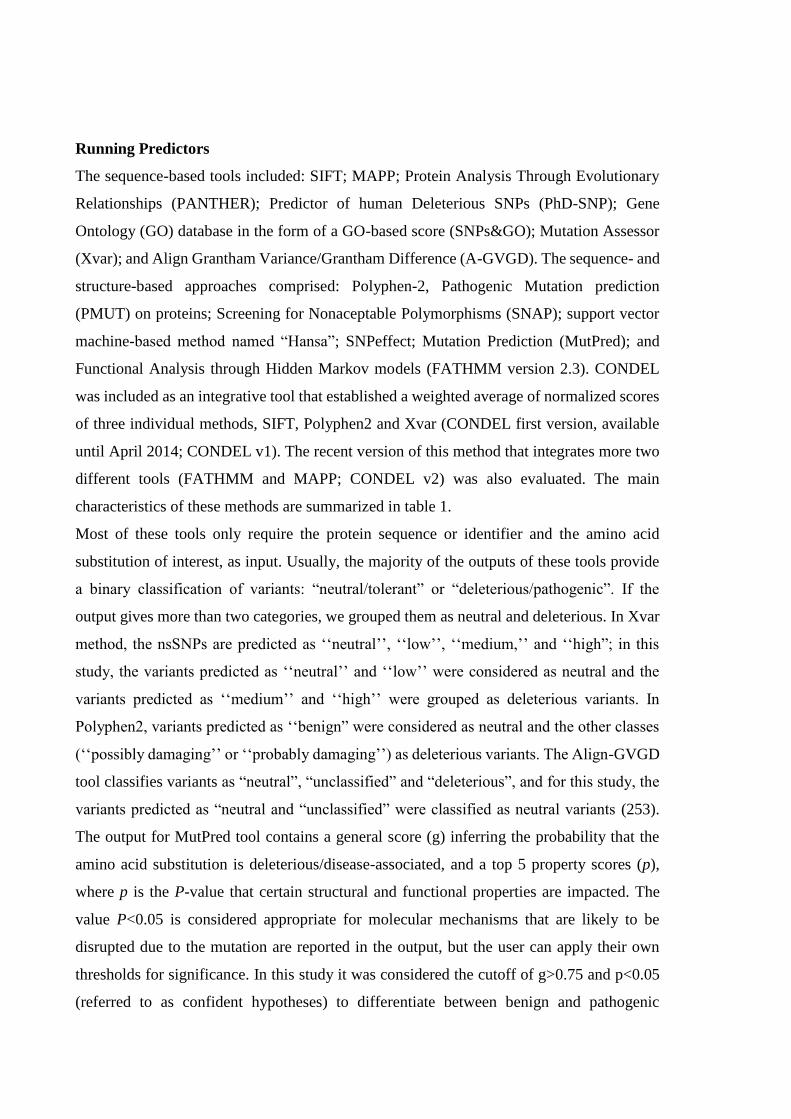
Running Predictors
The sequence-based tools included: SIFT; MAPP; Protein Analysis Through Evolutionary
Relationships (PANTHER); Predictor of human Deleterious SNPs (PhD-SNP); Gene
Ontology (GO) database in the form of a GO-based score (SNPs&GO); Mutation Assessor
(Xvar); and Align Grantham Variance/Grantham Difference (A-GVGD). The sequence- and
structure-based approaches comprised: Polyphen-2, Pathogenic Mutation prediction
(PMUT) on proteins; Screening for Nonaceptable Polymorphisms (SNAP); support vector
machine-based method named “Hansa”; SNPeffect; Mutation Prediction (MutPred); and
Functional Analysis through Hidden Markov models (FATHMM version 2.3). CONDEL
was included as an integrative tool that established a weighted average of normalized scores
of three individual methods, SIFT, Polyphen2 and Xvar (CONDEL first version, available
until April 2014; CONDEL v1). The recent version of this method that integrates more two
different tools (FATHMM and MAPP; CONDEL v2) was also evaluated. The main
characteristics of these methods are summarized in table 1.
Most of these tools only require the protein sequence or identifier and the amino acid
substitution of interest, as input. Usually, the majority of the outputs of these tools provide
a binary classification of variants: “neutral/tolerant” or “deleterious/pathogenic”. If the
output gives more than two categories, we grouped them as neutral and deleterious. In Xvar
method, the nsSNPs are predicted as ‘‘neutral’’, ‘‘low’’, ‘‘medium,’’ and ‘‘high”; in this
study, the variants predicted as ‘‘neutral’’ and ‘‘low’’ were considered as neutral and the
variants predicted as ‘‘medium’’ and ‘‘high’’ were grouped as deleterious variants. In
Polyphen2, variants predicted as ‘‘benign” were considered as neutral and the other classes
(‘‘possibly damaging’’ or ‘‘probably damaging’’) as deleterious variants. The Align-GVGD
tool classifies variants as “neutral”, “unclassified” and “deleterious”, and for this study, the
variants predicted as “neutral and “unclassified” were classified as neutral variants (253).
The output for MutPred tool contains a general score (g) inferring the probability that the
amino acid substitution is deleterious/disease-associated, and a top 5 property scores (p),
where p is the P-value that certain structural and functional properties are impacted. The
value P<0.05 is considered appropriate for molecular mechanisms that are likely to be
disrupted due to the mutation are reported in the output, but the user can apply their own
thresholds for significance. In this study it was considered the cutoff of g>0.75 and p<0.05
(referred to as confident hypotheses) to differentiate between benign and pathogenic
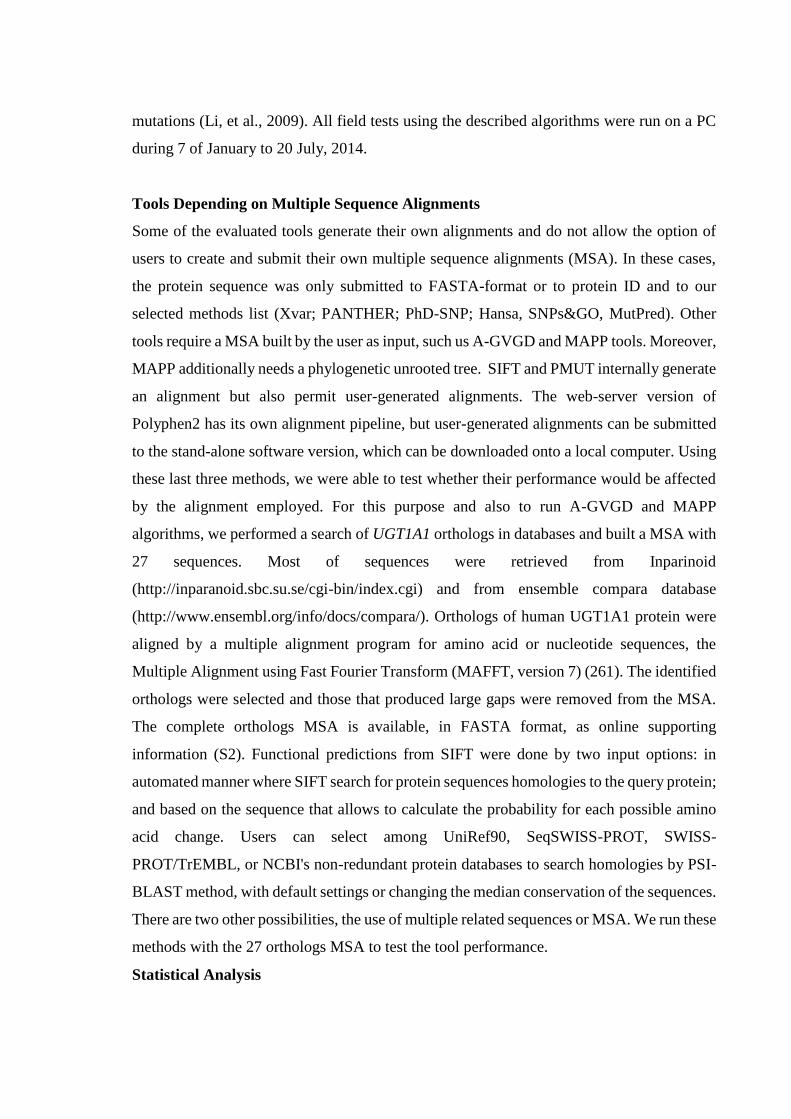
mutations (Li, et al., 2009). All field tests using the described algorithms were run on a PC
during 7 of January to 20 July, 2014.
Tools Depending on Multiple Sequence Alignments
Some of the evaluated tools generate their own alignments and do not allow the option of
users to create and submit their own multiple sequence alignments (MSA). In these cases,
the protein sequence was only submitted to FASTA-format or to protein ID and to our
selected methods list (Xvar; PANTHER; PhD-SNP; Hansa, SNPs&GO, MutPred). Other
tools require a MSA built by the user as input, such us A-GVGD and MAPP tools. Moreover,
MAPP additionally needs a phylogenetic unrooted tree. SIFT and PMUT internally generate
an alignment but also permit user-generated alignments. The web-server version of
Polyphen2 has its own alignment pipeline, but user-generated alignments can be submitted
to the stand-alone software version, which can be downloaded onto a local computer. Using
these last three methods, we were able to test whether their performance would be affected
by the alignment employed. For this purpose and also to run A-GVGD and MAPP
algorithms, we performed a search of UGT1A1 orthologs in databases and built a MSA with
27 sequences. Most of sequences were retrieved from Inparinoid
(http://inparanoid.sbc.su.se/cgi-bin/index.cgi) and from ensemble compara database
(http://www.ensembl.org/info/docs/compara/). Orthologs of human UGT1A1 protein were
aligned by a multiple alignment program for amino acid or nucleotide sequences, the
Multiple Alignment using Fast Fourier Transform (MAFFT, version 7) (261). The identified
orthologs were selected and those that produced large gaps were removed from the MSA.
The complete orthologs MSA is available, in FASTA format, as online supporting
information (S2). Functional predictions from SIFT were done by two input options: in
automated manner where SIFT search for protein sequences homologies to the query protein;
and based on the sequence that allows to calculate the probability for each possible amino
acid change. Users can select among UniRef90, SeqSWISS-PROT, SWISS-
PROT/TrEMBL, or NCBI's non-redundant protein databases to search homologies by PSI-
BLAST method, with default settings or changing the median conservation of the sequences.
There are two other possibilities, the use of multiple related sequences or MSA. We run these
methods with the 27 orthologs MSA to test the tool performance.
Statistical Analysis
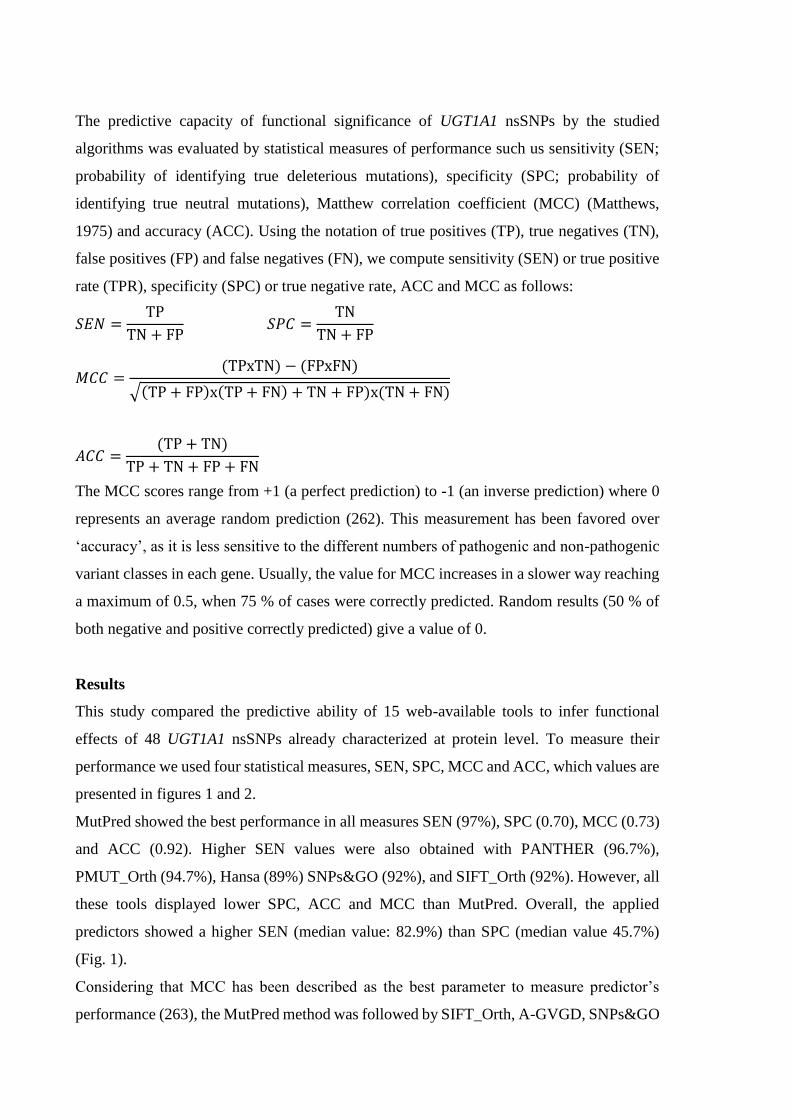
The predictive capacity of functional significance of UGT1A1 nsSNPs by the studied
algorithms was evaluated by statistical measures of performance such us sensitivity (SEN;
probability of identifying true deleterious mutations), specificity (SPC; probability of
identifying true neutral mutations), Matthew correlation coefficient (MCC) (Matthews,
1975) and accuracy (ACC). Using the notation of true positives (TP), true negatives (TN),
false positives (FP) and false negatives (FN), we compute sensitivity (SEN) or true positive
rate (TPR), specificity (SPC) or true negative rate, ACC and MCC as follows:
𝑆𝐸𝑁 =TP
TN + FP 𝑆𝑃𝐶 =
TN
TN + FP
𝑀𝐶𝐶 =(TPxTN) − (FPxFN)
√(TP + FP)x(TP + FN) + TN + FP)x(TN + FN)
𝐴𝐶𝐶 =(TP + TN)
TP + TN + FP + FN
The MCC scores range from +1 (a perfect prediction) to -1 (an inverse prediction) where 0
represents an average random prediction (262). This measurement has been favored over
‘accuracy’, as it is less sensitive to the different numbers of pathogenic and non-pathogenic
variant classes in each gene. Usually, the value for MCC increases in a slower way reaching
a maximum of 0.5, when 75 % of cases were correctly predicted. Random results (50 % of
both negative and positive correctly predicted) give a value of 0.
Results
This study compared the predictive ability of 15 web-available tools to infer functional
effects of 48 UGT1A1 nsSNPs already characterized at protein level. To measure their
performance we used four statistical measures, SEN, SPC, MCC and ACC, which values are
presented in figures 1 and 2.
MutPred showed the best performance in all measures SEN (97%), SPC (0.70), MCC (0.73)
and ACC (0.92). Higher SEN values were also obtained with PANTHER (96.7%),
PMUT_Orth (94.7%), Hansa (89%) SNPs&GO (92%), and SIFT_Orth (92%). However, all
these tools displayed lower SPC, ACC and MCC than MutPred. Overall, the applied
predictors showed a higher SEN (median value: 82.9%) than SPC (median value 45.7%)
(Fig. 1).
Considering that MCC has been described as the best parameter to measure predictor’s
performance (263), the MutPred method was followed by SIFT_Orth, A-GVGD, SNPs&GO
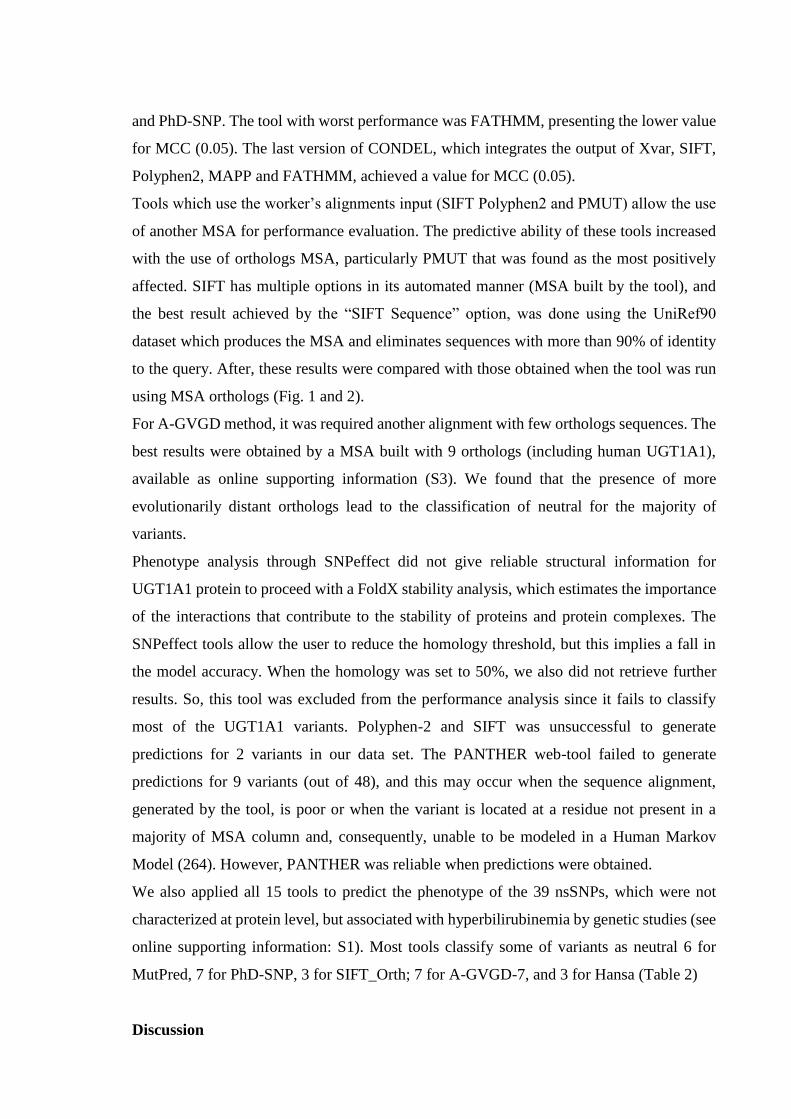
and PhD-SNP. The tool with worst performance was FATHMM, presenting the lower value
for MCC (0.05). The last version of CONDEL, which integrates the output of Xvar, SIFT,
Polyphen2, MAPP and FATHMM, achieved a value for MCC (0.05).
Tools which use the worker’s alignments input (SIFT Polyphen2 and PMUT) allow the use
of another MSA for performance evaluation. The predictive ability of these tools increased
with the use of orthologs MSA, particularly PMUT that was found as the most positively
affected. SIFT has multiple options in its automated manner (MSA built by the tool), and
the best result achieved by the “SIFT Sequence” option, was done using the UniRef90
dataset which produces the MSA and eliminates sequences with more than 90% of identity
to the query. After, these results were compared with those obtained when the tool was run
using MSA orthologs (Fig. 1 and 2).
For A-GVGD method, it was required another alignment with few orthologs sequences. The
best results were obtained by a MSA built with 9 orthologs (including human UGT1A1),
available as online supporting information (S3). We found that the presence of more
evolutionarily distant orthologs lead to the classification of neutral for the majority of
variants.
Phenotype analysis through SNPeffect did not give reliable structural information for
UGT1A1 protein to proceed with a FoldX stability analysis, which estimates the importance
of the interactions that contribute to the stability of proteins and protein complexes. The
SNPeffect tools allow the user to reduce the homology threshold, but this implies a fall in
the model accuracy. When the homology was set to 50%, we also did not retrieve further
results. So, this tool was excluded from the performance analysis since it fails to classify
most of the UGT1A1 variants. Polyphen-2 and SIFT was unsuccessful to generate
predictions for 2 variants in our data set. The PANTHER web-tool failed to generate
predictions for 9 variants (out of 48), and this may occur when the sequence alignment,
generated by the tool, is poor or when the variant is located at a residue not present in a
majority of MSA column and, consequently, unable to be modeled in a Human Markov
Model (264). However, PANTHER was reliable when predictions were obtained.
We also applied all 15 tools to predict the phenotype of the 39 nsSNPs, which were not
characterized at protein level, but associated with hyperbilirubinemia by genetic studies (see
online supporting information: S1). Most tools classify some of variants as neutral 6 for
MutPred, 7 for PhD-SNP, 3 for SIFT_Orth; 7 for A-GVGD-7, and 3 for Hansa (Table 2)
Discussion
Determining the pathogenicity of a nsSNP could be an important step to establish the genetic
basis of a pathology, assess individual susceptibility to disease, understand its pathogenesis,
identify molecular targets for drug treatment and improve individualized therapy. An
increasing number of algorithms have been developed in order to predict the impact of
missense mutations on protein function. In line, we evaluated the performance of fifteen
available tools to predict the functionality of our selected UGT1A1 nsSNP variants.
The majority of bioinformatics tools described in literature are sequence and structure-based
approaches (table 1). The MutPred, a sequence and structure-based approach was found as
the best performance tool to predict the phenotype of UGT1A1 nsSNPs (265). This tool
predicts the disruption of molecular function and works specifically fine for well-studied
proteins, when homology and solved structure are available. It was expected that the lack of
3D solved structure of UGT1A1 protein could be a limitation for this analysis, but the
establishment of MutPred’s of g>0.75 cutoff to differentiating between benign and
disrupted/pathogenic variants, was determinant to classify accurately neutral variants of our
data set, resulting in higher specificity of this tool (70%). The other tools that also presented
a good performance were SIFT (Orth) and PhD-SNP.
These results are in accordance with those obtained in other studies, in which MutPred
showed a good performance (258, 265). Thusberg and collaborators evaluated eight tools,
also included in our study, in a total dataset of 40 000 variants and concluded that no single
method could be rated as the best for all parameters. However, SNPs&GO and MutPred
approaches showed the best performance (MutPred: MCC=0.63; ACC=0.81; SNPs&GO:
MCC=0.65; ACC=0.82). In two other studies which evaluate SNP-based predictor’s
performance on UGT1A1 nsSNPs was obtained a lower performance with these tools (155)
(156). The first study encompassed other UGT1A1 variants, did not include neutral variants
and tools only included SIFT and Polyphen (first version) (155). For Polyphen the correct
prediction rate was 66.7% and for SIFT was 57.1%, a prediction rate significantly lower
compared to that found in the present study, 88,9% for SIFT and 81,6% for Polyphen. In the
second study, the performance of 6 SNP-based pathogenicity tools were tested in 59
UGT1A1 nsSNPs associated with CNS (156). The higher MCC value was obtained by
SIFT_Orth (0.62), which also showed the highest ACC value (0.87), similarly to MutPred
method (0.92). FATHMM method had shown the lowest performance, a result also obtained
in our study. Additionally, some of the tools applied by Galehdari and collaborators were
used in our work, namely SIFT, Polyphen2, MutPred, PhD-SNP and FATHMM, for the
same UGT1A1 variants (156). However, they obtained lower performances for all methods,
except for FATHMM. These discrepancies could be related with the use of different criterion
for variant selection, since in our study the selection of UGT1A1 variants were performed
based on literature search, the selected variants were deleterious and already validated by
functional studies, and the neutral variants were described as associated with normal
bilirubin levels.
The quality of MSA used to infer how an amino acid substitution is tolerated at a given
position, is a critical step. There are tools that generate MSAs internally and allow the option
of users to create and submit their own MSAs. Some SNPs predictors do not always
accomplish their best own program-generated MSA and more accurate results could be
achieved with gene-specific MSAs optimized by the user (266). Considering that orthologs
sequences are more reliable to give phylogenetic information, several groups have improved
predictions by restricting analysis to orthologs rather than paralogs (253, 260). Additionally,
others MSA, built strictly with orthologs sequences could improve performance. A
conserved position within a multiple sequence alignment may be due to an evolutionary
selection pressure, to maintain protein function, but it also can occur casually. Increasing the
orthologs added to a MSA leads to a greater power in discriminate local substitutions as
pathogenic and non-pathogenic (259). Orthologs are corresponding genes in different
lineages and are a result of speciation, whereas paralogs result from gene duplication (267).
We verified that methods mainly based on protein structural information, such as SNPeffect,
failed to give reliable information for UGT1A1 variants. The three tools SIFT_Orth,
Polyphen2 and PMUT enables greater control of user-defined sequences in the alignment
and flexibility when adding or removing sequences in the MSA, but entails considerable
additional work to obtain and align the relevant protein sequences. There is also the
possibility of skewing the results by variations in the numbers and types of species selected
to be included in the MSA.
Building a reliable MSA of UGT1A1 orthologs was challenging due to the presence of
hypervariable and constant regions observed among UGT1A1 sequences. The UGT1A1 gene
is part of a complex locus that encodes several UDP-glucuronosyltransferases (138). The
locus includes thirteen unique alternate first exons followed by four common exons. Each of
the remaining nine 5' exons may be spliced to the four common exons, resulting in nine
proteins with different N-terminal and identical C-terminal. Each first exon encodes the
substrate binding site, and is regulated by its own promoter (acceptor-binding region;
residues 26-291) and the other four exons (conserved region; residues: 292 and 490) encodes
the sugar binding site, donor-binding region (138). According to Li and co-workers (150)
the donor-binding region is highly conserved, especially in the donor-interacting residues
(the residues interacting with UDP glucuronic acid) and in the acceptor-binding region that
presents four hypervariable regions among vertebrate UGTs. The alignment of 27 orthologs
(Fig. 3) is shown in a fragment of the protein sequence corresponding to acceptor-binding
region (Fig. 3 A) and in a section of the donor-binding site (Fig. 3B). The complete alignment
of 27 orthologs is available as online supporting information (supplementary data file: S4).
Classification of variants based on phylogenetic information assumes that pathogenic sites
remain conserved and non-pathogenic sites exhibit increased diversity. Some of the
validated pathogenic variants located at hypervariable region of UGT1A1 protein are
frequently as neutral due to the low conservation observed at those positions by sequence
based tools. Examples of these variants are G71R (268), F83L (269) and V225G (270),
associated with GS and CNS. In opposing, neutral mutations are classified as deleterious at
the constant region.
We verify that most of variants are classified as neutral by using the A-GVGD tool, when
the alignments contain large number of sequences. The presence of gaps in the vicinity of
the alignment column leads to predictions towards neutral, as verified by Hicks and co-
workers (271). In order to improve the tool´s performance, it was required another
alignment, with few orthologs sequences (9 orthologs), and with higher identity. The manual
inspection of the alignment is recommended in order to ensure that predictions are
appropriate and accurate as possible.
In the prediction analyses of other 39 variants described in literature as associated with
hyperbilirubinemia, without functional studies (table 2), we observed that some predictors
with the best performance classified these variants as neutral. This can happen for several
reasons. First, all of these methods have an error associated in their prediction and any tool
does not reach 100% accuracy. Second, most of these variants, classified as neutral, are
located in the hypervariable region (M1V, Q6H, H39D, W40R, V169E, Q185P) as observed
for the first data set analyzed in this study. Third, the variant could be classified as neutral
and its association with hyperbilirubinemia may have resulted from an incorrect assumption.
The establishment of a genotype-phenotype correlation in relation to SNPs of UGT1A1 gene,
may be challenging due to the presence of other frequent mutation which occurs at promoter
region (see variant description file S1), that could be also associated with elevate bilirubin
levels.
The information provided by the in silico methods has the advantage of directing and
complement functional assays. The overall best performing methods obtained in this study
for UGT1A1 variants were MutPred and SIFT-Orth. The capacity of SNP prediction methods
can vary according the available structural information and the MSA employed. Taking in
account the results obtained in this work, whenever possible, the user should consider
optimizing sequence alignment employed. The performance study of SNP predictors, using
a set of functionally well characterized variants, is essential to help redirect the in silico
analysis of particular gene.
Acknowledgments
A PhD grant (SFRH/BD/42791/2007) attributed to Carina Rodrigues, from Fundação para a
Ciência e Tecnologia (FCT) and Fundo Social Europeu (FSE), supported this work. The
authors thank Adam Hospital from the University of Barcelona (PMUT) for their help in
analyzing our data and Dr. Ivan Adzhubey (Polyphen-2), from Harvard Medical School, for
providing the analysis with Standalone software in their local computer and guidance to
analyze results.
Disclosure Statement
All the authors have declared no conflicts of interest.
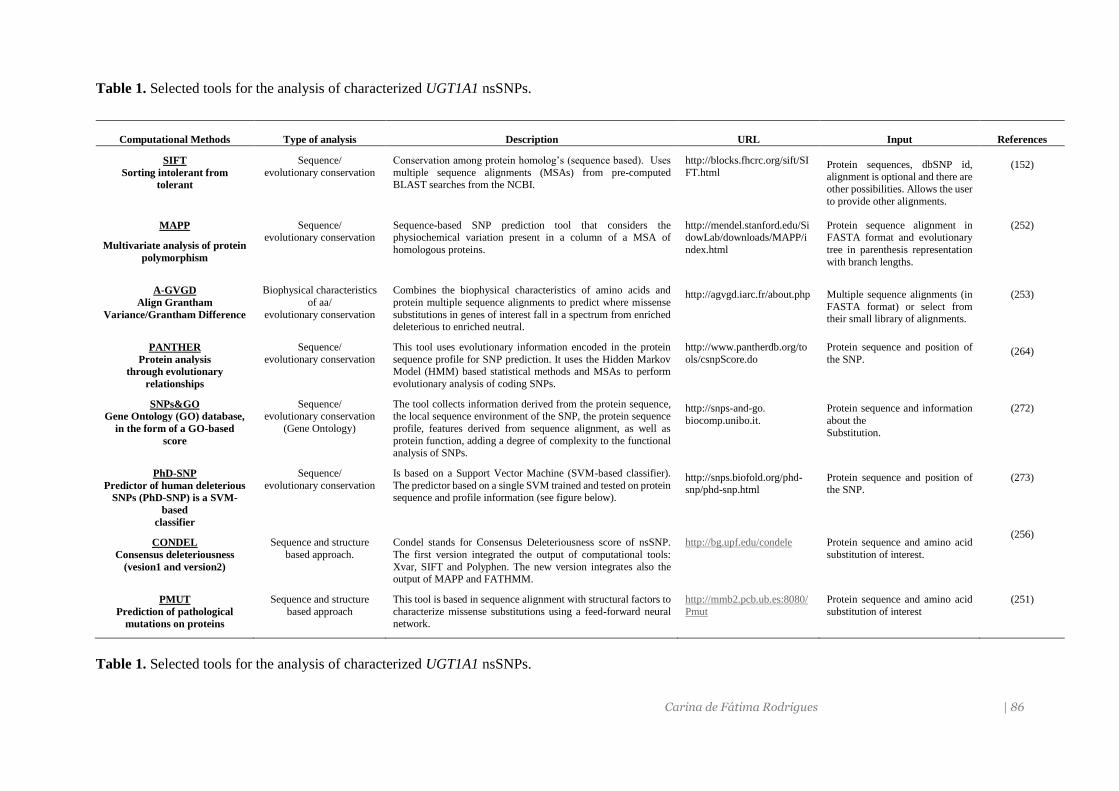
Carina de Fátima Rodrigues | 86
Table 1. Selected tools for the analysis of characterized UGT1A1 nsSNPs.
Table 1. Selected tools for the analysis of characterized UGT1A1 nsSNPs.
Computational Methods
Type of analysis
Description
URL
Input
References
SIFT
Sorting intolerant from
tolerant
Sequence/
evolutionary conservation
Conservation among protein homolog’s (sequence based). Uses
multiple sequence alignments (MSAs) from pre-computed BLAST searches from the NCBI.
http://blocks.fhcrc.org/sift/SI
FT.html
Protein sequences, dbSNP id, alignment is optional and there are
other possibilities. Allows the user
to provide other alignments.
(152)
MAPP
Multivariate analysis of protein
polymorphism
Sequence/ evolutionary conservation
Sequence-based SNP prediction tool that considers the physiochemical variation present in a column of a MSA of
homologous proteins.
http://mendel.stanford.edu/SidowLab/downloads/MAPP/i
ndex.html
Protein sequence alignment in FASTA format and evolutionary
tree in parenthesis representation
with branch lengths.
(252)
A-GVGD
Align Grantham
Variance/Grantham Difference
Biophysical characteristics
of aa/
evolutionary conservation
Combines the biophysical characteristics of amino acids and
protein multiple sequence alignments to predict where missense
substitutions in genes of interest fall in a spectrum from enriched deleterious to enriched neutral.
http://agvgd.iarc.fr/about.php
Multiple sequence alignments (in
FASTA format) or select from their small library of alignments.
(253)
PANTHER
Protein analysis
through evolutionary
relationships
Sequence/
evolutionary conservation
This tool uses evolutionary information encoded in the protein
sequence profile for SNP prediction. It uses the Hidden Markov Model (HMM) based statistical methods and MSAs to perform
evolutionary analysis of coding SNPs.
http://www.pantherdb.org/to
ols/csnpScore.do
Protein sequence and position of
the SNP.
(264)
SNPs&GO
Gene Ontology (GO) database,
in the form of a GO-based
score
Sequence/ evolutionary conservation
(Gene Ontology)
The tool collects information derived from the protein sequence, the local sequence environment of the SNP, the protein sequence
profile, features derived from sequence alignment, as well as
protein function, adding a degree of complexity to the functional analysis of SNPs.
http://snps-and-go.
biocomp.unibo.it.
Protein sequence and information
about the
Substitution.
(272)
PhD-SNP
Predictor of human deleterious
SNPs (PhD-SNP) is a SVM-
based
classifier
Sequence/
evolutionary conservation
Is based on a Support Vector Machine (SVM-based classifier).
The predictor based on a single SVM trained and tested on protein sequence and profile information (see figure below).
http://snps.biofold.org/phd-snp/phd-snp.html
Protein sequence and position of the SNP.
(273)
CONDEL
Consensus deleteriousness
(vesion1 and version2)
Sequence and structure
based approach.
Condel stands for Consensus Deleteriousness score of nsSNP.
The first version integrated the output of computational tools:
Xvar, SIFT and Polyphen. The new version integrates also the output of MAPP and FATHMM.
http://bg.upf.edu/condele
Protein sequence and amino acid
substitution of interest.
(256)
PMUT
Prediction of pathological
mutations on proteins
Sequence and structure
based approach
This tool is based in sequence alignment with structural factors to
characterize missense substitutions using a feed-forward neural network.
http://mmb2.pcb.ub.es:8080/
Pmut
Protein sequence and amino acid
substitution of interest
(251)
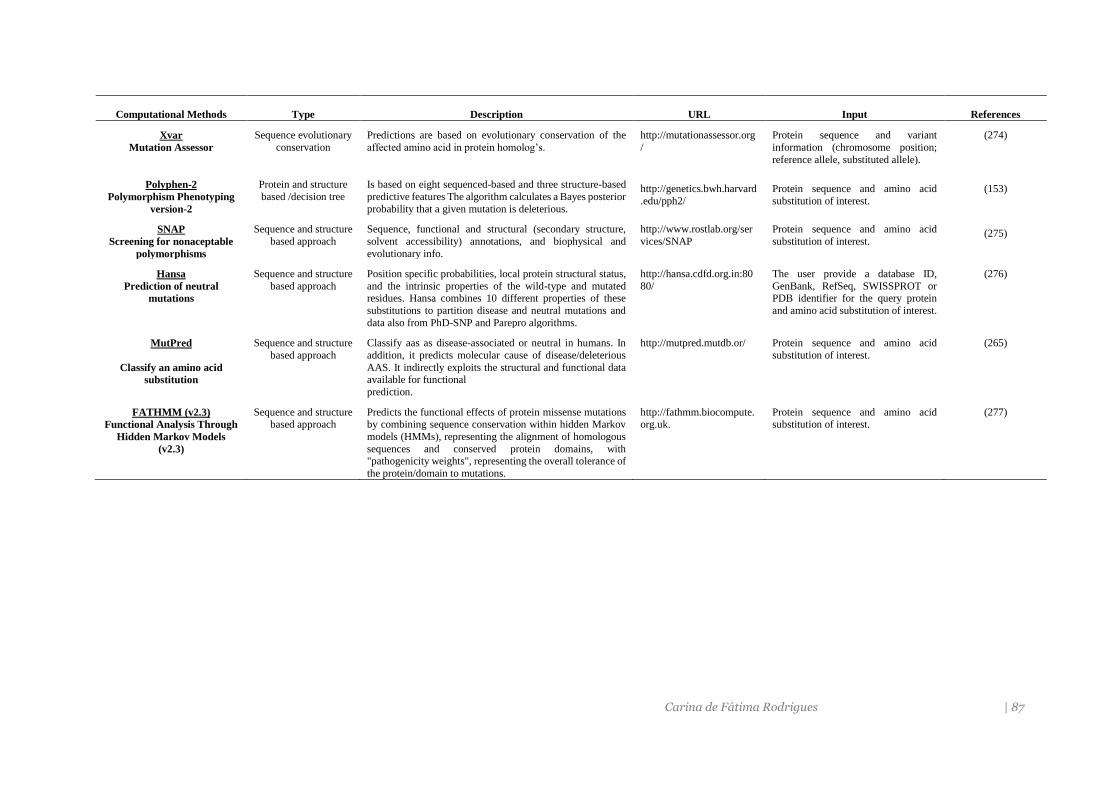
Carina de Fátima Rodrigues | 87
Computational Methods
Type
Description
URL
Input
References
Xvar
Mutation Assessor
Sequence evolutionary
conservation
Predictions are based on evolutionary conservation of the
affected amino acid in protein homolog’s.
http://mutationassessor.org
/
Protein sequence and variant
information (chromosome position;
reference allele, substituted allele).
(274)
Polyphen-2
Polymorphism Phenotyping
version-2
Protein and structure
based /decision tree
Is based on eight sequenced-based and three structure-based
predictive features The algorithm calculates a Bayes posterior
probability that a given mutation is deleterious.
http://genetics.bwh.harvard
.edu/pph2/
Protein sequence and amino acid
substitution of interest.
(153)
SNAP
Screening for nonaceptable
polymorphisms
Sequence and structure
based approach
Sequence, functional and structural (secondary structure,
solvent accessibility) annotations, and biophysical and
evolutionary info.
http://www.rostlab.org/ser
vices/SNAP
Protein sequence and amino acid
substitution of interest.
(275)
Hansa
Prediction of neutral
mutations
Sequence and structure
based approach
Position specific probabilities, local protein structural status,
and the intrinsic properties of the wild-type and mutated residues. Hansa combines 10 different properties of these
substitutions to partition disease and neutral mutations and
data also from PhD-SNP and Parepro algorithms.
http://hansa.cdfd.org.in:80
80/
The user provide a database ID,
GenBank, RefSeq, SWISSPROT or PDB identifier for the query protein
and amino acid substitution of interest.
(276)
MutPred
Classify an amino acid
substitution
Sequence and structure
based approach
Classify aas as disease-associated or neutral in humans. In
addition, it predicts molecular cause of disease/deleterious
AAS. It indirectly exploits the structural and functional data available for functional
prediction.
http://mutpred.mutdb.or/
Protein sequence and amino acid
substitution of interest.
(265)
FATHMM (v2.3)
Functional Analysis Through
Hidden Markov Models
(v2.3)
Sequence and structure
based approach
Predicts the functional effects of protein missense mutations
by combining sequence conservation within hidden Markov
models (HMMs), representing the alignment of homologous
sequences and conserved protein domains, with "pathogenicity weights", representing the overall tolerance of
the protein/domain to mutations.
http://fathmm.biocompute.
org.uk.
Protein sequence and amino acid
substitution of interest.
(277)
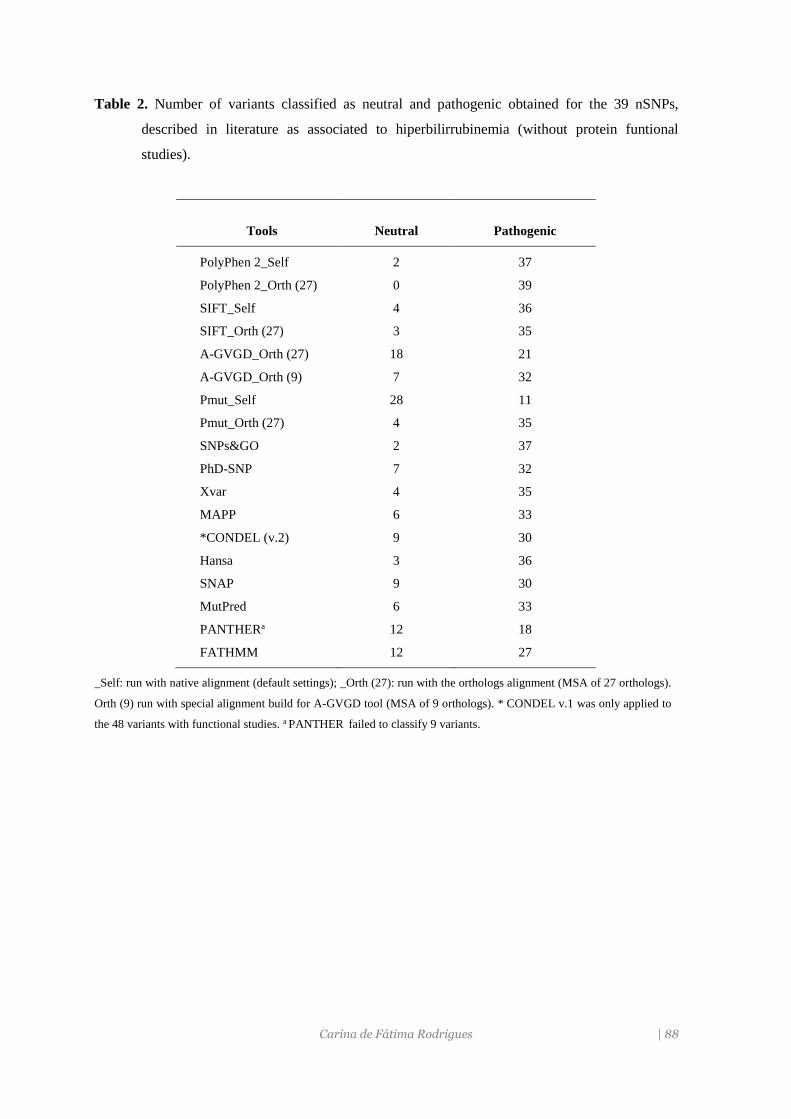
Carina de Fátima Rodrigues | 88
Table 2. Number of variants classified as neutral and pathogenic obtained for the 39 nSNPs,
described in literature as associated to hiperbilirrubinemia (without protein funtional
studies).
_Self: run with native alignment (default settings); _Orth (27): run with the orthologs alignment (MSA of 27 orthologs).
Orth (9) run with special alignment build for A-GVGD tool (MSA of 9 orthologs). * CONDEL v.1 was only applied to
the 48 variants with functional studies. a PANTHER failed to classify 9 variants.
Tools
Neutral
Pathogenic
PolyPhen 2_Self 2 37
PolyPhen 2_Orth (27) 0 39
SIFT_Self 4 36
SIFT_Orth (27) 3 35
A-GVGD_Orth (27) 18 21
A-GVGD_Orth (9) 7 32
Pmut_Self 28 11
Pmut_Orth (27) 4 35
SNPs&GO 2 37
PhD-SNP 7 32
Xvar 4 35
MAPP 6 33
*CONDEL (v.2) 9 30
Hansa 3 36
SNAP 9 30
MutPred 6 33
PANTHERa 12 18
FATHMM 12 27
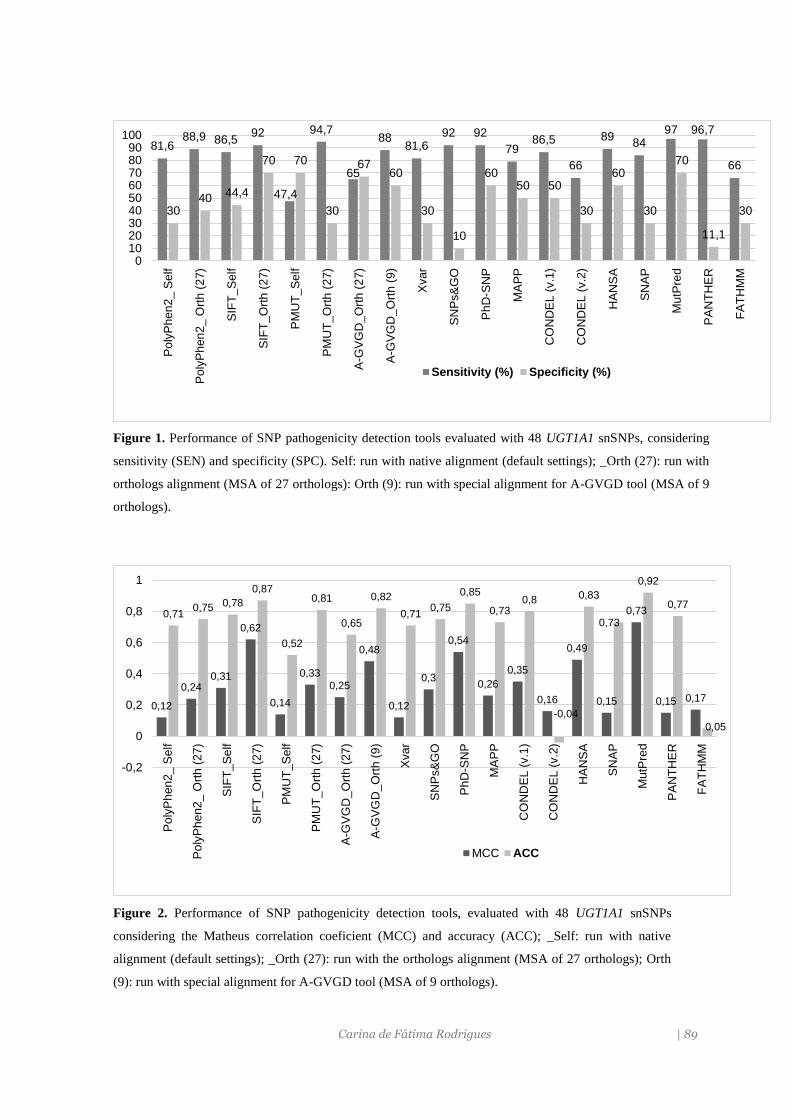
Carina de Fátima Rodrigues | 89
Figure 1. Performance of SNP pathogenicity detection tools evaluated with 48 UGT1A1 snSNPs, considering
sensitivity (SEN) and specificity (SPC). Self: run with native alignment (default settings); _Orth (27): run with
orthologs alignment (MSA of 27 orthologs): Orth (9): run with special alignment for A-GVGD tool (MSA of 9
orthologs).
Figure 2. Performance of SNP pathogenicity detection tools, evaluated with 48 UGT1A1 snSNPs
considering the Matheus correlation coeficient (MCC) and accuracy (ACC); _Self: run with native
alignment (default settings); _Orth (27): run with the orthologs alignment (MSA of 27 orthologs); Orth
(9): run with special alignment for A-GVGD tool (MSA of 9 orthologs).
81,688,9 86,5
92
47,4
94,7
65
8881,6
92 92
7986,5
66
8984
97 96,7
66
3040 44,4
70 70
30
6760
30
10
6050 50
30
60
30
70
11,1
30
0102030405060708090
100
Po
lyP
hen
2_
Se
lf
Po
lyP
hen
2_
Ort
h (
27)
SIF
T_S
elf
SIF
T_O
rth
(2
7)
PM
UT
_S
elf
PM
UT
_O
rth
(2
7)
A-G
VG
D_
Ort
h (
27
)
A-G
VG
D_
Ort
h (
9)
Xvar
SN
Ps&
GO
Ph
D-S
NP
MA
PP
CO
ND
EL
(v.1
)
CO
ND
EL
(v.2
)
HA
NS
A
SN
AP
Mu
tPre
d
PA
NT
HE
R
FA
TH
MM
Sensitivity (%) Specificity (%)
0,12
0,240,31
0,62
0,14
0,330,25
0,48
0,12
0,3
0,54
0,26
0,35
0,16
0,49
0,15
0,73
0,15 0,17
0,710,75 0,78
0,87
0,52
0,81
0,65
0,82
0,710,75
0,85
0,730,8
-0,04
0,83
0,73
0,92
0,77
0,05
-0,2
0
0,2
0,4
0,6
0,8
1
Po
lyP
hen
2_
Se
lf
Po
lyP
hen
2_
Ort
h (
27)
SIF
T_S
elf
SIF
T_O
rth
(2
7)
PM
UT
_S
elf
PM
UT
_O
rth
(2
7)
A-G
VG
D_O
rth (
27
)
A-G
VG
D_O
rth (
9)
Xvar
SN
Ps&
GO
Ph
D-S
NP
MA
PP
CO
ND
EL
(v.1
)
CO
ND
EL
(v.2
)
HA
NS
A
SN
AP
Mu
tPre
d
PA
NT
HE
R
FA
TH
MM
MCC ACC
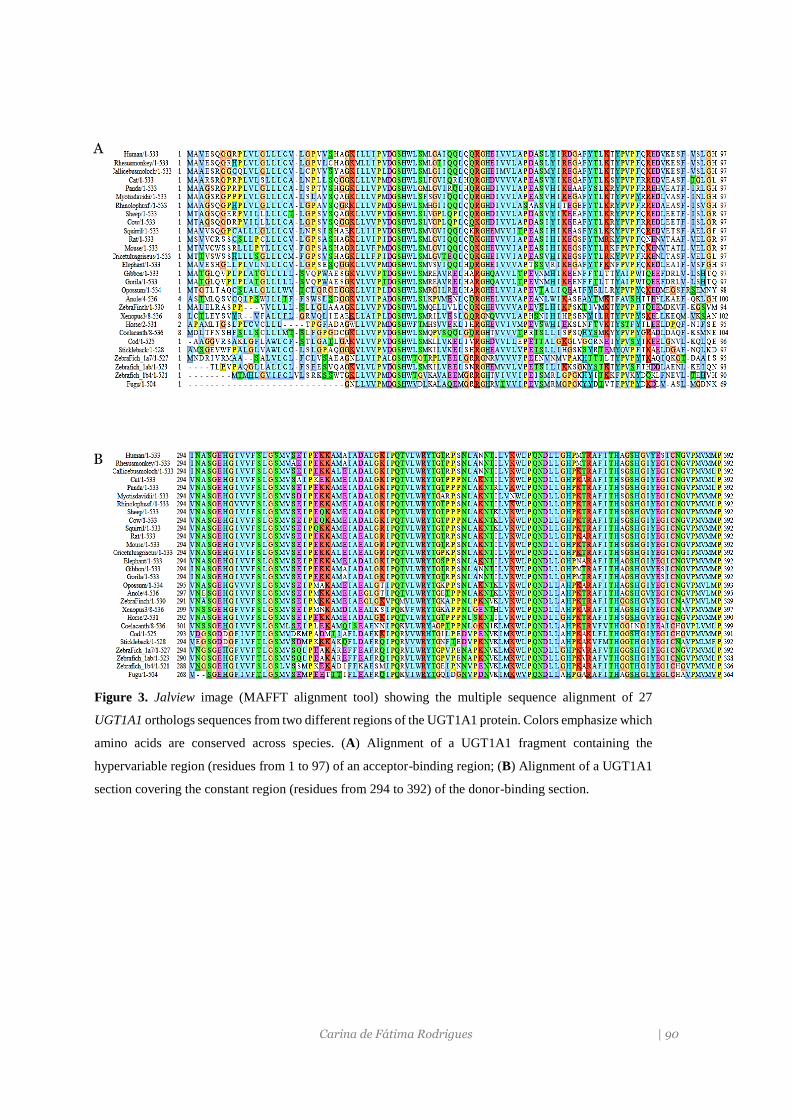
Carina de Fátima Rodrigues | 90
Figure 3. Jalview image (MAFFT alignment tool) showing the multiple sequence alignment of 27
UGT1A1 orthologs sequences from two different regions of the UGT1A1 protein. Colors emphasize which
amino acids are conserved across species. (A) Alignment of a UGT1A1 fragment containing the
hypervariable region (residues from 1 to 97) of an acceptor-binding region; (B) Alignment of a UGT1A1
section covering the constant region (residues from 294 to 392) of the donor-binding section.
A
B
Carina de Fátima Rodrigues | 91
References
Acharya V, Nagarajaram HÁ. 2012. Hansa: An automated method for discriminating disease and
neutral human nsSNPs. Hum Mutat 33:332-337.
Adzhubei IA, Schmidt S, Peshkin L, Ramensky VE, Gerasimova A, Bork P, Kondrashov AS,
Sunyaev SR. 2010. A method and server for predicting damaging missense mutations. Nat
Methods 7:248-249.
Aono S, Adachi Y, Uyama E, Yamada Y, Keino H, Nanno T, Koiwai O, Sato H. 1995. Analysis of
genes for bilirubin UDP-glucuronosyltransferase in Gilbert's syndrome. Lancet 345:958-
959.
Baldi P, Brunak S, Chauvin Y, Andersen CA, Nielsen H. 2000. Assessing the accuracy of prediction
algorithms for classification: an overview. Bioinformatics (Oxford, England) 16:412-424.
Bromberg Y, Rost B. 2007. SNAP: predict effect of non-synonymous polymorphisms on function.
Nucl Acid Res 35:3823-3835.
Calabrese R, Capriotti E, Fariselli P, Martelli PL, Casadio R. 2009. Functional annotations improve
the predictive score of human disease-related mutations in proteins. Hum Mutat 30:1237-
1244.
Capriotti E, Calabrese R, Casadio R. 2006. Predicting the insurgence of human genetic diseases
associated to single point protein mutations with support vector machines and evolutionary
information. Bioinformatics (Oxford, England) 22:2729-2734.
Ciotti M, Chen F, Rubaltelli FF, Owens IS. 1998. Coding defect and a TATA box mutation at the
bilirubin UDP-glucuronosyltransferase gene cause Crigler-Najjar type I disease. Biochim
Biophys Acta 1407:40-50.
Costa E. 2006. Hematologically important mutations: bilirubin UDP-glucuronosyltransferase gene
mutations in Gilbert and Crigler-Najjar syndromes. Blood Cells Mol Dis 36:77-80.
Costa E, Vieira E, Martins M, Saraiva J, Cancela E, Costa M, Bauerle R, Freitas T, Carvalho JR,
Santos-Silva A, Barbot J, Dos Santos R. 2006. Analysis of the UDP-glucuronosyltransferase
gene in Portuguese patients with a clinical diagnosis of Gilbert and Crigler-Najjar
syndromes. Blood Cells Mol Dis 36:91-97.
Di YM, Chan E, Wei MQ, Liu JP, Zhou SF. 2009. Prediction of deleterious non-synonymous single-
nucleotide polymorphisms of human uridine diphosphate glucuronosyltransferase genes.
AAPS J 11:469-80.
Ferrer-Costa C, Orozco M, de la Cruz X. 2004. Sequence-based prediction of pathological mutations.
Proteins 57:811-819.
Farheen S, Sengupta S, Santra A, Pal S, Dhali GK, Chakravorty M, Majumder PP, Chowdhury A.
2006. Gilbert's syndrome: High frequency of the (TA)7 TAA allele in India and its
Carina de Fátima Rodrigues | 92
interaction with a novel CAT insertion in promoter of the gene for bilirubin UDP-
glucuronosyltransferase 1 gene. World Jf Gastroenterol 12:2269-2275.
Ferrer-Costa C, Gelpi JL, Zamakola L, Parraga I, de la Cruz X, Orozco M. 2005. PMUT: a web-
based tool for the annotation of pathological mutations on proteins. Bioinformatics (Oxford,
England) 21:3176-3178.
Galehdari H, Saki N, Mohammadi-Asl J, Rahim F. 2013. Meta-analysis diagnostic accuracy of SNP-
based pathogenicity detection tools: a case of UTG1A1 gene mutations. Int J Mol Epidemiol
Genet 4:774-785.
Gonzalez-Perez A, Lopez-Bigas N. 2011. Improving the assessment of the outcome of
nonsynonymous SNVs with a consensus deleteriousness score, Condel. Am J Hum Genet
88:440-449.
Hicks S, Wheeler DA, Plon SE, Kimmel M. 2011a. Prediction of missense mutation functionality
depends on both the algorithm and sequence alignment employed. Hum Mutat 32:661-668.
Hicks S, Wheeler DA, Plon SE, Kimmel M.2011b. Prediction of missense mutation functionality
depends on both the algorithm and sequence alignment employed. Hum Mutat 32:661-668.
Huang CS, Luo GA, Huang ML, Yu SC, Yang SS. 2000. Variations of the bilirubin uridine-
diphosphoglucuronosyl transferase 1A1 gene in healthy Taiwanese. Pharmacogenetics
10:539-544.
Johnson MM, Houck J, Chen C. 2005. Screening for Deleterious Nonsynonymous Single-Nucleotide
Polymorphisms in Genes Involved in Steroid Hormone Metabolism and Response. Cancer
Epidemiol Biomarkers Prev 14:1326-1329.
Jordan DM, Ramensky VE, Sunyaev SR. 2010. Human allelic variation: perspective from protein
function, structure, and evolution. Curr Opin Struct Biol 20:342-350.
Kaniwa N, Kurose K, Jinno H, Tanaka-Kagawa T, Saito Y, Saeki M, Sawada J, Tohkin M, Hasegawa
R. 2005. Racial variability in haplotype frequencies of UGT1A1 and glucuronidation activity
of a novel single nucleotide polymorphism 686C> T (P229L) found in an African-American.
Drug Metab Dispos 33:458-465.
Karchin R, Diekhans M, Kelly L, Thomas DJ, Pieper U, Eswar N, Haussler D, Sali A. 2005. LS-
SNP: large-scale annotation of coding non-synonymous SNPs based on multiple information
sources. Bioinformatics (Oxford, England) 21:2814-2820.
Katoh K, Standley DM. 2013. MAFFT Multiple Sequence Alignment Software Version 7:
Improvements in Performance and Usability. Mol Biol Evol 30:772-780.
Kumar P, Henikoff S, Ng PC. 2009. Predicting the effects of coding non-synonymous variants on
protein function using the SIFT algorithm. Nat Protoc 4:1073-1081.
Carina de Fátima Rodrigues | 93
Labrune P, Myara A, Hadchouel M, Ronchi F, Bernard O, Trivin F, Chowdhury NR, Chowdhury
JR, Munnich A, Odievre M. 1994. Genetic heterogeneity of Crigler-Najjar syndrome type I:
a study of 14 cases. Hum Genet 94:693-697.
Labrune P, Myara A, Chalas J, Le Bihan B, Capel L, Francoual J. 2002. Association of a homozygous
(TA)8 promoter polymorphism and a N400D mutation of UGT1A1 in a child with Crigler-
Najjar type II syndrome. Hum Mutat 20:399-401.
Li B, Krishnan VG, Mort ME, Xin F, Kamati KK, Cooper DN, Mooney SD, Radivojac P. 2009.
Automated inference of molecular mechanisms of disease from amino acid substitutions.
Bioinformatics (Oxford, England) 25:2744-50.
Li C, Wu Q. 2007. Adaptive evolution of multiple-variable exons and structural diversity of drug-
metabolizing enzymes. BMC Evol Biol 7:69-88.
Lynch M, Katju V. 2004. The altered evolutionary trajectories of gene duplicates. Trends Genet
20:544-549.
Mackenzie PI. 1986. Rat liver UDP-glucuronosyltransferase. Sequence and expression of a cDNA
encoding a phenobarbital-inducible form. J Biol Chem 261:6119-6125.
Ng PC, Henikoff S. 2006. Predicting the effects of amino acid substitutions on protein function. Annu
Rev Genomics Hum Genet 7:61-80.
Reumers J, Maurer-Stroh S, Schymkowitz J, Rousseau F. 2006. SNPeffect v2.0: a new step in
investigating the molecular phenotypic effects of human non-synonymous SNPs.
Bioinformatics (Oxford, England) 22:2183-2185.
Reva B, Antipin Y, Sander C. 2011. Predicting the functional impact of protein mutations:
application to cancer genomics. Nucleic Acids Res 39:e118.
Sai K, Saeki M, Saito Y, Ozawa S, Katori N, Jinno H, Hasegawa R, Kaniwa N, Sawada J, Komamura
K, Ueno K, Kamakura S, Kitakaze M, Kitamura Y, Kamatani N, Minami H, Ohtsu A, Shirao
K, Yoshida T, Saijo N. 2004. UGT1A1 haplotypes associated with reduced glucuronidation
and increased serum bilirubin in irinotecan-administered Japanese patients with cancer. Clin
Pharmacol Ther 75:501-515.
Seppen J, Bosma PJ, Goldhoorn BG, Bakker CT, Chowdhury JR, Chowdhury NR, Jansen PL, Oude
Elferink RP. 1994. Discrimination between Crigler-Najjar type I and II by expression of
mutant bilirubin uridine diphosphate-glucuronosyltransferase. J Clin Invest 94:2385-2391.
Shihab HA, Gough J, Cooper DN, Stenson PD, Barker GL, Edwards KJ, Day IN, Gaunt TR. 2013.
Predicting the functional, molecular, and phenotypic consequences of amino acid
substitutions using hidden Markov models. Hum Mutat 34:57-65.
Shu Y, Leabman MK, Feng B, Mangravite LM, Huang CC, Stryke D, Kawamoto M, Johns SJ,
DeYoung J, Carlson E and others. 2003. Evolutionary conservation predicts function of
Carina de Fátima Rodrigues | 94
variants of the human organic cation transporter, OCT1. Proc Natl Acad Sci USA 100:5902-
5907.
Sneitz N, Bakker CT, de Knegt RJ, Halley DJ, Finel M, Bosma PJ. 2010. Crigler-Najjar syndrome
in The Netherlands: identification of four novel UGT1A1 alleles, genotype-phenotype
correlation, and functional analysis of 10 missense mutants. Hum Mutat 31:52-59.
Stone EA, Sidow A. 2005. Physicochemical constraint violation by missense substitutions mediates
impairment of protein function and disease severity. Genome Res 15:978-986.
Strassburg CP, Lankisch TO, Manns MP, Ehmer U. 2008. Family 1 uridine-5'-diphosphate
glucuronosyltransferases (UGT1A): from Gilbert's syndrome to genetic organization and
variability. Arch Toxicol 82:415-433.
Sutomo R, Laosombat V, Sadewa AH, Yokoyama N, Nakamura H, Matsuo M, Nishio H. 2002.
Novel missense mutation of the UGT1A1 gene in Thai siblings with Gilbert's syndrome.
Pediatr Int 44:427-432.
Tavtigian SV, Deffenbaugh AM, Yin L, Judkins T, Scholl T, Samollow PB, de Silva D, Zharkikh A,
Thomas A. 2006. Comprehensive statistical study of 452 BRCA1 missense substitutions
with classification of eight recurrent substitutions as neutral. J Med Genet 43:295-305.
Thomas PD, Kejariwal A, Campbell MJ, Mi H, Diemer K, Guo N, Ladunga I, Ulitsky-Lazareva B,
Muruganujan A, Rabkin S, Vandergriff JA, Doremieux O. 2003. PANTHER: a browsable
database of gene products organized by biological function, using curated protein family and
subfamily classification. Nucleic Acids Res. 31:334-341.
Thusberg J, Olatubosun A, Vihinen M. 2011. Performance of mutation pathogenicity prediction
methods on missense variants. Hum Mutat 32:358-368.
Wang Z, Moult J. 2001. SNPs, protein structure, and disease. Hum Muta 17:263-270.
Wong KC, Zhang Z. 2014. SNPdryad: predicting deleterious non-synonymous human SNPs using
only orthologous protein sequences. Bioinformatics (Oxford, England) [Epub ahead of print]
Yusoff S, Van Rostenberghe H, Yusoff NM, Talib NA, Ramli N, Ismail NZ, Ismail WP, Matsuo M,
Nishio H. 2006.Frequencies of A(TA)7TAA, G71R, and G493R mutations of the UGT1A1
gene in the Malaysian population. Biol Neonate 89:171-176.
CAPÍTULO IV – Discussão Geral e Conclusões

Discussão
Carina de Fátima Rodrigues | 96
Discussão
Carina de Fátima Rodrigues | 97
Na atualidade, a bilirrubina tem sido referida como “biomarcador” e “protetor” de
várias doenças crónicas, legitimando o interesse em determinar as condições que alteram
os seus níveis plasmáticos. Assim, neste estudo fez-se a avaliação de alguns fatores genéticos
e não genéticos que podem condicionar os níveis de BL e a interação dos diferentes
parâmetros analisados. Foram também avaliados métodos in silico para estudar o efeito
funcional de variantes pontuais identificadas neste estudo e de outras já descritas na
literatura.
O tempo de jejum noturno foi identificado como uma variável independente associada
à concentração de BL na amostra estudada. Os indivíduos com mais horas de jejum
apresentavam valores mais elevados de bilirrubina total, o que está de acordo com a menor
motilidade intestinal que o jejum provoca, que conduz à diminuição da excreção dos
pigmentos biliares e faz com que haja um refluxo da BL para o plasma (278). Em voluntários
saudáveis que tinham consistentemente concentrações elevadas de BL, foi demonstrado
que a ingestão controlada e regular de alimentos baixava os NPB (52). De facto, uma das
primeiras formas de diagnosticar a SG foi a aplicação de um teste, desenvolvido por
Augustine Gilbert, baseado em restrição calórica durante dois dias (279). No presente
estudo, observaram-se diferenças nos valores de bilirrubina, dentro do intervalo de jejum
noturno estimado para os participantes (7-13 horas). O efeito confundidor desta variável
deve ser considerado nos estudos que envolvem a determinação de BL, dado que em
indivíduos com capacidade de glucuronidação normal os valores de bilirrubina podem ser
superiores ao dos indivíduos que apresentam que apresentam deficiência enzimática, se
tiverem um maior tempo de jejum que aumentá a concentração do pigmento.
Na análise da variação dos NPB com os hábitos tabágicos não foi observada diferença
significativa entre fumadores e não fumadores. No entanto, alguns estudos demonstram
que a concentração de BL é inferior em indivíduos fumadores (58), o que tem sido explicado
pelo possível “consumo” excessivo de BL (na reação de oxidação) por espécies de radicais
livres existentes no tabaco. Foi também sugerido que possa haver indução da expressão do
gene UGT1A1, por substâncias do tabaco, determinando um incremento da taxa de
glucuronidação e um aumento da excreção de BL (58). Um outro estudo mostrou que a
associação entre o consumo de tabaco e a concentração de BL é menos pronunciada nas
mulheres do que nos homens e que o número de anos de exposição e de cigarros/dia eram
determinantes para a diminuição da concentração de BL (280). A ausência de associação
entre os hábitos tabágicos e a variação dos NPB observada, pode ser justificada pelo facto
da amostra estudada ser constituída por mulheres jovens, com períodos curtos de exposição
ao tabaco e em que 80% fumava menos de 10 cigarros por dia.
No que respeita ao consumo de álcool, não foi estabelecida qualquer associação entre
o seu consumo e os NPB, o que está de acordo com o descrito anteriormente (281), embora
Discussão
Carina de Fátima Rodrigues | 98
já tenha sido relatada uma associação positiva entre as duas variáveis (282). Apenas 6% dos
participantes deste estudo ultrapassaram o limite recomendado de ingestão de álcool
(15mg) e 26% não o consumiam.
Na análise da variação dos níveis de BL nas jovens sob terapia de anticoncetivos orais
não foram encontradas diferenças significativas entre os vários tercis. Está descrito que a
concentração de BL é inferior em mulheres sob terapêutica de estrogénios, o que parece
estar relacionado com a excreção aumentada de bilirrubina, por indução da expressão
hepática de UGT1A1, como foi observado em modelos animais (75). Quanto ao tempo de
terapia com contracetivos orais, tem sido referido uma redução da concentração BNC, numa
fase inicial, com posterior regressão para níveis normais a longo prazo (283). Com a mesma
abordagem, a nossa amostra foi dividida em três grupos: terapia de curta duração (1-6
meses), terapia de média duração (7 meses a 2 anos) e de longa duração (mais de 2 anos).
No entanto, a variação dos NPB entre estes três grupos também não evidenciou diferenças
estatisticamente significativas.
A análise de regressão multivariada indicou que o índice de massa corporal (IMC) era
uma variável independente associada a uma redução da concentração da BL na amostra
analisada. Também foi identificada uma correlação linear negativa entre a BT e o IMC e a
percentagem de gordura corporal (PGC). Estas variáveis parecem ter uma relação “estreita”,
apesar da variação inter-individual ser pequena, tanto para os níveis de BL como para o
IMC (apenas 4 jovens apresentavam IMC superior a 30). Estes resultados foram também
observados noutro estudo, onde por perda de 1% de peso corporal havia um incremento
linear na concentração de BL (66). O IMC e a PGC são considerados fatores de risco
positivamente associados a doenças cardiovasculares (284), diabetes (214), síndrome
metabólica (217) e apresentam-se negativamente correlacionados com a BL (203, 217, 218).
O mecanismo subjacente responsável pela associação negativa entre a concentração de BL
e o IMC, ainda não foi esclarecido. No entanto a obesidade tem sido associada a um processo
inflamatório e a stress oxidativo como já foi referido. Um IMC elevado é, em geral,
acompanhado de dislipidémia e de alterações a nível da síntese, catabolismo e anabolismo
das lipoproteínas, que pode ter como consequência a elevação dos níveis do colesterol total,
de LDL-C e dos triglicéridos, assim como um decréscimo nos níveis de HDL-C (285). Uma
vez que os NPB também variam de acordo com o perfil lipídico, aspeto que será abordado
posteriormente, esta associação poderá resultar dessas alterações lipídicas.
A análise de duas variáveis referentes ao estilo de vida, ingestão calórica e atividade
física, que são co-variáveis com a PGC e IMC, não mostrou qualquer associação com os
níveis de BL. Dado que o exercício tem efeitos benéficos na redução da gordura corporal e
do peso (66), é plausível que o exercício físico aumenta os níveis de BL. Um estudo que
procurou determinar, em homens e mulheres, o impacto do exercício físico na função
Discussão
Carina de Fátima Rodrigues | 99
hepática, perfil lipídico e adiposidade também não encontram qualquer associação com a
concentração de BL, observou-se, no entanto, uma associação negativa entre a BL e o IMC,
antes e depois de treino físico (64). Como demonstrado num estudo em mulheres no
período pós-menopausa, a intensidade do exercício afeta os níveis de BL em que a
concentração de BL aumentava face a um aumento de 150% da intensidade do treino (65).
O desenvolvimento do stress oxidativo está associado a dietas ricas em gordura, a
elevada ingestão calórica e a obesidade, surgindo mesmo antes do desenvolvimento da
resistência à insulina (286). Considerando a função antioxidante da BL, fez-se a avaliação
da ingestão calórica, aplicando um questionário de frequência alimentar validado para a
população portuguesa (287) em que o consumo de nutrientes representa uma estimativa
aproximada da ingestão diária. Os resultados não evidenciaram diferenças significativas
entre os tercis de BT. No entanto, as características dietéticas dos estudantes avaliados
foram semelhantes às encontradas noutros estudos realizados na população portuguesa,
utilizando diferentes metodologias de avaliação (288).
A análise dos parâmetros hematológicos evidenciou que os indivíduos dos tercis T2 e
T3 apresentavam valores mais elevados de concentração de Hb, hematócrito e dos índices
hematimétricos, hemoglobina globular média (HGM) e concentração de hemoglobina
glóbular média (CHGM). É importante salientar nestes resultados, como para outros
parâmetros analisados nesta amostra, que a variação foi muito pequena devido à amostra
ser bastante homogénea. Os parâmetros hematológicos, tal como a concentração de BL,
encontravam-se dentro dos valores de referência para a maioria dos indivíduos, mesmo sem
considerar as diferenças genéticas. Por regressão linear, verificou-se que a Hb explicava
grande parte da variação inter-individual dos NPB (=0.292; p<0.0001). As diferenças na
variação da concentração de bilirrubina plasmática entre homens e mulheres têm sido
atribuídas ao diferente turnover das hemeproteínas e pela maior massa eritrocitária
observada nos homens (52). Na população africana, os níveis mais baixos de BL em relação
aos caucasianos, foram atribuídos às diferenças nos níveis de Hb (289). Além disso as
modificações na concentração de BL associadas à idade também se devem às diferenças na
concentração da hemoglobina com a idade (52). Assim os valores de BL podem ser
condicionados pela produção de células sanguíneas e pelo metabolismo da hemoglobina
(52). Os resultados deste estudo corroboram esta estreita relação, uma vez que a Hb foi o
fator mais significativamente associado à variação de NPB depois do polimorfismo do
promotors.
A BL parece ter um papel benéfico na prevenção de alterações oxidativas em várias
patologias como as doenças cardiovasculares (DCV) e comorbidades relacionadas (diabetes
mellitus, síndrome metabólica e doença renal crónica), cancro, doenças auto-imunes e
inflamatórias (228, 290, 291). Da mesma forma, os níveis baixos de Hb ou a presença de
Discussão
Carina de Fátima Rodrigues | 100
anemia têm sido associados a um impacto negativo na maioria destas mesmas doenças. Em
diferentes populações, a anemia foi considerada como um fator de risco em doentes com
DCV (292, 293), insuficiência renal (294), diabetes melittus (295) e cancro (296)
aumentando a mortalidade nos doentes com anemia (297). Dado que a bilirrubina
circulante resulta do catabolismo da hemoglobina, níveis baixos de Hb terão como
consequência uma menor produção de BL e menor concentração no plasma, exceto se
houver um mecanismo hemolítico subjacente a anemia. Porém, em muitos estudos
epidemiológicos sobre a associação da concentração de BL e o risco para doenças
cardiovasculares, foi considerado um amplo espectro de fatores de risco, mas a
concentração de hemoglobina não foi considerada como variável confundidora. Nos últimos
vinte anos, as baixas concentrações de Hb e de BL emergiram como fatores de risco, em
estudos epidemiológicos independentes, para o mesmo grupo de doenças.
Relativamente ao valor das plaquetas, verificou-se uma diminuição significativa da
BL nos valores mais elevados de plaquetas. Foi já demonstrado uma associação negativa
entre a concentração de plaquetas e a presença de SG (51) e mais recentemente verificou-
que as concentrações de BNC, semelhantes às observadas em indivíduos com SG,
promoviam a inibição da atividade de plaquetas através de um mecanismo específico de
ativação de plaquetas (298). A redução da formação de trombos contribuirá para o menor
risco de doenças cardiovasculares nos indivíduos que apresentam níveis moderadamente
elevados de BL (299).
No presente estudo não foi detetada qualquer associação dos níveis de glicose com as
diferentes frações de BL. Como já foi referido, NPB baixos têm sido associadas a patologia
com alterações do metabolismo da glicose, (300-302), e que a hiperglicemia favorece o
desenvolvimento de stress oxidativo (303). Num estudo em ratos diabéticos verificou-se
que o aumento da expressão de HO-1 conduzia a maior produção de BL, diminuía a
resistência à insulina e restabelecia os valores de glicémia normal (304). Além disso, foi
proposto que as propriedades antioxidantes da BL podem reverter os danos oxidativos
associados a um estado hiperglicémico (299).
A associação do perfil lipídico com os níveis de BL foi avaliada tendo em conta o
genótipo dos indivíduos UGT1A1*28 (artigo 3; tabela 1). O estudo do perfil lipídico inclui a
determinação de CT, TG, LDL-C e HDL-C. Na análise multivariada, tendo em conta o
genótipo dos indivíduos, não foi identificada qualquer associação com os parâmetros do
perfil lipídico.
Há estudos que mostram que NPB mais elevados podem ter um efeito modulador no
perfil lipídico nomeadamente, no valor de LDL-C (211)(219) CT e de TG (208). A associação
da BL com os fatores de risco para diversas doenças crónicas tem tido abordagens
diferentes: alguns trabalhos analisam o perfil lipídico em indivíduos com a SG ou em
Discussão
Carina de Fátima Rodrigues | 101
indivíduos portadores do polimorfismo TA (212) e outros são apenas estudos clínicos que
examinam a relação do perfil lipídico com o valor de BL (218). A dúvida que persiste é se a
associação entre a concentração de BL e o perfil lipídico é devida a uma qualquer relação
indireta, dado que ambos dependem do metabolismo hepático, ou a BL tem efetivamente,
um papel modulador na síntese e/ou catabolismo lipídico ou, se há “consumo” da BL, como
antioxidante, para reduzir o stress oxidativo associado a situações de dislipidémia. Estudos
anteriores, realizados na década de 70 e 80, sobre o metabolismo hepático lipídico,
demonstraram que concentração de BL se correlacionava positivamente com a
concentração de ácidos gordos livres (305). Efetivamente, durante o jejum, os triglicéridos
são hidrolisados para produzir ácidos gordos e glicerol, diminuindo a sua concentração
(305), enquanto as concentrações de BL aumentam com o jejum, explicando a associação
negativa entre BL e TG. Outra possibilidade é que baixas concentrações de BL diminuem a
solubilização do colesterol, e reduzem a sua excreção biliar, aumentando a concentração no
plasma (306), (307).
A avaliação do perfil lipídico de acordo com os genótipos para o polimorfismo
A[TA]nTAA não evidenciou qualquer associação. Com a mesma abordagem, foi feito um
estudo para avaliar a associação entre os níveis BL e fatores de risco para doenças
cardiovasculares e arteriosclerose subclínica, que também não encontrou qualquer
associação entre o genótipo e o perfil lipídico (212). Há outros trabalhos onde também não
foi observado o fator protetor do genótipo [TA]7/[TA]7 para as DCV (308, 309), isto é, os
indivíduos portadores do polimorfismo tinham o mesmo risco para essas doenças do que os
indivíduos com o alelo normal.
O presente estudo mostrou que os indivíduos com elevada concentração de BL
também têm maior concentração de Alb. A BL é um ligando endógeno de alta afinidade para
a albumina plasmática, o que faz com que, em condições normais, apenas 0.01% da
bilirrubina total circule no plasma na forma não ligada. Foi descrito que as baixas
concentrações de Alb estavam associadas a um risco mais elevado para o enfarte do
miocárdio (200) e que a albumina pode atuar como um antioxidante indireto inibindo a
formação de radicais livres (310). Como transportador da BL e pelo facto de parte da ação
da Alb como antioxidante derivar desta ligação, é importante esclarecer se existe sinergia
entre as duas moléculas. Como a toxicidade da BL depende da relação entre a concentração
das duas moléculas no plasma, a questão que se coloca é se essa razão também influencia a
sua capacidade protetora e, para isso, serão necessários estudos experimentais que avaliem
quais são as outras frações de BL, inclusivamente a fração livre e a fração covalente ligada à
Alb (-bilirrubina).
O eritrócito tem sido usado como modelo para estudar o mecanismo de toxicidade da
BL. Esta, em elevadas concentrações pode induzir alterações morfológicas nos eritrócitos
Discussão
Carina de Fátima Rodrigues | 102
humanos, alterando a estrutura da membrana e a assimetria dos fosfolípidos (237, 311). O
eritrócito maduro é anucleado, tem uma capacidade biossintética reduzida, que se traduz
na incapacidade para reparar lesões resultantes do envelhecimento normal ou de situações
de stress, que podem levar à senescência acelerada da célula (243). Verificou-se que em
eritrócitos mais velhos e/ou danificados, a hemoglobina é oxidada e liga-se ao pólo
citoplasmático da proteína banda 3 promovendo a sua agregação (312). A importância do
estudo da banda 3 deve-se ao facto de as alterações na sua conformação constituírem uma
prova de modificações intracelulares ou membranares, de natureza senescente, ou como
resultado de stress oxidativo. Um perfil de banda 3 compatível com lesão oxidativa é
caracterizado por um aumento em agregados de alto peso molecular e por uma diminuição
da forma monoméricas e dos fragmentos proteolíticas (245). Este perfil foi observado em
vários estados patológicos, tais como, doenças cardiovasculares, esferocitose hereditária
(313), doença crónica renal, psoríase (314), pré-eclampsia (315) e ao estado fisiológico, com
exercício físico intenso (316).
Tendo em conta estes conhecimentos e o acumular de evidências sobre a função
protetora da BL, considerou-se pertinente avaliar o efeito in vivo de concentrações
moderadas de BL na proteína banda 3, tendo em conta o genótipo dos indivíduos (artigo 3).
Os indivíduos homozigóticos e heterozigóticos para o alelo [TA]7 apresentaram uma
redução significativa na lesão oxidativa do eritrócito, com valores mais baixos de agregados
e mais elevados de monómeros, quando comparados com os indivíduos [TA]6/[TA]6. Este
perfil de banda 3 pode dever-se à existência de um microambiente favorável, criado por
concentrações moderadamente elevadas de BL, como acontece nos indivíduos portadores
do alelo [TA]7. Está descrito que a BL em concentrações plasmáticas inferiores a 100
µmol/L, atua como antioxidante, mas para valores de 200 µmol/L é fortemente pró-
oxidante (317). No presente estudo, as concentrações médias de bilirrubina nos indivíduos
[TA]7/[TA]7 foram de 16,8±6.2 µmol/L e, portanto, insuficientes para induzirem toxicidade
nos eritrócitos, apesar dos valores de BL nos indivíduos homozigóticos para este
polimorfismo poderem oscilar entre 17,1 e 85,3 µmol/L.
Sedlak e colaboradores (318) demostraram que a glutationa e a BL protegem,
respectivamente, os compartimentos celulares proteicos e lipídicos do stress oxidativo, mas
sugerem igualmente que a BL pode contribuir para manter a estabilidade das proteínas de
membrana, uma vez que estas se encontram rodeadas por um meio hidrofóbico.
Paralelamente ao estudo da banda 3 foram analisados outros marcadores de stress
oxidativo, nomeadamente, as substâncias reativas ao ácido tiobarbitúrico (TBA), usadas
como indicadores de peroxidação lipídica, e o estado total de antioxidantes (TAS). Os
indivíduos [TA]6/[TA]6 apresentavam uma tendência para valores mais elevados de TBA e
da razão TBA/TAS, quando comparados com os indivíduos [TA]6/[TA]7, e ainda mais
Discussão
Carina de Fátima Rodrigues | 103
exacerbados naqueles com o genótipo [TA]7/[TA]7. Não foram encontradas diferenças
significativas para os valores de TAS entre os 3 genótipos, mas verificou-se uma correlação
positiva entre a concentração de BT e o TAS (r=264; p=0.021). Estes resultados estão em
concordância com o que foi observado para a banda 3.
Para determinar o efeito da presença de outras mutações no gene UGT1A1 na
modulação dos níveis de BL, realizou-se a genotipagem das duas regiões mais importantes
no promotor deste gene, contendo os polimorfismos A[TA]nTAA e c.-3279T>G, e a
sequenciação das 5 regiões exónicas, nos controlos e nos doentes com diagnóstico clínico de
SG (artigo2). Existem outros polimorfismos no gene UGT1A1 associados com a
concentração de BL, como é o caso da variante c.211C>A (p.G71A), que tem uma elevada
incidência na hiperbilirrubinémia neonatal na população Leste Asiática (145). Mais
recentemente, o polimorfismo c.-3279T>G surgiu como fator adicional para a
hiperbilirrubinémia (319).
Verificou-se que a distribuição genotípica para os dois polimorfismos no grupo
controlo e nos doentes SG era significativamente diferente (tabela 2; artigo 2). Para o
polimorfismo c.-41_40dupTA, no grupo dos doentes SG, 82.2% eram homozigóticos para o
alelo [TA]7 e 17.8% heterozigotos. No grupo controlo, a frequência para o alelo
c.−41_−40dupTA foi de 9.9% nos homozigóticos e de 43.3% para os nos heterozigotos, e
46.6% apresentavam o alelo A[TA]6TAA. Assim, foi estimada uma frequência para o alelo
[TA]6 de 0.32, o que está em concordância com outros trabalhos publicados para a
população portuguesa (110) (213). Este valor é ligeiramente inferior ao reportado noutras
populações caucasianas, estando descritas frequências de 0.34 em Espanha (142), 0.35 na
Alemanha (143), 0.40 na Holanda (79) e 0.387 Estados Unidos (80).
O rastreio da região do elemento de resposta ao fenobarbital (c.-3279T>G), na
amostra controlo, permitiu verificar que a frequência de homozigóticos para o alelo mutado
(GG) era de 33.5%, para alelo normal (TT), de 44.1% para os heterozigóticos (TG) e de 22.4%
para os homozigóticos com o alelo mutado. Nos doentes clinicamente diagnosticados com
SG, 86.7% eram homozigóticos para o alelo GG e 13.3% heterozigotos, exibindo este
polimorfismo uma maior frequência genética relativamente ao polimorfismo A[TA]nAA. No
grupo controlo, os dois polimorfismos encontravam-se em equilíbrio de Hardy-Weinberg e
em desequilíbrio de ligação (valor de Lewontin, D=1.0; r2=0.57). Este valores são
semelhantes aos encontrados noutros estudos (140, 307, 320), em que o desequilíbrio
também não é total.
A pesquisa da associação da presença dos polimorfismos com os níveis de BL foi
efetuada, numa primeira fase, separadamente para cada polimorfismo, avaliando-se depois
o impacto dos diferentes haplótipos (tabela 3; artigo2). A diferença entre os NPB eram mais
Discussão
Carina de Fátima Rodrigues | 104
significativas entre os genótipos do polimorfismo TA relativamente aos genótipos do
polimorfismo c.-3279T>G. Dos nove diplótipos (c.−41_−40dupTA/c.−3279T>G) possíveis
(tabela 3, artigo 2) foram identificados apenas sete, provavelmente devido ao número muito
reduzido de indivíduos e ao facto dos dois polimorfismos estarem em desequilíbrio de
ligação, o que dificultou a análise da sua influência nos níveis de BL. A distribuição dos
indivíduos pelos diplótipos foi significativamente diferente entre a amostra controlo e os
doentes com SG. Apenas o duplo homozigótico para os dois alelos mutados, [TA]7/[TA]7–
GG, apresentou diferenças estatisticamente significativas com os restantes diplótipos e
estava associado a valores de BL mais elevados, o que está de acordo com resultados
anteriormente descritos (321). Em crianças com hiperbilirrubinémia, foi evidenciado que o
teste combinado, incluindo os dois polimorfismos, era a metodologia que melhor predizia a
presença de SG (322).
Estudos populacionais mostraram que os níveis plasmáticos de BL na população
africana eram cerca de 15-20% inferiores aos da população caucasiana (323) e de indivíduos
asiáticos (143, 323) Contudo, o alelo [TA]7 era mais frequente na população africana do que
na caucasiana e menos frequente na asiática (80). Na população africana são frequentes os
alelos de [TA]5 e [TA]8 (80). A expressão in vitro da enzima UGT1A1 diminui gradualmente
a capacidade de glucorunidação do alelo [TA]5 para o alelo [TA]8 (80). No entanto, na
população africana e asiática este aumento de repetições nem sempre está associado a
hiperbilirrubinémia. Estas observações sugerem que este polimorfismo influencia, com
maior gravidade, os níveis de BL na população caucasiana do que nas outras populações
(80). Adicionalmente, o polimorfismo c.-3279T>G não parece estar associado a
hiperbilirrubinémia (140) na população africana. Para além destes polimorfismos, existem
fatores epigénicos que podem interferir nos NPB. Verificou-se que a região promotora das
células renais humanas HK-2 estava completamente metilada e que em células hepáticas
HuH-7 se encontrava parcialmente metilada, o que induzia a expressão de mRNA UGT1A1.
Para além do estado de metilação, a hiperacetilação da histona H3 em células hepáticas e a
hipometilação das células renais, indicou que a regulação epigenética condiciona a
expressão de UGT1A1 de uma forma específica nos diferentes tecidos (324).
Na prática clínica, quando um doente é referenciado para se realizar a análise genética
para o diagnóstico SG, normalmente, só é rastreado o polimorfismo do promotor, o
UGT1A1*28, e não as outras regiões génicas não são analisadas. Contudo, tem-se verificado
que este polimorfismo nem sempre é suficiente para explicar a presença de
hiperbilirrubinémia (39). Mutações na região codificante do gene UGT1A1 podem causar as
síndromes de SCN-I e SCN-II (77), e verificando-se que indivíduos heterozigotos para essas
mutações podem manifestar, de forma autossómica dominante, a SG (80).
Discussão
Carina de Fátima Rodrigues | 105
A sequenciação das 5 regiões exónicas, nas duas amostras deste estudo, permitiu a
identificação de 9 variantes pontuais não sinonímias (nsSNP) (tabela 4, artigo 2), duas
mutações já descritas na literatura (c.674T>G, p.V225G; c.923G>A; p.G308E) (325) e sete
mutações novas (c.538G>C, p.E180Q; c.643A>G, p.I215V; c.814A>G, p.M272V; c.1156G>A,
p.V386I; c.1211T>C, p.M404T; c.1423C>T, p.R475C; c.1475T>C, p.I492T). Nas novas
mutações, três foram identificadas em doentes com SG (c.538G>C; c.1211T>C; c.1423C>T,)
e quatro nos controlos (c.643A>G; c.814A>G; c.1156G>A; c.1475T>C). O impacto das
variantes nos níveis de BL revelou que a presença de mutação na região codificante se
associava a valores associada a valores mais elevados de BL nos doentes com SG (tabela 4,
artigo 2).
Atualmente, estão disponíveis online vários métodos computacionais para a análise
de SNPs, que permitem separar as variantes com possível efeito deletério na proteína
daquelas que são neutras. A determinação da patogenicidade de variantes que encontramos
já descritas na literatura como associadas ou não a hiperbilirrubinémia, assim como das
variantes novas, identificadas neste estudo, utilizando ferramentas de bioinformática. A
análise in silico teve nos últimos anos um progresso notável, mas pode ser condicionada
pela informação disponível para determinado gene ou proteína (266). Os estudos de
expressão e os estudos enzimáticos, utilizados para definir o efeito das variantes na função
da proteína, implicam dispêndio de tempo e de recursos, que nem sempre estão ao alcance
de todos os laboratórios. Alguns programas classificam as variantes de acordo com
homologia de sequências e encontram-se também disponíveis online. Outros baseiam a
classificação das variantes na análise filogenética e na homologia de sequências, como o
Polymorphism Phenotyping (Polyphem, versão 1) (153) ou Sorting Intolerant from
Tolerant (SIFT) (152). Há ainda os que utilizam as características bioquímicas dos
aminoácidos, como o Align Grantham Variance/Grantham Difference (A-GVGD)(253) e o
Blocks Substitution Matrix (BLOSUM62).
A avaliação da patogenicidade das 7 novas mutações, identificadas em doentes com
SG e na amostra controlo, foi feita com 4 ferramentas de bioinformática (tabela 5, artigo 2)
integradas num mesmo software (Alamut software v.1.5, Interactive Biosoftware, Rouen,
France) disponível online. Os resultados desta análise para as novas variantes mostraram
pouca concordância entre os vários preditores; realizou-se de seguida uma nova pesquisa,
com mais 13 algorítmos diferentes. Uns baseados na análise filogenética, que incluíram o
SIFT (executado com outras opções), Multivariate Analysis of Protein Polymorphism
(MAPP) (252), Protein Analysis Through Evolutionary Relationships (PANTHER) (264),
Predictor of human Deleterious SNPs (PhD-SNP) (273), Gene Ontology (GO) database in
the form of a GO-based score (SNPs&GO) (272), Mutation Assessor Xvar (274) e Align
Grantham Variance/Grantham Difference (Align-GVGD) (executado com diferentes
Discussão
Carina de Fátima Rodrigues | 106
MSAs) e outros baseados na análise da sequência e das alterações das caraterísticas
estruturais da proteína, tais como o Polyphen2 (versão atual), Pathogenic Mutation
prediction (PMUT) (251), Screening for Nonaceptable Polymorphisms (SNAP) (275),
Hansa (método baseado em máquina de vetores de suporte) (276), Variant Effect Predictor
(SNPeffect) (154), Mutation Prediction (MutPred) (265), Functional Analysis through
Hidden Markov models (FATHMM) (277). Foi ainda usada uma ferramenta em que o
resultado depende da integração normalizada de valores de outros algoritmos, o CONDEL,
em duas versões diferentes (256) (artigos 2 e 4). Pretendeu-se com esta análise verificar o
desempenho destes métodos, com o objetivo de selecionar o mais adequado para
determinar a patogenicidade dos SNPs do UGT1A1, que foi condicionada pela ausência da
estrutura 3D e pela organização genómica particular do complexo UGT (138) que possui
várias isoformas com regiões constantes e regiões hipervariáveis (150).
O alinhamento de sequências de DNA ou proteína permite verificar a homologia entre
sequências, construir árvores filogenéticas, identificar sequências motivo e prever
estruturas secundárias e terciárias e função de proteínas (262). Alguns algoritmos são
baseados na utilização de alinhamentos múltiplos de sequências MSA (Multiple Sequence
Alignmente) homólogas, e podem apresentar duas formas de submeter os dados. Uma
automática, que requer a variante e a sequência ID, da proteína e o algoritmo constrói o
próprio MSA (ex. PANTHER, PhD-SNP, SNPs&GO) e outra em que após obtenção de um
alinhamento inicial, este é submetido com as variantes a analisar (ex. MAPP, A-GVGD).
Alguns métodos permitem as duas opções (SIFT, Polyphen2 e Pmut). Tanto o número como
o tipo de sequências homólogas podem condicionar a capacidade preditiva (260) (253). Em
média, a identidade de sequência de aminoácidos entre dois parálogos é apenas de 30%
(259). Idealmente, o MSA só deveria incluir ortólogos, dado que parecem conduzir a uma
análise evolutiva mais fiável (260) mas têm sido amplamente utilizados os parálogos,
provavelmente, devido ao número de insuficiência de sequências de ortólogos (259).
A capacidade preditiva destes métodos foi determinada em 48 variantes, já
caracterizadas em termos de função e que funcionaram como padrão, uma vez o estudo
funcional proteína, e em 39 variantes associadas a hiperbilirrubinémia, por estudos
genéticos, mas ainda não caracterizadas a nível funcional. Fez-se a comparação dos
resultados obtidos pelos métodos SIFT, Polyphen2 e Pmut quando executados na opção
automática e quando submetido um MSA construído unicamente com sequências de
ortólogos (suplementos S2 e S4, artigo 4).
Verificou-se que os métodos SIFT (executado com o MSA de 27 ortólogos) e MutPred,
apresentavam os valores mais elevados para todas as medidas estatísticas utilizadas, que
incluíram a sensibilidade (SEN), especificidade (SPC), o coeficiente de correlação de
Discussão
Carina de Fátima Rodrigues | 107
Matthew (MCC) e a precisão (ACC), o que está de acordo com outros estudos recentes (258).
Para além destes, os métodos PhD-SNP e o A-GVGD também obtiveram valores elevados
para coeficiente de correlação de Matthew quando comparado com os restantes. O método
SNPeffect foi o que obteve pior desempenho na análise das variantes, seguido do FATHMM
e CONDEL. O resultado do SNPeffect, que avalia características estruturais muito
específicas, pode estar associado á inexistência da estrutura 3D da proteína. Foi obtida uma
boa performance com o MutPred, que avalia o efeito da variante na estabilidade da proteína.
Verificou-se que o Pmut apresentava uma diferença considerável na capacidade preditora
que era dependente do MSA usado.
A análise dos algoritmos que permitiram a utilização de um alinhamento construído
pelo utilizador evidenciou que a capacidade preditiva aumentava com a utilização de MSA
obtidos a partir de sequências de ortólogos. Na análise das 48 variantes verificou-se que
algumas, validadas como patogénicas em diversos estudos funcionais da proteína,
apresentavam-se recorrentemente classificadas por vários algoritmos como neutras. Estas
variantes, p.G71R (268), p.F83L (269) e p.V225G (270), estão localizadas na região
considerada hipervariável das sequências de homólogos de vertebrados da UGT1A1 (150).
Contribuíram para este resultado o facto de, numa análise filogenética, as regiões mais
conservadas terem maior probabilidade de uma substituição resultar em mutação, e de nas
regiões variáveis, que se alteram ao longo da evolução, essas substituições serem
potencialmente neutras. A possibilidade de usar ferramentas com outra abordagem que não
a análise filogenética, é conveniente para variantes localizadas nestas regiões. Porém, a
utilização de algumas destas metodologias pelos clínicos e investigadores para uma
primeira classificação das variantes é, muitas vezes dificultada quer pela disponibilidade de
software menos comum, exigida por algumas metodologias, quer pelos conhecimentos de
informática.
Em conclusão, estes resultados permitiram confirmar o papel antioxidante da
bilirrubina na amostra de indivíduos saudáveis. De facto, a função da bilirrubina enquanto
antioxidante natural tem vindo a ser largamente estudado e os resultados têm comprovado
a sua ação na prevenção de doenças associadas com aumento de stress oxidativo,
nomeadamente doenças cardiovasculares. Esta constatação enfatiza a importância de
avaliar fatores, genéticos ou não, que possam modular os níveis de bilirrubina, tanto na
população em geral como em indivíduos com SG.
Os resultados demostraram que a presença da duplicação TA, a concentração de
hemoglobina, o índice de massa corporal e o tempo de jejum noturno são fatores relevantes
associados com variações nos níveis de BL total na população geral. Nos indivíduos com SG,
os níveis de bilirrubina são maioritariamente condicionados pela presença de homozigotia
para a variante c.-41_-40dupTA, e a presença concomitante da variante c.-3279T>G na
Discussão
Carina de Fátima Rodrigues | 108
região promotora do gene e/ou a presença de mutações na região codificante do gene se
associam a níveis de bilirrubina mais elevados nestes doentes. A identificação de sete novas
mutações pontuais no gene UGT1A1 permitiu aumentar o conhecimento do espectro
mutacional do UGT1A1 e o seu contributo para a variação dos níveis de bilirrubina nos
doentes com SG. Da análise in silico, verificou-se que o método com melhor desempenho
para avaliar a patogenicidade das variantes do gene UGT1A1 foi o MutPred, seguido do
SIFT, executado com um alinhamento múltiplo de sequências (MSA) de ortólogos.

REFERÊNCIA BIBLIOGRÁFICAS

Referências
Carina de Fátima Rodrigues | 110
Referências
Carina de Fátima Rodrigues | 111
1. Fevery J, Muraca M, Mesa V, Van Steenbergen W, Blanckaert N. Plasma bilirubin
pigments in health and disease. Mol Aspects Med. 1987;9(5):391-404.
2. Fevery J. Bilirubin in clinical practice: a review. Liver Int. 2008;28(5):592-605.
3. Sticova E, Jirsa M. New insights in bilirubin metabolism and their clinical
implications. World J Gastroenterol. 2013;19(38):6398-407.
4. Erlinger S, Arias IM, Dhumeaux D. Inherited disorders of bilirubin transport and
conjugation: new insights into molecular mechanisms and consequences. Gastroenterology.
2014;146(7):1625-38.
5. Bonnett R, Davies JE, Hursthouse MB. Structure of bilirubin. Nature.
1976;262(5566):327-8.
6. Nogales D, Lightner DA. On the structure of bilirubin in solution. 13C[1H]
heteronuclear Overhauser effect NMR analyses in aqueous buffer and organic solvents. J
Biol Chem. 1995;270(1):73-7.
7. Chowdhury RJ WA, Chowdhury RN, Arias IM. Hereditary jaundice and disorders of
bilirubin metabolism. The metabolic and molecular bases of inherited disease. 8 ed. New
York: McGraw-Hill; 2001. p. 3063–101.
8. Myara A, Sender A, Valette V, Rostoker C, Paumier D, Capoulade C, et al. Early
changes in cutaneous bilirubin and serum bilirubin isomers during intensive phototherapy
of jaundiced neonates with blue and green light. Biol Neonate. 1997;71(2):75-82.
9. McDonagh AF. Tin-protoporphyrin in the management of children with Crigler-
Najjar disease. Pediatrics. 1990;86(1):151-2.
10. Costarino AT, Ennever JF, Baumgart S, Speck WT, Paul M, Polin RA. Bilirubin
photoisomerization in premature neonates under low- and high-dose phototherapy.
Pediatrics. 1985;75(3):519-22.
11. Condezo-Hoyos L, Abderrahim F, Conde MV, Susin C, Diaz-Gil JJ, Gonzalez MC, et
al. Antioxidant activity of liver growth factor, a bilirubin covalently bound to albumin. Free
Radic Biol Med. 2009;46(5):656-62.
Referências
Carina de Fátima Rodrigues | 112
12. Hutchinson DW, Johnson B, Knell AJ. The reaction between bilirubin and aromatic
diazo compounds. Biochem J. 1972;127(5):907-8.
13. Heirwegh KP, Fevery J, Blanckaert N. Chromatographic analysis and structure
determination of biliverdins and bilirubins. J Chromatogr. 1989;496(1):1-26.
14. Odell GB, Mogilevsky WS, Gourley GR. High-performance liquid chromatographic
analysis of bile pigments as their native tetrapyrroles and as their dipyrrolic azosulfanilate
derivatives. J Chromatogr. 1990;529(2):287-98.
15. Blanckaert N, Heirwegh KP, Compernolle F. Synthesis and separation by thin-layer
chromatography of bilirubin-IX isomers. Their identification as tetrapyrroles and dipyrrolic
ethyl anthranilate azo derivatives. Biochem J. 1976;155(2):405-17.
16. Kraemer D, Scheurlen M. [Gilbert disease and type I and II Crigler-Najjar syndrome
due to mutations in the same UGT1A1 gene locus]. Med Klin (Munich). 2002;97(9):528-32.
17. Brodersen R. Binding of bilirubin to albumin. CRC Crit Rev Clin Lab Sci.
1980;11(4):305-99.
18. Jacobsen J, Wennberg RP. Determination of unbound bilirubin in the serum of
newborns. Clin Chem. 1974;20(7):783.
19. Roca L, Calligaris S, Wennberg RP, Ahlfors CE, Malik SG, Ostrow JD, et al. Factors
affecting the binding of bilirubin to serum albumins: validation and application of the
peroxidase method. Pediatr Res. 2006;60(6):724-8.
20. Ahlfors CE, Wennberg RP. Bilirubin-albumin binding and neonatal jaundice. Semin
Perinatol. 2004;28(5):334-9.
21. Goessling W, Zucker SD. Role of apolipoprotein D in the transport of bilirubin in
plasma. Am J Physiol Gastrointest Liver Physiol. 2000;279(2):G356-65.
22. Ostrow JD, Mukerjee P, Tiribelli C. Structure and binding of unconjugated bilirubin:
relevance for physiological and pathophysiological function. J Lipid Res. 1994;35(10):1715-
37.
23. Berk PD, Howe RB, Bloomer JR, Berlin NI. Studies of bilirubin kinetics in normal
adults. J Clin Invest. 1969;48(11):2176-90.
Referências
Carina de Fátima Rodrigues | 113
24. Kim HP, Pae HO, Back SH, Chung SW, Woo JM, Son Y, et al. Heme oxygenase-1
comes back to endoplasmic reticulum. Biochem Biophys Res Commun. 2011;404(1):1-5.
25. Vitek L, Schwertner HA. The heme catabolic pathway and its protective effects on
oxidative stress-mediated diseases. Adv Clin Chem. 2007;43:1-57.
26. Maines MD. The heme oxygenase system: a regulator of second messenger gases.
Annu Rev Pharmacol Toxicol. 1997;37:517-54.
27. Nath KA. The functional significance of induction of heme oxygenase by oxidant
stress. J Lab Clin Med. 1994;123(4):461-3.
28. Ryter SW, Alam J, Choi AM. Heme oxygenase-1/carbon monoxide: from basic science
to therapeutic applications. Physiol Rev. 2006;86(2):583-650.
29. Tenhunen R, Ross ME, Marver HS, Schmid R. Reduced nicotinamide-adenine
dinucleotide phosphate dependent biliverdin reductase: partial purification and
characterization. Biochemistry. 1970;9(2):298-303.
30. Talafant E. Properties and composition of the bile pigment giving a direct diazo
reaction. Nature. 1956;178(4528):312.
31. Sorrentino D, Berk PD. Mechanistic aspects of hepatic bilirubin uptake. Semin Liver
Dis. 1988;8(2):119-36.
32. Wolkoff AW, Goresky CA, Sellin J, Gatmaitan Z, Arias IM. Role of ligandin in transfer
of bilirubin from plasma into liver. Am J Physiol. 1979;236(6):E638-48.
33. Mediavilla MG, Pascolo L, Rodriguez JV, Guibert EE, Ostrow JD, Tiribelli C. Uptake
of [(3)H]bilirubin in freshly isolated rat hepatocytes: role of free bilirubin concentration.
FEBS Lett. 1999;463(1-2):143-5.
34. Campbell SD, de Morais SM, Xu JJ. Inhibition of human organic anion transporting
polypeptide OATP 1B1 as a mechanism of drug-induced hyperbilirubinemia. Chem Biol
Interact. 2004;150(2):179-87.
35. Cui Y, Konig J, Leier I, Buchholz U, Keppler D. Hepatic uptake of bilirubin and its
conjugates by the human organic anion transporter SLC21A6. J Biol Chem.
2001;276(13):9626-30.
Referências
Carina de Fátima Rodrigues | 114
36. Hagenbuch B, Gui C. Xenobiotic transporters of the human organic anion
transporting polypeptides (OATP) family. Xenobiotica. 2008;38(7-8):778-801.
37. van de Steeg E, Stranecky V, Hartmannova H, Noskova L, Hrebicek M, Wagenaar E,
et al. Complete OATP1B1 and OATP1B3 deficiency causes human Rotor syndrome by
interrupting conjugated bilirubin reuptake into the liver. J Clin Invest. 2012;122(2):519-28.
38. Iusuf D, van de Steeg E, Schinkel AH. Functions of OATP1A and 1B transporters in
vivo: insights from mouse models. Trends Pharmacol Sci. 2012;33(2):100-8.
39. Bosma PJ, Seppen J, Goldhoorn B, Bakker C, Oude Elferink RP, Chowdhury JR, et al.
Bilirubin UDP-glucuronosyltransferase 1 is the only relevant bilirubin glucuronidating
isoform in man. J Biol Chem. 1994;269(27):17960-4.
40. Keitel V, Kartenbeck J, Nies AT, Spring H, Brom M, Keppler D. Impaired protein
maturation of the conjugate export pump multidrug resistance protein 2 as a consequence
of a deletion mutation in Dubin-Johnson syndrome. Hepatology. 2000;32(6):1317-28.
41. Vlaming ML, Pala Z, van Esch A, Wagenaar E, de Waart DR, van de Wetering K, et al.
Functionally overlapping roles of Abcg2 (Bcrp1) and Abcc2 (Mrp2) in the elimination of
methotrexate and its main toxic metabolite 7-hydroxymethotrexate in vivo. Clin Cancer Res.
2009;15(9):3084-93.
42. Cherrington NJ, Hartley DP, Li N, Johnson DR, Klaassen CD. Organ distribution of
multidrug resistance proteins 1, 2, and 3 (Mrp1, 2, and 3) mRNA and hepatic induction of
Mrp3 by constitutive androstane receptor activators in rats. J Pharmacol Exp Ther.
2002;300(1):97-104.
43. van de Steeg E, Wagenaar E, van der Kruijssen CM, Burggraaff JE, de Waart DR,
Elferink RP, et al. Organic anion transporting polypeptide 1a/1b-knockout mice provide
insights into hepatic handling of bilirubin, bile acids, and drugs. J Clin Invest.
2010;120(8):2942-52.
44. Vitek L, Majer F, Muchova L, Zelenka J, Jiraskova A, Branny P, et al. Identification of
bilirubin reduction products formed by Clostridium perfringens isolated from human
neonatal fecal flora. J Chromatogr B Analyt Technol Biomed Life Sci. 2006;833(2):149-57.
45. Poland RL, Odell GB. Physiologic jaundice: the enterohepatic circulation of bilirubin.
N Engl J Med. 1971;284(1):1-6.
Referências
Carina de Fátima Rodrigues | 115
46. Elias MM, Mottino AD, Ochoa EJ. Transepithelial fate of bilirubin in the isolated rat
kidney. Biochim Biophys Acta. 1997;1336(1):7-14.
47. Berry CS, Zarembo JE, Ostrow JD. Evidence for conversion of bilirubin to dihydroxyl
derivatives in the gunn rat. Biochem Biophys Res Commun. 1972;49(5):1366-75.
48. Kapitulnik J, Ostrow JD. Stimulation of bilirubin catabolism in jaundiced Gunn rats
by an induced of microsomal mixed-function monooxygenases. Proc Natl Acad Sci U S A.
1978;75(2):682-5.
49. Rosenthal P, Pincus M, Fink D. Sex- and age-related differences in bilirubin
concentrations in serum. Clin Chem. 1984;30(8):1380-2.
50. Muraca M, Fevery J. Influence of sex and sex steroids on bilirubin uridine
diphosphate-glucuronosyltransferase activity of rat liver. Gastroenterology.
1984;87(2):308-13.
51. Buyukasik Y, Akman U, Buyukasik NS, Goker H, Kilicarslan A, Shorbagi AI, et al.
Evidence for higher red blood cell mass in persons with unconjugated hyperbilirubinemia
and Gilbert's syndrome. Am J Med Sci. 2008;335(2):115-9.
52. Winkel P, Statland BE, Bokelund H. Factors contributing to intra-individual variation
of serum constituents: 5. Short-term day-to-day and within-hour variation of serum
constituents in healthy subjects. Clin Chem. 1974;20(12):1520-7.
53. Werner M, Tolls RE, Hultin JV, Mellecker J. Influence of sex and age on the normal
range of eleven serum constituents. Z Klin Chem Klin Biochem. 1970;8(2):105-15.
54. Reiser DJ. Neonatal jaundice: physiologic variation or pathologic process. Crit Care
Nurs Clin North Am. 2004;16(2):257-69.
55. Carmel R, Wong ET, Weiner JM, Johnson CS. Racial differences in serum total
bilirubin levels in health and in disease (pernicious anemia). JAMA. 1985;253(23):3416-8.
56. O'Malley SS, Wu R, Mayne ST, Jatlow PI. Smoking Cessation Is Followed by Increases
in Serum Bilirubin, an Endogenous Antioxidant Associated With Lower Risk of Lung Cancer
and Cardiovascular Disease. Nicotine Tob Res. 2014.
Referências
Carina de Fátima Rodrigues | 116
57. Jo J, Kimm H, Yun JE, Lee KJ, Jee SH. Cigarette smoking and serum bilirubin
subtypes in healthy Korean men: the Korea Medical Institute study. J Prev Med Public
Health. 2012;45(2):105-12.
58. Frei B, Forte TM, Ames BN, Cross CE. Gas phase oxidants of cigarette smoke induce
lipid peroxidation and changes in lipoprotein properties in human blood plasma. Protective
effects of ascorbic acid. Biochem J. 1991;277 ( Pt 1):133-8.
59. Schwertner HA. Association of smoking and low serum bilirubin antioxidant
concentrations. Atherosclerosis. 1998;136(2):383-7.
60. Kimm H, Yun JE, Jo J, Jee SH. Low serum bilirubin level as an independent predictor
of stroke incidence: a prospective study in Korean men and women. Stroke.
2009;40(11):3422-7.
61. Horsfall LJ, Rait G, Walters K, Swallow DM, Pereira SP, Nazareth I, et al. Serum
bilirubin and risk of respiratory disease and death. JAMA. 2011;305(7):691-7.
62. Troughton JA, Woodside JV, Young IS, Arveiler D, Amouyel P, Ferrieres J, et al.
Bilirubin and coronary heart disease risk in the Prospective Epidemiological Study of
Myocardial Infarction (PRIME). Eur J Cardiovasc Prev Rehabil. 2007;14(1):79-84.
63. Breimer LH, Mikhailidis DP. Is bilirubin a marker of vascular disease and/or cancer
and is it a potential therapeutic target? Curr Pharm Des. 2011;17(33):3644-55.
64. Devries MC, Samjoo IA, Hamadeh MJ, Tarnopolsky MA. Effect of endurance exercise
on hepatic lipid content, enzymes, and adiposity in men and women. Obesity (Silver
Spring). 2008;16(10):2281-8.
65. Swift DL, Johannsen NM, Earnest CP, Blair SN, Church TS. Effect of different doses
of aerobic exercise training on total bilirubin levels. Med Sci Sports Exerc. 2012;44(4):569-
74.
66. Andersson C, Weeke P, Fosbol EL, Brendorp B, Kober L, Coutinho W, et al. Acute
effect of weight loss on levels of total bilirubin in obese, cardiovascular high-risk patients:
an analysis from the lead-in period of the Sibutramine Cardiovascular Outcome trial.
Metabolism. 2009;58(8):1109-15.
67. Laperche Y, Preaux AM, Feldmann G, Mahu JL, Berthelot P. Effect of fasting on
organic anion uptake by isolated rat liver cells. Hepatology. 1981;1(6):617-21.
Referências
Carina de Fátima Rodrigues | 117
68. Kotal P, Vitek L, Fevery J. Fasting-related hyperbilirubinemia in rats: the effect of
decreased intestinal motility. Gastroenterology. 1996;111(1):217-23.
69. Katoh M, Yoshioka Y, Nakagawa N, Yokoi T. Effects of Japanese herbal medicine,
Kampo, on human UGT1A1 activity. Drug Metab Pharmacokinet. 2009;24(3):226-34.
70. Saracino MR, Bigler J, Schwarz Y, Chang JL, Li S, Li L, et al. Citrus fruit intake is
associated with lower serum bilirubin concentration among women with the UGT1A1*28
polymorphism. J Nutr. 2009;139(3):555-60.
71. Teyssier C, Amiot MJ, Mondy N, Auger J, Kahane R, Siess MH. Effect of onion
consumption by rats on hepatic drug-metabolizing enzymes. Food Chem Toxicol.
2001;39(10):981-7.
72. Basten GP, Bao Y, Williamson G. Sulforaphane and its glutathione conjugate but not
sulforaphane nitrile induce UDP-glucuronosyl transferase (UGT1A1) and glutathione
transferase (GSTA1) in cultured cells. Carcinogenesis. 2002;23(8):1399-404.
73. Appelt LC, Reicks MM. Soy feeding induces phase II enzymes in rat tissues. Nutr
Cancer. 1997;28(3):270-5.
74. Haber D, Siess MH, Canivenc-Lavier MC, Le Bon AM, Suschetet M. Differential
effects of dietary diallyl sulfide and diallyl disulfide on rat intestinal and hepatic drug-
metabolizing enzymes. J Toxicol Environ Health. 1995;44(4):423-34.
75. Luquita MG, Catania VA, Pozzi EJ, Veggi LM, Hoffman T, Pellegrino JM, et al.
Molecular basis of perinatal changes in UDP-glucuronosyltransferase activity in maternal
rat liver. J Pharmacol Exp Ther. 2001;298(1):49-56.
76. Loke DF, Ng CS, Holck S, Hall PE, Ratnam SS. Lipid and biochemical changes after
low-dose oral contraception. Contraception. 1992;46(3):227-41.
77. Bosma PJ, Chowdhury NR, Goldhoorn BG, Hofker MH, Oude Elferink RP, Jansen PL,
et al. Sequence of exons and the flanking regions of human bilirubin-UDP-
glucuronosyltransferase gene complex and identification of a genetic mutation in a patient
with Crigler-Najjar syndrome, type I. Hepatology. 1992;15(5):941-7.
78. Strassburg CP. Hyperbilirubinemia syndromes (Gilbert-Meulengracht, Crigler-
Najjar, Dubin-Johnson, and Rotor syndrome). Best Pract Res Clin Gastroenterol.
2010;24(5):555-71.
Referências
Carina de Fátima Rodrigues | 118
79. Bosma PJ, Chowdhury JR, Bakker C, Gantla S, de Boer A, Oostra BA, et al. The genetic
basis of the reduced expression of bilirubin UDP-glucuronosyltransferase 1 in Gilbert's
syndrome. N Engl J Med. 1995;333(18):1171-5.
80. Beutler E, Gelbart T, Demina A. Racial variability in the UDP-glucuronosyltransferase
1 (UGT1A1) promoter: a balanced polymorphism for regulation of bilirubin metabolism?
Proc Natl Acad Sci U S A. 1998;95(14):8170-4.
81. Sampietro M, Lupica L, Perrero L, Comino A, Martinez di Montemuros F, Cappellini
MD, et al. The expression of uridine diphosphate glucuronosyltransferase gene is a major
determinant of bilirubin level in heterozygous beta-thalassaemia and in glucose-6-
phosphate dehydrogenase deficiency. Br J Haematol. 1997;99(2):437-9.
82. Ritter JK, Yeatman MT, Ferreira P, Owens IS. Identification of a genetic alteration in
the code for bilirubin UDP-glucuronosyltransferase in the UGT1 gene complex of a Crigler-
Najjar type I patient. J Clin Invest. 1992;90(1):150-5.
83. Strauss KA, Robinson DL, Vreman HJ, Puffenberger EG, Hart G, Morton DH.
Management of hyperbilirubinemia and prevention of kernicterus in 20 patients with
Crigler-Najjar disease. Eur J Pediatr. 2006;165(5):306-19.
84. van der Veere CN, Sinaasappel M, McDonagh AF, Rosenthal P, Labrune P, Odievre
M, et al. Current therapy for Crigler-Najjar syndrome type 1: report of a world registry.
Hepatology. 1996;24(2):311-5.
85. Arias IM, Gartner LM, Cohen M, Ezzer JB, Levi AJ. Chronic nonhemolytic
unconjugated hyperbilirubinemia with glucuronyl transferase deficiency. Clinical,
biochemical, pharmacologic and genetic evidence for heterogeneity. Am J Med.
1969;47(3):395-409.
86. Strassburg CP. Pharmacogenetics of Gilbert's syndrome. Pharmacogenomics.
2008;9(6):703-15.
87. Labrune P, Myara A, Hennion C, Gout JP, Trivin F, Odievre M. Crigler-Najjar type II
disease inheritance: a family study. J Inherit Metab Dis. 1989;12(3):302-6.
88. Seppen J, Bosma PJ, Goldhoorn BG, Bakker CT, Chowdhury JR, Chowdhury NR, et
al. Discrimination between Crigler-Najjar type I and II by expression of mutant bilirubin
uridine diphosphate-glucuronosyltransferase. J Clin Invest. 1994;94(6):2385-91.
Referências
Carina de Fátima Rodrigues | 119
89. Black M, Fevery J, Parker D, Jacobson J, Billing BH, Carson ER. Effect of
phenobarbitone on plasma (14C)bilirubin clearance in patients with unconjugated
hyperbilirubinaemia. Clin Sci Mol Med. 1974;46(1):1-17.
90. Canu G, Minucci A, Zuppi C, Capoluongo E. Gilbert and Crigler Najjar syndromes: an
update of the UDP-glucuronosyltransferase 1A1 (UGT1A1) gene mutation database. Blood
Cells Mol Dis. 2013;50(4):273-80.
91. Costa E. Hematologically important mutations: bilirubin UDP-
glucuronosyltransferase gene mutations in Gilbert and Crigler-Najjar syndromes. Blood
Cells Mol Dis. 2006;36(1):77-80.
92. Dubin IN, Johnson FB. Chronic idiopathic jaundice with unidentified pigment in liver
cells; a new clinicopathologic entity with a report of 12 cases. Medicine (Baltimore).
1954;33(3):155-97.
93. Huang MJ, Kua KE, Teng HC, Tang KS, Weng HW, Huang CS. Risk factors for severe
hyperbilirubinemia in neonates. Pediatr Res. 2004;56(5):682-9.
94. Poungouras PK, Samios BG, Michael I. Familial non-hemolytic jaundice with van den
Bergh reaction-study of a Greek family. Acta Hepatosplenol. 1963;10:36-40.
95. Wolkoff AW, Wolpert E, Pascasio FN, Arias IM. Rotor's syndrome. A distinct
inheritable pathophysiologic entity. Am J Med. 1976;60(2):173-9.
96. Sanna S, Busonero F, Maschio A, McArdle PF, Usala G, Dei M, et al. Common variants
in the SLCO1B3 locus are associated with bilirubin levels and unconjugated
hyperbilirubinemia. Hum Mol Genet. 2009;18(14):2711-8.
97. Johnson AD, Kavousi M, Smith AV, Chen MH, Dehghan A, Aspelund T, et al. Genome-
wide association meta-analysis for total serum bilirubin levels. Hum Mol Genet.
2009;18(14):2700-10.
98. Zhang W, He YJ, Gan Z, Fan L, Li Q, Wang A, et al. OATP1B1 polymorphism is a major
determinant of serum bilirubin level but not associated with rifampicin-mediated bilirubin
elevation. Clin Exp Pharmacol Physiol. 2007;34(12):1240-4.
99. Kaplan M, Algur N, Hammerman C. Onset of jaundice in glucose-6-phosphate
dehydrogenase-deficient neonates. Pediatrics. 2001;108(4):956-9.
Referências
Carina de Fátima Rodrigues | 120
100. Huang CS, Huang MJ, Lin MS, Yang SS, Teng HC, Tang KS. Genetic factors related to
unconjugated hyperbilirubinemia amongst adults. Pharmacogenet Genomics.
2005;15(1):43-50.
101. Datta S, Chowdhury A, Ghosh M, Das K, Jha P, Colah R, et al. A genome-wide search
for non-UGT1A1 markers associated with unconjugated bilirubin level reveals significant
association with a polymorphic marker near a gene of the nucleoporin family. Ann Hum
Genet. 2012;76(1):33-41.
102. Doye V, Hurt E. From nucleoporins to nuclear pore complexes. Curr Opin Cell Biol.
1997;9(3):401-11.
103. Schillinger M, Exner M, Mlekusch W, Ahmadi R, Rumpold H, Mannhalter C, et al.
Heme oxygenase-1 genotype is a vascular anti-inflammatory factor following balloon
angioplasty. J Endovasc Ther. 2002;9(4):385-94.
104. Lublinghoff N, Winkler K, Winkelmann BR, Seelhorst U, Wellnitz B, Boehm BO, et al.
Genetic variants of the promoter of the heme oxygenase-1 gene and their influence on
cardiovascular disease (the Ludwigshafen Risk and Cardiovascular Health study). BMC
Med Genet. 2009;10:36.
105. Endler G, Exner M, Schillinger M, Marculescu R, Sunder-Plassmann R, Raith M, et
al. A microsatellite polymorphism in the heme oxygenase-1 gene promoter is associated
with increased bilirubin and HDL levels but not with coronary artery disease. Thromb
Haemost. 2004;91(1):155-61.
106. del Giudice EM, Perrotta S, Nobili B, Specchia C, d'Urzo G, Iolascon A. Coinheritance
of Gilbert syndrome increases the risk for developing gallstones in patients with hereditary
spherocytosis. Blood. 1999;94(7):2259-62.
107. Perrotta S, Gallagher PG, Mohandas N. Hereditary spherocytosis. Lancet.
2008;372(9647):1411-26.
108. Gallagher PG. Hereditary elliptocytosis: spectrin and protein 4.1R. Semin Hematol.
2004;41(2):142-64.
109. An X, Mohandas N. Disorders of red cell membrane. Br J Haematol. 2008;141(3):367-
75.
Referências
Carina de Fátima Rodrigues | 121
110. Rocha S, Costa E, Ferreira F, Cleto E, Barbot J, Rocha-Pereira P, et al. Hereditary
spherocytosis and the (TA)nTAA polymorphism of UGT1A1 gene promoter region--a
comparison of the bilirubin plasmatic levels in the different clinical forms. Blood Cells Mol
Dis. 2010;44(2):117-9.
111. Tukey RH, Strassburg CP. Human UDP-glucuronosyltransferases: metabolism,
expression, and disease. Annu Rev Pharmacol Toxicol. 2000;40:581-616.
112. Borgna-Pignatti C, Rigon F, Merlo L, Chakrok R, Micciolo R, Perseu L, et al.
Thalassemia minor, the Gilbert mutation, and the risk of gallstones. Haematologica.
2003;88(10):1106-9.
113. Costa E, Pinto R, Vieira E, Polo S, Sarmento AM, Oliveira I, et al. [Influence of
Gilbert's syndrome on serum bilirubin levels and gallstone formation in children with
chronic hemolytic disease]. An Esp Pediatr. 2002;57(6):529-33.
114. Monaghan G, McLellan A, McGeehan A, Li Volti S, Mollica F, Salemi I, et al. Gilbert's
syndrome is a contributory factor in prolonged unconjugated hyperbilirubinemia of the
newborn. J Pediatr. 1999;134(4):441-6.
115. Kaplan M, Beutler E, Vreman HJ, Hammerman C, Levy-Lahad E, Renbaum P, et al.
Neonatal hyperbilirubinemia in glucose-6-phosphate dehydrogenase-deficient
heterozygotes. Pediatrics. 1999;104(1 Pt 1):68-74.
116. Maisels MJ, Newman TB. Kernicterus in otherwise healthy, breast-fed term
newborns. Pediatrics. 1995;96(4 Pt 1):730-3.
117. Maruo Y, Morioka Y, Fujito H, Nakahara S, Yanagi T, Matsui K, et al. Bilirubin uridine
diphosphate-glucuronosyltransferase variation is a genetic basis of breast milk jaundice. J
Pediatr. 2014;165(1):36-41 e1.
118. Perera MA, Innocenti F, Ratain MJ. Pharmacogenetic testing for uridine diphosphate
glucuronosyltransferase 1A1 polymorphisms: are we there yet? Pharmacotherapy.
2008;28(6):755-68.
119. Wenning LA, Hanley WD, Brainard DM, Petry AS, Ghosh K, Jin B, et al. Effect of
rifampin, a potent inducer of drug-metabolizing enzymes, on the pharmacokinetics of
raltegravir. Antimicrob Agents Chemother. 2009;53(7):2852-6.
Referências
Carina de Fátima Rodrigues | 122
120. Kiang TK, Ensom MH, Chang TK. UDP-glucuronosyltransferases and clinical drug-
drug interactions. Pharmacol Ther. 2005;106(1):97-132.
121. Jemnitz K, Lengyel G, Vereczkey L. In vitro induction of bilirubin conjugation in
primary rat hepatocyte culture. Biochem Biophys Res Commun. 2002;291(1):29-33.
122. Folprecht G, Kohne CH. The role of new agents in the treatment of colorectal cancer.
Oncology. 2004;66(1):1-17.
123. Kawato Y, Aonuma M, Hirota Y, Kuga H, Sato K. Intracellular roles of SN-38, a
metabolite of the camptothecin derivative CPT-11, in the antitumor effect of CPT-11. Cancer
Res. 1991;51(16):4187-91.
124. Innocenti F, Iyer L, Ratain MJ. Pharmacogenetics of anticancer agents: lessons from
amonafide and irinotecan. Drug Metab Dispos. 2001;29(4 Pt 2):596-600.
125. Zhang D, Chando TJ, Everett DW, Patten CJ, Dehal SS, Humphreys WG. In vitro
inhibition of UDP glucuronosyltransferases by atazanavir and other HIV protease inhibitors
and the relationship of this property to in vivo bilirubin glucuronidation. Drug Metab
Dispos. 2005;33(11):1729-39.
126. Lankisch TO, Moebius U, Wehmeier M, Behrens G, Manns MP, Schmidt RE, et al.
Gilbert's disease and atazanavir: from phenotype to UDP-glucuronosyltransferase
haplotype. Hepatology. 2006;44(5):1324-32.
127. Petersen K, Riddle MS, Jones LE, Furtek KJ, Christensen AR, Tasker SA, et al. Use of
bilirubin as a marker of adherence to atazanavir-based antiretroviral therapy. AIDS.
2005;19(15):1700-2.
128. Cheng Z, Rios GR, King CD, Coffman BL, Green MD, Mojarrabi B, et al.
Glucuronidation of catechol estrogens by expressed human UDP-glucuronosyltransferases
(UGTs) 1A1, 1A3, and 2B7. Toxicol Sci. 1998;45(1):52-7.
129. Tang KS, Chiu HF, Chen HH, Eng HL, Tsai CJ, Teng HC, et al. Link between colorectal
cancer and polymorphisms in the uridine-diphosphoglucuronosyltransferase 1A7 and 1A1
genes. World J Gastroenterol. 2005;11(21):3250-4.
130. Fisher MB, Paine MF, Strelevitz TJ, Wrighton SA. The role of hepatic and extrahepatic
UDP-glucuronosyltransferases in human drug metabolism. Drug Metab Rev. 2001;33(3-
4):273-97.
Referências
Carina de Fátima Rodrigues | 123
131. Meech R, Mackenzie PI. Structure and function of uridine diphosphate
glucuronosyltransferases. Clin Exp Pharmacol Physiol. 1997;24(12):907-15.
132. van Es HH, Bout A, Liu J, Anderson L, Duncan AM, Bosma P, et al. Assignment of the
human UDP glucuronosyltransferase gene (UGT1A1) to chromosome region 2q37.
Cytogenet Cell Genet. 1993;63(2):114-6.
133. Senafi SB, Clarke DJ, Burchell B. Investigation of the substrate specificity of a cloned
expressed human bilirubin UDP-glucuronosyltransferase: UDP-sugar specificity and
involvement in steroid and xenobiotic glucuronidation. Biochem J. 1994;303 ( Pt 1):233-
40.
134. Mackenzie PI, Owens IS, Burchell B, Bock KW, Bairoch A, Belanger A, et al. The UDP
glycosyltransferase gene superfamily: recommended nomenclature update based on
evolutionary divergence. Pharmacogenetics. 1997;7(4):255-69.
135. Zhang T, Haws P, Wu Q. Multiple variable first exons: a mechanism for cell- and
tissue-specific gene regulation. Genome Res. 2004;14(1):79-89.
136. Fauci AS KD, Braunwald E, Hauser SL, Longo DL. Hiperbilirubinemias. Harrison's
Principles of Internal Medicine. New York: McGraw-Hill Companies; 2011.
137. Rouleau M, Collin P, Bellemare J, Harvey M, Guillemette C. Protein-protein
interactions between the bilirubin-conjugating UDP-glucuronosyltransferase UGT1A1 and
its shorter isoform 2 regulatory partner derived from alternative splicing. Biochem J.
2013;450(1):107-14.
138. Mackenzie PI. Rat liver UDP-glucuronosyltransferase. Sequence and expression of a
cDNA encoding a phenobarbital-inducible form. J Biol Chem. 1986;261(13):6119-25.
139. Ghosh SS, Lu Y, Lee SW, Wang X, Guha C, Roy-Chowdhury J, et al. Role of cysteine
residues in the function of human UDP glucuronosyltransferase isoform 1A1 (UGT1A1).
Biochem J. 2005;392(Pt 3):685-92.
140. Innocenti F, Grimsley C, Das S, Ramirez J, Cheng C, Kuttab-Boulos H, et al. Haplotype
structure of the UDP-glucuronosyltransferase 1A1 promoter in different ethnic groups.
Pharmacogenetics. 2002;12(9):725-33.
Referências
Carina de Fátima Rodrigues | 124
141. Sugatani J, Yamakawa K, Yoshinari K, Machida T, Takagi H, Mori M, et al.
Identification of a defect in the UGT1A1 gene promoter and its association with
hyperbilirubinemia. Biochem Biophys Res Commun. 2002;292(2):492-7.
142. Fernandez Salazar JM, Remacha Sevilla A, del Rio Conde E, Baiget Bastus M.
[Distribution of the A(TA)7TAA genotype associated with Gilbert syndrome in the Spanish
population]. Med Clin (Barc). 2000;115(14):540-1.
143. Te Morsche RH, Zusterzeel PL, Raijmakers MT, Roes EM, Steegers EA, Peters WH.
Polymorphism in the promoter region of the bilirubin UDP-glucuronosyltransferase
(Gilbert's syndrome) in healthy Dutch subjects. Hepatology. 2001;33(3):765.
144. Martins R, Morais A, Dias A, Soares I, Rolao C, Ducla-Soares JL, et al. Early
modification of sickle cell disease clinical course by UDP-glucuronosyltransferase 1A1 gene
promoter polymorphism. J Hum Genet. 2008;53(6):524-8.
145. Akaba K, Kimura T, Sasaki A, Tanabe S, Ikegami T, Hashimoto M, et al. Neonatal
hyperbilirubinemia and mutation of the bilirubin uridine diphosphate-
glucuronosyltransferase gene: a common missense mutation among Japanese, Koreans and
Chinese. Biochem Mol Biol Int. 1998;46(1):21-6.
146. Huang CS, Luo GA, Huang ML, Yu SC, Yang SS. Variations of the bilirubin uridine-
diphosphoglucuronosyl transferase 1A1 gene in healthy Taiwanese. Pharmacogenetics.
2000;10(6):539-44.
147. Saeki M, Saito Y, Jinno H, Sai K, Ozawa S, Kurose K, et al. Haplotype structures of the
UGT1A gene complex in a Japanese population. Pharmacogenomics J. 2006;6(1):63-75.
148. Strassburg CP. Gilbert-Meulengracht's syndrome and pharmacogenetics: is jaundice
just the tip of the iceberg? Drug Metab Rev. 2010;42(1):168-81.
149. Locuson CW, Tracy TS. Comparative modelling of the human UDP-
glucuronosyltransferases: insights into structure and mechanism. Xenobiotica.
2007;37(2):155-68.
150. Li C, Wu Q. Adaptive evolution of multiple-variable exons and structural diversity of
drug-metabolizing enzymes. BMC Evol Biol. 2007;7:69.
Referências
Carina de Fátima Rodrigues | 125
151. Laakkonen L, Finel M. A molecular model of the human UDP-
glucuronosyltransferase 1A1, its membrane orientation, and the interactions between
different parts of the enzyme. Mol Pharmacol. 2010;77(6):931-9.
152. Kumar P, Henikoff S, Ng PC. Predicting the effects of coding non-synonymous
variants on protein function using the SIFT algorithm. Nat Protoc. 2009;4(7):1073-81.
153. Adzhubei IA, Schmidt S, Peshkin L, Ramensky VE, Gerasimova A, Bork P, et al. A
method and server for predicting damaging missense mutations. Nat Methods.
2010;7(4):248-9.
154. Reumers J, Maurer-Stroh S, Schymkowitz J, Rousseau F. SNPeffect v2.0: a new step
in investigating the molecular phenotypic effects of human non-synonymous SNPs.
Bioinformatics. 2006;22(17):2183-5.
155. Di YM, Chan E, Wei MQ, Liu JP, Zhou SF. Prediction of deleterious non-synonymous
single-nucleotide polymorphisms of human uridine diphosphate glucuronosyltransferase
genes. AAPS J. 2009;11(3):469-80.
156. Galehdari H, Saki N, Mohammadi-Asl J, Rahim F. Meta-analysis diagnostic accuracy
of SNP-based pathogenicity detection tools: a case of UTG1A1 gene mutations. Int J Mol
Epidemiol Genet. 2013;4(2):77-85.
157. Rahim F, Galehdari H, Mohammadi-Asl J, Saki N. Regression Modeling and Meta-
Analysis of Diagnostic Accuracy of SNP-Based Pathogenicity Detection Tools for UGT1A1
Gene Mutation. Genet Res Int. 2013;2013:546909.
158. Hazin R, Abu-Rajab Tamimi TI, Abuzetun JY, Zein NN. Recognizing and treating
cutaneous signs of liver disease. Cleve Clin J Med. 2009;76(10):599-606.
159. Sackey K. Hemolytic anemia: Part 1. Pediatr Rev. 1999;20(5):152-8; quiz 9.
160. Burtis CA AE, Bruns DE,. .Clinical Chemistry: Theory, Analysis, Correlation. 4 ed1996
1996. 836 p.
161. Kaplan M, Hammerman C. Understanding severe hyperbilirubinemia and preventing
kernicterus: adjuncts in the interpretation of neonatal serum bilirubin. Clin Chim Acta.
2005;356(1-2):9-21.
Referências
Carina de Fátima Rodrigues | 126
162. Cleijsen RM, van de Ende ME, Kroon FP, Lunel FV, Koopmans PP, Gras L, et al.
Therapeutic drug monitoring of the HIV protease inhibitor atazanavir in clinical practice. J
Antimicrob Chemother. 2007;60(4):897-900.
163. Pasha TM, Lindor KD. Diagnosis and therapy of cholestatic liver disease. Med Clin
North Am. 1996;80(5):995-1019.
164. Winger J, Michelfelder A. Diagnostic approach to the patient with jaundice. Prim
Care. 2011;38(3):469-82; viii.
165. Kosters A, Karpen SJ. The role of inflammation in cholestasis: clinical and basic
aspects. Semin Liver Dis. 2010;30(2):186-94.
166. Pashankar D, Schreiber RA. Jaundice in older children and adolescents. Pediatr Rev.
2001;22(7):219-26.
167. Roche SP, Kobos R. Jaundice in the adult patient. Am Fam Physician.
2004;69(2):299-304.
168. Giannini EG, Testa R, Savarino V. Liver enzyme alteration: a guide for clinicians.
CMAJ. 2005;172(3):367-79.
169. Rosalki SB, Dooley JS. Liver function profiles and their interpretation. Br J Hosp Med.
1994;51(4):181-6.
170. Limdi JK, Hyde GM. Evaluation of abnormal liver function tests. Postgrad Med J.
2003;79(932):307-12.
171. Hansen TW. Bilirubin brain toxicity. J Perinatol. 2001;21 Suppl 1:S48-51; discussion
S9-62.
172. Stocker R, Glazer AN, Ames BN. Antioxidant activity of albumin-bound bilirubin.
Proc Natl Acad Sci U S A. 1987;84(16):5918-22.
173. Schwertner HA, Jackson WG, Tolan G. Association of low serum concentration of
bilirubin with increased risk of coronary artery disease. Clin Chem. 1994;40(1):18-23.
174. Sies H. Oxidative stress: from basic research to clinical application. Am J Med.
1991;91(3C):31S-8S.
Referências
Carina de Fátima Rodrigues | 127
175. Halliwell B, Whiteman M. Measuring reactive species and oxidative damage in vivo
and in cell culture: how should you do it and what do the results mean? Br J Pharmacol.
2004;142(2):231-55.
176. Kang SJ, Lee C, Kruzliak P. Effects of serum bilirubin on atherosclerotic processes.
Ann Med. 2014;46(3):138-47.
177. Baranano DE, Rao M, Ferris CD, Snyder SH. Biliverdin reductase: a major physiologic
cytoprotectant. Proc Natl Acad Sci U S A. 2002;99(25):16093-8.
178. Stocker R, Perrella MA. Heme oxygenase-1: a novel drug target for atherosclerotic
diseases? Circulation. 2006;114(20):2178-89.
179. Ollinger R, Bilban M, Erat A, Froio A, McDaid J, Tyagi S, et al. Bilirubin: a natural
inhibitor of vascular smooth muscle cell proliferation. Circulation. 2005;112(7):1030-9.
180. Skalen K, Gustafsson M, Rydberg EK, Hulten LM, Wiklund O, Innerarity TL, et al.
Subendothelial retention of atherogenic lipoproteins in early atherosclerosis. Nature.
2002;417(6890):750-4.
181. Shih PT, Elices MJ, Fang ZT, Ugarova TP, Strahl D, Territo MC, et al. Minimally
modified low-density lipoprotein induces monocyte adhesion to endothelial connecting
segment-1 by activating beta1 integrin. J Clin Invest. 1999;103(5):613-25.
182. Zernecke A, Shagdarsuren E, Weber C. Chemokines in atherosclerosis: an update.
Arterioscler Thromb Vasc Biol. 2008;28(11):1897-908.
183. Yan ZQ, Hansson GK. Innate immunity, macrophage activation, and atherosclerosis.
Immunol Rev. 2007;219:187-203.
184. Robertson AK, Hansson GK. T cells in atherogenesis: for better or for worse?
Arterioscler Thromb Vasc Biol. 2006;26(11):2421-32.
185. Mazzone GL, Rigato I, Ostrow JD, Bossi F, Bortoluzzi A, Sukowati CH, et al. Bilirubin
inhibits the TNFalpha-related induction of three endothelial adhesion molecules. Biochem
Biophys Res Commun. 2009;386(2):338-44.
186. Tapan S, Dogru T, Tasci I, Ercin CN, Ozgurtas T, Erbil MK. Soluble CD40 ligand and
soluble P-selectin levels in Gilbert's syndrome: a link to protection against atherosclerosis?
Clin Biochem. 2009;42(9):791-5.
Referências
Carina de Fátima Rodrigues | 128
187. Peyton KJ, Shebib AR, Azam MA, Liu XM, Tulis DA, Durante W. Bilirubin inhibits
neointima formation and vascular smooth muscle cell proliferation and migration. Front
Pharmacol. 2012;3:48.
188. Stoeckius M, Erat A, Fujikawa T, Hiromura M, Koulova A, Otterbein L, et al. Essential
roles of Raf/extracellular signal-regulated kinase/mitogen-activated protein kinase
pathway, YY1, and Ca2+ influx in growth arrest of human vascular smooth muscle cells by
bilirubin. J Biol Chem. 2012;287(19):15418-26.
189. Labrune P, Myara A, Trivin F, Odievre M. Gunn rats: a reproducible experimental
model to compare the different methods of measurements of bilirubin serum concentration
and to evaluate the risk of bilirubin encephalopathy. Clin Chim Acta. 1990;192(1):29-33.
190. Burmistrov SO, Dubinina EE, Shabalov NP, Khodov DA, Talabi E. [The action of
bilirubin in vitro on the antioxidant activity and lipid peroxidation of the plasma and
erythrocytes of cord blood]. Biull Eksp Biol Med. 1993;116(7):50-2.
191. Molzer C, Pfleger B, Putz E, Rossmann A, Schwarz U, Wallner M, et al. In vitro DNA-
damaging effects of intestinal and related tetrapyrroles in human cancer cells. Exp Cell Res.
2013;319(4):536-45.
192. Roche M, Rondeau P, Singh NR, Tarnus E, Bourdon E. The antioxidant properties of
serum albumin. FEBS Lett. 2008;582(13):1783-7.
193. Jacobsen C. Lysine residue 240 of human serum albumin is involved in high-affinity
binding of bilirubin. Biochem J. 1978;171(2):453-9.
194. Bar-Or D, Rael LT, Lau EP, Rao NK, Thomas GW, Winkler JV, et al. An analog of the
human albumin N-terminus (Asp-Ala-His-Lys) prevents formation of copper-induced
reactive oxygen species. Biochem Biophys Res Commun. 2001;284(3):856-62.
195. Danesh J, Collins R, Appleby P, Peto R. Association of fibrinogen, C-reactive protein,
albumin, or leukocyte count with coronary heart disease: meta-analyses of prospective
studies. JAMA. 1998;279(18):1477-82.
196. Viana LV, Gross JL, Camargo JL, Zelmanovitz T, da Costa Rocha EP, Azevedo MJ.
Prediction of cardiovascular events, diabetic nephropathy, and mortality by albumin
concentration in a spot urine sample in patients with type 2 diabetes. J Diabetes
Complications. 2012;26(5):407-12.

Referências
Carina de Fátima Rodrigues | 129
197. Neuzil J, Stocker R. Bilirubin attenuates radical-mediated damage to serum albumin.
FEBS Lett. 1993;331(3):281-4.
198. Neuzil J, Stocker R. Free and albumin-bound bilirubin are efficient co-antioxidants
for alpha-tocopherol, inhibiting plasma and low density lipoprotein lipid peroxidation. J
Biol Chem. 1994;269(24):16712-9.
199. Wu TW, Wu J, Li RK, Mickle D, Carey D. Albumin-bound bilirubins protect human
ventricular myocytes against oxyradical damage. Biochem Cell Biol. 1991;69(10-11):683-8.
200. Djousse L, Rothman KJ, Cupples LA, Levy D, Ellison RC. Serum albumin and risk of
myocardial infarction and all-cause mortality in the Framingham Offspring Study.
Circulation. 2002;106(23):2919-24.
201. Bulmer AC, Verkade HJ, Wagner KH. Bilirubin and beyond: a review of lipid status in
Gilbert's syndrome and its relevance to cardiovascular disease protection. Prog Lipid Res.
2013;52(2):193-205.
202. Cheriyath P, Gorrepati VS, Peters I, Nookala V, Murphy ME, Srouji N, et al. High Total
Bilirubin as a Protective Factor for Diabetes Mellitus: An Analysis of NHANES Data From
1999 - 2006. J Clin Med Res. 2010;2(5):201-6.
203. Kwon KM, Kam JH, Kim MY, Chung CH, Kim JK, Linton JA, et al. Inverse association
between total bilirubin and metabolic syndrome in rural korean women. J Womens Health
(Larchmt). 2011;20(6):963-9.
204. Tanaka M, Fukui M, Okada H, Senmaru T, Asano M, Akabame S, et al. Low serum
bilirubin concentration is a predictor of chronic kidney disease. Atherosclerosis.
2014;234(2):421-5.
205. Targher G, Bosworth C, Kendrick J, Smits G, Lippi G, Chonchol M. Relationship of
serum bilirubin concentrations to kidney function and albuminuria in the United States
adult population. Findings from the National Health and Nutrition Examination Survey
2001-2006. Clin Chem Lab Med. 2009;47(9):1055-62.
206. Fischman D, Valluri A, Gorrepati VS, Murphy ME, Peters I, Cheriyath P. Bilirubin as
a Protective Factor for Rheumatoid Arthritis: An NHANES Study of 2003 - 2006 Data. J
Clin Med Res. 2010;2(6):256-60.
Referências
Carina de Fátima Rodrigues | 130
207. Peng F, Deng X, Yu Y, Chen X, Shen L, Zhong X, et al. Serum bilirubin concentrations
and multiple sclerosis. J Clin Neurosci. 2011;18(10):1355-9.
208. Temme EH, Zhang J, Schouten EG, Kesteloot H. Serum bilirubin and 10-year
mortality risk in a Belgian population. Cancer Causes Control. 2001;12(10):887-94.
209. Lacko M, Roelofs HM, Te Morsche RH, Voogd AC, Ophuis MB, Peters WH, et al.
Genetic polymorphism in the conjugating enzyme UGT1A1 and the risk of head and neck
cancer. Int J Cancer. 2010;127(12):2815-21.
210. Holvoet P, Jenny NS, Schreiner PJ, Tracy RP, Jacobs DR. The relationship between
oxidized LDL and other cardiovascular risk factors and subclinical CVD in different ethnic
groups: the Multi-Ethnic Study of Atherosclerosis (MESA). Atherosclerosis.
2007;194(1):245-52.
211. Ocadlik I, Hlinstakova S, Oravec S. Relationship between unconjugated
hyperbilirubinemia and lipoprotein spectrum. Neuro Endocrinol Lett. 2011;32(3):360-4.
212. McArdle PF, Whitcomb BW, Tanner K, Mitchell BD, Shuldiner AR, Parsa A.
Association between bilirubin and cardiovascular disease risk factors: using Mendelian
randomization to assess causal inference. BMC Cardiovasc Disord. 2012;12:16.
213. Belo L, Nascimento H, Kohlova M, Bronze-da-Rocha E, Fernandes J, Costa E, et al.
Body Fat Percentage Is a Major Determinant of Total Bilirubin Independently of
UGT1A1*28 Polymorphism in Young Obese. PLoS One. 2014;9(6):e98467.
214. Ohnaka K, Kono S, Inoguchi T, Yin G, Morita M, Adachi M, et al. Inverse associations
of serum bilirubin with high sensitivity C-reactive protein, glycated hemoglobin, and
prevalence of type 2 diabetes in middle-aged and elderly Japanese men and women.
Diabetes Res Clin Pract. 2010;88(1):103-10.
215. Tapan S, Karadurmus N, Dogru T, Ercin CN, Tasci I, Bilgi C, et al. Decreased small
dense LDL levels in Gilbert's syndrome. Clin Biochem. 2011;44(4):300-3.
216. Vitek L, Jirsa M, Brodanova M, Kalab M, Marecek Z, Danzig V, et al. Gilbert syndrome
and ischemic heart disease: a protective effect of elevated bilirubin levels. Atherosclerosis.
2002;160(2):449-56.
Referências
Carina de Fátima Rodrigues | 131
217. Lin LY, Kuo HK, Hwang JJ, Lai LP, Chiang FT, Tseng CD, et al. Serum bilirubin is
inversely associated with insulin resistance and metabolic syndrome among children and
adolescents. Atherosclerosis. 2009;203(2):563-8.
218. Breimer LH, Wannamethee G, Ebrahim S, Shaper AG. Serum bilirubin and risk of
ischemic heart disease in middle-aged British men. Clin Chem. 1995;41(10):1504-8.
219. Boon AC, Hawkins CL, Bisht K, Coombes JS, Bakrania B, Wagner KH, et al. Reduced
circulating oxidized LDL is associated with hypocholesterolemia and enhanced thiol status
in Gilbert syndrome. Free Radic Biol Med. 2012;52(10):2120-7.
220. Lin JP, Vitek L, Schwertner HA. Serum bilirubin and genes controlling bilirubin
concentrations as biomarkers for cardiovascular disease. Clin Chem. 2010;56(10):1535-43.
221. Wu BJ, Midwinter RG, Cassano C, Beck K, Wang Y, Changsiri D, et al. Heme
oxygenase-1 increases endothelial progenitor cells. Arterioscler Thromb Vasc Biol.
2009;29(10):1537-42.
222. Lin JP, O'Donnell CJ, Schwaiger JP, Cupples LA, Lingenhel A, Hunt SC, et al.
Association between the UGT1A1*28 allele, bilirubin levels, and coronary heart disease in
the Framingham Heart Study. Circulation. 2006;114(14):1476-81.
223. Erdogan D, Gullu H, Yildirim E, Tok D, Kirbas I, Ciftci O, et al. Low serum bilirubin
levels are independently and inversely related to impaired flow-mediated vasodilation and
increased carotid intima-media thickness in both men and women. Atherosclerosis.
2006;184(2):431-7.
224. Bulmer AC, Blanchfield JT, Toth I, Fassett RG, Coombes JS. Improved resistance to
serum oxidation in Gilbert's syndrome: a mechanism for cardiovascular protection.
Atherosclerosis. 2008;199(2):390-6.
225. Chin HJ, Cho HJ, Lee TW, Na KY, Oh KH, Joo KW, et al. The mildly elevated serum
bilirubin level is negatively associated with the incidence of end stage renal disease in
patients with IgA nephropathy. J Korean Med Sci. 2009;24 Suppl:S22-9.
226. Choi SH, Yun KE, Choi HJ. Relationships between serum total bilirubin levels and
metabolic syndrome in Korean adults. Nutr Metab Cardiovasc Dis. 2013;23(1):31-7.
227. Hwang HJ, Lee SW, Kim SH. Relationship between bilirubin and C-reactive protein.
Clin Chem Lab Med. 2011;49(11):1823-8.
Referências
Carina de Fátima Rodrigues | 132
228. Perlstein TS, Pande RL, Creager MA, Weuve J, Beckman JA. Serum total bilirubin
level, prevalent stroke, and stroke outcomes: NHANES 1999-2004. Am J Med.
2008;121(9):781-8 e1.
229. Zucker SD, Horn PS, Sherman KE. Serum bilirubin levels in the U.S. population:
gender effect and inverse correlation with colorectal cancer. Hepatology. 2004;40(4):827-
35.
230. Ben-Amotz R, Bonagura J, Velayutham M, Hamlin R, Burns P, Adin C.
Intraperitoneal bilirubin administration decreases infarct area in a rat coronary
ischemia/reperfusion model. Front Physiol. 2014;5:53.
231. Ostrow JD, Pascolo L, Brites D, Tiribelli C. Molecular basis of bilirubin-induced
neurotoxicity. Trends Mol Med. 2004;10(2):65-70.
232. Dore S, Goto S, Sampei K, Blackshaw S, Hester LD, Ingi T, et al. Heme oxygenase-2
acts to prevent neuronal death in brain cultures and following transient cerebral ischemia.
Neuroscience. 2000;99(4):587-92.
233. Akin E, Clower B, Tibbs R, Tang J, Zhang J. Bilirubin produces apoptosis in cultured
bovine brain endothelial cells. Brain Res. 2002;931(2):168-75.
234. Rodrigues CM, Sola S, Brites D. Bilirubin induces apoptosis via the mitochondrial
pathway in developing rat brain neurons. Hepatology. 2002;35(5):1186-95.
235. Vaz AR, Delgado-Esteban M, Brito MA, Bolanos JP, Brites D, Almeida A. Bilirubin
selectively inhibits cytochrome c oxidase activity and induces apoptosis in immature
cortical neurons: assessment of the protective effects of glycoursodeoxycholic acid. J
Neurochem. 2010;112(1):56-65.
236. Bennett V. The membrane skeleton of human erythrocytes and its implications for
more complex cells. Annu Rev Biochem. 1985;54:273-304.
237. Mireles LC, Lum MA, Dennery PA. Antioxidant and cytotoxic effects of bilirubin on
neonatal erythrocytes. Pediatr Res. 1999;45(3):355-62.
238. Brito MA, Silva RFM, Brites D. Bilirubin induces loss of membrane lipids and
exposure of phosphatidylserine in human erythrocytes. Cell Biology and Toxicology.
2002;18(3):181-92.
Referências
Carina de Fátima Rodrigues | 133
239. Alexandra Brito M, Silva RF, Brites D. Bilirubin toxicity to human erythrocytes: a
review. Clin Chim Acta. 2006;374(1-2):46-56.
240. Dhumeaux D, Erlinger S. Hereditary conjugated hyperbilirubinaemia: 37 years later.
J Hepatol. 2013;58(2):388-90.
241. Zhang D, Kiyatkin A, Bolin JT, Low PS. Crystallographic structure and functional
interpretation of the cytoplasmic domain of erythrocyte membrane band 3. Blood.
2000;96(9):2925-33.
242. Luu TD, Rusu AM, Walter V, Ripp R, Moulinier L, Muller J, et al. MSV3d: database of
human MisSense Variants mapped to 3D protein structure. Database (Oxford).
2012;2012:bas018.
243. Lutz HU, Bussolino F, Flepp R, Fasler S, Stammler P, Kazatchkine MD, et al. Naturally
occurring anti-band-3 antibodies and complement together mediate phagocytosis of
oxidatively stressed human erythrocytes. Proc Natl Acad Sci U S A. 1987;84(21):7368-72.
244. Brunati AM, Bordin L, Clari G, James P, Quadroni M, Baritono E, et al. Sequential
phosphorylation of protein band 3 by Syk and Lyn tyrosine kinases in intact human
erythrocytes: identification of primary and secondary phosphorylation sites. Blood.
2000;96(4):1550-7.
245. Santos-Silva A, Rebelo I, Castro E, Belo L, Catarino C, Monteiro I, et al. Erythrocyte
damage and leukocyte activation in ischemic stroke. Clin Chim Acta. 2002;320(1-2):29-35.
246. Strassburg CP, Lankisch TO, Manns MP, Ehmer U. Family 1 uridine-5'-diphosphate
glucuronosyltransferases (UGT1A): from Gilbert's syndrome to genetic organization and
variability. Arch Toxicol. 2008;82(7):415-33.
247. Labrune P, Myara A, Chalas J, Le Bihan B, Capel L, Francoual J. Association of a
homozygous (TA)8 promoter polymorphism and a N400D mutation of UGT1A1 in a child
with Crigler-Najjar type II syndrome. Hum Mutat. 2002;20(5):399-401.
248. Yusoff S, Van Rostenberghe H, Yusoff NM, Talib NA, Ramli N, Ismail NZ, et al.
Frequencies of A(TA)7TAA, G71R, and G493R mutations of the UGT1A1 gene in the
Malaysian population. Biol Neonate. 2006;89(3):171-6.
249. Sneitz N, Bakker CT, de Knegt RJ, Halley DJ, Finel M, Bosma PJ. Crigler-Najjar
syndrome in The Netherlands: identification of four novel UGT1A1 alleles, genotype-
Referências
Carina de Fátima Rodrigues | 134
phenotype correlation, and functional analysis of 10 missense mutants. Hum Mutat.
2010;31(1):52-9.
250. Sai K, Saeki M, Saito Y, Ozawa S, Katori N, Jinno H, et al. UGT1A1 haplotypes
associated with reduced glucuronidation and increased serum bilirubin in irinotecan-
administered Japanese patients with cancer. Clin Pharmacol Ther. 2004;75(6):501-15.
251. Ferrer-Costa C, Gelpi JL, Zamakola L, Parraga I, de la Cruz X, Orozco M. PMUT: a
web-based tool for the annotation of pathological mutations on proteins. Bioinformatics.
2005;21(14):3176-8.
252. Stone EA, Sidow A. Physicochemical constraint violation by missense substitutions
mediates impairment of protein function and disease severity. Genome Res.
2005;15(7):978-86.
253. Tavtigian SV, Deffenbaugh AM, Yin L, Judkins T, Scholl T, Samollow PB, et al.
Comprehensive statistical study of 452 BRCA1 missense substitutions with classification of
eight recurrent substitutions as neutral. J Med Genet. 2006;43(4):295-305.
254. Ng PC, Henikoff S. Predicting the effects of amino acid substitutions on protein
function. Annu Rev Genomics Hum Genet. 2006;7:61-80.
255. Ferrer-Costa C, Orozco M, de la Cruz X. Sequence-based prediction of pathological
mutations. Proteins. 2004;57(4):811-9.
256. Gonzalez-Perez A, Lopez-Bigas N. Improving the assessment of the outcome of
nonsynonymous SNVs with a consensus deleteriousness score, Condel. Am J Hum Genet.
2011;88(4):440-9.
257. Jordan DM, Ramensky VE, Sunyaev SR. Human allelic variation: perspective from
protein function, structure, and evolution. Curr Opin Struct Biol. 2010;20(3):342-50.
258. Thusberg J, Olatubosun A, Vihinen M. Performance of mutation pathogenicity
prediction methods on missense variants. Hum Mutat. 2011;32(4):358-68.
259. Wong KC, Zhang Z. SNPdryad: predicting deleterious non-synonymous human SNPs
using only orthologous protein sequences. Bioinformatics. 2014.
Referências
Carina de Fátima Rodrigues | 135
260. Shu Y, Leabman MK, Feng B, Mangravite LM, Huang CC, Stryke D, et al. Evolutionary
conservation predicts function of variants of the human organic cation transporter, OCT1.
Proc Natl Acad Sci U S A. 2003;100(10):5902-7.
261. Katoh K, Standley DM. MAFFT Multiple Sequence Alignment Software Version 7:
Improvements in Performance and Usability. Molecular Biology and Evolution.
2013;30(4):772-80.
262. Baldi P, Brunak S, Chauvin Y, Andersen CA, Nielsen H. Assessing the accuracy of
prediction algorithms for classification: an overview. Bioinformatics. 2000;16(5):412-24.
263. Johnson MM, Houck J, Chen C. Screening for Deleterious Nonsynonymous Single-
Nucleotide Polymorphisms in Genes Involved in Steroid Hormone Metabolism and
Response. Cancer Epidemiology Biomarkers & Prevention. 2005;14(5):1326-9.
264. Thomas PD, Kejariwal A, Campbell MJ, Mi H, Diemer K, Guo N, et al. PANTHER: a
browsable database of gene products organized by biological function, using curated protein
family and subfamily classification. Nucleic Acids Res. 2003;31(1):334-41.
265. Li B, Krishnan VG, Mort ME, Xin F, Kamati KK, Cooper DN, et al. Automated
inference of molecular mechanisms of disease from amino acid substitutions.
Bioinformatics. 2009;25(21):2744-50.
266. Hicks S, Wheeler DA, Plon SE, Kimmel M. Prediction of missense mutation
functionality depends on both the algorithm and sequence alignment employed. Human
Mutation. 2011;32(6):661-8.
267. Lynch M, Katju V. The altered evolutionary trajectories of gene duplicates. Trends
Genet. 2004;20(11):544-9.
268. Aono S, Adachi Y, Uyama E, Yamada Y, Keino H, Nanno T, et al. Analysis of genes for
bilirubin UDP-glucuronosyltransferase in Gilbert's syndrome. Lancet.
1995;345(8955):958-9.
269. Sutomo R, Laosombat V, Sadewa AH, Yokoyama N, Nakamura H, Matsuo M, et al.
Novel missense mutation of the UGT1A1 gene in Thai siblings with Gilbert's syndrome.
Pediatr Int. 2002;44(4):427-32.
Referências
Carina de Fátima Rodrigues | 136
270. Costa E, Vieira E, Martins M, Saraiva J, Cancela E, Costa M, et al. Analysis of the UDP-
glucuronosyltransferase gene in Portuguese patients with a clinical diagnosis of Gilbert and
Crigler-Najjar syndromes. Blood Cells Mol Dis. 2006;36(1):91-7.
271. Hicks S, Wheeler DA, Plon SE, Kimmel M. Prediction of missense mutation
functionality depends on both the algorithm and sequence alignment employed. Hum
Mutat. 2011;32(6):661-8.
272. Calabrese R, Capriotti E, Fariselli P, Martelli PL, Casadio R. Functional annotations
improve the predictive score of human disease-related mutations in proteins. Hum Mutat.
2009;30(8):1237-44.
273. Capriotti E, Calabrese R, Casadio R. Predicting the insurgence of human genetic
diseases associated to single point protein mutations with support vector machines and
evolutionary information. Bioinformatics. 2006;22(22):2729-34.
274. Reva B, Antipin Y, Sander C. Predicting the functional impact of protein mutations:
application to cancer genomics. Nucleic Acids Res. 2011;39(17):e118.
275. Bromberg Y, Rost B. SNAP: predict effect of non-synonymous polymorphisms on
function. Nucleic Acids Res. 2007;35(11):3823-35.
276. Acharya V, Nagarajaram HA. Hansa: An automated method for discriminating
disease and neutral human nsSNPs. Human Mutation. 2012;33(2):332-7.
277. Shihab HA, Gough J, Cooper DN, Stenson PD, Barker GL, Edwards KJ, et al.
Predicting the functional, molecular, and phenotypic consequences of amino acid
substitutions using hidden Markov models. Hum Mutat. 2013;34(1):57-65.
278. Goresky CA, Gordon ER, Shaffer EA, Pare P, Carassavas D, Aronoff A. Definition of a
conjugation of dysfunction in Gilbert's syndrome: studies of the handling of bilirubin loads
and of the pattern of bilirubin conjugates secreted in bile. Clin Sci Mol Med. 1978;55(1):63-
71.
279. Teich N, Lehmann I, Rosendahl J, Troltzsch M, Mossner J, Schiefke I. The inverse
starving test is not a suitable provocation test for Gilbert's syndrome. BMC Res Notes.
2008;1:35.
Referências
Carina de Fátima Rodrigues | 137
280. Van Hoydonck PG, Temme EH, Schouten EG. Serum bilirubin concentration in a
Belgian population: the association with smoking status and type of cigarettes. Int J
Epidemiol. 2001;30(6):1465-72.
281. Shaper AG, Pocock SJ, Ashby D, Walker M, Whitehead TP. Biochemical and
haematological response to alcohol intake. Ann Clin Biochem. 1985;22 ( Pt 1):50-61.
282. Chan-Yeung M, Ferreira P, Frohlich J, Schulzer M, Tan F. The effects of age, smoking,
and alcohol on routine laboratory tests. Am J Clin Pathol. 1981;75(3):320-6.
283. Ebele IJ EN, Ignatius MC, Peace NU, Ebele E. Effects of Duration of Use of Hormonal
Contraceptives on Liver Function. Research Journal of Medical Sciences. 2009;3(2):4.
284. Hopkins PN, Wu LL, Hunt SC, James BC, Vincent GM, Williams RR. Higher serum
bilirubin is associated with decreased risk for early familial coronary artery disease.
Arterioscler Thromb Vasc Biol. 1996;16(2):250-5.
285. Pimenta HB, Caldeira AP. [Cardiovascular risk factors on the Framingham Risk Score
among hypertensive patients attended by family health teams.]. Cien Saude Colet.
2014;19(6):1731-9.
286. Galili O, Versari D, Sattler KJ, Olson ML, Mannheim D, McConnell JP, et al. Early
experimental obesity is associated with coronary endothelial dysfunction and oxidative
stress. Am J Physiol Heart Circ Physiol. 2007;292(2):H904-11.
287. Lopes C, Aro A, Azevedo A, Ramos E, Barros H. Intake and adipose tissue composition
of fatty acids and risk of myocardial infarction in a male Portuguese community sample. J
Am Diet Assoc. 2007;107(2):276-86.
288. Brandao MP, Pimentel FL, Silva CC, Cardoso MF. Risk factors for cardiovascular
disease in a Portuguese university population. Rev Port Cardiol. 2008;27(1):7-25.
289. Garn SM, Smith NJ, Clark DC. Lifelong differences in hemoglobin levels between
Blacks and Whites. J Natl Med Assoc. 1975;67(2):91-6.
290. Djousse L, Levy D, Cupples LA, Evans JC, D'Agostino RB, Ellison RC. Total serum
bilirubin and risk of cardiovascular disease in the Framingham offspring study. Am J
Cardiol. 2001;87(10):1196-200; A4, 7.
Referências
Carina de Fátima Rodrigues | 138
291. Shin HS, Jung YS, Rim H. Relationship of serum bilirubin concentration to kidney
function and 24-hour urine protein in Korean adults. BMC Nephrol. 2011;12:29.
292. Sarnak MJ, Tighiouart H, Manjunath G, MacLeod B, Griffith J, Salem D, et al. Anemia
as a risk factor for cardiovascular disease in The Atherosclerosis Risk in Communities
(ARIC) study. J Am Coll Cardiol. 2002;40(1):27-33.
293. Amin MG, Tighiouart H, Weiner DE, Stark PC, Griffith JL, MacLeod B, et al.
Hematocrit and left ventricular mass: the Framingham Heart study. J Am Coll Cardiol.
2004;43(7):1276-82.
294. Zadrazil J, Horak P. Pathophysiology of anemia in chronic kidney diseases. A review.
Biomed Pap Med Fac Univ Palacky Olomouc Czech Repub. 2014.
295. Dikow R, Schwenger V, Schomig M, Ritz E. How should we manage anaemia in
patients with diabetes? Nephrol Dial Transplant. 2002;17 Suppl 1:67-72.
296. Caro JJ, Salas M, Ward A, Goss G. Anemia as an independent prognostic factor for
survival in patients with cancer: a systemic, quantitative review. Cancer. 2001;91(12):2214-
21.
297. Volkova N, Arab L. Evidence-based systematic literature review of
hemoglobin/hematocrit and all-cause mortality in dialysis patients. Am J Kidney Dis.
2006;47(1):24-36.
298. Kundur AR, Bulmer AC, Singh I. Unconjugated bilirubin inhibits collagen induced
platelet activation. Platelets. 2014;25(1):45-50.
299. Lindenblatt N, Bordel R, Schareck W, Menger MD, Vollmar B. Vascular heme
oxygenase-1 induction suppresses microvascular thrombus formation in vivo. Arterioscler
Thromb Vasc Biol. 2004;24(3):601-6.
300. Giral P, Ratziu V, Couvert P, Carrie A, Kontush A, Girerd X, et al. Plasma bilirubin and
gamma-glutamyltransferase activity are inversely related in dyslipidemic patients with
metabolic syndrome: relevance to oxidative stress. Atherosclerosis. 2010;210(2):607-13.
301. Han SS, Na KY, Chae DW, Kim YS, Kim S, Chin HJ. High serum bilirubin is associated
with the reduced risk of diabetes mellitus and diabetic nephropathy. Tohoku J Exp Med.
2010;221(2):133-40.
Referências
Carina de Fátima Rodrigues | 139
302. Hwang HJ, Kim SH. Inverse relationship between fasting direct bilirubin and
metabolic syndrome in Korean adults. Clin Chim Acta. 2010;411(19-20):1496-501.
303. De Mattia G, Bravi MC, Laurenti O, Moretti A, Cipriani R, Gatti A, et al. Endothelial
dysfunction and oxidative stress in type 1 and type 2 diabetic patients without clinical
macrovascular complications. Diabetes Res Clin Pract. 2008;79(2):337-42.
304. Ndisang JF, Lane N, Jadhav A. The heme oxygenase system abates hyperglycemia in
Zucker diabetic fatty rats by potentiating insulin-sensitizing pathways. Endocrinology.
2009;150(5):2098-108.
305. Odievre M. [Free fatty acids and metabolism of bilirubin]. Biol Gastroenterol (Paris).
1975;8(2):93-8.
306. Cowan RE, Thompson RP, Kaye JP, Hall RJ. Plasma bilirubin and serum free fatty
acids after myocardial infarction. Postgrad Med J. 1981;57(663):9-12.
307. Borucki K, Weikert C, Fisher E, Jakubiczka S, Luley C, Westphal S, et al. Haplotypes
in the UGT1A1 gene and their role as genetic determinants of bilirubin concentration in
healthy German volunteers. Clin Biochem. 2009;42(16-17):1635-41.
308. Bosma PJ, van der Meer IM, Bakker CT, Hofman A, Paul-Abrahamse M, Witteman
JC. UGT1A1*28 allele and coronary heart disease: the Rotterdam Study. Clin Chem.
2003;49(7):1180-1.
309. Gajdos V, Petit FM, Perret C, Mollet-Boudjemline A, Colin P, Capel L, et al. Further
evidence that the UGT1A1*28 allele is not associated with coronary heart disease: The
ECTIM Study. Clin Chem. 2006;52(12):2313-4.
310. Era S, Kuwata K, Imai H, Nakamura K, Hayashi T, Sogami M. Age-related change in
redox state of human serum albumin. Biochim Biophys Acta. 1995;1247(1):12-6.
311. Rodrigues CM, Sola S, Brito MA, Brites D, Moura JJ. Bilirubin directly disrupts
membrane lipid polarity and fluidity, protein order, and redox status in rat mitochondria. J
Hepatol. 2002;36(3):335-41.
312. Low PS. Role of hemoglobin denaturation and band 3 clustering in initiating red cell
removal. Adv Exp Med Biol. 1991;307:173-83.
Referências
Carina de Fátima Rodrigues | 140
313. Rocha S, Costa E, Rocha-Pereira P, Ferreira F, Cleto E, Barbot J, et al. Erythrocyte
membrane protein destabilization versus clinical outcome in 160 Portuguese Hereditary
Spherocytosis patients. Br J Haematol. 2010;149(5):785-94.
314. Rocha-Pereira P, Santos-Silva A, Rebelo I, Figueiredo A, Quintanilha A, Teixeira F.
The inflammatory response in mild and in severe psoriasis. Br J Dermatol.
2004;150(5):917-28.
315. Belo L, Rebelo I, Castro EM, Catarino C, Pereira-Leite L, Quintanilha A, et al. Band 3
as a marker of erythrocyte changes in pregnancy. Eur J Haematol. 2002;69(3):145-51.
316. Santos-Silva A, Castro EM, Teixeira NA, Guerra FC, Quintanilha A. Erythrocyte
membrane band 3 profile imposed by cellular aging, by activated neutrophils and by
neutrophilic elastase. Clin Chim Acta. 1998;275(2):185-96.
317. Nag N, Halder S, Chaudhuri R, Adhikary S, Mazumder S. Role of bilirubin as
antioxidant in neonatal jaundice and effect of ethanolic extract of sweet lime peel on
experimentally induced jaundice in rat. Indian J Biochem Biophys. 2009;46(1):73-8.
318. Sedlak TW, Saleh M, Higginson DS, Paul BD, Juluri KR, Snyder SH. Bilirubin and
glutathione have complementary antioxidant and cytoprotective roles. Proc Natl Acad Sci
U S A. 2009;106(13):5171-6.
319. Matsui K, Maruo Y, Sato H, Takeuchi Y. Combined effect of regulatory polymorphisms
on transcription of UGT1A1 as a cause of Gilbert syndrome. BMC Gastroenterol. 2010;10:57.
320. Jirsa M, Petrasek J, Vitek L. Linkage between A(TA)7TAA and -3279T>G mutations
in UGT1A1 is not essential for pathogenesis of Gilbert syndrome. Liver Int.
2006;26(10):1302-3.
321. Costa E, Vieira E, Santos-Silva E, Barbot J, dos Santos R. TATA-Box polymorphism
in the uridine diphosphate glucuronosyl transferase gene in Portuguese patients with
clinical diagnosis of Gilbert Syndrome. Haematologica. 2002;87(4):ELT21.
322. Almond A, Axelsen JB. Physical interpretation of residual dipolar couplings in neutral
aligned media. J Am Chem Soc. 2002;124(34):9986-7.
323. Madhavan M, Wattigney WA, Srinivasan SR, Berenson GS. Serum bilirubin
distribution and its relation to cardiovascular risk in children and young adults.
Atherosclerosis. 1997;131(1):107-13.
Referências
Carina de Fátima Rodrigues | 141
324. Oda S, Fukami T, Yokoi T, Nakajima M. Epigenetic regulation is a crucial factor in the
repression of UGT1A1 expression in the human kidney. Drug Metab Dispos.
2013;41(10):1738-43.
325. Iolascon A, Copola A, B R. Crigler-Najjar syndrome type II resulting from three
different mutations in the bilirubin uridine 5′-diphosphate-glucuronosyltransferase
(UGT1A1) gene. Journal of Medical Genetics. 2000;37(9):712-3.
326. Petit F, Gajdos V, Capel L, Parisot F, Myara A, Francoual J, et al. Crigler–Najjar type
II syndrome may result from several types and combinations of mutations in the UGT1A1
gene. Clinical Genetics. 2006;69(6):525-7.
327. Skierka JM, Kotzer KE, Lagerstedt SA, O'Kane DJ, Baudhuin LM. UGT1A1 Genetic
Analysis as a Diagnostic Aid for Individuals with Unconjugated Hyperbilirubinemia. J
Pediatr. 2013.
328. Seppen J, Steenken E, Lindhout D, Bosma PJ, Elferink RP. A mutation which disrupts
the hydrophobic core of the signal peptide of bilirubin UDP-glucuronosyltransferase, an
endoplasmic reticulum membrane protein, causes Crigler-Najjar type II. FEBS Lett.
1996;390(3):294-8.
329. Servedio V, d'Apolito M, Maiorano N, Minuti B, Torricelli F, Ronchi F, et al. Spectrum
of UGT1A1 mutations in Crigler-Najjar (CN) syndrome patients: identification of twelve
novel alleles and genotype-phenotype correlation. Human Mutation. 2005;25(3):325-.
330. Kadakol A, Ghosh SS, Sappal BS, Sharma G, Chowdhury JR, Chowdhury NR. Genetic
lesions of bilirubin uridine-diphosphoglucuronate glucuronosyltransferase (UGT1A1)
causing Crigler-Najjar and Gilbert syndromes: Correlation of genotype to phenotype.
Human Mutation. 2000;16(4):297-306.
331. Ciotti M, Chen F, Rubaltelli FF, Owens IS. Coding defect and a TATA box mutation at
the bilirubin UDP-glucuronosyltransferase gene cause Crigler-Najjar type I disease.
Biochim Biophys Acta. 1998;1407(1):40-50.
332. Rodrigues C, Vieira E, Santos R, de Carvalho J, Santos-Silva A, Costa E, et al. Impact
of UGT1A1 gene variants on total bilirubin levels in Gilbert syndrome patients and in healthy
subjects. Blood Cells Mol Dis. 2012;48(3):166-72.
Referências
Carina de Fátima Rodrigues | 142
333. Huang CS, Tan N, Yang SS, Sung YC, Huang MJ. Crigler-Najjar syndrome type 2. J
Formos Med Assoc. 2006;105(11):950-3.
334. Aono S, Yamada Y, Keino H, Hanada N, Nakagawa T, Sasaoka Y, et al. Identification
of defect in the genes for bilirubin UDP-glucuronosyl-transferase in a patient with Crigler-
Najjar syndrome type II. Biochem Biophys Res Commun. 1993;197(3):1239-44.
335. Gagne JF, Montminy V, Belanger P, Journault K, Gaucher G, Guillemette C. Common
human UGT1A polymorphisms and the altered metabolism of irinotecan active metabolite
7-ethyl-10-hydroxycamptothecin (SN-38). Mol Pharmacol. 2002;62(3):608-17.
336. D'Apolito M, Marrone A, Servedio V, Vajro P, De Falco L, Iolascon A. Seven novel
mutations of the UGT1A1 gene in patients with unconjugated hyperbilirubinemia.
Haematologica. 2007;92(1):133-4.
337. Skierka JM, Kotzer KE, Lagerstedt SA, O'Kane DJ, Baudhuin LM. UGT1A1 genetic
analysis as a diagnostic aid for individuals with unconjugated hyperbilirubinemia. J Pediatr.
2013;162(6):1146-52, 52 e1-2.
338. Labrune P, Myara A, Hadchouel M, Ronchi F, Bernard O, Trivin F, et al. Genetic
heterogeneity of Crigler-Najjar syndrome type I: a study of 14 cases. Hum Genet.
1994;94(6):693-7.
339. Erps LT, Ritter JK, Hersh JH, Blossom D, Martin NC, Owens IS. Identification of two
single base substitutions in the UGT1 gene locus which abolish bilirubin uridine
diphosphate glucuronosyltransferase activity in vitro. J Clin Invest. 1994;93(2):564-70.
340. Ciotti M, Werlin SL, Owens IS. Delayed response to phenobarbital treatment of a
Crigler-Najjar type II patient with partially inactivating missense mutations in the bilirubin
UDP-glucuronosyltransferase gene. J Pediatr Gastroenterol Nutr. 1999;28(2):210-3.
341. Farheen S, Sengupta S, Santra A, Pal S, Dhali GK, Chakravorty M, et al. Gilbert's
syndrome: High frequency of the (TA)7 TAA allele in India and its interaction with a novel
CAT insertion in promoter of the gene for bilirubin UDP-glucuronosyltransferase 1 gene.
World J Gastroenterol. 2006;12(14):2269-75.
342. Moghrabi N, Clarke DJ, Boxer M, Burchell B. Identification of an A-to-G missense
mutation in exon 2 of the UGT1 gene complex that causes Crigler-Najjar syndrome type 2.
Genomics. 1993;18(1):171-3.
Referências
Carina de Fátima Rodrigues | 143
343. Kaniwa N, Kurose K, Jinno H, Tanaka-Kagawa T, Saito Y, Saeki M, et al. Racial
variability in haplotype frequencies of UGT1A1 and glucuronidation activity of a novel single
nucleotide polymorphism 686C> T (P229L) found in an African-American. Drug Metab
Dispos. 2005;33(3):458-65.
344. Passuello V, Puhl AG, Wirth S, Steiner E, Skala C, Koelbl H, et al. Pregnancy outcome
in maternal Crigler-Najjar syndrome type II: a case report and systematic review of the
literature. Fetal Diagn Ther. 2009;26(3):121-6.
345. Bosma PJ, Chowdhury JR, Huang TJ, Lahiri P, Elferink RP, Van Es HH, et al.
Mechanisms of inherited deficiencies of multiple UDP-glucuronosyltransferase isoforms in
two patients with Crigler-Najjar syndrome, type I. FASEB J. 1992;6(10):2859-63.
346. Ciotti M, Obaray R, Martin MG, Owens IS. Genetic defects at the UGT1 locus
associated with Crigler-Najjar type I disease, including a prenatal diagnosis. Am J Med
Genet. 1997;68(2):173-8.
347. Chalasani N, Chowdhury NR, Chowdhury JR, Boyer TD. Kernicterus in an adult who
is heterozygous for Crigler-Najjar syndrome and homozygous for Gilbert-type genetic
defect. Gastroenterology. 1997;112(6):2099-103.
348. Maruo Y, Nishizawa K, Sato H, Sawa H, Shimada M. Prolonged unconjugated
hyperbilirubinemia associated with breast milk and mutations of the bilirubin uridine
diphosphate- glucuronosyltransferase gene. Pediatrics. 2000;106(5):E59.

Carina de Fátima Rodrigues | 144

Carina de Fátima Rodrigues | 145
ANEXOS
_____________________________________________________________

Anexos
Carina de Fátima Rodrigues | 146
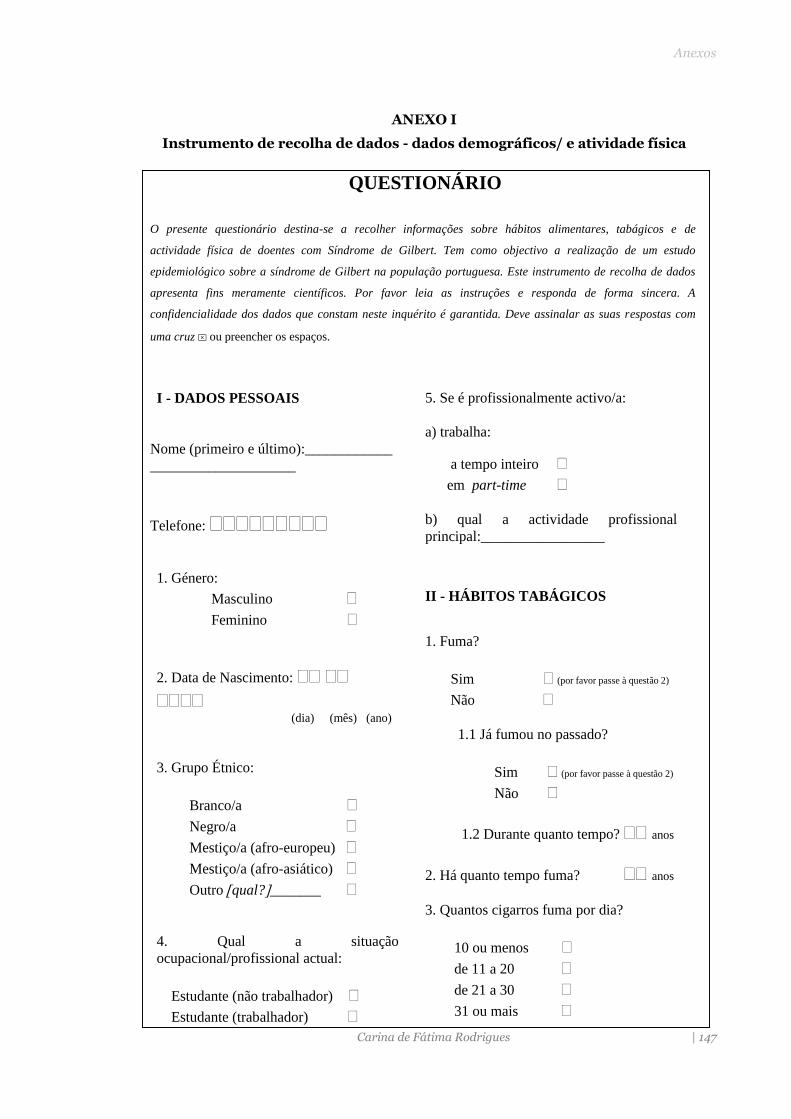
Anexos
Carina de Fátima Rodrigues | 147
ANEXO I
Instrumento de recolha de dados - dados demográficos/ e atividade física
QUESTIONÁRIO
O presente questionário destina-se a recolher informações sobre hábitos alimentares, tabágicos e de
actividade física de doentes com Síndrome de Gilbert. Tem como objectivo a realização de um estudo
epidemiológico sobre a síndrome de Gilbert na população portuguesa. Este instrumento de recolha de dados
apresenta fins meramente científicos. Por favor leia as instruções e responda de forma sincera. A
confidencialidade dos dados que constam neste inquérito é garantida. Deve assinalar as suas respostas com
uma cruz ⌧ ou preencher os espaços.
I - DADOS PESSOAIS
Nome (primeiro e último):____________
____________________
Telefone:
1. Género:
Masculino
Feminino
2. Data de Nascimento:
(dia) (mês) (ano)
3. Grupo Étnico:
Branco/a
Negro/a
Mestiço/a (afro-europeu)
Mestiço/a (afro-asiático)
Outro qual?_______
4. Qual a situação
ocupacional/profissional actual:
Estudante (não trabalhador)
Estudante (trabalhador)
5. Se é profissionalmente activo/a:
a) trabalha:
a tempo inteiro
em part-time
b) qual a actividade profissional
principal:_________________
II - HÁBITOS TABÁGICOS
1. Fuma?
Sim (por favor passe à questão 2)
Não
1.1 Já fumou no passado?
Sim (por favor passe à questão 2)
Não
1.2 Durante quanto tempo? anos
2. Há quanto tempo fuma? anos
3. Quantos cigarros fuma por dia?
10 ou menos
de 11 a 20
de 21 a 30
31 ou mais
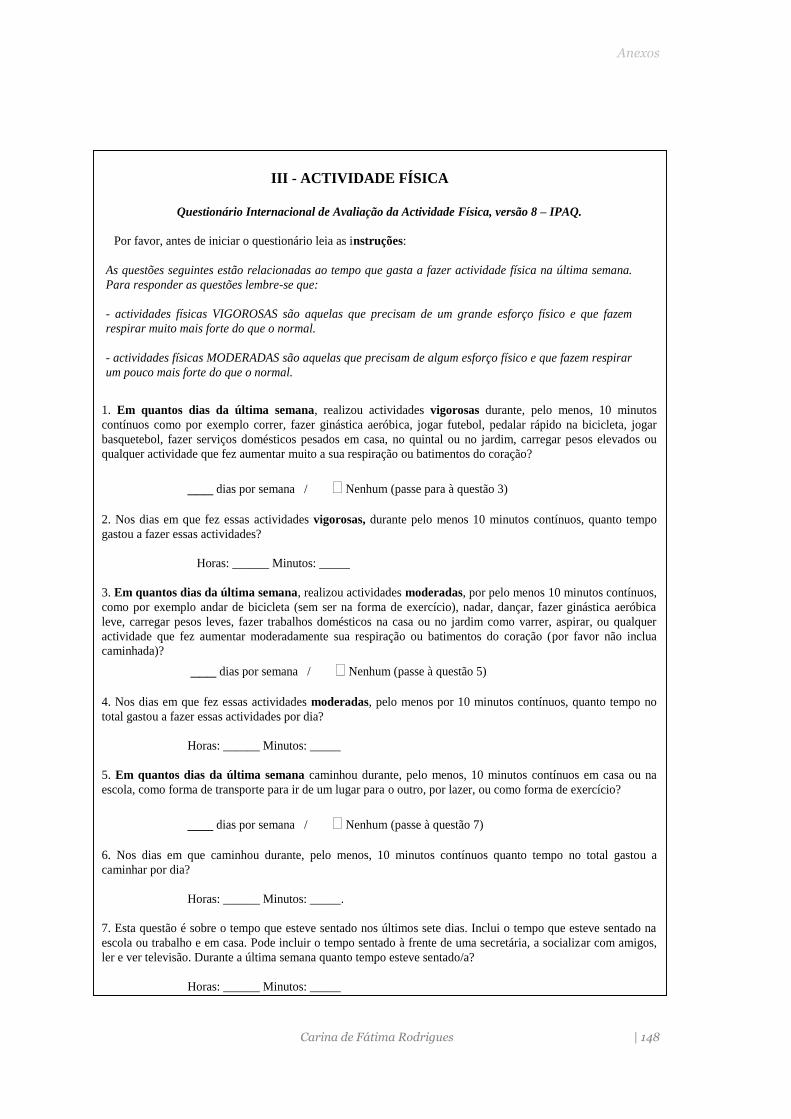
Anexos
Carina de Fátima Rodrigues | 148
III - ACTIVIDADE FÍSICA
Questionário Internacional de Avaliação da Actividade Física, versão 8 – IPAQ.
Por favor, antes de iniciar o questionário leia as instruções:
As questões seguintes estão relacionadas ao tempo que gasta a fazer actividade física na última semana.
Para responder as questões lembre-se que:
- actividades físicas VIGOROSAS são aquelas que precisam de um grande esforço físico e que fazem
respirar muito mais forte do que o normal.
- actividades físicas MODERADAS são aquelas que precisam de algum esforço físico e que fazem respirar
um pouco mais forte do que o normal.
1. Em quantos dias da última semana, realizou actividades vigorosas durante, pelo menos, 10 minutos
contínuos como por exemplo correr, fazer ginástica aeróbica, jogar futebol, pedalar rápido na bicicleta, jogar
basquetebol, fazer serviços domésticos pesados em casa, no quintal ou no jardim, carregar pesos elevados ou
qualquer actividade que fez aumentar muito a sua respiração ou batimentos do coração?
___ dias por semana / Nenhum (passe para à questão 3)
2. Nos dias em que fez essas actividades vigorosas, durante pelo menos 10 minutos contínuos, quanto tempo
gastou a fazer essas actividades?
Horas: ______ Minutos: _____
3. Em quantos dias da última semana, realizou actividades moderadas, por pelo menos 10 minutos contínuos,
como por exemplo andar de bicicleta (sem ser na forma de exercício), nadar, dançar, fazer ginástica aeróbica
leve, carregar pesos leves, fazer trabalhos domésticos na casa ou no jardim como varrer, aspirar, ou qualquer
actividade que fez aumentar moderadamente sua respiração ou batimentos do coração (por favor não inclua
caminhada)?
___ dias por semana / Nenhum (passe à questão 5)
4. Nos dias em que fez essas actividades moderadas, pelo menos por 10 minutos contínuos, quanto tempo no
total gastou a fazer essas actividades por dia?
Horas: ______ Minutos: _____
5. Em quantos dias da última semana caminhou durante, pelo menos, 10 minutos contínuos em casa ou na
escola, como forma de transporte para ir de um lugar para o outro, por lazer, ou como forma de exercício?
___ dias por semana / Nenhum (passe à questão 7)
6. Nos dias em que caminhou durante, pelo menos, 10 minutos contínuos quanto tempo no total gastou a
caminhar por dia?
Horas: ______ Minutos: _____.
7. Esta questão é sobre o tempo que esteve sentado nos últimos sete dias. Inclui o tempo que esteve sentado na
escola ou trabalho e em casa. Pode incluir o tempo sentado à frente de uma secretária, a socializar com amigos,
ler e ver televisão. Durante a última semana quanto tempo esteve sentado/a?
Horas: ______ Minutos: _____
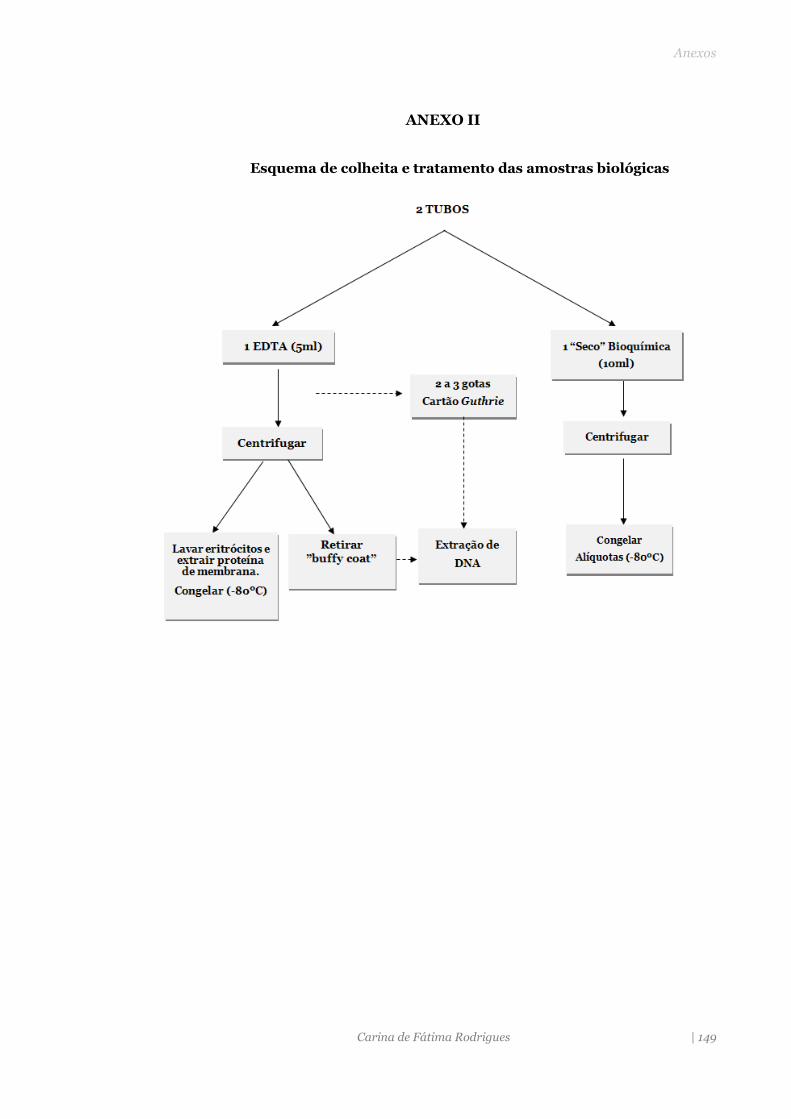
Anexos
Carina de Fátima Rodrigues | 149
ANEXO II
Esquema de colheita e tratamento das amostras biológicas
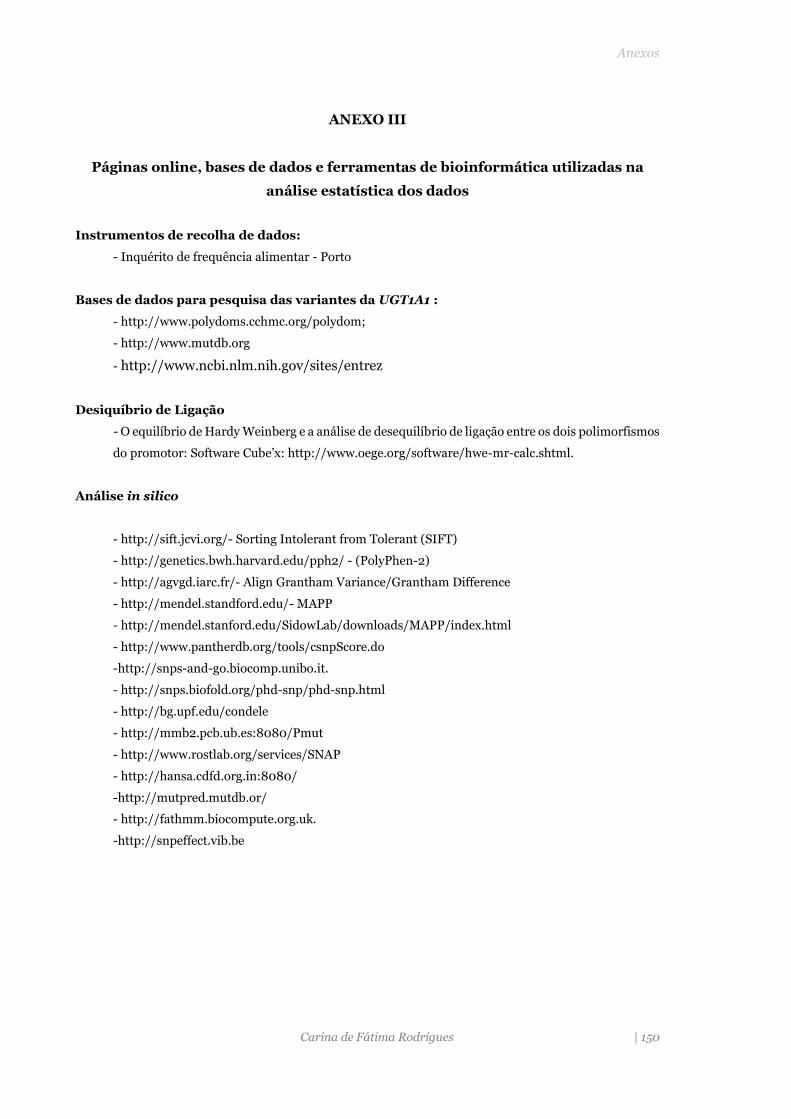
Anexos
Carina de Fátima Rodrigues | 150
ANEXO III
Páginas online, bases de dados e ferramentas de bioinformática utilizadas na
análise estatística dos dados
Instrumentos de recolha de dados:
- Inquérito de frequência alimentar - Porto
Bases de dados para pesquisa das variantes da UGT1A1 :
- http://www.polydoms.cchmc.org/polydom;
- http://www.mutdb.org
- http://www.ncbi.nlm.nih.gov/sites/entrez
Desiquíbrio de Ligação
- O equilíbrio de Hardy Weinberg e a análise de desequilíbrio de ligação entre os dois polimorfismos
do promotor: Software Cube’x: http://www.oege.org/software/hwe-mr-calc.shtml.
Análise in silico
- http://sift.jcvi.org/- Sorting Intolerant from Tolerant (SIFT)
- http://genetics.bwh.harvard.edu/pph2/ - (PolyPhen-2)
- http://agvgd.iarc.fr/- Align Grantham Variance/Grantham Difference
- http://mendel.standford.edu/- MAPP
- http://mendel.stanford.edu/SidowLab/downloads/MAPP/index.html
- http://www.pantherdb.org/tools/csnpScore.do
-http://snps-and-go.biocomp.unibo.it.
- http://snps.biofold.org/phd-snp/phd-snp.html
- http://bg.upf.edu/condele
- http://mmb2.pcb.ub.es:8080/Pmut
- http://www.rostlab.org/services/SNAP
- http://hansa.cdfd.org.in:8080/
-http://mutpred.mutdb.or/
- http://fathmm.biocompute.org.uk.
-http://snpeffect.vib.be
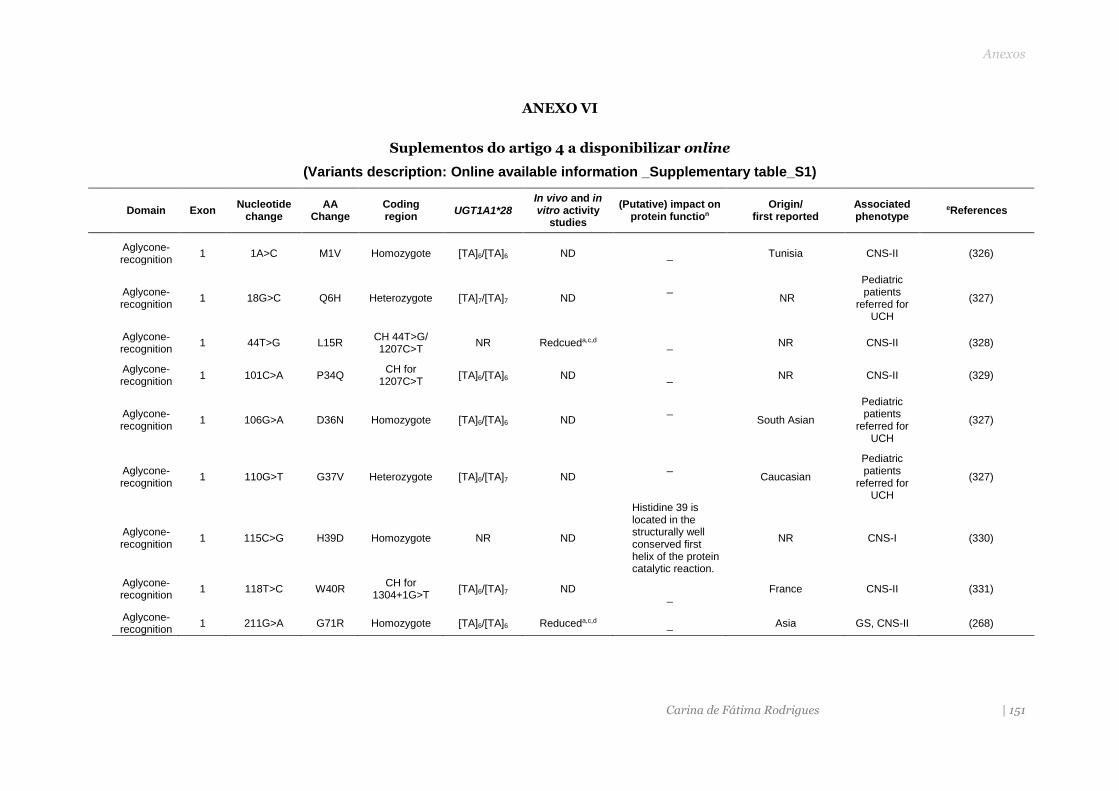
Anexos
Carina de Fátima Rodrigues | 151
ANEXO VI
Suplementos do artigo 4 a disponibilizar online
(Variants description: Online available information _Supplementary table_S1)
Domain Exon Nucleotide
change AA
Change Coding region
UGT1A1*28 In vivo and in vitro activity
studies
(Putative) impact on protein function
Origin/ first reported
Associated phenotype
eReferences
Aglycone-recognition
1 1A>C M1V Homozygote [TA]6/[TA]6 ND _ Tunisia CNS-II (326)
Aglycone-recognition
1 18G>C Q6H Heterozygote [TA]7/[TA]7 ND _
NR
Pediatric patients
referred for UCH
(327)
Aglycone-recognition
1 44T>G L15R CH 44T>G/ 1207C>T
NR Redcueda,c,d _ NR CNS-II (328)
Aglycone-recognition
1 101C>A P34Q CH for
1207C>T [TA]6/[TA]6 ND _ NR CNS-II (329)
Aglycone-recognition
1 106G>A D36N Homozygote [TA]6/[TA]6 ND _
South Asian
Pediatric patients
referred for UCH
(327)
Aglycone-recognition
1 110G>T G37V Heterozygote [TA]6/[TA]7 ND _
Caucasian
Pediatric patients
referred for UCH
(327)
Aglycone-recognition
1 115C>G H39D Homozygote NR ND
Histidine 39 is located in the structurally well conserved first helix of the protein catalytic reaction.
NR CNS-I (330)
Aglycone-recognition
1 118T>C W40R CH for
1304+1G>T [TA]6/[TA]7 ND
_ France CNS-II (331)
Aglycone-recognition
1 211G>A G71R Homozygote [TA]6/[TA]6 Reduceda,c,d _ Asia GS, CNS-II (268)
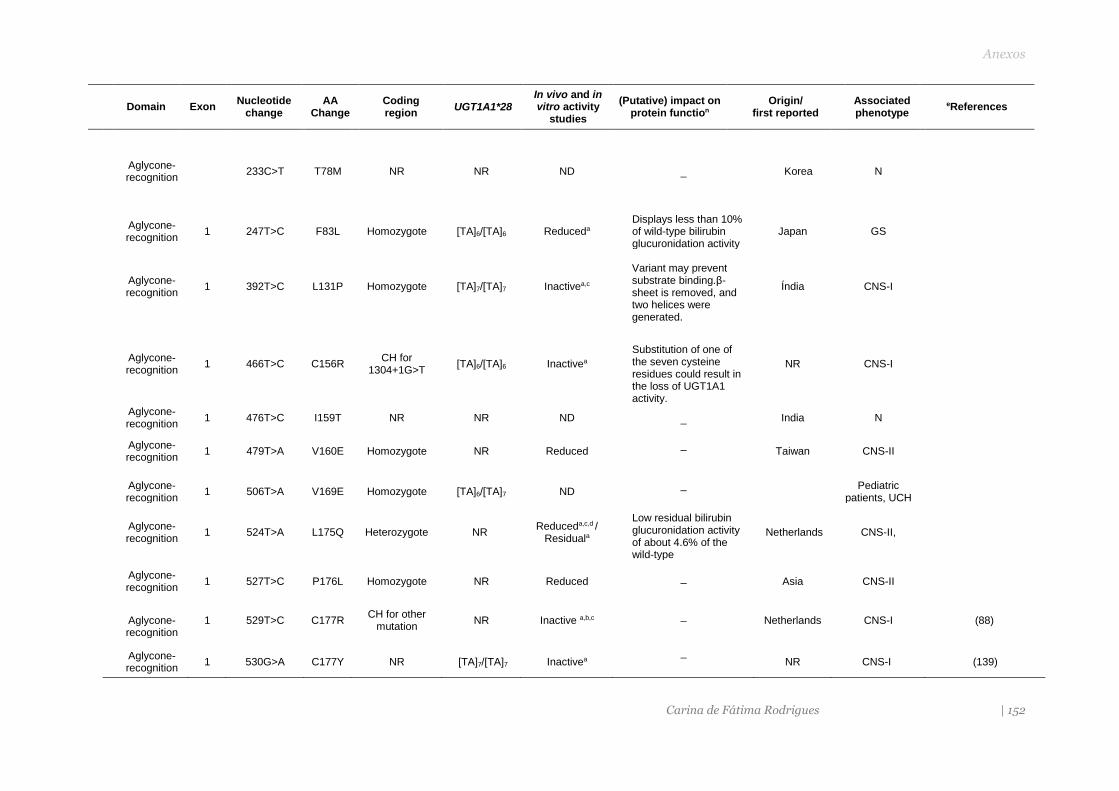
Anexos
Carina de Fátima Rodrigues | 152
Domain Exon Nucleotide
change AA
Change Coding region
UGT1A1*28 In vivo and in vitro activity
studies
(Putative) impact on protein function
Origin/ first reported
Associated phenotype
eReferences
Aglycone-recognition
233C>T T78M NR NR ND
_ Korea N
Aglycone-recognition
1 247T>C F83L Homozygote [TA]6/[TA]6 Reduceda Displays less than 10% of wild-type bilirubin glucuronidation activity
Japan GS
Aglycone-recognition
1 392T>C L131P Homozygote [TA]7/[TA]7 Inactivea,c
Variant may prevent substrate binding.β-sheet is removed, and two helices were generated.
Índia CNS-I
Aglycone-recognition
1 466T>C C156R CH for
1304+1G>T [TA]6/[TA]6 Inactivea
Substitution of one of the seven cysteine residues could result in the loss of UGT1A1 activity.
NR CNS-I
Aglycone-recognition
1 476T>C I159T NR NR ND _ India N
Aglycone-recognition
1 479T>A V160E Homozygote NR Reduced _
Taiwan CNS-II
Aglycone-recognition
1 506T>A V169E Homozygote [TA]6/[TA]7 ND _
Pediatric
patients, UCH
Aglycone-recognition
1 524T>A L175Q Heterozygote NR Reduceda,c,d /
Residuala
Low residual bilirubin glucuronidation activity of about 4.6% of the wild-type
Netherlands CNS-II,
Aglycone-recognition
1 527T>C P176L Homozygote NR Reduced _ Asia CNS-II
Aglycone-recognition
1 529T>C C177R CH for other
mutation NR Inactive a,b,c _ Netherlands CNS-I (88)
Aglycone-recognition
1 530G>A C177Y NR [TA]7/[TA]7 Inactivea _
NR CNS-I (139)
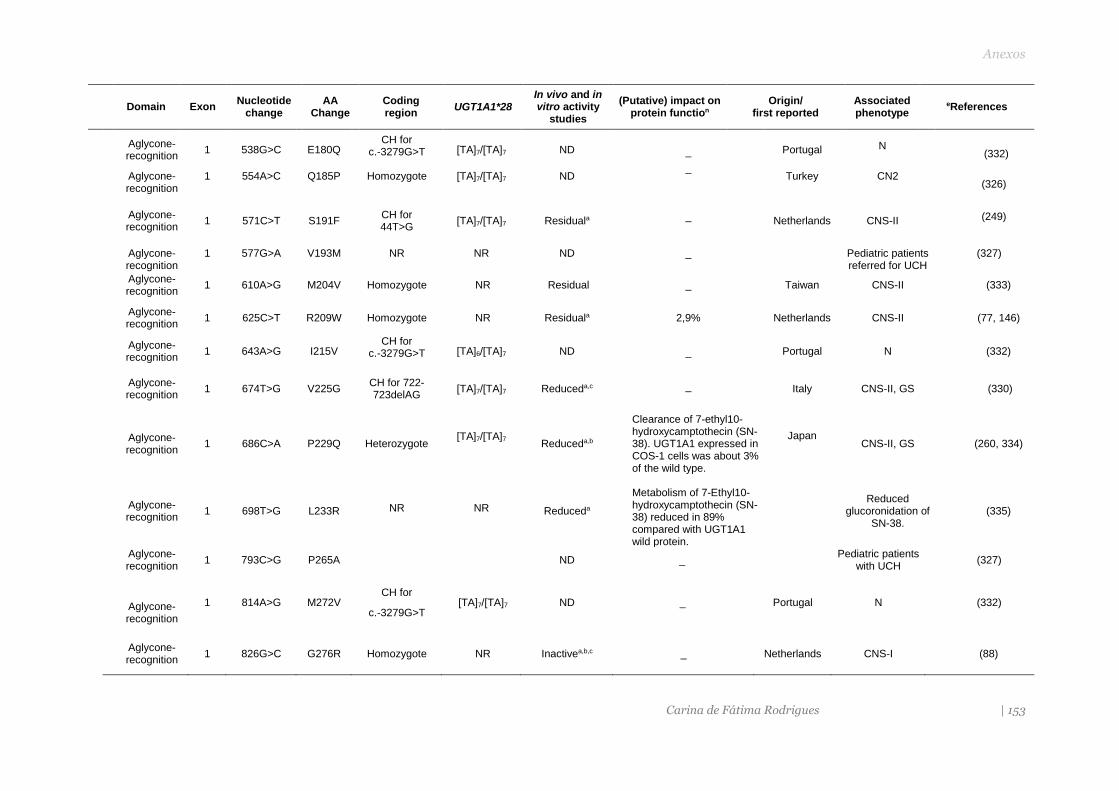
Anexos
Carina de Fátima Rodrigues | 153
Domain Exon Nucleotide
change AA
Change Coding region
UGT1A1*28 In vivo and in vitro activity
studies
(Putative) impact on protein function
Origin/ first reported
Associated phenotype
eReferences
Aglycone-recognition
1 538G>C E180Q CH for
c.-3279G>T [TA]7/[TA]7 ND _ Portugal N (332)
Aglycone-recognition
1 554A>C Q185P Homozygote [TA]7/[TA]7 ND _
Turkey CN2 (326)
Aglycone-recognition
1 571C>T S191F CH for 44T>G
[TA]7/[TA]7 Residuala _ Netherlands CNS-II (249)
Aglycone-recognition
1 577G>A V193M NR NR ND _ Pediatric patients referred for UCH
(327)
Aglycone-recognition
1 610A>G M204V Homozygote NR Residual _ Taiwan CNS-II (333)
Aglycone-recognition
1 625C>T R209W Homozygote NR Residuala 2,9% Netherlands CNS-II (77, 146)
Aglycone-recognition
1 643A>G I215V CH for
c.-3279G>T [TA]6/[TA]7 ND _ Portugal N (332)
Aglycone-recognition
1 674T>G V225G CH for 722-723delAG
[TA]7/[TA]7 Reduceda,c _ Italy CNS-II, GS (330)
Aglycone-recognition
1 686C>A P229Q Heterozygote [TA]7/[TA]7
Reduceda,b
Clearance of 7-ethyl10-hydroxycamptothecin (SN-38). UGT1A1 expressed in COS-1 cells was about 3% of the wild type.
Japan CNS-II, GS (260, 334)
Aglycone-recognition
1 698T>G L233R NR NR Reduceda
Metabolism of 7-Ethyl10-hydroxycamptothecin (SN-38) reduced in 89% compared with UGT1A1 wild protein.
Reduced
glucoronidation of SN-38.
(335)
Aglycone-recognition
1 793C>G P265A ND _ Pediatric patients with UCH
(327)
Aglycone-recognition
1 814A>G M272V CH for
c.-3279G>T [TA]7/[TA]7 ND _ Portugal N (332)
Aglycone-recognition
1 826G>C G276R Homozygote NR Inactivea,b,c _ Netherlands CNS-I (88)
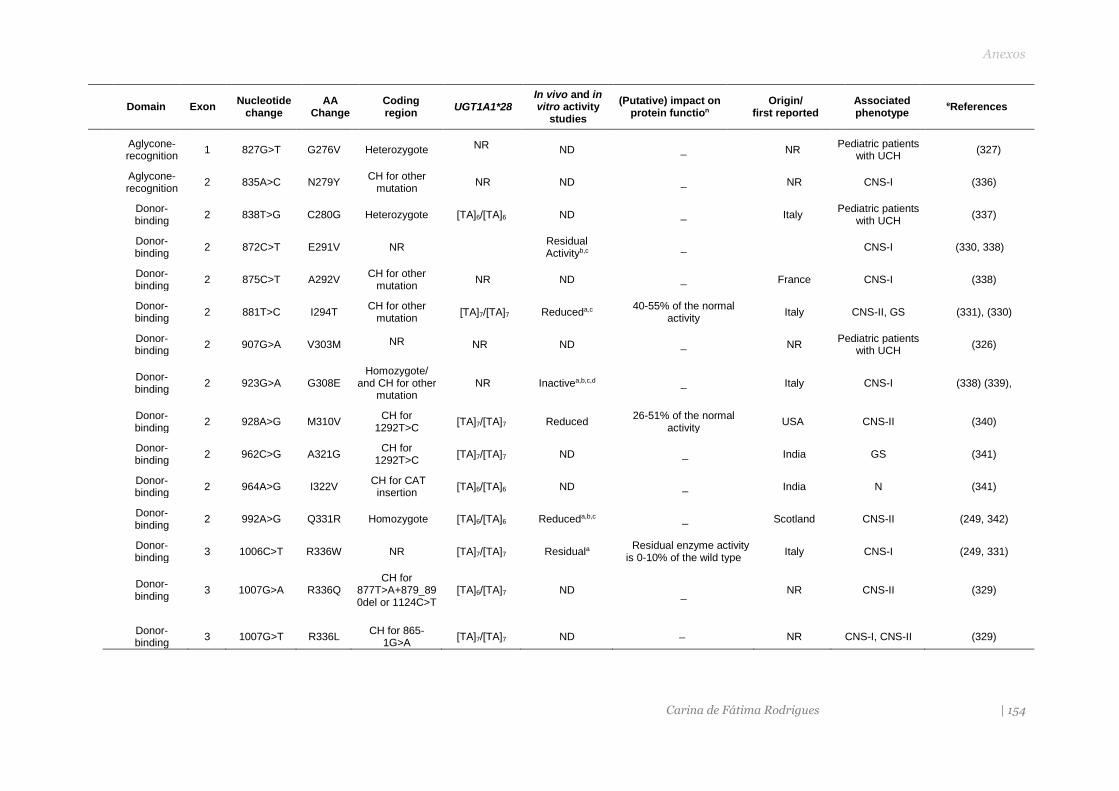
Anexos
Carina de Fátima Rodrigues | 154
Domain Exon Nucleotide
change AA
Change Coding region
UGT1A1*28 In vivo and in vitro activity
studies
(Putative) impact on protein function
Origin/ first reported
Associated phenotype
eReferences
Aglycone-recognition
1 827G>T G276V Heterozygote NR ND _ NR Pediatric patients
with UCH (327)
Aglycone-recognition
2 835A>C N279Y CH for other
mutation NR ND _ NR CNS-I (336)
Donor-binding
2 838T>G C280G Heterozygote [TA]6/[TA]6 ND _ Italy Pediatric patients
with UCH (337)
Donor-binding
2 872C>T E291V NR Residual Activityb,c
_ CNS-I (330, 338)
Donor-binding
2 875C>T A292V CH for other
mutation NR ND _ France CNS-I (338)
Donor-binding
2 881T>C I294T CH for other
mutation [TA]7/[TA]7 Reduceda,c
40-55% of the normal activity
Italy CNS-II, GS (331), (330)
Donor-binding
2 907G>A V303M NR NR ND _ NR Pediatric patients
with UCH (326)
Donor-binding
2 923G>A G308E Homozygote/
and CH for other mutation
NR Inactivea,b,c,d _ Italy CNS-I (338) (339),
Donor-binding
2 928A>G M310V CH for
1292T>C [TA]7/[TA]7 Reduced
26-51% of the normal activity
USA CNS-II (340)
Donor-binding
2 962C>G A321G CH for
1292T>C [TA]7/[TA]7 ND _ India GS (341)
Donor-binding
2 964A>G I322V CH for CAT
insertion [TA]6/[TA]6 ND _ India N (341)
Donor-binding
2 992A>G Q331R Homozygote [TA]6/[TA]6 Reduceda,b,c _ Scotland CNS-II (249, 342)
Donor-binding
3 1006C>T R336W NR [TA]7/[TA]7 Residuala Residual enzyme activity
is 0-10% of the wild type Italy CNS-I (249, 331)
Donor-binding
3 1007G>A R336Q CH for
877T>A+879_890del or 1124C>T
[TA]6/[TA]7 ND _ NR CNS-II (329)
Donor-binding
3 1007G>T R336L CH for 865-
1G>A [TA]7/[TA]7 ND _ NR CNS-I, CNS-II (329)
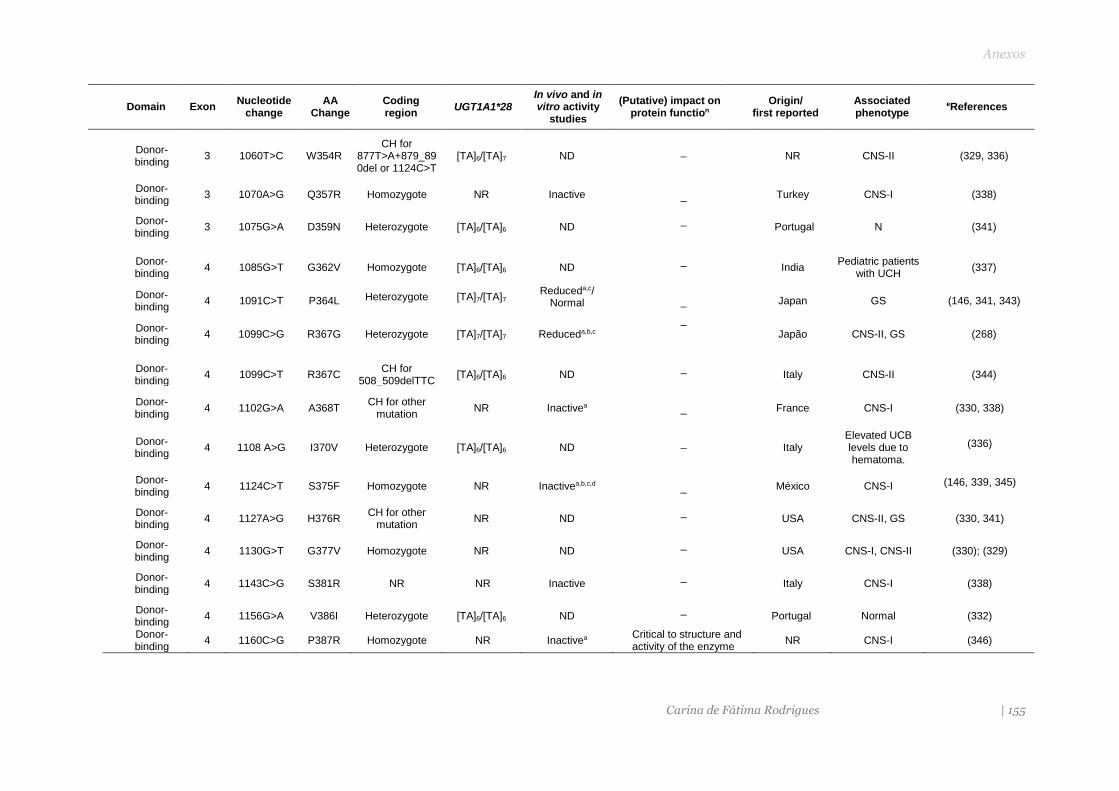
Anexos
Carina de Fátima Rodrigues | 155
Domain Exon Nucleotide
change AA
Change Coding region
UGT1A1*28 In vivo and in vitro activity
studies
(Putative) impact on protein function
Origin/ first reported
Associated phenotype
eReferences
Donor-binding
3 1060T>C W354R CH for
877T>A+879_890del or 1124C>T
[TA]6/[TA]7 ND _ NR CNS-II (329, 336)
Donor-binding
3 1070A>G Q357R Homozygote NR Inactive _ Turkey CNS-I (338)
Donor-binding
3 1075G>A D359N Heterozygote [TA]6/[TA]6 ND _
Portugal N (341)
Donor-binding
4 1085G>T G362V Homozygote [TA]6/[TA]6 ND _
India Pediatric patients
with UCH (337)
Donor-binding
4 1091C>T P364L Heterozygote [TA]7/[TA]7 Reduceda,c/
Normal _ Japan GS (146, 341, 343)
Donor-binding
4 1099C>G R367G Heterozygote [TA]7/[TA]7 Reduceda,b,c
_
Japão CNS-II, GS (268)
Donor-binding
4 1099C>T R367C CH for
508_509delTTC [TA]6/[TA]6 ND
_ Italy CNS-II (344)
Donor-binding
4 1102G>A A368T CH for other
mutation NR Inactivea _ France CNS-I (330, 338)
Donor-binding
4 1108 A>G I370V Heterozygote [TA]6/[TA]6 ND _ Italy Elevated UCB levels due to hematoma.
(336)
Donor-binding
4 1124C>T S375F Homozygote NR Inactivea,b,c,d _ México CNS-I (146, 339, 345)
Donor-binding
4 1127A>G H376R CH for other
mutation NR ND
_ USA CNS-II, GS (330, 341)
Donor-binding
4 1130G>T G377V Homozygote NR ND _
USA CNS-I, CNS-II (330); (329)
Donor-binding
4 1143C>G S381R NR NR Inactive _
Italy CNS-I (338)
Donor-binding
4 1156G>A V386I Heterozygote [TA]6/[TA]6 ND _
Portugal Normal (332)
Donor-binding
4 1160C>G P387R Homozygote NR Inactivea Critical to structure and activity of the enzyme
NR CNS-I (346)
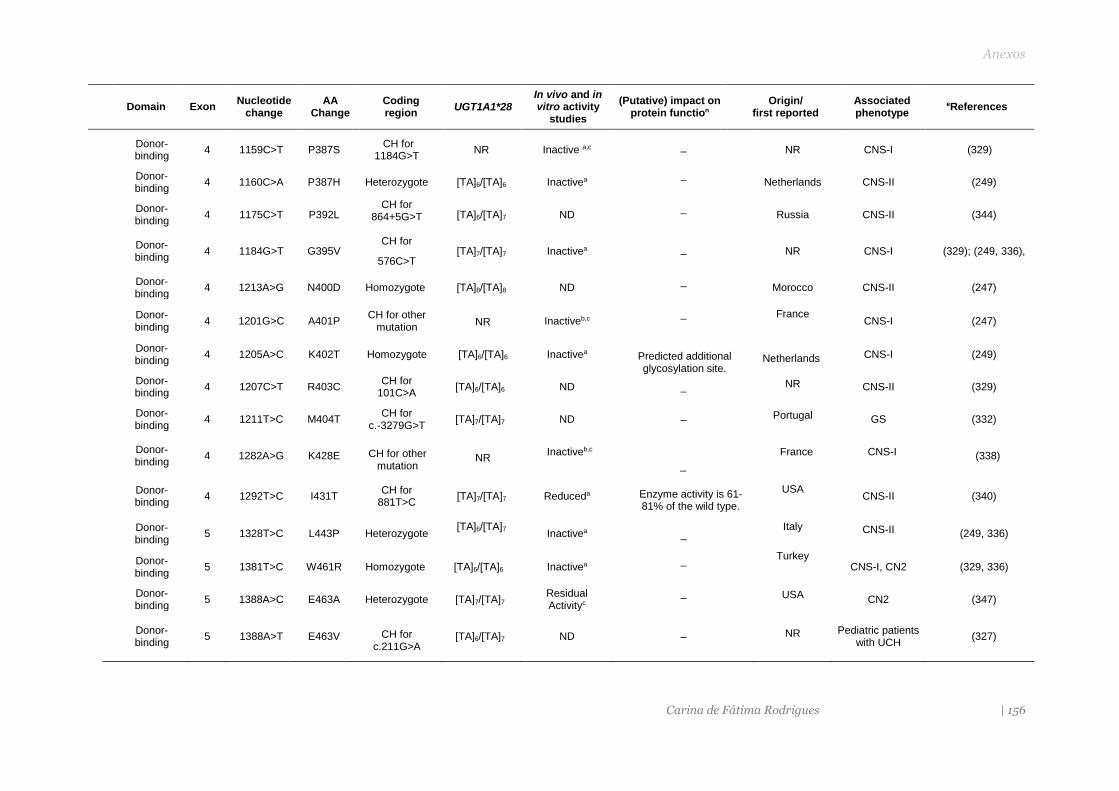
Anexos
Carina de Fátima Rodrigues | 156
Domain Exon Nucleotide
change AA
Change Coding region
UGT1A1*28 In vivo and in vitro activity
studies
(Putative) impact on protein function
Origin/ first reported
Associated phenotype
eReferences
Donor-binding
4 1159C>T P387S CH for
1184G>T NR Inactive a,c _ NR CNS-I (329)
Donor-binding
4 1160C>A P387H Heterozygote [TA]6/[TA]6 Inactivea _
Netherlands CNS-II (249)
Donor-binding
4 1175C>T P392L CH for
864+5G>T [TA]6/[TA]7 ND _
Russia CNS-II (344)
Donor-binding
4 1184G>T G395V CH for
576C>T [TA]7/[TA]7 Inactivea _ NR CNS-I (329); (249, 336),
Donor-binding
4 1213A>G N400D Homozygote [TA]8/[TA]8 ND _
Morocco CNS-II (247)
Donor-binding
4 1201G>C A401P CH for other
mutation NR Inactiveb,c
_ France CNS-I (247)
Donor-binding
4 1205A>C K402T Homozygote [TA]6/[TA]6 Inactivea Predicted additional glycosylation site.
Netherlands CNS-I (249)
Donor-binding
4 1207C>T R403C CH for
101C>A [TA]6/[TA]6 ND _ NR CNS-II (329)
Donor-binding
4 1211T>C M404T CH for
c.-3279G>T [TA]7/[TA]7 ND _ Portugal GS (332)
Donor-binding
4 1282A>G K428E CH for other mutation
NR Inactiveb,c
_
France CNS-I (338)
Donor-binding
4 1292T>C I431T CH for
881T>C [TA]7/[TA]7 Reduceda Enzyme activity is 61-
81% of the wild type.
USA CNS-II (340)
Donor-binding
5 1328T>C L443P Heterozygote [TA]6/[TA]7
Inactivea _ Italy CNS-II (249, 336)
Donor-binding
5 1381T>C W461R Homozygote [TA]6/[TA]6 Inactivea _ Turkey
CNS-I, CN2 (329, 336)
Donor-binding
5 1388A>C E463A Heterozygote [TA]7/[TA]7 Residual Activityc
_ USA CN2 (347)
Donor-binding
5 1388A>T E463V CH for c.211G>A
[TA]6/[TA]7 ND _ NR Pediatric patients with UCH
(327)
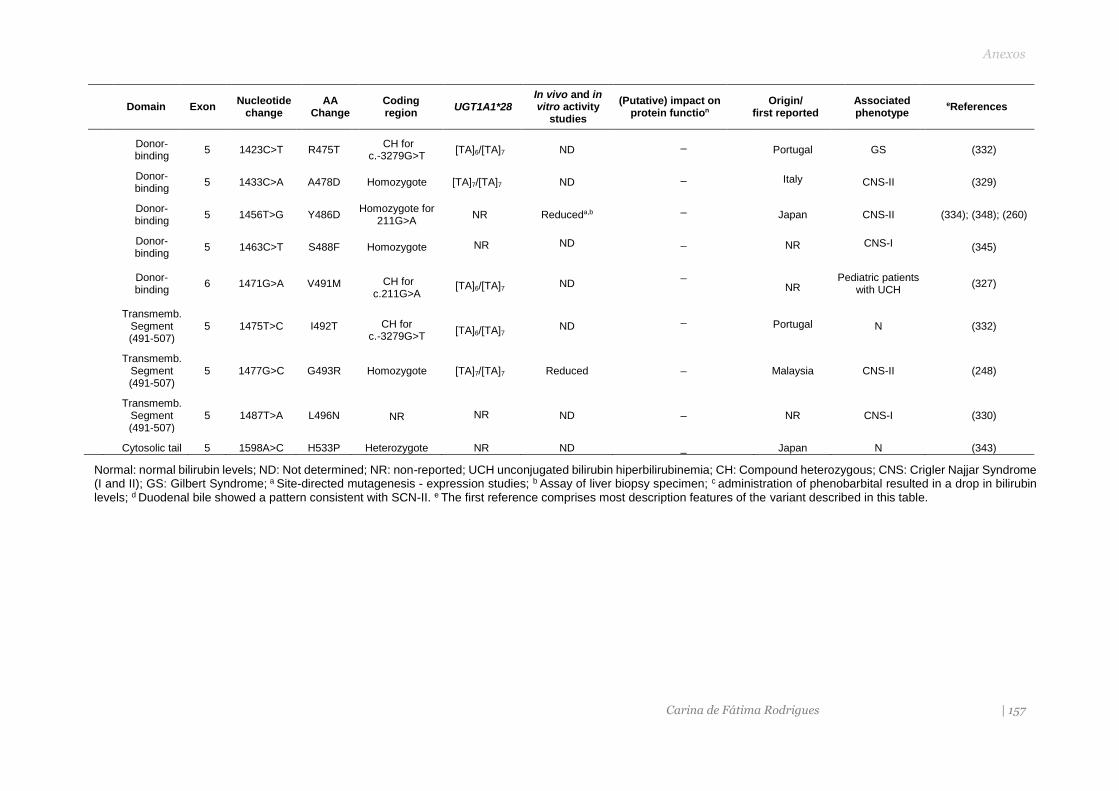
Anexos
Carina de Fátima Rodrigues | 157
Domain Exon Nucleotide
change AA
Change Coding region
UGT1A1*28 In vivo and in vitro activity
studies
(Putative) impact on protein function
Origin/ first reported
Associated phenotype
eReferences
Donor-binding
5 1423C>T R475T CH for
c.-3279G>T [TA]6/[TA]7 ND
_ Portugal GS (332)
Donor-binding
5 1433C>A A478D Homozygote [TA]7/[TA]7 ND _ Italy CNS-II (329)
Donor-binding
5 1456T>G Y486D Homozygote for
211G>A NR Reduceda,b
_ Japan CNS-II (334); (348); (260)
Donor-binding
5 1463C>T S488F Homozygote NR ND _ NR CNS-I (345)
Donor-binding
6 1471G>A V491M CH for c.211G>A
[TA]6/[TA]7 ND _
NR Pediatric patients
with UCH (327)
Transmemb.
Segment (491-507)
5 1475T>C I492T CH for c.-3279G>T
[TA]6/[TA]7 ND
_
Portugal N (332)
Transmemb.
Segment (491-507)
5 1477G>C G493R Homozygote [TA]7/[TA]7 Reduced _ Malaysia CNS-II (248)
Transmemb.
Segment (491-507)
5 1487T>A L496N NR NR ND _ NR CNS-I (330)
Cytosolic tail 5 1598A>C H533P Heterozygote NR ND _ Japan N (343)
Normal: normal bilirubin levels; ND: Not determined; NR: non-reported; UCH unconjugated bilirubin hiperbilirubinemia; CH: Compound heterozygous; CNS: Crigler Najjar Syndrome (I and II); GS: Gilbert Syndrome; a Site-directed mutagenesis - expression studies; b Assay of liver biopsy specimen; c administration of phenobarbital resulted in a drop in bilirubin levels; d Duodenal bile showed a pattern consistent with SCN-II. e The first reference comprises most description features of the variant described in this table.
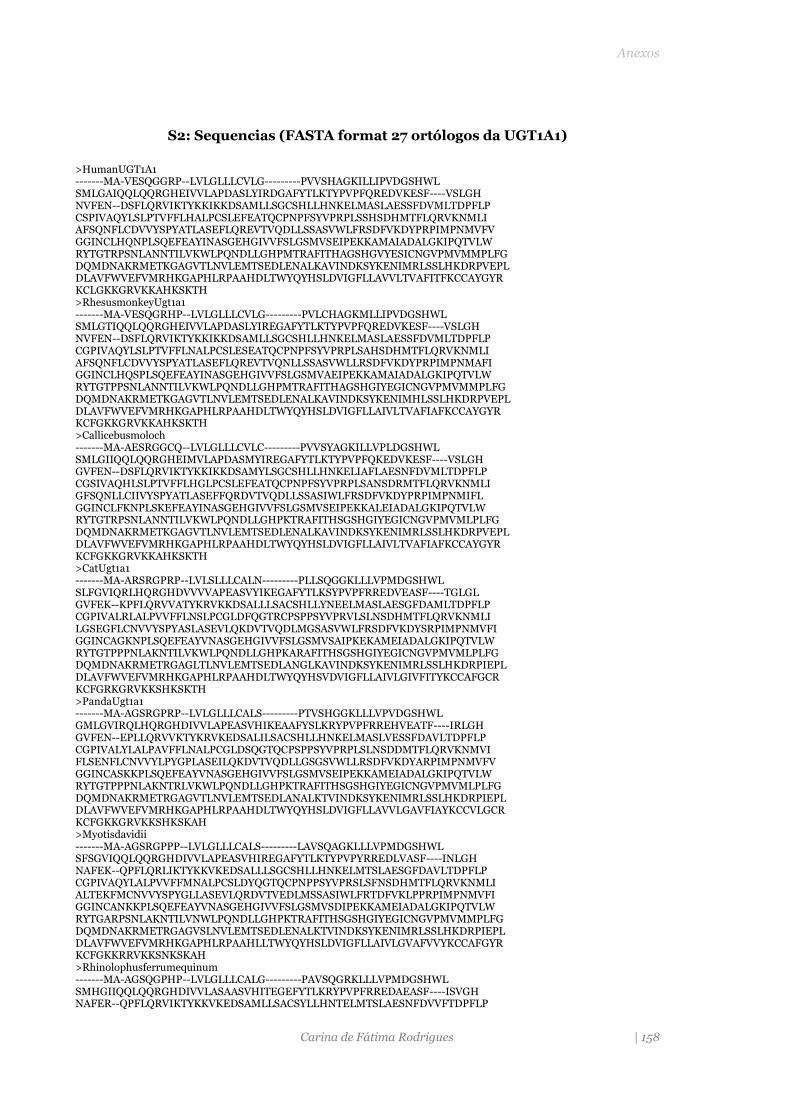
Anexos
Carina de Fátima Rodrigues | 158
S2: Sequencias (FASTA format 27 ortólogos da UGT1A1)
>HumanUGT1A1 -------MA-VESQGGRP--LVLGLLLCVLG---------PVVSHAGKILLIPVDGSHWL SMLGAIQQLQQRGHEIVVLAPDASLYIRDGAFYTLKTYPVPFQREDVKESF----VSLGH NVFEN--DSFLQRVIKTYKKIKKDSAMLLSGCSHLLHNKELMASLAESSFDVMLTDPFLP CSPIVAQYLSLPTVFFLHALPCSLEFEATQCPNPFSYVPRPLSSHSDHMTFLQRVKNMLI AFSQNFLCDVVYSPYATLASEFLQREVTVQDLLSSASVWLFRSDFVKDYPRPIMPNMVFV GGINCLHQNPLSQEFEAYINASGEHGIVVFSLGSMVSEIPEKKAMAIADALGKIPQTVLW RYTGTRPSNLANNTILVKWLPQNDLLGHPMTRAFITHAGSHGVYESICNGVPMVMMPLFG DQMDNAKRMETKGAGVTLNVLEMTSEDLENALKAVINDKSYKENIMRLSSLHKDRPVEPL DLAVFWVEFVMRHKGAPHLRPAAHDLTWYQYHSLDVIGFLLAVVLTVAFITFKCCAYGYR KCLGKKGRVKKAHKSKTH >RhesusmonkeyUgt1a1 -------MA-VESQGRHP--LVLGLLLCVLG---------PVLCHAGKMLLIPVDGSHWL SMLGTIQQLQQRGHEIVVLAPDASLYIREGAFYTLKTYPVPFQREDVKESF----VSLGH NVFEN--DSFLQRVIKTYKKIKKDSAMLLSGCSHLLHNKELMASLAESSFDVMLTDPFLP CGPIVAQYLSLPTVFFLNALPCSLESEATQCPNPFSYVPRPLSAHSDHMTFLQRVKNMLI AFSQNFLCDVVYSPYATLASEFLQREVTVQNLLSSASVWLLRSDFVKDYPRPIMPNMAFI GGINCLHQSPLSQEFEAYINASGEHGIVVFSLGSMVAEIPEKKAMAIADALGKIPQTVLW RYTGTPPSNLANNTILVKWLPQNDLLGHPMTRAFITHAGSHGIYEGICNGVPMVMMPLFG DQMDNAKRMETKGAGVTLNVLEMTSEDLENALKAVINDKSYKENIMHLSSLHKDRPVEPL DLAVFWVEFVMRHKGAPHLRPAAHDLTWYQYHSLDVIGFLLAIVLTVAFIAFKCCAYGYR KCFGKKGRVKKAHKSKTH >Callicebusmoloch -------MA-AESRGGCQ--LVLGLLLCVLC---------PVVSYAGKILLVPLDGSHWL SMLGIIQQLQQRGHEIMVLAPDASMYIREGAFYTLKTYPVPFQKEDVKESF----VSLGH GVFEN--DSFLQRVIKTYKKIKKDSAMYLSGCSHLLHNKELIAFLAESNFDVMLTDPFLP CGSIVAQHLSLPTVFFLHGLPCSLEFEATQCPNPFSYVPRPLSANSDRMTFLQRVKNMLI GFSQNLLCIIVYSPYATLASEFFQRDVTVQDLLSSASIWLFRSDFVKDYPRPIMPNMIFL GGINCLFKNPLSKEFEAYINASGEHGIVVFSLGSMVSEIPEKKALEIADALGKIPQTVLW RYTGTRPSNLANNTILVKWLPQNDLLGHPKTRAFITHSGSHGIYEGICNGVPMVMLPLFG DQMDNAKRMETKGAGVTLNVLEMTSEDLENALKAVINDKSYKENIMRLSSLHKDRPVEPL DLAVFWVEFVMRHKGAPHLRPAAHDLTWYQYHSLDVIGFLLAIVLTVAFIAFKCCAYGYR KCFGKKGRVKKAHKSKTH >CatUgt1a1 -------MA-ARSRGPRP--LVLSLLLCALN---------PLLSQGGKLLLVPMDGSHWL SLFGVIQRLHQRGHDVVVVAPEASVYIKEGAFYTLKSYPVPFRREDVEASF----TGLGL GVFEK--KPFLQRVVATYKRVKKDSALLLSACSHLLYNEELMASLAESGFDAMLTDPFLP CGPIVALRLALPVVFFLNSLPCGLDFQGTRCPSPPSYVPRVLSLNSDHMTFLQRVKNMLI LGSEGFLCNVVYSPYASLASEVLQKDVTVQDLMGSASVWLFRSDFVKDYSRPIMPNMVFI GGINCAGKNPLSQEFEAYVNASGEHGIVVFSLGSMVSAIPKEKAMEIADALGKIPQTVLW RYTGTPPPNLAKNTILVKWLPQNDLLGHPKARAFITHSGSHGIYEGICNGVPMVMLPLFG DQMDNAKRMETRGAGLTLNVLEMTSEDLANGLKAVINDKSYKENIMRLSSLHKDRPIEPL DLAVFWVEFVMRHKGAPHLRPAAHDLTWYQYHSVDVIGFLLAIVLGIVFITYKCCAFGCR KCFGRKGRVKKSHKSKTH >PandaUgt1a1 -------MA-AGSRGPRP--LVLGLLLCALS---------PTVSHGGKLLLVPVDGSHWL GMLGVIRQLHQRGHDIVVLAPEASVHIKEAAFYSLKRYPVPFRREHVEATF----IRLGH GVFEN--EPLLQRVVKTYKRVKEDSALILSACSHLLHNKELMASLVESSFDAVLTDPFLP CGPIVALYLALPAVFFLNALPCGLDSQGTQCPSPPSYVPRPLSLNSDDMTFLQRVKNMVI FLSENFLCNVVYLPYGPLASEILQKDVTVQDLLGSGSVWLLRSDFVKDYARPIMPNMVFV GGINCASKKPLSQEFEAYVNASGEHGIVVFSLGSMVSEIPEKKAMEIADALGKIPQTVLW RYTGTPPPNLAKNTRLVKWLPQNDLLGHPKTRAFITHSGSHGIYEGICNGVPMVMLPLFG DQMDNAKRMETRGAGVTLNVLEMTSEDLANALKTVINDKSYKENIMRLSSLHKDRPIEPL DLAVFWVEFVMRHKGAPHLRPAAHDLTWYQYHSLDVIGFLLAVVLGAVFIAYKCCVLGCR KCFGKKGRVKKSHKSKAH >Myotisdavidii -------MA-AGSRGPPP--LVLGLLLCALS---------LAVSQAGKLLLVPMDGSHWL SFSGVIQQLQQRGHDIVVLAPEASVHIREGAFYTLKTYPVPYRREDLVASF----INLGH NAFEK--QPFLQRLIKTYKKVKEDSALLLSGCSHLLHNKELMTSLAESGFDAVLTDPFLP CGPIVAQYLALPVVFFMNALPCSLDYQGTQCPNPPSYVPRSLSFNSDHMTFLQRVKNMLI ALTEKFMCNVVYSPYGLLASEVLQRDVTVEDLMSSASIWLFRTDFVKLPPRPIMPNMVFI GGINCANKKPLSQEFEAYVNASGEHGIVVFSLGSMVSDIPEKKAMEIADALGKIPQTVLW RYTGARPSNLAKNTILVNWLPQNDLLGHPKTRAFITHSGSHGIYEGICNGVPMVMMPLFG DQMDNAKRMETRGAGVSLNVLEMTSEDLENALKTVINDKSYKENIMRLSSLHKDRPIEPL DLAVFWVEFVMRHKGAPHLRPAAHLLTWYQYHSLDVIGFLLAIVLGVAFVVYKCCAFGYR KCFGKKRRVKKSNKSKAH >Rhinolophusferrumequinum -------MA-AGSQGPHP--LVLGLLLCALG---------PAVSQGRKLLLVPMDGSHWL SMHGIIQQLQQRGHDIVVLASAASVHITEGEFYTLKRYPVPFRREDAEASF----ISVGH NAFER--QPFLQRVIKTYKKVKEDSAMLLSACSYLLHNTELMTSLAESNFDVVFTDPFLP
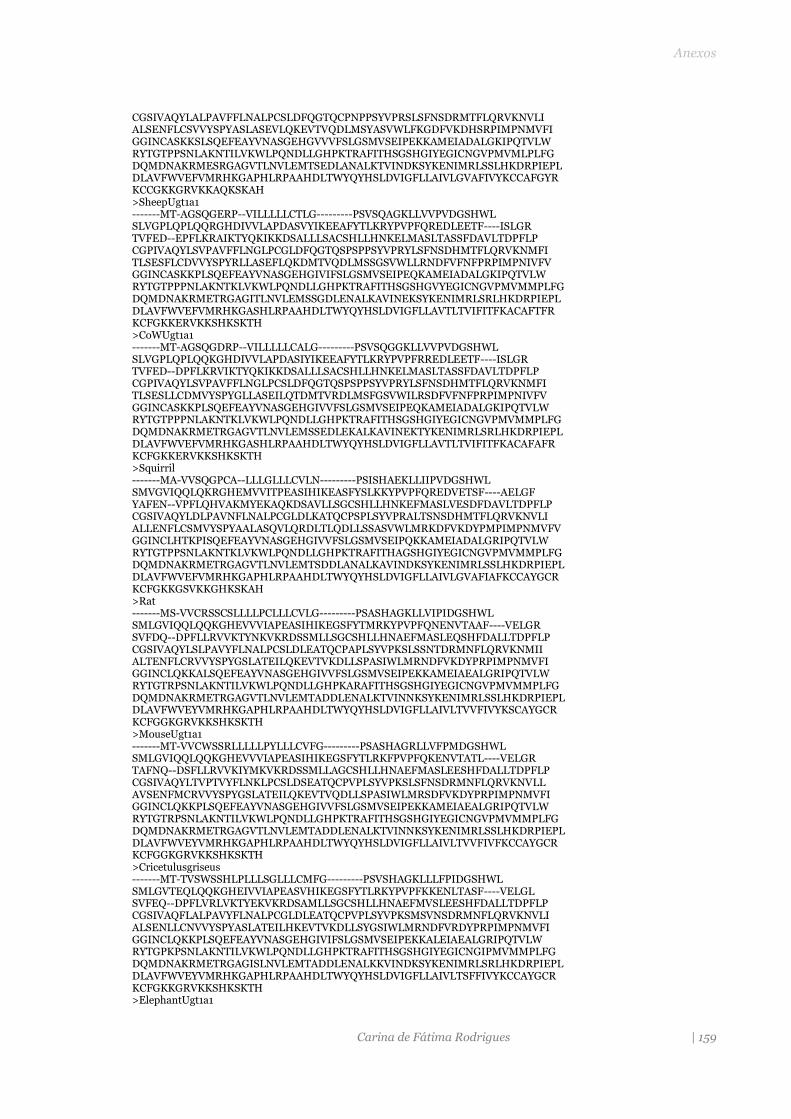
Anexos
Carina de Fátima Rodrigues | 159
CGSIVAQYLALPAVFFLNALPCSLDFQGTQCPNPPSYVPRSLSFNSDRMTFLQRVKNVLI ALSENFLCSVVYSPYASLASEVLQKEVTVQDLMSYASVWLFKGDFVKDHSRPIMPNMVFI GGINCASKKSLSQEFEAYVNASGEHGVVVFSLGSMVSEIPEKKAMEIADALGKIPQTVLW RYTGTPPSNLAKNTILVKWLPQNDLLGHPKTRAFITHSGSHGIYEGICNGVPMVMLPLFG DQMDNAKRMESRGAGVTLNVLEMTSEDLANALKTVINDKSYKENIMRLSSLHKDRPIEPL DLAVFWVEFVMRHKGAPHLRPAAHDLTWYQYHSLDVIGFLLAIVLGVAFIVYKCCAFGYR KCCGKKGRVKKAQKSKAH >SheepUgt1a1 -------MT-AGSQGERP--VILLLLLCTLG---------PSVSQAGKLLVVPVDGSHWL SLVGPLQPLQQRGHDIVVLAPDASVYIKEEAFYTLKRYPVPFQREDLEETF----ISLGR TVFED--EPFLKRAIKTYQKIKKDSALLLSACSHLLHNKELMASLTASSFDAVLTDPFLP CGPIVAQYLSVPAVFFLNGLPCGLDFQGTQSPSPPSYVPRYLSFNSDHMTFLQRVKNMFI TLSESFLCDVVYSPYRLLASEFLQKDMTVQDLMSSGSVWLLRNDFVFNFPRPIMPNIVFV GGINCASKKPLSQEFEAYVNASGEHGIVIFSLGSMVSEIPEQKAMEIADALGKIPQTVLW RYTGTPPPNLAKNTKLVKWLPQNDLLGHPKTRAFITHSGSHGVYEGICNGVPMVMMPLFG DQMDNAKRMETRGAGITLNVLEMSSGDLENALKAVINEKSYKENIMRLSRLHKDRPIEPL DLAVFWVEFVMRHKGASHLRPAAHDLTWYQYHSLDVIGFLLAVTLTVIFITFKACAFTFR KCFGKKERVKKSHKSKTH >CoWUgt1a1 -------MT-AGSQGDRP--VILLLLLCALG---------PSVSQGGKLLVVPVDGSHWL SLVGPLQPLQQKGHDIVVLAPDASIYIKEEAFYTLKRYPVPFRREDLEETF----ISLGR TVFED--DPFLKRVIKTYQKIKKDSALLLSACSHLLHNKELMASLTASSFDAVLTDPFLP CGPIVAQYLSVPAVFFLNGLPCSLDFQGTQSPSPPSYVPRYLSFNSDHMTFLQRVKNMFI TLSESLLCDMVYSPYGLLASEILQTDMTVRDLMSFGSVWILRSDFVFNFPRPIMPNIVFV GGINCASKKPLSQEFEAYVNASGEHGIVVFSLGSMVSEIPEQKAMEIADALGKIPQTVLW RYTGTPPPNLAKNTKLVKWLPQNDLLGHPKTRAFITHSGSHGIYEGICNGVPMVMMPLFG DQMDNAKRMETRGAGVTLNVLEMSSEDLEKALKAVINEKTYKENIMRLSRLHKDRPIEPL DLAVFWVEFVMRHKGASHLRPAAHDLTWYQYHSLDVIGFLLAVTLTVIFITFKACAFAFR KCFGKKERVKKSHKSKTH >Squirril -------MA-VVSQGPCA--LLLGLLLCVLN---------PSISHAEKLLIIPVDGSHWL SMVGVIQQLQKRGHEMVVITPEASIHIKEASFYSLKKYPVPFQREDVETSF----AELGF YAFEN--VPFLQHVAKMYEKAQKDSAVLLSGCSHLLHNKEFMASLVESDFDAVLTDPFLP CGSIVAQYLDLPAVNFLNALPCGLDLKATQCPSPLSYVPRALTSNSDHMTFLQRVKNVLI ALLENFLCSMVYSPYAALASQVLQRDLTLQDLLSSASVWLMRKDFVKDYPMPIMPNMVFV GGINCLHTKPISQEFEAYVNASGEHGIVVFSLGSMVSEIPQKKAMEIADALGRIPQTVLW RYTGTPPSNLAKNTKLVKWLPQNDLLGHPKTRAFITHAGSHGIYEGICNGVPMVMMPLFG DQMDNAKRMETRGAGVTLNVLEMTSDDLANALKAVINDKSYKENIMRLSSLHKDRPIEPL DLAVFWVEFVMRHKGAPHLRPAAHDLTWYQYHSLDVIGFLLAIVLGVAFIAFKCCAYGCR KCFGKKGSVKKGHKSKAH >Rat -------MS-VVCRSSCSLLLLPCLLLCVLG---------PSASHAGKLLVIPIDGSHWL SMLGVIQQLQQKGHEVVVIAPEASIHIKEGSFYTMRKYPVPFQNENVTAAF----VELGR SVFDQ--DPFLLRVVKTYNKVKRDSSMLLSGCSHLLHNAEFMASLEQSHFDALLTDPFLP CGSIVAQYLSLPAVYFLNALPCSLDLEATQCPAPLSYVPKSLSSNTDRMNFLQRVKNMII ALTENFLCRVVYSPYGSLATEILQKEVTVKDLLSPASIWLMRNDFVKDYPRPIMPNMVFI GGINCLQKKALSQEFEAYVNASGEHGIVVFSLGSMVSEIPEKKAMEIAEALGRIPQTVLW RYTGTRPSNLAKNTILVKWLPQNDLLGHPKARAFITHSGSHGIYEGICNGVPMVMMPLFG DQMDNAKRMETRGAGVTLNVLEMTADDLENALKTVINNKSYKENIMRLSSLHKDRPIEPL DLAVFWVEYVMRHKGAPHLRPAAHDLTWYQYHSLDVIGFLLAIVLTVVFIVYKSCAYGCR KCFGGKGRVKKSHKSKTH >MouseUgt1a1 -------MT-VVCWSSRLLLLLPYLLLCVFG---------PSASHAGRLLVFPMDGSHWL SMLGVIQQLQQKGHEVVVIAPEASIHIKEGSFYTLRKFPVPFQKENVTATL----VELGR TAFNQ--DSFLLRVVKIYMKVKRDSSMLLAGCSHLLHNAEFMASLEESHFDALLTDPFLP CGSIVAQYLTVPTVYFLNKLPCSLDSEATQCPVPLSYVPKSLSFNSDRMNFLQRVKNVLL AVSENFMCRVVYSPYGSLATEILQKEVTVQDLLSPASIWLMRSDFVKDYPRPIMPNMVFI GGINCLQKKPLSQEFEAYVNASGEHGIVVFSLGSMVSEIPEKKAMEIAEALGRIPQTVLW RYTGTRPSNLAKNTILVKWLPQNDLLGHPKTRAFITHSGSHGIYEGICNGVPMVMMPLFG DQMDNAKRMETRGAGVTLNVLEMTADDLENALKTVINNKSYKENIMRLSSLHKDRPIEPL DLAVFWVEYVMRHKGAPHLRPAAHDLTWYQYHSLDVIGFLLAIVLTVVFIVFKCCAYGCR KCFGGKGRVKKSHKSKTH >Cricetulusgriseus -------MT-TVSWSSHLPLLLSGLLLCMFG---------PSVSHAGKLLLFPIDGSHWL SMLGVTEQLQQKGHEIVVIAPEASVHIKEGSFYTLRKYPVPFKKENLTASF----VELGL SVFEQ--DPFLVRLVKTYEKVKRDSAMLLSGCSHLLHNAEFMVSLEESHFDALLTDPFLP CGSIVAQFLALPAVYFLNALPCGLDLEATQCPVPLSYVPKSMSVNSDRMNFLQRVKNVLI ALSENLLCNVVYSPYASLATEILHKEVTVKDLLSYGSIWLMRNDFVRDYPRPIMPNMVFI GGINCLQKKPLSQEFEAYVNASGEHGIVIFSLGSMVSEIPEKKALEIAEALGRIPQTVLW RYTGPKPSNLAKNTILVKWLPQNDLLGHPKTRAFITHSGSHGIYEGICNGIPMVMMPLFG DQMDNAKRMETRGAGISLNVLEMTADDLENALKKVINDKSYKENIMRLSRLHKDRPIEPL DLAVFWVEYVMRHKGAPHLRPAAHDLTWYQYHSLDVIGFLLAIVLTSFFIVYKCCAYGCR KCFGKKGRVKKSHKSKTH >ElephantUgt1a1
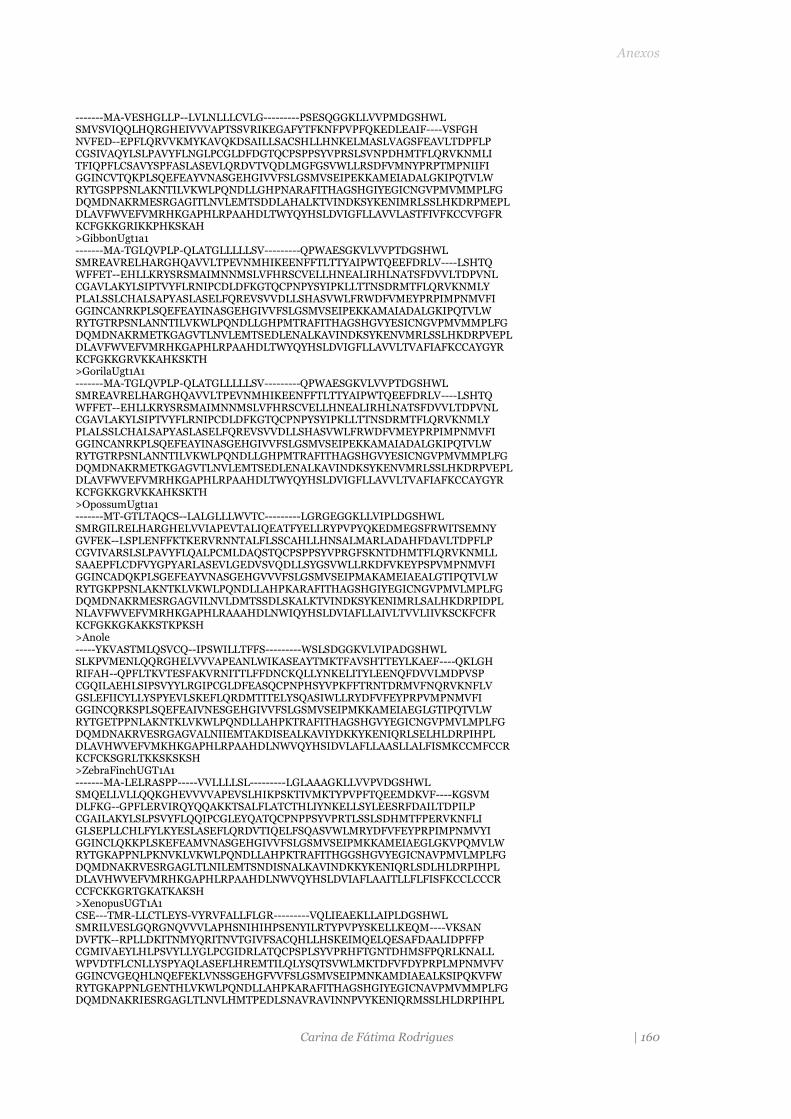
Anexos
Carina de Fátima Rodrigues | 160
-------MA-VESHGLLP--LVLNLLLCVLG---------PSESQGGKLLVVPMDGSHWL SMVSVIQQLHQRGHEIVVVAPTSSVRIKEGAFYTFKNFPVPFQKEDLEAIF----VSFGH NVFED--EPFLQRVVKMYKAVQKDSAILLSACSHLLHNKELMASLVAGSFEAVLTDPFLP CGSIVAQYLSLPAVYFLNGLPCGLDFDGTQCPSPPSYVPRSLSVNPDHMTFLQRVKNMLI TFIQPFLCSAVYSPFASLASEVLQRDVTVQDLMGFGSVWLLRSDFVMNYPRPTMPNIIFI GGINCVTQKPLSQEFEAYVNASGEHGIVVFSLGSMVSEIPEKKAMEIADALGKIPQTVLW RYTGSPPSNLAKNTILVKWLPQNDLLGHPNARAFITHAGSHGIYEGICNGVPMVMMPLFG DQMDNAKRMESRGAGITLNVLEMTSDDLAHALKTVINDKSYKENIMRLSSLHKDRPMEPL DLAVFWVEFVMRHKGAPHLRPAAHDLTWYQYHSLDVIGFLLAVVLASTFIVFKCCVFGFR KCFGKKGRIKKPHKSKAH >GibbonUgt1a1 -------MA-TGLQVPLP-QLATGLLLLLSV---------QPWAESGKVLVVPTDGSHWL SMREAVRELHARGHQAVVLTPEVNMHIKEENFFTLTTYAIPWTQEEFDRLV----LSHTQ WFFET--EHLLKRYSRSMAIMNNMSLVFHRSCVELLHNEALIRHLNATSFDVVLTDPVNL CGAVLAKYLSIPTVYFLRNIPCDLDFKGTQCPNPYSYIPKLLTTNSDRMTFLQRVKNMLY PLALSSLCHALSAPYASLASELFQREVSVVDLLSHASVWLFRWDFVMEYPRPIMPNMVFI GGINCANRKPLSQEFEAYINASGEHGIVVFSLGSMVSEIPEKKAMAIADALGKIPQTVLW RYTGTRPSNLANNTILVKWLPQNDLLGHPMTRAFITHAGSHGVYESICNGVPMVMMPLFG DQMDNAKRMETKGAGVTLNVLEMTSEDLENALKAVINDKSYKENVMRLSSLHKDRPVEPL DLAVFWVEFVMRHKGAPHLRPAAHDLTWYQYHSLDVIGFLLAVVLTVAFIAFKCCAYGYR KCFGKKGRVKKAHKSKTH >GorilaUgt1A1 -------MA-TGLQVPLP-QLATGLLLLLSV---------QPWAESGKVLVVPTDGSHWL SMREAVRELHARGHQAVVLTPEVNMHIKEENFFTLTTYAIPWTQEEFDRLV----LSHTQ WFFET--EHLLKRYSRSMAIMNNMSLVFHRSCVELLHNEALIRHLNATSFDVVLTDPVNL CGAVLAKYLSIPTVYFLRNIPCDLDFKGTQCPNPYSYIPKLLTTNSDRMTFLQRVKNMLY PLALSSLCHALSAPYASLASELFQREVSVVDLLSHASVWLFRWDFVMEYPRPIMPNMVFI GGINCANRKPLSQEFEAYINASGEHGIVVFSLGSMVSEIPEKKAMAIADALGKIPQTVLW RYTGTRPSNLANNTILVKWLPQNDLLGHPMTRAFITHAGSHGVYESICNGVPMVMMPLFG DQMDNAKRMETKGAGVTLNVLEMTSEDLENALKAVINDKSYKENVMRLSSLHKDRPVEPL DLAVFWVEFVMRHKGAPHLRPAAHDLTWYQYHSLDVIGFLLAVVLTVAFIAFKCCAYGYR KCFGKKGRVKKAHKSKTH >OpossumUgt1a1 -------MT-GTLTAQCS--LALGLLLWVTC---------LGRGEGGKLLVIPLDGSHWL SMRGILRELHARGHELVVIAPEVTALIQEATFYELLRYPVPYQKEDMEGSFRWITSEMNY GVFEK--LSPLENFFKTKERVRNNTALFLSSCAHLLHNSALMARLADAHFDAVLTDPFLP CGVIVARSLSLPAVYFLQALPCMLDAQSTQCPSPPSYVPRGFSKNTDHMTFLQRVKNMLL SAAEPFLCDFVYGPYARLASEVLGEDVSVQDLLSYGSVWLLRKDFVKEYPSPVMPNMVFI GGINCADQKPLSGEFEAYVNASGEHGVVVFSLGSMVSEIPMAKAMEIAEALGTIPQTVLW RYTGKPPSNLAKNTKLVKWLPQNDLLAHPKARAFITHAGSHGIYEGICNGVPMVLMPLFG DQMDNAKRMESRGAGVILNVLDMTSSDLSKALKTVINDKSYKENIMRLSALHKDRPIDPL NLAVFWVEFVMRHKGAPHLRAAAHDLNWIQYHSLDVIAFLLAIVLTVVLIIVKSCKFCFR KCFGKKGKAKKSTKPKSH >Anole -----YKVASTMLQSVCQ--IPSWILLTFFS---------WSLSDGGKVLVIPADGSHWL SLKPVMENLQQRGHELVVVAPEANLWIKASEAYTMKTFAVSHTTEYLKAEF----QKLGH RIFAH--QPFLTKVTESFAKVRNITTLFFDNCKQLLYNKELITYLEENQFDVVLMDPVSP CGQILAEHLSIPSVYYLRGIPCGLDFEASQCPNPHSYVPKFFTRNTDRMVFNQRVKNFLV GSLEFIICYLLYSPYEVLSKEFLQRDMTITELYSQASIWLLRYDFVFEYPRPVMPNMVFI GGINCQRKSPLSQEFEAIVNESGEHGIVVFSLGSMVSEIPMKKAMEIAEGLGTIPQTVLW RYTGETPPNLAKNTKLVKWLPQNDLLAHPKTRAFITHAGSHGVYEGICNGVPMVLMPLFG DQMDNAKRVESRGAGVALNIIEMTAKDISEALKAVIYDKKYKENIQRLSELHLDRPIHPL DLAVHWVEFVMKHKGAPHLRPAAHDLNWVQYHSIDVLAFLLAASLLALFISMKCCMFCCR KCFCKSGRLTKKSKSKSH >ZebraFinchUGT1A1 -------MA-LELRASPP-----VVLLLLSL---------LGLAAAGKLLVVPVDGSHWL SMQELLVLLQQKGHEVVVVAPEVSLHIKPSKTIVMKTYPVPFTQEEMDKVF----KGSVM DLFKG--GPFLERVIRQYQQAKKTSALFLATCTHLIYNKELLSYLEESRFDAILTDPILP CGAILAKYLSLPSVYFLQQIPCGLEYQATQCPNPPSYVPRTLSSLSDHMTFPERVKNFLI GLSEPLLCHLFYLKYESLASEFLQRDVTIQELFSQASVWLMRYDFVFEYPRPIMPNMVYI GGINCLQKKPLSKEFEAMVNASGEHGIVVFSLGSMVSEIPMKKAMEIAEGLGKVPQMVLW RYTGKAPPNLPKNVKLVKWLPQNDLLAHPKTRAFITHGGSHGVYEGICNAVPMVLMPLFG DQMDNAKRVESRGAGLTLNILEMTSNDISNALKAVINDKKYKENIQRLSDLHLDRPIHPL DLAVHWVEFVMRHKGAPHLRPAAHDLNWVQYHSLDVIAFLAAITLLFLFISFKCCLCCCR CCFCKKGRTGKATKAKSH >XenopusUGT1A1 CSE---TMR-LLCTLEYS-VYRVFALLFLGR---------VQLIEAEKLLAIPLDGSHWL SMRILVESLGQRGNQVVVLAPHSNIHIHPSENYILRTYPVPYSKELLKEQM----VKSAN DVFTK--RPLLDKITNMYQRITNVTGIVFSACQHLLHSKEIMQELQESAFDAALIDPFFP CGMIVAEYLHLPSVYLLYGLPCGIDRLATQCPSPLSYVPRHFTGNTDHMSFPQRLKNALL WPVDTFLCNLLYSPYAQLASEFLHREMTILQLYSQTSVWLMKTDFVFDYPRPLMPNMVFV GGINCVGEQHLNQEFEKLVNSSGEHGFVVFSLGSMVSEIPMNKAMDIAEALKSIPQKVFW RYTGKAPPNLGENTHLVKWLPQNDLLAHPKARAFITHAGSHGIYEGICNAVPMVMMPLFG DQMDNAKRIESRGAGLTLNVLHMTPEDLSNAVRAVINNPVYKENIQRMSSLHLDRPIHPL
Anexos
Carina de Fátima Rodrigues | 161
DLAVHWVEFVMRHKGAPHLRPAAHDLNWFQYYSLDVIGFLLAVLLTALFISLKCCTFVFR RCFKRNSKKQRKSKSQ-- >Horse -------MAPAMLTGSLP--LCVCLLLT------------PGFADAGWLLVVPMDGSHWF TMHSVVEKLIHRGHEVVIVMPEVSWHIEKSLNFTVKTYSTFYTLEELDPQF----NIFSE AHWKG--QEQSLLSTLLTSSGDSFIEHFYSHCRSLFNDAKLVKYLEENSFDAVFLDPFDM CGFIVAKYFSLPSVVFTKVVICHHLEEGTQCPSAPSYVPRFLSGFPDTLTFRERVRKHIF YFEEYLFCRYFIKNVLEFASEIFQKTVTEYDLLSHTSIWLLRTDFVFDYPKPVMPNVIFI GGINCHQGKPLTKEFEAYVNASGEHGIVVFSLGSMVSEIPEKKAMEIADALGKIPQTVLW RYTGTPPPNLSKNTILVKWLPQNDLLGHPKTRAFITHSGSHGVYEGICNGVPMVMMPLFG DQMDNAKRMETRGAGVSLNVLEMTSDDLANALKTVINDKSYKENIMRLSSLHKDRPVEPL DLAVFWVEFVMRHKGAPHLRPAAHDLTWYQYHSLDVIGFLLAVVLGVAFIVYKSCAFGFR KFFGKKGRVKKSHKSKTQ >Coelacanth MEQLLRKMD-LTFNSHFS--LLSCLLLMTFQSL-------FGPGDCGKLLVVPVDGSHWL SMQPVSQQLGQRGHTVVVVTPRTSLLISPSQHYSMKYYPVPYGRADLDAQF----KSMNE NLFDQ--TPRLGKITTTYRRFRNVSKLFLTTCEHLLYNQELMASLRQENFDAVLTDPIIP CGLIVAEYLSLPLVTLLRGLPCSMEYRASQCPAPPSYVPRIFTGHTDRMTFLQRMKNLLT SFAELSFCQLFYGQFDGLAAHFLQKDTSVLELLSHTSIWLMQYDFVFEYPRPLMPNMIMV GGLNCGSAKALPQELEDFVNSSGEHGIVVFSLGSMLSEIPLEKAMQISEAFNNIPQKVLW RYAGPTPPNLGKNIKLMKWLPQNDLLAHPKTRVFVTHGGINGIYEAICHGVPLVMLPLFG DQADNSHHMQAHGAGIILNIFQMTSRDLLAALNAVISDVRYKENMLRLSTLHKDRPIEPL HLAVHWVEFVMKHKGAKHLWPAAHELNWFQYHCLDVIGLLVAATGILLYVVLRGCCFCWR RCLCKKTTRKPKSE---- >Cod ----------AAGGVRSA-KLGFLAWLCFST---------LGATLGAKVLVVPVDGSHWL SMKLLVKELIVRGHDVVLLEPETTALGKGLVGCRNEIYPVSYTKEELGNVL----KQLQE NVFIK--LPKITDAYVNVQRLIDYTSIHVKGCENLLYNQEVMGRLRLEGFDVVLTDPFLP CGSILAETLSVPVVYFLRGLPCGLDEIGTQCPSPPSYVPRFYSGHSDTMTFPQRVKNMVM YGIESVSCRIMYASFDELASRYLEKDISYKDLVRRGAIWLLRYDFAFLFPKPMMPNMVLI GGINCAKPSPLSAHLEEFVDGSGDDGFIVFTLGSMVDKMPADMTIAFLDAFKKIPQRVVW RHTGILPEDVPENVKIMKWLPQNDLLAHPKAKLFLTHGGSHGIYEGICHGVPMVMMPLFG DQPDNVDYMVARGVAVVIDVFDVTTEKVLEAINKVVNDTSYKEKMVNLMSVHQDHAVKPL DLAVFWTEFVVRHQGADHLRPAAHNLNWIQYHSLDTLCLLAAIVMTIAFLGLKCCCFCGR KCCVRVAKKKK------- >Stickleback --------A-MSGEVWFP-ALGLVAWLCCLS---------LGPAQGGKVLVVPVDGSHWL SMKILVKELSHRGHEAVVLVPETSLLIHGSKSYRTEMYQVPFTKAELDGAF----NQLKD GVFLK--PPTITDLFINIQRLVNFTSMQVGACESLLYNQPLMSKLKSEGFDLVLTDPFLP CGSILSHVFSIPAVYFLRGLPCELDSRANHCPAPVSYVPVAFTGNTDIMNFPQRVKNMLM SILESYVCRVLYYNFEDLVSRYLGNDITYKGLLSNGAIWLLRYDFTFEWPKPLLPNMVFI GGINCAKKAPLPADLKEFVEGSGDDGFIVFTLGSMVSDMPKKKAKQFLDAFRQIPQRVVW RYTGNFTEDVPKNVKLMKWLPQNDLLAHPKAKVFMTHGGTHGIYEGICNAVPMLMFPLFG DQGDNVHHLVSRGVAEKLLIYDVTTETLLVAIKKIINDKSYKEKITTLSDIHLDRPVEPL DLAVFWTEFVMRHKGAAHLRVAAHDLNWIQYNSLDVFVFFAVVLVGVLWVTLKGCLFCGR KCFRKGTPKRKQA----- >ZebraFich1a7 MND--RIVR----------MAASALVLCLFC---------LVSAEAGNLLVIPALGSHWT GTRPLVEELGRRGNRVVVVFPEENVNMVPAKHTTTLTYPVPYTKAQIQKGT----DAAIS KLFSADVSSDVGRFQNFFTTMDMLKVIISRNAEGLLLNKDLLKKLQDYNFDAILTDPFET VGVIASEYLSIPAIYMQTSHPCGADVLASQCPAPPSYVPKGLTHFTDRMNLWQRSVNFVR TLVQPVACSRMFAHADEIASKVLQKKTSVMEIMSRAALWFMHFDFAFEFPRPVMPNMVVI GGVDTKKPEPLSQELEEFVNGSGEHGFVVFTLGSMVSQLPEAKAREFFEAFRQIPQRVLW RYTGPVPENAPKNVKLMKWLPQNDLLGHPKVRAFVTHGGSHGIYEGICNGVPMVMLPLFG DQGDNAQRLVSRGVAESLTIYDVTSEKLLVALKKVINDKSYKEKMMKLSAIHRDRPIEPL DLAVFWTEFVMRHKGAEHLRPAAHDLNWIQYHSLDVIGFLLLILLTVIFVTVKSCMFCFR KCFKKSQKKKKA------ >Zebrafich1ab -------------TLPVP-AQGLLALLCLFS---------FESVQAGKVLVLPVDGSHWL SMKILVEELSNRGHEMVVLVPETSILIKKSGKYSTKTYPVSFTHDDLAENL----KEIQN SALEK--APKLTDIVVNFRNLLQFLTMQSKTCEGLLYNEPLMKSLREMGFDAMLTDPFLP CGTIIADSFSIPAVYFLRLIPCRLDEAAAQCPSPPSFMPRYSSGFTDKMTFPQRLVNTLL TVVEGFLCRSMYESADELASRYLQKETTYAELLGHGAVWLLRYDFAFEFPRPQMPNMVQI GGINCVKRAPLTKELEEFVNGSGEHGFVVFTLGSMVSQLPEAKAREFFEAFRQIPQRVLW RYTGPVPENAPKNVKLMKWLPQNDLLGHPKVRAFVTHGGSHGIYEGICNGVPMVMLPLFG DQGDNAQRLVSRGVAESLTIYDVTSEKLLVALKKVINDKSYKEKMMKLSAIHRDRPIEPL DLAVFWTEFVMRHKGAEHLRPAAHDLNWIQYHSLDVIGFLLLILLTVIFVTVKSCMFCFR KCFKKSQKKKKA------ >Zebrafich1b4 ----------MTINMHLG--VIFCLVVGVVCSAAVDQKLSRKSSWTGKLLVVPMDGSHWT GVKAVAEEMGRRGHTVIVVIPEISMRLGPGKHYITKKFPVKYDQKLFNEVL----TEHVH EVTNP-GHSRLKTVTSTMANLLKMFNMMASTSESLFQDKELIKFLRDENFDAILTDPALP MGAVLAYNFSVPAVYMLRGMPCALDATATACPNTPSYIPRFHTGNTDRMSFGERVMNVLM SILEQVACKVMYWSFEEVTSNFLQRDVSLTEILSTGAVWLMRYDFTLEFPKPLMPNMQFI
Anexos
Carina de Fátima Rodrigues | 162
GGINCGVKNPLMKEVEEFVNGSGEHGIVVFSLGSLVSSMPKEKADIFFKAFSMIPQRVLW RYTGEIPNNVPENVKLMKWLPQNDLLGHPKARAFITHGGTHGIYEGICHGVPMVMLPLFG DQADNVHRVATRGVGVILSIHDITVETLLDALNSVINNSSYKQKMQKLSAIHNDRPIQPL DLAVFWTEFVMRHKGADHLRPAAHELNWLQYHSLDVIGFMLLIVLIVTLAMLKCCSLCWR RCCRKTQKRKED------ >FUGU ----------------------------------------------GNLLVVPMDGSHWV DLKALAQEMGRRGHRVTVVIPEVSMRMGPGKYYDTVTFPVPYDKDLV-ASL----MGDNK GILEKSTVGFTEKIQNRISQFQTFASFLHTTAESLLFNASIISQLEQQNFDAVLTDPMVP TGALIARKLGLPIVNLLRGIPCMLDMKSAGCPSPPSYVPRYMTGYTDKMNFKERTINTMV ALLEPLMCKLLFWQFDYISHQFLGEEVGMAEVLSESAVWLLRIDMTLELPRPLMPNTILV GGINCNVRDALPEDLLPWV--SGEHGFIVFTLGSMVSEMPEETTTIFLEAFRQIPQKVIW RYTGQIDGNVPDNVKIMKWVPQNDLLAHPGARAFITHAGSHGLYEGLCHAVPMVMVPLIA EQPDNAEKMASRGAGIVLNILSVSTEDIVQALNNVINDTRYKDNIKTLSELHKDQPINPL ELSVYWTEFVMRHKGAKHLRPAVHDLNWIQYYCLDVVAFLFTILLLVVVLTVKCLKVFLR
S3: Sequencias (FASTA format 9 ortólogos da UGT1A1)
9 UGT1A1 Orthologs >QUERY MAVESQGGRPLVLGLLLCVLGPVVSHAGKILLIPVDGSHWLSMLGAIQQLQQRGHEIVVL APDASLYIRDGAFYTLKTYPVPFQREDVKESFVSLGHNVFENDSFLQRVIKTYKKIKKDS AMLLSGCSHLLHNKELMASLAESSFDVMLTDPFLPCSPIVAQYLSLPTVFFLHALPCSLE FEATQCPNPFSYVPRPLSSHSDHMTFLQRVKNMLIAFSQNFLCDVVYSPYATLASEFLQR EVTVQDLLSSASVWLFRSDFVKDYPRPIMPNMVFVGGINCLHQNPLSQEFEAYINASGEH GIVVFSLGSMVSEIPEKKAMAIADALGKIPQTVLWRYTGTRPSNLANNTILVKWLPQNDL LGHPMTRAFITHAGSHGVYESICNGVPMVMMPLFGDQMDNAKRMETKGAGVTLNVLEMTS EDLENALKAVINDKSYKENIMRLSSLHKDRPVEPLDLAVFWVEFVMRHKGAPHLRPAAHD LTWYQYHSLDVIGFLLAVVLTVAFITFKCCAYGYRKCLGKKGRVKKAHKSKTH >CHIMPANZEE_UGT1A1 MAVESQGGRPLVLGLLLCVLGPVVSHAGKILLIPVDGSHWLSMLGAIQQLQQRGHEIVVL APDASLYIRDGAFYTLKTYPVPFQREDVKESFVSLGHNVFENDSFLQRVIKTYKKIKKDS AMLLSGCSHLLHNKELMASLAESSFDVMLTDPFLPCSPIVAQYLSLPTVFFLHALPCSLE FEATQCPNPFSYVPRPLSSHSDHMTFLQRVKNMLIAFSQNFLCDVVYSPYATLASEFLQR EVTVQDLLSSASVWLFRSDFVKDYPRPIMPNMVFVGGINCLHQNPLSQEFEAYINASGEH GIVVFSLGSMVSEIPEKKAMAIADALGKIPQTVLWRYTGTRPSNLANNTILVKWLPQNDL LGHPMTRAFITHAGSHGVYESICNGVPMVMMPLFGDQMDNAKRMETKGAGVTLNVLEMTS EDLENALKAVINDKSYKENIMRLSSLHKDRPVEPLDLAVFWVEFVMRHKGAPHLRPAAHD LTWYQYHSLDVIGFLLAVVLTVAFITFKCCAYGYRKCFGKKGRVKKAHKSKTH >PANDA_UGT1A1 MAAGSRGPRPLVLGLLLCALSPTVSHGGKLLLVPVDGSHWLGMLGVIRQLHQRGHDIVVL APEASVHIKEAAFYSLKRYPVPFRREHVEATFIRLGHGVFENEPLLQRVVKTYKRVKEDS ALILSACSHLLHNKELMASLVESSFDAVLTDPFLPCGPIVALYLALPAVFFLNALPCGLD SQGTQCPSPPSYVPRPLSLNSDDMTFLQRVKNMVIFLSENFLCNVVYLPYGPLASEILQK DVTVQDLLGSGSVWLLRSDFVKDYARPIMPNMVFVGGINCASKKPLSQEFEAYVNASGEH GIVVFSLGSMVSEIPEKKAMEIADALGKIPQTVLWRYTGTPPPNLAKNTRLVKWLPQNDL LGHPKTRAFITHSGSHGIYEGICNGVPMVMLPLFGDQMDNAKRMETRGAGVTLNVLEMTS EDLANALKTVINDKSYKENIMRLSSLHKDRPIEPLDLAVFWVEFVMRHKGAPHLRPAAHD LTWYQYHSLDVIGFLLAVVLGAVFIAYKCCVLGCRKCFGKKGRVKKSHKSKAH >SHEEP_UGT1A1 MTAGSQGERPVILLLLLCTLGPSVSQAGKLLVVPVDGSHWLSLVGPLQPLQQRGHDIVVL APDASVYIKEEAFYTLKRYPVPFQREDLEETFISLGRTVFEDEPFLKRAIKTYQKIKKDS ALLLSACSHLLHNKELMASLTASSFDAVLTDPFLPCGPIVAQYLSVPAVFFLNGLPCGLD FQGTQSPSPPSYVPRYLSFNSDHMTFLQRVKNMFITLSESFLCDVVYSPYRLLASEFLQK DMTVQDLMSSGSVWLLRNDFVFNFPRPIMPNIVFVGGINCASKKPLSQEFEAYVNASGEH GIVIFSLGSMVSEIPEQKAMEIADALGKIPQTVLWRYTGTPPPNLAKNTKLVKWLPQNDL LGHPKTRAFITHSGSHGVYEGICNGVPMVMMPLFGDQMDNAKRMETRGAGITLNVLEMSS GDLENALKAVINEKSYKENIMRLSRLHKDRPIEPLDLAVFWVEFVMRHKGASHLRPAAHD LTWYQYHSLDVIGFLLAVTLTVIFITFKACAFTFRKCFGKKERVKKSHKSKTH >RHESUSMONKEY_UGT1A MAVESQGRHPLVLGLLLCVLGPVLCHAGKMLLIPVDGSHWLSMLGTIQQLQQRGHEIVVL APDASLYIREGAFYTLKTYPVPFQREDVKESFVSLGHNVFENDSFLQRVIKTYKKIKKDS AMLLSGCSHLLHNKELMASLAESSFDVMLTDPFLPCGPIVAQYLSLPTVFFLNALPCSLE SEATQCPNPFSYVPRPLSAHSDHMTFLQRVKNMLIAFSQNFLCDVVYSPYATLASEFLQR EVTVQNLLSSASVWLLRSDFVKDYPRPIMPNMAFIGGINCLHQSPLSQEFEAYINASGEH GIVVFSLGSMVAEIPEKKAMAIADALGKIPQTVLWRYTGTPPSNLANNTILVKWLPQNDL LGHPMTRAFITHAGSHGIYEGICNGVPMVMMPLFGDQMDNAKRMETKGAGVTLNVLEMTS EDLENALKAVINDKSYKENIMHLSSLHKDRPVEPLDLAVFWVEFVMRHKGAPHLRPAAHD LTWYQYHSLDVIGFLLAIVLTVAFIAFKCCAYGYRKCFGKKGRVKKAHKSKTH >CAT_UGT1A1 MAARSRGPRPLVLSLLLCALNPLLSQGGKLLLVPMDGSHWLSLFGVIQRLHQRGHDVVVV APEASVYIKEGAFYTLKSYPVPFRREDVEASFTGLGLGVFEKKPFLQRVVATYKRVKKDS ALLLSACSHLLYNEELMASLAESGFDAMLTDPFLPCGPIVALRLALPVVFFLNSLPCGLD FQGTRCPSPPSYVPRVLSLNSDHMTFLQRVKNMLILGSEGFLCNVVYSPYASLASEVLQK
Anexos
Carina de Fátima Rodrigues | 163
DVTVQDLMGSASVWLFRSDFVKDYSRPIMPNMVFIGGINCAGKNPLSQEFEAYVNASGEH GIVVFSLGSMVSAIPKEKAMEIADALGKIPQTVLWRYTGTPPPNLAKNTILVKWLPQNDL LGHPKARAFITHSGSHGIYEGICNGVPMVMLPLFGDQMDNAKRMETRGAGLTLNVLEMTS EDLANGLKAVINDKSYKENIMRLSSLHKDRPIEPLDLAVFWVEFVMRHKGAPHLRPAAHD LTWYQYHSVDVIGFLLAIVLGIVFITYKCCAFGCRKCFGRKGRVKKSHKSKTH >COW_UGT1A1 MTAGSQGDRPVILLLLLCALGPSVSQGGKLLVVPVDGSHWLSLVGPLQPLQQKGHDIVVL APDASIYIKEEAFYTLKRYPVPFRREDLEETFISLGRTVFEDDPFLKRVIKTYQKIKKDS ALLLSACSHLLHNKELMASLTASSFDAVLTDPFLPCGPIVAQYLSVPAVFFLNGLPCSLD FQGTQSPSPPSYVPRYLSFNSDHMTFLQRVKNMFITLSESLLCDMVYSPYGLLASEILQT DMTVRDLMSFGSVWILRSDFVFNFPRPIMPNIVFVGGINCASKKPLSQEFEAYVNASGEH GIVVFSLGSMVSEIPEQKAMEIADALGKIPQTVLWRYTGTPPPNLAKNTKLVKWLPQNDL LGHPKTRAFITHSGSHGIYEGICNGVPMVMMPLFGDQMDNAKRMETRGAGVTLNVLEMSS EDLEKALKAVINEKTYKENIMRLSRLHKDRPIEPLDLAVFWVEFVMRHKGASHLRPAAHD LTWYQYHSLDVIGFLLAVTLTVIFITFKACAFAFRKCFGKKERVKKSHKSKTH >SQUIRRIL MAVVSQGPCALLLGLLLCVLNPSISHAEKLLIIPVDGSHWLSMVGVIQQLQKRGHEMVVI TPEASIHIKEASFYSLKKYPVPFQREDVETSFAELGFYAFENVPFLQHVAKMYEKAQKDS AVLLSGCSHLLHNKEFMASLVESDFDAVLTDPFLPCGSIVAQYLDLPAVNFLNALPCGLD LKATQCPSPLSYVPRALTSNSDHMTFLQRVKNVLIALLENFLCSMVYSPYAALASQVLQR DLTLQDLLSSASVWLMRKDFVKDYPMPIMPNMVFVGGINCLHTKPISQEFEAYVNASGEH GIVVFSLGSMVSEIPQKKAMEIADALGRIPQTVLWRYTGTPPSNLAKNTKLVKWLPQNDL LGHPKTRAFITHAGSHGIYEGICNGVPMVMMPLFGDQMDNAKRMETRGAGVTLNVLEMTS DDLANALKAVINDKSYKENIMRLSSLHKDRPIEPLDLAVFWVEFVMRHKGAPHLRPAAHD LTWYQYHSLDVIGFLLAIVLGVAFIAFKCCAYGCRKCFGKKGSVKKGHKSKAH >ELEPHANT_UGT1A1 MAVESHGLLPLVLNLLLCVLGPSESQGGKLLVVPMDGSHWLSMVSVIQQLHQRGHEIVVV APTSSVRIKEGAFYTFKNFPVPFQKEDLEAIFVSFGHNVFEDEPFLQRVVKMYKAVQKDS AILLSACSHLLHNKELMASLVAGSFEAVLTDPFLPCGSIVAQYLSLPAVYFLNGLPCGLD FDGTQCPSPPSYVPRSLSVNPDHMTFLQRVKNMLITFIQPFLCSAVYSPFASLASEVLQR DVTVQDLMGFGSVWLLRSDFVMNYPRPTMPNIIFIGGINCVTQKPLSQEFEAYVNASGEH GIVVFSLGSMVSEIPEKKAMEIADALGKIPQTVLWRYTGSPPSNLAKNTILVKWLPQNDL LGHPNARAFITHAGSHGIYEGICNGVPMVMMPLFGDQMDNAKRMESRGAGITLNVLEMTS DDLAHALKTVINDKSYKENIMRLSSLHKDRPMEPLDLAVFWVEFVMRHKGAPHLRPAAHD LTWYQYHSLDVIGFLLAVVLASTFIVFKCCVFGFRKCFGKKGRIKKPHKSKAH
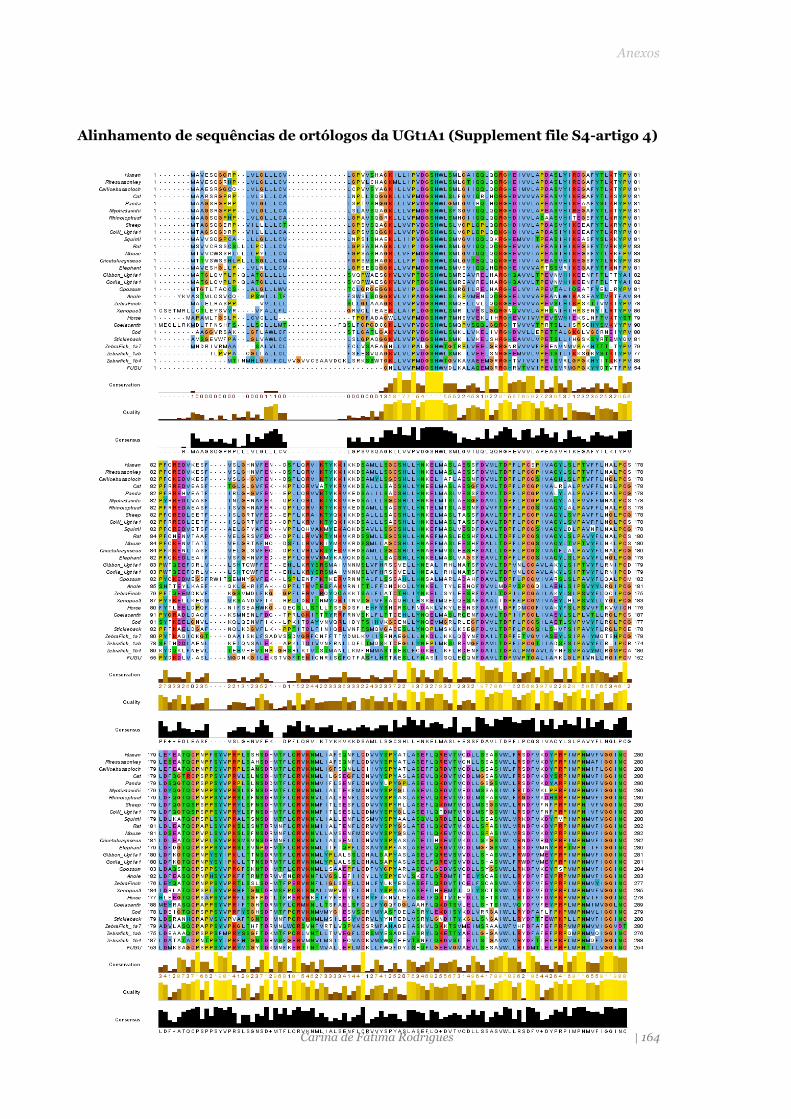
Anexos
Carina de Fátima Rodrigues | 164
Alinhamento de sequências de ortólogos da UGt1A1 (Supplement file S4-artigo 4)
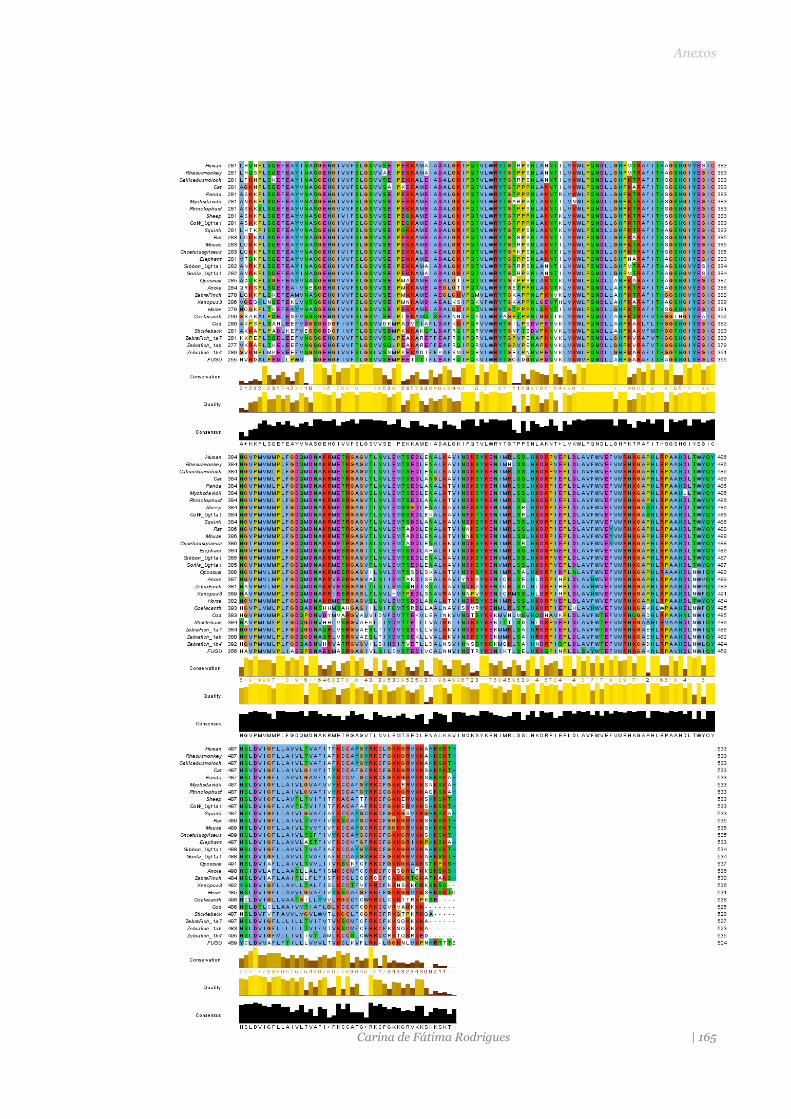
Anexos
Carina de Fátima Rodrigues | 165
Recommended