Embed Size (px)
Citation preview

Castanha,
Encontro com operadores
da grande
distribuição
The Portuguese Chestnut sector
An overview António Borges José Gomes Laranjo
[email protected] [email protected]
Sortegel UTAD
RefCast – Associação Portuguesa da Castanha
Alés, 8 setembro 2016
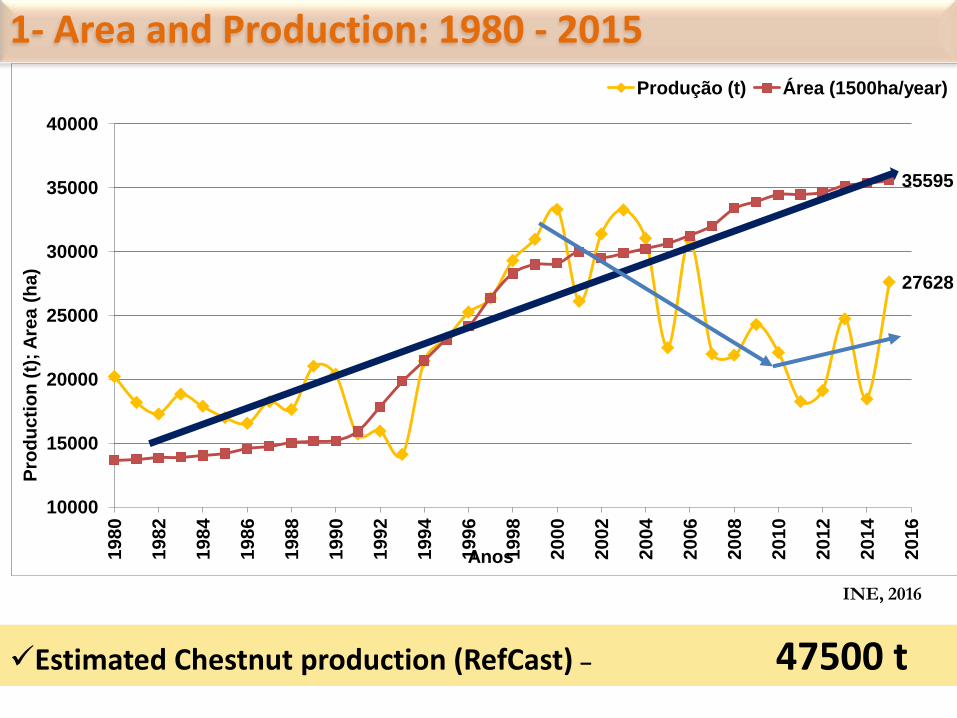
27628
35595
10000
15000
20000
25000
30000
35000
40000 1980
1982
1984
1986
1988
1990
1992
1994
1996
1998
2000
2002
2004
2006
2008
2010
2012
2014
2016
Pro
du
cti
on
(t)
; A
rea
(h
a)
Anos
Produção (t) Área (1500ha/year)
Estimated Chestnut production (RefCast) – 47500 t
INE, 2016
1- Area and Production: 1980 - 2015
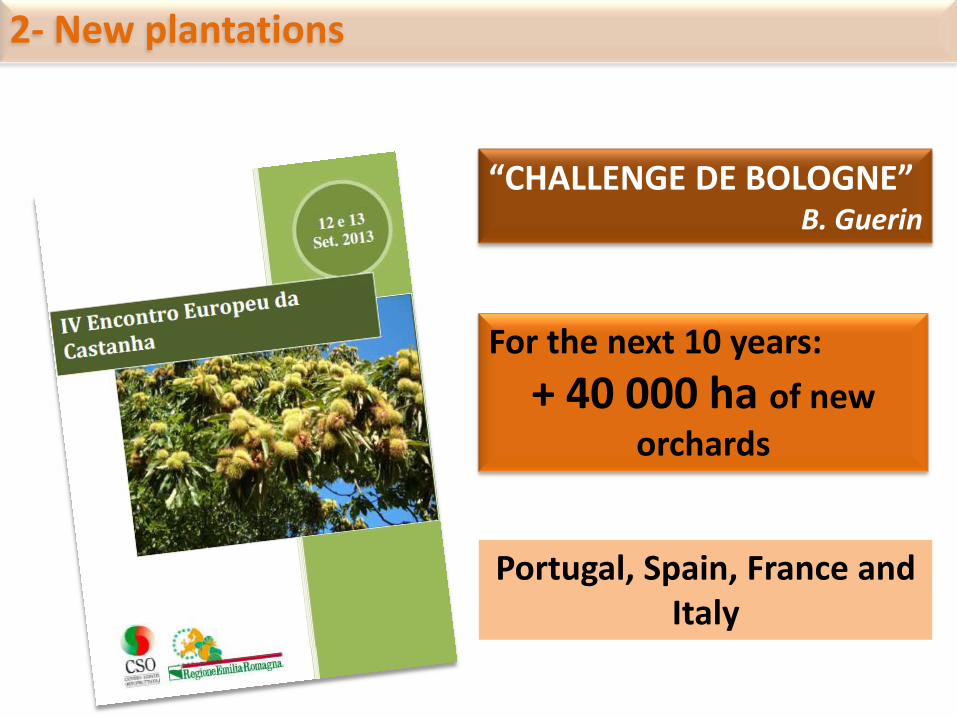
“CHALLENGE DE BOLOGNE” B. Guerin
For the next 10 years:
+ 40 000 ha of new
orchards
Portugal, Spain, France and Italy
2- New plantations
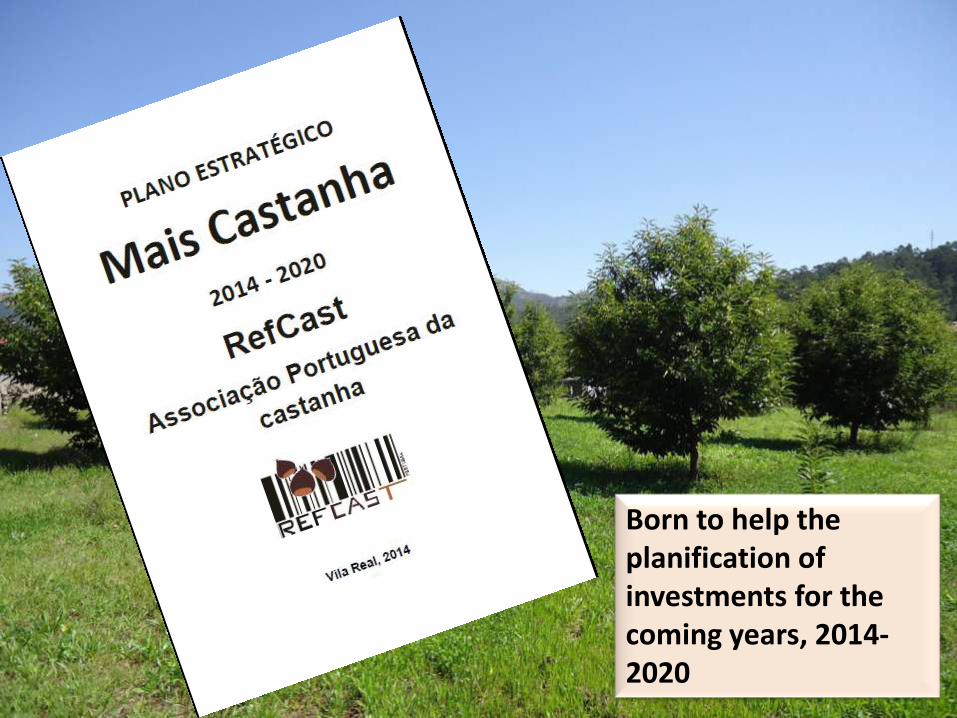
Born to help the planification of investments for the coming years, 2014-2020
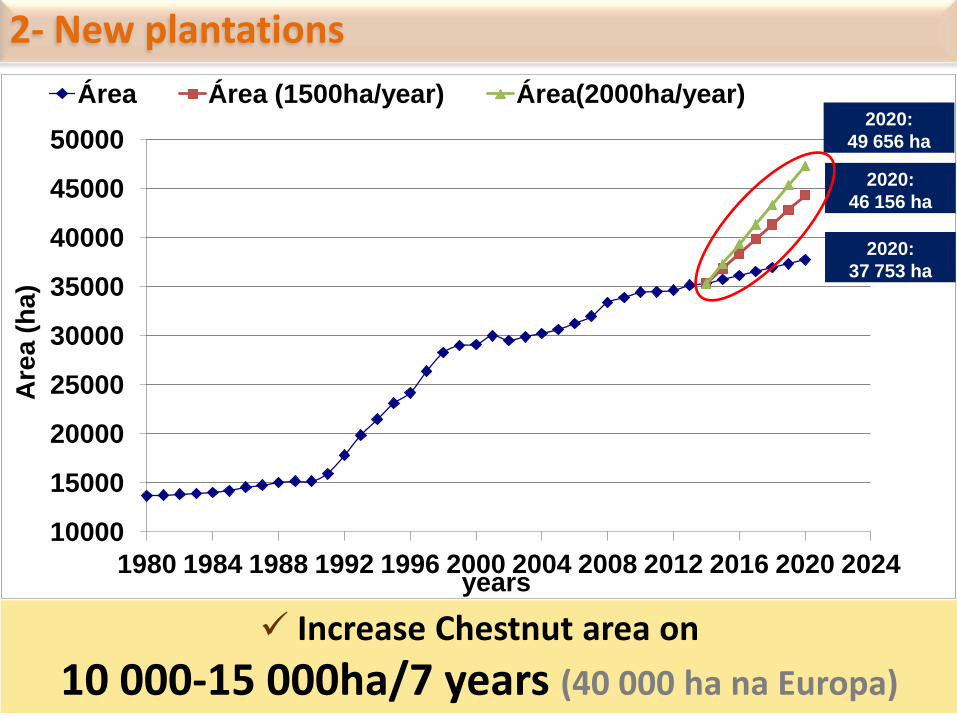
Increase Chestnut area on
10 000-15 000ha/7 years (40 000 ha na Europa)
INE, 2013
2- New plantations
10000
15000
20000
25000
30000
35000
40000
45000
50000
1980 1984 1988 1992 1996 2000 2004 2008 2012 2016 2020 2024
Are
a (
ha
)
years
Área Área (1500ha/year) Área(2000ha/year)
2020:
37 753 ha
2020:
49 656 ha
2020:
46 156 ha

INE, 2015
2- New plantations
Nurseries- sale of chestnuts
In 2015 there were planted an equivalent to 800 ha
121 174
20 000
40 000
60 000
80 000
100 000
120 000
140 000
20
03
20
04
20
05
20
06
20
07
20
08
20
09
20
10
20
11
20
12
20
13
20
14
20
15
Ch
est
nu
ts (
nº)
Time (years)
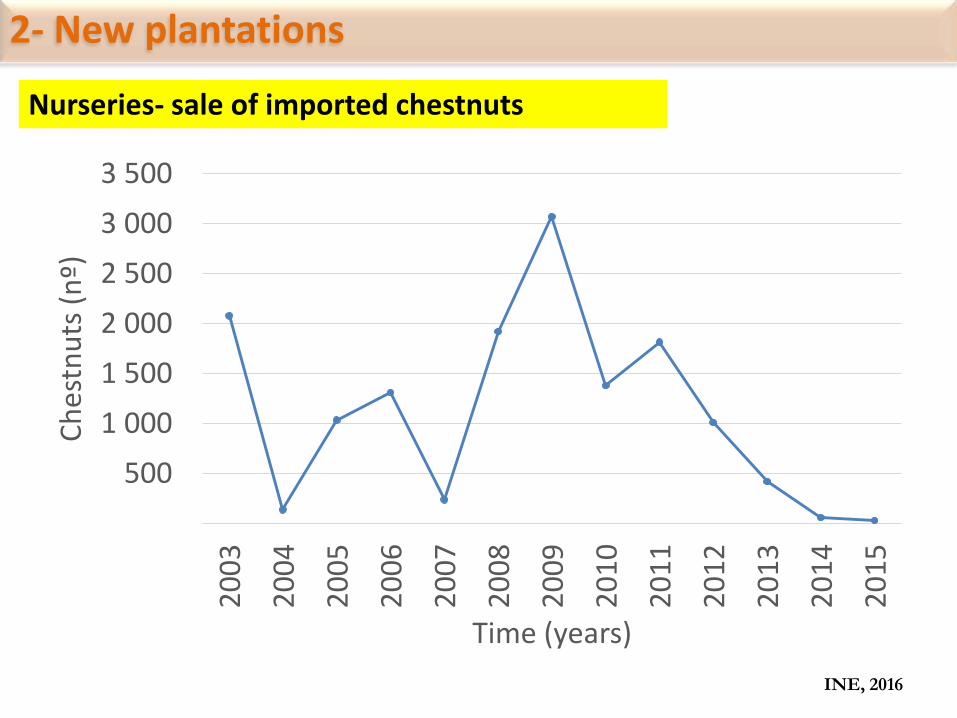
INE, 2016
2- New plantations
Nurseries- sale of imported chestnuts
500
1 000
1 500
2 000
2 500
3 000
3 500
20
03
20
04
20
05
20
06
20
07
20
08
20
09
20
10
20
11
20
12
20
13
20
14
20
15
Ch
est
nu
ts (
nº)
Time (years)
SIMA, 2016
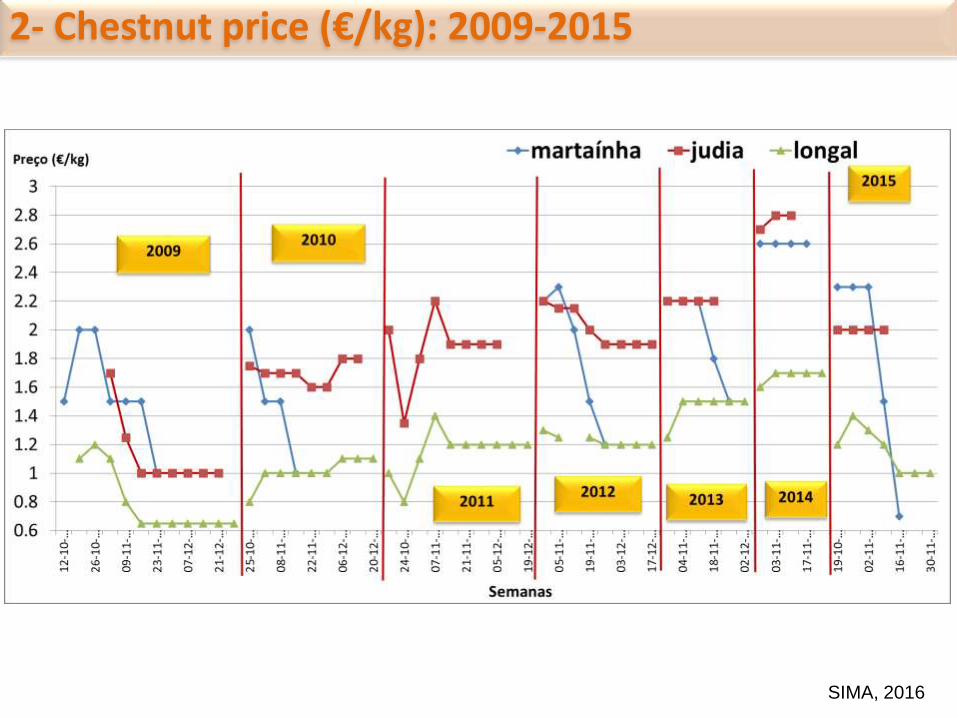
2- Chestnut price (€/kg): 2009-2015
0
5000
10000
15000
20000
25000
30000
35000
2000 2002 2004 2006 2008 2010 2012 2014 2016
Am
ou
nt
(t)
Time (years)
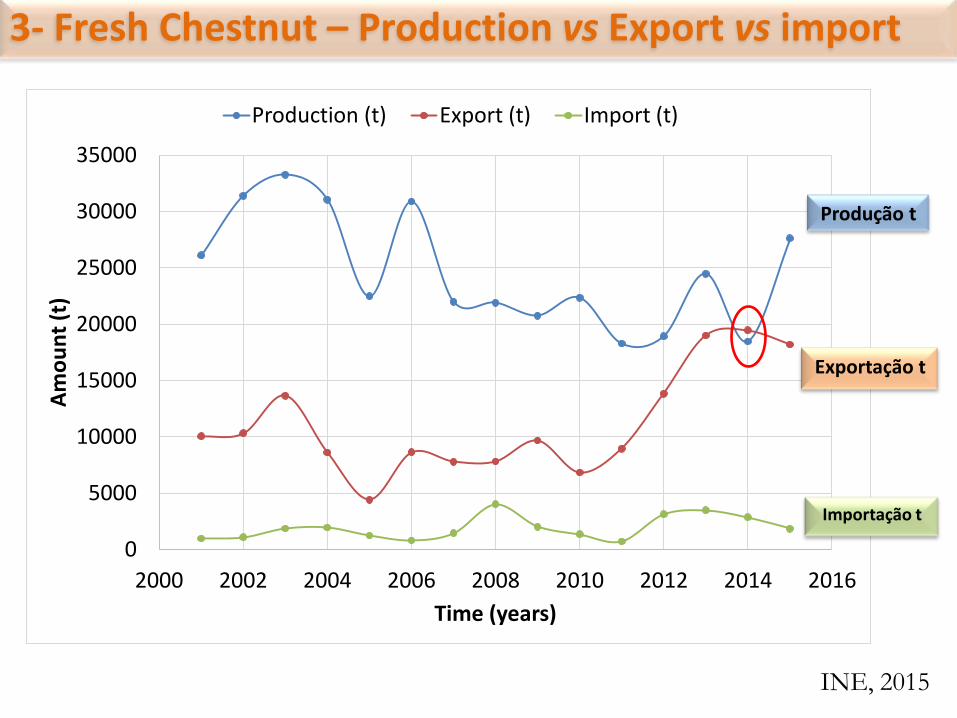
Production (t) Export (t) Import (t)
INE, 2015
Exportação t
Produção t
Importação t
3- Fresh Chestnut – Production vs Export vs import
0
10000
20000
30000
40000
50000
60000
70000
2000 2002 2004 2006 2008 2010 2012 2014 2016
Val
ue
(€
)
Time (years)
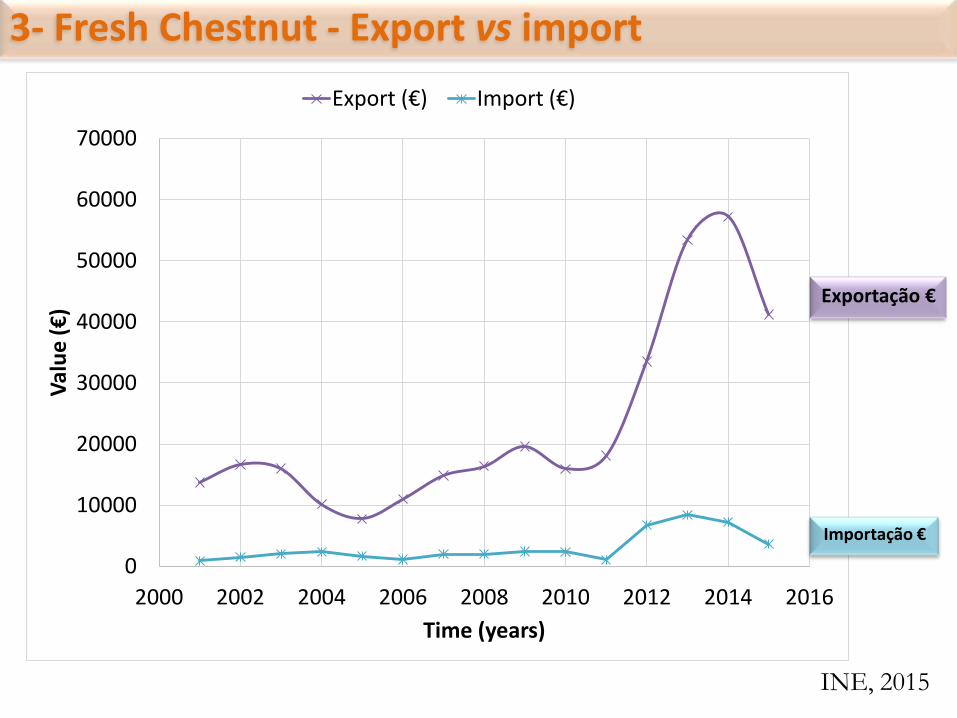
Export (€) Import (€)
INE, 2015
Importação €
3- Fresh Chestnut - Export vs import
Exportação €
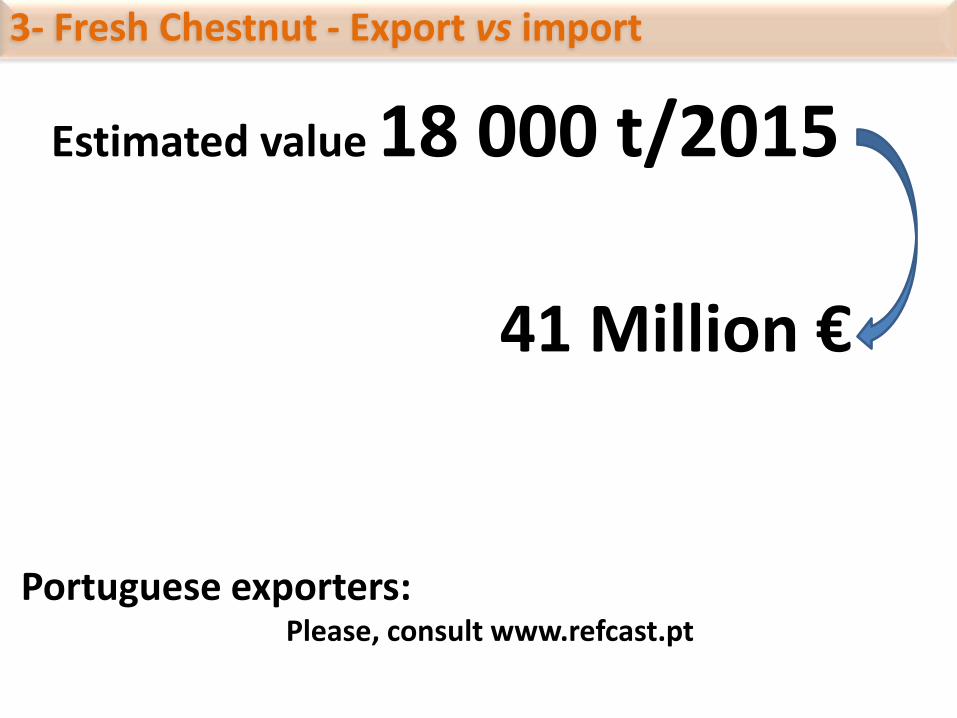
Estimated value 18 000 t/2015
Portuguese exporters: Please, consult www.refcast.pt
41 Million €
3- Fresh Chestnut - Export vs import
Refcast millestones
Increasing the amount of exported nuts Introduction of a Portuguese brand for chestnuts Increasing the national consumption
3- Fresh Chestnut - Export vs import
0,000
0,500
1,000
1,500
2,000
2,500
3,000
3,500
2000 2002 2004 2006 2008 2010 2012 2014 2016
Val
or
/€/k
g)
Tempo (anos)
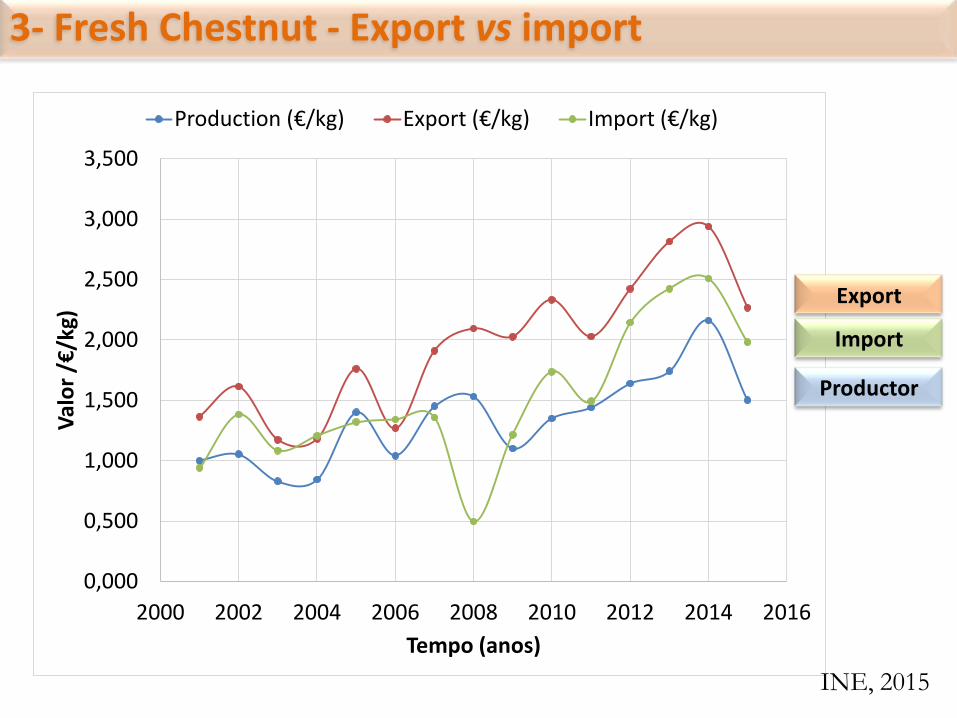
Production (€/kg) Export (€/kg) Import (€/kg)
INE, 2015
Import
Export
3- Fresh Chestnut - Export vs import
Productor
0
500
1 000
1 500
2 000
2 500
3 000
3 500
4 000 Q
uan
tid
ade
t)
Paises
INE, 2015
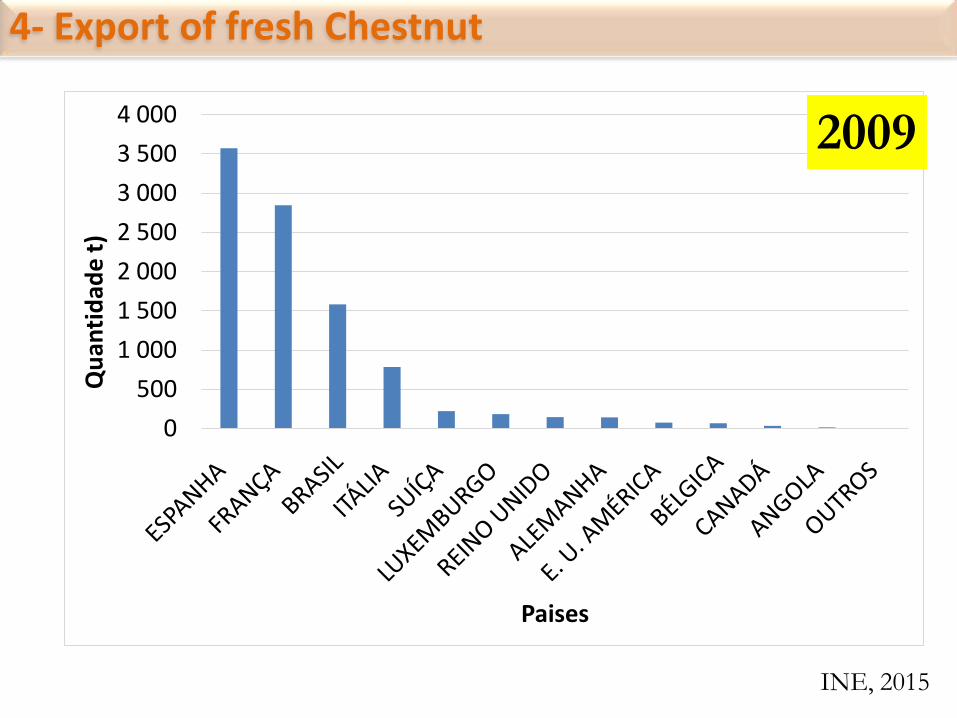
4- Export of fresh Chestnut
2009
0 500
1 000 1 500 2 000 2 500 3 000 3 500 4 000 4 500 5 000
Qu
anti
dad
e (
t)
Paises
INE, 2015
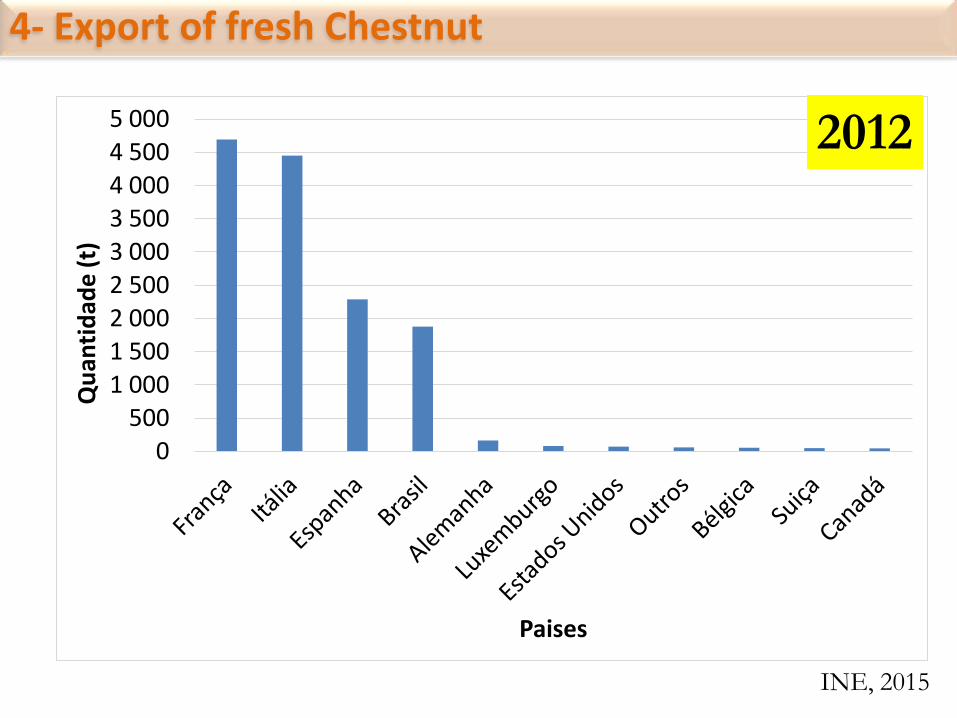
4- Export of fresh Chestnut
2012
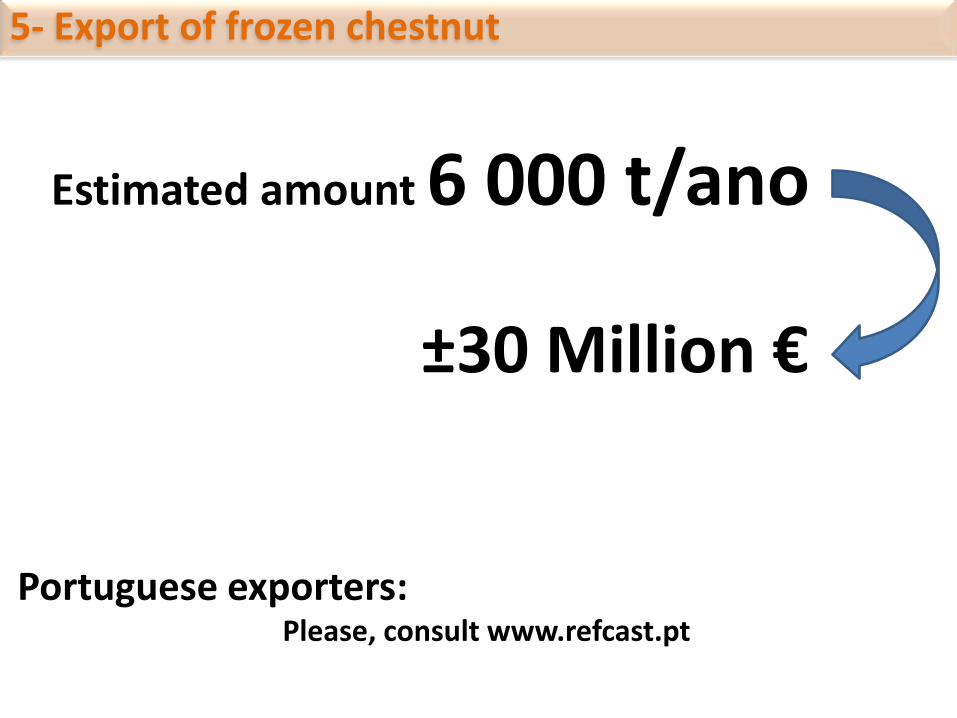
5- Export of frozen chestnut
Estimated amount 6 000 t/ano
Portuguese exporters: Please, consult www.refcast.pt
±30 Million €
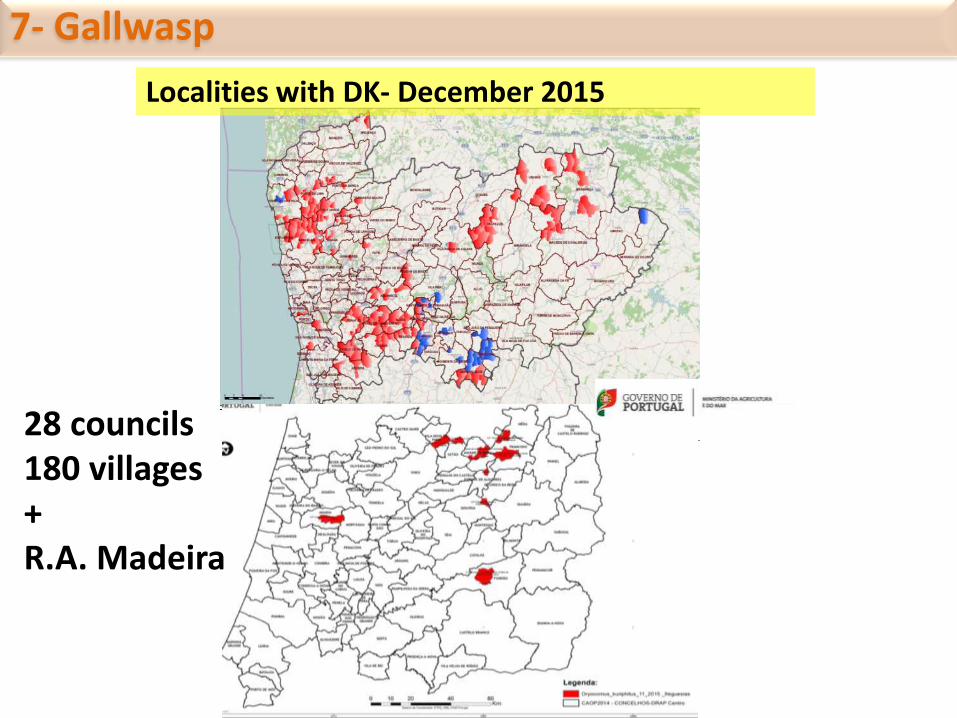
Localities with DK- December 2015
28 councils 180 villages + R.A. Madeira
7- Gallwasp
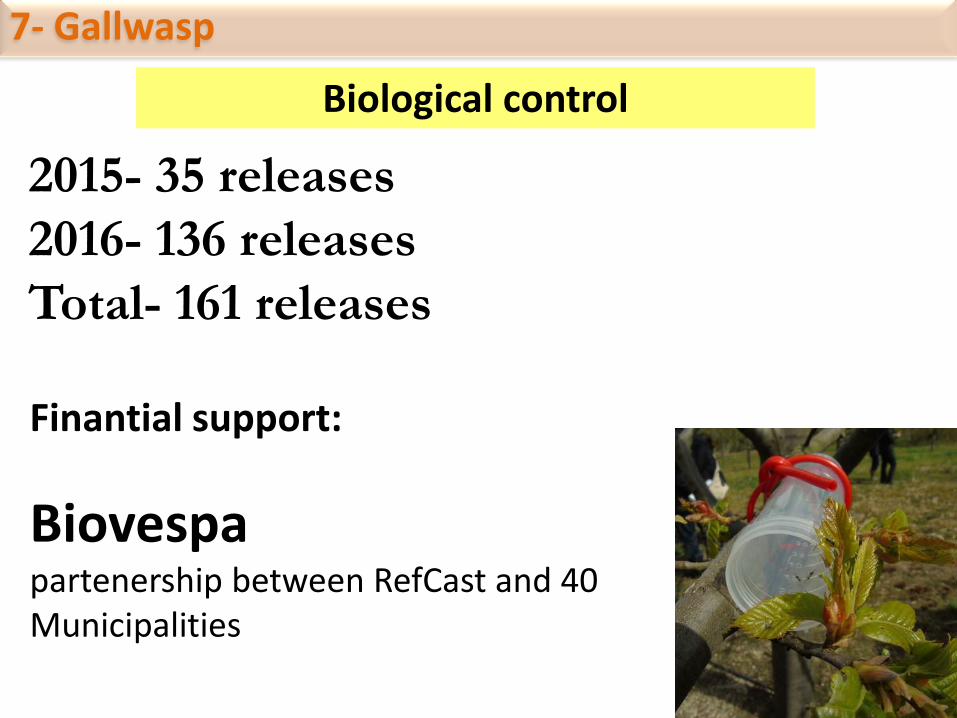
2015- 35 releases
2016- 136 releases
Total- 161 releases
7- Gallwasp
Biological control
Finantial support:
Biovespa partenership between RefCast and 40 Municipalities
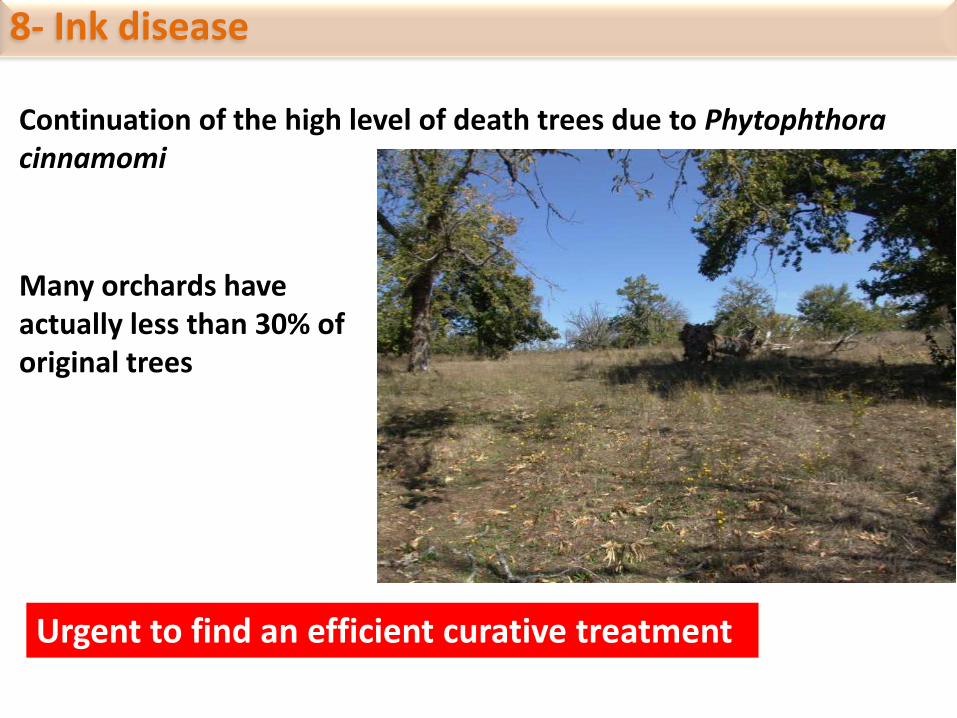
8- Ink disease
Continuation of the high level of death trees due to Phytophthora cinnamomi
Urgent to find an efficient curative treatment
Many orchards have actually less than 30% of original trees
0
500
1000
1500
2000
2500
3000
3500
4000
Jan Fev Mar Abr Mai Jun Jul Ago Set Out Nov Dez
GD
D (
°D)
Month
2004 2005 2006 2007 2008 2009 2010
2011 2012 2013 2014 2015 2016
INE, 2015
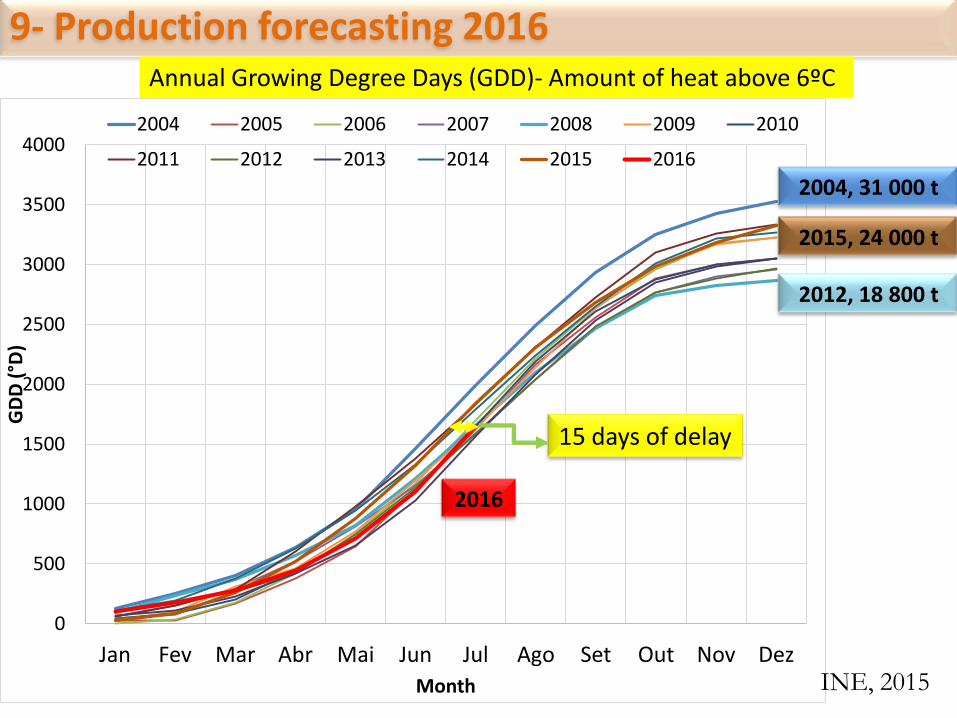
9- Production forecasting 2016
2004, 31 000 t
2015, 24 000 t
2016
2012, 18 800 t
Annual Growing Degree Days (GDD)- Amount of heat above 6ºC
15 days of delay
0,0
5,0
10,0
15,0
20,0
25,0
Tem
per
atu
re (
ºC)
Time (years) INE, 2015
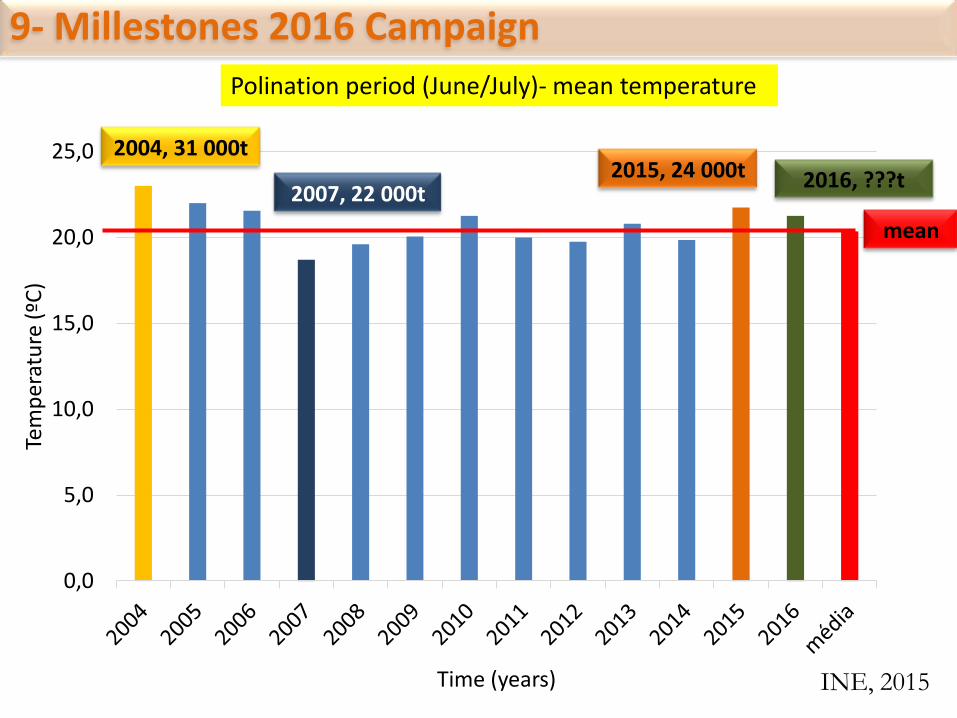
9- Millestones 2016 Campaign
2004, 31 000t 2015, 24 000t
mean
2007, 22 000t
Polination period (June/July)- mean temperature
2016, ???t

0
200
400
600
800
1000
1200
1400
Jan Fev Mar Abr Mai Jun Jul Ago Set Out Nov Dez
Pre
cip
itat
ion
(m
m)
months
2005 2006 2007 2008 2009 2010 2011
2012 2013 2014 2015 2016 média
Water is very importante in this period!!
INE, 2015
2014, 18 000t
2005, 22 000t
2016, ??t Mean
2015, 24 000t
9- Millestones 2016 Campaign
Annual Precipitation
2006, 31 000t
2011, 18 000t
9- Millestones 2016 Campaign
According climatic parameters defined until August, we predict a very good 2016’s campaign with: high amount and quality production similar or better than 2015 IF It rain during September

FIM Obrigado pela atenção