Embed Size (px)
Citation preview

S AO-AI5 824 NAVAL UNOER8ATER SYSTEMS CENTER NEWPORT RI F/B 20/14
SHIPBOARD POWERLINE TRANSFORMERS: H EMISSION CHARACTERISTICS, E--ETC(U)JAN al L J DALSASS
UNCLASSIFIED NUSC-TM-801173 NL*2fffflllllfffmEhEhE hEIEEEIIEEEEEEEEIIEIIIIhEEEIIEIIIIIIIEEEEEI

Ct-C
' Shipboard Powerline Transformers:Z H Emission Characteristics, EMI Models,
and a Test Procedure That UtilizesSimulated Input Signals.
1~- Louis J.lDalsassSubmarine iectrofuin tic--
Systems Department
' ' ' " /1 Januma 81
LNUSCNaval Underwater Systems Center
Newport, Rhode Island * New London, Connecticut
IDISTRIBUTION STATEMENT AApproved for public releaas.
Distribution Unlimited
8 7 10 113 1343-19

NEWPORT, R.I 02841).%F .AREA CODE 401
NAVAL UNDERWATER SYSTEMS CENTER A4,-T. 948 + EXT.HEADQUARTERS NEW LONON, CONN. 06120
ltNEWPORT, RHODE ISLAN 0240 AREA CODE 203442-077t -EXT.AUTO VON 636 + EXT.
'IN REPLY REFER TO:
343:DSD:lrk3912Ser. 1343-197
From: Commanding Officer 1 "To: Commander, Naval Sea Systems Command, Naval Sea Systems Command
Headquarters, (H. DeMattia, Code 61R4); Washington, DC 20362Commander, Naval Electronics Systems Command (J. Cauffman, Code614), Washington, DC 20360
Subj: Electromagnetic Compatibility (EMC).R&D Program Output; forwardingof NUSC Technical Memorandum 801173
Ref: (a) Submarine "Below-Decks" EMC R&D Program (P.E. 62543N)
Encl: (1) NUSC TM 801173 entitled "Shipboard Powerline Transformers:H Emission Characteristics, EMI Models, and a Test Procedurethat Utilizes Simulated Input Signals"
(2) Transformer EMI Model Task: Remaining work(3) Leakage Reactance Transformer Tests
1. The reference (a) program has as one of its objectives to validateelectro-magnetic interference (EMI) models that can be utilized bothmanually as well as in the computer controlled EMC prediction program thatis presently being developed at NUSC.
2. The enclosed Technical Memorandum documents the effort required todevelop a new test procedure and to validate a shipboard powerline trans-former radiated EMI model useful in the 5 kHz to 50 kHz frequency band.This range of frequencies is particularly important because it includesthe VLF communications frequency band. Since typical VLF receivers andcouplers have nanovolt sensitivities, they can be extremely susceptible toradiated electromagnetic interference (EMI). This model will improve theaccuracy of EMC predictions required to ensure the compatibility of "below-decks" electrical/electronic equipment. The transformer leakage magneticfield model considers the following factors:
a. The distance from the center of the transformer to a field lo-cation (R)
b. The shielding effectiveness (S.E.) of the transformer casec. The current spectrum of the input (powerline) harmonicsd. Model limitations (such as endcaps, seams, and gratings)e. The transformer vertical half distance (R )
In summary, the model behaves as follows:a. At distances close to the transformer (R<2.5 Ro), the magnetic
field falls off at a /R3 rate.b. At distances greater than 2.5 Ro, the magnetic field falls off at
a I/Re rate.

343: DSD: irk3912Ser. 1343-197
Subj: Electromagnetic Compatibility (EMC) R&D Program Output; forwarding
The test procedure developed to conduct the transformer model measurementshad the following characteristics:
a. Utilized a broadband noise generator to simulate the effects ofpowerline harmonics in the 5 kHz to 50 kHz frequency range
b. Utilized a Fast Fourier Transform (FFT) Analyzer to rapidly com-plete the number of spectrum averages required to ensure accuratedata
c. Utilized magnetic field normalization to compensate for trans-former current variations (these variations were caused by im-pedance changes and harmonic distortion effects created by themagnetic core)
3. The transformer EMI modeling effort is nearing completion. There are,however, several unresolved questions on the most accurate transformerdistance model and fundamental frequency model to utilize. Mr. L. Dalsasshas begun the tasks described in enclosures (2) and (3), which are expectedto resolve these ambiguities. A final report is expected during the firstquarter of FY82.
VW. S. ADAMSBy direction
Copy to: (w/encl)
NAVSEA 61R4 (H. DeMattia, extra copy)61433 (G. Rees)61434 (R. Peterson)
NAVELEX 51024 (S. Caine)NOSC Code 8105 (Dr. J. Rockway)
Code 9234 (E. Kamm, J. Henry)UPENN (Dr. R. Showers, N00140-81C-BB63)DTICNAVMAT 08DI7NAVMAT 08
I.
VI.

TM 801173
ABSTRACT
Harmonics of the powerline fundamental frequency (60/400 Hz) can be gener-ated whenever nonlinear loads are connected to the power distribution system.In some cases, these currents can be the source of radiated magnetic fieldemissions that adversely affect shipboard equipment. In this memorandum, themagnetic fields from shipboard power transformers were determined using anoffline broadband generator as a source of controlled powerline harmonics atfrequencies up to 50 kHz. Normalizing the flux density, B, by the harmoniccurrent spectral density in the primary winding, I, was found to be an effec-tive method to compensate for impedance changes and harmonic distortion causedby the transformer magnetic core.
It was shown that between 5 and 50 kHz the magnetic fields from trans-formers rated at 200 W to 5 kVA depend on the distance from the center of thetransformer to the field point, the shielding effectiveness of the case, andthe current spectrum of the input harmonics. In this frequency band, a trans-former surface not containing seams or openings behaves similar to an idealshielding boundary with respect to frequency (1-k/2 dependence). At a distanceclose to the transformer, the magnetic fields are proportional to l/.0 (dipolesource); at greater distances they are proportional to lI/R. The transitionoccurs between regions where the leakage inductance and inter conductor-gen-erated magnetic fields, respectively, are dominant.
ADMINISTRATIVE INFORMATION
This memorandum was funded under NUSC Project No. A51000, "SubmarineElectromagnetic Compatibility R&D Program," Principal Investigator, D. S.Dixon, Code 343. The sponsoring organization is Naval Electronics SystemsCommand; Mr. J. Cauffman, of Code 3041, is Program Manager. The TechnicalAgent is Mr. H. DeMattia, Code 61R4, of the Naval Sea Systems Command.
Accession For
NTIS GRA&IDTIC TABUnannouncedJustification-
ByDistribution/
Availability CodesAvail and/or
Dist Special
R s i/i
Reverse Blank

TM 801173
TABLE OF CONTENTS
Page
ABSTRACT . . . . . . . . . . . . . . . . . . . . . . . . . . . . . . . . i
ADMINISTRATIVE INFORMATION ......... .......................
LIST OF ILLUSTRATIONS ......... .......................... v
INTRODUCTION ..... ............. ...................... .. 1
DISCUSSION ........... ............................... 2
A. Transformer Magnetic Fields .... ... .................. 2
B. Transformer Models ........ ....................... 3
C. Magnetizing Inductance ....... ..................... 4
D. Leakage Inductance ........ ....................... 5
E. Instrumentation .... ... .. ........................ 5
F. Transformer Test Models .... .... .................... 7
G. Data Analysis ....... .. ......................... 8
H. Broadband Input Characteristics .... .. ................ 9
I. Magnetic Field Measurements/Calculations .... ............ 9
J. Discussion of Probe Separation Geometry .... ............ 11
K. Comparison of Normalized Transformer
Magnetic Fields (B/I) at 25 kHz .... ................ .12
L. Effect of Internal Conductors on
Transformer Leakage Fields ..... .................. .13
M. Open-Circuited Secondary Winding (Effect on Inversion) ....... 15
N. Data Summary and Analysis ..... ................... .15
0. Comments on Transformer Shielding Models (5 to 50 kHz) ....... 20
P. Comparison of Transformer Leakage
Fields Versus Frequency ...... .................... .22
Q. High Frequency Leakage Field Model ... ............... .. 23
R. Relationship of Primary-Current
Spectrum I(f) to Susceptor-Coupled EMI ... ............ .. 24
S. Leakage Field Versus Distance Models ... ............. .. 26
T. EMI Implications of the Test Results ... .............. .28
iii

TM 801173
TABLE OF CONTENTS (Cont'd)
Page
CONCLUSIONS .. .. ...... ...... ...... ...... .... 30
ACKNOWLEDGMENTS. .. .... ...... ..... ...... ...... 31
REFERENCES. .. ...... ...... ...... ...... ..... 89
iv

TM 801173
LIST OF ILLUSTRATIONS
Figure Page
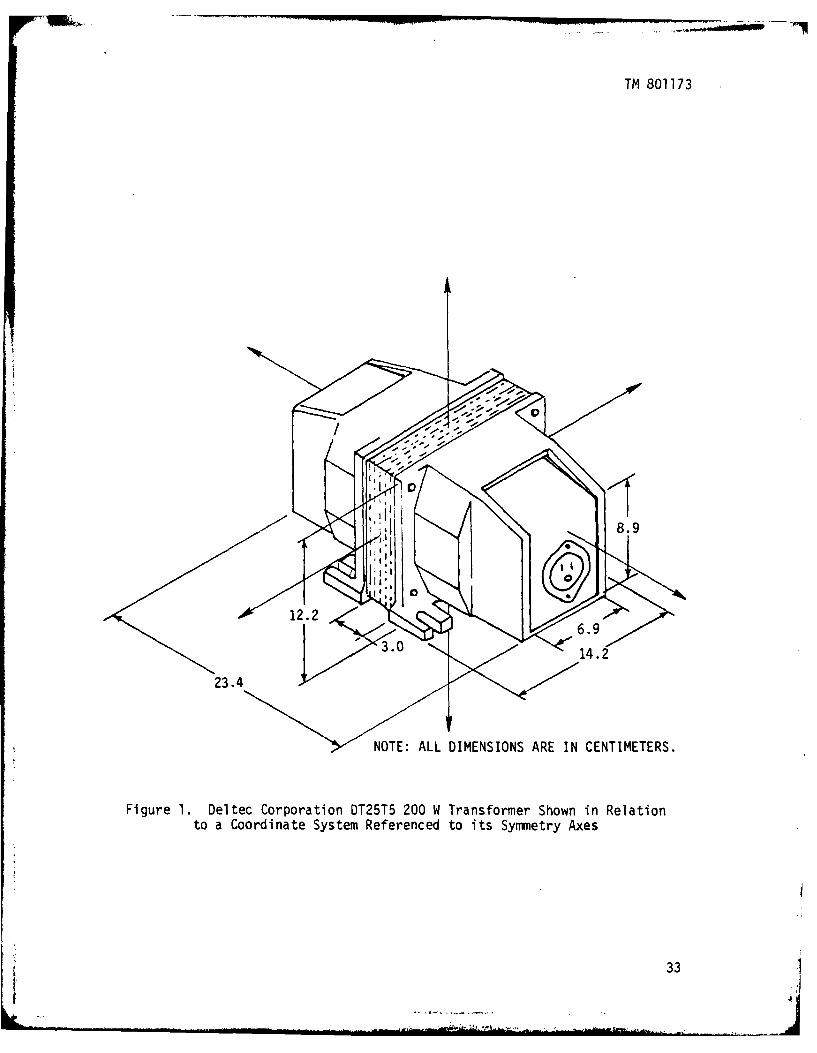
1 Deltec Corporation DT25T5 200 W TransformerShown in Relation to a Coordinate SystemReferenced to its Symmetry Axes ..... .............. 33
2 General Electric 9T51YI3 3 kVA TransformerShown in Relation to a Coordinate SystemReferenced to its Symmetry Axes .... .............. .34
3 Jefferson Electric 5 kVA Transformer, Serial 12438,Shown in Relation to a Coordinate SystemReferenced to its Symmetry Axes .... .............. .35
4 Horizontal Section of the Test Probe ShowingSome Construction Details .... .. ................. 36
5 Series-Induced Open-Circuit Probe Voltage for a 1-GaussMagnetic Field at Frequencies Up to 100 kHz .......... .36
6 Approximate Transformer Equivalent Circuitfor a Turns Ratio (n) of 1:1. ...... ................ 37
7 Hysteresis Loop for a Typical Transformer Laminationand Transformer Magnetizing Inductance Model .......... .38
8 Block Diagram of Wide-Band Measurement System Usedto Measure Transformer Magnetic Fields ............. .39
9 Circuit Diagram of Break-In Box Used in theWide-Band Instrumentation System ... .............. .40
10 Approximate Transfer Equivalent Circuits With anAssumed Turns Ratio of Unity, n = 1:1. ... ........... .41
11 Diagram for Adding or Subtracting Decibels (Courtesyof General Radio Co., West Concord, MA) ... .......... .42
12 Comparison of Flux Density at 25 kHz at DifferentLocations in the Leakage Field of TransformersNormalized to 1 A of Primary-Winding CurrentWith a Short-Circuited Secondary Winding ............ .43
13 Input Voltage and Current Spectral Densitiesfor a 200 W Transformer ..... .................. .44
14 Probe Voltage Versus Frequency Plots as a Function ofProbe Distance From the Top Surface of the DT25T5 200 WTransformer as the Probe Was Moved Along the VerticalCoordinate Axis Shown in Figure 1 .... ............. .45
15 Normalized Flux Density at the Top Surface of the200 W Transformer (Center of Laminations) ... ......... 46
V--.

TM 801173
LIST OF ILLUSTRATIONS (Cont'd)
Figure Page
16 Probe Voltage Versus Frequency Plots as a Function ofProbe Distance From the Top Surface of the DT25T5Transformer as the Probe Was Moved Along a VerticalAxis Intersecting the Edge of the Lamination Stack ....... 47
17 Normalized Flux Density at the Top Surface of the200 W Transformer (Edge of Laminations) ... .......... .48
18 Probe Voltage Versus Frequency Plots as a Function ofProbe Distance From the Side of the DT25T5 200 WTransformer as the Probe Was Moved Along theHorizontal Axis Shown in Figure 1 .... ............. .49
19 Normalized Flux Density at the Sideof the 200 W Transformer ....... .................. 50
20 Probe Voltage Versus Frequency Plots as a Function ofProbe Distance From the Primary-Side Endcap of theDT25T5 200 W Transformer as the Probe Was MovedAlong the Horizontal Axis Intersecting theEndcap Shown in Figure 1 ..... .................. .51
21 Normalized Flux Density at the PrimaryEndcap of the 200 W Transformer .... .............. .52
22 Probe Voltage Versus Frequency Plots as a Function ofProbe Distance From the Secondary Side Endcapof the DT25T5 200 W Transformer .... .............. .53
23 Normalized Flux Density at the SecondaryEndcap of the 200 W Transformer .... .............. .54
24 Probe Voltage Versus Frequency Plots as a Function ofProbe Distance From the Secondary Side Endcap ofthe DT25T5 200 W Transformer(Open-Circuited Secondary) ..... ................. .55
25 Input Voltage and Current SpectralDensities for a 3 kVA Transformer .... ............. .56
26 Probe Voltage Versus Frequency Plots as a Function ofProbe Distance From the Top Surface of a 3 kVAGE 9T51Y13 Transformer as the Probe Was MovedAlong a Vertical Axis Intersecting the Narrow Seamin the Transformer Cover Shown in Figure 2 ........... .. 57
27 Normalized Flux Density at the Top Surface of the 3 kVATransformer Above the Narrow Seam in the Cover ......... 58
28 Probe Voltage Versus Frequency Plots as a Function ofProbe Distance From the Top Surface of a 3 kVAGE 9T51YI3 Transformer as the Probe Was Moved Alonga Vertical Axis Intersecting the Center of theLamination Stack Shown in Figure 2 ... ............. .59
vi

TM 801173
LIST OF ILLUSTRATIONS (Cont'd)
Figure Page
29 Normalized Flux Density at the Top Surfaceof the 3 kVA Transformer Above theCenter of the Lamination Stack ..... ............... 60
30 Probe Voltage Versus Frequency Plots as a Function ofProbe Distance From the Top Surface of a 3 kVAGE 9T51Y13 Transformer (Open-Circuited Secondary) ..... .. 61
31 Probe Voltage Versus Frequency Plots as a Function ofProbe Distance From the Side of the 3 kVA GE9T51Y13 Transformer as the Probe Was Moved Alongthe Horizontal Axis Shown in Figure 2 .. ........... .. 62
32 Normalized Flux Density at the Sideof the 3 kVA Transformer ....... .................. 63
33 Probe Voltage Versus Frequency Plots as a Function ofProbe Distance From the Side of a 3 kVA GE 9T51Y13Transformer (Open-Circuited Secondary) ............. .64
34 Probe Voltage Versus Frequency Plots as a Function ofProbe Distance From the I/O Endcap of a 3 kVA GE9T51Y13 Transformer as the Probe Was Moved Alongthe Horizontal Axis Shown in Figure 2 .... ........... 65
35 Normalized Flux Density at the 1/0Endcap of the 3 kVA Transformer ..... .............. 66
36 Probe Voltage Versus Frequency Plots as a Function ofProbe Distance From the I/O Endcap of a 3 kVA GE9T51Y13 Transformer (Open-Circuited Secondary) ......... 67
37 Probe Voltage Versus Frequency Plots as a Function ofProbe Distance From the Endcap Opposite the 1/0Endcap of the 3 kVA GE 9T51Y13 Transformer as theProbe Was Moved Along the HorizontalAxis Shown in Figure 2 ..... ................... .68
38 Normalized Flux Density at the Endcap Opposite theI/O Endcap of the 3 kVA Transformer ...... ......... 69
39 Input Voltage and Current SpectralDensities for a 5 kVA Transformer ... ............. .70
40 Probe Voltage Versus Frequency Plots as a Function ofProbe Distance From the Top Surface of the JeffersonElectric 12438 Transformer as the Probe Was MovedAlong a Vertical Axis Intersecting the Center of theSeam Nearest the Endcap Shown in Figure 3 ... ......... 71
41 Normalized Flux Density at the Top Surface of the 5 kVATransformer Above the Seam Nearest the Endcap ........ .. 72
vii

TM 801173
LIST OF ILLUSTRATIONS (Cont'd)
Figure Page
42 Probe Voltage Versus Frequency Plots as a Functionof Probe Distance From the Top Surface of theJefferson Electric 12438 Transformer as theProbe Was Moved Along a Vertical AxisIntersecting the Center of the Seam Nearestthe Endcap (Open-Circuited Secondary) .. ........... .. 73
43 Probe Voltage Versus Frequency Plots as a Function ofProbe Distance From the Top Surface of theJefferson Electric 12438 Transformer as the ProbeWas Moved Along a Vertical Axis Intersectingthe Center of the Seam Nearest theCenter of the Case Shown in Figure 3 .... ............ 74
44 Normalized Flux Density at the Top Surface of the5 kVA Transformer Above the SeamNearest the Center of the Case ..... ............... 75
45 Probe Voltage Versus Frequency Plots as a Function ofProbe Distance From the Side of the JeffersonElectric 12438 Transformer as the Probe WasMoved Along the Horizontal Axis Shown in Figure 3 ..... .. 76
46 Normalized Flux Density at the Sideof the 5 kVA Transformer ....... .................. 77
47 Probe Voltage Versus Frequency Plots as a Function ofProbe Distance From the Side of the JeffersonElectric 12438 Transformer (Open-Circuited Secondary) . . . 78
48 Probe Voltage Versus Frequency Plots as a Function ofProbe Distance From the Endcap of the Jefferson
Electric 12438 Transformer (Side WithOpen Grating) Shown in Figure 3 .... .............. .79
49 Normalized Flux Density at the Endcap (OpenGrating) of the 5 kVA Transformer .... ............. .80
50 Comparison of the Maximum Leakage Flux Density From a200 W, a 3 kVA, and a 5 kVA Transformer in Unitsof Decibels Relative to 1 Gauss Normalized to 1 Aof Primary-Winding Current (B/I) VersusFrequency With the Location of the RespectiveTransformer Surface Identified at the Right .......... .81
51 Comparison of the Leakage Flux Density From a 200 W,a 3 kVA, and a 5 kVA Transformer in Units ofDecibels Relative to 1 Gauss Normalized to I' Aof Primary-Winding Current (B/I) VersusFrequency With the Location of the RespectiveTransformer Surface Identified at the Right .......... .82
52 Normalized Flux Density at the Top Surface of a200 W Transformer Versus Spacing ... .............. .83
viii

TM 801173
LIST OF ILLUSTRATIONS (Cont'd)
Figure Page
53 Normalized Flux Density at the Side of a200 W Transformer Versus Spacing ..... .............. 84
54 Normalized Flux Density at the Primary Endcapof a 200 W Transformer Versus Spacing .. ........... .. 85
55 Normalized Flux Density at the Top SurfaceSeam of a 3 kVA Transformer Versus Spacing ........... .. 86
56 Normalized Flux Density at the EndcapOpposite the I/0 Endcap of the 3 kVATransformer Versus Spacing ...... ................. 87
57 Normalized Flux Density at the Side of the5 kVA Transformer Versus Spacing ..... .............. 88
ix/xReverse Blank

TM 801173
SHIPBOARD POWERLINE TRANSFORMERS: H EMISSION CHARACTERISTICS,EMI MODELS, AND A TEST PROCEDURE THAT
UTILIZES SIMULATED INPUT SIGNALS
INTRODUCTION
Power-system related electromagnetic interference (EMI) is a frequent
cause of performance degradation for equipment operating on both submarines
and surface ships. In many cases, the interference is caused by magnetic
fields generated by such common powerline emitters as cables, switchboards, or
transformers, which inductively couple into low-level input circuitry found in
various very low frequency (VLF) or sonar receiver subsystems.
The most likely sources of such magnetic fields at sonar/VLF frequencies
are the powerline harmonics generated by nonlinear loading of the power distri-
bution system. This loading occurs if equipments containing power supply rec-
tifiers or other pulsing loads are connected to the power line.
Because the harmonic amplitudes vary in unpredictable ways due to chang-
ing load conditions, equipment connections, etc., they are usually unsuitable
as exciting sources for tests on power devices requiring controlled harmonic
inputs. The objectives of this memorandum are to report on test results for
the magnetic fields generated by power transformers excited from an offline
source at frequencies up to 50 kHz. The tests employed a wide-band calibrated
Gaussian noise source and a power-amplifier driver that allowed broadband
testing of the transformers (to be accomplished simultaneously) at frequencies
from 5 through 50 kHz.
For these measurements, the driver-output spectrum was neither filtered
nor shaped, in effect supplying approximately the same input-voltage spectral
density to the transformer under test. The effects on the leakage fields, due
to changes in input amplitude could, however, be observed by adjusting the
power-amplifier output.
.............................

TM 801173
DISCUSSION
A. TRANSFORMER MAGNETIC FIELDS
The leakage fields surrounding magnetic devices, such as transformers,
possess aspect symmetries that depend on the orientation of the primary and
secondary windings.l,2 The magnetic fields generated from the power trans-
formers under test were measured by moving an air-cored magnetic probe to
different locations in the transformer's external leakage field. To permit
acceptable spatial resolution of the field "pattern", a probe with small
cross-sectional area was used to approximate a localized point sensor.
Magnetic-flux density measurements were taken along all principal sym-
metry axes (relative to the lamination core) of the transformers as well as
near physical features of the transformers that might contribute to large
stray field components. These measurement points included field points adja-
cent to seams and gratings in the transformer case and input/output (I/O)
connectors for both open-circuited and short-circuited secondary winding con-
ditions.
In these tests, the probe "sensed" the normal or perpendicular component
of the leakage field, i.e., the plane of the probe was parallel to the trans-
former enclosure. Figures I through 3 illustrate the three test transformers,
which ranged from 200 W to 5 f.VA, respectively. The normal component of the
leakage field is parallel to the Cartesian coordinate axes shown in the fig-
ures.
Figure 4 shows details of the probe construction. The transmission line
to the probe is a twisted shielded pair to prevent EMI from coupling into the
line conductors by undesired magnetic and common-mode electric fields. The
maximum open-circuit voltage induced in such an air-cored probe that is placed
in a uniform sinusoidal magnetic field is given by
lel = NAwB = KfB . (1)
From equation (1),
K = 27rNA , (2)
where
el = the maximum induced voltage (volts),
2
TM 801173
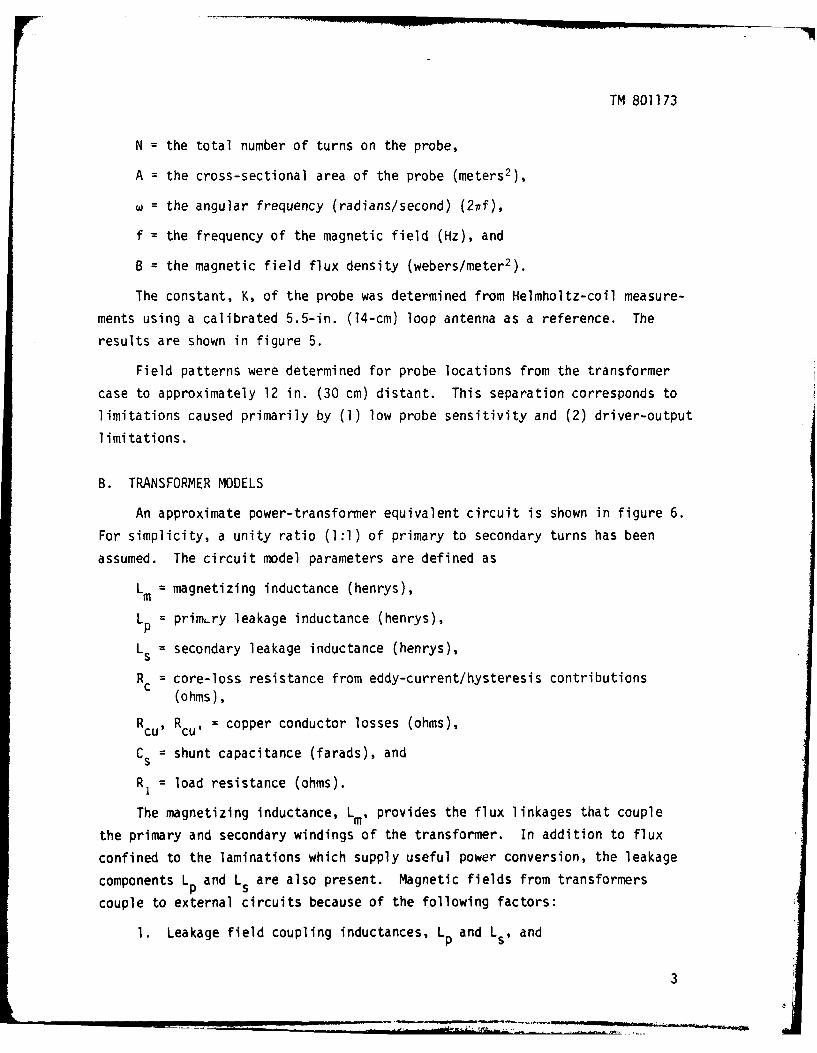
N = the total number of turns on the probe,
A = the cross-sectional area of the probe (meters2 ),
w = the angular frequency (radians/second) (24f),
f = the frequency of the magnetic field (Hz), and
B = the magnetic field flux density (webers/meter2 ).
The constant, K, of the probe was determined from Helmholtz-coil measure-
ments using a calibrated 5.5-in. (14-cm) loop antenna as a reference. The
results are shown in figure 5.
Field patterns were determined for probe locations from the transformer
case to approximately 12 in. (30 cm) distant. This separation corresponds to
limitations caused primarily by (1) low probe sensitivity and (2) driver-output
limitations.
B. TRANSFORMER MODELS
An approximate power-transformer equivalent circuit is shown in figure 6.
For simplicity, a unity ratio (1:1) of primary to secondary turns has been
assumed. The circuit model parameters are defined as
Lm = magnetizing inductance (henrys),
Lp = primary leakage inductance (henrys),
Ls = secondary leakage inductance (henrys),
R = core-loss resistance from eddy-current/hysteresis contributions(ohms),
Rcu, Rcu, = copper conductor losses (ohms),
Cs = shunt capacitance (farads), and
R, = load resistance (ohms).
The magnetizing inductance, Lm, provides the flux linkages that couple
the primary and secondary windings of the transformer. In addition to flux
confined to the laminations which supply useful power conversion, the leakage
components Lp and L are also present. Magnetic fields from transformers
couple to external circuits because of the following factors:
1. Leakage field coupling inductances, Lp and Ls, and
3
TM 801173
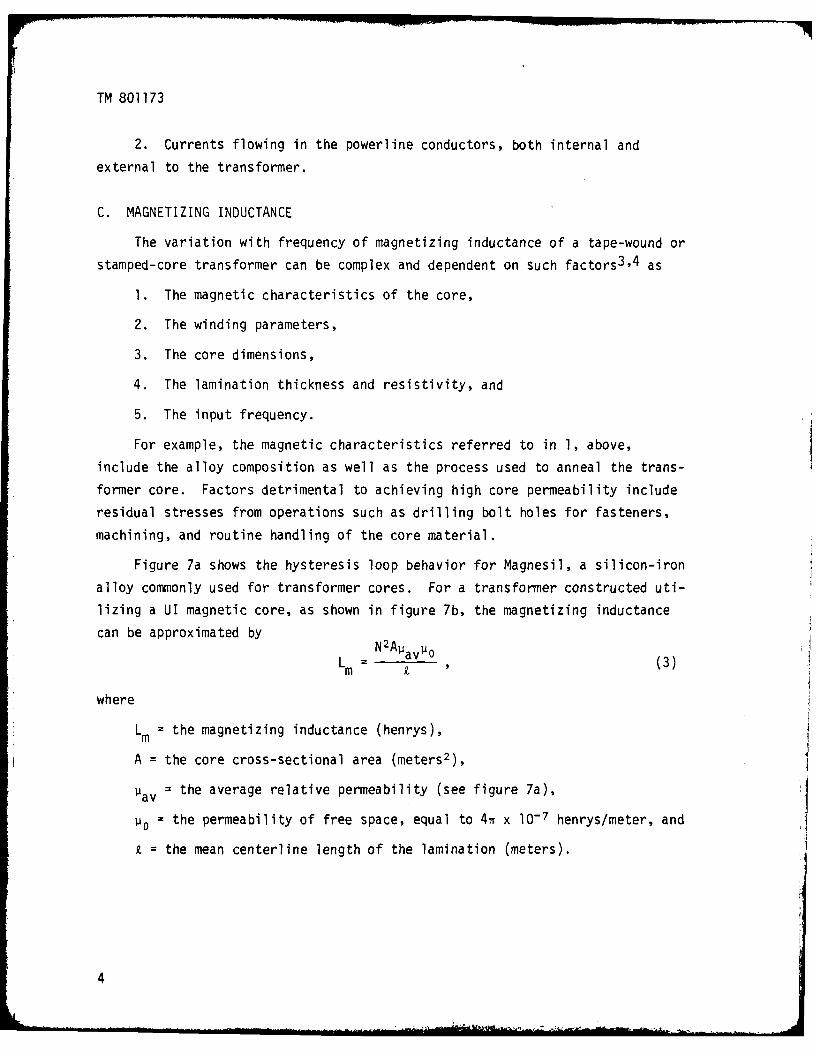
2. Currents flowing in the powerline conductors, both internal and
external to the transformer.
C. MAGNETIZING INDUCTANCE
The variation with frequency of magnetizing inductance of a tape-wound or
stamped-core transformer can be complex and dependent on such factors3 ,4 as
1. The magnetic characteristics of the core,
2. The winding parameters,
3. The core dimensions,
4. The lamination thickness and resistivity, and
5. The input frequency.
For example, the magnetic characteristics referred to in 1, above,
include the alloy composition as well as the process used to anneal the trans-
former core. Factors detrimental to achieving high core permeability include
residual stresses from operations such as drilling bolt holes for fasteners,
machining, and routine handling of the core material.
Figure 7a shows the hysteresis loop behavior for Magnesil, a silicon-iron
alloy commonly used for transformer cores. For a transformer constructed uti-
lizing a UI magnetic core, as shown in figure 7b, the magnetizing inductance
can be approximated by N2A avP oLm ao (3)m
where
Lm = the magnetizing inductance (henrys),
A : the core cross-sectional area (meters2 ),
Pav = the average relative permeability (see figure 7a),
Po the permeability of free space, equal to 4n x 10- 7 henrys/meter, and
= the mean centerline length of the lamination (meters).
4

TM 801173
D. LEAKAGE INDUCTANCE
In addition to the mutual flux that couples the primary and secondary
windings in a magnetic-cored power conversion device, a smaller leakage flux
component confined primarily to an air path is also present. Because the
leakage path is through the air, this inductance can be viewed as being equiv-
alent to an air-core inductor. 5
As a general rule, the leakage inductance depends on the following vari-
ables:
1. The spacing between the primary and secondary windings,
2. The amount of coil "build",
3. The winding widths, and
4. The number of primary/secondary turns.
E. INSTRUMENTATION
Leakage Field Measurements
Figure 8 is a block diagram of the instrumentation for a wide-band noise
system employing a fast Fourier transform (FFT) processor and display system.
The objective of the measurement system is to utilize the speed and ease of
operation of a digital-based spectrum analyzer in conjunction with a wide-band
Gaussian noise source to provide an automated broadband analysis capability.
Remarkable improvements in speed with subsequent improvements in effi-
ciency are possible with broadband digital-based measurement systems relative
to sinusoidal testing. This last factor becomes an important consideration in
the evolution of equipment data for inclusion in computer-based data banks
such as those needed for the electromagnetic compatibility (EMC) R&D program.
Wide-Band Driver
Figure 9 is a circuit diagram of the junction box used to monitor the
line currents and voltages supplied to the transformer under test. Toroids
L, L and L4 are used to sense the differential line currents . 12 and29 3' 2
13. T1, T2, and T3 are stepdown transformers used to monitor the input
5

TM 801173
voltage. Since our tests were conducted on single-phase transformers, only
input lines A and B were monitored. Transformer power ratings ranged from 0.2
to 5 kVA.
FFT Spectrum Analysis
A Nicolet 446 spectrum analyzer was employed for 1/0 analysis of the
broadband transformer magnetic fields. The availability of FFT instruments
with highly automated user controls has simplified greatly the wide-band test-
ing of components and systems. In particular, the Nicolet 446 analyzer has
front-panel controls that automate all of the operations needed to perform
sampling, filtering, and analog-to-digital (A/D) conversion of the input sig-
nal.
The operation of these FFT analyzers relies on the approximation of a
Fourier integral representing the signal spectrum by a discrete transform,6
+CD
F(w) =fC f(t)eJ~t dt (4)
N-1
c(i) = f(kAt)ej2wk i/N (5)
k=O
i = 0,1,2,. .,N-1
where f(t) is the input signal.
A total of N2 terms are required to evaluate the transform coefficients,
c(i), in equation (5). A large reduction in the number of required operations
is possible with instruments using modern FFT algorithms. This results in
considerable simplification in instrument hardware and lower cost and weight.
Spectrum Averaging
The transform coefficient, c2(i), is a measure of the signal power at the
i-th frequency element. For a data record T seconds long, where T is greater
than the transform period, Ts, spectral averaging of the n = T/Ts individual
spectral estimates is accomplished on the Nicolet unit. Averaging is advan-
tageous because of the lower statistical variance of the spectral amplitudes.
6

TM 801173
For most of our tests, 64 averages provided sufficient accuracy and also kept
the averaging time within reasonable limits.
FFT Analyzer Bandwidths
The Nicolet 446 is classified as a 400-line analyzer providing 400 fre-
quency-resolution elements irrespective of the size of the analysis band. For
operation in the 0 to 50 kHz frequency range employed in our tests, the reso-
lution-element bandwidth, a, which is the baseline width of a single frequency,
is
Analysis band (Hz) _ 50 x 1 3 125 Hz (6)Number of frequency elements 4 x 10²
The noise bandwidth, BW, for the Nicolet 446 analyzer is given by7
BW = 1.5a = 187.5 Hz
The conversion of the measured data from a 187.5 bandwidth to a 1 Hz
bandwidth can be accomplished simply by the bandwidth correction
dBV//'%i'= dBV//IFT.5 - 22.7 dB ,
(i.e., a 10 log BW correction factor) where dBV//)l Hz = volts in decibels
relative to a 1 Hz bandwidth.
F. TRANSFORMER TEST MODELS
Open-Circuited Secondary (No Load)
A power transformer with an open-circuited secondary can be approximated
by the model shown in figure lOa. In this case, the secondary leakage react-
ance does not appear in the circuit model since current is not being drawn by
the secondary circuit. The primary exciting current needed to supply the flux
linkages in the core of most transformers is usually less than 10 percent of
full-load current at a fundamental frequency of 60 or 400 Hz.
Short-Circuited Secondary
To facilitate supplying a power transformer with full rated current from
a power-amplifier driver, a short-circuited secondary was used as a test load.
This represents a loading condition of the worst case that a transformer is
7
TM 801173
likely to encounter in operation. However, the input voltage that is required
(for this short-circuited secondary test) is normally only a small fraction of
rated voltage, typically 10 to 15 V for a design input of 100 V. The net
effect is to reduce the driver power requirements.
Since the magnetizing current (exciting current) is small, < 10 percent
of full-load current, an approximate short-circuited model that neglects the
magnetizing inductance, as shown in figure lOb, applies in this case.
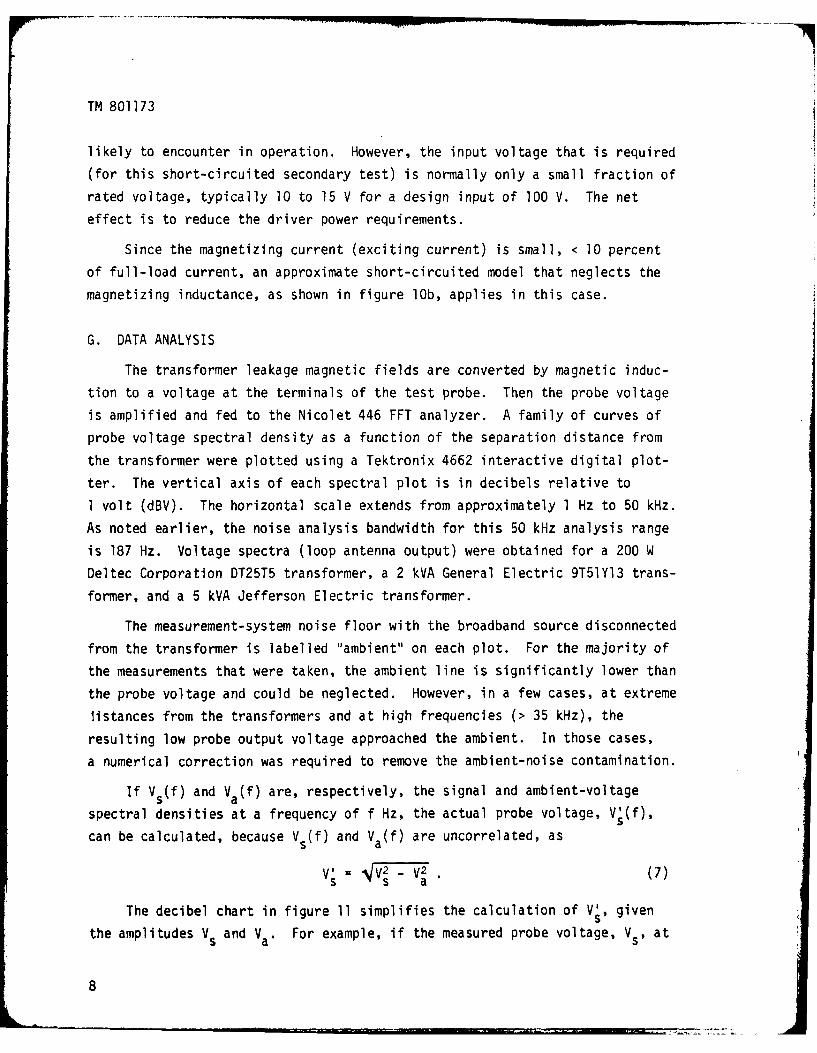
G. DATA ANALYSIS
The transformer leakage magnetic fields are converted by magnetic induc-
tion to a voltage at the terminals of the test probe. Then the probe voltage
is amplified and fed to the Nicolet 446 FFT analyzer. A family of curves of
probe voltage spectral density as a function of the separation distance from
the transformer were plotted using a Tektronix 4662 interactive digital plot-
ter. The vertical axis of each spectral plot is in decibels relative to
1 volt (dBV). The horizontal scale extends from approximately 1 Hz to 50 kHz.
As noted earlier, the noise analysis bandwidth for this 50 kHz analysis range
is 187 Hz. Voltage spectra (loop antenna output) were obtained for a 200 W
Deltec Corporation DT25T5 transformer, a 2 kVA General Electric 9T51Y13 trans-
former, and a 5 kVA Jefferson Electric transformer.
The measurement-system noise floor with the broadband source disconnected
from the transformer is labelled "ambient" on each plot. For the majority of
the measurements that were taken, the ambient line is significantly lower than
the probe voltage and could be neglected. However, in a few cases, at extreme
listances from the transformers and at high frequencies (> 35 kHz), the
resulting low probe output voltage approached the ambient. In those cases,
a numerical correction was required to remove the ambient-noise contamination.
If V s(f) and V a(f) are, respectively, the signal and ambient-voltage
spectral densities at a frequency of f Hz, the actual probe voltage, V'(f),
can be calculated, because V s(f) and V a(f) are uncorrelated, as
s a
The decibel chart in figure 11 simplifies the calculation of Vs, given
the amplitudes Vs and Va. For example, if the measured probe voltage, Vs , at
8

TM 801173
a particular frequency is 6.8 dB above the ambient, the actual voltage, V ,
would be 1 dB less. The 1 dB is the result of contamination of the probe
voltage by the presence of the additional ambient noise. A noise correction,
indicated by an asterisk (*), was applied whenever differences between probe
voltage and ambient were less than 7 dB.
H. BROADBAND INPUT CHARACTERISTICS
The input exciting voltage to the transformer under test was supplied by
a broadband pseudorandom noise generator (Hewlett Packard Model 3722A) and a
McIntosh power-amplifier driver (see figure 8).
The Gaussian noise approximates a flat voltage spectral density for input
frequencies from 1 Hz to 50 kHz. Spectra of the input exciting voltage and
primary current were measured with both open- and short-circuited secondary
windings. For the short-circuited case, operation at full-rated broadband
root-mean-square (rms) current was possible only with the 200 W transformer,
because of a 300 W power-amplifier driver limitation. The (rms broadband)
input voltage and primary winding current levels are labelled adjacent to each
plot.
I. MAGNETIC FIELD MEASUREMENTS/CALCULATIONS
The voltage induced in an air-cored test probe by a magnetic field is
given by equation (1). The factor K, the gain of the probe, is a function of
the probe capture area, NA. For input frequencies less than the resonance
frequency, a well-designed probe will have a linear variation of output voltage
with frequency, as shown in figure 5, where a 1-gauss exciting field was used
to calibrate the probe. Table 1 is a listing of probe output voltages [in
decibels (20 log 10 Kf)] at selected frequencies of 5, 15, 25, 35, and 50 kHz.
These data points were obtained from figure 5.
Table 1. Probe Output for 0 dBG Field Strength
Frequency (kHz) 5 15 25 35 50
Probe Output (dBV) -15.9 -6.4 -1.9 0.98 4.08
9

TM 801173
The probe voltage, Vp, from equation (1), is
Vp = KfB (8)
After subtraction of the preamplifier gain and conversion to decibels
(20 log equation (8) becomes
Vp= Vs(dB) - GA(dB) : Kf(dB) + B(dB) , (9)
where
Vs(dB) : amplified probe voltage (decibels), and
GA(dB) : preamplifier gain (decibels).
From equation (9),
B(dB) = dBG = V s(dB) - dB) - Kf(dB) , (10)
where dBG = flux density in decibels relative to 1 gauss.
Equation (10) can be normalized on a per-unit-current basis (B/I) to
account for differences in transformer exciting current spectral density as
B/I = B(dB) - I(dB) = Vs(dB) - GA(dB) - Kf(dB) - I(dB) (11)
A computer program written for an HP-25C calculator was used to evaluate
B/I from equation (11), given Vs, GAD Kf, and I as input parameters. The
values of V5 and I were obtained from the spectral plots at discrete frequen-
cies of 5, 15, 25, 35, and 50 kHz. The selection of these frequencies was
arbitrary to a certain extent, but the intent was to include sample frequencies
applicable to the sonar and VLF radio bands. It should be noted, however, that
the leakage fields at other frequencies are equally accessible.
An Ithaco preamplifier was used to amplify the probe output voltage. A
gain (Ga) of 30 dB was used in all probe measurements. Values of Ga, Kf, and
I were written into HP-25C storage registers 1, 2, and 3, respectively, as
input entries for calculation of (B/I). A listing of the program steps needed
to implement the calculation of B/I from equation (11) is given below:
1. Initial entries, store in registers:
a. Amplifier gain (G a),
b. Probe factor (Kf), see table 1, and
10

TM 801173
c. Current spectral density (I).
2. Steps:
a. Enter the amplified probe voltage (Vs),5
b. Recall (contents of) register 1,
c. Subtract step b from step a,
d. Recall register 2,
e. Subtract step d from the results of step c,
f. Recall register 3, and
g. Subtract step f from step e.
J. DISCUSSION OF PROBE SEPARATION GEOMETRY
It was noted earlier that the air-cored probe was protected by a poly-
urethane potting compound. The separation distance, d, in the Vs spectral
plots is the distance from the flat lower surface of the probe head to the
transformer case. The mid-plane of the probe, corresponding to the center of
the air-cored loop, was spaced an additional 1.72 cm.
The total distance, D, from the transformer case to the center of the
loop is
O = d + o, (12) d ,
CASE
where d and Do are in cm, and Do = 1.72 cm.
Comparisons of the leakage magnetic-field variation with distance were
made in some cases by converting from absolute separation distance, D, to the
parameter D/D0 , which is the ratio of D to the initial separation value, D.
11

TM 801173
K. COMPARISON OF NORMALIZED TRANSFORMERMAGNETIC FIELDS (B/I) AT 25 kHz
The flux density, normalized to 1 A of primary current (B/I), was calcu-
lated using the probe voltage spectral plots and equation (11). B/I was
determined at frequencies of 5, 15, 25, 35, and 50 kHz. As previously dis-
cussed, these frequencies were selected to provide sufficient coverage in the
sonar/VLF bands but at the same time limit the data analysis and subsequent
summaries to manageable proportions. Values of B/I at any other frequency in
the band can, of course, also be determined using this procedure.
Figure 12 shows the results of this calculation at 25 kHz for the Deltec
Corporation 200 W, General Electric 3 kVA, and Jefferson Electric 5 kVA trans-
formers. The bar graph summarizes the comparative magnitude of leakage fields
for a probe position corresponding to d = 0.
For the Deltec DT25T5 and General Electric (GE) 9T51Y13 transformers, the
largest contributions originate at the top surface at the center of the lami-
nation stack. In each case, the laminations are fully exposed, as shown in
figures 1 and 2.
The absence of shielding over the laminations resulted in the highest
measured values of B/I that were observed. The situation is different in the
case of the 5 kVA transformer, which employs a steel panel over the lamination
stack. The magnetic field at the top surface is more than 50 dB lower than
for the other two smaller units. At the seams in the top surface of the 5 kVA
transformer, flux penetrates through the gaps to the exterior of the enclosure.
However, the resulting magnetic fields at both the center and end seams are
still less than for fully exposed laminations because the narrow gaps permit
only a small percentage of the available flux lines to escape confinement.
The enclosure surfaces of the Deltec DT25T5 and GE 9T51Y13 transformers
that contribute the largest exterior magnetic fields are (1) the top surface
over the core stack, (2) the sides, and (3) the endcaps. In the case of the
5 kVA transformer, the shielding effectiveness of the enclosure generally
inhibits the leakage fields except in the vicinity of seams and openings.
12

TM 801173
L. EFFECT OF INTERNAL CONDUCTORS ONTRANSFORMER LEAKAGE FIELDS
As stated in an earlier section of this memorandum, the leakage fields
from transformers are generated by the following sources:
1. The leakage inductance contributed by the primary and secondary wind-
ings, and
2. The internal conductors connected to the primary and secondary wind-
ings.
The magnitude of the external magnetic field contributed by the leakage
inductance would be expected to decrease as the separation distance from the
transformer enclosure increases. This "fall6ff" with distance can be inter-
preted as resulting from flux spreading at greater distance, in effect leaving
reduced numbers of flux lines per unit area at those locations.
At some transformer surfaces where the fields are relatively low, an
inversion in the distance relationship would occur. That is, at an interme-
diate spacing (nominally 4 to 6 cm), the field would begin to increase with
increasing distance. At some further distance, the field decreases once again.
Numerous examples of this inversion are found in the test results, which
are shown in figures 13 through 57. This inversion, however, did not occur at
high field strength locations, such as the tops of the Deltec DT25T5 and GE 3
kVA transformers. The explanation is that the magnetic fields generated by
the power conductors, internal to the transformer, are much smaller than the
leakage fields in the vicinity of the exposed laminations. However, they
become comparable to the smaller fields originating at the side and endcaps.
An examination of several of the transformers showed that the reason for
the inversion was that the internal conductors of the transformers were inade-
quately twisted and not shielded. At some surfaces, usually close to the con-
ductors (I/0 endcaps), these conductor sources become more significant
contributors to the external field than the magnetic core leakage inductances.
It is interesting to note that all three transformers tested showed inversion
effects at one or more surfaces.
An estimate of the magnetic field generated by the transformer's internal
conductors can be made by assuming a parallel wire-pair model. For this
1't

TM 801173
radiator model, the conductor spacing is assumed to be equal to the approxi-
mate net displacement of the actual conductors. The flux-density component,
By, per ampere of exciting current, I, is given approximately by8
B dY
Z
I 2i0 2 , >> d . (13) d/
Z X
where
D = the coordinate of the field point relative to the center of the wire
pair (meters),
d = the conductor spacing (meters),
By = the component flux density perpendicular to the loop area formed by
the conductors (webers/meter2), and
PO = the magnetic permeability of free space (4r x 10- 7 henrys/meter).
Values of d and D were approximated as d = 0.25 in. 0.007 meter and D = 10
cm = 0.1 meter.
The parameter 0 is the sum of the distances from the conductor pair to
the transformer case (m 6 cm) and from the case to the external field point
(0 4 cm), for a total of 10 cm. From equation (13),_yi : l 0- x 0.0072 0 ) _webers
By 4n x 1070.007 = 1.4 x l0 - 7 (,weerS per ampere
Since 1 gauss = l0- 4 webers/meter2 ,
= 1.4 x 10 3 G/A = 57.1 dBG/AIo
This value of B y/I also must be reduced by the shielding effectiveness of
the transformer enclosure. For example, figure 23a shows the results obtained
for B/I from the secondary endcap of a 200 W DT25T5 transformer versus the
field separation ratio D/D0O At a frequency of 5 kHz and a separation param-
eter of D/D0 Z 6.0, B/I = -70.1 dBG/A. Beyond this distance, the field begins
14

TM 801173
to increase after continuously decreasing at closer distances to the endcap.
An additional example is given in figure 35a, which shows B/I at the I/0 end-
cap of the GE 9T51Y13 3 kVA transformer. At a frequency of 5 kHz and D/D05.0, B/I -67.0 dBG/A.
Although the calculation above is based on estimates of conductor spacing
and an uncertain shielding effectiveness of the endcaps, nevertheless, B/I is
not inconsistent with the onset of the inversion effects that were observed.
M. OPEN-CIRCUITED SECONDARY WINDING(EFFECT ON INVERSION)
Further evidence of the role the current-carrying internal conductors
play in the leakage-field inversion effects can be demonstrated in tests in
which the transformer secondary winding is open circuited. In this instance,
no current is being conducted by the secondary winding and only a small amount
of exciting current flows in the primary.
The results of the open-circuit tests are presented in the Data Summary
and Analysis section of this memorandum, where the field-inversion effects are
discussed in further detail.
Corrective procedures that could counteract the inversion effects, how-
ever, were not attempted. This, for example, would include modification of
the transformers, such as by retwisting and shielding of the internal conduc-
tors.
N. DATA SUMMARY AND ANALYSIS
The purpose of this section is to provide a brief description and dis-
cussion of the test data and the results of the flux-density (B/I) calcula-
tions at various locations relative to the transformer enclosure. The leakage
fields (B/I) are obtained by applying equation (11) (which was programmed on
the HP-25C calculator) to the probe data obtained from each figure.
All figures are grouped with the probe-data figure number identified
first, followed by the B/I results that are observed from it. A brief
description of probe location and some commentary on the results of the anal-
ysis complete the summary.
15

TM 801173
The plots of B/I as a function of the normalized spacing ratio, D/Do,
show the distance dependence of the leakage fields at the extreme ends of the
frequency band. B/I at intermediate frequencies of 15, 25, and 35 kHz are
tabulated below the plot in each figure. The parameter d can be converted to
the spacing ratio, D/D0 , as discussed elsewhere in this memorandum.
Deltec DT25T5 200 W Transformer
1. Figure 13, Description. The input source levels of voltage and cur-
rent spectral densities used for the DT25T5 transformer tests are shown in
figure 13.
2. Figures 14 and 15.
a. Description. The probe was located at the top surface of the
transformer on a vertical axis intersecting the center of the lamination stack
(see figure 1). Figure 14 is the amplified probe voltage versus frequency and
spacing plots at the above location. Figure 15 shows the flux density per
ampere of primary exciting current (B/I) as a function of spacing at this
location.
b. Comments. B/I is "normal". The leakage fields decrease contin-
uously with increasing distance from the transformer surface. The highest
fields are generated at this location.
3. Figures 16 and 17.
a. Description. The probe remains on the top surface but has been
moved to a vertical axis which now intersects the outside edge of the lamina-
tions. Figure 16 is the amplified probe voltage versus frequency and spacing
plots. Figure 17 shows the normalized flux densities (B/I) corresponding to
figure 16.
b. Comments. B/I is "normal". The leakage fields decrease con-
tinuously with distance from the surface.
4. Figures 18 and 19.
a. Description. The probe is now at the side of the transformer
along the horizontal axis shown in figure 1. Figure 18 is the amplified probe
voltage versus frequency and spacing at this location. Figure 19 shows B/I
versus spacing.
16

TM 801173
b. Comments. B/I decreases rapidly within a short distance (10 cm)
from the surface. Ambient noise limited the measurements to a maximum of 10
cm separation. B/I is "normal".
5. Figures 20 and 21.
a. Description. The probe is at the primary endcap along a hori-
zontal axis (see figure 1). Figure 20 is the amplified probe voltage versus
frequency and spacing plots. Figure 21 shows the corresponding B/I versus
spacing.
b. Comments. The magnetic fields from the primary endcap surface
are comparable to the fields at the side. B/I is "normal".
6. Figures 22, 23, and 24.
a. Description. The probe is at the secondary endcap along a hori-
zontal axis. Figure 22 is the amplified probe voltage versus frequency and
spacing plots. Figure 23 shows the flux density (B/I) versus spacing corre-
sponding to figure 22.
b. Comments. The leakage fields decrease from d = 0 (D/Do = 1) to
d = 6 cm (D/Do = 4.5), increase for d > 6 cm to 12 cm (D/D0 = 8.1), then
decrease once again to d = 18 cm (D/D0 = 11.6). This inversion is the result
of the magnetic fields generated by the secondary-winding conductors. The
primary endcap surface, by comparison, is normal. Figure 24 shows the ampli-
fied probe voltage versus frequency plots for an open-circuited secondary
winding. Note that the spacing dependence is normal in this case, unlike the
results of figure 22 for a shorted secondary winding.
GE 9T51Yl3 3 kVA Transformer
1. Figure 25, Description. The input source levels of voltage and cur-
rent spectral densities used for the GE 9T51YI3 3 kVA transformer are shown
in figure 25.
2. Figures 26 and 27.
a. Description. The probe is at the top surface along a vertical
axis that intersects the narrow seam in the cover (see figure 1). Figure 26
is the amplified probe voltage versus frequency and spacing. Figure 27 shows
the flux densities per ampere of primary exciting current (B/I) versus spacing.
17

TM 801173
b. Comments. B/I is "normal". The highest fields are generated
at this location over the seam.
3. Figures 28, 29, and 30.
a. Description. The probe remains at the top surface but has been
moved along a vertical axis intersecting the center of the lamination stack.
Figure 28 shows the amplified probe voltage versus frequency and spacing
plots. Figure 29 shows the normalized flux densities (B/I) versus spacing.
b. Comments. The leakage fields decrease from d = 0 (D/Do = 1) to
d = 2 cm (D/D0 = 2.2), increase for d > 2 cm to d = 6 cm (D/D0 = 4.5), then
decrease continuously to d = 24 cm (D/D0 = 15.1). Figure 30 shows the ampli-
fied probe voltage versus frequency and spacing plots for an open-circuited
secondary winding. Note that the spacing dependence is normal in this case,
unlike the results of figure 28 with a shorted secondary. It is interesting
that the flux density at this location has been depleted by the shunting of
flux lines through the adjacent seam in the transformer cover (see figure 2).
4. Figures 31, 32, and 33.
a. Description. The probe is now at the side of the transformer
along the horizontal axis shown in figure 2. Figure 31 shows the amplified
probe voltage versus frequency and spacing plots. Figure 32 shows the nor-
malized flux densities (B/I) versus spacing at this location.
b. Comments. The leakage fields decrease from d = 0 to d = 6 cm
(D/D0 = 4.5), increase for d > 6 cm to d = 14 cm (D/Do = 9.2), then decrease
continuously to d = 20 cm (D/D0 = 12.8). Figure 33 shows the results for an
open-circuited secondary winding. The amplified probe voltage is normal in
this case.
5. Figures 34, 35, and 36.
a. Description. The probe is located at the I/O endcap along the
horizontal axis shown in figure 2. Figure 34 is the amplified probe voltage
versus frequency and spacing plots. Figure 35 shows the normalized flux den-
sities (B/I) versus spacing.
b. Comments. The leakage fields decrease from d = 0 to d = 4 cm
(D/Do = 3.4), increase for d > 4 cm to d = 12 cm (D/Do = 8.1), then slowly
decrease to d = 24 cm (see figure 34). It should be noted that the magnetic
18

TM 801173
field at 24 cm is greater than at 4 cm. At a spacing of 4 cm, an unusually
rapid decrease of the field occurs at frequencies below 10 kHz. This change
is the largest observed in this spacing interval and appears to be due to
field cancellation effects resulting from the phasing of the leakage and con-
ductor fields. At a spacing of 4 cm, the probe voltage (figure 34) shows an
abrupt decrease with frequency to a null-like minimum at 7300 Hz. Figure 36
shows the amplified probe voltage for an open-circuited secondary. No inver-
sion or interference effects are present.
6. Figures 37 and 38.
a. Description. The probe is located at the endcap opposite the
I/O endcap along the horizontal axis (see figure 2). Figure 37 is the ampli-
fied probe voltage versus frequency and spacing plots. Figure 38 shows B/I
versus spacing.
b. Comments. B/I is "normal". Note that no field inversion occurs
at this endcap, which is located some distance away from the I/O conductors.
Jefferson Electric 12438 5 kVA Transformer
1. Figure 39, Description. The input source levels of voltage and cur-
rent spectral densities used for the Jefferson Electric 12438 5 kVA trans-
former are shown in figure 39.
2. Figures 40, 41, and 42.
a. Description. The probe is located at the top surface of the
transformer along a vertical axis intersecting the center of the seam nearest
the endcap (see figure 3). Figure 40 shows the amplified probe voltage versus
frequency and spacing at this location. Figure 41 shows B/I versus spacing.
b. Comments. The leakage fields decrease from d = 0 to d = 4 cm
(D/D0 = 3.4), increase for d > 4 cm to d = 8 cm (D/D0 = 4.7), then remain
approximately constant out to 22 cm. Figure 42 shows the corresponding
results for an open-circuited secondary winding. The amplified probe voltage
is "normal". The leakage fields decrease with increasing distance from the
transformer in contrast to the shorted-secondary winding results shown in
figure 40.
19

TM 801173
3. Figures 43 and 44.
a. Description. The probe is still at the top surface but has been
moved to the center of the seam nearest the center of the cover (see figure
3). Figure 43 is the amplified probe voltage versus frequency and spacing
plots at this location. Figure 44 shows the flux densities (B/I) versus
spacing at this location.
b. Comments. The leakage fields are normal, decreasing with
increasing distance from the transformer.
4. Figures 45, 46, and 47.
a. Description. The probe is located at the side of the trans-
former on the horizontal axis shown in figure 3. Figure 45 shows the ampli-
fied probe voltage versus frequency and spacing plots. Figure 46 shows the
normalized flux densities (B/I) versus spacing.
b. Comments. The leakage fields decrease from d = 0 to d = 10 cm
(D/D0 = 6.9) and increase for d > 10 cm. The test data were limited to 16 cm.
Note that at 16 cm the leakage fields are approximately the same magnitude as
at d = 0. Figure 47 shows the results at this location for an open-circuited
secondary winding. No inversion occurs in this case.
5. Figures 48 and 49.
a. Description. The probe is located at an endcap surface of the
transformer (side with open grating) along a horizontal axis (see figure 3).
Figure 48 is the amplified probe voltage versus frequency and spacing plots.
Figure 49 shows B/I versus spacing at this location.
b. Comments. The leakage fields (B/I) are normal.
0. COMMENTS ON TRANSFORMER SHIELDING
MODELS (5 TO 50 kHz)
The external leakage fields at the surface of a transformer depend on the
source strength of the internal fields and the shielding or attenuation that
occurs at the enclosure interface. For practical transformer cases contain-
ing seams, gaps, complex shapes, and endcaps, no simple solution is possible.
20

TM 801173
For simple shielding enclosures, such as sheets and cylinders, a high-
frequency shielding effectiveness (SE) can be calculated. This provides some
insight into the relevancy of various parameters that need to be considered.
In the case of a cylindrical enclosure, a particularly simple expression
can be used for both longitudinal and transverse magnetic field components.
The shielding effectiveness (SE) in this case is9
SE in decibels = 20 log 10 a exp(d/6) (14)
where
a = the outer radius of the enclosure (meters),
d = the enclosure thickness (meters),
11 = Url: the magnetic permeability (henrys/meter),
= : the skin depth (meters) - ,
= the conductivity of the enclosure (siemens), and
= 2rf (radians/second).
Equation (14) is valid provided that j >> 1, which corresponds to an
enclosure constructed of a ferromagnetic metal, typically steel. From equa-
tion (14) and the definition of the skin depth, 6, the frequency dependence
of the shielding effectiveness is approximately proportional to the square
root of frequency. Over the 5 to 50 kHz frequency range considered in this
memorandum, approximately 10 dB of additional shielding would be expected
under these assumptions. Returning briefly to the results in figure 12, the
transformer characteristic that is the dominant factor influencing the exte-
rior magnetic field at frequencies from 5 to 50 kHz is the shielding effec-
tiveness of the case. In fact, the 200 W transformer was a more serious EMI
offender than the 5 kVA unit. For instance, the flux density over the top
surface of the Deltec DT25T5 transformer lamination stack is 16 dB more than
the highest emission from any surface of the larger 5 kVA transformer. Com-
pared to the top surface of the GE 9T51Yl3 3 kVA, the DT25T5 flux density is
18 dB higher.
The conclusion that can be drawn from figure 12 is that an effective
transformer shielding enclosure should be constructed of a high-quality steel
21

TM 801173
alloy with a minimum of seams and openings. Since the strongest fields were
over the magnetic core, a cover panel that encloses the stack is essential to
reduce the possibility of magnetic-field coupling to nearby circuits and
cables.
The next section compares the leakage fields from the test transformers
as a function of the input exciting frequency. The results show that the
simple shielding effectiveness model, above, is adequate to account for the
falloff of the leakage fields with frequency that was observed in most cases.
P. COMPARISON OF TRANSFORMER LEAKAGEFIELDS VERSUS FREQUENCY
The leakage fields, B/I, at the surfaces of the transformers were deter-
mined at input frequencies of 5, 15, 25, 35, and 50 kHz. The procedure
required the same steps used in obtaining the leakage field versus spacing
plots.
The upper two sets of data points in figure 50 show the B/I versus fre-
quency plot for the top surfaces of the Deltec DT25T5 and GE 9T51YI3 trans-
formers over the lamination stacks. As noted earlier, the highest fields
occurred at this location. A susceptor located in proximity with this surface
would require the most protection against magnetic-field coupled EMI.
Superimposed on the two sets of data points is a line with a -10 dB per
decade slope. The data shown are very accurately represented by this falloff
line for frequencies within the 5 to 50 kHz band. Therefore, the normalized
transformer leakage fields can be expressed as B/I = f-1/2.
The lower curve in figure 50 is the maximum leakage field generated by
the 5 kVA Jefferson Electric transformer. This field originates at the seamthat is located at the side of the transformer. The B/I data also follow the
same falloff with frequency slope. However, the excursions from the -10 dB/
decade slope line are somewhat greater in this case.
It should be noted that for the DT25T5 and 9T51Y13 transformers, the
shielding is within the magnetic-core structure of the transformer, which can
be considered a relatively homogenous shielding geometry. This is not the
case at the seam in the 5 kVA transformer since flux lines there will emerge
distorted from the effects of the reluctance discontinuity at the boundary.
22
TM 801173
Therefore, it would be expected that external fields at those locations would
normally depart to a greater extent from a simple shielding approximation,
although in this instance the agreement is still good.
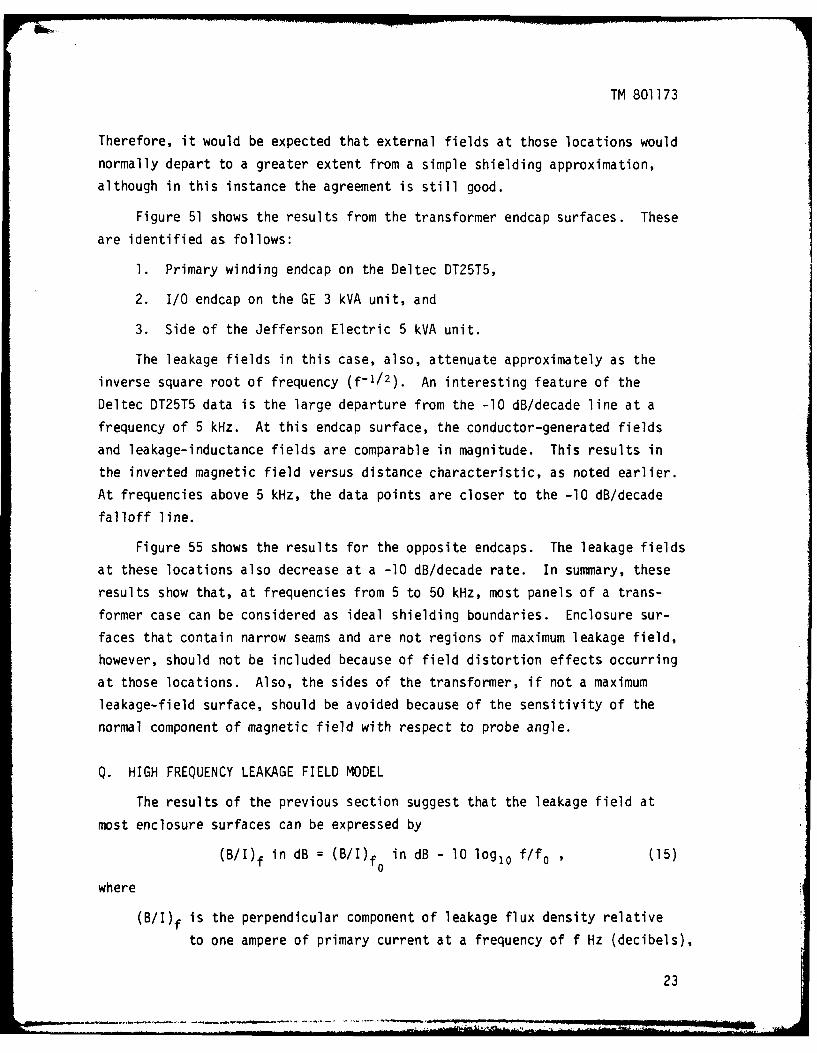
Figure 51 shows the results from the transformer endcap surfaces. These
are identified as follows:
1. Primary winding endcap on the Deltec DT25T5,
2. I/0 endcap on the GE 3 kVA unit, and
3. Side of the Jefferson Electric 5 kVA unit.
The leakage fields in this case, also, attenuate approximately as the
inverse square root of frequency (f-1/2). An interesting feature of the
Deltec DT25T5 data is the large departure from the -10 dB/decade line at a
frequency of 5 kHz. At this endcap surface, the conductor-generated fields
and leakage-inductance fields are comparable in magnitude. This results in
the inverted magnetic field versus distance characteristic, as noted earlier.
At frequencies above 5 kHz, the data points are closer to the -10 dB/decade
falloff line.
Figure 55 shows the results for the opposite endcaps. The leakage fields
at these locations also decrease at a -10 dB/decade rate. In summary, these
results show that, at frequencies from 5 to 50 kHz, most panels of a trans-
former case can be considered as ideal shielding boundaries. Enclosure sur-
faces that contain narrow seams and are not regions of maximum leakage field,
however, should not be included because of field distortion effects occurring
at those locations. Also, the sides of the transformer, if not a maximum
leakage-field surface, should be avoided because of the sensitivity of the
normal component of magnetic field with respect to probe angle.
Q. HIGH FREQUENCY LEAKAGE FIELD MODEL
The results of the previous section suggest that the leakage field at
most enclosure surfaces can be expressed by
(B/I)f in dB = (B/I)f in dB - 10 loglo f/f0 , (15)
where
(B/I)f is the perpendicular component of leakage flux density relative
to one ampere of primary current at a frequency of f Hz (decibels),
23
TM 801173
(B/I)fo the normalized flux density, B/I, evaluated at fo Hz, and
fl,fo = the compared frequencies, f0 < f.
Equation (15) can also be written as
(B/I)f = (B/1)f (f/fo)-1/2 , fo < f (16)
If (B/I)f is taken to be the value of B/I at the lowest frequency in the
band, 5 kHz in this case, (B/I)f at any frequency between 5 and 50 kHz is
expressible as
(B/I)f = C(f/fo)-1/2 , fo < f , (17)
with C = (B/I)f0
The conversion of the normalized values of B/I, in equation (17), above,
to absolute values of B(f) and I(f) presumes that for some input range of
exciting currents the variables B and I can be linearized, e.g., increasing
the primary current by 6 dB results in a corresponding 6 dB increase in the
leakage field. A limited amount of testing involving changes in the input
amplitude of the broadband noise generator suggested this to be a reasonable
first approximation. Equation (16) then becomes
B(f) = CI(f)(f/fo)-1/2 (18)
R. RELATIONSHIP OF PRIMARY-CURRENT SPECTRUM
I(f) TO SUSCEPTOR-COUPLED EMI
The noise voltage coupled into a susceptible circuit that is located in
the leakage field of the transformers can be obtained by substituting the flux
density results of equation (18) into equation (1). The maximum open-circuit
voltage is given by
jel = jao/atj = NAwB (19)
= 2rf NACI(f)(f/fo)'1/2
= 2n NACI(f)(fof)1/2 , f0 < f , (20)
with
ao/at = the time rate of change of flux leakages coupling into the sus-
ceptor loop area,
24

TM 801173
lel = maximum open-circuit voltage,
= 211f,
B = the equivalent sinusoidal exciting flux density,
NA the capture area of the susceptor, and
C = (B/I)f0 *
In equation (20), the coupling voltage depends on the primary-winding
current spectrum, I(f). This spectrum variation can be continuous, such as
that used in the broadband tests, or it can be discrete, as from powerline
harmonics generated as the result of using various nonlinear loads.
The behavior of the coupling voltage with respect to the current spec-
trum, I(f), in either case, can be examined for specific threshold envelopes.
The selected spectral envelopes are
1. I(f) f-I = 1/f,
2. I(f) = f-1/2, and
3. I(f) = f-1/2 + a, where a = positive constant.
For I(f) = 1/f, equation (20) becomes
lei = 2n NACfl/2f-1/2 (21)
If there is no EMI problem at the baseband frequency f0 ' it is also
unlikely at higher frequencies, since the maximum open-circuit voltage
decreases at a -10 dB/decade rate throughout the band.
For I(f) = f-1/2,
lei = 2,r NACf1/2 (22)
The maximum open-circuit voltage is constant for all frequencies, there-
fore no EMI problem is likely to occur.
For I(f) = f-1/2 + a, a = positive constant,
lel = 2,, NACfl/2fa (23)0
In this case, the susceptor voltage increases continuously with fre-
quency, creating a potentially serious EMI problem. The severity of the cou-
pling depends on the constant, a, which is a measure of how much slower the
25

TM 801173
current spectrum decreases relative to a -10 dB/decade rate. For discrete
powerline harmonics, this is equivalent to the condition
f < 10 dB/decade , (24)
fl 12
where
12 = the rms current amplitude in dB at a frequency of f2 Hz,
I, = the rms current amplitude in dB at a frequency of f, Hz, and
f29,f = the frequencies in Hz, f2 >> f1 "
The quantity (12 - I1)/(f2 - fl) represents the slope of the line con-
necting the peaks of the spectral components that are being compared.
S. LEAKAGE FIELD VERSUS DISTANCE MODELS
The leakage field versus distance plots discussed earlier were converted,
based on a conversation with R. Showers, of the University of Pennsylvania, to
a coordinate system whose origin was taken as the approximate center of the
primary/secondary windings. This change was equivalent to an axis translation
from the surface of the transformer case to a point near the transformer cen-
ter approximately equal to one-half the vertical height of the unit away.
From figures 1, 2, and 3, those distances for the Deltec DT25T5, GE 9T51Y13,
and Jefferson Electric units are 6.1, 5.6, and 7.9 cm, respectively.
The basis for this change is that it relates the leakage fields to a
frame of reference located at the source of the fields. Clearly this is only
valid for the magnetic fields generated by the primary and secondary leakage
inductances. Transformer surfaces where the leakage field contained large
contributions from internal conductors are excluded in this analysis.
The distances, R, of the field points from the approximate source center
that were used are
26

TM 801173
1. For the Deltec DT25T5 transformer,
R = d + Do + Ro = d + 7.8 cm , (25)
since Do = 1.72 cm and Ro = 6.1 cm.
2. For the GE 9T51Y13 transformer,
R = d + D0 + Ro = d + 7.3 cm , (26)
since D. = 1.72 cm and R, = 5.6 cm.
3. For the Jefferson Electric transformer,
R = d + D + Ro = d + 9.6 cm , (27)
since Do = 1.72 cm and Ro = 7.9 cm.
The parameters d and DO are defined as d = the probe distance measured
from the surface of the transformer and D, = the probe loop center spacing
for d = 0.
Figure 52 shows B/I as a function of distance from the top surface of the
Deltec DT25T5 transformer measured relative to the center, R. The plotted
points are the results for the extreme ends of the band, i.e., at 5 and 50 kHz.
B/I at frequencies of 15, 25, and 35 kHz are shown in the adjoining table
(figure 52b).
At the surface of this transformer, the flux density decreases very rap-
idly with separation distance (I/R3). At a distance approximately equal to
2.5 times the distance R0, the leakage field begins to decrease at a slower
rate (I/R2). This behavior is defined as
for R < 2.5R o, B/I is proportional to I/R3 (28)
for 2.5R o > R < 5Ro, B/I is proportional to I/R 2 $
where Ro is the transformer vertical half-distance, which is equal to 6.1 cm
for the Deltec DT25T5 transformer.
Figures 53 and 54 are the results from the side and primary endcap sur-
faces, respectively, of the Deltec DT25T5 transformer. The agreement between
all three orthogonal surfaces is excellent. The relation shown in equation
(28) is valid for all three sides of the transformer.
27
TM 801173
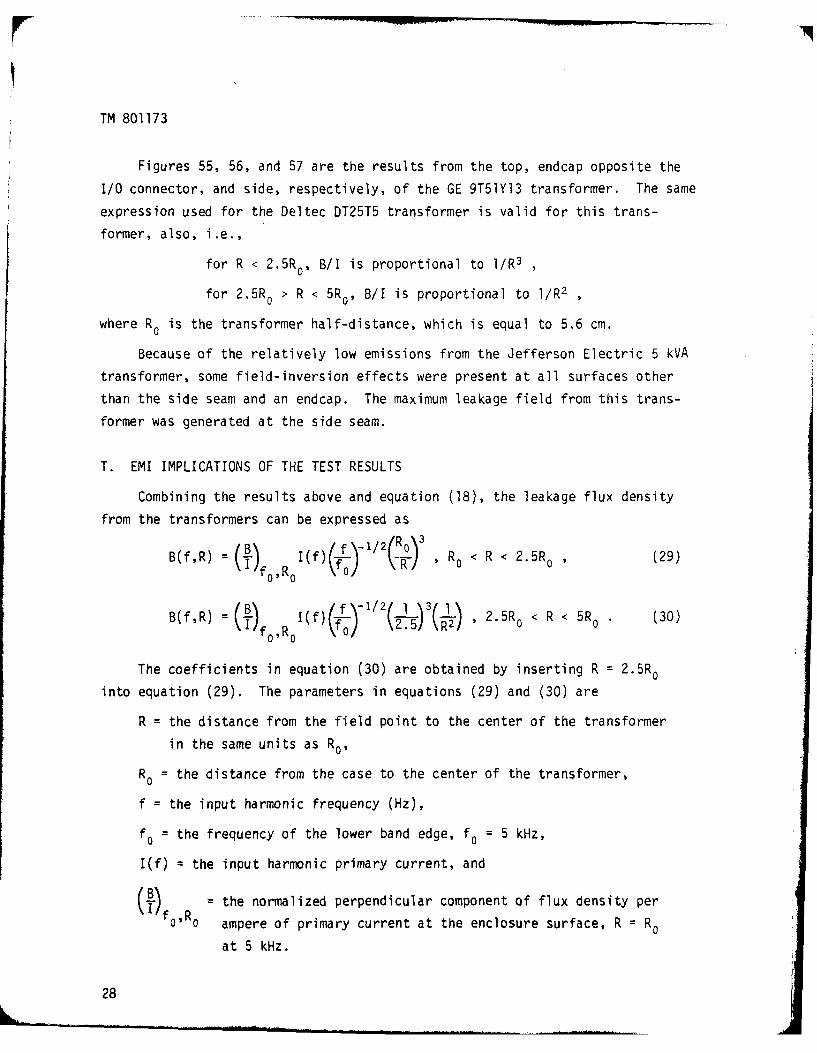
Figures 55, 56, and 57 are the results from the top, endcap opposite the
I/O connector, and side, respectively, of the GE 9T51Yl3 transformer. The same
expression used for the Deltec DT25T5 transformer is valid for this trans-
former, also, i.e.,
for R < 2.5Ro, B/I is proportional to I/R 3
for 2.5R o > R < 5R, B/I is proportional to I/R2
where Ro is the transformer half-distance, which is equal to 5.6 cm.
Because of the relatively low emissions from the Jefferson Electric 5 kVA
transformer, some field-inversion effects were present at all surfaces other
than the side seam and an endcap. The maximum leakage field from this trans-
former was generated at the side seam.
T. EMI IMPLICATIONS OF THE TEST RESULTS
Combining the results above and equation (18), the leakage flux density
from the transformers can be expressed as
B(f,R) = o, f)( R/) , Ro < R < 2.5R o , (29)(' 1 Ro I (f)<
B(fR) = B I(f () , 2.5R o , R < 5Ro . (30)
The coefficients in equation (30) are obtained by inserting R = 2.5R ointo equation (29). The parameters in equations (29) and (30) are
R = the distance from the field point to the center of the transformer
in the same units as Ro,Ro = the distance from the case to the center of the transformer,
f = the input harmonic frequency (Hz),
fo = the frequency of the lower band edge, fo = 5 kHz,
I(f) = the input harmonic primary current, and
T1) the normalized perpendicular component of flux density perf 0oRo ampere of primary current at the enclosure surface, R = Ro
at 5 kHz.
28
, .h h.rrr,, . - . ..

TM 801173
The absolute magnitudes of leakage field given by equations (29) and (30)
require as inputs the parameters R, f, I(f), and (B/)foR0. Factors that
influence the value of (B/I) ,R include the shielding effectiveness of the0
enclosure, kVA rating, and details of the transformer design. The leakage
fields along the three orthogonal axes require values of (B/I)fR for the
tops, sides, and the endcap locations. If, as in most EMI applications, the
worst case or largest magnetic field is of primary concern, only one param-
eter is needed. The appropriate value of (B/I)f0,R0 is taken at the location
corresponding to the highest emitting surface. At the present time,
(B/I)f0,R ° must be determined by a test similar to the procedure described in
this memorandum. In this case, however, the process is simply a single meas-
urement at a frequency of 5 kHz taken in direct contact with the transformer
enclosure, R = R0.
In the future, it appears likely that (B/I)foR0 can be obtained by cal-
culation based on the specific characteristics of a given transformer design.
This capability would permit estimates of the leakage-field strengths from
transformers to be predicted with improved confidence. It would, subse-
quently, add to the effectiveness of various protective-margin calculations
used to assess shipboard equipment compatibility. These would include a wide
variety of interactions, such as cabinet-to-cabinet, cabinet-to-cable, and
cabinet-to-connector, where magnetic fields at frequencies up to 50 kHz have
been known to be a major source of performance degradation in shipboard sys-
tems.
In examining equations (29) and (30), it should be noted that, at close
distances to the transformer, R < 2.5R, the leakage inductance behaves simi-
lar to a magnetic dipole with respect to the magnetic-field dependence on the
separation distance, I/R3.
This inverse R3 relationship leads to a rapid decrease of magnetic-field
strength within a short distance from the enclosure surface. The significance
of the limiting distance, R = 2.5R0, in equations (29) and (30) is that it
appears to represent the distance from the transformer case where the internal
conductor-generated magnetic fields become comparable in magnitude to the
leakage fields. For R > 2.5R o, they exceed the leakage fields and decrease
at a slower rate, l/R2, given by equation (13) for a conductor line pair.
29

TM 801173
CONCLUSIONS
The leakage magnetic fields from power transformers were studied using a
broadband Gaussian noise generator to simulate the effects of powerline har-
monics at frequencies from 5 to 50 kHz. Normalizing the magnetic fields to
1 A of primary current (B/I) proved to be an effective method of compensating
for current variations resulting from the effects of impedance changes and
harmonic distortion by the transformer magnetic core.
A program was written for the HP-25C calculator to compute the flux den-
sities generated by the transformers in the vicinity of the tops, sides, and
endcaps of several transformers ranging from 200 W to 5 kVA in power rating.
In addition, the magnetic fields at seams, gratings, and I/0 connector were
included in the analysis.
It was shown that the leakage magnetic fields from transformers rated at
200 W to 5 kVA could be modeled accurately from 5 to 50 kHz. The model con-
tains terms that depend on the following factors:
1. The distance from approximately the center of the transformer t, the
field point, R,
2. The shielding effectiveness of the case, and
3. The current spectrum of the input harmonics.
At distances close to the transformer enclosure, R < 2.5R, the fields
are inverse R3; at greater distances, the inverse R2 relationship applies.
The limit, R = 2.5R0 (where R0 is the half-distance of the transformer), rep-
resents a transition between regions where the leakage inductance and internal
conductor-generated magnetic fields, respectively, are dominant.
At some transformer surfaces, the magnetic fields "inverted", increasing
with greater separation distance from the case. Within this inversion dis-
tance, spacing a susceptor to reduce EMI is counterproductive, resulting
instead in higher magnetic-field coupled noise voltages.
30

TM 801173
ACKNOWLEDGMENTS
The author is grateful to Robert Sniegoski, of Code 343, for valuable
help in obtaining the test results and to Ms. Bonnie Wardle, Code 343, for
help with the illustrations.
31/32Reverse Blank
TM 801173
1 2 .24 .
23.4 01
NOTE: ALL DIMENSIONS ARE IN CENTIMETERS.
Figure 1. Deltec Corporation DT25T5 200 W Transformer Shown in Relationto a Coordinate System Referenced to its Symmetry Axes
33
!j

TM 801173
13.15'
NOTE: ALL DIMENSIONS ARE IN CENTIMETERS.
Figure 2. General Electric 9T51Yl3 3 kVA Transformer Shown in Relationto a Coordinate System Referenced to its Symmetry Axes
34

TM 801173
NOTE: ALL DIMENSIONS ARE IN CENTIMETERS.
Figure 3. Jefferson Electric 5 kVA Transformer, Serial 12438, Shown inRelation to a Coordinate System Referenced to its Symmnetry Axes
1535
................. .. ...

TM 801173
10 17.8 cm
__ SOLENOID
WINDING CABLE
CABLE
Figure 4. Horizontal Section of the Test Probe ShowingSome Construction Details
101
100
LJ
2,
l-J
10-3101 102 103 104 105
FREQUENCY (Hz)
Figure 5. Series-Induced Open-Circuit Probe Voltage for a 1-Gauss
Magnetic Field at Frequencies Up to 100 kHz
36

TM 801173
S.-
-j-
O4-
ajS..2-)
U,9
00
cri
0L37

TM 801173
L~J4J
-i LL 4- .
c~ CU-~ I-S- M:
4- CL
(A~ C4r_ a
ea C
ca-
w .- r
=0-P4 - 0.1
-- 0ujA
ki 11Ca . -
) LfL.ca)4 0~
CIO~f
LL.L6I~
38 0

TM 801173
LLJx
)
ui2
CI.-
Lai U,).-A
- ) LU C
WE*'-0
W-~4 coCLr
I---
L L- w)-J-o
00
4- r00(a
ERFS- c
LLLL
oLA-
0d 00.0u
E3
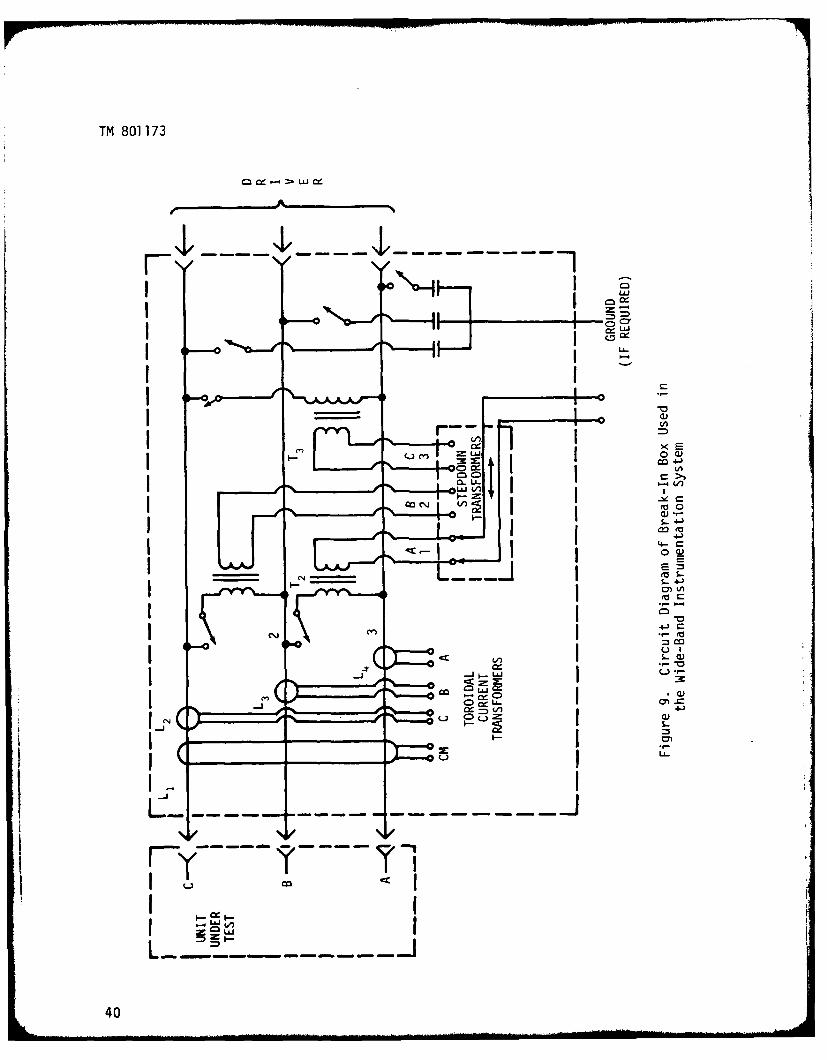
TM 801173
1= cc > LUJ
A,' -I
x Ei 0 (
CUb
Ax II C
CO~
cm
404-

TM 801173
Cs
Figure 10a. Open-Circuited Secondary Winding
LiR cu L p Ls .
Figure lOb. Short-Circuited Secondary Winding
Figure 10. Approximate Transfer Equivalent Circuits With anAssumed Turns Ratio of Unity, n -1:1
41

TM 801173
J
LU~ - ~
LL-0
-A CCL)
uLj
L )DL 0L (
LLL LJ .-
=D F- LJJ L1)
SC
.L--a 0
LL.~
42 S

TM 801173
-40-
-80
TOP SIDE PRIMARY SECONDARYENDCAP WINDING
ENDCAP
Figure 12a. Deltec DT25T5 200 W Transformer
-40
-So-:a -60--70
TOP SIDE I/D ENDCAPENDCAP OPPOSITE
I/O
Figure 12b. GE 9T51YI3 2 kVA Transformer
-50'- ,
-60-
S-70-
-80
-90
-100 Ll
TOP Top TOP SIDE SIDE END(CENTER) (CENTER) (END) (END) (CENTER) (GRATING)OF COVER SEAM SEAM SEAM SEAM
Figure 12c. Jefferson Electric 12438 5 kVA Transformer
Figure 12. Comparison of Flux Density at 25 kHz at Different Locations inthe Leakage Field of Transformers Normalized to 1 A of Primary-Winding
Current With a Short-Circuited Secondary Winding
43

TM 801173
- C
a -0. . .
C) oLO -0 * 0
LO'. (a4-
CD4- s-.--0) 0 - 0 -
a) (A -
1%] 1 ,... V) . C C)
=0
I~ ~ J. 4- li( -
CDC
a 0- o..~
s-4- 0-C L C
- (v a) s'C)~a > E
S.-L 4-) O
CL 0.
4-) a)
CID ~ ~ -a >-I -0 0 - s
**a j C\U
u 0
(M8 A8P A.LSN3 (~j/V~) AISNO~~V~~L~~dS S-1O 4-Z)S.L3~
44 L

TM 801173
-m
a)
.~-0
Q)
4-- 0 L-
.4c-: 1 Q)LL-
;IN4- 4.
j ) _ra
CU-
4-5

TM 801173
= d + 1 .72 cmNOTE: DID o 1 .72
00 5 kHz
_£0 /x 50 kHzCM Do =1.72 cm-o
v--- 0 0E-- A
0-70. A
-8 0 _ . . . . . .
2 4 6 8 10 12 14 16 18 20D/D0
Figure 15a. The Perpendicular Component of Leakage Flux Density in Units ofDecibels Relative to 1 Gauss Normalized to 1 A of Primary-Winding Current
(B/I) for Frequencies of 5 and 50 kHz. B/I is Shown as a Function ofthe Probe Spacing Ratio, D/D0 . The Probe Was Located at the Top
Surface of the DT25T5 Transformer Along the VerticalCoordinate Axis Shown in Figure 1.
B/I (dBG/A)Frequency d (cm)
(kHz) 0 2 4 6 8 10 14 20
15 -38.6 -45.6 -55.6 -60,6 -65.6 -67.6 -71.6 -74.6
25 -40.6 -47.7 -56.3 -61.5 -66.1 -70.3 -75.4 -78.1
35 -41 -48 -57 -62 -67 -70 -75 -83.4*
Figure 15b. B/I Versus Probe Spacing, d, at Frequencies Between theLimits of 5 and 50 kHz Shown Above.
Figure 15. Normalized Flux Density at the Top Surface of the 200 WTransformer (Center of Laminations)
46

r -- -TM 801173
0- C- __w u
..- V) L
.--- 4-o
0 L
£Q 0
c - __
4- -
~7. - L-4
0 S
L' 4-.
---- 7- Nn
-- -S -
* L-4- LLA
) 4- X
-4---- 0) 0- --- 71727
4.) 4/
C.'c4 )OPV 0
(Mg /-'K -AIS0 lb)d.-V10 9b
47
lk .... ..

TM 801173
-501
-5 NOTE: D/D0 = d + 1.72 cm1 .72 5 kHz
-60CC A 50 kHz
co Do =1.72 cm-70
-' A-80 A A
A A A-90. A
II ! ! I j j i . ' j I I0 2 4 6 8 10 12 14 16 18 20
D/Do
Figure 17a. The Perpendicular Component of Leakage Flux Density in Units ofDecibels Relative to 1 Gauss Normalized to I A of Primary-Winding Current
(B/I) for Frequencies of 5 and 50 kHz. B/I is Shown as a Function ofthe Probe Spacing Ratio. D/Do. The Probe Was Located at the TopSurface of the DT25T5 Transformer Along a Vertical Coordinate
Axis Intersecting the Edge of the Lamination Stack.
B/I (dBG/A)Frequency _ d (cm)
(kHz) 0 2 6 10 14 18 20
15 -57.6 -71.6 -75.1 -77.6 -81.6 -84.6 -87.6
25 -59.1 -71.7 -76.2 -78.7 -82.9 -86.6 -89.6
35 -60 -71 -75 -79.8 -84 -87.5 -89.8
Figure 17b. B/I Versus Probe Spacing, d, at Frequencies Between theLimits of 5 and 50 kHz Shown Above.
Figure 17. Normalized Flux Density at the Top Surface of the 200 WTransformer (Edge of Laminations)
48

TM 801173
Lii
(D0
s - C
a 0
49
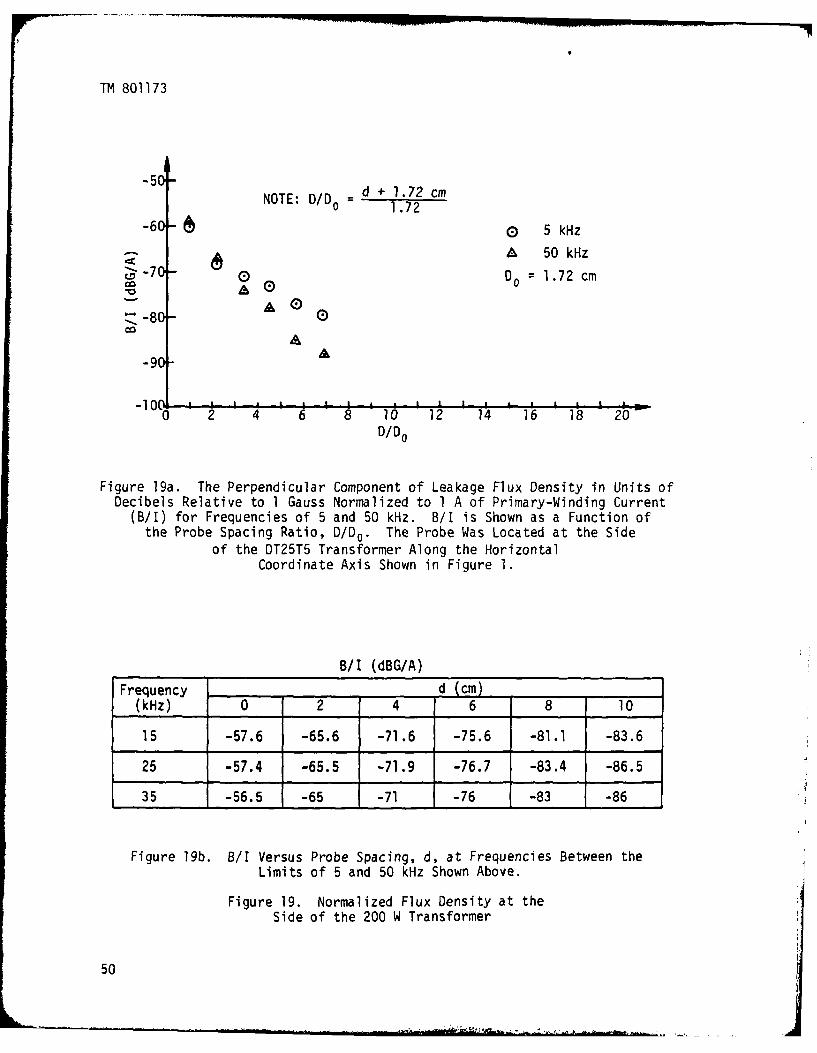
TM 801173
-5NOTE: D/D0 = d + 1.72 cm0 1.72
-60- C) 5 kHz
A 50 kHz-700 Do = 1.72 cm
9a 0-8
-10- 2 4 6 8 10 12 14 16 18 20D/Do
Figure 19a. The Perpendicular Component of Leakage Flux Density in Units ofDecibels Relative to 1 Gauss Normalized to 1 A of Primary-Winding Current
(B/I) for Frequencies of 5 and 50 kHz. B/I is Shown as a Function ofthe Probe Spacing Ratio, D/D0. The Probe Was Located at the Side
of the DT25T5 Transformer Along the HorizontalCoordinate Axis Shown in Figure 1.
B/I (dBG/A)
Frequency d (cm)(kHz) 0 2 4 6 8 10
15 -57.6 -65.6 -71.6 -75.6 -81.1 -83.6
25 -57.4 -65.5 -71.9 -76.7 -83.4 -86.5
35 -56.5 -65 -71 -76 -83 -86
Figure 19b. B/I Versus Probe Spacing, d, at Frequencies Between theLimits of 5 and 50 kHz Shown Above.
Figure 19. Normalized Flux Density at theSide of the 200 W Transformer
50

TM 801173
C>
Lo U
ro~
S-L
2-1 1 11114- (U44 ~ ~ 1C C li
_T +jW0 ~
E LICS~~ LS_-
L-
:tt /rp isoa1~~S3~iO 9~
i L IS_ 5-

TM 801173
-50 Ed + 1.72 cmNOTE: DID0 1.72
-600 0 5 kHz
A 50 kHz~-70Do = 1.72 cm
1-80 A A 0
A 0 0-90 0
-100 t I I I I I 1 ' I I I I I I I -0 2 4 6 8 10 12 14 16 18 20
D/D
Figure 21a. The Perpendicular Component of Leakage Flux Density in Units ofDecibels Relative to 1 Gauss Normalized to 1 A of Primary-Winding Current
(B/I) for Frequencies of 5 and 50 kHz. B/I is Shown as a Function ofthe Probe Spacing Ratio, D/Do . The Probe Was Located at the
Primary Endcap of the DT25T5 Transformer Along theHorizontal Coordinate Axis Shown in Figure 1.
B/I (dBG/A)
Frequency d (cm)(kHz) 0 2 4 6 10 14 22
15 -66.6 -72.1 -78.6 -85.6 -90.6 -91.6 -93.6
25 -72.6 -76.5 -80.5 -87.3 -90.7 -92.5 -94.6
35 -74 -77.5 -82 -87 -91 -90.5 -93
Figure 21b. B/I Versus Probe Spacing, d, at Frequencies Between theLimits of 5 and 50 kHz Shown Above.
Figure 21. Normalized Flux Density at the PrimaryEndcap of the 200 W Transformer
52

TM 801173
-
0~~ C
nLn
co-I
colc
- .-- V)
COLC'.j
I.L L:r
LA-
(tIN/gP) iISNG I US HI10A39Q)
* ~ J53

TM 801173
-5d
NOTE: DID0 = d + 1.72 cm
-6 - 1.72 0 5 kHz
A 50 kHz
- -80 0-7 - A 0 17c
080-A0 A
-90- A
-10 . . 8 . . . . 200 2 4 6 8 10 12 14 16 18 20
D/Do
Figure 23a. The Perpendicular Component of Leakage Flux Density in Units ofDecibels Relative to I Gauss Normalized to I A of Primary-Winding Current
(B/I) for Frequencies of 5 and 50 kHz. B/I is Shown as a Function ofthe Probe Spacing Ratio, D/D0. The Probe Was Located at the
Secondary Side Endcap of the DT25T5 Transformer Alongthe Vertical Coordinate Axis Shown in Figure 1.
B/I (dBG/A)Frequency d (cm)
(kHz) 0 2 4 5 6 8 12 18
15 -61.6 -74.1 -76.1 -86.6 -89.6 -76.6 -72.6 -79.6
25 -66.2 -77.4 -79 -88.8 -92.1 -80 -76.1 -82.6
35 -66 -78 -82 -89 -93 -82 -77 -84
Figure 23b. B/I Versus Probe Spacing, d, at Frequencies Between theLimits of 5 and 50 kHz Shown Above.
Figure 23. Normalized Flux Density at theSecondary Endcap of the 200 W Transformer
54

TM 801173
0 Zj
C>~
0
L
(~~~A/A9P)~~4- VIS3 V~ldS3VLO 9~
554-'

TM 801173
L.
4--
- . 4m S_ S_4 S
U~-aj 0
7- aOLn ..U) '-O
E0 a- o
4- 0a sLO '4-
m=50V .L- -4-
(DW CUCi
= n S_ 4-)
4- Q CL
-o (a ( S... 4-)
uj on 44--' V) CIT - .,.TU VS-
ol C'1D4
eaE c4- o
'4 u04- Q)
~~~~- 0)- - -
LL-O
0.~ ~ U. i- ,OL4
-V 0 n( f
m I S_
(M ~ ~ ~ ~ C /A0P 11S~ .~ IvP A. s1~~~1~~~3dSLj 3910 A-1'.3dS.Nl
56l

TM 801173
E E E E
LA. - C'.j
L>O
Lo
s-0WS.-
0. S- 4-
0LA
UL-
C4-l
(~%./ASP ALIN3G b'~LJ~d 3~V1OA aOn
0 57 r

TM 801173
-30 NOTE: D/Do = d + 1.72 cm1.72
-40- A 0A"00
5 kHz-5A 0 A 50kHza' & Do 172c
CM. 60 & 0 :1.72 cm=A 0 (
-70 A 0A
-80
0 2 4 6 8 10 12 14 16 18 20D/D0
Figure 27a. The Perpendicular Component of Leakage Flux Density in Units ofDecibels Relative to I Gauss Normalized to 1 A of Primary-Winding Current
(B/I) for Frequencies of 5 and 50 kHz. B/I is Shown as a Function ofthe Probe Spacing Ratio, D/Do. The Probe Was Located Over the
Seam in the Top Surface of the GE 9T51Y13 Transformer Alonga Vertical Axis Shown in Figure 2.
B/I (dBG/A)Frequency d (cm)
(kHz) 0 2 4 6 8 10 14 18
15 -38.6 -43.6 -47.6 -53.1 -57.6 -59.1 -65.6 -70.6
25 -39 -47.5 -50.6 -53.9 -57.8 -61.6 -69.4 -73.5
35 -42.1 -48.1 -52.1 -56.1 -60.1 -62.6 -69.6 -73.6
Figure 27b. B/I Versus Probe Spacing, d, at Frequencies Between theLimits of 5 and 50 kHz Shown Above.
Figure 27. Normalized Flux Density at the Top Surface of the 3 kVATransformer Above the Narrow Seam in the Cover
58

TM 801 173
E 2
AL- F;.
4w
C-1 1 0U. S..
I s Iu C\j
4-) 0)~
I. X o Mj
4- >
LOo4U- tV
0) 4-3
0)0cn.
40 +J(
-7w
(~~jN/~ep) 4IIN3 SVId -11A~Qi
59 -

TM 801173
-40
0NOTE: DID 1.72 0 5 kHz
A 50 kHz
-60 0 Do : 1.72 cm0 000
i N -70 ®Q7A
A A A
-80 A AA
0 2 4 6 8 10 12 14 16 18 20D/Do
Figure 29a. The Perpendicular Component of Leakage Flux Density in Units ofDecibels Relative to 1 Gauss Normalized to 1 A of Primary-Winding Current
(B/I) for Frequencies of 5 and 50 kHz. B/I is Shown as a Function ofthe Probe Spacing Ratio, D/D0. The Probe Was Located at the Top
Surface of the GE 9T51YI3 Transformer Along theCoordinate Axis Shown in Figure 2.
B/I (dBG/A)Frequency d (cm)
(kHz) 0 2 6 12 14 20 24
15 -67.1 -71.6 -66.6 -68.1 -71.6 -76.6 -80.6
25 -68.7 -76.4 -69.7 -70.7 -73.7 -77.2 -82.2
35 -69.6 -80.1 -71.1 -72.1 -75.1 -78.6 -82.1
Figure 29b. B/I Versus Probe Spacing, d, at Frequencies Between theLimits of 5 and 50 kHz Shown Above.
Figure 29. Normalized Flux Density at the Top Surface of the 3 kVATransformer Above the Center of the Lamination Stack
60

TM 801173
011 0 U) U UUC:)(N CN
c -
Liu
Ln
........................
__F -LL.
o L
CD,,
w <
ILI 116161

TM 801173
S E
So Soi
0u V
I- a)
0 0)
-
ILL 4-
a (
.~c LAIC'.
r- v
- - 0X
U4-)
-~~S .- U.Z( L
< Q
- cu
I I I i b I
(tg /A9P) AIISN30 1VM13dS 39VJ.10A 39OUd
62

TM 801173
-40 NOTE: DiD0 d + 1.72 5kmS5 kHz
-50-- A 50 kHz
(D Do =1.72 cm
® V e
"- -70
A-80
-901 , i i , i , I I ,
0 2 4 6 8 10 12 14 16 18 20D/D0
Figure 32a. The Perpendicular Component of Leakage Flux Density in Units ofDecibels Relative to 1 Gauss Normalized to 1 A of Primary-Winding Current
(B/I) for Frequencies of 5 and 50 kHz. B/I is Shown as a Function ofthe Probe Spacing Ratio, D/Do. The Probe Was Located at the Side
of the GE 9T51Y13 Transformer Along the HorizontalCoordinate Axis Shown in Figure 2.
B/I (dBG/A)
Frequency d (cm)(kHz) 0 2 4 10 14 20
15 -54.6 -60.6 -62.6 -57.6 -51.6 -66.6
25 -54.6 -60.1 -63.8 -59.7 -53.7 -69.7
35 -55.1 -61.1 -65.1 -61.1 -55.1 -73.1
Figure 32b. B/I Versus Probe Spacing, d, at Frequencies Between theLimits of 5 and 50 kHz Shown Above.
Figure 32. Normalized Flux Density at theSide of the 3 kVA Transformer
63

TM 801173
uo U U u
-W 0* ~ ~~ --- .u
........... . ..- L.J0
CC
(0 C),
0 E-~~~- 4 - - - - .
O LLi 0
- s-
- _ -lN 0)
U b 00
70-
__ _ _ 2 0OF
(k/APAIS3 IM N 30V10A 90b
64,Li UN

TM 801173
= E
0U
C --
0
-7-
4-Q
o_ Q) a
LL --
ea 4-a
CL
LuJ
4-)~
-4-o
4-)~
4-)
LLA
C.CD
I t I t I C)
CA/ASP) AJ-ISN3a3 1Vb.L)3dS 30V'110A 3808d
65

TM 801173
-50 NOTE: D/D d + 1.72 cm 0 5 kHz0 1.72
A 50 kHz._-6( & 0
DO00 = 1.72 cm-700
A 0&
-80.A A
0 2 4 6 8 10 12 14 16 18 20D/Do
Figure 35a. The Perpendicular Component of Leakage Flux Density in Units ofDecibels Relative to 1 Gauss Normalized to 1 A of Primary-Winding Current
(B/I) for Frequencies of 5 and 50 kHz. B/I is Shown as a Function ofthe Probe Spacing Ratio, D/D The Probe Was Located at the
I/O Endcap of the GE 9TgYl3 Transformer Along theHorizontal Coordinate Axis Shown in Figure 2.
B/I (dBG/A)Frequency d (cm)
(kHz) 0 2 4 6 12
15 -54.6 -64.6 -79.6 -70.6 -68.1
25 -56.2 -67.6 -79.4 -73.7 -70.7
35 -59.1 -68.1 -78.1 -76.1 -72.6
Figure 35b. B/I Versus Probe Spacing, d, at Frequencies Between theLimits of 5 and 50 kHz Shown Above.
Figure 35. Normalized Flux Density at theI/O Endcap of the 3 kVA Transformer
66

TM 801173
E FSE EE =E = E uU U
c'.j
Un -
14-
0 -j
I~~ a
L67

TM 801173
E F ~E E
* ii a
C - (A
Eeo
~0s- Q
-~s -- s-. -
L-EW
0 ~ .L >- 0
o CD
e e .
CyU
-~~s - --- a)-
C) 0
0 '14-1
0(A '
_____ _ L)C
(A L
Ln In-C
/ASP)~~~~~'1L AIS- V13d 9 96
68~ .
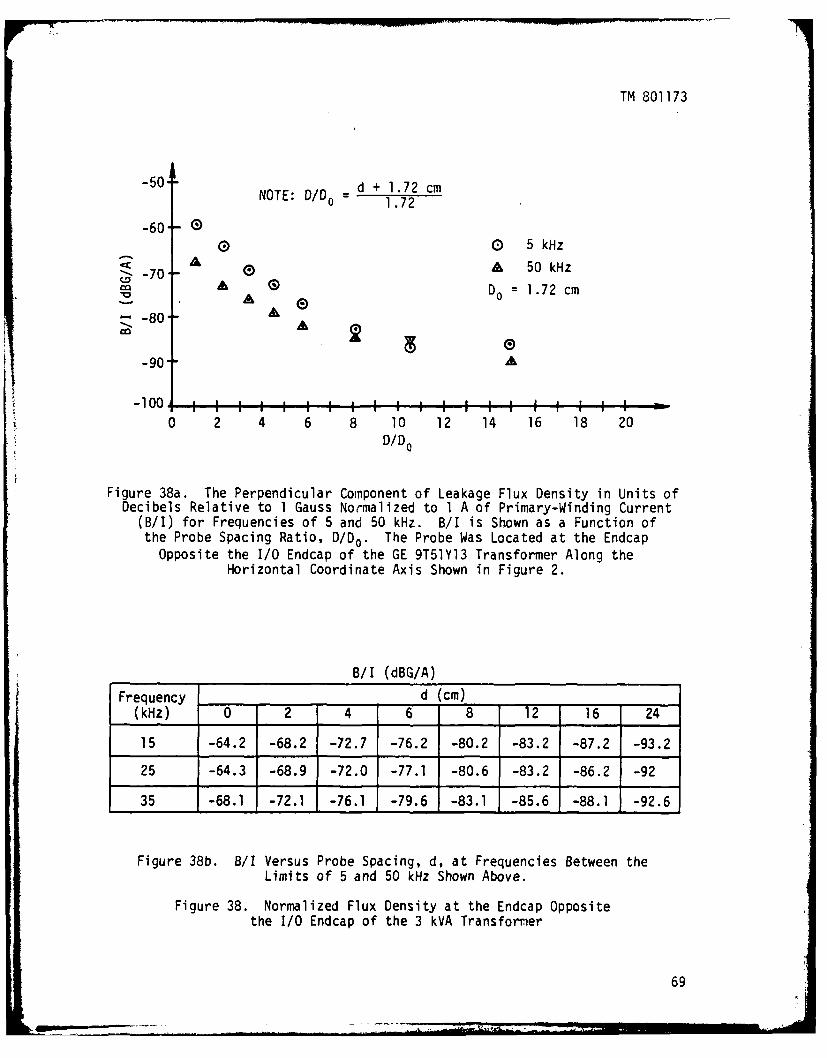
TM 801173
-50J .2cNOTE: D/Do =d + 1.72 cm
-60'0 0 5 kHz
-70 A 50 kHzSD o= 1.72 cm
"- -80" &
-90 ,
0 2 4 6 8 10 12 14 16 18 20D/D0
Figure 38a. The Perpendicular Component of Leakage Flux Density in Units ofDecibels Relative to 1 Gauss Normalized to 1 A of Primary-Winding Current
(B/I) for Frequencies of 5 and 50 kHz. B/I is Shown as a Function ofthe Probe Spacing Ratio, D/D0. The Probe Was Located at the EndcapOpposite the I/O Endcap of the GE 9T51Yl3 Transformer Along the
Horizontal Coordinate Axis Shown in Figure 2.
B/I (dBG/A)
Frequency d (cm)(kHz) 0 2 4 6 8 12 16 24
15 -64.2 -68.2 -72.7 -76.2 -80.2 -83.2 -87.2 -93.2
25 -64.3 -68.9 -72.0 -77.1 -80.6 -83.2 -86.2 -92
35 -68.1 -72.1 -76.1 -79.6 -83.1 -85.6 -88.1 -92.6
Figure 38b. B/I Versus Probe Spacing, d, at Frequencies Between theLimits of 5 and 50 kHz Shown Above.
Figure 38. Normalized Flux Density at the Endcap Oppositethe I/O Endcap of the 3 kVA Transformer
69

TM 801173
L co
(jO 0i
.c .. -3 S0. iA 4- 0- I
0LJ.f s- CC 4-
s- 0 0
* O I
o
4- - -
Q LO
CLC
0 et) ) -fj 4--
___ oo 4-
r-4 - 4. 0~
4-)
CL L3 02 S-
-U Cye
.--- 4-)
I-0,C 42 c
co ~ J C'
,j 4-)
C- 0- LO cu-o (Z 0)
cc * -
s-- 0) u
41 I
(MG /ASP) AIISN3a CV e1Y01J.dS 30V110A (M/VSP) ;IISN3O
IVUI33dS iN3anfl
70

TM 801173
CD-
S. -o Q
-L -.
) =
-~~
-ALr
24~~ ~ Y l 0.
- -(a
-L Cl - 3L Z ia) L
u~ Lfl0 aLUU
- .. W-(A
to -= - -Z
- - 4-)L. 4- r
-- a - C
01 Cl ,
- -4-~--4-'
0) O 4-W-0 ~
LL- U 4-)
( - (Aj
M4-. -)
U,0 4- Q
--: 4-
3)- c
0~~ 0f I C) cz
(mj/"90) AIISN30 1VWJ.3d 30V110A 39Obd
71

TM 801173
N d + 1.72 cm-70 NOTE: D/D0 1.72
-- 80
o 0 5 kHz2-90-
A 50 kHzo - 10 1.72 cm
-100
-1 0I I I I 1 I I I I I ! I i I I I I0 2 4 6 8 10 12 14 16 18 20
D/Do
Figure 41a. The Perpendicular Component of Leakage Flux Density in Units ofDecibels Relative to 1 Gauss Normalized to 1 A of Primary-Winding Current
(B/I) for Frequencies of 5 and 50 kHz. B/I is Shown as a Function ofthe Probe Spacing Ratio, D/Do. The Probe Was Located at the Top
Surface of the Jefferson Electric 12438 Transformer Along aVertical Axis Intersecting the Center of the Seam
Nearest the Endcap Shown in Figure 3.
B/I (dBG/A)Frequency d (cm)
(kHz) 0 2 4 8
15 -76.6 -87.6 -93.6 -90.6
25 -76.1 -85.2 -94.6 -90.2
35 -77.9 -87.6 -95.6 -92.6
Figure 41b. B/I Versus Probe Spacing, d, at Frequencies Between theLimits of 5 and 50 kHz Shown Above.
Figure 41. Normalized Flux Density at the Top Surface ofthe 5 kVA Transformer Above the Seam Nearest the Endcap
72

TM 801173
Q0
0~c 4- )'C ~ - - r
S_ Io (
4- -
* . ,.. cc- Q.
* 4-3 4-)
iim -,z m E.L -
+J.~ 4--
u, 7 C (0I.... .... .~jI4:77: e% C.
-CT . a '
* . ~ 00
C) 0~L
(1 Cn
040
L4-'
0. (U (A
4-i
1 - 4-C
S_ 4-C
C.)Di>~fCI
(!m /A9P) AiISN30 IVbI33dS 30V1O0A 39Obd
73

FpTM 801173
E E
0 en 0
w. u
.1. -(a
I.-.
C)) =
IKE~~ (A-AV
4- a)~
0 0
C) L X-
'.0 0
74-

TM 801173
-60 N d + 1.72 cmNOTE: D1.72
-70.k
0 5 kHz80-- 50 kHz
a00 Do : 1.72 cm
-90 e
-100.
0 2 4 6 8 10 12 14 16 18 20D/Do
Figure 44a. The Perpendicular Component of Leakage Flux Density in Units ofDecibels Relative to 1 Gauss Normalized to 1 A of Primary-Winding Current
(B/I) for Frequencies of 5 and 50 kHz. B/I is Shown as a Function ofthe Probe Spacing Ratio, D/Do. The Probe Was Located at the Top
Surface of the Jefferson Electric 12438 Transformer Along aVertical Axis Intersecting the Center of the Seam Nearest
the Center of the Case Shown in Figure 3.
B/I (dBG/A)Frequency d (cm)
(kHz) 0 2 4 6 14 22
15 -70.2 -83.1 -87.1 -89.6 -92.6 -94.6
25 -68.2 -81.6 -86.6 -90.5 -92.3 -95.2
35 -69.6 -82.6 -87.6 -93.1 -94.4 -96.4
Figure 44b. B/I Versus Probe Spacing, d, at Frequencies Between theLimits of 5 and 50 kHz Shown Above.
Figure 44. Normalized Flux Density at the Top Surface of the 5 kVATransformer Above the Seam Nearest the Center of the Case
75

TM 801173
u u
cl~ .0
a- S_
w-C_7_ _ _ 4j c
ru0
N (n _L
005-o
.0
7 I= Q) 4- N
T1LL
-- - '4-
I0 0
__ I c-.jz0' CD Z'
n___ _ M_ /AP -IS3 W04-'3ViOA39
763 -
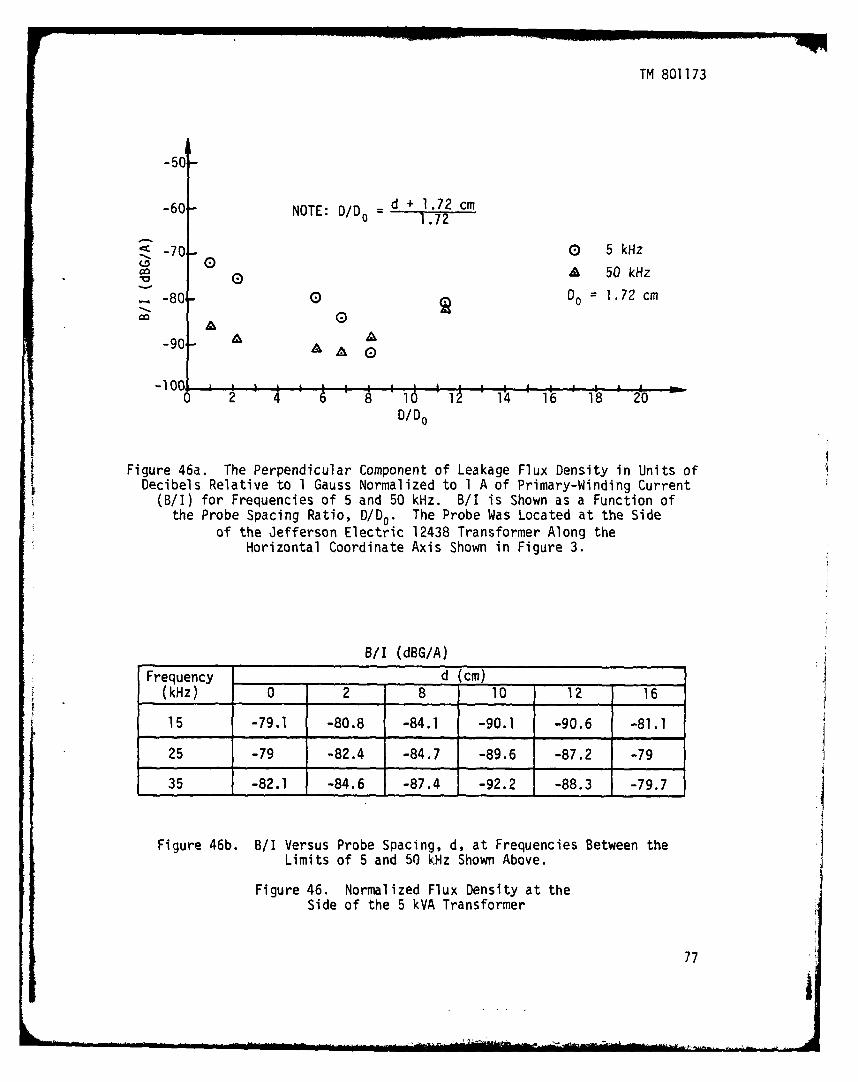
TM 801173
-50-
-60 NOTE: D/D = d + 1.72 cm1.72
-70- 0 5 kHz0 0 o 50 kHz
-80 D = 1.72 cm
-90- 0
-9O0 A A, . . - . ; , . . . , ., -
0 2 4 6 8 I 16 8 It 20D/Do
Figure 46a. The Perpendicular Component of Leakage Flux Density in Units ofDecibels Relative to 1 Gauss Normalized to 1 A of Primary-Winding Current
(B/I) for Frequencies of 5 and 50 kHz. B/I is Shown as a Function ofthe Probe Spacing Ratio, D/D0 . The Probe Was Located at the Side
of the Jefferson Electric 12438 Transformer Along theHorizontal Coordinate Axis Shown in Figure 3.
B/I (dBG/A)
Frequency d (cm)(kHz) 0 2 8 10 12 16
15 -79.1 -80.8 -84.1 -90.1 -90.6 -81.1
25 -79 -82.4 -84.7 -89.6 -87.2 -79
35 -82.1 -84.6 -87.4 -92.2 -88.3 -79.7
Figure 46b. B/I Versus Probe Spacing, d, at Frequencies Between theLimits of 5 and 50 kHz Shown Above.
Figure 46. Normalized Flux Density at theSide of the 5 kVA Transformer
77 I

TM 801173
7
o- 3
(31
~.0
I I ILI.I
C~~~!NIA2P)~~~% C~S3 b~.3d ~UO 8
78
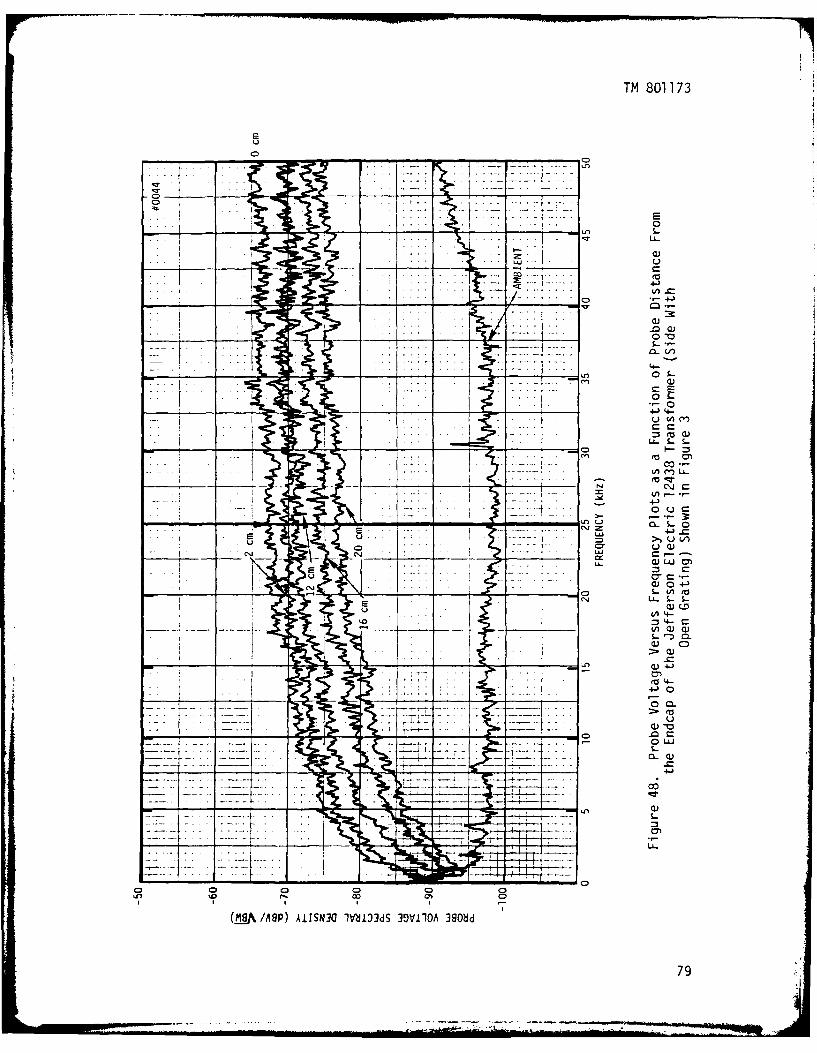
TM 801173
UC
CDCCD -
... .. . .
I T
U C
C~jr
/ 4-)
-)
-- (n -IV
clj - - 0 .
CD
() Li
-7-,-~> ea-~ O
I LLIL
/ASP AIS3 IV4- C010A3
- -i - u79
mop-___.

TM 801173
-60
d + 1.72 cm ) 5kHz
-70 NOTE: D/Do 1.72 " 50kHz(EA 50 kHz
-80 Do 1.72 cm
* A- -90 A
~A
-100
-110 . ' I ' I I I : I I I I I I I I : I -0 2 4 6 8 10 12 14 16 18 20
D/Do
Figure 49a. The Perpendicular Component of Leakage Flux Density in Units ofDecibels Relative to 1 Gauss Normalized to 1 A of Primary-Winding Current
(B/I) for Frequencies of 5 and 50 kHz. B/I is Shown as a Function ofthe Probe Spacing Ratio, D/Do. The Probe Was Located at the Endcap
of the Jefferson Electric 12438 Transformer (Side WithOpen Grating) Shown in Figure 3.
B/I (dBG/A)Frequency d (cm)
(kHz) 0 2 12 16 20
15 -77.8 -80.6 -81.9 -85.0 -87.5
25 -78.2 -79.7 -82.9 -84.6 -88.7
35 -79.6 -82.6 -83.6 -86.6 -88.6
Figure 49b. B/I Versus Probe Spacing, d, at Frequencies Between theLimits of 5 and 50 kHz Shown Above.
Figure 49. Normalized Flux Density at the Endcap(Open Grating) of the 5 kVA Transformer
80
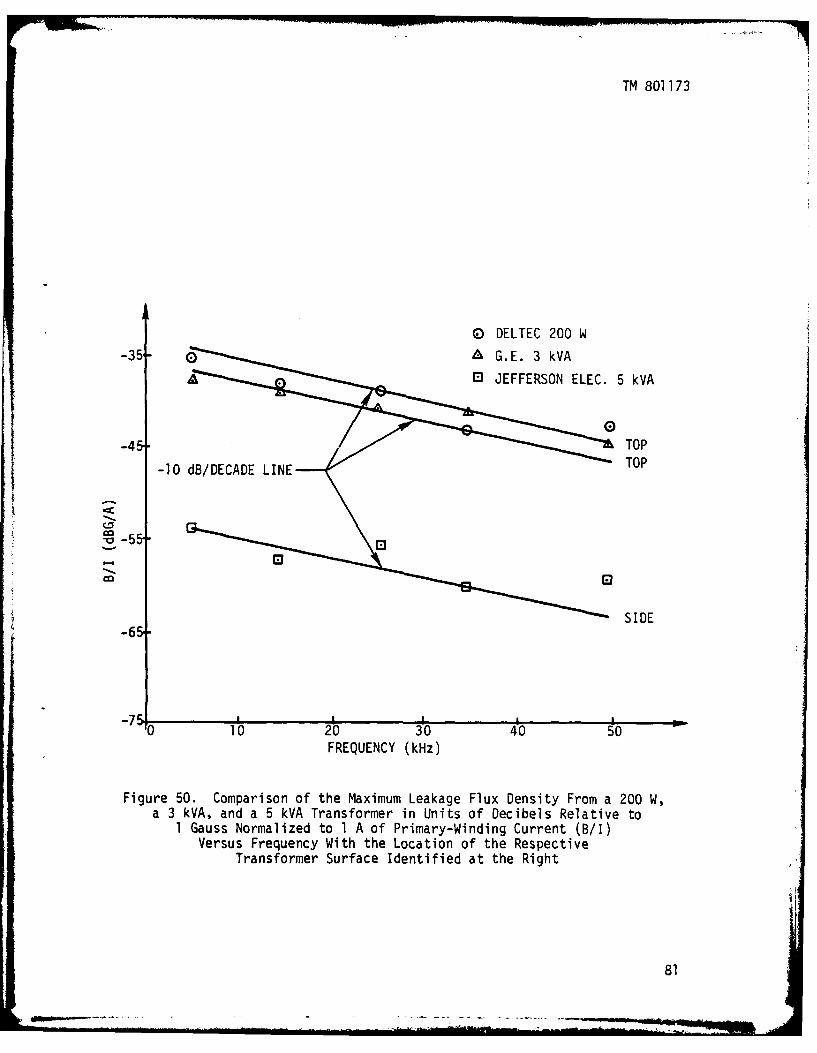
TM 801173
0 DELTEC 200 W-35- A G. E. 3 kVA
E0 JEFFERSON ELEC. 5 kVA
-45- TOP-10 dB/DECADE LINE TOP
-55 []
SIDE-65
-7 . I p,
0 10 20 30 40 50FREQUENCY (kHz)
Figure 50. Comparison of the Maximum Leakage Flux Density From a 200 W,a 3 kVA, and a 5 kVA Transformer in Units of Decibels Relative to
1 Gauss Normalized to 1 A of Primary-Winding Current (B/I)Versus Frequency With the Location of the Respective
Transformer Surface Identified at the Right
81

TM 801173
-45
0 DELTEC 200 WA G.E. 3 kVA
E JEFFERSON ELEC. 5 kVA
-55-
-10 dB/DECADE LINE
-65- INPUT/OUTPUT ENDCAP
( 0
-85 OPEN GRATING ENDCAP
-951 I , , .0 10 20 30 40 50
FREQUENCY (kHz)
Figure 51. Comparison of the Leakage Flux Density From a 200 W, a 3 kVA,and a 5 kVA Transformer in Units of Decibels Relative to. 1 Gauss
Normalized to 1 A of Primary-Winding Current (B/I) VersusFrequency With the Location of the RespectiveTransformer Surface Identified at the Right
82

TM 801173
-30
0-40 0 5 kHz
I/R3 A 50 kHz
-50
'a-60
m -70 AAA
-80
-90 i I I I I I I I I I I -0 6 12 18 24 30 36
R (cm)
Figure 52a. The Leakage Flux Density at the Top Surface of a 200 W DeltecDT25T5 Transformer. B/I is in Units of Decibels Relative to 1 Gauss
Normalized to 1 A of Primary Current. B/I is Shown as a Functionof the Probe Spacing Measured From the Center of the
Transformer, R, at Frequencies of 5 and 50 kHz.
B/I (dBG/A)
Frequency R (cm)(kHz) 7.8 9.8 11.8 13.8 15.8 17.8 21.8 27.8
15 -38.6 -45.6 -55.6 -60.6 -65.6 -67.6 -71.6 -74.6
25 -40.6 -47.7 -56.3 -61.5 -66.1 -70.3 -75.4 -78.1
35 -41 -48 -57 -62 -67 -70 -75
Figure 52b. B/I Ver,'-js Probe Spacing, R, at Frequencies Between theLimits of 5 and 50 kHz Shown Above.
Figure 52. Normalized Flux Density at the Top Surface ofa 200 W Transformer Versus Spacing
83

TM 801173
-400 5 kHz
-50 & 50 kHz
-1-60--CD I/R 3
-- 70-
-80--
-90II It I I i I I l i. t , I i ,
0 6 12 18 24 30 36R (cm)
Figure 53a. The Leakage Flux Density at a Side Surface of a 200 W DeltecDT25T5 Transformer. B/I is in Units of Decibels Relative to 1 Gauss
Normalized to 1 A of Primary Current. B/I is Shown as a Functionof the Probe Spacing Measured From the Center of theTransformer, R, at Frequencies of 5 and 50 kHz.
B/I (dBG/A)
Frequency R (cm)(kHz) 7.8 9.8 11.8 13.8 15.8 17.8
15 -57.6 -65.6 -71.6 -75.6 -81.1 -83.6
25 -57.4 -65.5 -71.9 -76.7 -83.4 -86.5
35 -56.5 -65 -71 -76 -83 -86
Figure 53b. B/I Versus Probe Spacing, R, at Frequencies Between theLimits of 5 and 50 kHz Shown Above.
Figure 53. Normalized Flux Density at the Side ofa 200 W Transformer Versus Spacing
84

TM 801173
-50
-60 0 5 kHz
A 50 kHz
SI/R/R3
-90-0
i I 3 I e i | I I i I I I i0 6 12 18 24 30 36
R (cm)
Figure 54a. The Leakage Flux Density at the Primary Endcap of a 200 WDeltec QT25T5 Transformer. B/I is in Units of Decibels Relative to1 Gauss Normalized to 1 A of Primary Current. B/I is Shown as
a Function of the Probe Spacing Measured From the Centerof the Transformer, R, at Frequencies of 5 and 50 kHz.
B/I (dBG/A)
Frequency R (cm) .(kHz) 7.8 9.8 11.8 13.8 17.8 21.8 29.8
15 -66.6 -72.1 -78.6 -85.6 -90.6 -91.6 -93.6
25 -72.6 -76.5 -80.5 -87.3 -90.7 -92.5 -94.6
35 -74 -77.5 -82 -87 -91 -90.5 -93
Figure 54b. B/I Versus the Probe Spacing, R, at Frequencies Between theLimits of 5 and 50 kHz Shown Above.
Figure 54. Normalized Flux Density at the PrimaryEndcap of a 200 W Transformer Versus Spacing
85

TM 801173
-30
0 hR3 0 5 kHz-40- A 50 kHz
~-50"0 .
-- 60
-70
-80
0 6 12 18 24 30 36R (cm)
Figure 55a. The Leakage Flux Density at the Top Surface Seam of a 3 kVAGE 9T51Y13 Transformer. B/I is in Units of Decibels Relative to1 Gauss Normalized to 1 A of Primary Current. B/I is Shown as
a Function of the Probe Spacing Measured From the Centerof the Transformer, R, at Frequencies of 5 and 50 kHz.
B/I (dBG/A)
Frequency R (cm)
(kHz) 7.3 9.3 11.3 13.3 15.3 17.3 21.3 25.3
15 -38.6 -43.6 -47.6 -53.1 -57.6 -59.1 -65.6 -70.6
25 -39 -47.5 -50.6 -53.9 -57.8 -61.6 -69.4 -73.5
35 -42.1 -48.1 -52.1 -56.1 -60.1 -62.6 -69.6 -73.6
Figure 55b. B/I Versus Probe Spacing, R, at Frequencies Between theLimits of 5 and 50 kHz Shown Above.
Figure 55. Normalized Flux Density at the Top Surface Seamof a 3 kVA Transformer Versus Spacing
86)8

AD-A103 824 NAVAL UNDERWATER SYSTEMS CENTER NEWPORT RI F/6 20/14
JAN 81 L J DALSASSUNCLASSIFIED NUSC-TMA801173 NL

TM 801173
-50
-60 Q 0 5 kHzA 50 kHz
-70C13
1 /R2
-800
-90 -
-100I ! I I t t I I I I I I I I I I t I
0 6 12 18 24 30 36R (cm)
Figure 56a. The Leakage Flux Density at the Endcap Opposite the I/O Endcapof a 3 kVA GE 9T51Y13 Transformer. B/I is in Units of Decibels Relative
to 1 Gauss Normalized to 1 A of Primary Current. B/I is Shown as aFunction of the Probe Spacing Measured From the Center of the
Transformer, R, at Frequencies of 5 and 50 kHz.
__ _B/I (dBG/A)
Frequency R (cm)(kHz) 7.3 9.3 11.3 13.3 15.3 19.3 23.3 31.3
15 -64.2 -68.2 -72.7 -76.2 -80.2 -83.2 -87.2 -93.2
25 -64.3 -68.9 -72.0 -77.1 -80.6 -83.2 -86.2 -92
35 -68.1 -72.1 -76.1 -79.6 -83.1 -85.6 -88.1 -92.6
Figure 56b. B/I Versus Probe Spacing, R, at Frequencies Between theLimits of 5 and 50 kHz Shown Above.
Figure 56. Normalized Flux Density at the Endcap Opposite the I/OEndcap of the 3 kVA Transformer Versus Spacing
87
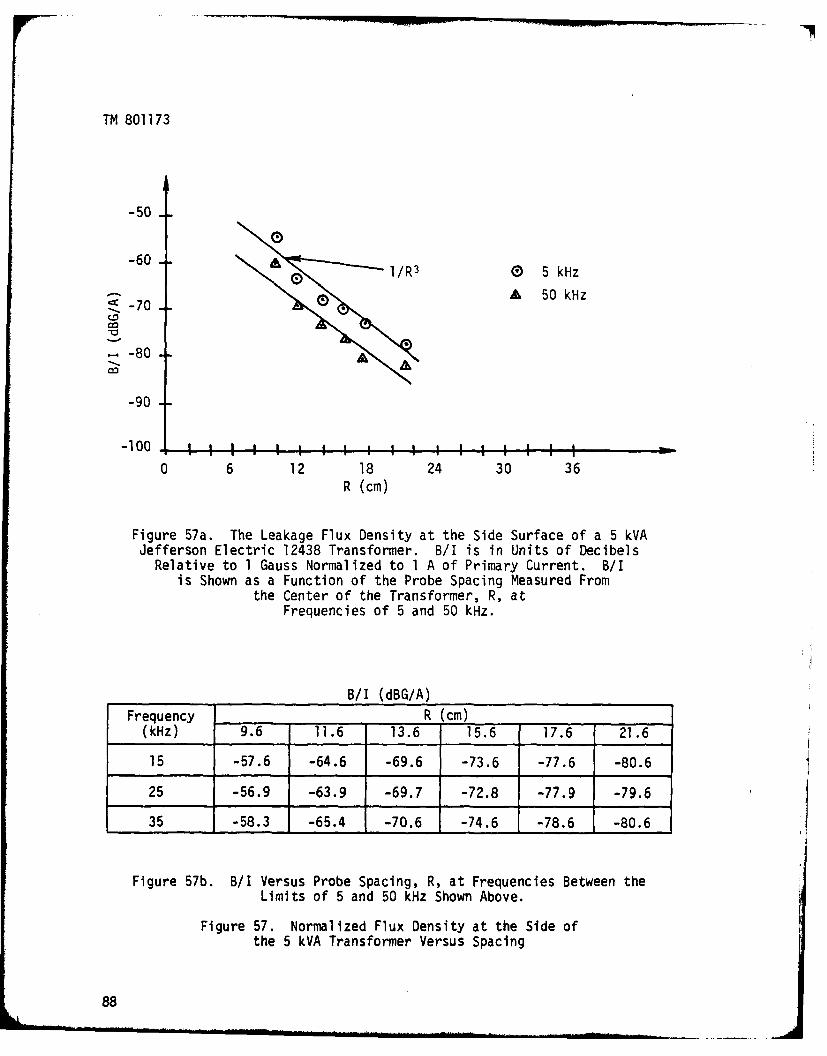
TM 801173
-50
-60 0 /R 5 kHz
--- A 50 kHz-70
-80
-90
0 6 12 18 24 30 36R (cm)
Figure 57a. The Leakage Flux Density at the Side Surface of a 5 kVAJefferson Electric 12438 Transformer. B/I is in Units of Decibels
Relative to 1 Gauss Normalized to 1 A of Primary Current. B/Iis Shown as a Function of the Probe Spacing Measured From
the Center of the Transformer, R, atFrequencies of 5 and 50 kHz.
B/I (dBG/A)
Frequency R (cm)(kHz) 9.6 11.6 13.6 15.6 17.6 21.6
15 -57.6 -64.6 -69.6 -73.6 -77.6 -80.6
25 -56.9 -63.9 -69.7 -72.8 -77.9 -79.6
35 -58.3 -65.4 -70.6 -74.6 -78.6 -80.6
Figure 57b. B/I Versus Probe Spacing, R, at Frequencies Between theLimits of 5 and 50 kHz Shown Above.
Figure 57. Normalized Flux Density at the Side ofthe 5 kVA Transformer Versus Spacing
88

TM 801173
REFERENCES
1. A. E. Fitzgerald and C. Kingsley, Electrical Machinery, McGraw-Hill Book
Company, Inc., NY, 1952, p. 650.
2. K. Henney, Radio Engineering Handbook, McGraw-Hill Book Company, Inc.,
NY, 1959, pp. 17-49.
3. "The Effect of Nickel Content on Magnetic and Expansion Properties of
High Nickel-Iron Alloys," Technical Note, Carpenter Technology Corporation.4. "Magnetic Laminations," Catalog ML-303S, Magnetics, Inc.
5. F. E. Terman, Radio Engineers Handbook, McGraw-Hill Book Company, Inc.,
NY, pp. 99-101.
6. "Fast Fourier Transforms and its Application to Digital Filtering and
Spectral Analysis," IEEE Transactions on Audio and Electroacoustics, vol.
AU-15, no. 2, June 1967.
7. "Instruction Manual for the Model 446 FFT Spectrum Analyzer," Nicolet
Scientific Co.
8. "Systems Electromagnetic Compatibility Evaluation," Report 74-03, Univer-
sity of Pennsylvania, 31 August 1973, p. 30.
9. S. Shenfeld, Prediction of Coupling, Shielding, and Grounds for Low-Fre-
quency Fields,"NUSC Technical Report 4051, Naval Underwater Systems Cen-
ter, New London, CT, 2 April 1971.
89/90Reverse Blank

w CC-0
.- U- C)
>- ~ # XU L- L
C:: d< > YI w-C
C/) ,
C:) C) GOC) LA=L
F- -4 l
C - C) C/ 9-1 LU 0 0.0w Lii LU1 C .)~
LLI CD C
Cl LUw -j 0L L w 0 -/ C-.) w- 0- w
w- -1 > CDw C C) P-4D~4 A
L U C- LU /
F- cr C/ -
u- w LU C- CJ LU UI
:cC LU 0 ~0 CF- CD~ LU (- LU -4 Li U
CDz LU C) C) fI-I- = C LJ wU uCL = n 00
LU C/ CD CU I L ---Cl, C,) C/C C)U
LL: -j CC wC 0- 0 U
Cl, '.27 -L C- C C) - ~ L
C) CD C/ = o-40
) CC) Wl
LL- ~ 'G 4x SLwC-
.4 w- C.) 1- LL C/ )
w ~ U- LA w
X x a V.X C c

C/)
W ) 44
UL Ci)
V CD a.C/ U- C L U
4-J CD
C) C -)= LLn = C) 4-
0- a- L. C-a LLJ W0DC
0) C W U C') I-- C
C-) W lC - dN L
LU: I 'i 4: O
0- C) Cl CD w ~ = (D C
I-U) L
L; = w w- -
0- DwC' P-4 0F- 0D : o = == L
X~~ CD >- 0N C-i U -
-4 I- 0 ~CD W

iiI.


![Marize He[1]](https://img.document.onl/doc/110x75/55cf9bd8550346d033a795ad/marize-he1.jpg)