Embed Size (px)
Citation preview
7/23/2019 Full Report BR
http://slidepdf.com/reader/full/full-report-br 1/36
[BUSINESS RESEARCH]
BUSINESS RESEARCH
ASSIGNMENT (CBEB2105)
NO NAME MATRIC NO
1. ABDUL AZIM B BADRUL HISHAM CEA 120003
2. AHMAD SYAZWAN B AHMAD SHUKRI CEA 120007
3. NEZA AZIZI B AZLI CEA 120059
4.
5.
6.
7.
DATELINE : 28 MAY 2014
Table of Content
NO TITLE PAE
1 !UESTION 1 3"#
2 !UESTION 2 9"113 !UESTION 3 12"15
1

7/23/2019 Full Report BR
http://slidepdf.com/reader/full/full-report-br 2/36
[BUSINESS RESEARCH]
4 !UESTION 4 16"1#
5 !UESTION 5 19"21
6 !UESTION 6 22"26
7 !UESTION 7 27"33
# !UESTION # 34"35
9 !UESTION 9 36"37
PART II: Data Analysis and Interpretation
Qestion 1
Perform frequency distribution with chart for the following variables and discuss the
results:
1! "e#
2

7/23/2019 Full Report BR
http://slidepdf.com/reader/full/full-report-br 3/36
[BUSINESS RESEARCH]
$ender
Frequency Percent Valid Percent Cumulative
Percent
Valid
male 264 52! 5"2 5"2
female 2"2 464 46! #$$$%otal 4&6 &&2 #$$$
'issing (ystem 4 !%otal 5$$ #$$$
)ased on table above* there are 4&6 valid res+ondents with 4 missing value
,ut of 4&6 valid res+ondents* 264 valid res+ondents are male -t re+resents 52!.
out of 4&6 valid res+ondents %he rest 2"2 valid res+ondents are female and 464.
out of 4&6 valid res+ondents %here are 4 res+ondents do not state their gender
From the chart above* it shows that male res+ondents are more than female
res+ondents in this survey
2! Readers%ip o& t%e ne'spaper!
a! Ne' "traits Ti(es
Ne' "traits Ti(es
Frequency Percent Valid Percent Cumulative
Percent
Valid yes 24# 4!2 4!" 4!"
no 25! 5#6 5#/ #$$$
3

7/23/2019 Full Report BR
http://slidepdf.com/reader/full/full-report-br 4/36
[BUSINESS RESEARCH]
%otal 4&& &&! #$$$
'issing (ystem # 2
%otal 5$$ #$$$
)ased on the table above* there are 4&& valid res+ondents with # missing
value %here are 24# res+ondents or 4!2. state they read 0ew (traits %imes while
the remaining 25! res+ondents or 5#6. state they do not read 0ew (traits %imes
)! T%e "tar
T%e "tar
Frequency Percent Valid Percent Cumulative
Percent
Valid
yes 225 45$ 45$ 45$
no 2/5 55$ 55$ #$$$
%otal 5$$ #$$$ #$$$
4
7/23/2019 Full Report BR
http://slidepdf.com/reader/full/full-report-br 5/36
[BUSINESS RESEARCH]
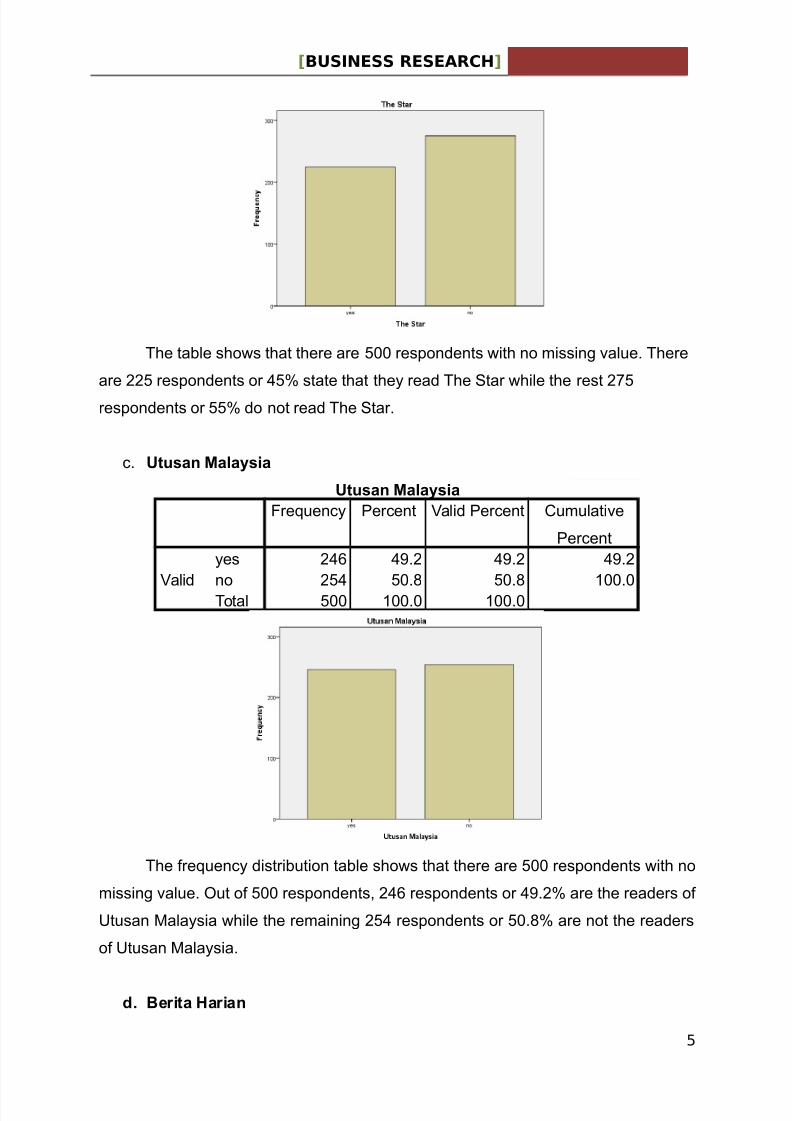
%he table shows that there are 5$$ res+ondents with no missing value %here
are 225 res+ondents or 45. state that they read %he (tar while the rest 2/5
res+ondents or 55. do not read %he (tar
c *tsan Malaysia
*tsan Malaysia
Frequency Percent Valid Percent Cumulative
Percent
Valid
yes 246 4&2 4&2 4&2
no 254 5$! 5$! #$$$
%otal 5$$ #$$$ #$$$
%he frequency distribution table shows that there are 5$$ res+ondents with no
missing value ,ut of 5$$ res+ondents* 246 res+ondents or 4&2. are the readers of
1tusan 'alaysia while the remaining 254 res+ondents or 5$!. are not the readers
of 1tusan 'alaysia
d! +erita ,arian
5

7/23/2019 Full Report BR
http://slidepdf.com/reader/full/full-report-br 6/36
[BUSINESS RESEARCH]
+erita ,arian
Frequency Percent Valid Percent Cumulative
Percent
Valid
yes 245 4&$ 4&$ 4&$
no 255 5#$ 5#$ #$$$
%otal 5$$ #$$$ #$$$
)ased on the figures above* there are 5$$ res+ondents with no missing value
,ut of 5$$ res+ondents* 245 res+ondents or 4&. state they read )erita arian while
the remaining 255 res+ondents or 5#. state they do not read )erita arian
-! Ra.e
et%i. $rop
Frequency Percent Valid Percent Cumulative
Percent
Valid
'alay 255 5#$ 5#$ 5#$
Chinese #5! "#6 "#6 !26
-ndian /& #5! #5! &!4
others ! #6 #6 #$$$
%otal 5$$ #$$$ #$$$
6

7/23/2019 Full Report BR
http://slidepdf.com/reader/full/full-report-br 7/36
[BUSINESS RESEARCH]
%here are 4 categories in this survey which are 'alay* Chinese* -ndian* and
,thers From the frequency distribution table* there are 5$$ res+ondents with no
missing value -n this survey* the ma3ority of res+ondents are 'alay -t re+resents
255 res+ondents or 5#. out of total valid res+ondents %here are #5! res+ondents
or "#6. are Chinese res+ondents while /& res+ondents or #5!. are -ndian
res+ondents ,nly ! res+ondents or #6. out of valid res+ondents choose others for
their race
4! /redit .ard
.redit .ard
Frequency Percent Valid Percent Cumulative
Percent
Validyes !" #66 #/! #/!no "!2 /64 !22 #$$$
%otal 465 &"$ #$$$
'issing (ystem "5 /$
%otal 5$$ #$$$
7
7/23/2019 Full Report BR
http://slidepdf.com/reader/full/full-report-br 8/36
[BUSINESS RESEARCH]
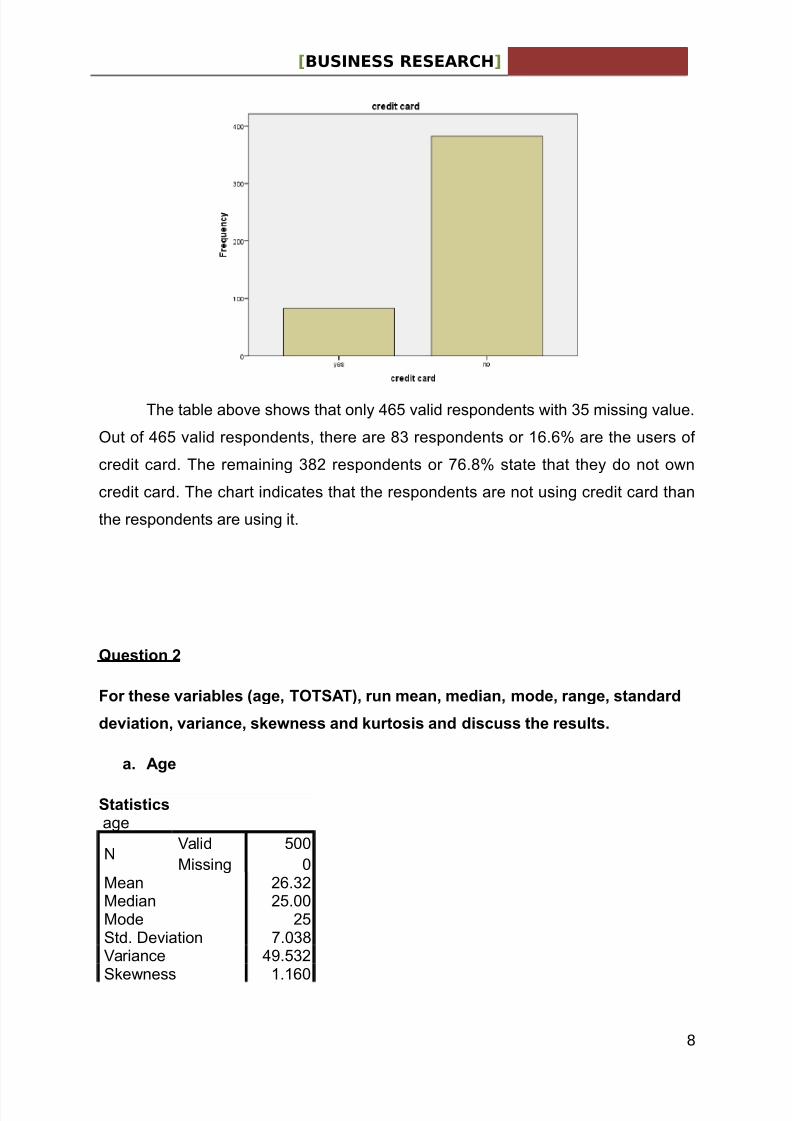
%he table above shows that only 465 valid res+ondents with "5 missing value
,ut of 465 valid res+ondents* there are !" res+ondents or #66. are the users of
credit card %he remaining "!2 res+ondents or /6!. state that they do not own
credit card %he chart indicates that the res+ondents are not using credit card than
the res+ondents are using it
Qestion 2
or t%ese aria)les a$e3 TT"AT53 rn (ean3 (edian3 (ode3 ran$e3 standard
deiation3 arian.e3 s6e'ness and 6rtosis and dis.ss t%e reslts!
a! A$e
"tatisti.sage
0Valid 5$$
'issing $'ean 26"2'edian 25$$'ode 25(td eviation /$"!Variance 4&5"2
(ewness ##6$
8

7/23/2019 Full Report BR
http://slidepdf.com/reader/full/full-report-br 9/36
[BUSINESS RESEARCH]
(td rror of
(ewness#$&
7urtosis "665(td rror of
7urtosis
2#!
8ange 55
From the table above* the variable 9ge has a mean of 26"2 'edian and mode
have the same value which is 25 %he range for 9ge is 55 where the age of
res+ondents is ranged from #5 to /$ years old (tandard deviation and variance
measure how much the scores deviate from mean or average For 9ge standard
deviation is /$"! whereas variance is 4&5"2
(ewness and urtosis can reflect the sha+e of distribution (ewness
measures the symmetry of the distribution while urtosis measures the +eaedness;
of the distribution by looing the relative concentration of values in the centre of the
distribution For variable 9ge* mode is equal to median* and median is lower than mean
<mode = median > mean? -t indicates the distribution is +ositively sewed which
sewed to the right with the value of ##6$ -t shows the +ile u+ of scores on the left
side of chart
'eanwhile* it has also +ositive value of urtosis which is "665 -t indicates
that the distribution of 9ge has a shar+er +ea than normal bell@sha+ed distribution
)! TT"AT Total "atis&a.tion in Li&e5
9

7/23/2019 Full Report BR
http://slidepdf.com/reader/full/full-report-br 10/36
[BUSINESS RESEARCH]
"tatisti.s%,%(9%
0Valid "66
'issing #"4'ean 42"$6
'edian 4"$$$'ode 4/$(td eviation 66"4$Variance 44$(ewness @462(td rror of
(ewness#2!
7urtosis @##5(td rror of
7urtosis254
8ange "5$
10

7/23/2019 Full Report BR
http://slidepdf.com/reader/full/full-report-br 11/36
%he variable %,%(9% is the measure of satisfaction in life by using ten items in
(ection --- of the questionnaire with the scores ranged from #=very dissatisfied to
6=very satisfied
-t has a mean of 42"$6* median of 4"$* and mode of 4/$ %he range for 9ge
is "5$ with the minimum number of 2" to the maAimum number of 5! %he
standard deviation is $66"4$ whereas the variance is $44$
For variable %,%(9%* mode is higher than median* and the median is higher
than mean <mode B median B mean? -t indicates the distribution is negatively
sewed which sewed to the left with the value of @$462 -t shows the +ile u+ of
scores on the right side of chart
-n measuring the +eaedness; of the distribution* the variable %,%(9% has a
negative value of urtosis which is @$##5 -t indicates that the distribution of %,%(9%
is relatively flatter than normal bell@sha+ed distribution

7/23/2019 Full Report BR
http://slidepdf.com/reader/full/full-report-br 12/36
Qestion -
Assess t%e relia)ility o& t%e &ollo'in$ s.ales:
1! "atis&a.tion in Li&e2! Moral "tandards
-! Reli$ios In.lination
/an t%e relia)ility o& t%e s.ales )e i(proed7
1! "atis&a.tion in Li&e
Relia)ility "tatisti.s
Cronbachs
9l+ha
0 of
-tems
/6$ #$
Ite(Total "tatisti.s
(cale 'ean if
-tem eleted
(cale
Variance if
-tem eleted
Corrected
-tem@%otal
Correlation
Cronbachs
9l+ha if -tem
eleted
money "!55 "4!!4 5$6 /2!
friends "//& "!//" "!5 /46
love
affairDromance
"!#/ "4556 46" /"5
3ob<if woring? "!#2 "5&// 45/ /"5
study "!"" "5&/& 42" /4$
relation "/"2 "!5!# "62 /4!leisure "!#$ "//!4 "&2 /45
a++earance "/!5 "/4/6 42# /4#
seAual life "!"5 "5/"4 "44 /56
material comfort "!#/ "62"! 52! /2!
-n reliability test* CronbachEs al+ha is a measure of internal consistency or
quality of items +ro+osed* which is how closely related a set of items are as a grou+
9s table 8eliability (tatistics; above shown* the value of CronbachEs 9l+ha is $/6$
-n most social science situations* reliability coefficient CronbachEs al+ha; of
$/$ or higher is considered acce+table; %hus in this case* the $/6$ CronbachEs
al+ha is acce+table -t indicates that all the #$ items to measure satisfaction in life
are reliable and closely related to each others

7/23/2019 Full Report BR
http://slidepdf.com/reader/full/full-report-br 13/36
%herefore* there is no need for the reliability of the scales to be im+roved as
the CronbachEs 9l+ha of $/6$ indicates that (atisfaction in ife has a good internal
consistency
2! Moral "tandards
Relia)ility "tatisti.s
Cronbachs
9l+ha
0 of
-tems
62! !
Ite(Total "tatisti.s
(cale 'ean if
-tem eleted
(cale Variance
if -tem eleted
Corrected -tem@
%otal
Correlation
Cronbachs
9l+ha if -tem
eleted
wor quality "##" #&&&/ 4&" 55#
trustworthy "$&! #&&44 5/5 5"6
means "2$# 24!4& @$"" 6&!
filial +iety "$!& 2#/26 "2/ 5&6
authority "##" #&&&/ 4&" 55#
advice "$&! #&&44 5/5 5"6
womans life "$&/ 2$&&# "$& 6$$
marriage "$!! 2#/4! #2& 6/$
9s the table shown* the first reliability test for 'oral (tandards achieved the
CronbachEs 9l+ha of $62! For scientific research* the reliability coefficient of $6$ or
above is acce+table* but for social science research the reliability score of $/$ or
above is +referable %hus* the $62! CronbachEs 9l+ha in this case is considered as
a +oor internal consistency and the items +ro+osed are not really reliable
0eAt* we checed on the column headed Cronbach’s Alpha if Item Deleted to
see whether a higher value of CronbachEs 9l+ha could be achieved if any of the
items was to be removed 9s a result* we removed 9#5 <Gend 3ustifies the means?
as the deletion of this item can result in a higher CronbachEs 9l+ha value which is
$6&! %he following tables showed the im+rovements after deleting one item* 9#5
TTMR1 IMPR9EMENT" ATER REM9IN NE ITEM3 A1;5
Relia)ility "tatisti.s

7/23/2019 Full Report BR
http://slidepdf.com/reader/full/full-report-br 14/36
Cronbachs
9l+ha
0 of
-tems
6&! /
Ite(Total "tatisti.s
(cale 'ean if
-tem eleted
(cale Variance
if -tem eleted
Corrected -tem@
%otal
Correlation
Cronbachs
9l+ha if -tem
eleted
wor quality 2/5/ #!5!2 5#5 6"/trustworthy 2/4" #!5&5 5&2 62"filial +iety 2/"" 2$#&! "54 6//authority 2/5/ #!5!2 5#5 6"/advice 2/4" #!5&5 5&2 62"
womans life 2/4# #&556 "25 6!/marriage 2/"2 2$#25 #5# /5/
9fter removing 9#5 the result showed that the CronbachEs 9l+ha was $6&!*
which indicated that the internal consistency of the items was good 9lthough $6&!
is still below $/$ but it was already very close to the ideal value of CronbachEs
9l+ha (o* we can conclude that the remaining seven items are closely related and
highly reliable in re+resenting the 'oral (tandards scale as a whole
-! Reli$ios In.lination
Relia)ility "tatisti.s
Cronbachs 9l+ha
0 of -tems
/// "
Ite(Total "tatisti.s
(cale 'ean if
-tem eleted
(cale Variance
if -tem eleted
Corrected
-tem@%otal
Correlation
Cronbachs
9l+ha if -tem
eleted
unlucy number  4#!" "24 #$$$fengsui &25 2&!6 /&! 4!&

7/23/2019 Full Report BR
http://slidepdf.com/reader/full/full-report-br 15/36
religion &25 2&!6 /&! 4!&
From table above* the CronbachEs 9l+ha is $/// which is considered
acce+table; in social science research From this result we can draw a conclusion
that the three items to measure religious inclination are highly reliable and closely
related to each others
%herefore* there is no need for the reliability of the scales to be im+roved as
the CronbachEs 9l+ha of $/// indicates that the scale of 8eligious -nclination has a
good internal consistency
7/23/2019 Full Report BR
http://slidepdf.com/reader/full/full-report-br 16/36
Qestion 4
Perform the correlation analysis on the following variables: satisfaction in life, moral
standards, religious inclination* and age iscuss the results
Ans'er:
/orrelations
age
%,%(9
%
%,%8
%,%',8
#
age Pearson
Correlation
# #6#HH @$// @$5#
(ig <2@tailed? $$2 $!/ 25!
0 5$$ "66 5$$ 4&&
%,%(9% Pearson
Correlation#6#HH # #!2HH 24$HH
(ig <2@tailed? $$2 $$$ $$$
0 "66 "66 "66 "66
%,%8 Pearson
Correlation@$// #!2HH # /!/HH
(ig <2@tailed? $!/ $$$ $$$0 5$$ "66 5$$ 4&&
%,%',8
#
Pearson
Correlation@$5# 24$HH /!/HH #
(ig <2@tailed? 25! $$$ $$$
0 4&& "66 4&& 4&&
HH Correlation is significant at the $$# level <2@tailed?
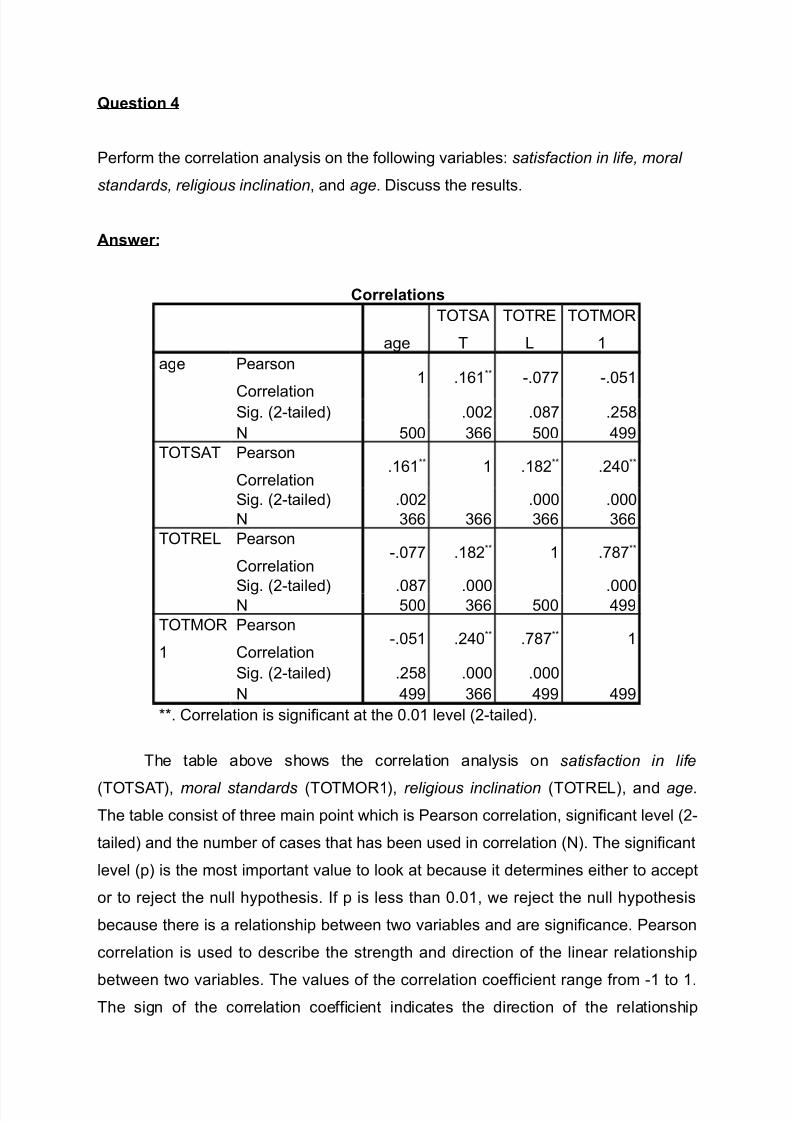
%he table above shows the correlation analysis on satisfaction in life
<%,%(9%?* moral standards <%,%',8#?* religious inclination <%,%8?* and age
%he table consist of three main +oint which is Pearson correlation* significant level <2@
tailed? and the number of cases that has been used in correlation <0? %he significant
level <+? is the most im+ortant value to loo at because it determines either to acce+t
or to re3ect the null hy+othesis -f + is less than $$#* we re3ect the null hy+othesis
because there is a relationshi+ between two variables and are significance Pearson
correlation is used to describe the strength and direction of the linear relationshi+
between two variables %he values of the correlation coefficient range from @# to #%he sign of the correlation coefficient indicates the direction of the relationshi+

7/23/2019 Full Report BR
http://slidepdf.com/reader/full/full-report-br 17/36
<+ositive or negative? %he absolute value of the correlation coefficient indicates the
strength* with larger absolute values indicating stronger relationshi+s %he correlation
coefficients on the main diagonal are always #* because each variable has a +erfect
+ositive linear relationshi+ with itself Correlation coefficients whose magnitude are
between $& and #$ indicate variables which can be considered very highly
correlated. Correlation coefficients whose magnitude are between $/ and $&
indicate variables which can be considered highly correlated. Correlation coefficients
whose magnitude are between $5 and $/ indicate variables which can be
considered moderately correlated. Correlation coefficients whose magnitude are
between $" and $5 indicate variables which have a low correlation. Correlation
coefficients whose magnitude are less than $" have little if any <linear? correlation
From the table we can see that is a relationshi+ between %,%(9% and
%,%8 is significant because the +@value is $$$$ which is lower than $$# and we
re3ect the null hy+othesis Pearson correlation shows that %,%(9% and %,%8
have a +ositive relationshi+ but it is relatively wea because the correlation value is
only $#!2 that is lower than $"$ Ie can mae a conclusion that the increase in the
religious inclination of the res+ondents will cause the satisfaction in life to increase
slightly
0eAt* we will loo at %,%(9% and %,%',8# which also have a significant
relationshi+ %he +@value is $$$$ and it is lower than $$# (o* we re3ect the null
hy+othesis %,%(9% and %,%',8# have a +ositive relationshi+ but it is a wea
+ositive relationshi+ because the correlation value is lower than $"$ which is only
$24$ Ie can conclude that the increase in the moral standards will cause the
satisfaction in life to increase slightly
%he third relationshi+ is between %,%(9% and age that is significant because
the +@value is $$$2 and it is lower than $$# %hus* we re3ect the null hy+othesis
owever* %,%(9% and age have the lowest +ositive relationshi+ where is correlation
value is lower than $"$ and it is only $#6# Ie can conclude that the increasing in
the age will affect the satisfaction in life increase slightly
7/23/2019 Full Report BR
http://slidepdf.com/reader/full/full-report-br 18/36
(ince the +@value is $$$$ and it is lower than $$# the relationshi+ between
%,%',8# and %,%8 is significant (o* we re3ect the null hy+othesis %,%',8#
and %,%8 have the +ositive relationshi+ and it is relatively high where the
correlation value is $/!/ Ie can conclude that the increase in religious inclination
of the res+ondents will affect the moral standard increase significantly
For %,%8 and age* the significant level is $$!/ and it is higher than $$#
%herefore* we acce+t the null hy+othesis and there is not relationshi+ between
%,%8 and age (ame things goes to %,%',8# and age where is significant level
is $25! which eAceed $$# and we acce+t the null hy+othesis %here is no
relationshi+ between %,%',8# and age
Qestion ;
/rossta)lation et%ni. $rops ra.e15 'it% satis&a.tion in li&e $rops
TT"AT15! Is t%ere a relations%ip )et'een ra.es and satis&a.tion in li&e7
Dis.ss t%e reslts!

7/23/2019 Full Report BR
http://slidepdf.com/reader/full/full-report-br 19/36
%here are two +roblems to be discussed in this section Firstly* the com+arison
of +ercentage of the variables and secondly* the significance of relationshi+ between
the variables First matter would be calculated using crosstabulation in (P(( while
another will be analyJed using Chi@(quare test
/rossta)lation
Crosstabulation is being used to establish an interde+endent relationshi+
between two tables of values which are the ethnics grou+s and satisfaction in life in
both values and +ercentage owever* it will not identify a causal relationshi+
between the values -n this case* we will see if there is any different of level of
satifaction between the different races
From the table* we can see that the total +ercentage for each level of
satisfaction within %,%(9%# is quite average which is about 2!@"6. %his means the
overall society is neither too satisfied nor eAtremely not satisfied owever* the result
shows that there are significant difference in each race category for their satisfaction
'alay are mostly satisfied with their lives as 4"!. of them have high satisfaction in
life

7/23/2019 Full Report BR
http://slidepdf.com/reader/full/full-report-br 20/36
owever* -ndian * Chinese and ,thers have a different result com+are to
'alay 44&. of -ndian and ,thers and 4"!. of Chinese are having low satisfaction
towards their lives Ie can see difference from the com+arison between satisfaction
in life of different races and the significant of the difference would be measured as
below by using Chi@(quare %est
/%i"<are Test
Chi@(quare test is basically carried out in order to determine whether the
categorical variables are significantly related to each other -n this test* we will loo
into the Person Chi@(quare value and com+are it with the decided asym+totic
significance level < 9sym+(ig? to 3ustify the relationshi+ between variables -f the
values is less than the asym+totic significance level* the relationshi+ is significant
%he fact that the Pearson Chi@(quare value is $$$# and much less than $$5
that being decided to be significance level %his indicates that that the rows and
columns of the contingency are de+endent (o* we will re3ect the null hy+othesis
which stated that there is no relationshi+ between race and satisfaction in life
Kenerally* this means that it is worthwhile to inter+ret the cells in the contingency
table and it +roved that the relationshi+ is significant
7/23/2019 Full Report BR
http://slidepdf.com/reader/full/full-report-br 21/36
-n conclusion* we can say that race will influence satisfaction in life of a
+erson %his might be because of his occu+ation* income* living bacground*
education or eA+osures to things ha++ened around through different news+a+ers
Q*E"TIN =
/rossta)late et%ni.s $rops ra.e15 'it% all ne'spaper! Is t%ere a relations%ip
)et'een ra.es and ne'spaper readers%ip7 Dis.ss t%e reslts!
Ne's "traits Ti(es
7/23/2019 Full Report BR
http://slidepdf.com/reader/full/full-report-br 22/36
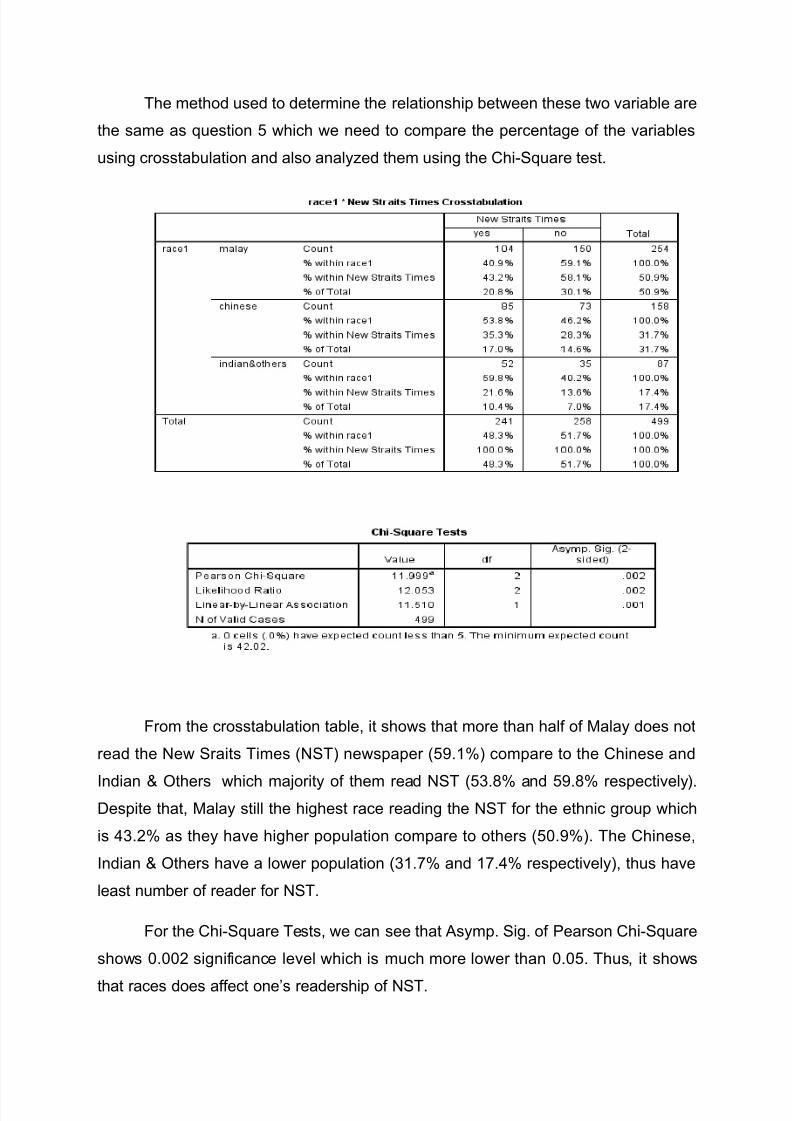
%he method used to determine the relationshi+ between these two variable are
the same as question 5 which we need to com+are the +ercentage of the variables
using crosstabulation and also analyJed them using the Chi@(quare test
From the crosstabulation table* it shows that more than half of 'alay does not
read the 0ew (raits %imes <0(%? news+a+er <5&#.? com+are to the Chinese and
-ndian L ,thers which ma3ority of them read 0(% <5"!. and 5&!. res+ectively?es+ite that* 'alay still the highest race reading the 0(% for the ethnic grou+ which
is 4"2. as they have higher +o+ulation com+are to others <5$&.? %he Chinese*
-ndian L ,thers have a lower +o+ulation <"#/. and #/4. res+ectively?* thus have
least number of reader for 0(%
For the Chi@(quare %ests* we can see that 9sym+ (ig of Pearson Chi@(quare
shows $$$2 significance level which is much more lower than $$5 %hus* it shows
that races does affect oneEs readershi+ of 0(%

7/23/2019 Full Report BR
http://slidepdf.com/reader/full/full-report-br 23/36
T%e "tar
)y looing at the result from the crosstabulation table* we can see that
ma3ority of 'alay does not read %he (tar news+a+er <66".? com+are to the
Chinese and -ndian L ,thers 'ore than half of the Chinese read %he (tar <55#.?
while -ndian L ,thers mae u+ the highest readers which is 5&!. For the ethnic
grou+* the Chinese have the highest amount of readers <"!/.? than 'alay* -ndian L
,thers which is "!2. and 2"#. res+ectively
From the Chi@(quare %ests* 9sym+ (ig +f Paerson Chi@(quare shows $
significance level* thus less than $$5 -t can be said that the relationshi+ between
races and oneEs readershi+ of %he (tar is highly related and significance
*tsan Malaysia
7/23/2019 Full Report BR
http://slidepdf.com/reader/full/full-report-br 24/36
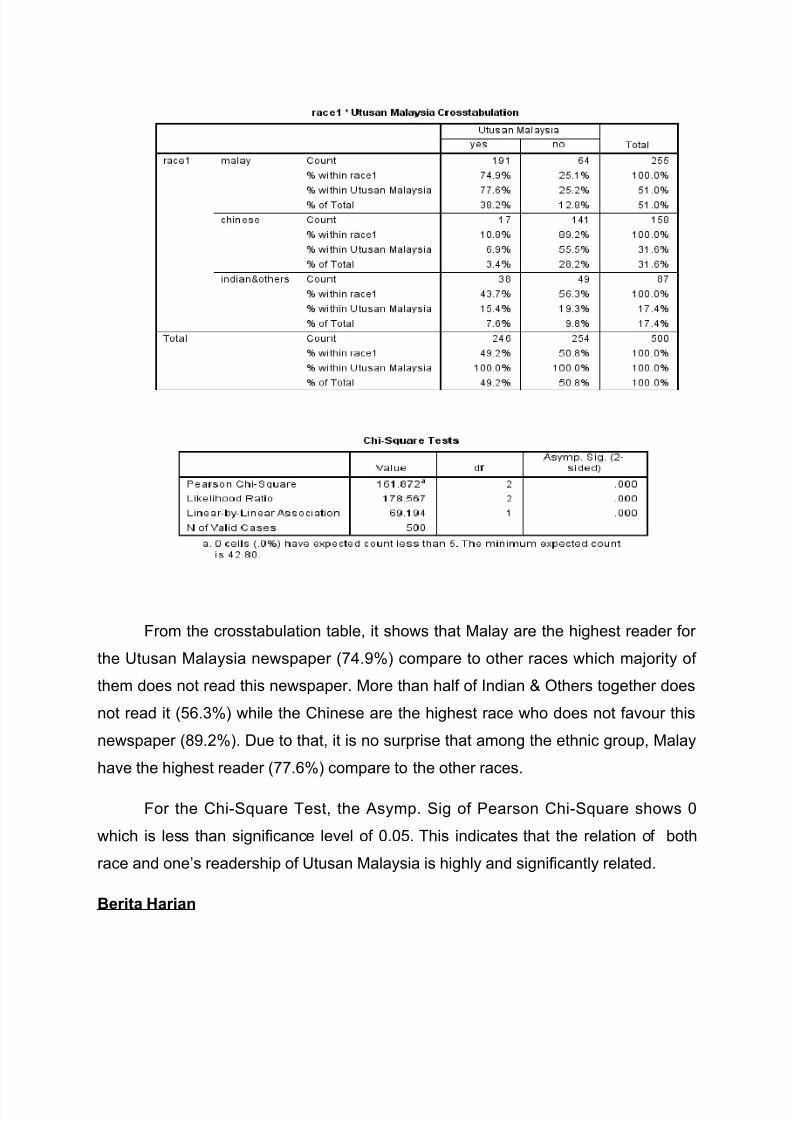
From the crosstabulation table* it shows that 'alay are the highest reader for
the 1tusan 'alaysia news+a+er </4&.? com+are to other races which ma3ority of
them does not read this news+a+er 'ore than half of -ndian L ,thers together does
not read it <56".? while the Chinese are the highest race who does not favour this
news+a+er <!&2.? ue to that* it is no sur+rise that among the ethnic grou+* 'alay
have the highest reader <//6.? com+are to the other races
For the Chi@(quare %est* the 9sym+ (ig of Pearson Chi@(quare shows $
which is less than significance level of $$5 %his indicates that the relation of both
race and oneEs readershi+ of 1tusan 'alaysia is highly and significantly related
+erita ,arian

7/23/2019 Full Report BR
http://slidepdf.com/reader/full/full-report-br 25/36
From the crosstabulation table* we can see that again 'alay are the ma3ority
reader for )erita arian news+a+er with /"/. com+are to the other race that have
least reader %he Chinese and -ndian L ,ther mae u+ big +ortion of reader who
does not read )erita arian which is !$4. and /$#. res+ectively For the ethnic
grou+* the result also the same as 'alay have highest reader of this news+a+er
which is /6/. com+are to the Chinese and -ndian L ,thers
%he 9sym+ (ig of Pearson Chi@(quare shows $ significance level which is
much lower than $$5 %hus* this indicates that it is highly and significantly related
between races and oneEs readershi+ of )erita arian
)ased on these results* it can be concluded that the Chinese and -ndian L
,thers have the same +reference of reading news+a+er while 'alay have the
o++osite +reference %his might be due to some factors such as 'alay are more
+refer to read news+a+er that used their own language since it can +rovide a better
understanding and also the fact that 'alay are not a native nglish s+eaer com+are
to Chinese and -ndian L ,thers )esides that* it is also can be said that since the
7/23/2019 Full Report BR
http://slidepdf.com/reader/full/full-report-br 26/36
Chinese and -ndian L ,thers have the same level of +reference or level of
satisfaction in life* there can be a indirect relationshi+ between races and satisfaction
in life
Q*E"TIN >
Per&or( a statisti.al test to see se# di&&eren.es 'it% respe.t to all t%e ite(s in
t%e satis&a.tion in li&e s.ale! Dis.ss t%e reslts!
7/23/2019 Full Report BR
http://slidepdf.com/reader/full/full-report-br 27/36
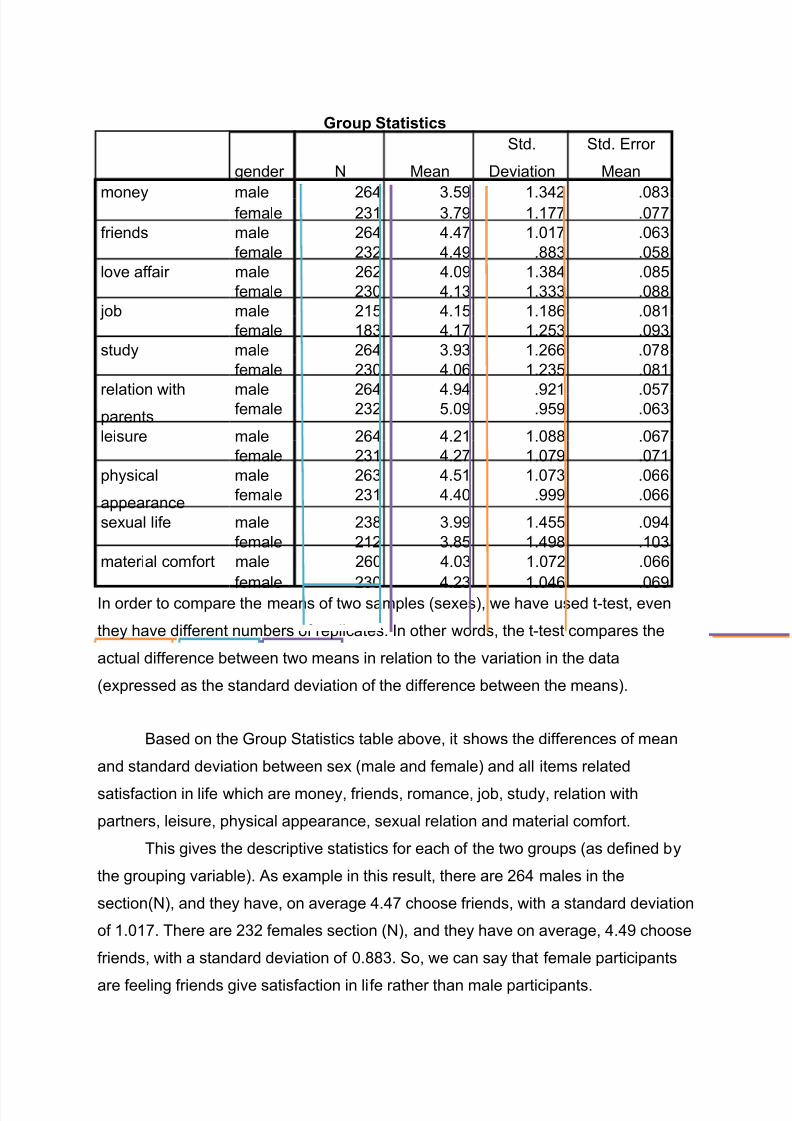
-n order to com+are the means of two sam+les <seAes?* we have used t@test* even
they have different numbers of re+licates -n other words* the t@test com+ares the
actual difference between two means in relation to the variation in the data
<eA+ressed as the standard deviation of the difference between the means?
)ased on the Krou+ (tatistics table above* it shows the differences of mean
and standard deviation between seA <male and female? and all items related
satisfaction in life which are money* friends* romance* 3ob* study* relation with
+artners* leisure* +hysical a++earance* seAual relation and material comfort
%his gives the descri+tive statistics for each of the two grou+s <as defined by
the grou+ing variable? 9s eAam+le in this result* there are 264 males in the
section<0?* and they have* on average 44/ choose friends* with a standard deviation
of #$#/ %here are 2"2 females section <0?* and they have on average* 44& choose
friends* with a standard deviation of $!!" (o* we can say that female +artici+ants
are feeling friends give satisfaction in life rather than male +artici+ants
rop "tatisti.s
gender 0 'ean
(td
eviation
(td rror
'ean
money male 264 "5& #"42 $!"female 2"# "/& ##// $//
friends male 264 44/ #$#/ $6"
female 2"2 44& !!" $5!
love affair male 262 4$& #"!4 $!5
female 2"$ 4#" #""" $!!
3ob male 2#5 4#5 ##!6 $!#
female #!" 4#/ #25" $&"
study male 264 "&" #266 $/!
female 2"$ 4$6 #2"5 $!#
relation with+arents
male 264 4&4 &2# $5/female 2"2 5$& &5& $6"
leisure male 264 42# #$!! $6/
female 2"# 42/ #$/& $/#
+hysical
a++earance
male 26" 45# #$/" $66
female 2"# 44$ &&& $66
seAual life male 2"! "&& #455 $&4
female 2#2 "!5 #4&! #$"
material comfort male 26$ 4$" #$/2 $66
female 2"$ 42" #$46 $6&

7/23/2019 Full Report BR
http://slidepdf.com/reader/full/full-report-br 28/36
%he -nde+endent (am+les t@test as below is used to see if two means are
different from each other when the two sam+les that the means are based on were
taen from different individualsM different grou+s of +eo+le <males and females? who
have not been matched as shown in table above
Ihen there is similar variance between male and female by checing the
results of evineEs %est for quality of Variances -f the variances are equal in both
grou+s* then the significant value will be greater than $$5 owever* if the significant
value is equal or less than $$5* the variance is unequal -f the variance is unequal*
the qual variances not assumed column will be used and if the variance is equal*
the qual variances not assumed will be used For study* the variance the significant
value level is $/!6 which is greater than $$5* the variances is acce+ted
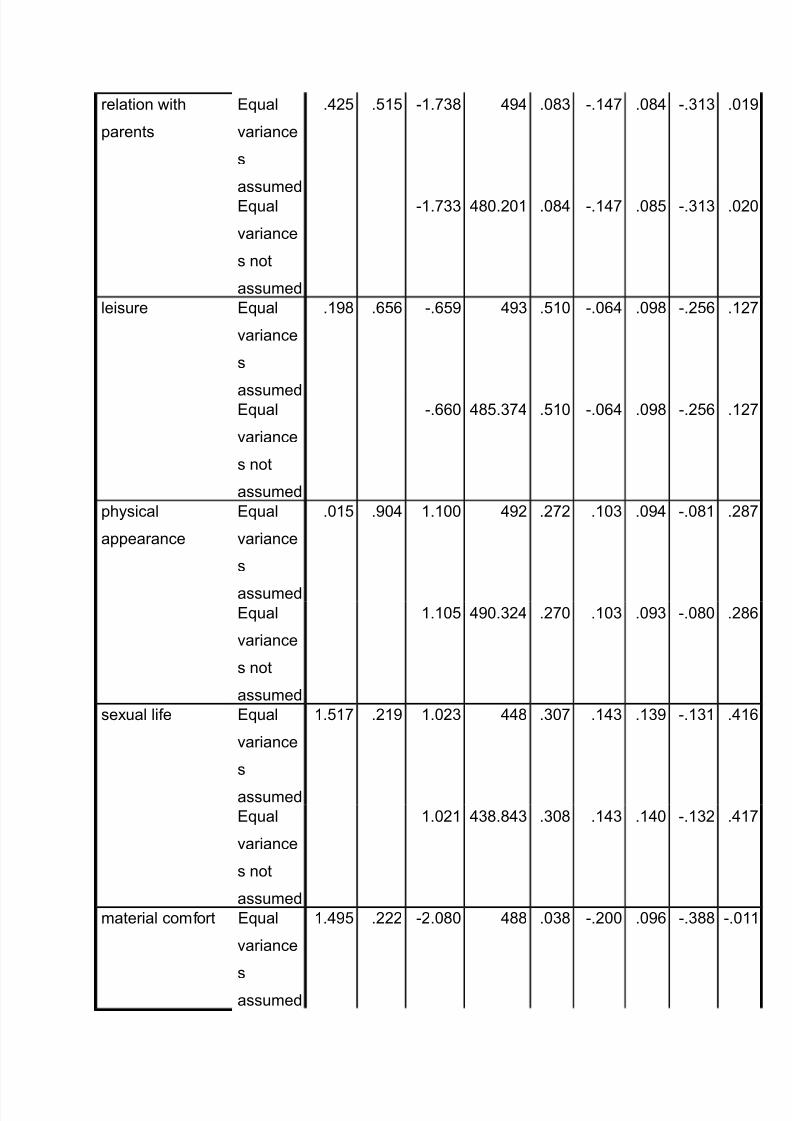
Independent "a(ples Test
evenes
%est for
quality of
Variances t@test for quality of 'eans
F (ig t df
(ig
<2@
taile
d?
'ean
iffer
ence
(td
rror
iffe
renc
e
&5.
Confidence
-nterval of
the
ifference
owe
r
1++
er
money qual
variance
s
assumed
/64& $$6 @#/5/ 4&" $/& @2$# ##4 @425 $24

7/23/2019 Full Report BR
http://slidepdf.com/reader/full/full-report-br 29/36
qual
variance
s not
assumed
@#//" 4&2&&! $// @2$# ##" @42" $22
friends qual
variance
s
assumed
#!$# #!$ @252 4&4 !$# @$22 $!6 @#&# #4/
qual
variance
s not
assumed
@254 4&"&"" /&& @$22 $!5 @#!& #46
love affair qual
variance
s
assumed
#5& 6&$ @"5# 4&$ /26 @$4" #2" @2!5 #&!
qual
variance
s not
assumed
@"52 4!5/!! /25 @$4" #2" @2!4 #&!
3ob qual
variance
s
assumed
!&! "44 @#6! "&6 !6/ @$2# #22 @26# 22$
qual
variance
s not
assumed
@#6/ "/!"6& !6/ @$2# #2" @262 22#
study qual
variance
s
assumed
$/" /!6 @##// 4&2 24$ @#"" ##" @"55 $!&
qual
variance
s notassumed
@##/& 4!5/// 2"& @#"" ##" @"54 $!&
7/23/2019 Full Report BR
http://slidepdf.com/reader/full/full-report-br 30/36
relation with
+arents
qual
variance
s
assumed
425 5#5 @#/"! 4&4 $!" @#4/ $!4 @"#" $#&
qual
variance
s not
assumed
@#/"" 4!$2$# $!4 @#4/ $!5 @"#" $2$
leisure qual
variance
s
assumed
#&! 656 @65& 4&" 5#$ @$64 $&! @256 #2/
qual
variance
s not
assumed
@66$ 4!5"/4 5#$ @$64 $&! @256 #2/
+hysical
a++earance
qual
variance
s
assumed
$#5 &$4 ##$$ 4&2 2/2 #$" $&4 @$!# 2!/
qual
variance
s not
assumed
##$5 4&$"24 2/$ #$" $&" @$!$ 2!6
seAual life qual
variance
s
assumed
#5#/ 2#& #$2" 44! "$/ #4" #"& @#"# 4#6
qual
variance
s not
assumed
#$2# 4"!!4" "$! #4" #4$ @#"2 4#/
material comfort qual
variance
s
assumed
#4&5 222 @2$!$ 4!! $"! @2$$ $&6 @"!! @$##

7/23/2019 Full Report BR
http://slidepdf.com/reader/full/full-report-br 31/36
qual
variance
s not
assumed
@2$!4 4!"2&5 $"! @2$$ $&6 @"!! @$##
%he %@%est for equality of means indicate that the significant value which is
equal or less than P=$$5 means significant difference in mean score Ihile* if value
more than P= $$5* there is no significant difference between 2 grou+s -n %@%est for
equality of means significant 2 tail value* money has $$/ values which B P=$5
means significant difference in mean score occurs
Ie decide to acce+t $: there is no difference that money gives satisfaction of
life between male and female 9s before* the decision rule is given by: $$/ is not
less than or equal to $5* so we fail to re3ect $
%hat im+lies that we success to observe there is no difference in satisfaction of
life is money between the male and female From the data shown as above* we can
see from the (ig <2@tailed? all the items for (ig value are score more than $$5
eA+ect the item 'aterial comfort
-n conclusion* we can conclude that money* friends* +hysical a++earance*
romance* seAual relation* relation with +artners* leisure* study and 3ob give
satisfaction in life are statistically not significantly different with seA variable eA+ect
the item 'aterial comfort ,nly material comfort gives different level of satisfaction in
life between male and female

7/23/2019 Full Report BR
http://slidepdf.com/reader/full/full-report-br 32/36
Q*E"TIN 8
Per&or( a statisti.al test to see (arital stats $rop di&&eren.es (arital15 'it%
respe.ts to all t%e ite(s in t%e reli$ios in.lination! Dis.ss t%e reslts!
From the %he test of omogeneity of variance table below shows that the significant
values of the all items in religious inclination variables are more than $$5 Ie can
say that* the variable are not violated the assum+tion of homogeneity of variance
Test o& ,o(o$eneity o& 9arian.es
evene
(tatistic df# df2 (ig
<r? unlucy no 6#5 2 4!! 54#<r? fengsui #$!/ 2 4!! ""!<r?religion
im+ortant#$!/ 2 4!! ""!

7/23/2019 Full Report BR
http://slidepdf.com/reader/full/full-report-br 33/36
AN9A
(um of
(quares df
'ean
(quare F (ig
<r? unlucy no )etween
Krou+s5$6 2 25" 2$! !#2
Iithin Krou+s 5&"/$2 4!! #2#/
%otal 5&42$! 4&$
<r? fengsui )etween
Krou+s#&52 2 &/6 &"5 "&"
Iithin Krou+s 5$&62$ 4!! #$44
%otal 5##5/2 4&$
<r? religion
im+ortant
)etween
Krou+s#&52 2 &/6 &"5 "&"
Iithin Krou+s 5$&62$ 4!! #$44
%otal 5##5/2 4&$
T%e one'ay analysis o& arian.e AN9A5 is sed to deter(ine '%et%er t%ere
are any si$ni&i.ant di&&eren.es )et'een $rops (eans on dependent aria)les!8es+ondents were classified into " grou+s based on their marital status* which are
Krou+ # is (ingle* Krou+ 2 is married without children* and Krou+ " is married with
children %here are three items were used to measure religious inclination which is an
unlucy numberofthe house or car registration number* Fengsui or Keomancy and
religion
From the result of the 90,V9 table above* we can say that there is no
significant difference about the means between religious inclinations for the " grou+s
of marital status <marital#? %his is because the significant values show all the items
of religious inclination scale are more than $$5
-f we loo at the significant value of the unlucy number of the house or car
registration number on the 9nova table above* the results show that* the P@value is
$!#2 which is higher that $$5 iewise with Fengsui or Keomancy and religion
)oth two items show the result of P@Value are $"&" which higher than $$5 -ts
indicate that or giving the meaning that there is no significant difference between
these three items and marital status
%herefore* we conclude that there is no significant difference about the means
between the marital status <marital #? and religious inclination* which we acce+t the

7/23/2019 Full Report BR
http://slidepdf.com/reader/full/full-report-br 34/36
null hy+othesis because the +@values of each item of religious inclination and marital
status <marital #? are more than $$5 and we re3ect the alternative hy+othesis
Qestion ?
1sing the following variables* +erform a regression analysis and discuss the results:
e+endent= (atisfaction in life
-nde+endent= 'oral standardsM religious inclination
Model "((ary)
Model R R "<are Adjusted R
Square
"td! Error o& t%e
Esti(ate
1 !24-a !0;? .054 !=4;-=
a! Predi.tors: /onstant53 TTREL3 TTMR1)! Dependent 9aria)le: TT"AT
9ccording to the 'odel (ummary table above* 9d3usted 8 (quare is $$54 -t
means that 54. of total variance in the satisfaction in life is eA+lained by the model
which includes the variables of moral standards and religious inclination

7/23/2019 Full Report BR
http://slidepdf.com/reader/full/full-report-br 35/36
AN9Aa
Model "( o&
"<ares
d& Mean
"<are
Sig.
1
Re$ression ?!4;1 2 4!>2= 11!-4= .000 b
Residal 1;1!18= -=- !41=
Total 1=0!=-> -=;
a! Dependent 9aria)le: TT"AT)! Predi.tors: /onstant53 TTREL3 TTMR1
)ased on the 90,V9 table above* the significance value is $$$$ which is
lower than $$5 %herefore* the figure $$$$ less than $$5 indicates that this model is
statistical significant
/oe&&i.ientsa
Model *nstandardi@ed
/oe&&i.ients
Standardize
d
Coefficients
t
+ "td! Error Beta
1
/onstant5 -!2=> !20? 1;!=-2
TTMR1 !2;- !080 .285 -!14>
TTREL !041 !0=? -.053 !;8?
a! Dependent 9aria)le: TT"AT
%he out+ut above shows that the beta of moral standards is $2!5 while the
beta of religious inclination is @$$5" %he +ositive beta shows that moral standards
has a +ositive relationshi+ with satisfaction in life %he negative beta shows that
religious inclination has a negative relationshi+ with satisfaction in life
%he significance value of moral standards is $$$2 which shows that it
statistically significant to the satisfaction in life because its +@value less than $$5
8eligious inclination has significance value of $556 which indicates that it not
significant to the satisfaction in life since its +@value bigger than $$5
For the recommendation* you have to increase moral standards if you want to
have satisfaction in life because the higher the beta* the stronger the relationshi+

7/23/2019 Full Report BR
http://slidepdf.com/reader/full/full-report-br 36/36
)esides that* we also suggest to eliminate religious inclination because it may be
overla+ with other inde+endent variables in this model